Baiting Hollow, NY Map & Demographics
Baiting Hollow Map
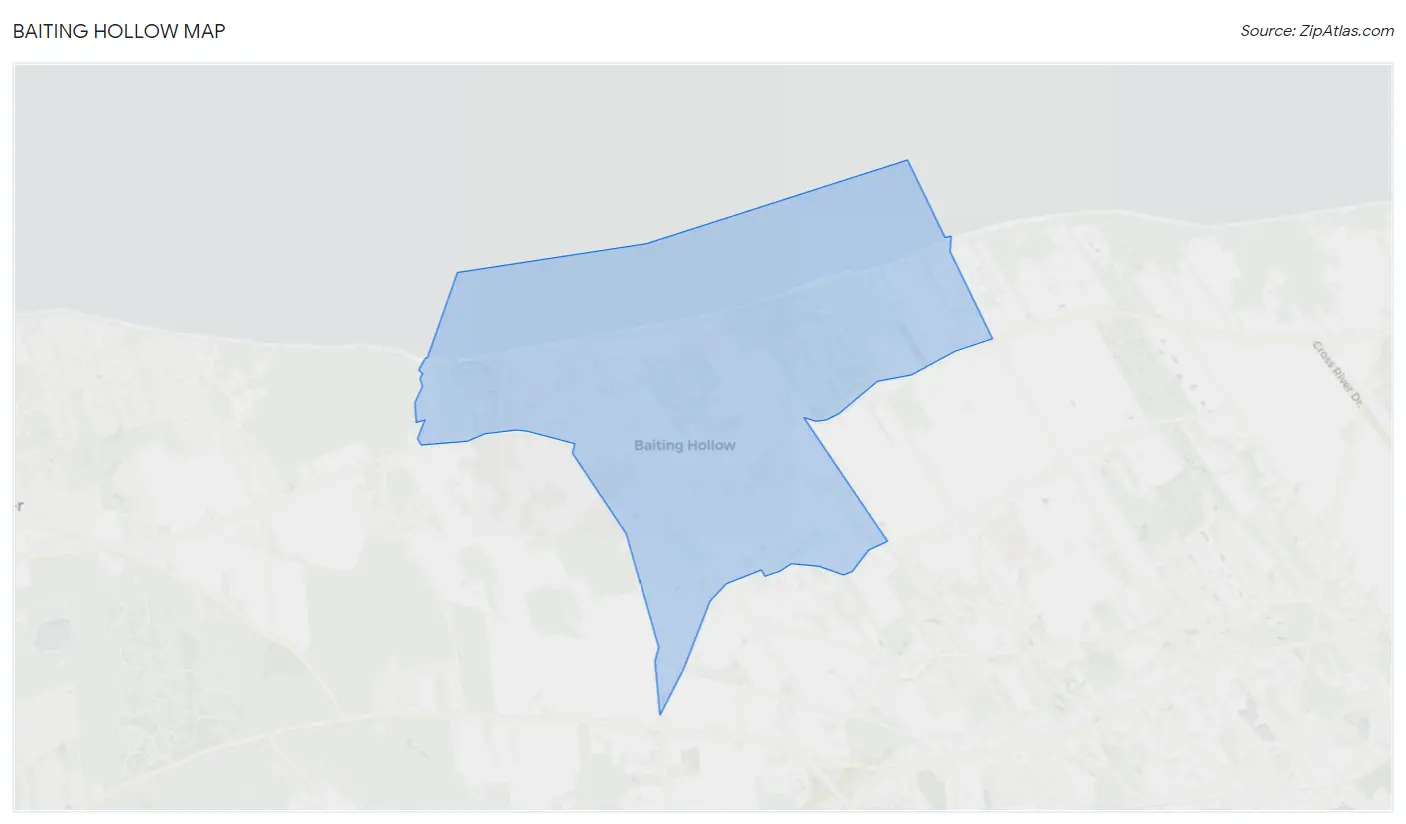
Baiting Hollow Overview
$53,844
PER CAPITA INCOME
$112,721
AVG FAMILY INCOME
$108,313
AVG HOUSEHOLD INCOME
59.9%
WAGE / INCOME GAP [ % ]
40.1¢/ $1
WAGE / INCOME GAP [ $ ]
0.39
INEQUALITY / GINI INDEX
2,899
TOTAL POPULATION
1,437
MALE POPULATION
1,462
FEMALE POPULATION
98.29
MALES / 100 FEMALES
101.74
FEMALES / 100 MALES
56.1
MEDIAN AGE
2.8
AVG FAMILY SIZE
2.4
AVG HOUSEHOLD SIZE
1,448
LABOR FORCE [ PEOPLE ]
56.9%
PERCENT IN LABOR FORCE
5.0%
UNEMPLOYMENT RATE
Baiting Hollow Area Codes
Income in Baiting Hollow
Income Overview in Baiting Hollow
Per Capita Income in Baiting Hollow is $53,844, while median incomes of families and households are $112,721 and $108,313 respectively.
| Characteristic | Number | Measure |
| Per Capita Income | 2,899 | $53,844 |
| Median Family Income | 931 | $112,721 |
| Mean Family Income | 931 | $141,946 |
| Median Household Income | 1,172 | $108,313 |
| Mean Household Income | 1,172 | $130,745 |
| Income Deficit | 931 | $0 |
| Wage / Income Gap (%) | 2,899 | 59.86% |
| Wage / Income Gap ($) | 2,899 | 40.14¢ per $1 |
| Gini / Inequality Index | 2,899 | 0.39 |
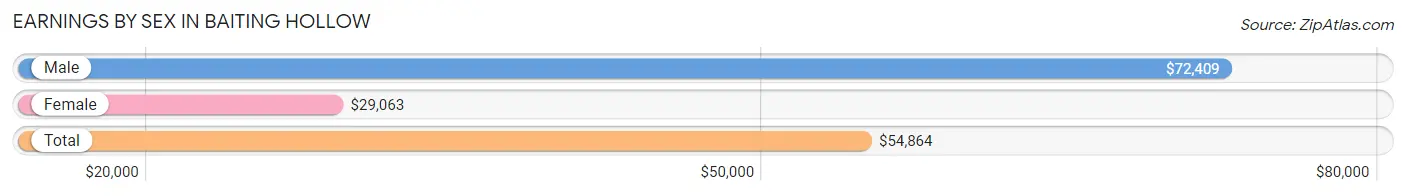
Earnings by Sex in Baiting Hollow
Average Earnings in Baiting Hollow are $54,864, $72,409 for men and $29,063 for women, a difference of 59.9%.
| Sex | Number | Average Earnings |
| Male | 881 (57.9%) | $72,409 |
| Female | 640 (42.1%) | $29,063 |
| Total | 1,521 (100.0%) | $54,864 |
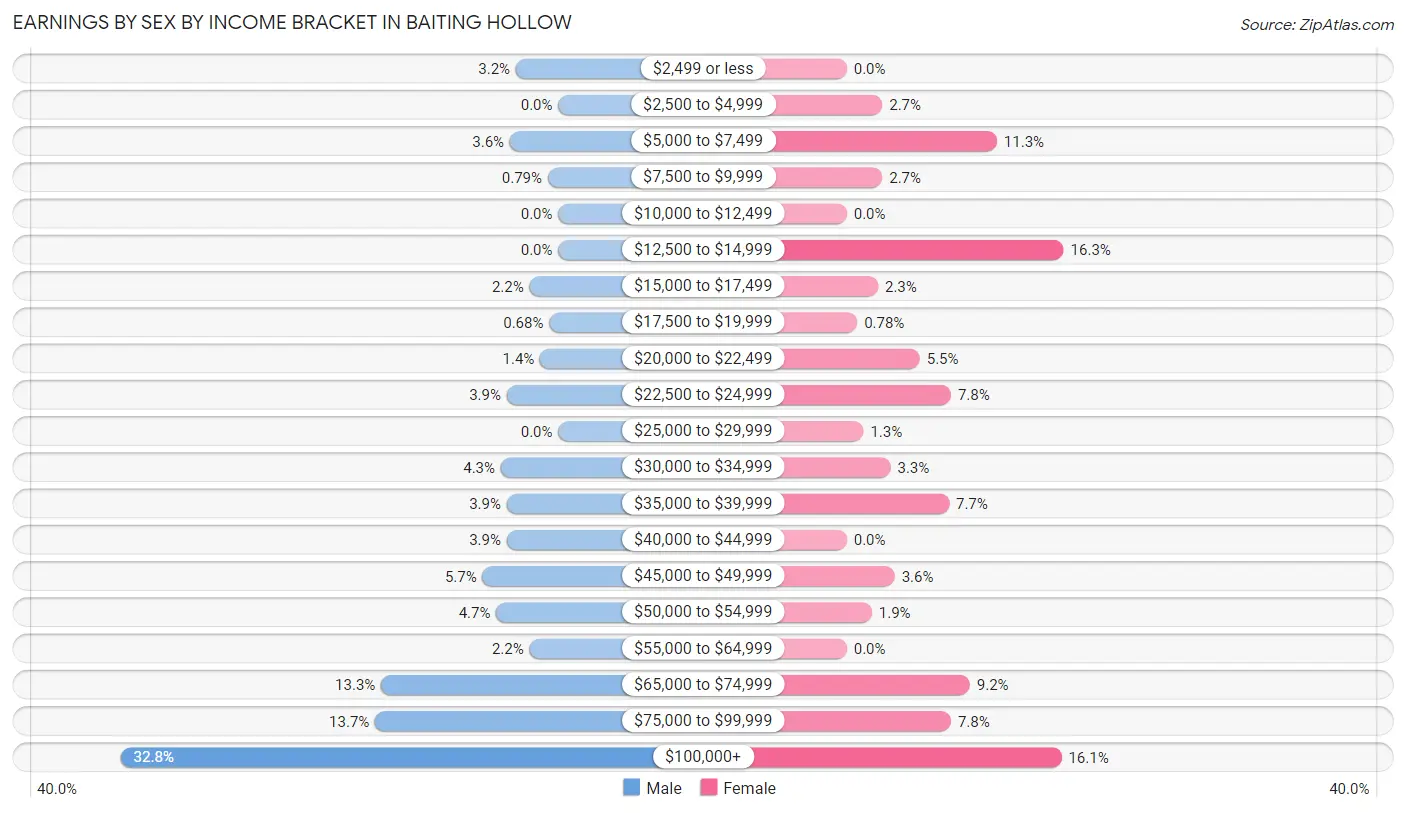
Earnings by Sex by Income Bracket in Baiting Hollow
The most common earnings brackets in Baiting Hollow are $100,000+ for men (289 | 32.8%) and $12,500 to $14,999 for women (104 | 16.3%).
| Income | Male | Female |
| $2,499 or less | 28 (3.2%) | 0 (0.0%) |
| $2,500 to $4,999 | 0 (0.0%) | 17 (2.7%) |
| $5,000 to $7,499 | 32 (3.6%) | 72 (11.3%) |
| $7,500 to $9,999 | 7 (0.8%) | 17 (2.7%) |
| $10,000 to $12,499 | 0 (0.0%) | 0 (0.0%) |
| $12,500 to $14,999 | 0 (0.0%) | 104 (16.3%) |
| $15,000 to $17,499 | 19 (2.2%) | 15 (2.3%) |
| $17,500 to $19,999 | 6 (0.7%) | 5 (0.8%) |
| $20,000 to $22,499 | 12 (1.4%) | 35 (5.5%) |
| $22,500 to $24,999 | 34 (3.9%) | 50 (7.8%) |
| $25,000 to $29,999 | 0 (0.0%) | 8 (1.3%) |
| $30,000 to $34,999 | 38 (4.3%) | 21 (3.3%) |
| $35,000 to $39,999 | 34 (3.9%) | 49 (7.7%) |
| $40,000 to $44,999 | 34 (3.9%) | 0 (0.0%) |
| $45,000 to $49,999 | 50 (5.7%) | 23 (3.6%) |
| $50,000 to $54,999 | 41 (4.6%) | 12 (1.9%) |
| $55,000 to $64,999 | 19 (2.2%) | 0 (0.0%) |
| $65,000 to $74,999 | 117 (13.3%) | 59 (9.2%) |
| $75,000 to $99,999 | 121 (13.7%) | 50 (7.8%) |
| $100,000+ | 289 (32.8%) | 103 (16.1%) |
| Total | 881 (100.0%) | 640 (100.0%) |
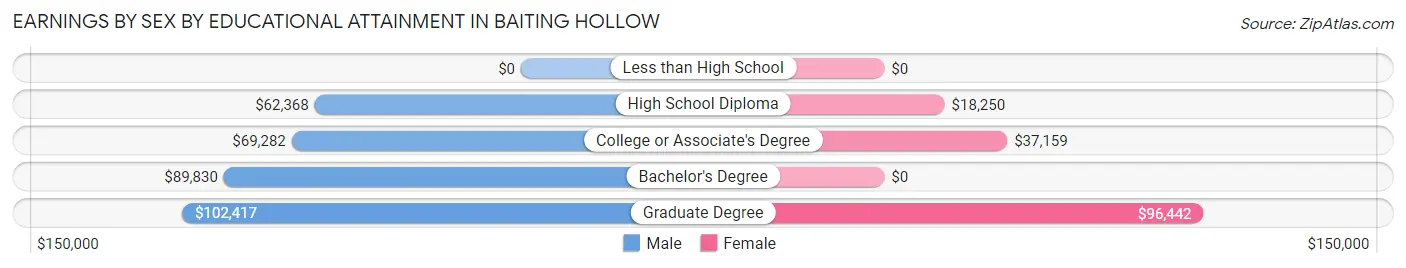
Earnings by Sex by Educational Attainment in Baiting Hollow
Average earnings in Baiting Hollow are $74,267 for men and $36,563 for women, a difference of 50.8%. Men with an educational attainment of graduate degree enjoy the highest average annual earnings of $102,417, while those with high school diploma education earn the least with $62,368. Women with an educational attainment of graduate degree earn the most with the average annual earnings of $96,442, while those with high school diploma education have the smallest earnings of $18,250.
| Educational Attainment | Male Income | Female Income |
| Less than High School | - | - |
| High School Diploma | $62,368 | $18,250 |
| College or Associate's Degree | $69,282 | $37,159 |
| Bachelor's Degree | $89,830 | $0 |
| Graduate Degree | $102,417 | $96,442 |
| Total | $74,267 | $36,563 |
Family Income in Baiting Hollow
Family Income Brackets in Baiting Hollow
According to the Baiting Hollow family income data, there are 284 families falling into the $100,000 to $149,999 income range, which is the most common income bracket and makes up 30.5% of all families.
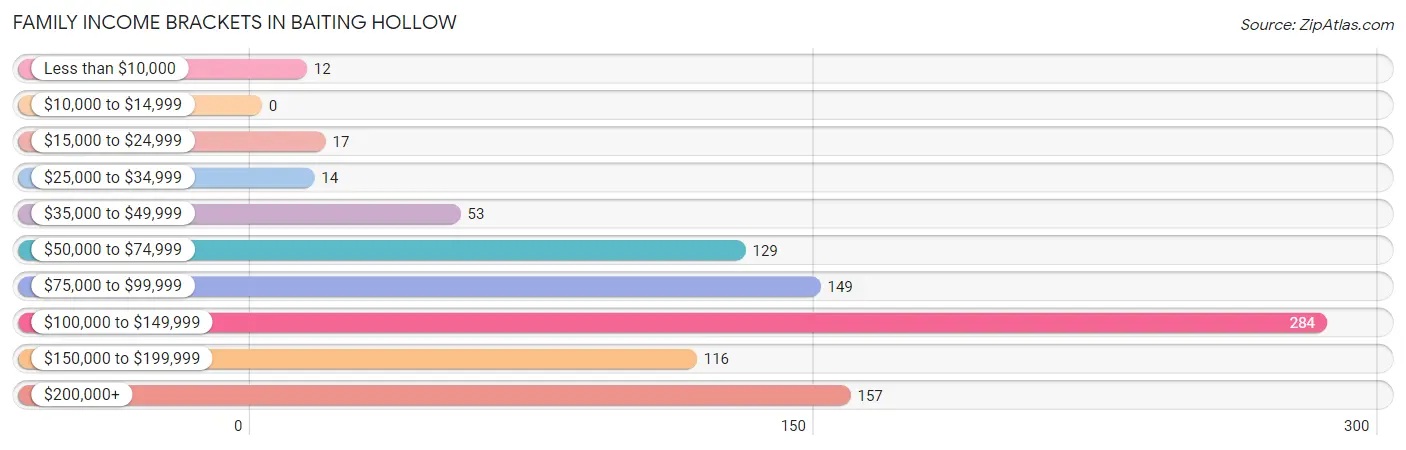
| Income Bracket | # Families | % Families |
| Less than $10,000 | 12 | 1.3% |
| $10,000 to $14,999 | 0 | 0.0% |
| $15,000 to $24,999 | 17 | 1.8% |
| $25,000 to $34,999 | 14 | 1.5% |
| $35,000 to $49,999 | 53 | 5.7% |
| $50,000 to $74,999 | 129 | 13.9% |
| $75,000 to $99,999 | 149 | 16.0% |
| $100,000 to $149,999 | 284 | 30.5% |
| $150,000 to $199,999 | 116 | 12.5% |
| $200,000+ | 157 | 16.9% |
Family Income by Famaliy Size in Baiting Hollow
3-person families (228 | 24.5%) account for the highest median family income in Baiting Hollow with $139,254 per family, while 2-person families (514 | 55.2%) have the highest median income of $50,577 per family member.
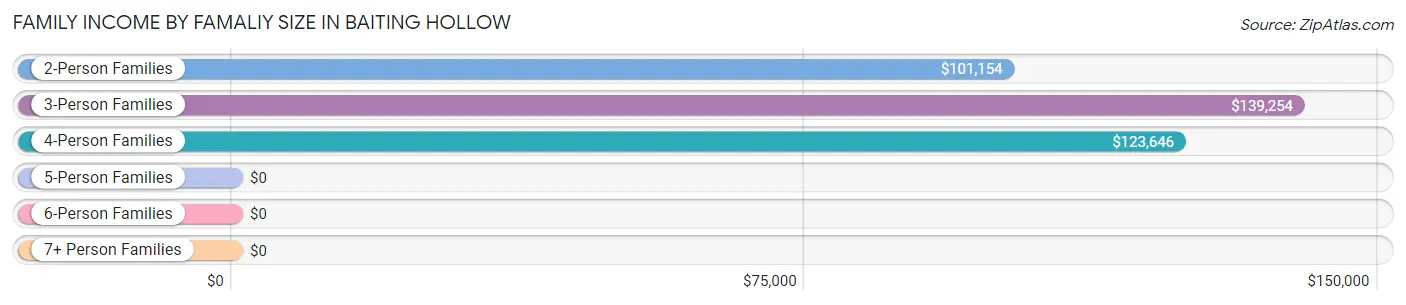
| Income Bracket | # Families | Median Income |
| 2-Person Families | 514 (55.2%) | $101,154 |
| 3-Person Families | 228 (24.5%) | $139,254 |
| 4-Person Families | 148 (15.9%) | $123,646 |
| 5-Person Families | 41 (4.4%) | $0 |
| 6-Person Families | 0 (0.0%) | $0 |
| 7+ Person Families | 0 (0.0%) | $0 |
| Total | 931 (100.0%) | $112,721 |
Family Income by Number of Earners in Baiting Hollow
The median family income in Baiting Hollow is $112,721, with families comprising 3+ earners (120) having the highest median family income of $139,430, while families with no earners (186) have the lowest median family income of $84,167, accounting for 12.9% and 20.0% of families, respectively.
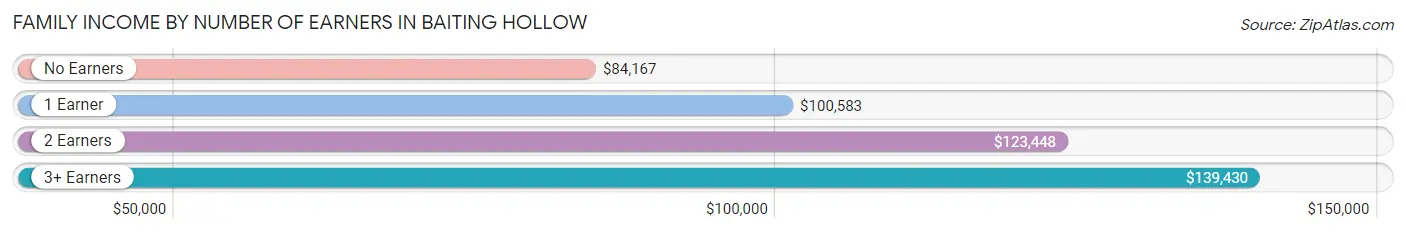
| Number of Earners | # Families | Median Income |
| No Earners | 186 (20.0%) | $84,167 |
| 1 Earner | 305 (32.8%) | $100,583 |
| 2 Earners | 320 (34.4%) | $123,448 |
| 3+ Earners | 120 (12.9%) | $139,430 |
| Total | 931 (100.0%) | $112,721 |
Household Income in Baiting Hollow
Household Income Brackets in Baiting Hollow
With 331 households falling in the category, the $100,000 to $149,999 income range is the most frequent in Baiting Hollow, accounting for 28.2% of all households.
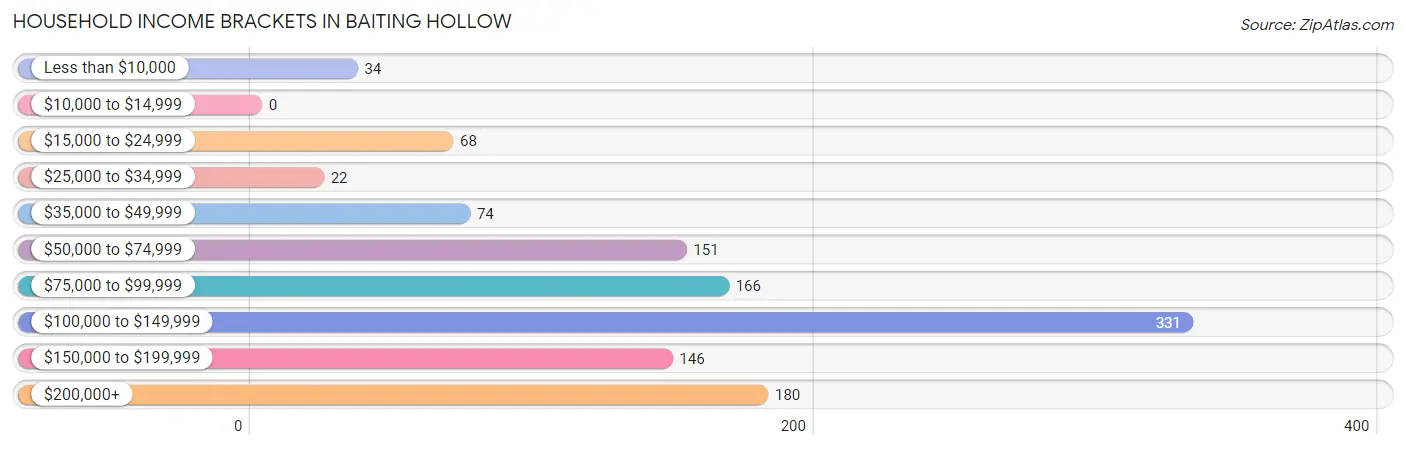
| Income Bracket | # Households | % Households |
| Less than $10,000 | 34 | 2.9% |
| $10,000 to $14,999 | 0 | 0.0% |
| $15,000 to $24,999 | 68 | 5.8% |
| $25,000 to $34,999 | 22 | 1.9% |
| $35,000 to $49,999 | 74 | 6.3% |
| $50,000 to $74,999 | 151 | 12.9% |
| $75,000 to $99,999 | 166 | 14.2% |
| $100,000 to $149,999 | 331 | 28.2% |
| $150,000 to $199,999 | 146 | 12.5% |
| $200,000+ | 180 | 15.4% |
Household Income by Householder Age in Baiting Hollow
The median household income in Baiting Hollow is $108,313, with the highest median household income of $109,598 found in the 45 to 64 years age bracket for the primary householder. A total of 607 households (51.8%) fall into this category. Meanwhile, the 15 to 24 years age bracket for the primary householder has the lowest median household income of $0, with 5 households (0.4%) in this group.
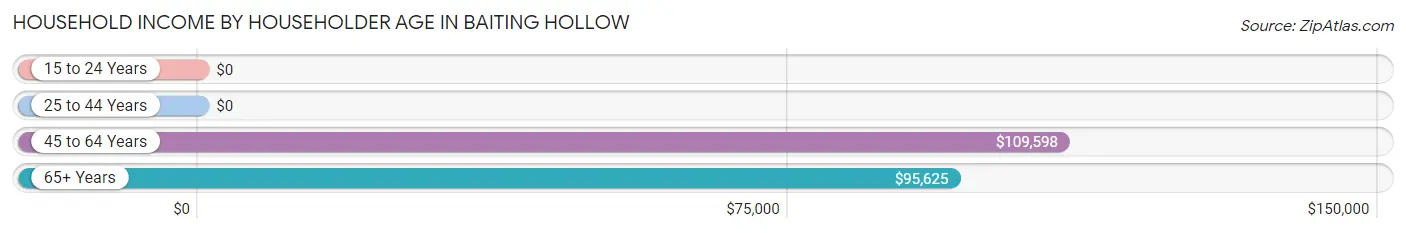
| Income Bracket | # Households | Median Income |
| 15 to 24 Years | 5 (0.4%) | $0 |
| 25 to 44 Years | 132 (11.3%) | $0 |
| 45 to 64 Years | 607 (51.8%) | $109,598 |
| 65+ Years | 428 (36.5%) | $95,625 |
| Total | 1,172 (100.0%) | $108,313 |
Poverty in Baiting Hollow
Income Below Poverty by Sex and Age in Baiting Hollow
With 2.4% poverty level for males and 1.2% for females among the residents of Baiting Hollow, 65 to 74 year old males and 15 year old females are the most vulnerable to poverty, with 34 males (13.6%) and 5 females (11.6%) in their respective age groups living below the poverty level.
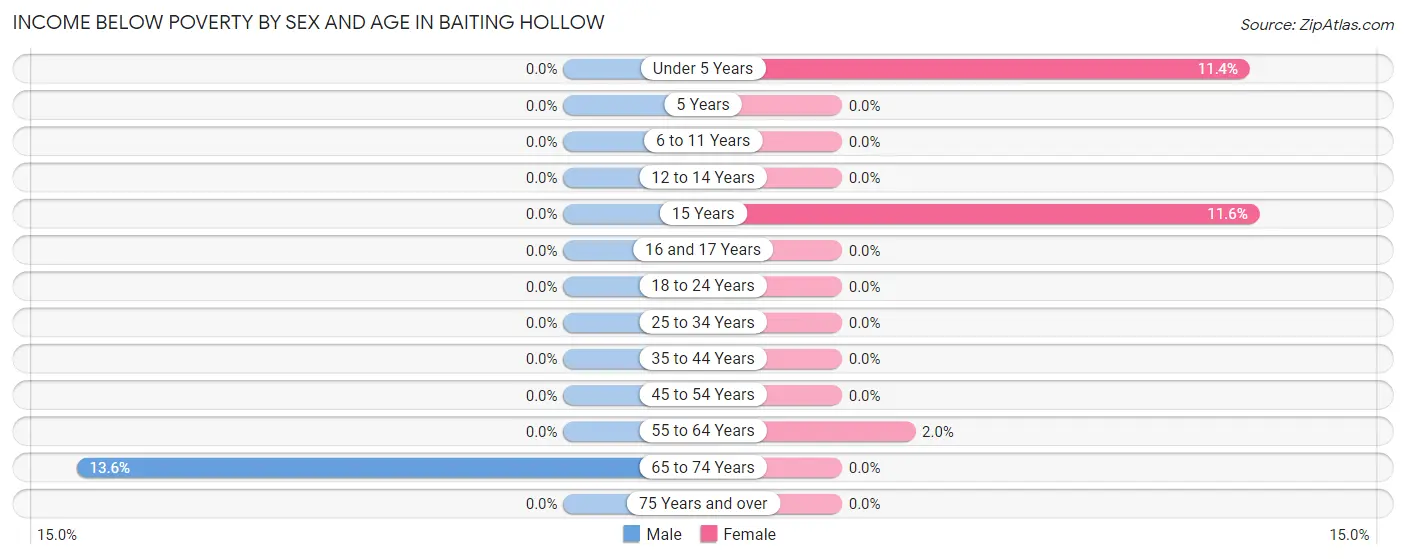
| Age Bracket | Male | Female |
| Under 5 Years | 0 (0.0%) | 5 (11.4%) |
| 5 Years | 0 (0.0%) | 0 (0.0%) |
| 6 to 11 Years | 0 (0.0%) | 0 (0.0%) |
| 12 to 14 Years | 0 (0.0%) | 0 (0.0%) |
| 15 Years | 0 (0.0%) | 5 (11.6%) |
| 16 and 17 Years | 0 (0.0%) | 0 (0.0%) |
| 18 to 24 Years | 0 (0.0%) | 0 (0.0%) |
| 25 to 34 Years | 0 (0.0%) | 0 (0.0%) |
| 35 to 44 Years | 0 (0.0%) | 0 (0.0%) |
| 45 to 54 Years | 0 (0.0%) | 0 (0.0%) |
| 55 to 64 Years | 0 (0.0%) | 8 (2.0%) |
| 65 to 74 Years | 34 (13.6%) | 0 (0.0%) |
| 75 Years and over | 0 (0.0%) | 0 (0.0%) |
| Total | 34 (2.4%) | 18 (1.2%) |
Income Above Poverty by Sex and Age in Baiting Hollow
According to the poverty statistics in Baiting Hollow, males aged under 5 years and females aged 5 years are the age groups that are most secure financially, with 100.0% of males and 100.0% of females in these age groups living above the poverty line.
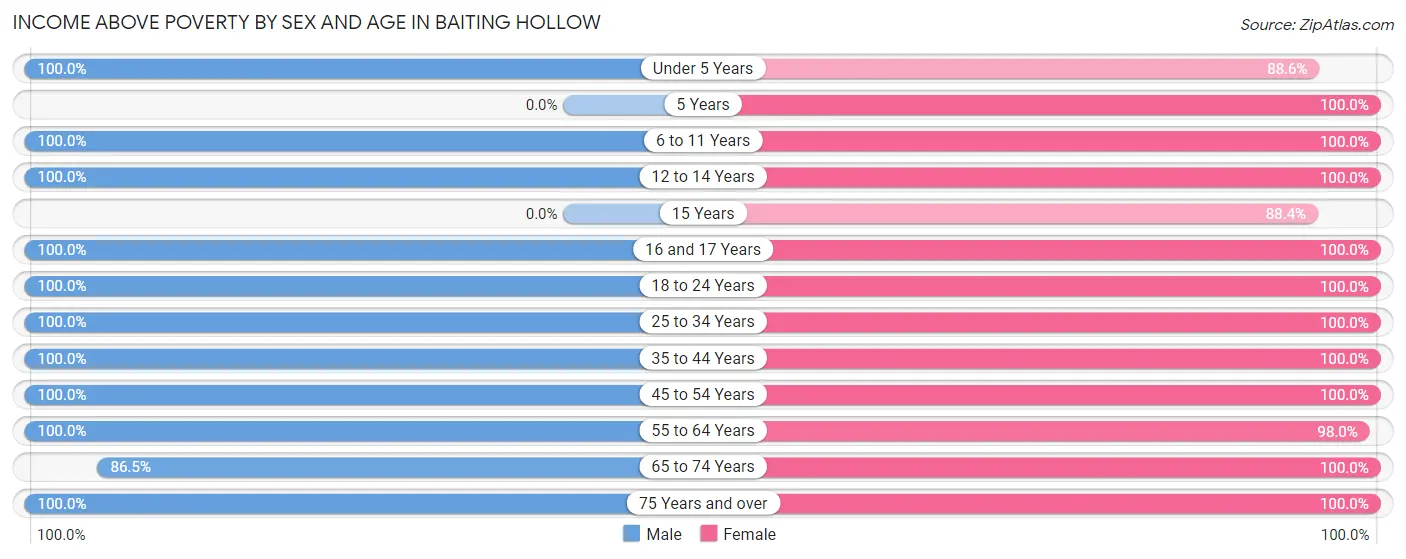
| Age Bracket | Male | Female |
| Under 5 Years | 94 (100.0%) | 39 (88.6%) |
| 5 Years | 0 (0.0%) | 22 (100.0%) |
| 6 to 11 Years | 17 (100.0%) | 50 (100.0%) |
| 12 to 14 Years | 34 (100.0%) | 42 (100.0%) |
| 15 Years | 0 (0.0%) | 38 (88.4%) |
| 16 and 17 Years | 55 (100.0%) | 63 (100.0%) |
| 18 to 24 Years | 45 (100.0%) | 40 (100.0%) |
| 25 to 34 Years | 123 (100.0%) | 105 (100.0%) |
| 35 to 44 Years | 129 (100.0%) | 85 (100.0%) |
| 45 to 54 Years | 178 (100.0%) | 215 (100.0%) |
| 55 to 64 Years | 388 (100.0%) | 384 (98.0%) |
| 65 to 74 Years | 217 (86.5%) | 186 (100.0%) |
| 75 Years and over | 114 (100.0%) | 175 (100.0%) |
| Total | 1,394 (97.6%) | 1,444 (98.8%) |
Income Below Poverty Among Married-Couple Families in Baiting Hollow
The poverty statistics for married-couple families in Baiting Hollow show that 0.9% or 7 of the total 801 families live below the poverty line. Families with no children have the highest poverty rate of 1.2%, comprising of 7 families. On the other hand, families with 1 or 2 children have the lowest poverty rate of 0.0%, which includes 0 families.
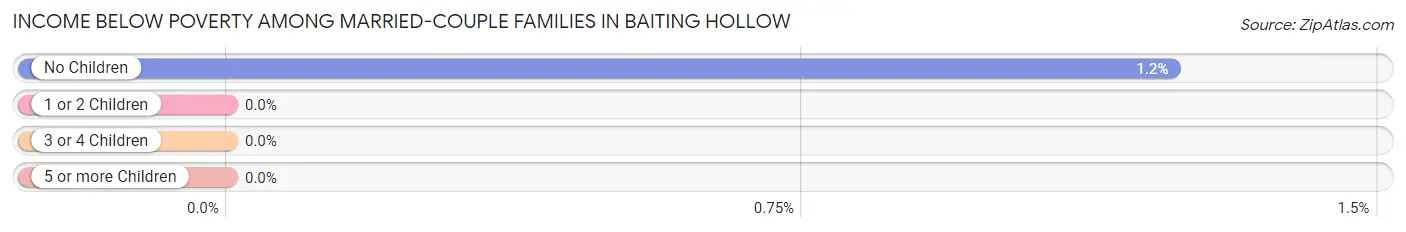
| Children | Above Poverty | Below Poverty |
| No Children | 562 (98.8%) | 7 (1.2%) |
| 1 or 2 Children | 209 (100.0%) | 0 (0.0%) |
| 3 or 4 Children | 23 (100.0%) | 0 (0.0%) |
| 5 or more Children | 0 (0.0%) | 0 (0.0%) |
| Total | 794 (99.1%) | 7 (0.9%) |
Income Below Poverty Among Single-Parent Households in Baiting Hollow
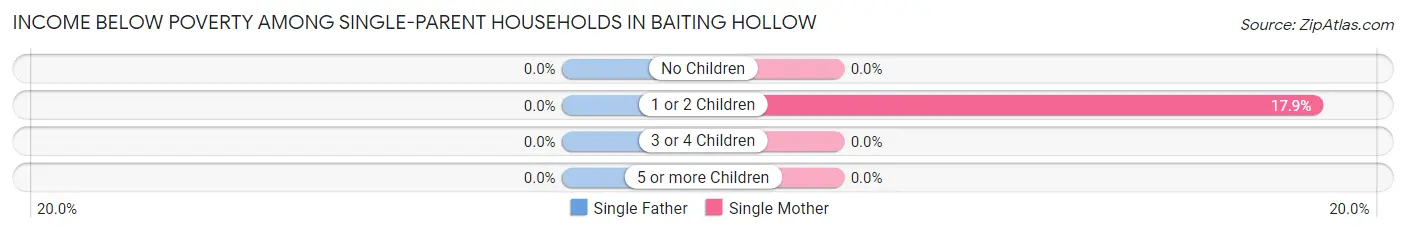
| Children | Single Father | Single Mother |
| No Children | 0 (0.0%) | 0 (0.0%) |
| 1 or 2 Children | 0 (0.0%) | 5 (17.9%) |
| 3 or 4 Children | 0 (0.0%) | 0 (0.0%) |
| 5 or more Children | 0 (0.0%) | 0 (0.0%) |
| Total | 0 (0.0%) | 5 (4.6%) |
Income Below Poverty Among Married-Couple vs Single-Parent Households in Baiting Hollow
The poverty data for Baiting Hollow shows that 7 of the married-couple family households (0.9%) and 5 of the single-parent households (3.8%) are living below the poverty level. Within the married-couple family households, those with no children have the highest poverty rate, with 7 households (1.2%) falling below the poverty line. Among the single-parent households, those with 1 or 2 children have the highest poverty rate, with 5 household (17.9%) living below poverty.
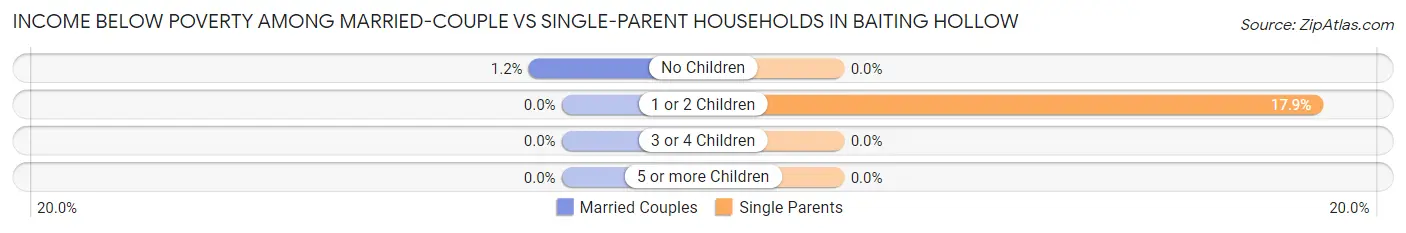
| Children | Married-Couple Families | Single-Parent Households |
| No Children | 7 (1.2%) | 0 (0.0%) |
| 1 or 2 Children | 0 (0.0%) | 5 (17.9%) |
| 3 or 4 Children | 0 (0.0%) | 0 (0.0%) |
| 5 or more Children | 0 (0.0%) | 0 (0.0%) |
| Total | 7 (0.9%) | 5 (3.8%) |
Race in Baiting Hollow
The most populous races in Baiting Hollow are White / Caucasian (2,536 | 87.5%), Asian (179 | 6.2%), and Black / African American (130 | 4.5%).
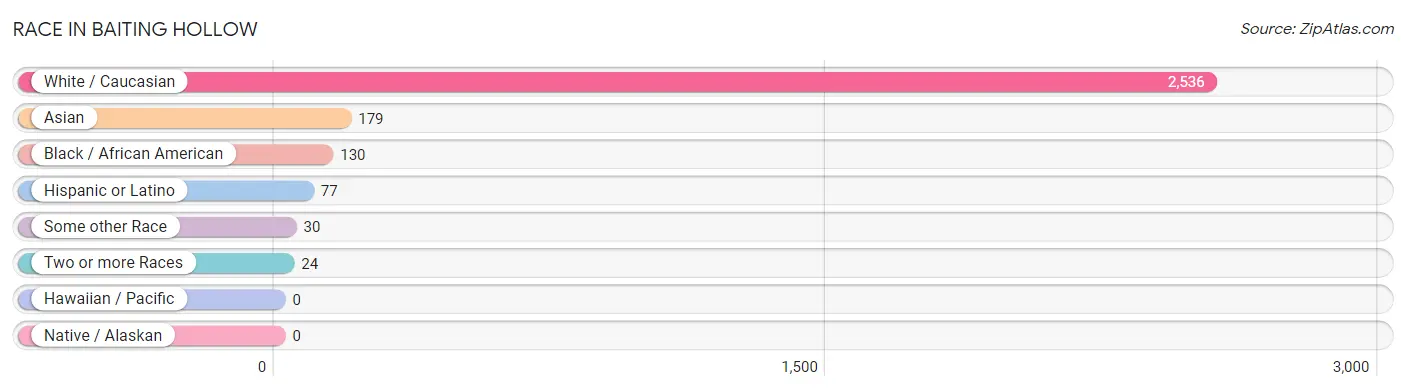
| Race | # Population | % Population |
| Asian | 179 | 6.2% |
| Black / African American | 130 | 4.5% |
| Hawaiian / Pacific | 0 | 0.0% |
| Hispanic or Latino | 77 | 2.7% |
| Native / Alaskan | 0 | 0.0% |
| White / Caucasian | 2,536 | 87.5% |
| Two or more Races | 24 | 0.8% |
| Some other Race | 30 | 1.0% |
| Total | 2,899 | 100.0% |
Ancestry in Baiting Hollow
The most populous ancestries reported in Baiting Hollow are German (675 | 23.3%), Irish (453 | 15.6%), Italian (450 | 15.5%), English (261 | 9.0%), and Polish (250 | 8.6%), together accounting for 72.0% of all Baiting Hollow residents.
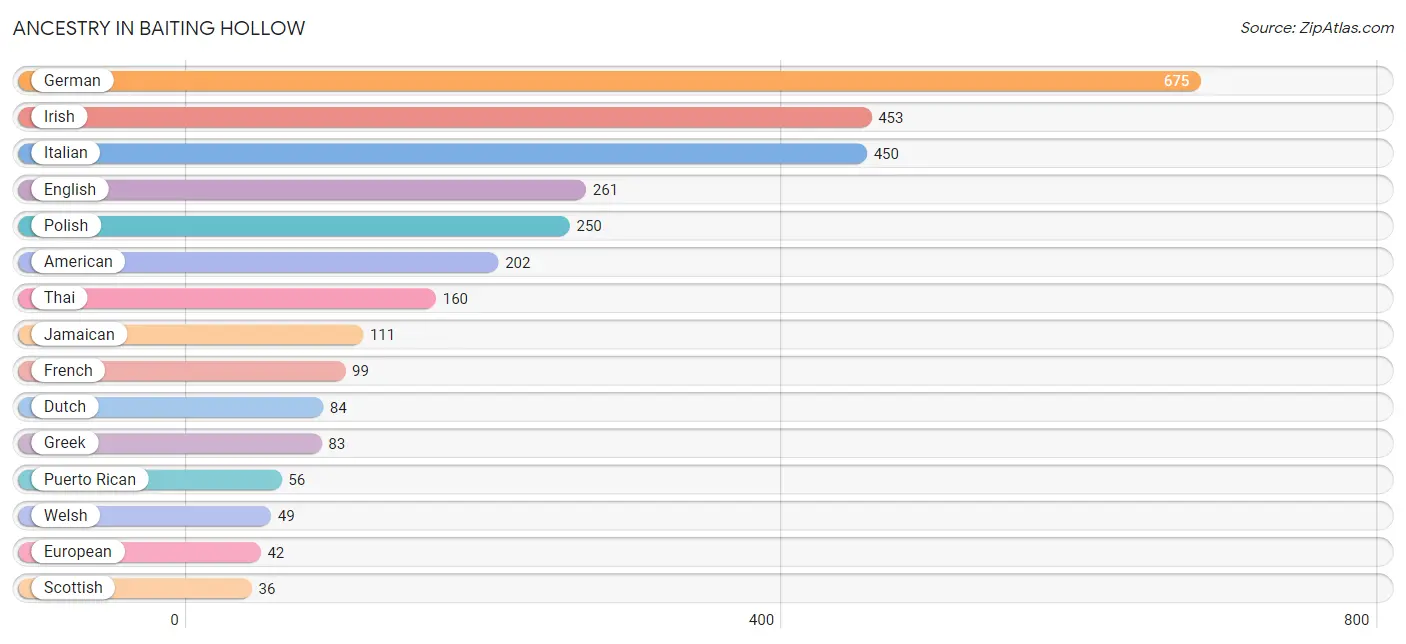
| Ancestry | # Population | % Population |
| American | 202 | 7.0% |
| Austrian | 15 | 0.5% |
| British | 8 | 0.3% |
| Burmese | 19 | 0.7% |
| Colombian | 17 | 0.6% |
| Croatian | 27 | 0.9% |
| Danish | 9 | 0.3% |
| Dutch | 84 | 2.9% |
| Eastern European | 24 | 0.8% |
| English | 261 | 9.0% |
| European | 42 | 1.5% |
| French | 99 | 3.4% |
| French Canadian | 5 | 0.2% |
| German | 675 | 23.3% |
| Greek | 83 | 2.9% |
| Hungarian | 8 | 0.3% |
| Irish | 453 | 15.6% |
| Italian | 450 | 15.5% |
| Jamaican | 111 | 3.8% |
| Lithuanian | 35 | 1.2% |
| Mexican | 4 | 0.1% |
| Norwegian | 10 | 0.3% |
| Polish | 250 | 8.6% |
| Puerto Rican | 56 | 1.9% |
| Romanian | 7 | 0.2% |
| Russian | 27 | 0.9% |
| Scotch-Irish | 19 | 0.7% |
| Scottish | 36 | 1.2% |
| Slovak | 4 | 0.1% |
| South African | 13 | 0.4% |
| South American | 17 | 0.6% |
| Subsaharan African | 13 | 0.4% |
| Swedish | 12 | 0.4% |
| Thai | 160 | 5.5% |
| Ukrainian | 12 | 0.4% |
| Welsh | 49 | 1.7% |
| West Indian | 5 | 0.2% | View All 37 Rows |
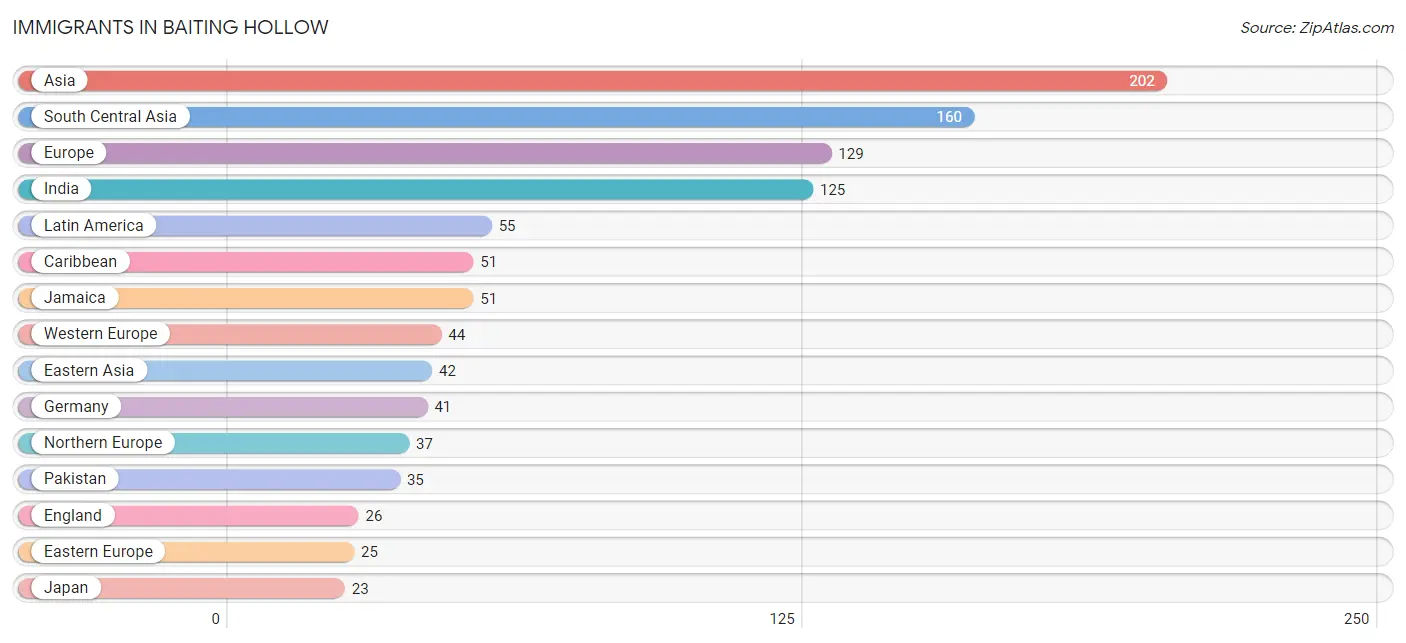
Immigrants in Baiting Hollow
The most numerous immigrant groups reported in Baiting Hollow came from Asia (202 | 7.0%), South Central Asia (160 | 5.5%), Europe (129 | 4.4%), India (125 | 4.3%), and Latin America (55 | 1.9%), together accounting for 23.1% of all Baiting Hollow residents.
| Immigration Origin | # Population | % Population |
| Africa | 13 | 0.4% |
| Asia | 202 | 7.0% |
| Canada | 5 | 0.2% |
| Caribbean | 51 | 1.8% |
| Central America | 4 | 0.1% |
| Croatia | 11 | 0.4% |
| Eastern Asia | 42 | 1.5% |
| Eastern Europe | 25 | 0.9% |
| England | 26 | 0.9% |
| Europe | 129 | 4.4% |
| Germany | 41 | 1.4% |
| Greece | 20 | 0.7% |
| India | 125 | 4.3% |
| Ireland | 11 | 0.4% |
| Italy | 3 | 0.1% |
| Jamaica | 51 | 1.8% |
| Japan | 23 | 0.8% |
| Korea | 19 | 0.7% |
| Latin America | 55 | 1.9% |
| Mexico | 4 | 0.1% |
| Moldova | 7 | 0.2% |
| Netherlands | 3 | 0.1% |
| Northern Europe | 37 | 1.3% |
| Pakistan | 35 | 1.2% |
| Russia | 7 | 0.2% |
| South Africa | 13 | 0.4% |
| South Central Asia | 160 | 5.5% |
| Southern Europe | 23 | 0.8% |
| Western Europe | 44 | 1.5% | View All 29 Rows |
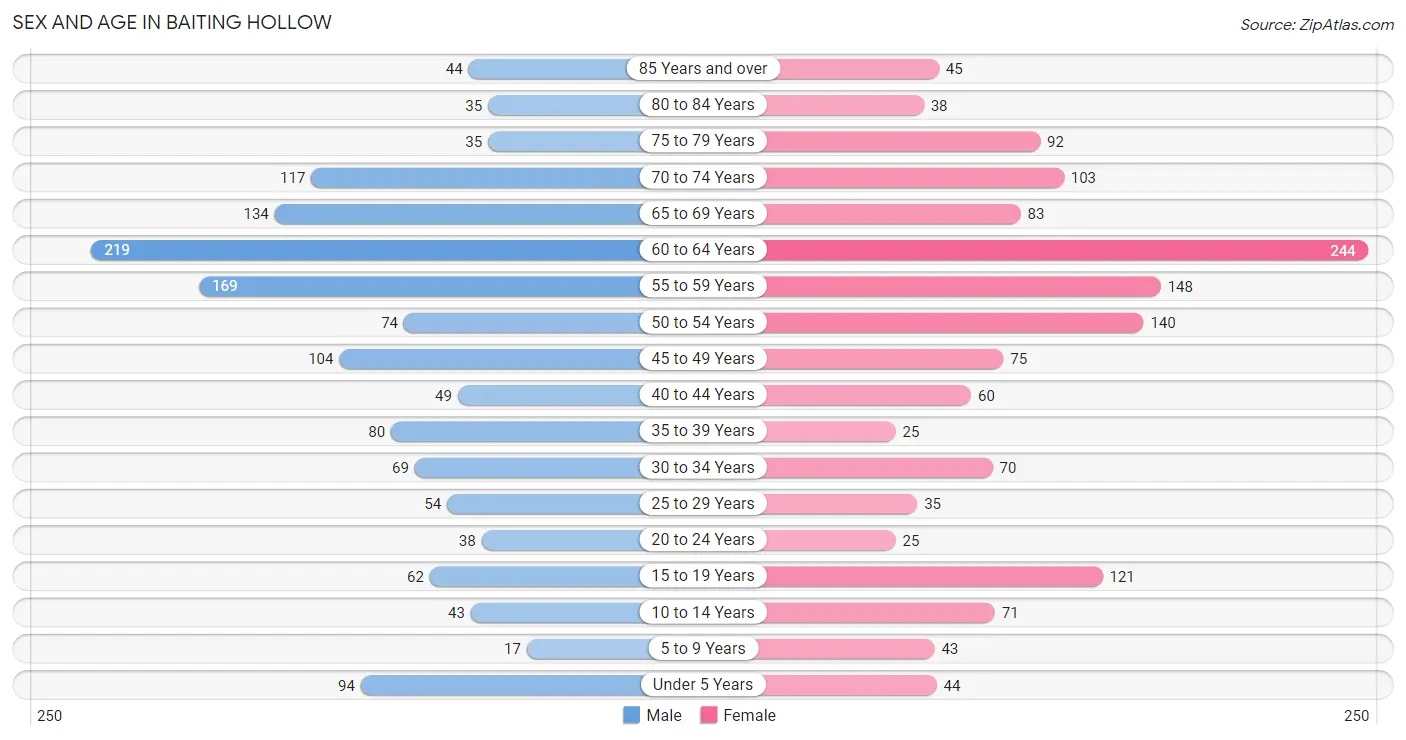
Sex and Age in Baiting Hollow
Sex and Age in Baiting Hollow
The most populous age groups in Baiting Hollow are 60 to 64 Years (219 | 15.2%) for men and 60 to 64 Years (244 | 16.7%) for women.
| Age Bracket | Male | Female |
| Under 5 Years | 94 (6.5%) | 44 (3.0%) |
| 5 to 9 Years | 17 (1.2%) | 43 (2.9%) |
| 10 to 14 Years | 43 (3.0%) | 71 (4.9%) |
| 15 to 19 Years | 62 (4.3%) | 121 (8.3%) |
| 20 to 24 Years | 38 (2.6%) | 25 (1.7%) |
| 25 to 29 Years | 54 (3.8%) | 35 (2.4%) |
| 30 to 34 Years | 69 (4.8%) | 70 (4.8%) |
| 35 to 39 Years | 80 (5.6%) | 25 (1.7%) |
| 40 to 44 Years | 49 (3.4%) | 60 (4.1%) |
| 45 to 49 Years | 104 (7.2%) | 75 (5.1%) |
| 50 to 54 Years | 74 (5.1%) | 140 (9.6%) |
| 55 to 59 Years | 169 (11.8%) | 148 (10.1%) |
| 60 to 64 Years | 219 (15.2%) | 244 (16.7%) |
| 65 to 69 Years | 134 (9.3%) | 83 (5.7%) |
| 70 to 74 Years | 117 (8.1%) | 103 (7.0%) |
| 75 to 79 Years | 35 (2.4%) | 92 (6.3%) |
| 80 to 84 Years | 35 (2.4%) | 38 (2.6%) |
| 85 Years and over | 44 (3.1%) | 45 (3.1%) |
| Total | 1,437 (100.0%) | 1,462 (100.0%) |
Families and Households in Baiting Hollow
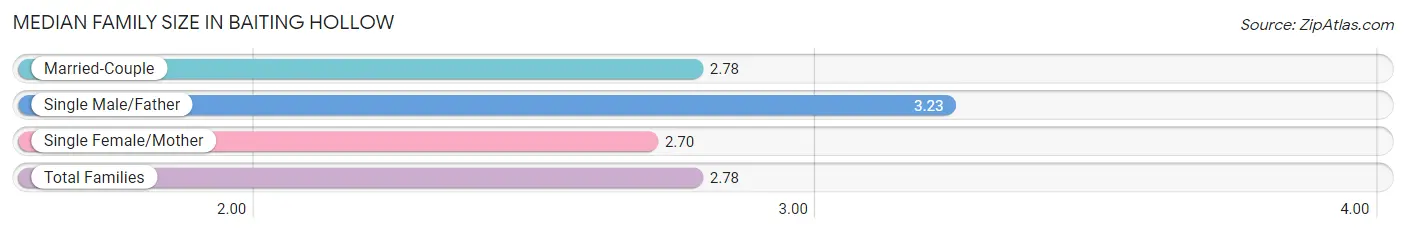
Median Family Size in Baiting Hollow
The median family size in Baiting Hollow is 2.78 persons per family, with single male/father families (22 | 2.4%) accounting for the largest median family size of 3.23 persons per family. On the other hand, single female/mother families (108 | 11.6%) represent the smallest median family size with 2.70 persons per family.
| Family Type | # Families | Family Size |
| Married-Couple | 801 (86.0%) | 2.78 |
| Single Male/Father | 22 (2.4%) | 3.23 |
| Single Female/Mother | 108 (11.6%) | 2.70 |
| Total Families | 931 (100.0%) | 2.78 |
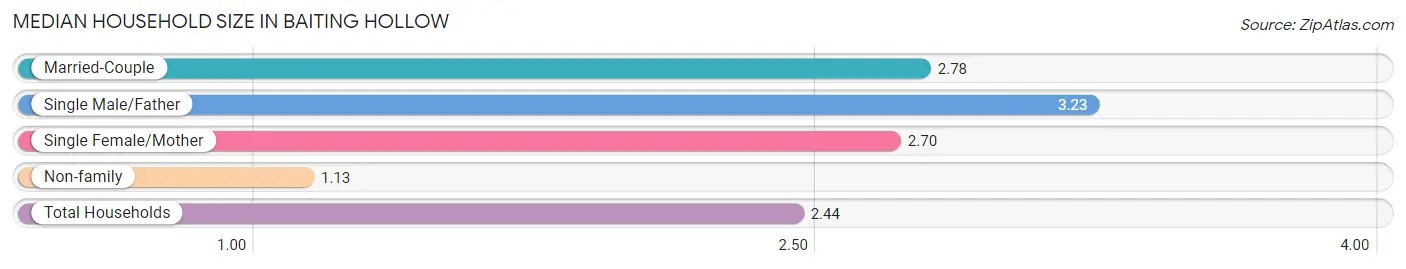
Median Household Size in Baiting Hollow
The median household size in Baiting Hollow is 2.44 persons per household, with single male/father households (22 | 1.9%) accounting for the largest median household size of 3.23 persons per household. non-family households (241 | 20.6%) represent the smallest median household size with 1.13 persons per household.
| Household Type | # Households | Household Size |
| Married-Couple | 801 (68.3%) | 2.78 |
| Single Male/Father | 22 (1.9%) | 3.23 |
| Single Female/Mother | 108 (9.2%) | 2.70 |
| Non-family | 241 (20.6%) | 1.13 |
| Total Households | 1,172 (100.0%) | 2.44 |
Household Size by Marriage Status in Baiting Hollow
Out of a total of 1,172 households in Baiting Hollow, 931 (79.4%) are family households, while 241 (20.6%) are nonfamily households. The most numerous type of family households are 2-person households, comprising 514, and the most common type of nonfamily households are 1-person households, comprising 218.
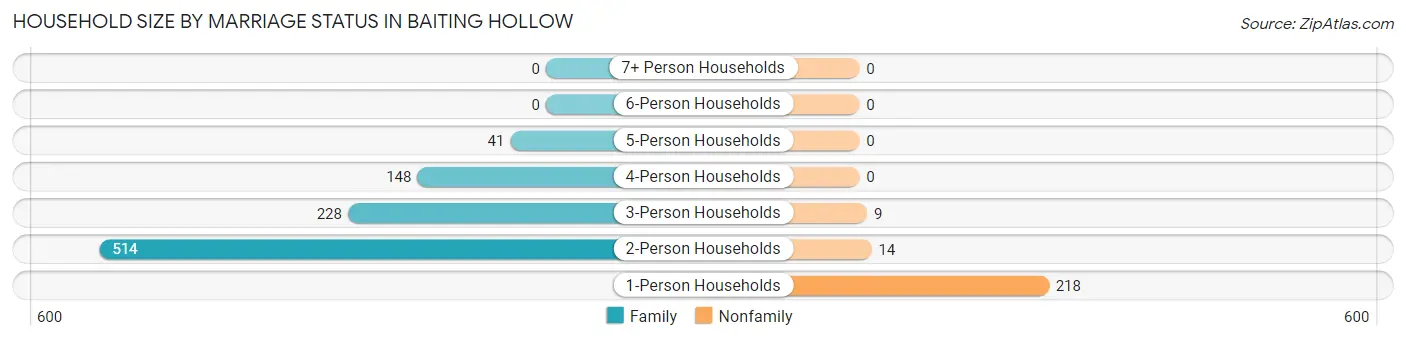
| Household Size | Family Households | Nonfamily Households |
| 1-Person Households | - | 218 (18.6%) |
| 2-Person Households | 514 (43.9%) | 14 (1.2%) |
| 3-Person Households | 228 (19.5%) | 9 (0.8%) |
| 4-Person Households | 148 (12.6%) | 0 (0.0%) |
| 5-Person Households | 41 (3.5%) | 0 (0.0%) |
| 6-Person Households | 0 (0.0%) | 0 (0.0%) |
| 7+ Person Households | 0 (0.0%) | 0 (0.0%) |
| Total | 931 (79.4%) | 241 (20.6%) |
Female Fertility in Baiting Hollow
Fertility by Age in Baiting Hollow
Average fertility rate in Baiting Hollow is 29.0 births per 1,000 women. Women in the age bracket of 35 to 50 years have the highest fertility rate with 67.0 births per 1,000 women. Women in the age bracket of 35 to 50 years acount for 100.0% of all women with births.
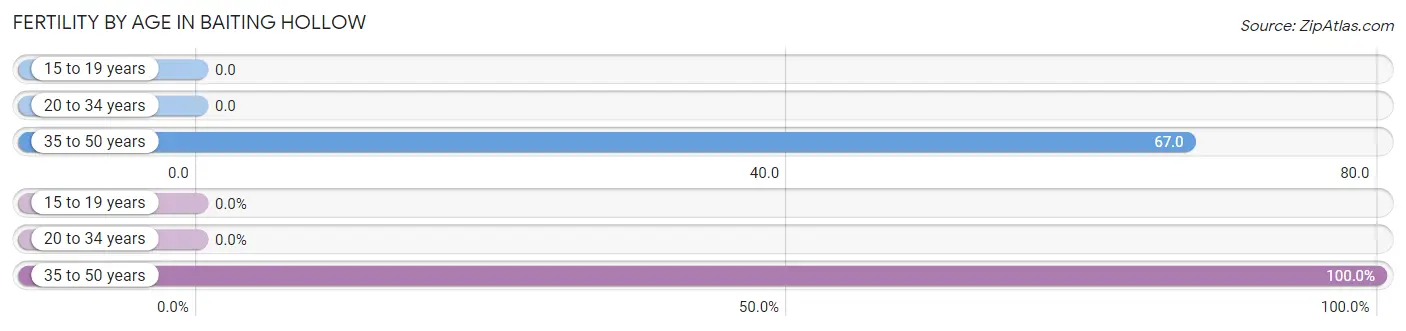
| Age Bracket | Women with Births | Births / 1,000 Women |
| 15 to 19 years | 0 (0.0%) | 0.0 |
| 20 to 34 years | 0 (0.0%) | 0.0 |
| 35 to 50 years | 13 (100.0%) | 67.0 |
| Total | 13 (100.0%) | 29.0 |
Fertility by Age by Marriage Status in Baiting Hollow
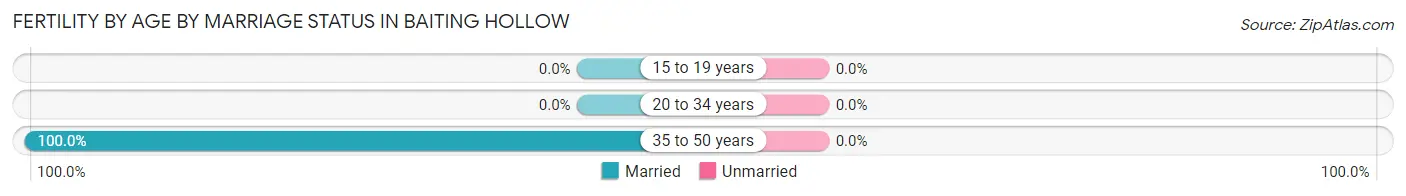
| Age Bracket | Married | Unmarried |
| 15 to 19 years | 0 (0.0%) | 0 (0.0%) |
| 20 to 34 years | 0 (0.0%) | 0 (0.0%) |
| 35 to 50 years | 13 (100.0%) | 0 (0.0%) |
| Total | 13 (100.0%) | 0 (0.0%) |
Fertility by Education in Baiting Hollow
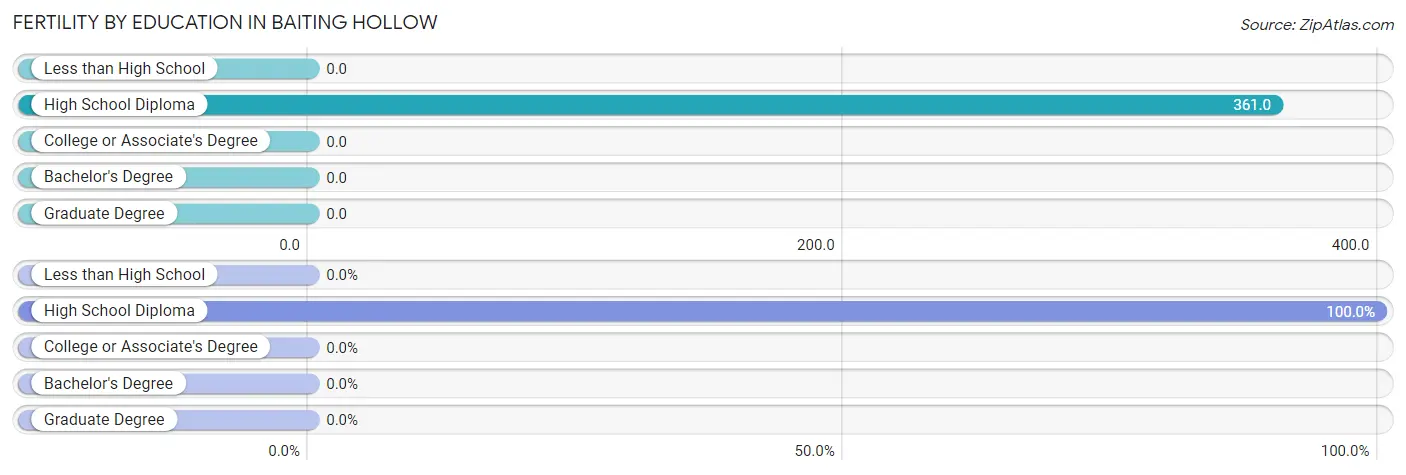
| Educational Attainment | Women with Births | Births / 1,000 Women |
| Less than High School | 0 (0.0%) | 0.0 |
| High School Diploma | 13 (100.0%) | 361.0 |
| College or Associate's Degree | 0 (0.0%) | 0.0 |
| Bachelor's Degree | 0 (0.0%) | 0.0 |
| Graduate Degree | 0 (0.0%) | 0.0 |
| Total | 13 (100.0%) | 29.0 |
Fertility by Education by Marriage Status in Baiting Hollow
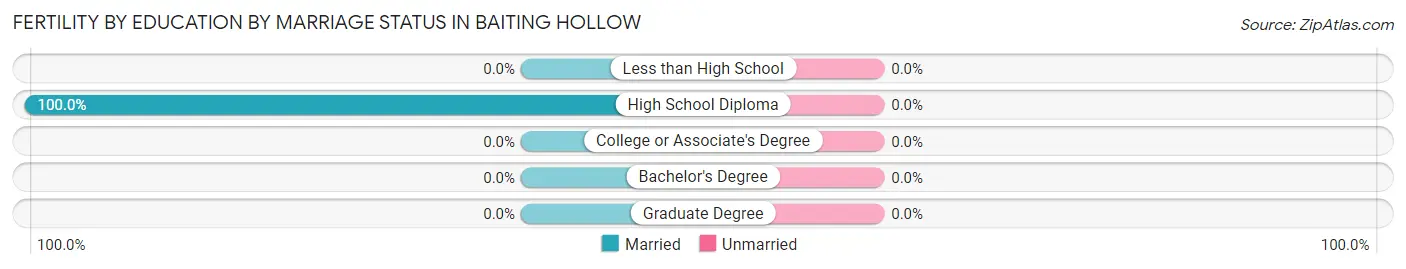
| Educational Attainment | Married | Unmarried |
| Less than High School | 0 (0.0%) | 0 (0.0%) |
| High School Diploma | 13 (100.0%) | 0 (0.0%) |
| College or Associate's Degree | 0 (0.0%) | 0 (0.0%) |
| Bachelor's Degree | 0 (0.0%) | 0 (0.0%) |
| Graduate Degree | 0 (0.0%) | 0 (0.0%) |
| Total | 13 (100.0%) | 0 (0.0%) |
Employment Characteristics in Baiting Hollow
Employment by Class of Employer in Baiting Hollow
Among the 1,363 employed individuals in Baiting Hollow, private company employees (830 | 60.9%), local government employees (218 | 16.0%), and self-employed (not incorporated) (131 | 9.6%) make up the most common classes of employment.
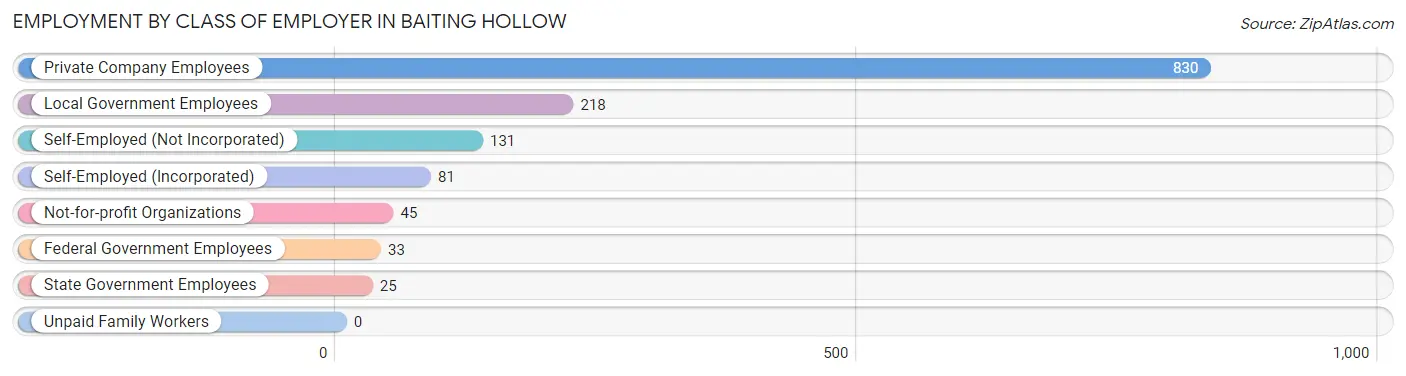
| Employer Class | # Employees | % Employees |
| Private Company Employees | 830 | 60.9% |
| Self-Employed (Incorporated) | 81 | 5.9% |
| Self-Employed (Not Incorporated) | 131 | 9.6% |
| Not-for-profit Organizations | 45 | 3.3% |
| Local Government Employees | 218 | 16.0% |
| State Government Employees | 25 | 1.8% |
| Federal Government Employees | 33 | 2.4% |
| Unpaid Family Workers | 0 | 0.0% |
| Total | 1,363 | 100.0% |
Employment Status by Age in Baiting Hollow
According to the labor force statistics for Baiting Hollow, out of the total population over 16 years of age (2,544), 56.9% or 1,448 individuals are in the labor force, with 5.0% or 72 of them unemployed. The age group with the highest labor force participation rate is 25 to 29 years, with 100.0% or 89 individuals in the labor force. Within the labor force, the 25 to 29 years age range has the highest percentage of unemployed individuals, with 12.4% or 11 of them being unemployed.
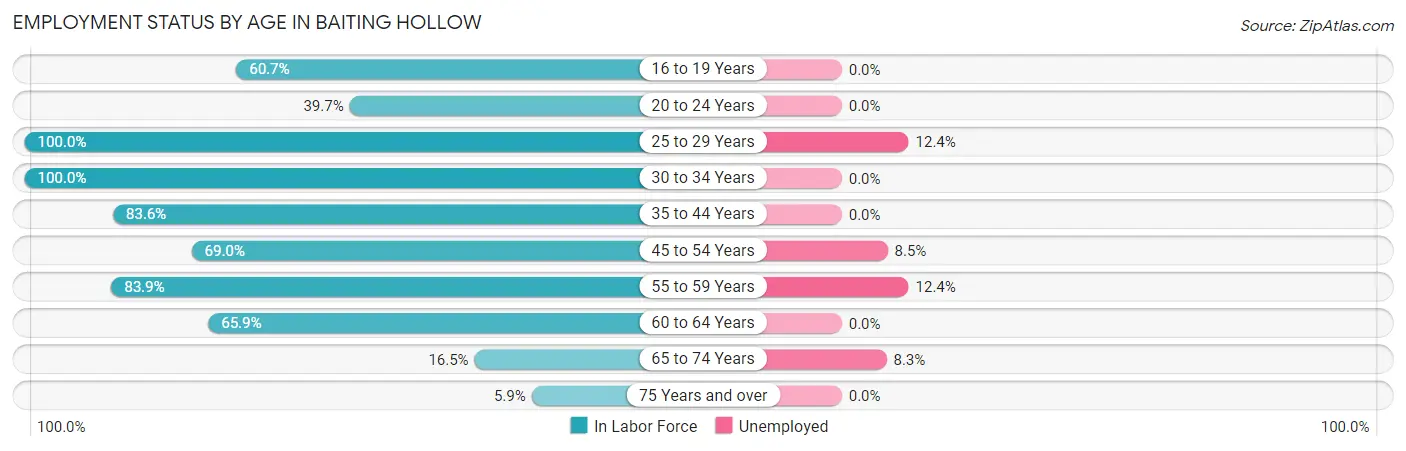
| Age Bracket | In Labor Force | Unemployed |
| 16 to 19 Years | 85 (60.7%) | 0 (0.0%) |
| 20 to 24 Years | 25 (39.7%) | 0 (0.0%) |
| 25 to 29 Years | 89 (100.0%) | 11 (12.4%) |
| 30 to 34 Years | 139 (100.0%) | 0 (0.0%) |
| 35 to 44 Years | 179 (83.6%) | 0 (0.0%) |
| 45 to 54 Years | 271 (69.0%) | 23 (8.5%) |
| 55 to 59 Years | 266 (83.9%) | 33 (12.4%) |
| 60 to 64 Years | 305 (65.9%) | 0 (0.0%) |
| 65 to 74 Years | 72 (16.5%) | 6 (8.3%) |
| 75 Years and over | 17 (5.9%) | 0 (0.0%) |
| Total | 1,448 (56.9%) | 72 (5.0%) |
Employment Status by Educational Attainment in Baiting Hollow
According to labor force statistics for Baiting Hollow, 77.3% of individuals (1,248) out of the total population between 25 and 64 years of age (1,615) are in the labor force, with 5.4% or 67 of them being unemployed. The group with the highest labor force participation rate are those with the educational attainment of high school diploma, with 89.5% or 188 individuals in the labor force. Within the labor force, individuals with less than high school education have the highest percentage of unemployment, with 43.6% or 17 of them being unemployed.
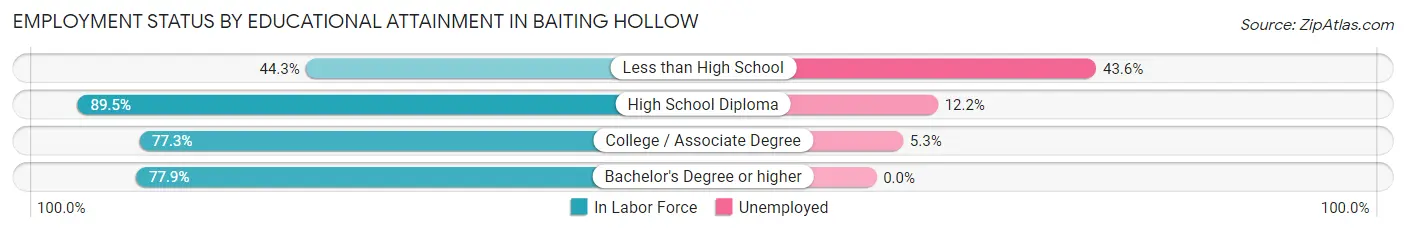
| Educational Attainment | In Labor Force | Unemployed |
| Less than High School | 39 (44.3%) | 38 (43.6%) |
| High School Diploma | 188 (89.5%) | 26 (12.2%) |
| College / Associate Degree | 507 (77.3%) | 35 (5.3%) |
| Bachelor's Degree or higher | 515 (77.9%) | 0 (0.0%) |
| Total | 1,248 (77.3%) | 87 (5.4%) |
Employment Occupations by Sex in Baiting Hollow
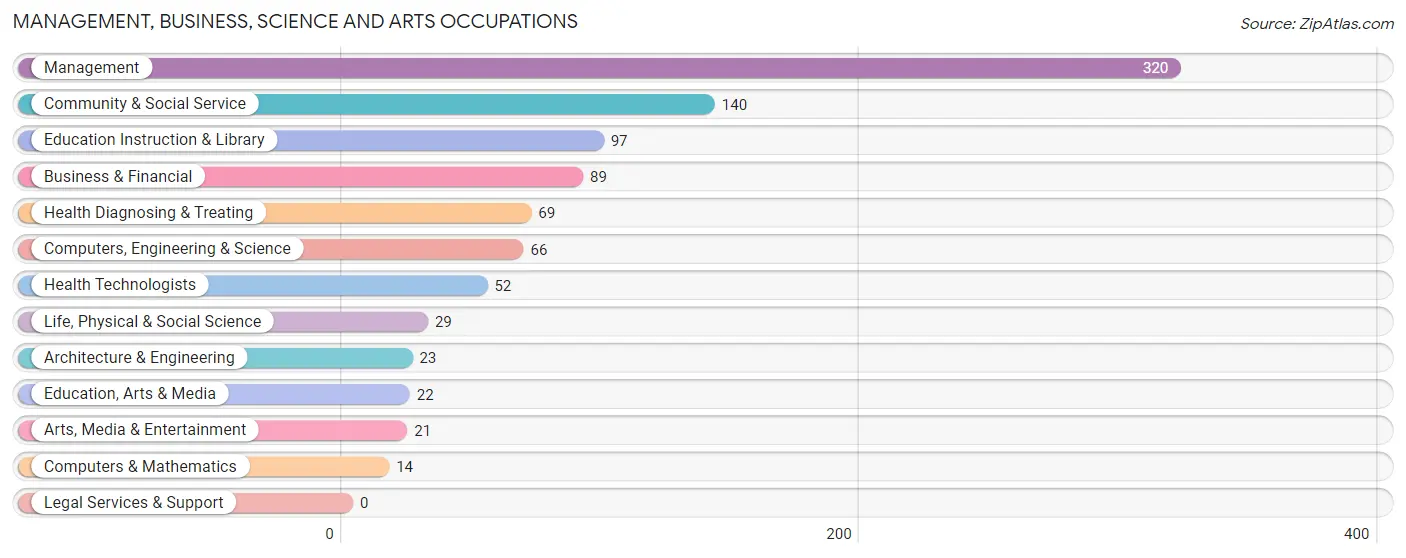
Management, Business, Science and Arts Occupations
The most common Management, Business, Science and Arts occupations in Baiting Hollow are Management (320 | 23.3%), Community & Social Service (140 | 10.2%), Education Instruction & Library (97 | 7.0%), Business & Financial (89 | 6.5%), and Health Diagnosing & Treating (69 | 5.0%).
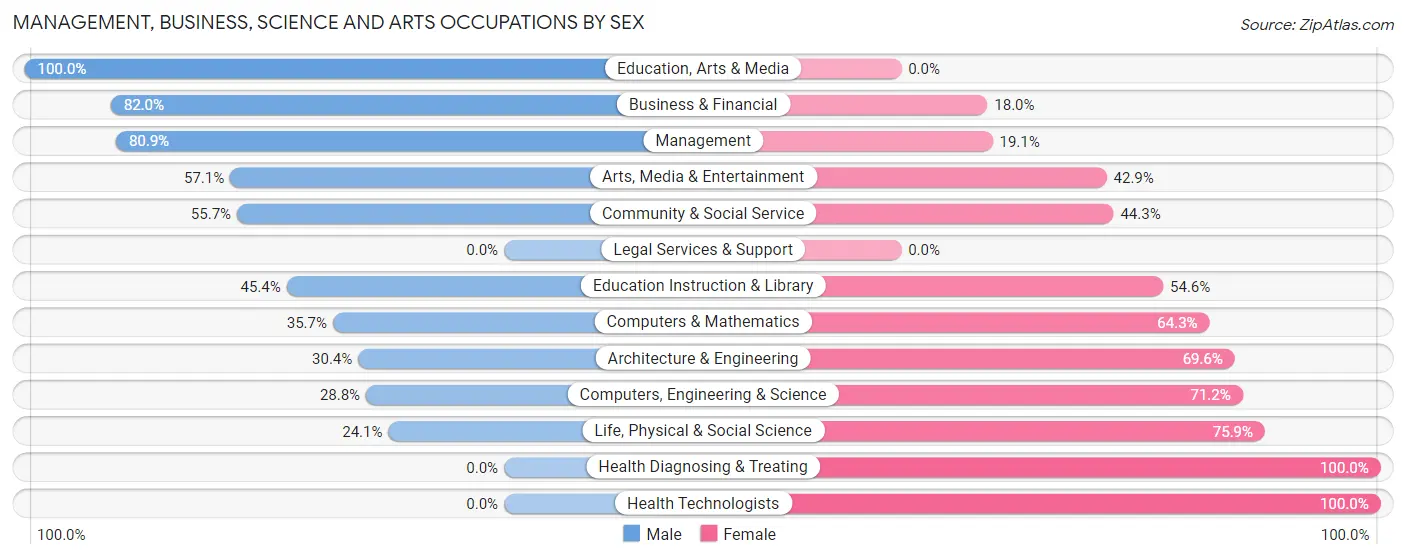
Management, Business, Science and Arts Occupations by Sex
Within the Management, Business, Science and Arts occupations in Baiting Hollow, the most male-oriented occupations are Education, Arts & Media (100.0%), Business & Financial (82.0%), and Management (80.9%), while the most female-oriented occupations are Health Diagnosing & Treating (100.0%), Health Technologists (100.0%), and Life, Physical & Social Science (75.9%).
| Occupation | Male | Female |
| Management | 259 (80.9%) | 61 (19.1%) |
| Business & Financial | 73 (82.0%) | 16 (18.0%) |
| Computers, Engineering & Science | 19 (28.8%) | 47 (71.2%) |
| Computers & Mathematics | 5 (35.7%) | 9 (64.3%) |
| Architecture & Engineering | 7 (30.4%) | 16 (69.6%) |
| Life, Physical & Social Science | 7 (24.1%) | 22 (75.9%) |
| Community & Social Service | 78 (55.7%) | 62 (44.3%) |
| Education, Arts & Media | 22 (100.0%) | 0 (0.0%) |
| Legal Services & Support | 0 (0.0%) | 0 (0.0%) |
| Education Instruction & Library | 44 (45.4%) | 53 (54.6%) |
| Arts, Media & Entertainment | 12 (57.1%) | 9 (42.9%) |
| Health Diagnosing & Treating | 0 (0.0%) | 69 (100.0%) |
| Health Technologists | 0 (0.0%) | 52 (100.0%) |
| Total (Category) | 429 (62.7%) | 255 (37.3%) |
| Total (Overall) | 804 (58.5%) | 571 (41.5%) |
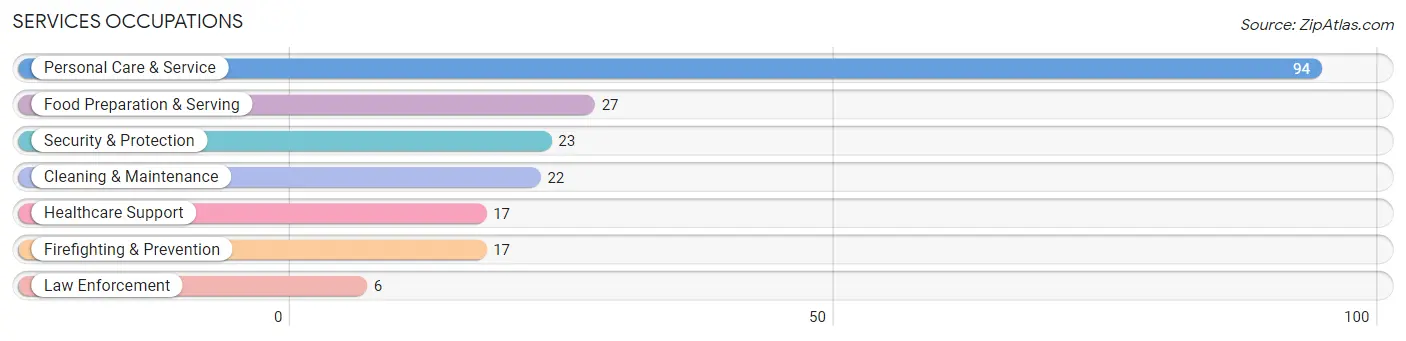
Services Occupations
The most common Services occupations in Baiting Hollow are Personal Care & Service (94 | 6.8%), Food Preparation & Serving (27 | 2.0%), Security & Protection (23 | 1.7%), Cleaning & Maintenance (22 | 1.6%), and Healthcare Support (17 | 1.2%).
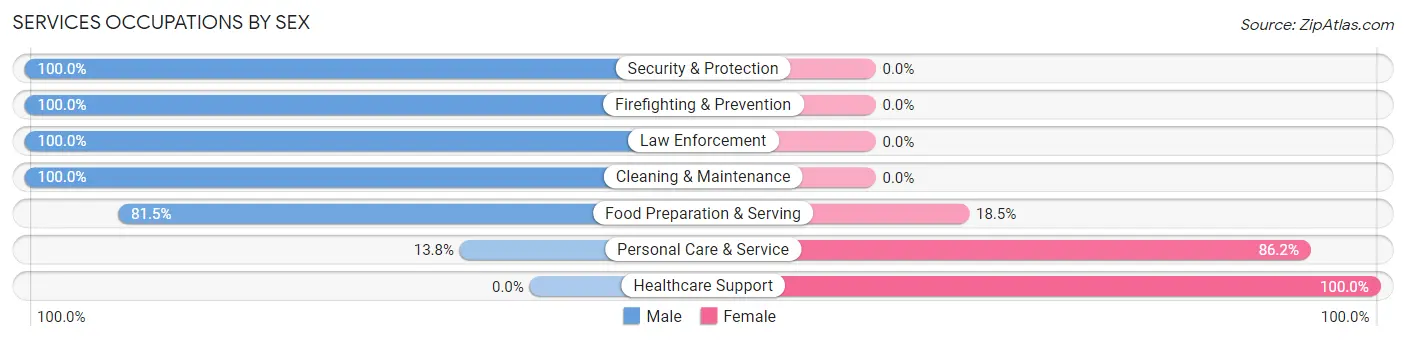
Services Occupations by Sex
Within the Services occupations in Baiting Hollow, the most male-oriented occupations are Security & Protection (100.0%), Firefighting & Prevention (100.0%), and Law Enforcement (100.0%), while the most female-oriented occupations are Healthcare Support (100.0%), Personal Care & Service (86.2%), and Food Preparation & Serving (18.5%).
| Occupation | Male | Female |
| Healthcare Support | 0 (0.0%) | 17 (100.0%) |
| Security & Protection | 23 (100.0%) | 0 (0.0%) |
| Firefighting & Prevention | 17 (100.0%) | 0 (0.0%) |
| Law Enforcement | 6 (100.0%) | 0 (0.0%) |
| Food Preparation & Serving | 22 (81.5%) | 5 (18.5%) |
| Cleaning & Maintenance | 22 (100.0%) | 0 (0.0%) |
| Personal Care & Service | 13 (13.8%) | 81 (86.2%) |
| Total (Category) | 80 (43.7%) | 103 (56.3%) |
| Total (Overall) | 804 (58.5%) | 571 (41.5%) |
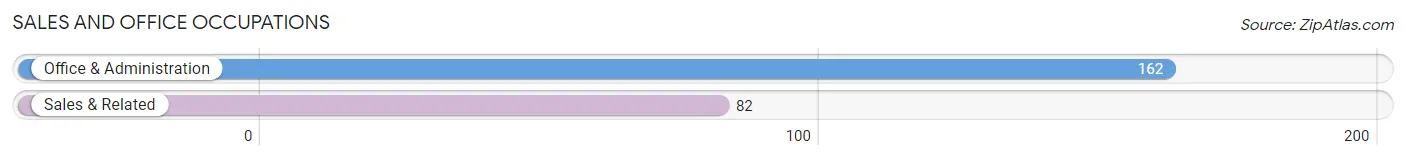
Sales and Office Occupations
The most common Sales and Office occupations in Baiting Hollow are Office & Administration (162 | 11.8%), and Sales & Related (82 | 6.0%).
Sales and Office Occupations by Sex
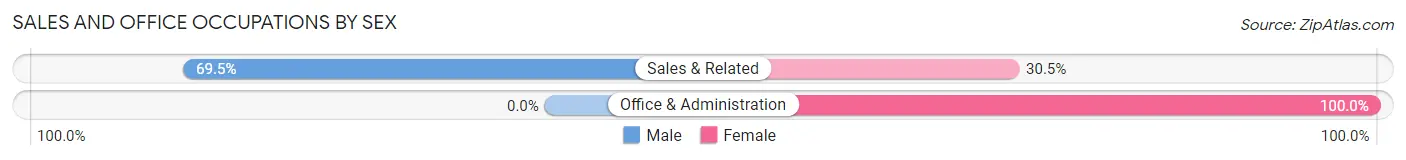
| Occupation | Male | Female |
| Sales & Related | 57 (69.5%) | 25 (30.5%) |
| Office & Administration | 0 (0.0%) | 162 (100.0%) |
| Total (Category) | 57 (23.4%) | 187 (76.6%) |
| Total (Overall) | 804 (58.5%) | 571 (41.5%) |
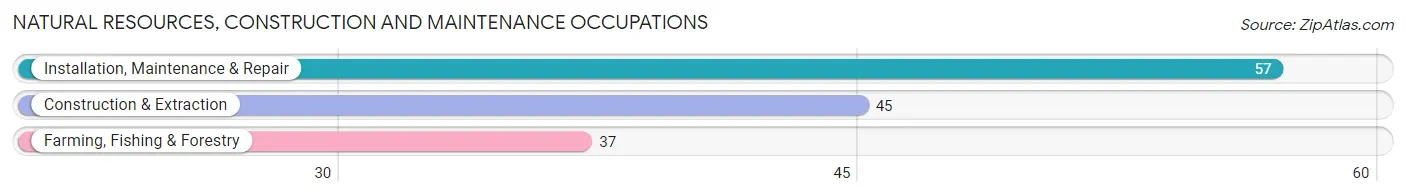
Natural Resources, Construction and Maintenance Occupations
The most common Natural Resources, Construction and Maintenance occupations in Baiting Hollow are Installation, Maintenance & Repair (57 | 4.2%), Construction & Extraction (45 | 3.3%), and Farming, Fishing & Forestry (37 | 2.7%).
Natural Resources, Construction and Maintenance Occupations by Sex
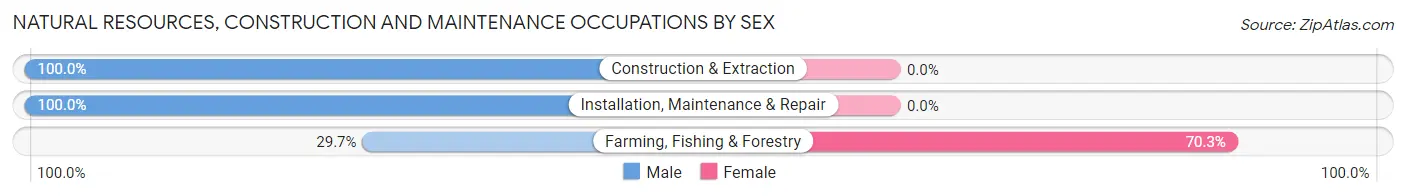
| Occupation | Male | Female |
| Farming, Fishing & Forestry | 11 (29.7%) | 26 (70.3%) |
| Construction & Extraction | 45 (100.0%) | 0 (0.0%) |
| Installation, Maintenance & Repair | 57 (100.0%) | 0 (0.0%) |
| Total (Category) | 113 (81.3%) | 26 (18.7%) |
| Total (Overall) | 804 (58.5%) | 571 (41.5%) |
Production, Transportation and Moving Occupations
The most common Production, Transportation and Moving occupations in Baiting Hollow are Production (57 | 4.2%), Transportation (49 | 3.6%), and Material Moving (19 | 1.4%).

Production, Transportation and Moving Occupations by Sex
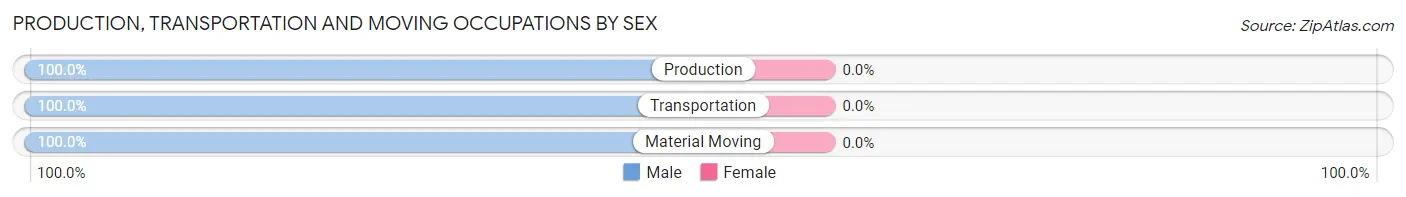
| Occupation | Male | Female |
| Production | 57 (100.0%) | 0 (0.0%) |
| Transportation | 49 (100.0%) | 0 (0.0%) |
| Material Moving | 19 (100.0%) | 0 (0.0%) |
| Total (Category) | 125 (100.0%) | 0 (0.0%) |
| Total (Overall) | 804 (58.5%) | 571 (41.5%) |
Employment Industries by Sex in Baiting Hollow
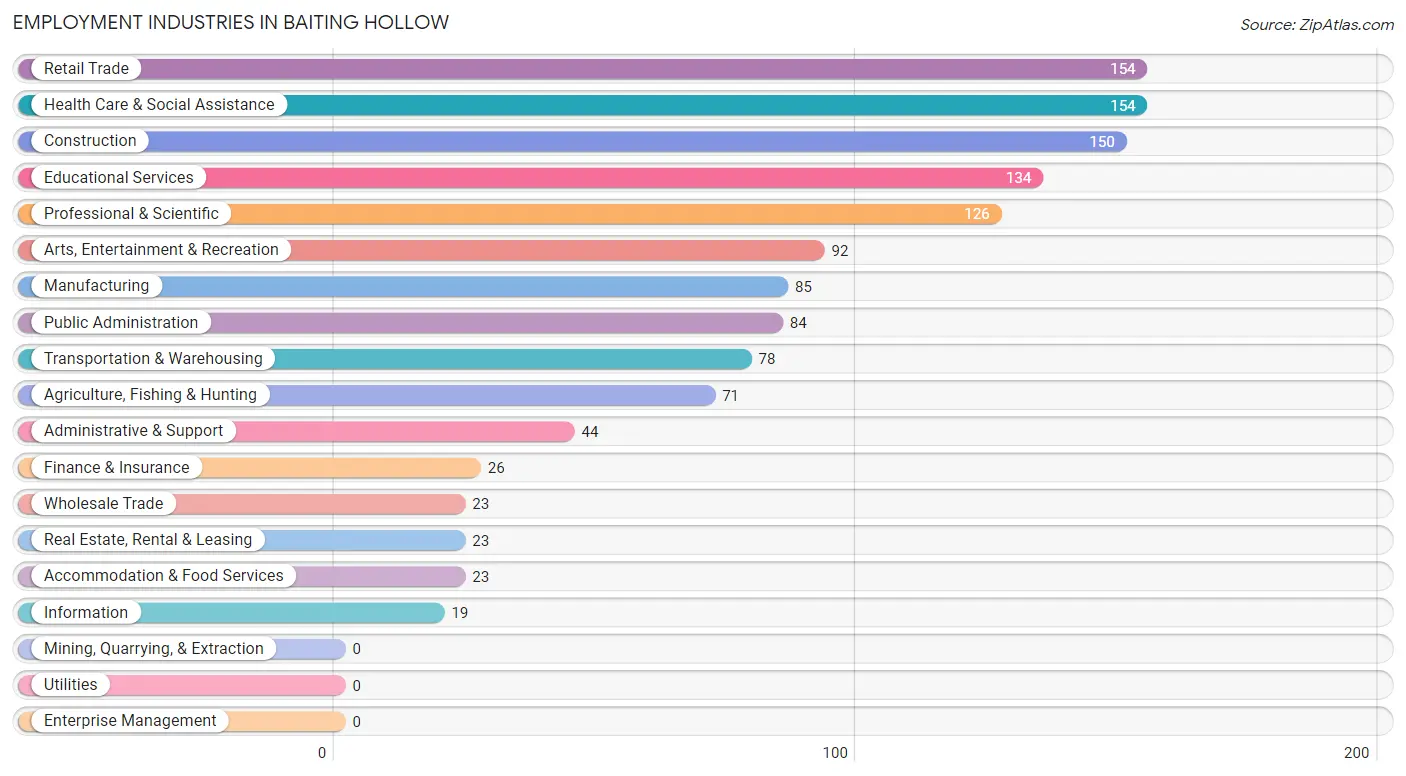
Employment Industries in Baiting Hollow
The major employment industries in Baiting Hollow include Retail Trade (154 | 11.2%), Health Care & Social Assistance (154 | 11.2%), Construction (150 | 10.9%), Educational Services (134 | 9.8%), and Professional & Scientific (126 | 9.2%).
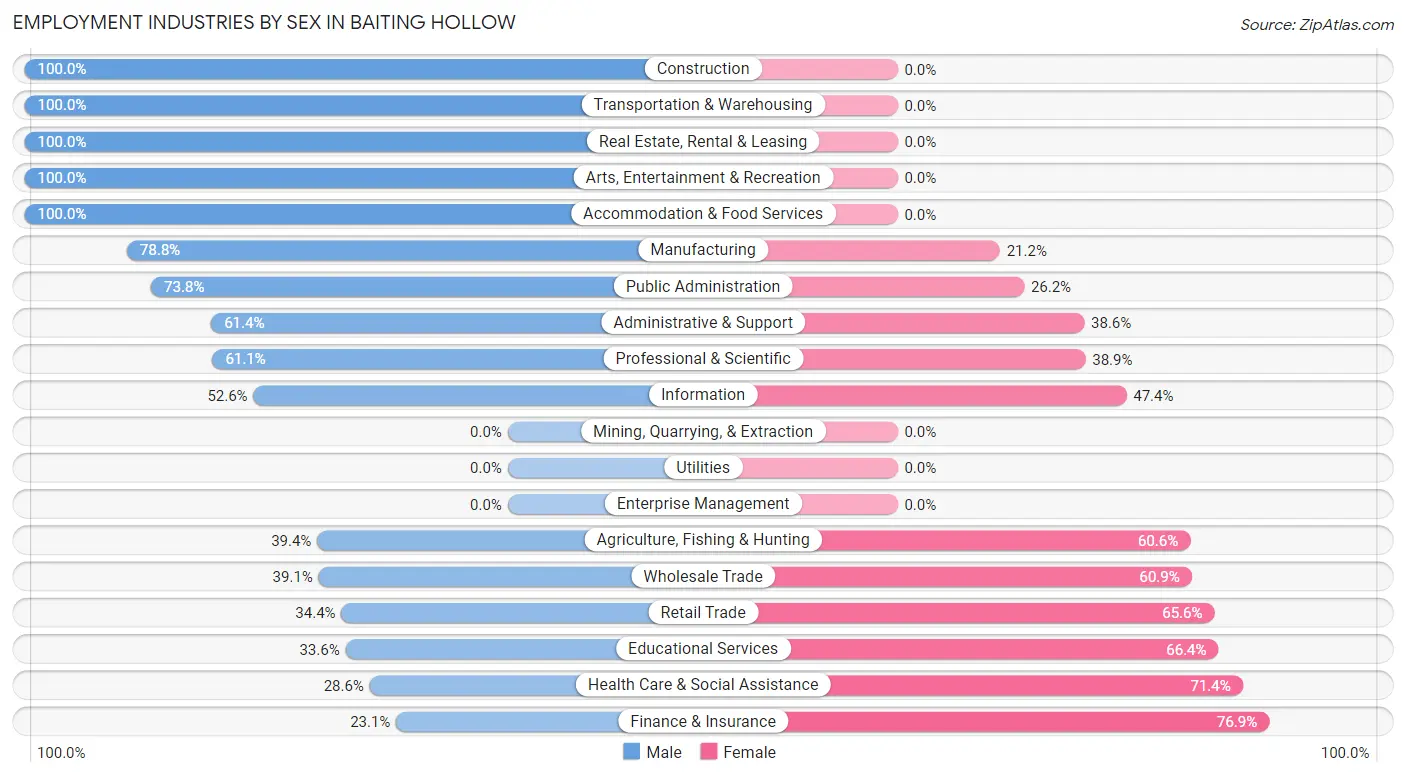
Employment Industries by Sex in Baiting Hollow
The Baiting Hollow industries that see more men than women are Construction (100.0%), Transportation & Warehousing (100.0%), and Real Estate, Rental & Leasing (100.0%), whereas the industries that tend to have a higher number of women are Finance & Insurance (76.9%), Health Care & Social Assistance (71.4%), and Educational Services (66.4%).
| Industry | Male | Female |
| Agriculture, Fishing & Hunting | 28 (39.4%) | 43 (60.6%) |
| Mining, Quarrying, & Extraction | 0 (0.0%) | 0 (0.0%) |
| Construction | 150 (100.0%) | 0 (0.0%) |
| Manufacturing | 67 (78.8%) | 18 (21.2%) |
| Wholesale Trade | 9 (39.1%) | 14 (60.9%) |
| Retail Trade | 53 (34.4%) | 101 (65.6%) |
| Transportation & Warehousing | 78 (100.0%) | 0 (0.0%) |
| Utilities | 0 (0.0%) | 0 (0.0%) |
| Information | 10 (52.6%) | 9 (47.4%) |
| Finance & Insurance | 6 (23.1%) | 20 (76.9%) |
| Real Estate, Rental & Leasing | 23 (100.0%) | 0 (0.0%) |
| Professional & Scientific | 77 (61.1%) | 49 (38.9%) |
| Enterprise Management | 0 (0.0%) | 0 (0.0%) |
| Administrative & Support | 27 (61.4%) | 17 (38.6%) |
| Educational Services | 45 (33.6%) | 89 (66.4%) |
| Health Care & Social Assistance | 44 (28.6%) | 110 (71.4%) |
| Arts, Entertainment & Recreation | 92 (100.0%) | 0 (0.0%) |
| Accommodation & Food Services | 23 (100.0%) | 0 (0.0%) |
| Public Administration | 62 (73.8%) | 22 (26.2%) |
| Total | 804 (58.5%) | 571 (41.5%) |
Education in Baiting Hollow
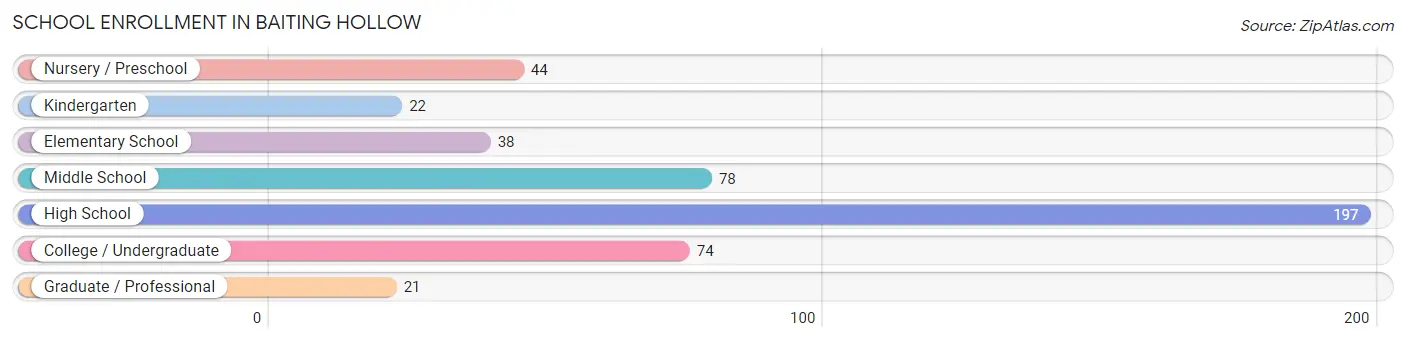
School Enrollment in Baiting Hollow
The most common levels of schooling among the 474 students in Baiting Hollow are high school (197 | 41.6%), middle school (78 | 16.5%), and college / undergraduate (74 | 15.6%).
| School Level | # Students | % Students |
| Nursery / Preschool | 44 | 9.3% |
| Kindergarten | 22 | 4.6% |
| Elementary School | 38 | 8.0% |
| Middle School | 78 | 16.5% |
| High School | 197 | 41.6% |
| College / Undergraduate | 74 | 15.6% |
| Graduate / Professional | 21 | 4.4% |
| Total | 474 | 100.0% |
School Enrollment by Age by Funding Source in Baiting Hollow
Out of a total of 474 students who are enrolled in schools in Baiting Hollow, 127 (26.8%) attend a private institution, while the remaining 347 (73.2%) are enrolled in public schools. The age group of 3 to 4 year olds has the highest likelihood of being enrolled in private schools, with 44 (100.0% in the age bracket) enrolled. Conversely, the age group of 5 to 9 year old has the lowest likelihood of being enrolled in a private school, with 60 (100.0% in the age bracket) attending a public institution.
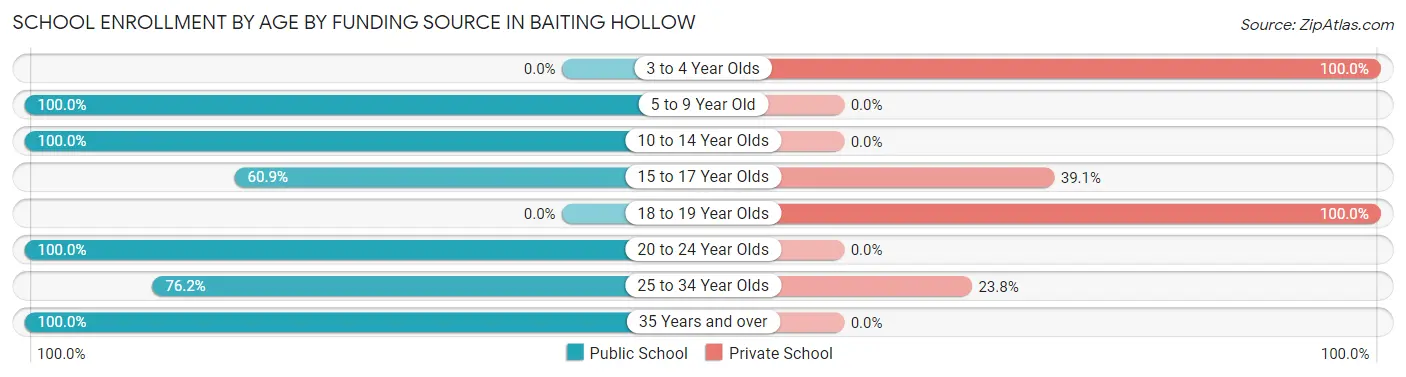
| Age Bracket | Public School | Private School |
| 3 to 4 Year Olds | 0 (0.0%) | 44 (100.0%) |
| 5 to 9 Year Old | 60 (100.0%) | 0 (0.0%) |
| 10 to 14 Year Olds | 114 (100.0%) | 0 (0.0%) |
| 15 to 17 Year Olds | 98 (60.9%) | 63 (39.1%) |
| 18 to 19 Year Olds | 0 (0.0%) | 15 (100.0%) |
| 20 to 24 Year Olds | 52 (100.0%) | 0 (0.0%) |
| 25 to 34 Year Olds | 16 (76.2%) | 5 (23.8%) |
| 35 Years and over | 7 (100.0%) | 0 (0.0%) |
| Total | 347 (73.2%) | 127 (26.8%) |
Educational Attainment by Field of Study in Baiting Hollow
Business (205 | 19.9%), education (188 | 18.2%), social sciences (135 | 13.1%), science & technology (123 | 11.9%), and bio, nature & agricultural (70 | 6.8%) are the most common fields of study among 1,031 individuals in Baiting Hollow who have obtained a bachelor's degree or higher.
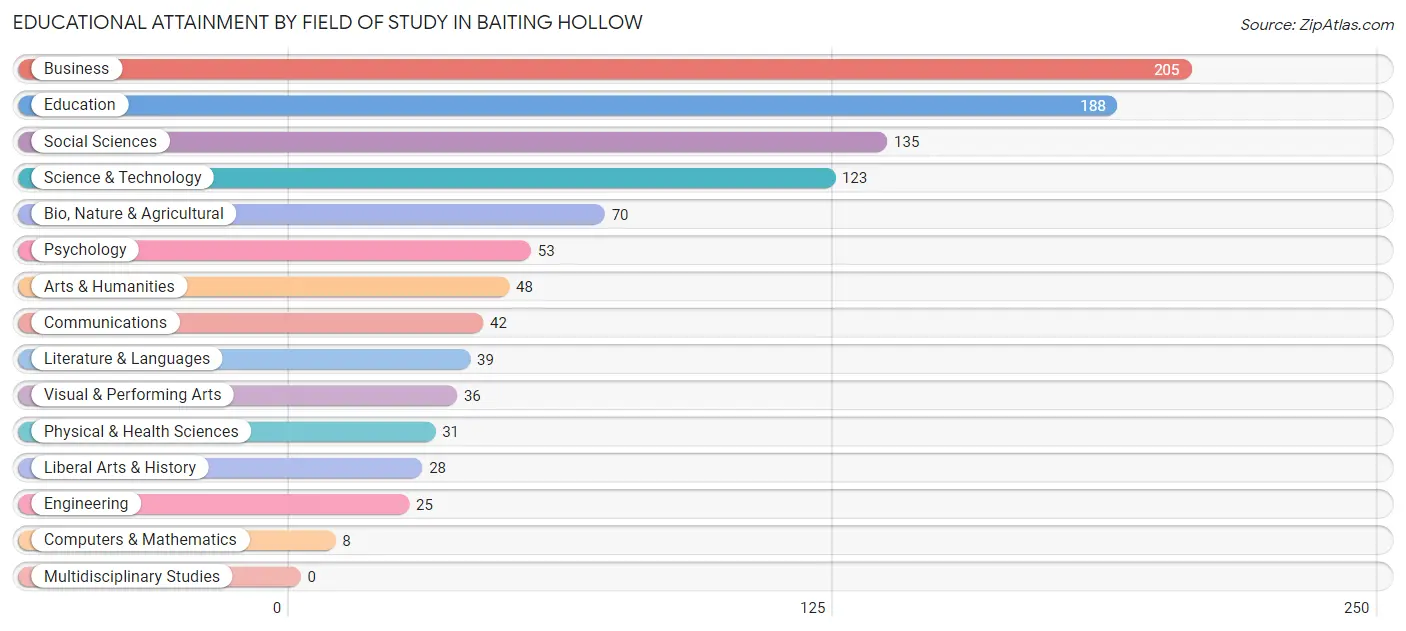
| Field of Study | # Graduates | % Graduates |
| Computers & Mathematics | 8 | 0.8% |
| Bio, Nature & Agricultural | 70 | 6.8% |
| Physical & Health Sciences | 31 | 3.0% |
| Psychology | 53 | 5.1% |
| Social Sciences | 135 | 13.1% |
| Engineering | 25 | 2.4% |
| Multidisciplinary Studies | 0 | 0.0% |
| Science & Technology | 123 | 11.9% |
| Business | 205 | 19.9% |
| Education | 188 | 18.2% |
| Literature & Languages | 39 | 3.8% |
| Liberal Arts & History | 28 | 2.7% |
| Visual & Performing Arts | 36 | 3.5% |
| Communications | 42 | 4.1% |
| Arts & Humanities | 48 | 4.7% |
| Total | 1,031 | 100.0% |
Transportation & Commute in Baiting Hollow
Vehicle Availability by Sex in Baiting Hollow
The most prevalent vehicle ownership categories in Baiting Hollow are males with 3 vehicles (361, accounting for 46.5%) and females with 3 vehicles (196, making up 63.9%).
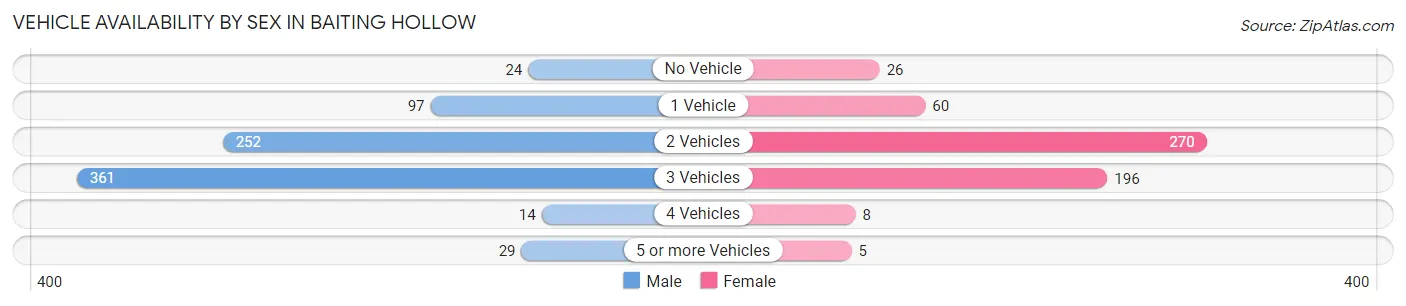
| Vehicles Available | Male | Female |
| No Vehicle | 24 (3.1%) | 26 (4.6%) |
| 1 Vehicle | 97 (12.5%) | 60 (10.6%) |
| 2 Vehicles | 252 (32.4%) | 270 (47.8%) |
| 3 Vehicles | 361 (46.5%) | 196 (34.7%) |
| 4 Vehicles | 14 (1.8%) | 8 (1.4%) |
| 5 or more Vehicles | 29 (3.7%) | 5 (0.9%) |
| Total | 777 (100.0%) | 565 (100.0%) |
Commute Time in Baiting Hollow
The most frequently occuring commute durations in Baiting Hollow are 15 to 19 minutes (246 commuters, 19.0%), 10 to 14 minutes (207 commuters, 16.0%), and 30 to 34 minutes (163 commuters, 12.6%).
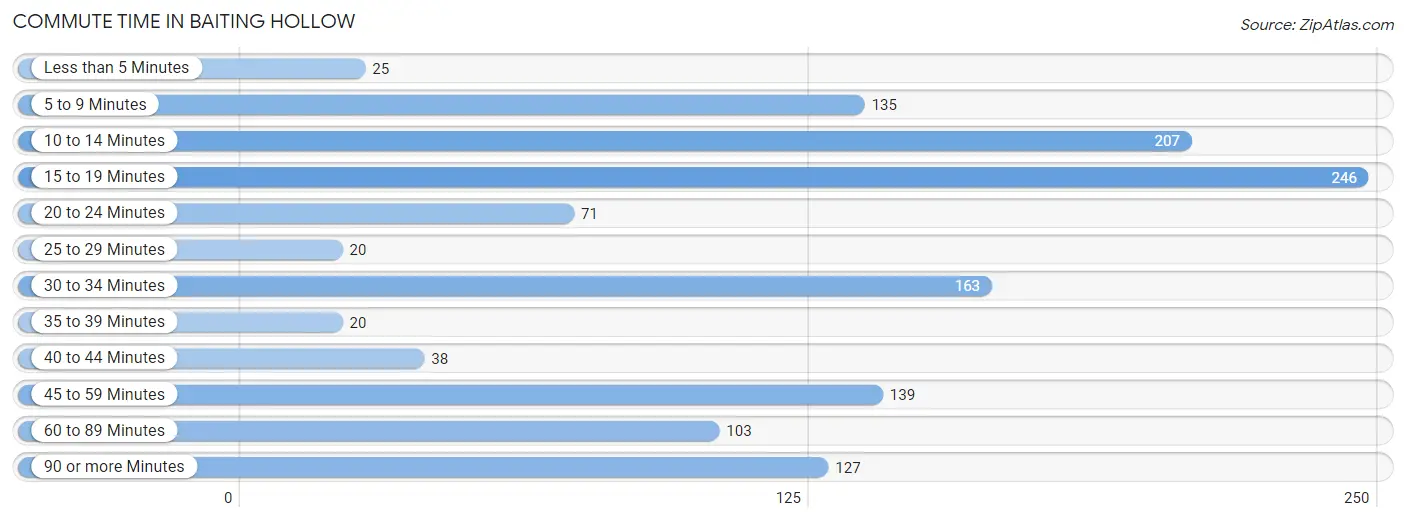
| Commute Time | # Commuters | % Commuters |
| Less than 5 Minutes | 25 | 1.9% |
| 5 to 9 Minutes | 135 | 10.4% |
| 10 to 14 Minutes | 207 | 16.0% |
| 15 to 19 Minutes | 246 | 19.0% |
| 20 to 24 Minutes | 71 | 5.5% |
| 25 to 29 Minutes | 20 | 1.5% |
| 30 to 34 Minutes | 163 | 12.6% |
| 35 to 39 Minutes | 20 | 1.5% |
| 40 to 44 Minutes | 38 | 2.9% |
| 45 to 59 Minutes | 139 | 10.7% |
| 60 to 89 Minutes | 103 | 8.0% |
| 90 or more Minutes | 127 | 9.8% |
Commute Time by Sex in Baiting Hollow
The most common commute times in Baiting Hollow are 10 to 14 minutes (160 commuters, 21.0%) for males and 15 to 19 minutes (145 commuters, 27.3%) for females.
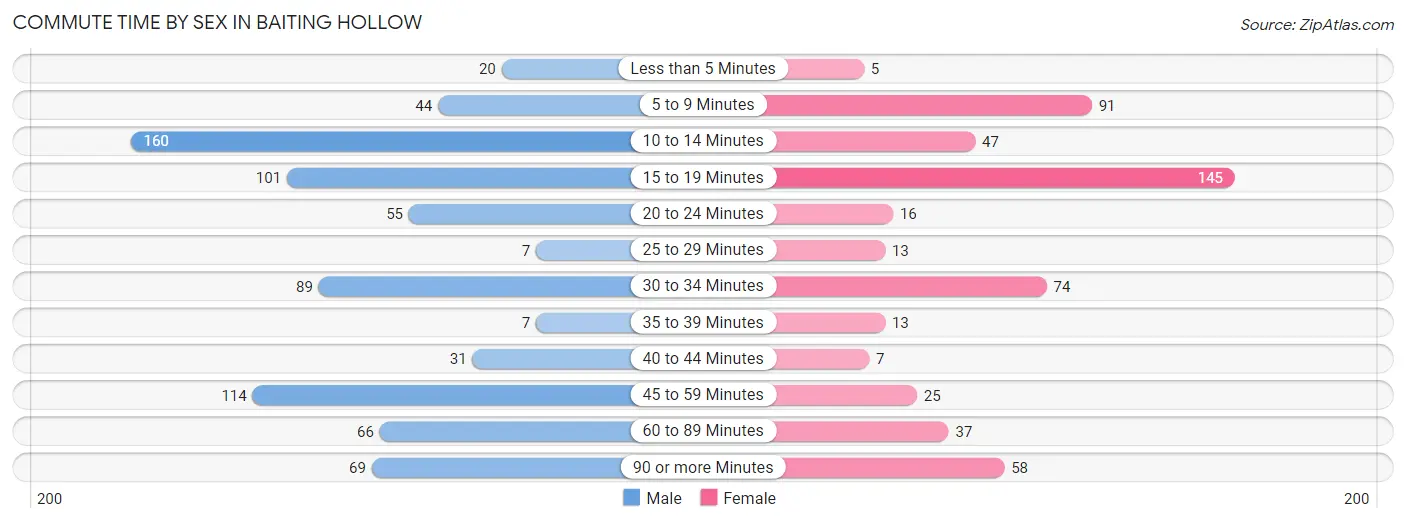
| Commute Time | Male | Female |
| Less than 5 Minutes | 20 (2.6%) | 5 (0.9%) |
| 5 to 9 Minutes | 44 (5.8%) | 91 (17.1%) |
| 10 to 14 Minutes | 160 (21.0%) | 47 (8.8%) |
| 15 to 19 Minutes | 101 (13.2%) | 145 (27.3%) |
| 20 to 24 Minutes | 55 (7.2%) | 16 (3.0%) |
| 25 to 29 Minutes | 7 (0.9%) | 13 (2.5%) |
| 30 to 34 Minutes | 89 (11.7%) | 74 (13.9%) |
| 35 to 39 Minutes | 7 (0.9%) | 13 (2.5%) |
| 40 to 44 Minutes | 31 (4.1%) | 7 (1.3%) |
| 45 to 59 Minutes | 114 (14.9%) | 25 (4.7%) |
| 60 to 89 Minutes | 66 (8.6%) | 37 (7.0%) |
| 90 or more Minutes | 69 (9.0%) | 58 (10.9%) |
Time of Departure to Work by Sex in Baiting Hollow
The most frequent times of departure to work in Baiting Hollow are 6:00 AM to 6:29 AM (136, 17.8%) for males and 8:00 AM to 8:29 AM (80, 15.1%) for females.
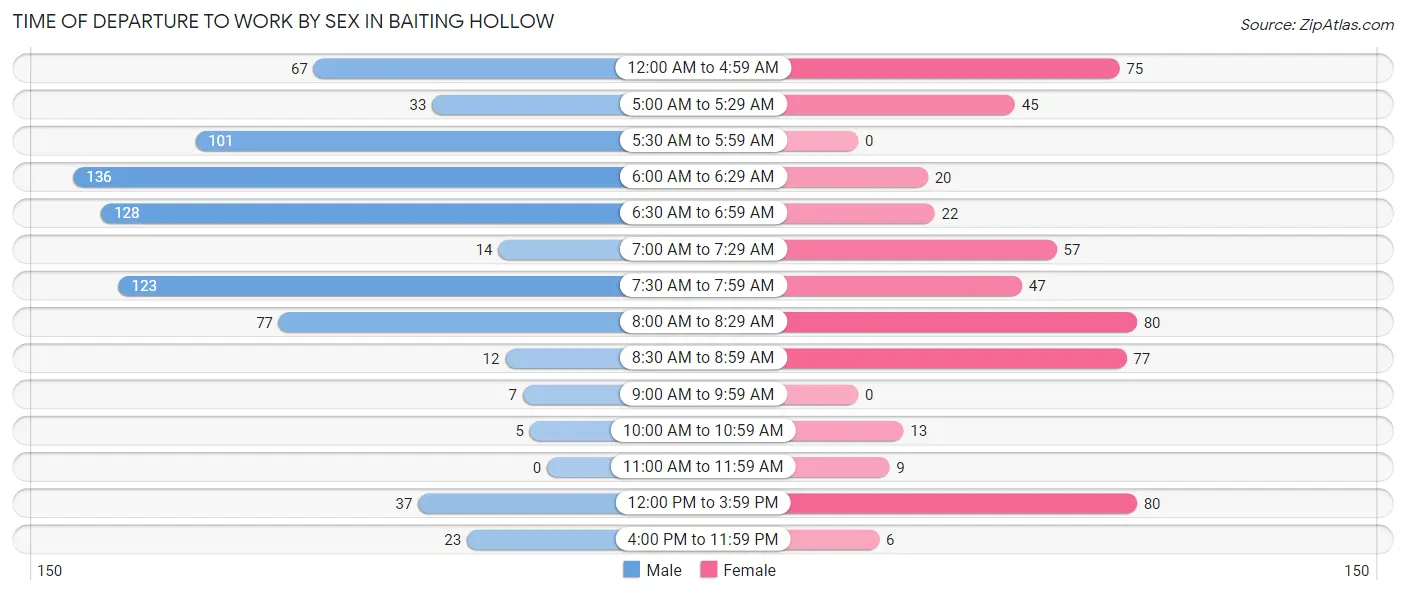
| Time of Departure | Male | Female |
| 12:00 AM to 4:59 AM | 67 (8.8%) | 75 (14.1%) |
| 5:00 AM to 5:29 AM | 33 (4.3%) | 45 (8.5%) |
| 5:30 AM to 5:59 AM | 101 (13.2%) | 0 (0.0%) |
| 6:00 AM to 6:29 AM | 136 (17.8%) | 20 (3.8%) |
| 6:30 AM to 6:59 AM | 128 (16.8%) | 22 (4.1%) |
| 7:00 AM to 7:29 AM | 14 (1.8%) | 57 (10.7%) |
| 7:30 AM to 7:59 AM | 123 (16.1%) | 47 (8.8%) |
| 8:00 AM to 8:29 AM | 77 (10.1%) | 80 (15.1%) |
| 8:30 AM to 8:59 AM | 12 (1.6%) | 77 (14.5%) |
| 9:00 AM to 9:59 AM | 7 (0.9%) | 0 (0.0%) |
| 10:00 AM to 10:59 AM | 5 (0.7%) | 13 (2.5%) |
| 11:00 AM to 11:59 AM | 0 (0.0%) | 9 (1.7%) |
| 12:00 PM to 3:59 PM | 37 (4.9%) | 80 (15.1%) |
| 4:00 PM to 11:59 PM | 23 (3.0%) | 6 (1.1%) |
| Total | 763 (100.0%) | 531 (100.0%) |
Housing Occupancy in Baiting Hollow
Occupancy by Ownership in Baiting Hollow
Of the total 1,172 dwellings in Baiting Hollow, owner-occupied units account for 1,142 (97.4%), while renter-occupied units make up 30 (2.6%).
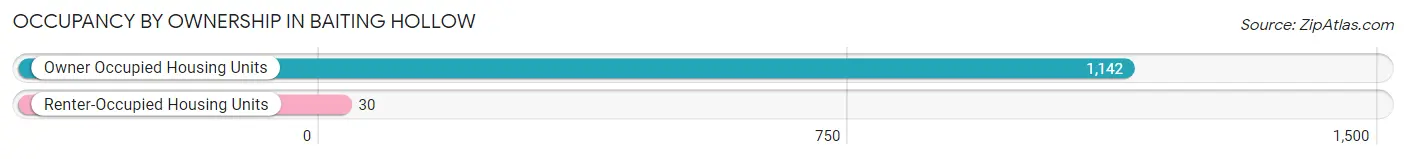
| Occupancy | # Housing Units | % Housing Units |
| Owner Occupied Housing Units | 1,142 | 97.4% |
| Renter-Occupied Housing Units | 30 | 2.6% |
| Total Occupied Housing Units | 1,172 | 100.0% |
Occupancy by Household Size in Baiting Hollow
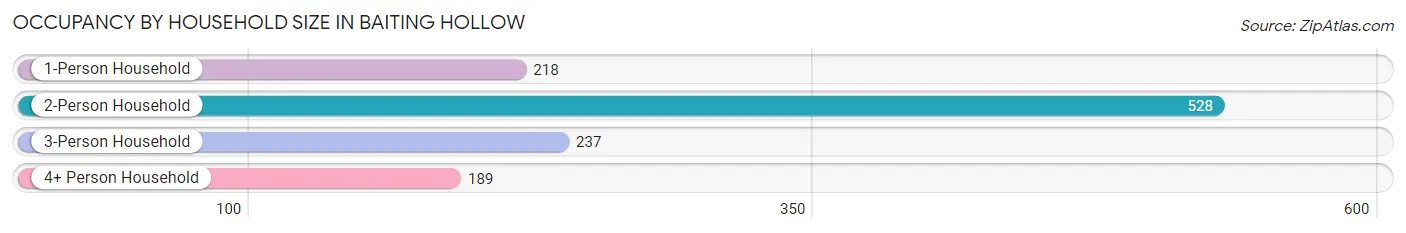
| Household Size | # Housing Units | % Housing Units |
| 1-Person Household | 218 | 18.6% |
| 2-Person Household | 528 | 45.1% |
| 3-Person Household | 237 | 20.2% |
| 4+ Person Household | 189 | 16.1% |
| Total Housing Units | 1,172 | 100.0% |
Occupancy by Ownership by Household Size in Baiting Hollow
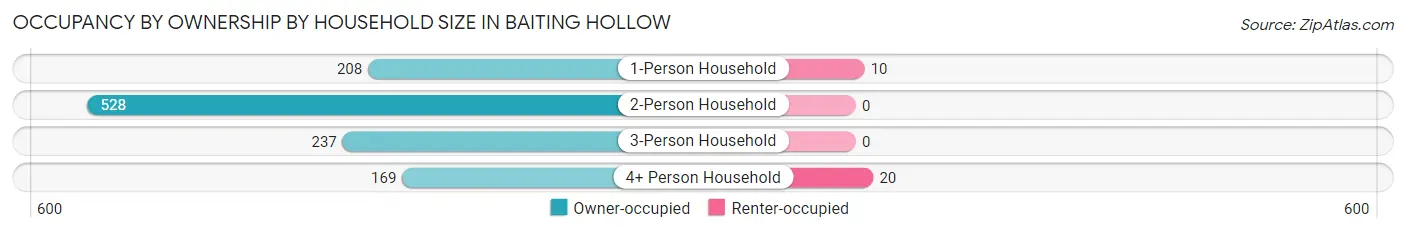
| Household Size | Owner-occupied | Renter-occupied |
| 1-Person Household | 208 (95.4%) | 10 (4.6%) |
| 2-Person Household | 528 (100.0%) | 0 (0.0%) |
| 3-Person Household | 237 (100.0%) | 0 (0.0%) |
| 4+ Person Household | 169 (89.4%) | 20 (10.6%) |
| Total Housing Units | 1,142 (97.4%) | 30 (2.6%) |
Occupancy by Educational Attainment in Baiting Hollow
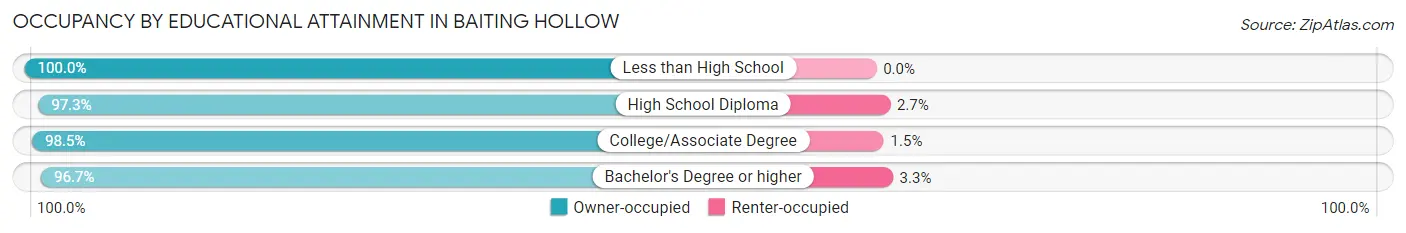
| Household Size | Owner-occupied | Renter-occupied |
| Less than High School | 40 (100.0%) | 0 (0.0%) |
| High School Diploma | 178 (97.3%) | 5 (2.7%) |
| College/Associate Degree | 332 (98.5%) | 5 (1.5%) |
| Bachelor's Degree or higher | 592 (96.7%) | 20 (3.3%) |
Occupancy by Age of Householder in Baiting Hollow
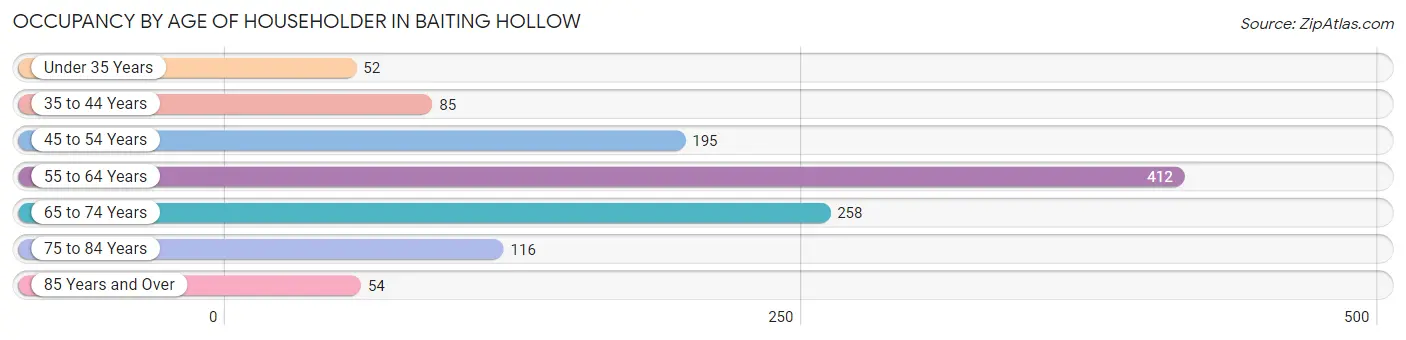
| Age Bracket | # Households | % Households |
| Under 35 Years | 52 | 4.4% |
| 35 to 44 Years | 85 | 7.2% |
| 45 to 54 Years | 195 | 16.6% |
| 55 to 64 Years | 412 | 35.1% |
| 65 to 74 Years | 258 | 22.0% |
| 75 to 84 Years | 116 | 9.9% |
| 85 Years and Over | 54 | 4.6% |
| Total | 1,172 | 100.0% |
Housing Finances in Baiting Hollow
Median Income by Occupancy in Baiting Hollow
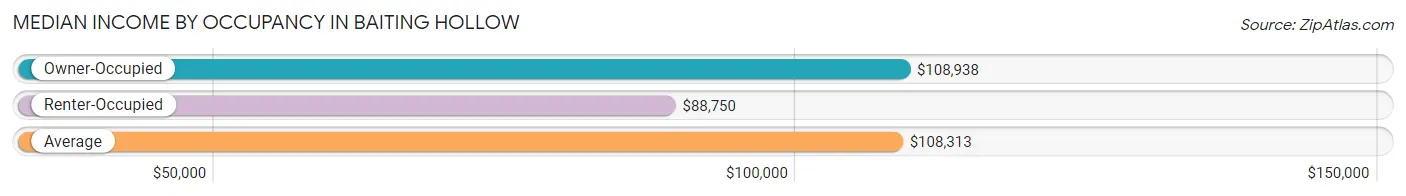
| Occupancy Type | # Households | Median Income |
| Owner-Occupied | 1,142 (97.4%) | $108,938 |
| Renter-Occupied | 30 (2.6%) | $88,750 |
| Average | 1,172 (100.0%) | $108,313 |
Occupancy by Householder Income Bracket in Baiting Hollow
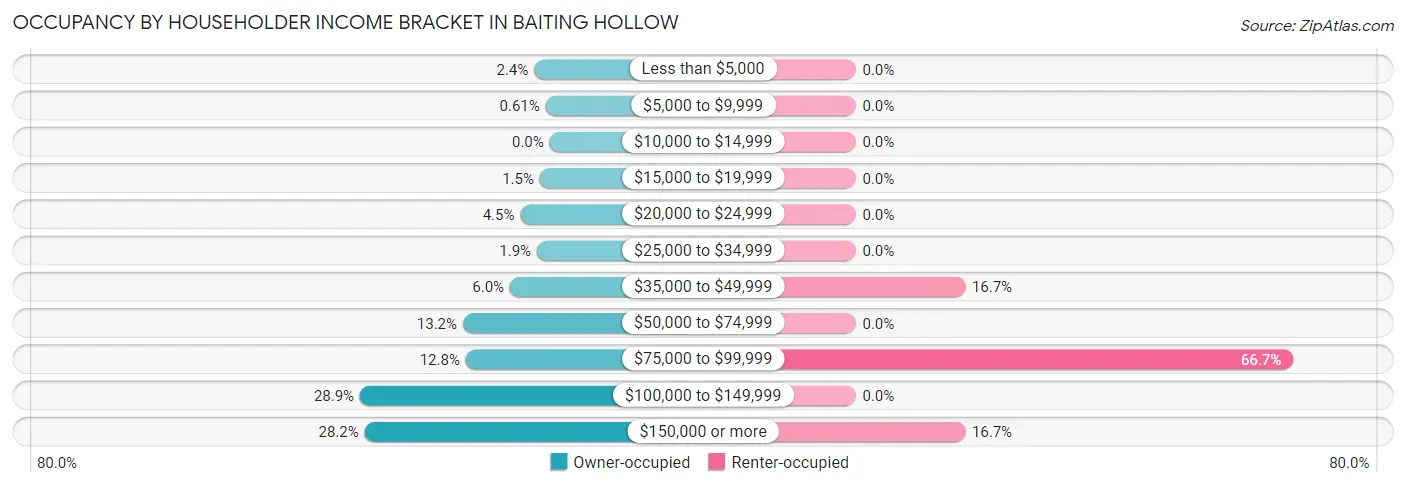
| Income Bracket | Owner-occupied | Renter-occupied |
| Less than $5,000 | 27 (2.4%) | 0 (0.0%) |
| $5,000 to $9,999 | 7 (0.6%) | 0 (0.0%) |
| $10,000 to $14,999 | 0 (0.0%) | 0 (0.0%) |
| $15,000 to $19,999 | 17 (1.5%) | 0 (0.0%) |
| $20,000 to $24,999 | 51 (4.5%) | 0 (0.0%) |
| $25,000 to $34,999 | 22 (1.9%) | 0 (0.0%) |
| $35,000 to $49,999 | 69 (6.0%) | 5 (16.7%) |
| $50,000 to $74,999 | 151 (13.2%) | 0 (0.0%) |
| $75,000 to $99,999 | 146 (12.8%) | 20 (66.7%) |
| $100,000 to $149,999 | 330 (28.9%) | 0 (0.0%) |
| $150,000 or more | 322 (28.2%) | 5 (16.7%) |
| Total | 1,142 (100.0%) | 30 (100.0%) |
Monthly Housing Cost Tiers in Baiting Hollow
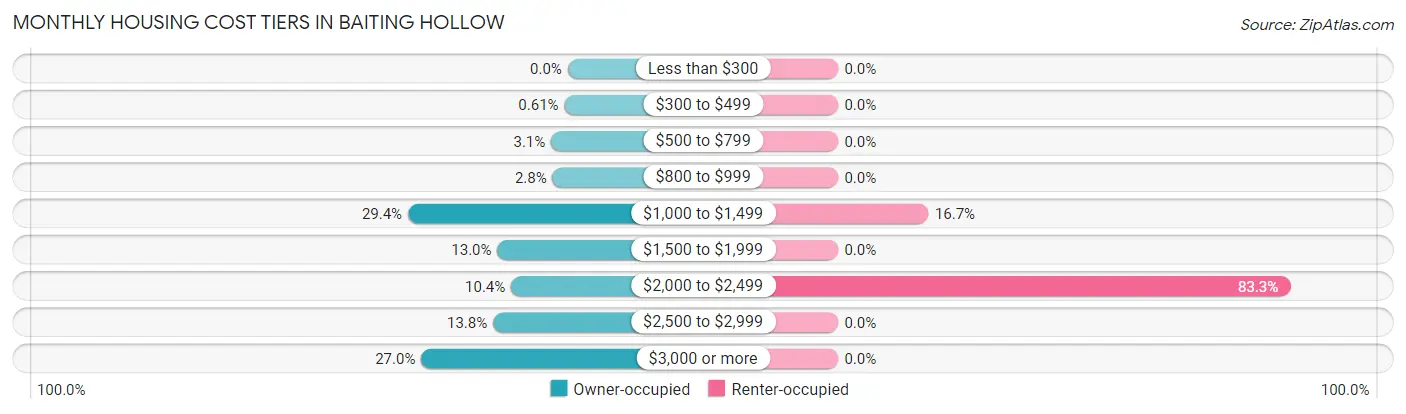
| Monthly Cost | Owner-occupied | Renter-occupied |
| Less than $300 | 0 (0.0%) | 0 (0.0%) |
| $300 to $499 | 7 (0.6%) | 0 (0.0%) |
| $500 to $799 | 35 (3.1%) | 0 (0.0%) |
| $800 to $999 | 32 (2.8%) | 0 (0.0%) |
| $1,000 to $1,499 | 336 (29.4%) | 5 (16.7%) |
| $1,500 to $1,999 | 148 (13.0%) | 0 (0.0%) |
| $2,000 to $2,499 | 119 (10.4%) | 25 (83.3%) |
| $2,500 to $2,999 | 157 (13.8%) | 0 (0.0%) |
| $3,000 or more | 308 (27.0%) | 0 (0.0%) |
| Total | 1,142 (100.0%) | 30 (100.0%) |
Physical Housing Characteristics in Baiting Hollow
Housing Structures in Baiting Hollow
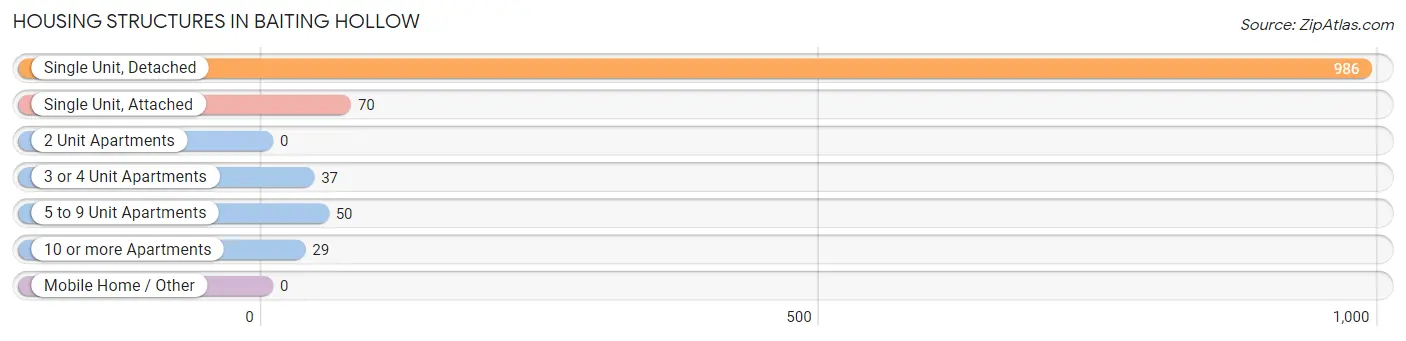
| Structure Type | # Housing Units | % Housing Units |
| Single Unit, Detached | 986 | 84.1% |
| Single Unit, Attached | 70 | 6.0% |
| 2 Unit Apartments | 0 | 0.0% |
| 3 or 4 Unit Apartments | 37 | 3.2% |
| 5 to 9 Unit Apartments | 50 | 4.3% |
| 10 or more Apartments | 29 | 2.5% |
| Mobile Home / Other | 0 | 0.0% |
| Total | 1,172 | 100.0% |
Housing Structures by Occupancy in Baiting Hollow
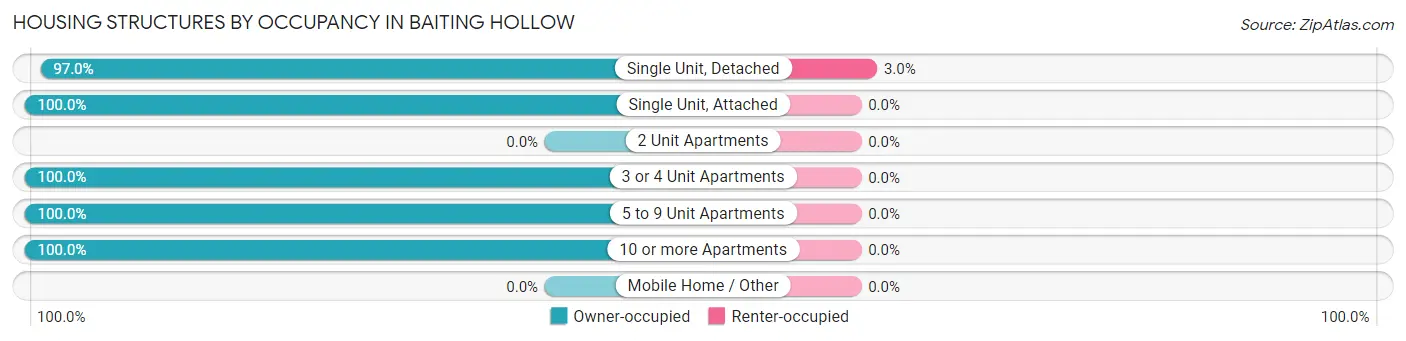
| Structure Type | Owner-occupied | Renter-occupied |
| Single Unit, Detached | 956 (97.0%) | 30 (3.0%) |
| Single Unit, Attached | 70 (100.0%) | 0 (0.0%) |
| 2 Unit Apartments | 0 (0.0%) | 0 (0.0%) |
| 3 or 4 Unit Apartments | 37 (100.0%) | 0 (0.0%) |
| 5 to 9 Unit Apartments | 50 (100.0%) | 0 (0.0%) |
| 10 or more Apartments | 29 (100.0%) | 0 (0.0%) |
| Mobile Home / Other | 0 (0.0%) | 0 (0.0%) |
| Total | 1,142 (97.4%) | 30 (2.6%) |
Housing Structures by Number of Rooms in Baiting Hollow
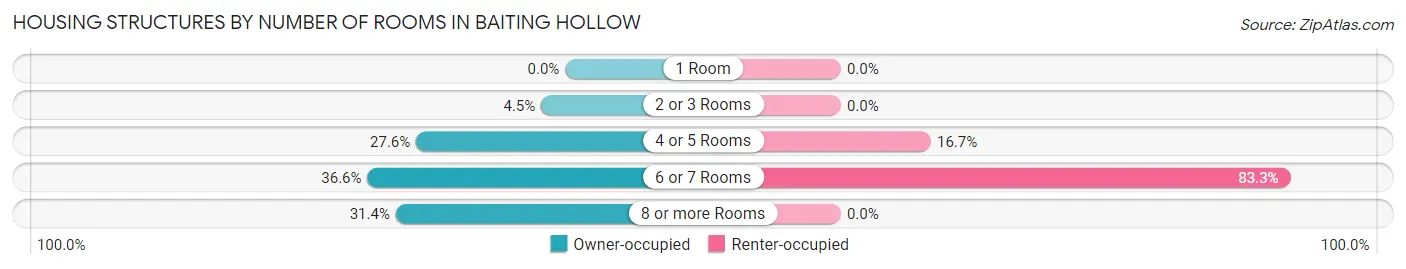
| Number of Rooms | Owner-occupied | Renter-occupied |
| 1 Room | 0 (0.0%) | 0 (0.0%) |
| 2 or 3 Rooms | 51 (4.5%) | 0 (0.0%) |
| 4 or 5 Rooms | 315 (27.6%) | 5 (16.7%) |
| 6 or 7 Rooms | 418 (36.6%) | 25 (83.3%) |
| 8 or more Rooms | 358 (31.4%) | 0 (0.0%) |
| Total | 1,142 (100.0%) | 30 (100.0%) |
Housing Structure by Heating Type in Baiting Hollow
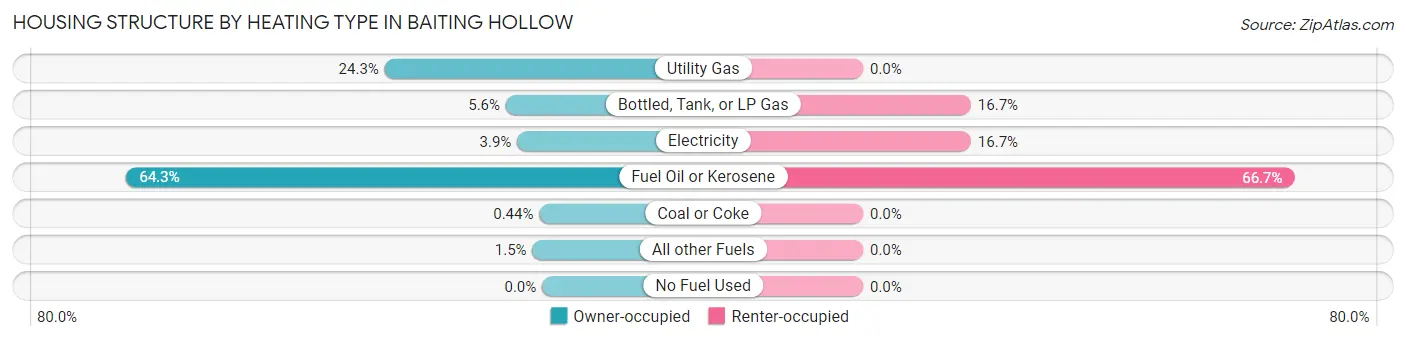
| Heating Type | Owner-occupied | Renter-occupied |
| Utility Gas | 278 (24.3%) | 0 (0.0%) |
| Bottled, Tank, or LP Gas | 64 (5.6%) | 5 (16.7%) |
| Electricity | 44 (3.8%) | 5 (16.7%) |
| Fuel Oil or Kerosene | 734 (64.3%) | 20 (66.7%) |
| Coal or Coke | 5 (0.4%) | 0 (0.0%) |
| All other Fuels | 17 (1.5%) | 0 (0.0%) |
| No Fuel Used | 0 (0.0%) | 0 (0.0%) |
| Total | 1,142 (100.0%) | 30 (100.0%) |
Household Vehicle Usage in Baiting Hollow
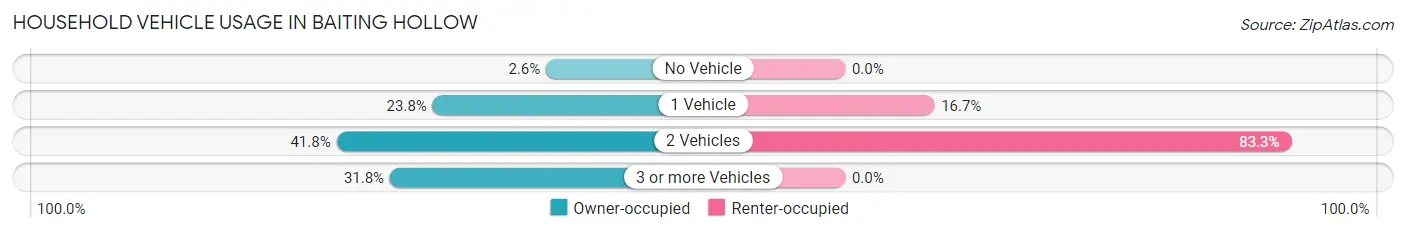
| Vehicles per Household | Owner-occupied | Renter-occupied |
| No Vehicle | 30 (2.6%) | 0 (0.0%) |
| 1 Vehicle | 272 (23.8%) | 5 (16.7%) |
| 2 Vehicles | 477 (41.8%) | 25 (83.3%) |
| 3 or more Vehicles | 363 (31.8%) | 0 (0.0%) |
| Total | 1,142 (100.0%) | 30 (100.0%) |
Real Estate & Mortgages in Baiting Hollow
Real Estate and Mortgage Overview in Baiting Hollow
| Characteristic | Without Mortgage | With Mortgage |
| Housing Units | 576 | 566 |
| Median Property Value | $479,700 | $551,800 |
| Median Household Income | $95,238 | $227 |
| Monthly Housing Costs | $1,353 | $300 |
| Real Estate Taxes | $9,231 | $0 |
Property Value by Mortgage Status in Baiting Hollow
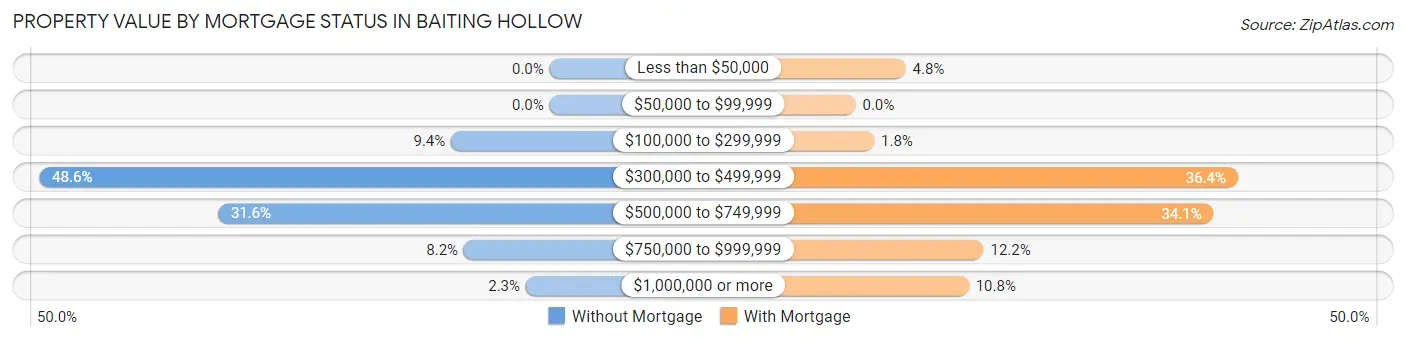
| Property Value | Without Mortgage | With Mortgage |
| Less than $50,000 | 0 (0.0%) | 27 (4.8%) |
| $50,000 to $99,999 | 0 (0.0%) | 0 (0.0%) |
| $100,000 to $299,999 | 54 (9.4%) | 10 (1.8%) |
| $300,000 to $499,999 | 280 (48.6%) | 206 (36.4%) |
| $500,000 to $749,999 | 182 (31.6%) | 193 (34.1%) |
| $750,000 to $999,999 | 47 (8.2%) | 69 (12.2%) |
| $1,000,000 or more | 13 (2.3%) | 61 (10.8%) |
| Total | 576 (100.0%) | 566 (100.0%) |
Household Income by Mortgage Status in Baiting Hollow
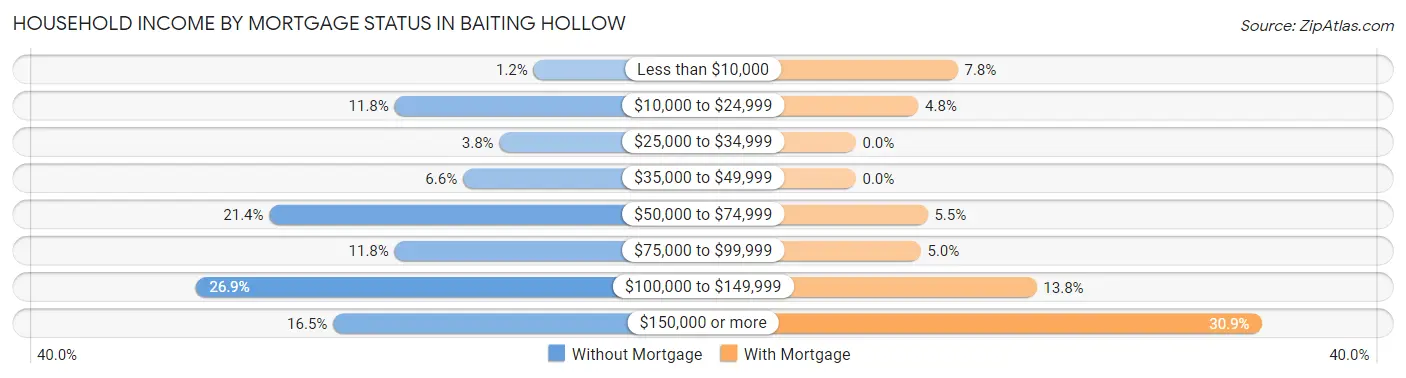
| Household Income | Without Mortgage | With Mortgage |
| Less than $10,000 | 7 (1.2%) | 44 (7.8%) |
| $10,000 to $24,999 | 68 (11.8%) | 27 (4.8%) |
| $25,000 to $34,999 | 22 (3.8%) | 0 (0.0%) |
| $35,000 to $49,999 | 38 (6.6%) | 0 (0.0%) |
| $50,000 to $74,999 | 123 (21.3%) | 31 (5.5%) |
| $75,000 to $99,999 | 68 (11.8%) | 28 (5.0%) |
| $100,000 to $149,999 | 155 (26.9%) | 78 (13.8%) |
| $150,000 or more | 95 (16.5%) | 175 (30.9%) |
| Total | 576 (100.0%) | 566 (100.0%) |
Property Value to Household Income Ratio in Baiting Hollow
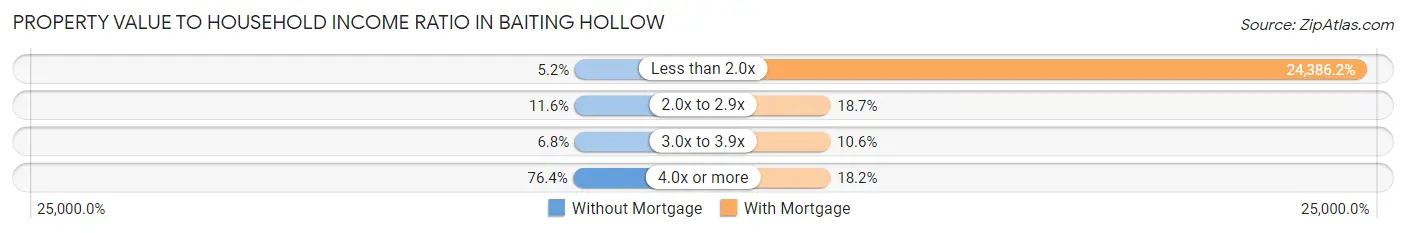
| Value-to-Income Ratio | Without Mortgage | With Mortgage |
| Less than 2.0x | 30 (5.2%) | 138,026 (24,386.2%) |
| 2.0x to 2.9x | 67 (11.6%) | 106 (18.7%) |
| 3.0x to 3.9x | 39 (6.8%) | 60 (10.6%) |
| 4.0x or more | 440 (76.4%) | 103 (18.2%) |
| Total | 576 (100.0%) | 566 (100.0%) |
Real Estate Taxes by Mortgage Status in Baiting Hollow
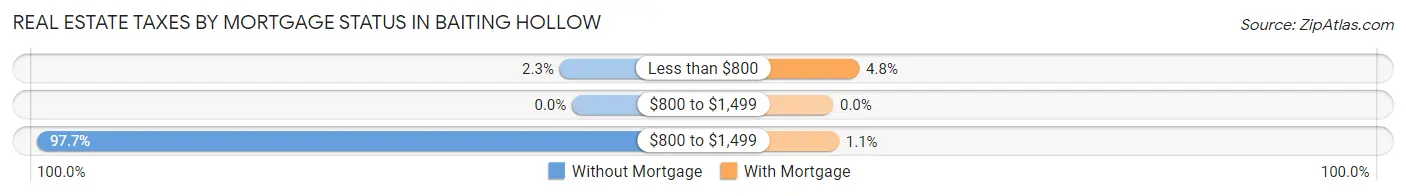
| Property Taxes | Without Mortgage | With Mortgage |
| Less than $800 | 13 (2.3%) | 27 (4.8%) |
| $800 to $1,499 | 0 (0.0%) | 0 (0.0%) |
| $800 to $1,499 | 563 (97.7%) | 6 (1.1%) |
| Total | 576 (100.0%) | 566 (100.0%) |
Health & Disability in Baiting Hollow
Health Insurance Coverage by Age in Baiting Hollow
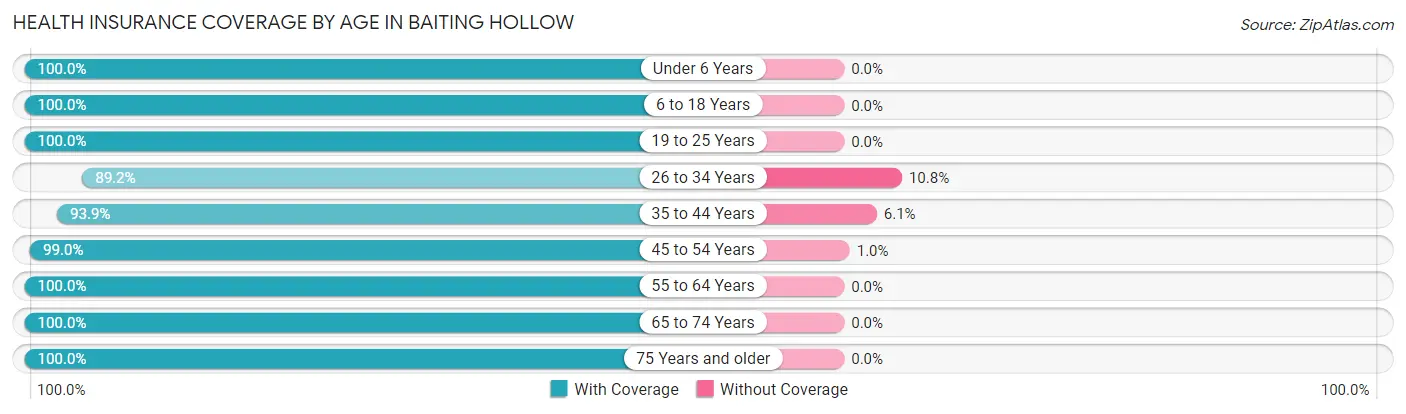
| Age Bracket | With Coverage | Without Coverage |
| Under 6 Years | 160 (100.0%) | 0 (0.0%) |
| 6 to 18 Years | 313 (100.0%) | 0 (0.0%) |
| 19 to 25 Years | 90 (100.0%) | 0 (0.0%) |
| 26 to 34 Years | 199 (89.2%) | 24 (10.8%) |
| 35 to 44 Years | 201 (93.9%) | 13 (6.1%) |
| 45 to 54 Years | 389 (99.0%) | 4 (1.0%) |
| 55 to 64 Years | 780 (100.0%) | 0 (0.0%) |
| 65 to 74 Years | 437 (100.0%) | 0 (0.0%) |
| 75 Years and older | 289 (100.0%) | 0 (0.0%) |
| Total | 2,858 (98.6%) | 41 (1.4%) |
Health Insurance Coverage by Citizenship Status in Baiting Hollow
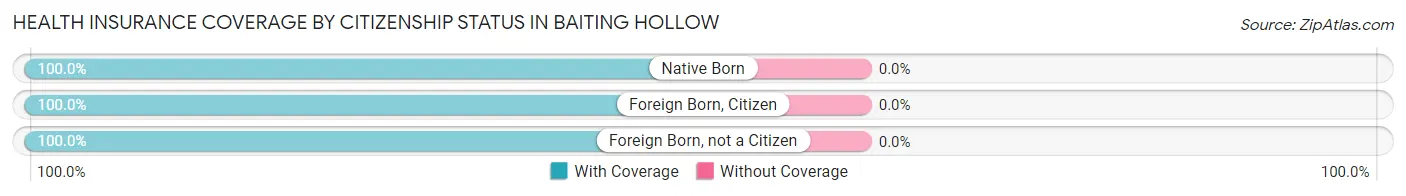
| Citizenship Status | With Coverage | Without Coverage |
| Native Born | 160 (100.0%) | 0 (0.0%) |
| Foreign Born, Citizen | 313 (100.0%) | 0 (0.0%) |
| Foreign Born, not a Citizen | 90 (100.0%) | 0 (0.0%) |
Health Insurance Coverage by Household Income in Baiting Hollow
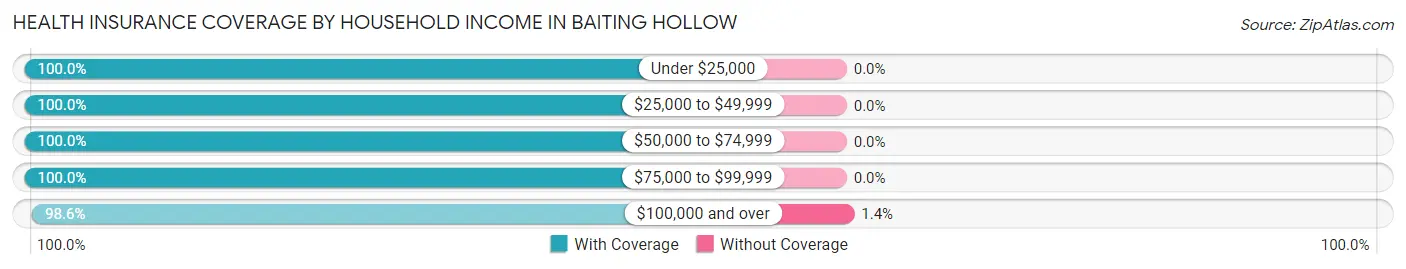
| Household Income | With Coverage | Without Coverage |
| Under $25,000 | 131 (100.0%) | 0 (0.0%) |
| $25,000 to $49,999 | 235 (100.0%) | 0 (0.0%) |
| $50,000 to $74,999 | 356 (100.0%) | 0 (0.0%) |
| $75,000 to $99,999 | 451 (100.0%) | 0 (0.0%) |
| $100,000 and over | 1,666 (98.6%) | 24 (1.4%) |
Public vs Private Health Insurance Coverage by Age in Baiting Hollow
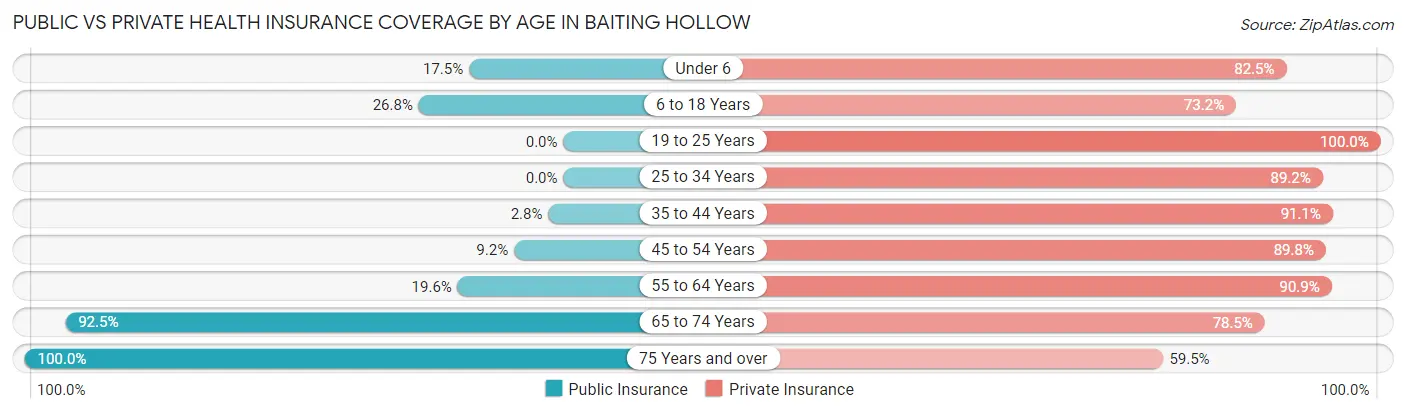
| Age Bracket | Public Insurance | Private Insurance |
| Under 6 | 28 (17.5%) | 132 (82.5%) |
| 6 to 18 Years | 84 (26.8%) | 229 (73.2%) |
| 19 to 25 Years | 0 (0.0%) | 90 (100.0%) |
| 25 to 34 Years | 0 (0.0%) | 199 (89.2%) |
| 35 to 44 Years | 6 (2.8%) | 195 (91.1%) |
| 45 to 54 Years | 36 (9.2%) | 353 (89.8%) |
| 55 to 64 Years | 153 (19.6%) | 709 (90.9%) |
| 65 to 74 Years | 404 (92.4%) | 343 (78.5%) |
| 75 Years and over | 289 (100.0%) | 172 (59.5%) |
| Total | 1,000 (34.5%) | 2,422 (83.6%) |
Disability Status by Sex by Age in Baiting Hollow
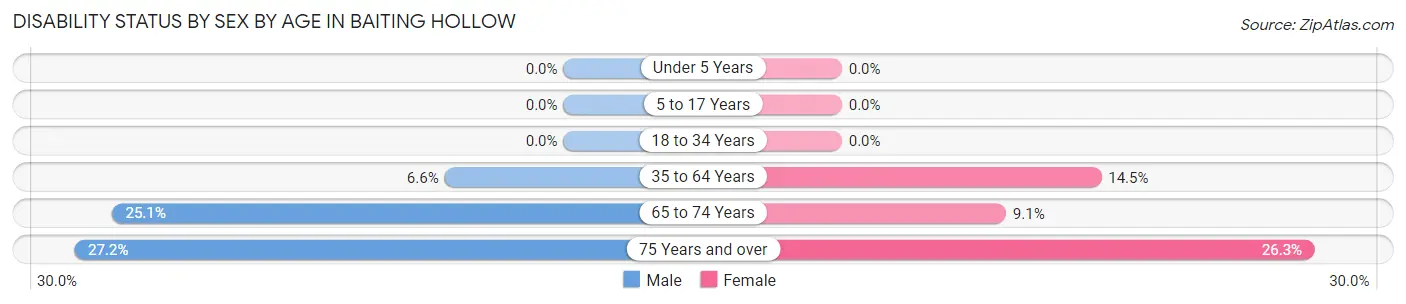
| Age Bracket | Male | Female |
| Under 5 Years | 0 (0.0%) | 0 (0.0%) |
| 5 to 17 Years | 0 (0.0%) | 0 (0.0%) |
| 18 to 34 Years | 0 (0.0%) | 0 (0.0%) |
| 35 to 64 Years | 46 (6.6%) | 100 (14.4%) |
| 65 to 74 Years | 63 (25.1%) | 17 (9.1%) |
| 75 Years and over | 31 (27.2%) | 46 (26.3%) |
Disability Class by Sex by Age in Baiting Hollow
Disability Class: Hearing Difficulty
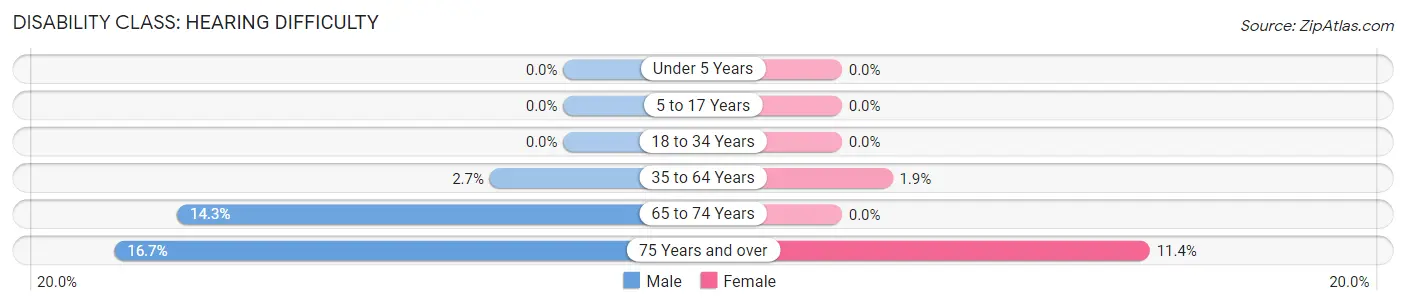
| Age Bracket | Male | Female |
| Under 5 Years | 0 (0.0%) | 0 (0.0%) |
| 5 to 17 Years | 0 (0.0%) | 0 (0.0%) |
| 18 to 34 Years | 0 (0.0%) | 0 (0.0%) |
| 35 to 64 Years | 19 (2.7%) | 13 (1.9%) |
| 65 to 74 Years | 36 (14.3%) | 0 (0.0%) |
| 75 Years and over | 19 (16.7%) | 20 (11.4%) |
Disability Class: Vision Difficulty
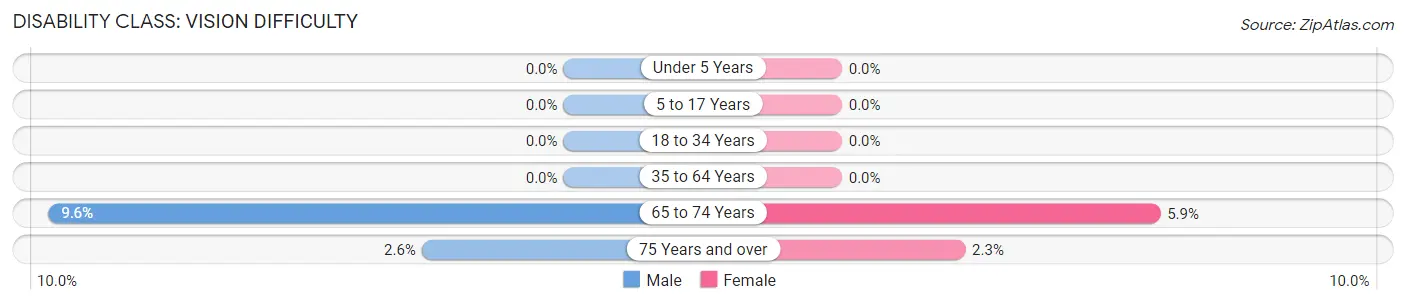
| Age Bracket | Male | Female |
| Under 5 Years | 0 (0.0%) | 0 (0.0%) |
| 5 to 17 Years | 0 (0.0%) | 0 (0.0%) |
| 18 to 34 Years | 0 (0.0%) | 0 (0.0%) |
| 35 to 64 Years | 0 (0.0%) | 0 (0.0%) |
| 65 to 74 Years | 24 (9.6%) | 11 (5.9%) |
| 75 Years and over | 3 (2.6%) | 4 (2.3%) |
Disability Class: Cognitive Difficulty
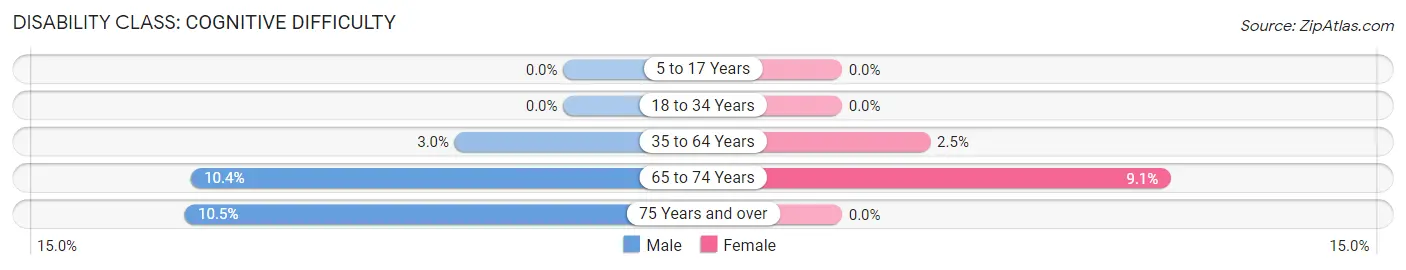
| Age Bracket | Male | Female |
| 5 to 17 Years | 0 (0.0%) | 0 (0.0%) |
| 18 to 34 Years | 0 (0.0%) | 0 (0.0%) |
| 35 to 64 Years | 21 (3.0%) | 17 (2.5%) |
| 65 to 74 Years | 26 (10.4%) | 17 (9.1%) |
| 75 Years and over | 12 (10.5%) | 0 (0.0%) |
Disability Class: Ambulatory Difficulty
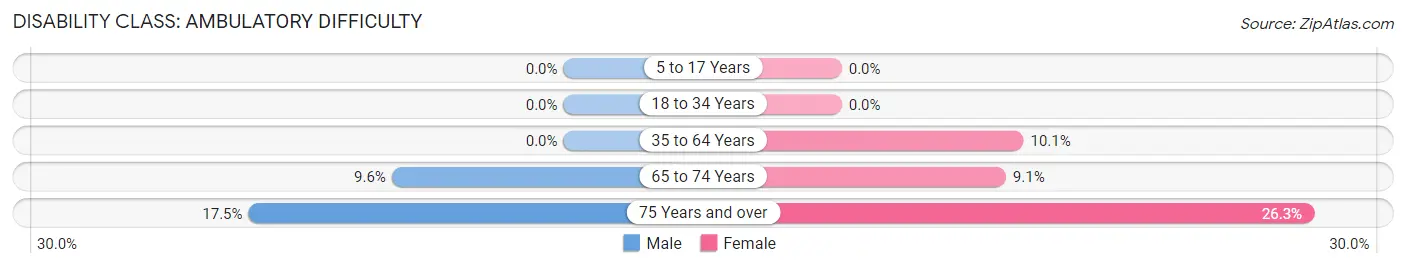
| Age Bracket | Male | Female |
| 5 to 17 Years | 0 (0.0%) | 0 (0.0%) |
| 18 to 34 Years | 0 (0.0%) | 0 (0.0%) |
| 35 to 64 Years | 0 (0.0%) | 70 (10.1%) |
| 65 to 74 Years | 24 (9.6%) | 17 (9.1%) |
| 75 Years and over | 20 (17.5%) | 46 (26.3%) |
Disability Class: Self-Care Difficulty
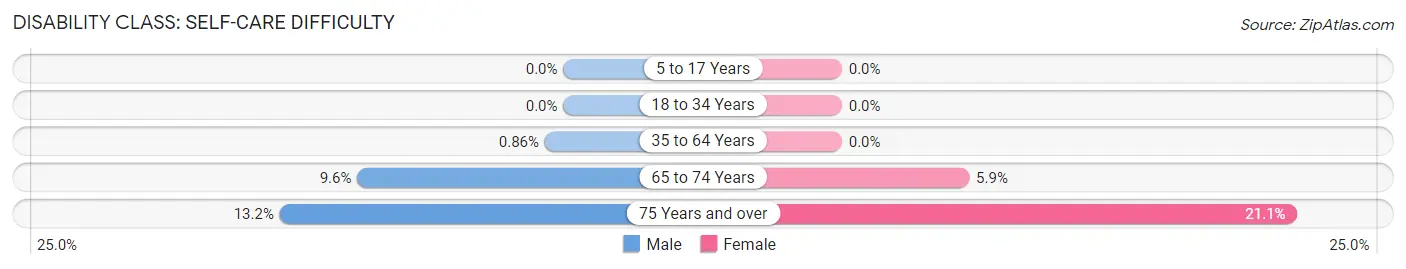
| Age Bracket | Male | Female |
| 5 to 17 Years | 0 (0.0%) | 0 (0.0%) |
| 18 to 34 Years | 0 (0.0%) | 0 (0.0%) |
| 35 to 64 Years | 6 (0.9%) | 0 (0.0%) |
| 65 to 74 Years | 24 (9.6%) | 11 (5.9%) |
| 75 Years and over | 15 (13.2%) | 37 (21.1%) |
Technology Access in Baiting Hollow
Computing Device Access in Baiting Hollow
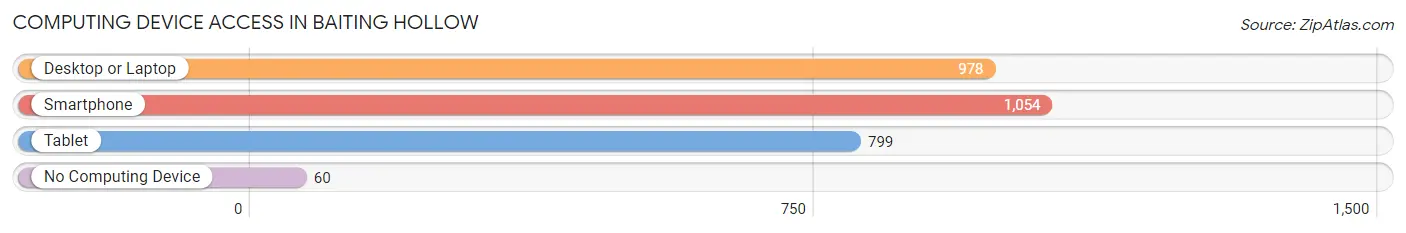
| Device Type | # Households | % Households |
| Desktop or Laptop | 978 | 83.5% |
| Smartphone | 1,054 | 89.9% |
| Tablet | 799 | 68.2% |
| No Computing Device | 60 | 5.1% |
| Total | 1,172 | 100.0% |
Internet Access in Baiting Hollow
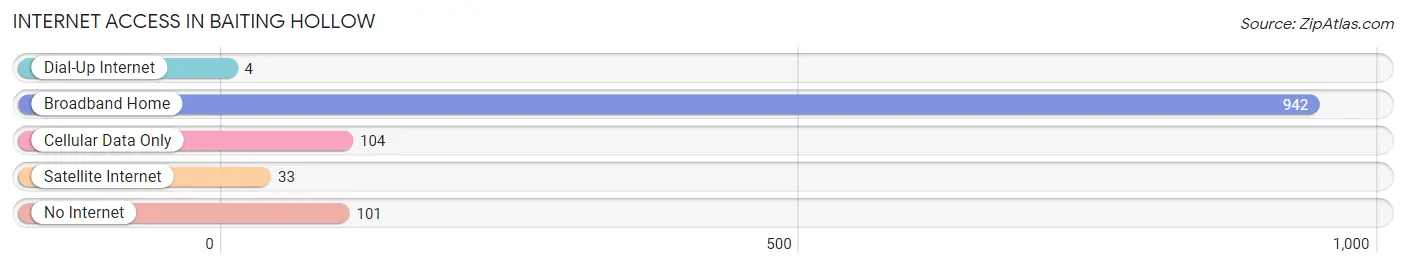
| Internet Type | # Households | % Households |
| Dial-Up Internet | 4 | 0.3% |
| Broadband Home | 942 | 80.4% |
| Cellular Data Only | 104 | 8.9% |
| Satellite Internet | 33 | 2.8% |
| No Internet | 101 | 8.6% |
| Total | 1,172 | 100.0% |
Baiting Hollow Summary
Baiting Hollow is a hamlet located in the Town of Riverhead in Suffolk County, New York. It is situated on the north shore of Long Island, approximately 80 miles east of New York City. The hamlet is bordered by the hamlets of Wading River to the west, Calverton to the north, and Jamesport to the east.
History
The area now known as Baiting Hollow was originally inhabited by the Shinnecock Native American tribe. The first European settlers arrived in the area in the late 1600s, and the hamlet was officially established in 1750. The name “Baiting Hollow” is derived from the practice of baiting horses in the hollows of the area.
In the late 1800s, Baiting Hollow became a popular summer resort destination for wealthy New Yorkers. The area was home to several grand hotels, including the Baiting Hollow Hotel, which was built in 1875 and was one of the largest hotels on Long Island. The hotel was destroyed by fire in 1895, but the area continued to be a popular summer destination until the early 1900s.
In the early 1900s, Baiting Hollow began to transition from a resort destination to a residential community. The area was home to several large farms, and the hamlet was known for its agricultural production. In the 1950s, the area began to experience rapid growth as more people moved to the area.
Geography
Baiting Hollow is located on the north shore of Long Island, approximately 80 miles east of New York City. The hamlet is bordered by the hamlets of Wading River to the west, Calverton to the north, and Jamesport to the east. The hamlet is situated on the Peconic Bay, and is home to several beaches, including the popular Baiting Hollow Beach.
The area is mostly flat, with some rolling hills. The highest point in the hamlet is located at the intersection of Sound Avenue and Baiting Hollow Road, which is approximately 100 feet above sea level. The area is home to several parks, including the Baiting Hollow Nature Preserve, which is located on the banks of the Peconic Bay.
Economy
The economy of Baiting Hollow is largely based on agriculture and tourism. The area is home to several large farms, which produce a variety of crops, including potatoes, corn, and apples. The area is also home to several wineries, which produce a variety of wines.
The hamlet is also a popular tourist destination, and is home to several popular attractions, including the Baiting Hollow Beach, the Baiting Hollow Nature Preserve, and the Long Island Aquarium. The area is also home to several restaurants, shops, and other businesses.
Demographics
As of the 2010 census, the population of Baiting Hollow was 2,845. The population is largely white (90.2%), with small percentages of African American (3.2%), Asian (2.2%), and Hispanic (2.2%) residents. The median household income is $77,857, and the median home value is $346,400.
Conclusion
Baiting Hollow is a hamlet located in the Town of Riverhead in Suffolk County, New York. The area was originally inhabited by the Shinnecock Native American tribe, and was later settled by European settlers in the late 1600s. The hamlet is situated on the north shore of Long Island, and is bordered by the hamlets of Wading River, Calverton, and Jamesport. The economy of Baiting Hollow is largely based on agriculture and tourism, and the population is largely white. The area is home to several popular attractions, including the Baiting Hollow Beach, the Baiting Hollow Nature Preserve, and the Long Island Aquarium.
Common Questions
What is Per Capita Income in Baiting Hollow?
Per Capita income in Baiting Hollow is $53,844.
What is the Median Family Income in Baiting Hollow?
Median Family Income in Baiting Hollow is $112,721.
What is the Median Household income in Baiting Hollow?
Median Household Income in Baiting Hollow is $108,313.
What is Income or Wage Gap in Baiting Hollow?
Income or Wage Gap in Baiting Hollow is 59.9%.
Women in Baiting Hollow earn 40.1 cents for every dollar earned by a man.
What is Inequality or Gini Index in Baiting Hollow?
Inequality or Gini Index in Baiting Hollow is 0.39.
What is the Total Population of Baiting Hollow?
Total Population of Baiting Hollow is 2,899.
What is the Total Male Population of Baiting Hollow?
Total Male Population of Baiting Hollow is 1,437.
What is the Total Female Population of Baiting Hollow?
Total Female Population of Baiting Hollow is 1,462.
What is the Ratio of Males per 100 Females in Baiting Hollow?
There are 98.29 Males per 100 Females in Baiting Hollow.
What is the Ratio of Females per 100 Males in Baiting Hollow?
There are 101.74 Females per 100 Males in Baiting Hollow.
What is the Median Population Age in Baiting Hollow?
Median Population Age in Baiting Hollow is 56.1 Years.
What is the Average Family Size in Baiting Hollow
Average Family Size in Baiting Hollow is 2.8 People.
What is the Average Household Size in Baiting Hollow
Average Household Size in Baiting Hollow is 2.4 People.
How Large is the Labor Force in Baiting Hollow?
There are 1,448 People in the Labor Forcein in Baiting Hollow.
What is the Percentage of People in the Labor Force in Baiting Hollow?
56.9% of People are in the Labor Force in Baiting Hollow.
What is the Unemployment Rate in Baiting Hollow?
Unemployment Rate in Baiting Hollow is 5.0%.