Levittown, NY Map & Demographics
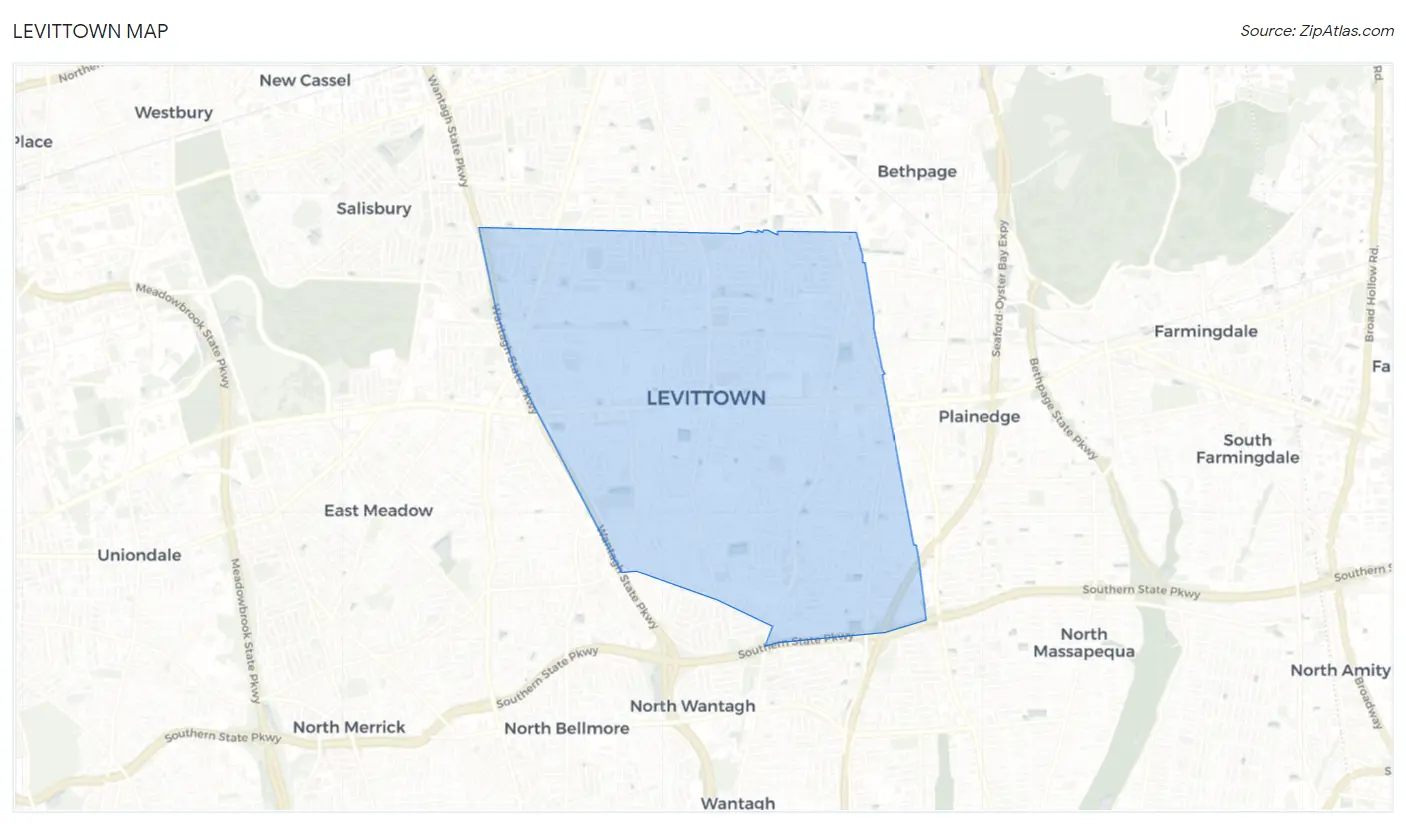
Levittown Map
Levittown Overview
$51,562
PER CAPITA INCOME
$151,189
AVG FAMILY INCOME
$140,559
AVG HOUSEHOLD INCOME
39.8%
WAGE / INCOME GAP [ % ]
60.2¢/ $1
WAGE / INCOME GAP [ $ ]
0.35
INEQUALITY / GINI INDEX
50,804
TOTAL POPULATION
24,559
MALE POPULATION
26,245
FEMALE POPULATION
93.58
MALES / 100 FEMALES
106.87
FEMALES / 100 MALES
42.3
MEDIAN AGE
3.4
AVG FAMILY SIZE
3.0
AVG HOUSEHOLD SIZE
29,844
LABOR FORCE [ PEOPLE ]
70.1%
PERCENT IN LABOR FORCE
5.4%
UNEMPLOYMENT RATE
Levittown Zip Codes
Levittown Area Codes
Income in Levittown
Income Overview in Levittown
Per Capita Income in Levittown is $51,562, while median incomes of families and households are $151,189 and $140,559 respectively.
| Characteristic | Number | Measure |
| Per Capita Income | 50,804 | $51,562 |
| Median Family Income | 13,759 | $151,189 |
| Mean Family Income | 13,759 | $166,338 |
| Median Household Income | 16,833 | $140,559 |
| Mean Household Income | 16,833 | $153,288 |
| Income Deficit | 13,759 | $0 |
| Wage / Income Gap (%) | 50,804 | 39.84% |
| Wage / Income Gap ($) | 50,804 | 60.16¢ per $1 |
| Gini / Inequality Index | 50,804 | 0.35 |
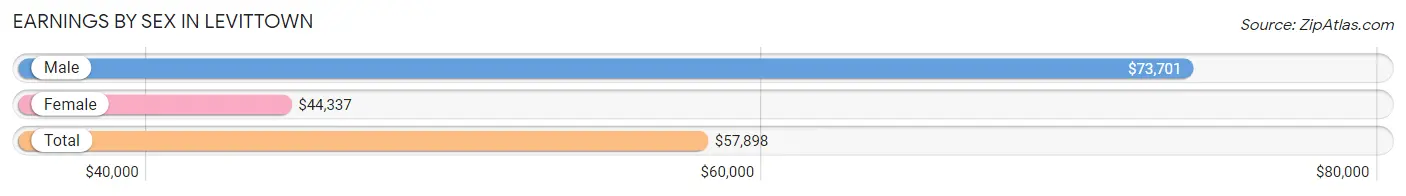
Earnings by Sex in Levittown
Average Earnings in Levittown are $57,898, $73,701 for men and $44,337 for women, a difference of 39.8%.
| Sex | Number | Average Earnings |
| Male | 15,053 (50.1%) | $73,701 |
| Female | 14,966 (49.9%) | $44,337 |
| Total | 30,019 (100.0%) | $57,898 |
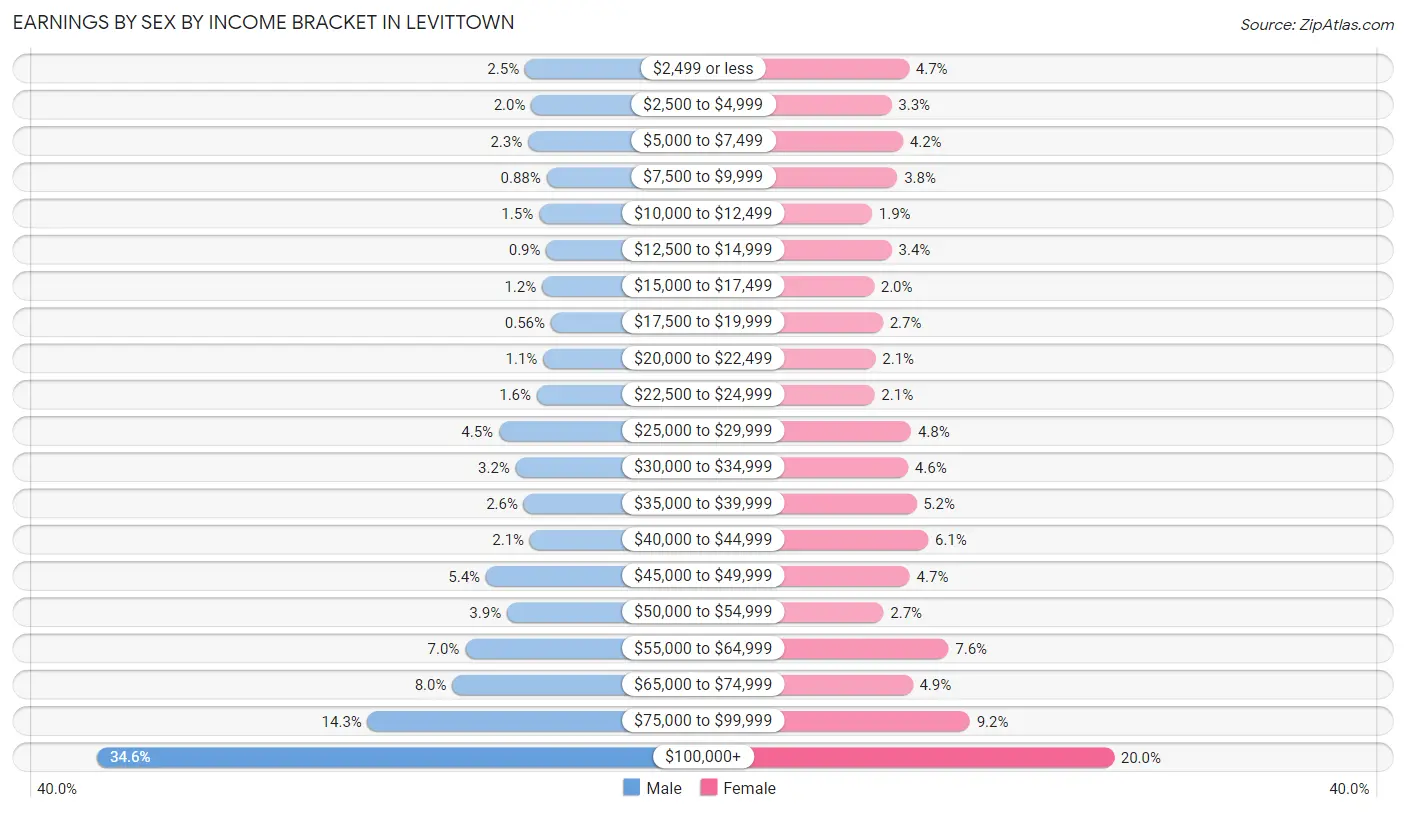
Earnings by Sex by Income Bracket in Levittown
The most common earnings brackets in Levittown are $100,000+ for men (5,202 | 34.6%) and $100,000+ for women (2,995 | 20.0%).
| Income | Male | Female |
| $2,499 or less | 376 (2.5%) | 696 (4.6%) |
| $2,500 to $4,999 | 306 (2.0%) | 500 (3.3%) |
| $5,000 to $7,499 | 342 (2.3%) | 628 (4.2%) |
| $7,500 to $9,999 | 133 (0.9%) | 565 (3.8%) |
| $10,000 to $12,499 | 219 (1.5%) | 281 (1.9%) |
| $12,500 to $14,999 | 136 (0.9%) | 503 (3.4%) |
| $15,000 to $17,499 | 183 (1.2%) | 303 (2.0%) |
| $17,500 to $19,999 | 84 (0.6%) | 402 (2.7%) |
| $20,000 to $22,499 | 172 (1.1%) | 320 (2.1%) |
| $22,500 to $24,999 | 242 (1.6%) | 310 (2.1%) |
| $25,000 to $29,999 | 670 (4.4%) | 720 (4.8%) |
| $30,000 to $34,999 | 482 (3.2%) | 685 (4.6%) |
| $35,000 to $39,999 | 390 (2.6%) | 778 (5.2%) |
| $40,000 to $44,999 | 320 (2.1%) | 911 (6.1%) |
| $45,000 to $49,999 | 818 (5.4%) | 705 (4.7%) |
| $50,000 to $54,999 | 580 (3.8%) | 410 (2.7%) |
| $55,000 to $64,999 | 1,050 (7.0%) | 1,139 (7.6%) |
| $65,000 to $74,999 | 1,197 (8.0%) | 736 (4.9%) |
| $75,000 to $99,999 | 2,151 (14.3%) | 1,379 (9.2%) |
| $100,000+ | 5,202 (34.6%) | 2,995 (20.0%) |
| Total | 15,053 (100.0%) | 14,966 (100.0%) |
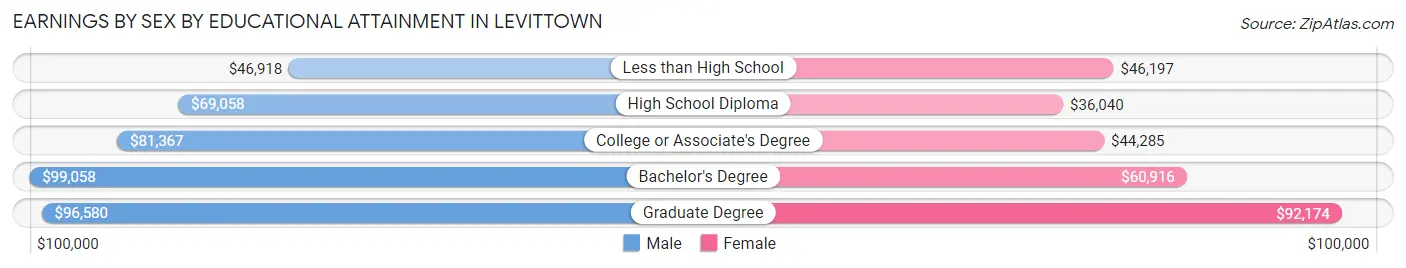
Earnings by Sex by Educational Attainment in Levittown
Average earnings in Levittown are $83,248 for men and $51,123 for women, a difference of 38.6%. Men with an educational attainment of bachelor's degree enjoy the highest average annual earnings of $99,058, while those with less than high school education earn the least with $46,918. Women with an educational attainment of graduate degree earn the most with the average annual earnings of $92,174, while those with high school diploma education have the smallest earnings of $36,040.
| Educational Attainment | Male Income | Female Income |
| Less than High School | $46,918 | $46,197 |
| High School Diploma | $69,058 | $36,040 |
| College or Associate's Degree | $81,367 | $44,285 |
| Bachelor's Degree | $99,058 | $60,916 |
| Graduate Degree | $96,580 | $92,174 |
| Total | $83,248 | $51,123 |
Family Income in Levittown
Family Income Brackets in Levittown
According to the Levittown family income data, there are 4,086 families falling into the $200,000+ income range, which is the most common income bracket and makes up 29.7% of all families. Conversely, the $10,000 to $14,999 income bracket is the least frequent group with only 41 families (0.3%) belonging to this category.
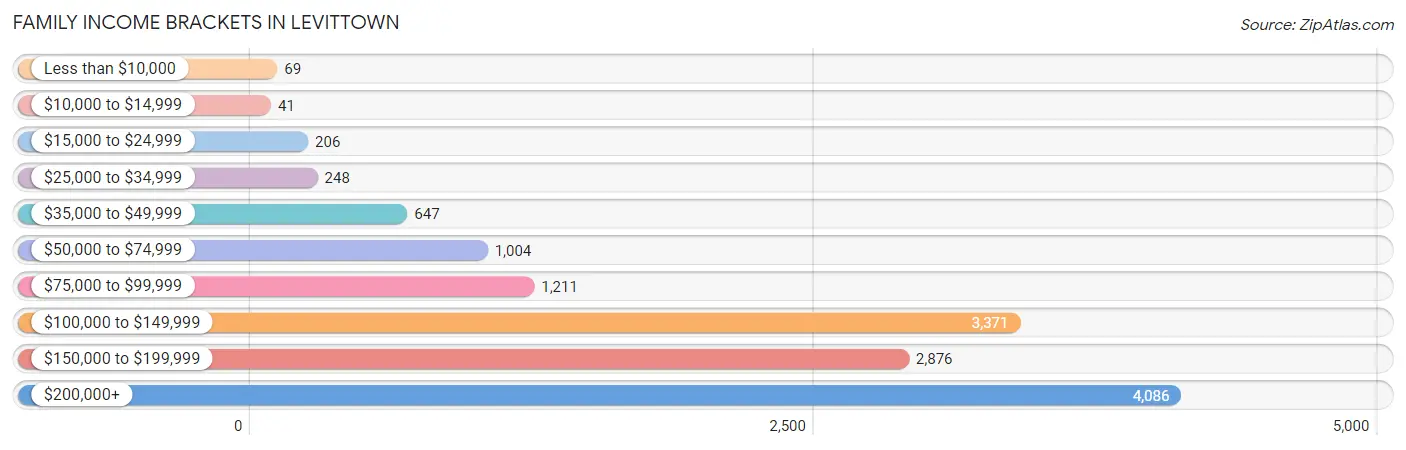
| Income Bracket | # Families | % Families |
| Less than $10,000 | 69 | 0.5% |
| $10,000 to $14,999 | 41 | 0.3% |
| $15,000 to $24,999 | 206 | 1.5% |
| $25,000 to $34,999 | 248 | 1.8% |
| $35,000 to $49,999 | 647 | 4.7% |
| $50,000 to $74,999 | 1,004 | 7.3% |
| $75,000 to $99,999 | 1,211 | 8.8% |
| $100,000 to $149,999 | 3,371 | 24.5% |
| $150,000 to $199,999 | 2,876 | 20.9% |
| $200,000+ | 4,086 | 29.7% |
Family Income by Famaliy Size in Levittown
7+ person families (193 | 1.4%) account for the highest median family income in Levittown with $204,934 per family, while 2-person families (4,933 | 35.8%) have the highest median income of $56,822 per family member.
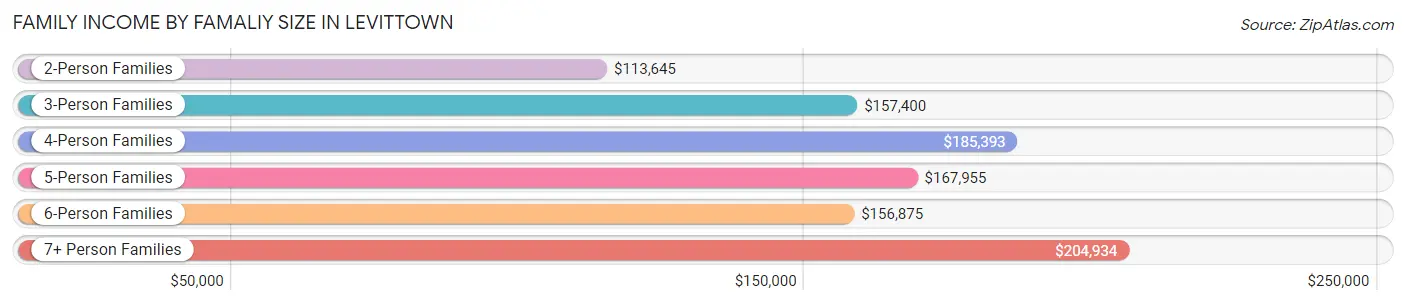
| Income Bracket | # Families | Median Income |
| 2-Person Families | 4,933 (35.8%) | $113,645 |
| 3-Person Families | 3,504 (25.5%) | $157,400 |
| 4-Person Families | 3,193 (23.2%) | $185,393 |
| 5-Person Families | 1,340 (9.7%) | $167,955 |
| 6-Person Families | 596 (4.3%) | $156,875 |
| 7+ Person Families | 193 (1.4%) | $204,934 |
| Total | 13,759 (100.0%) | $151,189 |
Family Income by Number of Earners in Levittown
The median family income in Levittown is $151,189, with families comprising 3+ earners (3,249) having the highest median family income of $219,732, while families with no earners (1,575) have the lowest median family income of $72,225, accounting for 23.6% and 11.5% of families, respectively.
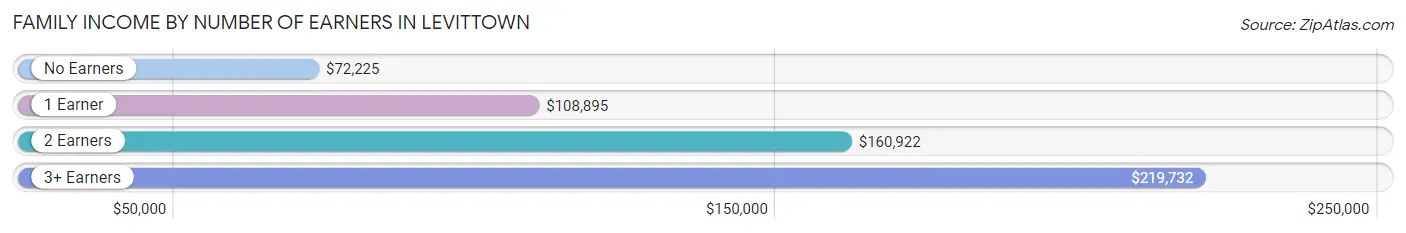
| Number of Earners | # Families | Median Income |
| No Earners | 1,575 (11.5%) | $72,225 |
| 1 Earner | 2,760 (20.1%) | $108,895 |
| 2 Earners | 6,175 (44.9%) | $160,922 |
| 3+ Earners | 3,249 (23.6%) | $219,732 |
| Total | 13,759 (100.0%) | $151,189 |
Household Income in Levittown
Household Income Brackets in Levittown
With 4,393 households falling in the category, the $200,000+ income range is the most frequent in Levittown, accounting for 26.1% of all households. In contrast, only 67 households (0.4%) fall into the $10,000 to $14,999 income bracket, making it the least populous group.
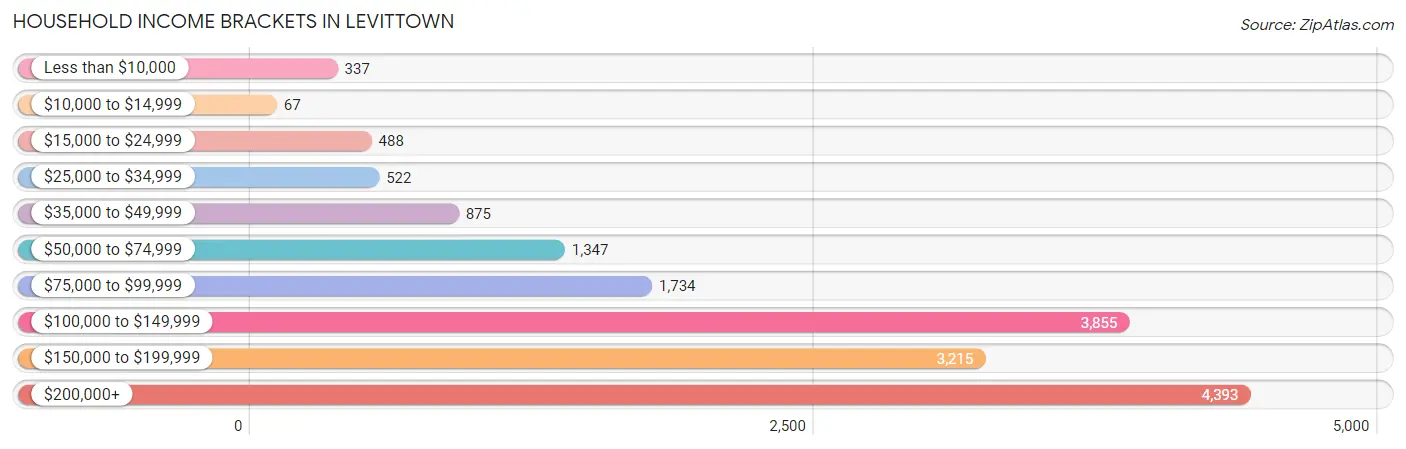
| Income Bracket | # Households | % Households |
| Less than $10,000 | 337 | 2.0% |
| $10,000 to $14,999 | 67 | 0.4% |
| $15,000 to $24,999 | 488 | 2.9% |
| $25,000 to $34,999 | 522 | 3.1% |
| $35,000 to $49,999 | 875 | 5.2% |
| $50,000 to $74,999 | 1,347 | 8.0% |
| $75,000 to $99,999 | 1,734 | 10.3% |
| $100,000 to $149,999 | 3,855 | 22.9% |
| $150,000 to $199,999 | 3,215 | 19.1% |
| $200,000+ | 4,393 | 26.1% |
Household Income by Householder Age in Levittown
The median household income in Levittown is $140,559, with the highest median household income of $157,019 found in the 45 to 64 years age bracket for the primary householder. A total of 7,831 households (46.5%) fall into this category. Meanwhile, the 65+ years age bracket for the primary householder has the lowest median household income of $89,167, with 4,844 households (28.8%) in this group.
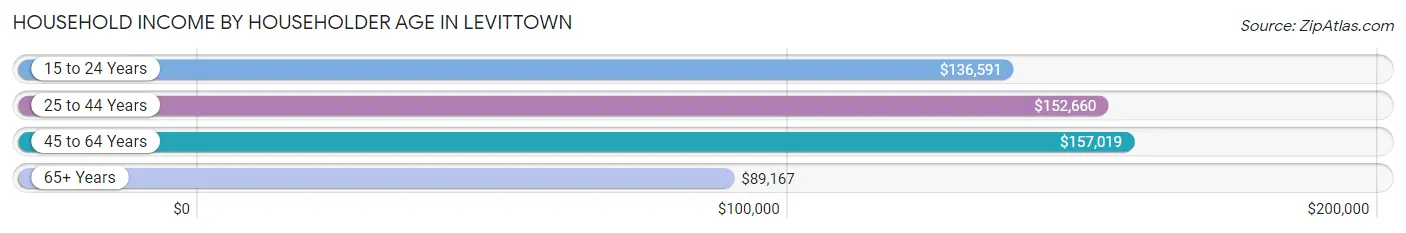
| Income Bracket | # Households | Median Income |
| 15 to 24 Years | 46 (0.3%) | $136,591 |
| 25 to 44 Years | 4,112 (24.4%) | $152,660 |
| 45 to 64 Years | 7,831 (46.5%) | $157,019 |
| 65+ Years | 4,844 (28.8%) | $89,167 |
| Total | 16,833 (100.0%) | $140,559 |
Poverty in Levittown
Income Below Poverty by Sex and Age in Levittown
With 2.7% poverty level for males and 4.4% for females among the residents of Levittown, 18 to 24 year old males and 75 year old and over females are the most vulnerable to poverty, with 185 males (7.2%) and 158 females (8.4%) in their respective age groups living below the poverty level.
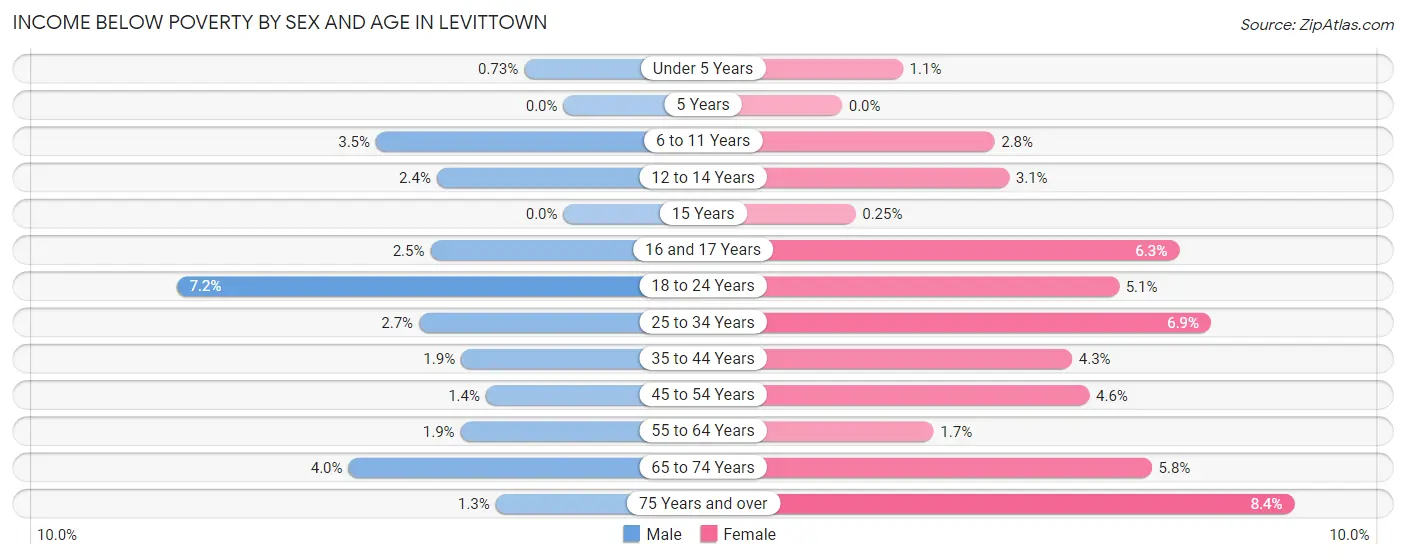
| Age Bracket | Male | Female |
| Under 5 Years | 10 (0.7%) | 14 (1.1%) |
| 5 Years | 0 (0.0%) | 0 (0.0%) |
| 6 to 11 Years | 51 (3.5%) | 41 (2.8%) |
| 12 to 14 Years | 16 (2.4%) | 23 (3.1%) |
| 15 Years | 0 (0.0%) | 1 (0.3%) |
| 16 and 17 Years | 12 (2.5%) | 34 (6.3%) |
| 18 to 24 Years | 185 (7.2%) | 128 (5.1%) |
| 25 to 34 Years | 85 (2.7%) | 210 (6.9%) |
| 35 to 44 Years | 60 (1.9%) | 133 (4.3%) |
| 45 to 54 Years | 47 (1.4%) | 165 (4.6%) |
| 55 to 64 Years | 82 (1.9%) | 75 (1.7%) |
| 65 to 74 Years | 91 (4.0%) | 171 (5.8%) |
| 75 Years and over | 16 (1.3%) | 158 (8.4%) |
| Total | 655 (2.7%) | 1,153 (4.4%) |
Income Above Poverty by Sex and Age in Levittown
According to the poverty statistics in Levittown, males aged 5 years and females aged 5 years are the age groups that are most secure financially, with 100.0% of males and 100.0% of females in these age groups living above the poverty line.
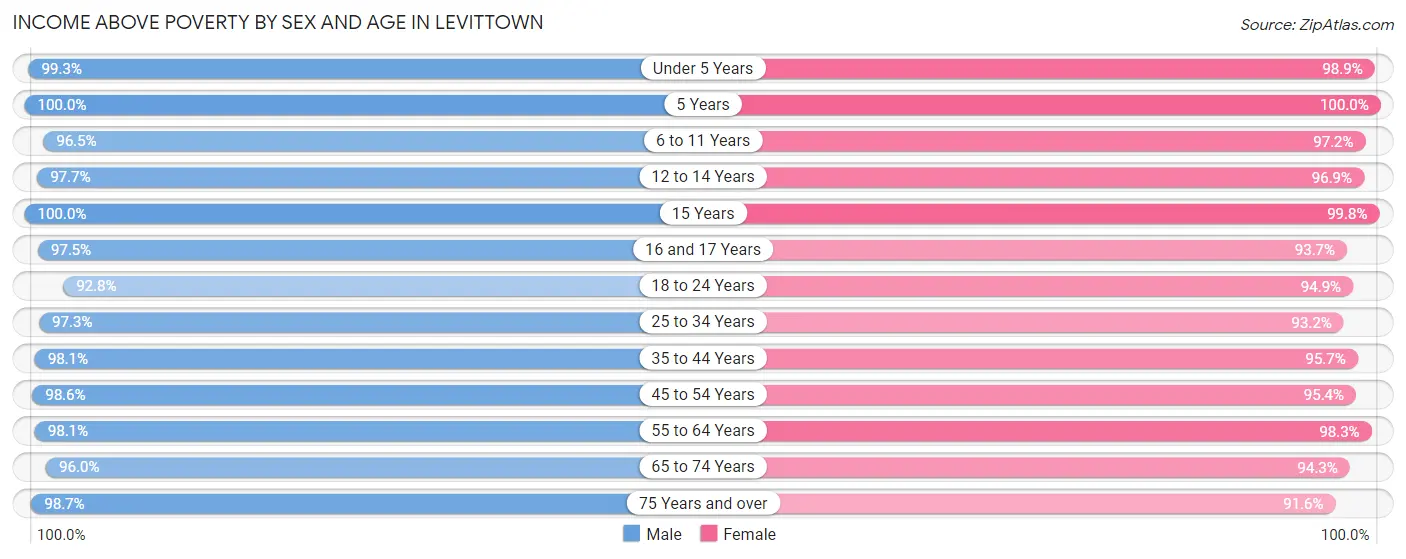
| Age Bracket | Male | Female |
| Under 5 Years | 1,357 (99.3%) | 1,221 (98.9%) |
| 5 Years | 113 (100.0%) | 282 (100.0%) |
| 6 to 11 Years | 1,414 (96.5%) | 1,408 (97.2%) |
| 12 to 14 Years | 665 (97.7%) | 718 (96.9%) |
| 15 Years | 374 (100.0%) | 404 (99.8%) |
| 16 and 17 Years | 473 (97.5%) | 509 (93.7%) |
| 18 to 24 Years | 2,390 (92.8%) | 2,361 (94.9%) |
| 25 to 34 Years | 3,086 (97.3%) | 2,856 (93.1%) |
| 35 to 44 Years | 3,090 (98.1%) | 2,980 (95.7%) |
| 45 to 54 Years | 3,225 (98.6%) | 3,433 (95.4%) |
| 55 to 64 Years | 4,210 (98.1%) | 4,341 (98.3%) |
| 65 to 74 Years | 2,192 (96.0%) | 2,801 (94.3%) |
| 75 Years and over | 1,253 (98.7%) | 1,722 (91.6%) |
| Total | 23,842 (97.3%) | 25,036 (95.6%) |
Income Below Poverty Among Married-Couple Families in Levittown
The poverty statistics for married-couple families in Levittown show that 1.5% or 173 of the total 11,190 families live below the poverty line. Families with 1 or 2 children have the highest poverty rate of 3.4%, comprising of 128 families. On the other hand, families with 3 or 4 children have the lowest poverty rate of 0.0%, which includes 0 families.
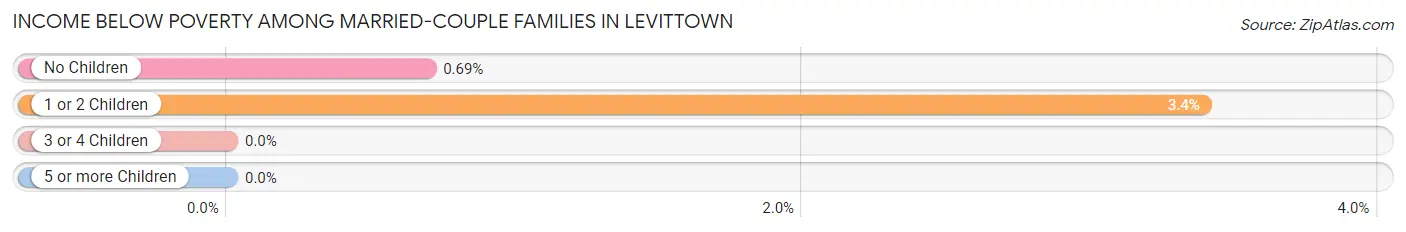
| Children | Above Poverty | Below Poverty |
| No Children | 6,522 (99.3%) | 45 (0.7%) |
| 1 or 2 Children | 3,653 (96.6%) | 128 (3.4%) |
| 3 or 4 Children | 830 (100.0%) | 0 (0.0%) |
| 5 or more Children | 12 (100.0%) | 0 (0.0%) |
| Total | 11,017 (98.5%) | 173 (1.5%) |
Income Below Poverty Among Single-Parent Households in Levittown
According to the poverty data in Levittown, 1.7% or 12 single-father households and 4.2% or 78 single-mother households are living below the poverty line. Among single-father households, those with no children have the highest poverty rate, with 12 households (2.5%) experiencing poverty. Likewise, among single-mother households, those with no children have the highest poverty rate, with 78 households (5.6%) falling below the poverty line.
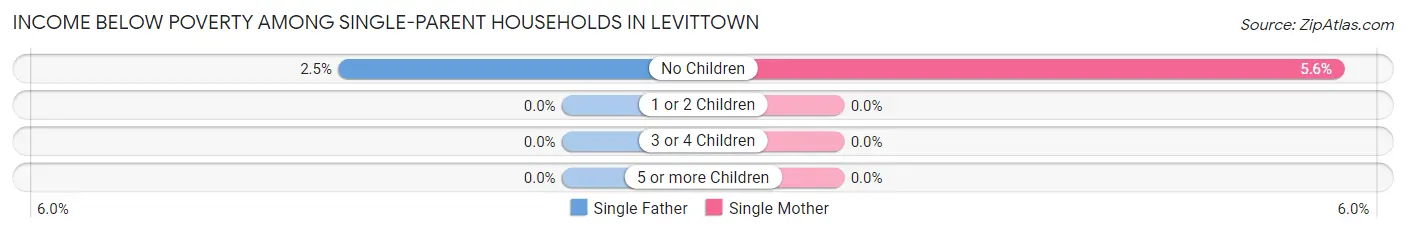
| Children | Single Father | Single Mother |
| No Children | 12 (2.5%) | 78 (5.6%) |
| 1 or 2 Children | 0 (0.0%) | 0 (0.0%) |
| 3 or 4 Children | 0 (0.0%) | 0 (0.0%) |
| 5 or more Children | 0 (0.0%) | 0 (0.0%) |
| Total | 12 (1.7%) | 78 (4.2%) |
Income Below Poverty Among Married-Couple vs Single-Parent Households in Levittown
The poverty data for Levittown shows that 173 of the married-couple family households (1.5%) and 90 of the single-parent households (3.5%) are living below the poverty level. Within the married-couple family households, those with 1 or 2 children have the highest poverty rate, with 128 households (3.4%) falling below the poverty line. Among the single-parent households, those with no children have the highest poverty rate, with 90 household (4.8%) living below poverty.
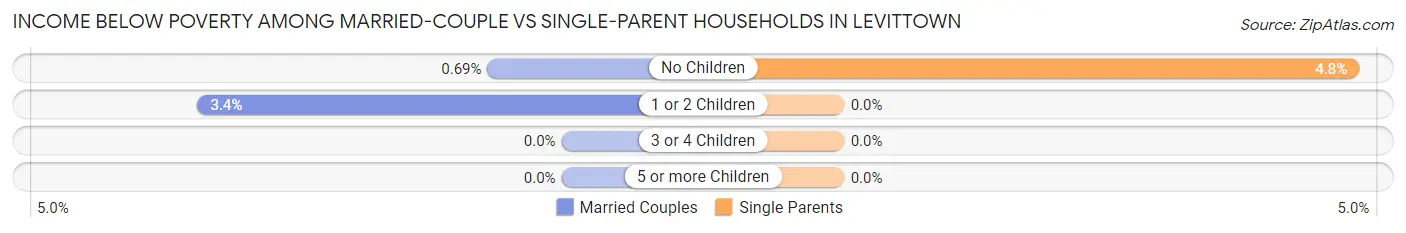
| Children | Married-Couple Families | Single-Parent Households |
| No Children | 45 (0.7%) | 90 (4.8%) |
| 1 or 2 Children | 128 (3.4%) | 0 (0.0%) |
| 3 or 4 Children | 0 (0.0%) | 0 (0.0%) |
| 5 or more Children | 0 (0.0%) | 0 (0.0%) |
| Total | 173 (1.5%) | 90 (3.5%) |
Race in Levittown
The most populous races in Levittown are White / Caucasian (38,471 | 75.7%), Hispanic or Latino (8,304 | 16.4%), and Asian (4,727 | 9.3%).
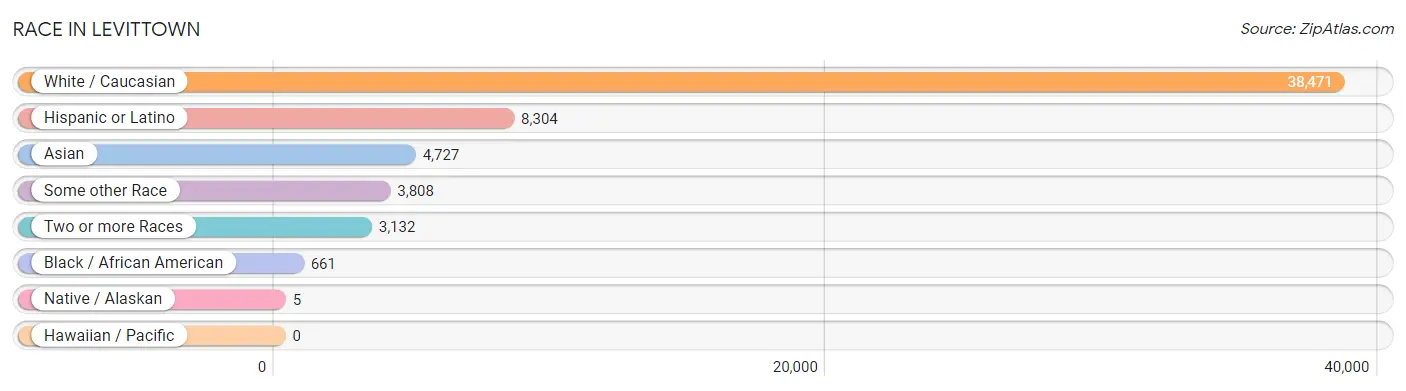
| Race | # Population | % Population |
| Asian | 4,727 | 9.3% |
| Black / African American | 661 | 1.3% |
| Hawaiian / Pacific | 0 | 0.0% |
| Hispanic or Latino | 8,304 | 16.4% |
| Native / Alaskan | 5 | 0.0% |
| White / Caucasian | 38,471 | 75.7% |
| Two or more Races | 3,132 | 6.2% |
| Some other Race | 3,808 | 7.5% |
| Total | 50,804 | 100.0% |
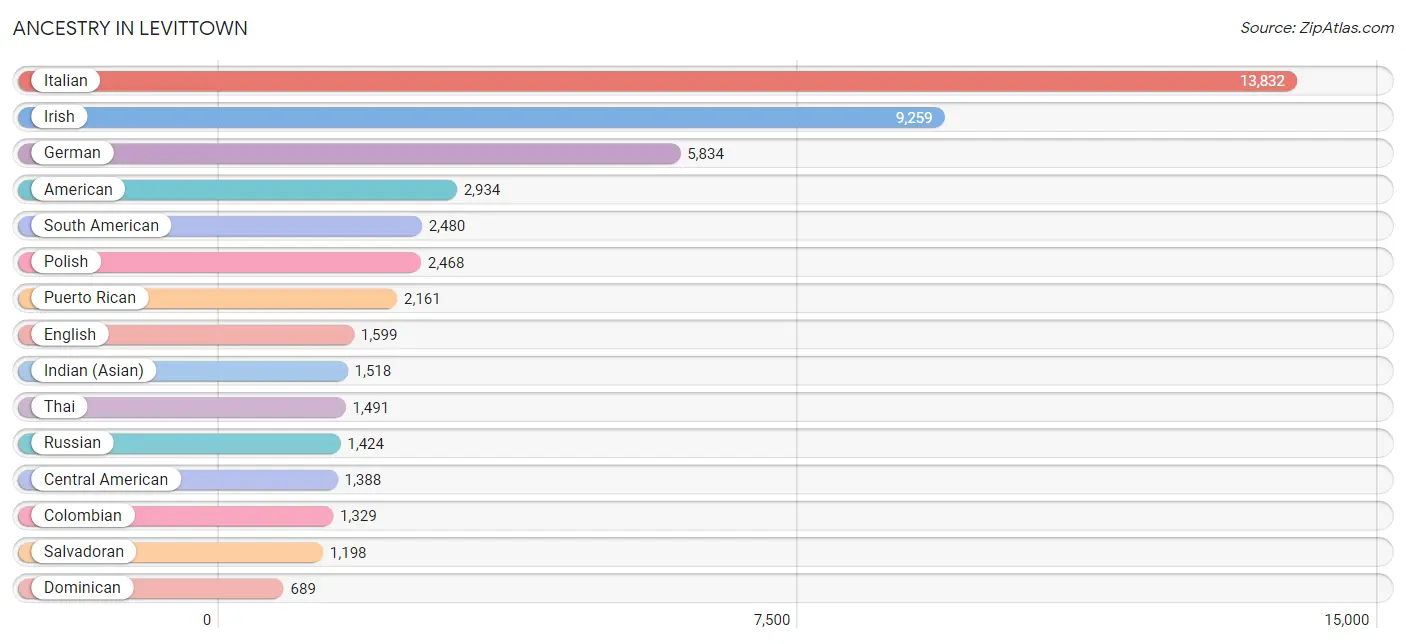
Ancestry in Levittown
The most populous ancestries reported in Levittown are Italian (13,832 | 27.2%), Irish (9,259 | 18.2%), German (5,834 | 11.5%), American (2,934 | 5.8%), and South American (2,480 | 4.9%), together accounting for 67.6% of all Levittown residents.
| Ancestry | # Population | % Population |
| Afghan | 263 | 0.5% |
| African | 27 | 0.1% |
| Albanian | 53 | 0.1% |
| American | 2,934 | 5.8% |
| Arab | 211 | 0.4% |
| Argentinean | 38 | 0.1% |
| Armenian | 19 | 0.0% |
| Austrian | 216 | 0.4% |
| Belgian | 29 | 0.1% |
| Bhutanese | 62 | 0.1% |
| Blackfeet | 12 | 0.0% |
| Brazilian | 70 | 0.1% |
| British | 76 | 0.2% |
| Burmese | 356 | 0.7% |
| Canadian | 41 | 0.1% |
| Central American | 1,388 | 2.7% |
| Central American Indian | 43 | 0.1% |
| Cherokee | 91 | 0.2% |
| Chilean | 51 | 0.1% |
| Colombian | 1,329 | 2.6% |
| Croatian | 149 | 0.3% |
| Cuban | 521 | 1.0% |
| Czech | 88 | 0.2% |
| Czechoslovakian | 124 | 0.2% |
| Danish | 9 | 0.0% |
| Dominican | 689 | 1.4% |
| Dutch | 195 | 0.4% |
| Eastern European | 439 | 0.9% |
| Ecuadorian | 558 | 1.1% |
| English | 1,599 | 3.2% |
| European | 610 | 1.2% |
| Filipino | 28 | 0.1% |
| Finnish | 47 | 0.1% |
| French | 639 | 1.3% |
| French Canadian | 95 | 0.2% |
| German | 5,834 | 11.5% |
| Greek | 569 | 1.1% |
| Guyanese | 293 | 0.6% |
| Haitian | 48 | 0.1% |
| Honduran | 155 | 0.3% |
| Hungarian | 315 | 0.6% |
| Indian (Asian) | 1,518 | 3.0% |
| Iranian | 38 | 0.1% |
| Irish | 9,259 | 18.2% |
| Israeli | 10 | 0.0% |
| Italian | 13,832 | 27.2% |
| Jamaican | 113 | 0.2% |
| Jordanian | 10 | 0.0% |
| Kenyan | 119 | 0.2% |
| Korean | 530 | 1.0% |
| Laotian | 44 | 0.1% |
| Latvian | 41 | 0.1% |
| Lebanese | 24 | 0.1% |
| Lithuanian | 49 | 0.1% |
| Luxembourger | 12 | 0.0% |
| Maltese | 32 | 0.1% |
| Mexican | 68 | 0.1% |
| Moroccan | 12 | 0.0% |
| Nicaraguan | 35 | 0.1% |
| Nigerian | 46 | 0.1% |
| Northern European | 8 | 0.0% |
| Norwegian | 343 | 0.7% |
| Pakistani | 153 | 0.3% |
| Palestinian | 30 | 0.1% |
| Peruvian | 347 | 0.7% |
| Polish | 2,468 | 4.9% |
| Portuguese | 222 | 0.4% |
| Puerto Rican | 2,161 | 4.3% |
| Romanian | 123 | 0.2% |
| Russian | 1,424 | 2.8% |
| Salvadoran | 1,198 | 2.4% |
| Scandinavian | 27 | 0.1% |
| Scotch-Irish | 144 | 0.3% |
| Scottish | 127 | 0.3% |
| Serbian | 68 | 0.1% |
| Slavic | 12 | 0.0% |
| South American | 2,480 | 4.9% |
| South American Indian | 67 | 0.1% |
| Spaniard | 98 | 0.2% |
| Spanish | 129 | 0.3% |
| Sri Lankan | 102 | 0.2% |
| Subsaharan African | 192 | 0.4% |
| Swedish | 110 | 0.2% |
| Swiss | 7 | 0.0% |
| Syrian | 11 | 0.0% |
| Thai | 1,491 | 2.9% |
| Trinidadian and Tobagonian | 1 | 0.0% |
| Turkish | 356 | 0.7% |
| Ukrainian | 174 | 0.3% |
| Uruguayan | 70 | 0.1% |
| Venezuelan | 87 | 0.2% |
| Vietnamese | 96 | 0.2% |
| Welsh | 45 | 0.1% |
| West Indian | 19 | 0.0% |
| Yugoslavian | 9 | 0.0% | View All 95 Rows |
Immigrants in Levittown
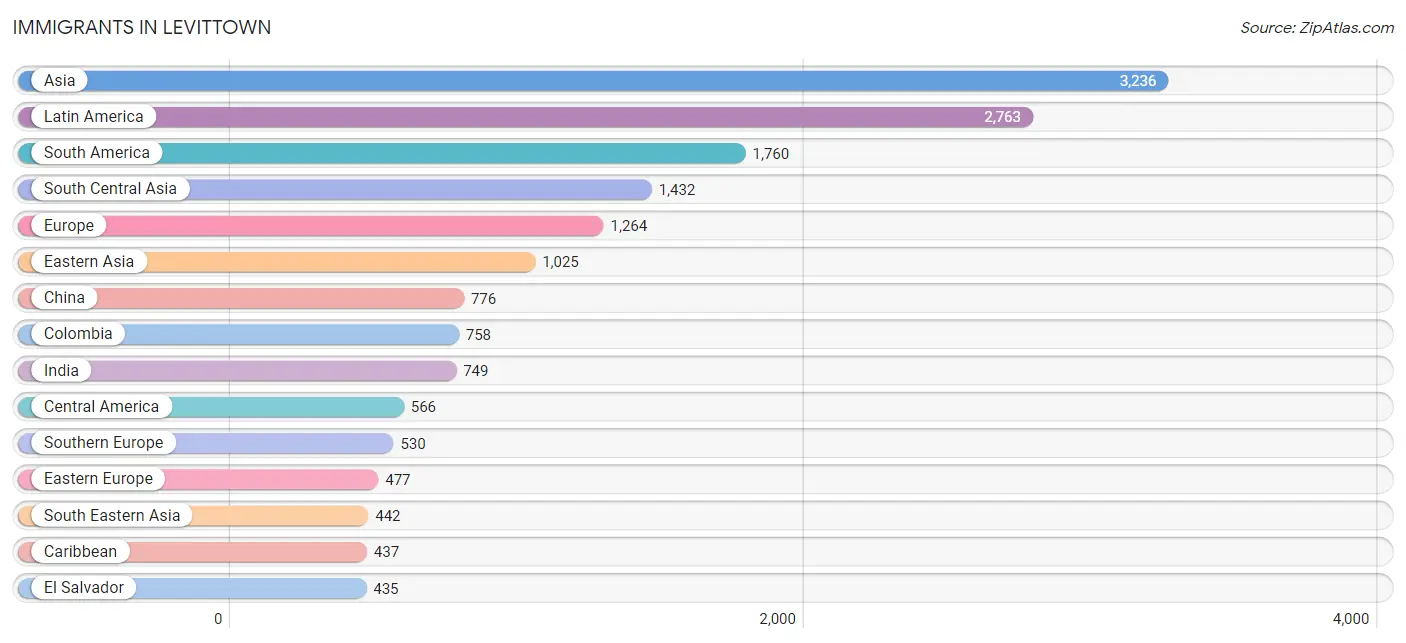
The most numerous immigrant groups reported in Levittown came from Asia (3,236 | 6.4%), Latin America (2,763 | 5.4%), South America (1,760 | 3.5%), South Central Asia (1,432 | 2.8%), and Europe (1,264 | 2.5%), together accounting for 20.6% of all Levittown residents.
| Immigration Origin | # Population | % Population |
| Afghanistan | 186 | 0.4% |
| Africa | 93 | 0.2% |
| Albania | 29 | 0.1% |
| Asia | 3,236 | 6.4% |
| Bangladesh | 136 | 0.3% |
| Belarus | 68 | 0.1% |
| Belgium | 6 | 0.0% |
| Brazil | 22 | 0.0% |
| Canada | 33 | 0.1% |
| Caribbean | 437 | 0.9% |
| Central America | 566 | 1.1% |
| Chile | 40 | 0.1% |
| China | 776 | 1.5% |
| Colombia | 758 | 1.5% |
| Croatia | 41 | 0.1% |
| Cuba | 29 | 0.1% |
| Dominican Republic | 276 | 0.5% |
| Eastern Asia | 1,025 | 2.0% |
| Eastern Europe | 477 | 0.9% |
| Ecuador | 304 | 0.6% |
| El Salvador | 435 | 0.9% |
| England | 42 | 0.1% |
| Europe | 1,264 | 2.5% |
| France | 11 | 0.0% |
| Germany | 110 | 0.2% |
| Ghana | 33 | 0.1% |
| Greece | 45 | 0.1% |
| Guyana | 190 | 0.4% |
| Haiti | 28 | 0.1% |
| Honduras | 124 | 0.2% |
| Hong Kong | 58 | 0.1% |
| India | 749 | 1.5% |
| Indonesia | 17 | 0.0% |
| Iran | 17 | 0.0% |
| Ireland | 68 | 0.1% |
| Israel | 21 | 0.0% |
| Italy | 410 | 0.8% |
| Jamaica | 26 | 0.1% |
| Jordan | 31 | 0.1% |
| Korea | 249 | 0.5% |
| Latin America | 2,763 | 5.4% |
| Malaysia | 6 | 0.0% |
| Mexico | 7 | 0.0% |
| Morocco | 12 | 0.0% |
| Nepal | 14 | 0.0% |
| Nigeria | 46 | 0.1% |
| Northern Africa | 12 | 0.0% |
| Northern Europe | 130 | 0.3% |
| Pakistan | 273 | 0.5% |
| Peru | 303 | 0.6% |
| Philippines | 313 | 0.6% |
| Poland | 80 | 0.2% |
| Portugal | 75 | 0.2% |
| Romania | 74 | 0.2% |
| Russia | 109 | 0.2% |
| Scotland | 15 | 0.0% |
| Serbia | 20 | 0.0% |
| South America | 1,760 | 3.5% |
| South Central Asia | 1,432 | 2.8% |
| South Eastern Asia | 442 | 0.9% |
| Southern Europe | 530 | 1.0% |
| Sri Lanka | 57 | 0.1% |
| Taiwan | 45 | 0.1% |
| Thailand | 52 | 0.1% |
| Trinidad and Tobago | 78 | 0.2% |
| Turkey | 219 | 0.4% |
| Ukraine | 56 | 0.1% |
| Uruguay | 90 | 0.2% |
| Venezuela | 53 | 0.1% |
| Vietnam | 47 | 0.1% |
| Western Africa | 79 | 0.2% |
| Western Asia | 337 | 0.7% |
| Western Europe | 127 | 0.3% | View All 73 Rows |
Sex and Age in Levittown
Sex and Age in Levittown
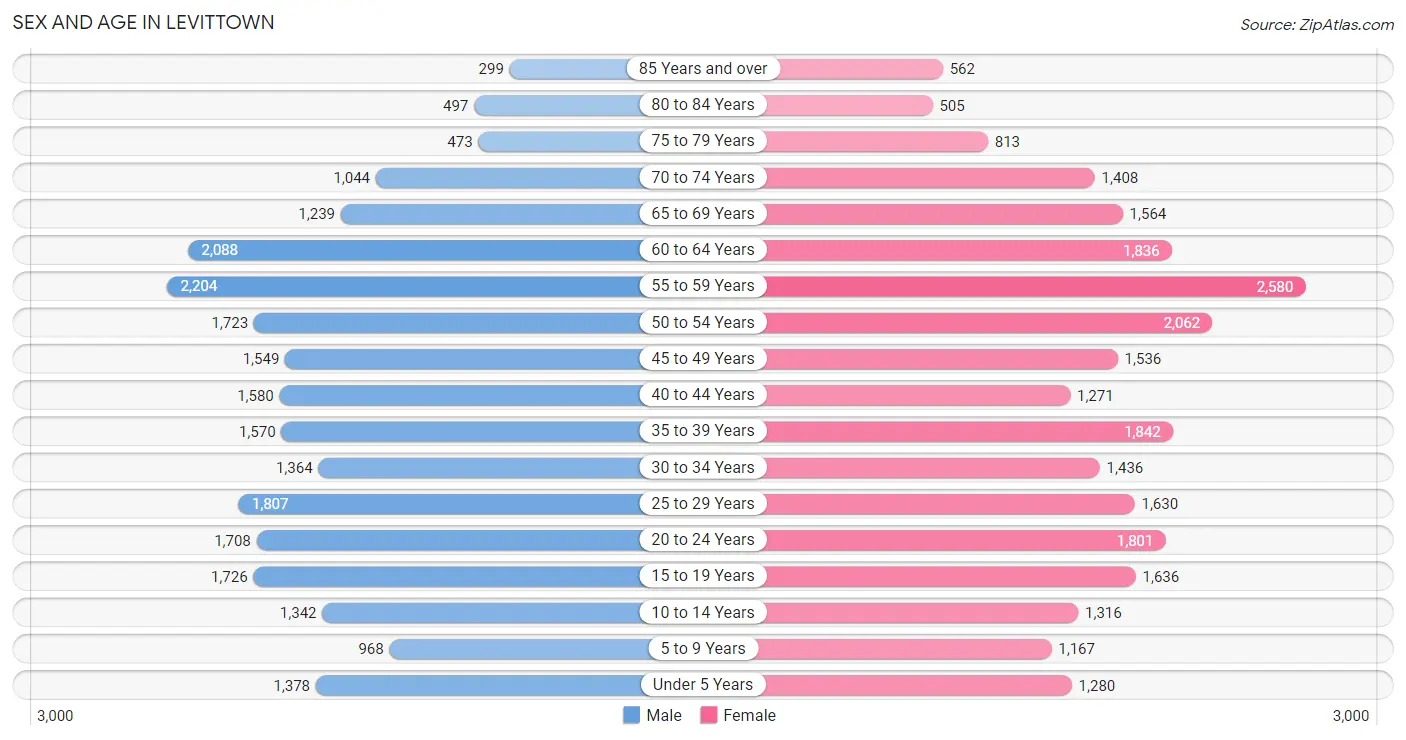
The most populous age groups in Levittown are 55 to 59 Years (2,204 | 9.0%) for men and 55 to 59 Years (2,580 | 9.8%) for women.
| Age Bracket | Male | Female |
| Under 5 Years | 1,378 (5.6%) | 1,280 (4.9%) |
| 5 to 9 Years | 968 (3.9%) | 1,167 (4.4%) |
| 10 to 14 Years | 1,342 (5.5%) | 1,316 (5.0%) |
| 15 to 19 Years | 1,726 (7.0%) | 1,636 (6.2%) |
| 20 to 24 Years | 1,708 (7.0%) | 1,801 (6.9%) |
| 25 to 29 Years | 1,807 (7.4%) | 1,630 (6.2%) |
| 30 to 34 Years | 1,364 (5.6%) | 1,436 (5.5%) |
| 35 to 39 Years | 1,570 (6.4%) | 1,842 (7.0%) |
| 40 to 44 Years | 1,580 (6.4%) | 1,271 (4.8%) |
| 45 to 49 Years | 1,549 (6.3%) | 1,536 (5.9%) |
| 50 to 54 Years | 1,723 (7.0%) | 2,062 (7.9%) |
| 55 to 59 Years | 2,204 (9.0%) | 2,580 (9.8%) |
| 60 to 64 Years | 2,088 (8.5%) | 1,836 (7.0%) |
| 65 to 69 Years | 1,239 (5.0%) | 1,564 (6.0%) |
| 70 to 74 Years | 1,044 (4.3%) | 1,408 (5.4%) |
| 75 to 79 Years | 473 (1.9%) | 813 (3.1%) |
| 80 to 84 Years | 497 (2.0%) | 505 (1.9%) |
| 85 Years and over | 299 (1.2%) | 562 (2.1%) |
| Total | 24,559 (100.0%) | 26,245 (100.0%) |
Families and Households in Levittown
Median Family Size in Levittown
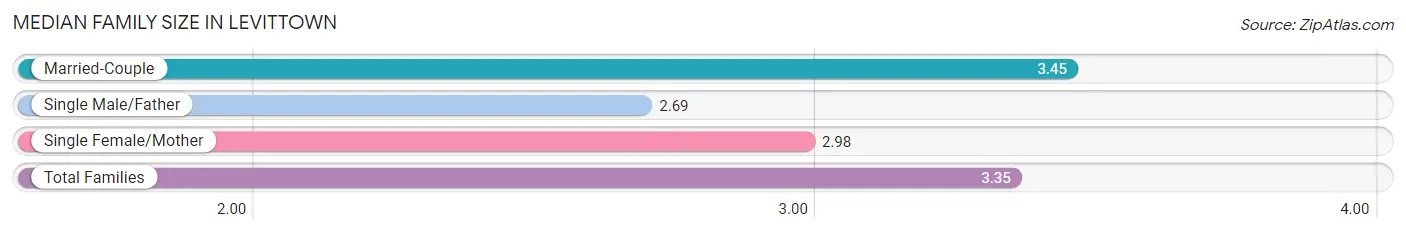
The median family size in Levittown is 3.35 persons per family, with married-couple families (11,190 | 81.3%) accounting for the largest median family size of 3.45 persons per family. On the other hand, single male/father families (693 | 5.0%) represent the smallest median family size with 2.69 persons per family.
| Family Type | # Families | Family Size |
| Married-Couple | 11,190 (81.3%) | 3.45 |
| Single Male/Father | 693 (5.0%) | 2.69 |
| Single Female/Mother | 1,876 (13.6%) | 2.98 |
| Total Families | 13,759 (100.0%) | 3.35 |
Median Household Size in Levittown
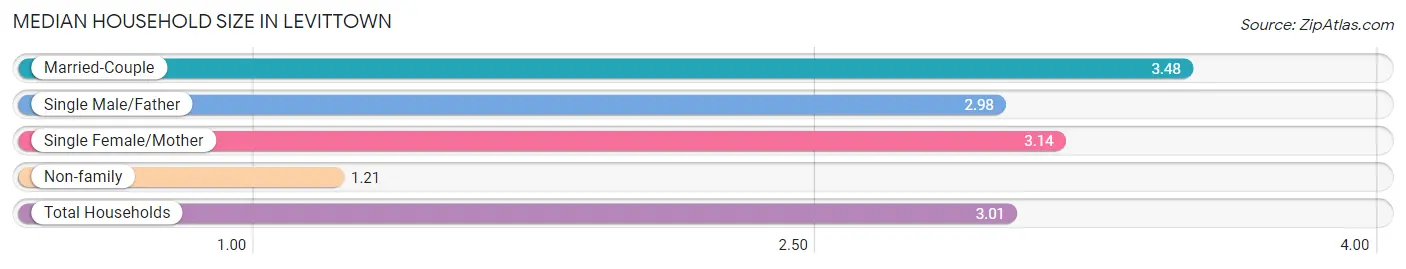
The median household size in Levittown is 3.01 persons per household, with married-couple households (11,190 | 66.5%) accounting for the largest median household size of 3.48 persons per household. non-family households (3,074 | 18.3%) represent the smallest median household size with 1.21 persons per household.
| Household Type | # Households | Household Size |
| Married-Couple | 11,190 (66.5%) | 3.48 |
| Single Male/Father | 693 (4.1%) | 2.98 |
| Single Female/Mother | 1,876 (11.1%) | 3.14 |
| Non-family | 3,074 (18.3%) | 1.21 |
| Total Households | 16,833 (100.0%) | 3.01 |
Household Size by Marriage Status in Levittown
Out of a total of 16,833 households in Levittown, 13,759 (81.7%) are family households, while 3,074 (18.3%) are nonfamily households. The most numerous type of family households are 2-person households, comprising 4,651, and the most common type of nonfamily households are 1-person households, comprising 2,591.
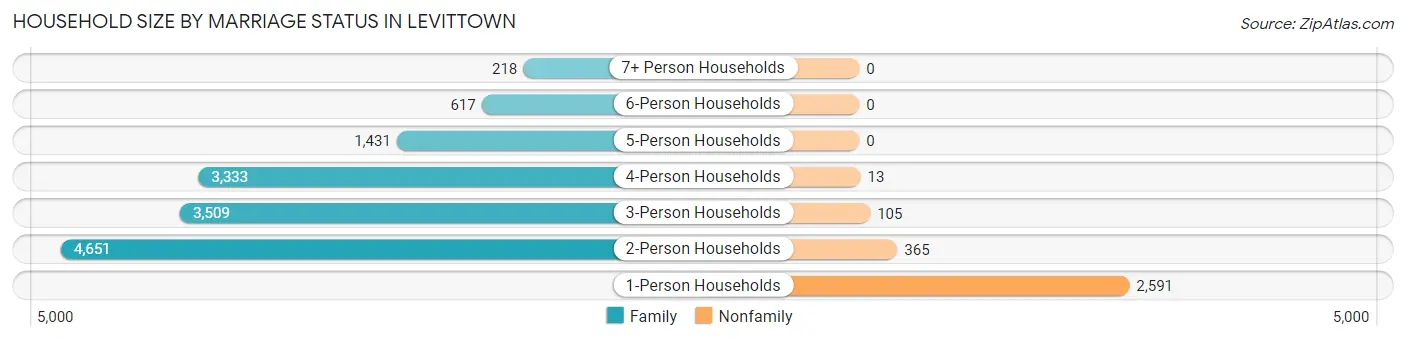
| Household Size | Family Households | Nonfamily Households |
| 1-Person Households | - | 2,591 (15.4%) |
| 2-Person Households | 4,651 (27.6%) | 365 (2.2%) |
| 3-Person Households | 3,509 (20.8%) | 105 (0.6%) |
| 4-Person Households | 3,333 (19.8%) | 13 (0.1%) |
| 5-Person Households | 1,431 (8.5%) | 0 (0.0%) |
| 6-Person Households | 617 (3.7%) | 0 (0.0%) |
| 7+ Person Households | 218 (1.3%) | 0 (0.0%) |
| Total | 13,759 (81.7%) | 3,074 (18.3%) |
Female Fertility in Levittown
Fertility by Age in Levittown
Average fertility rate in Levittown is 53.0 births per 1,000 women. Women in the age bracket of 20 to 34 years have the highest fertility rate with 87.0 births per 1,000 women. Women in the age bracket of 20 to 34 years acount for 68.3% of all women with births.
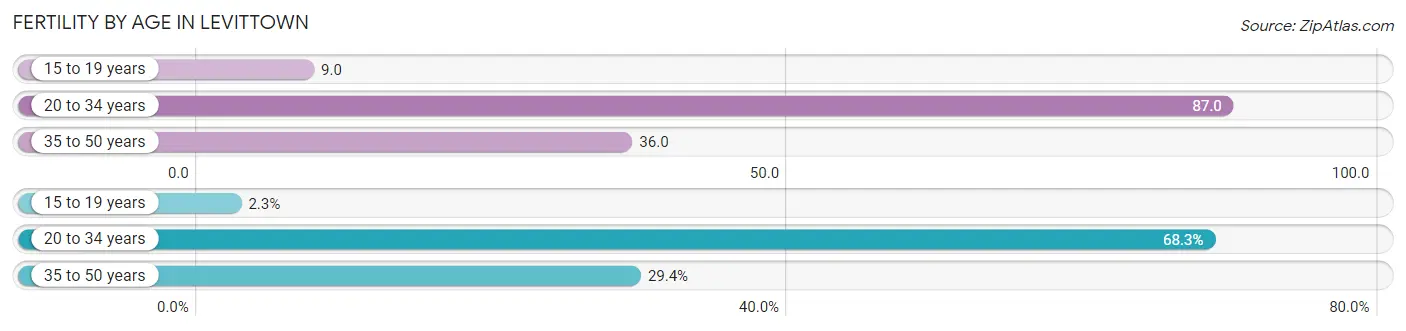
| Age Bracket | Women with Births | Births / 1,000 Women |
| 15 to 19 years | 14 (2.3%) | 9.0 |
| 20 to 34 years | 421 (68.3%) | 87.0 |
| 35 to 50 years | 181 (29.4%) | 36.0 |
| Total | 616 (100.0%) | 53.0 |
Fertility by Age by Marriage Status in Levittown
95.6% of women with births (616) in Levittown are married. The highest percentage of unmarried women with births falls into 15 to 19 years age bracket with 100.0% of them unmarried at the time of birth, while the lowest percentage of unmarried women with births belong to 35 to 50 years age bracket with 0.0% of them unmarried.
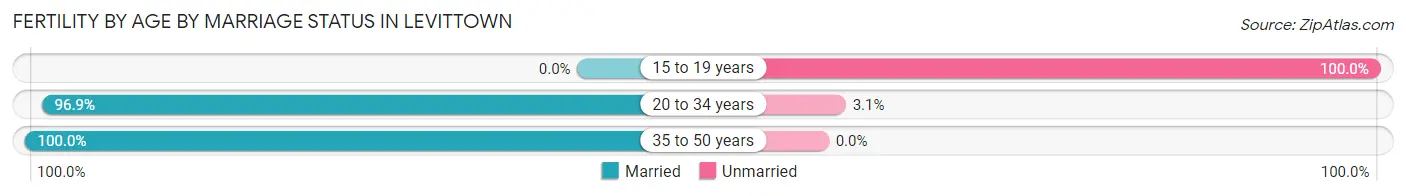
| Age Bracket | Married | Unmarried |
| 15 to 19 years | 0 (0.0%) | 14 (100.0%) |
| 20 to 34 years | 408 (96.9%) | 13 (3.1%) |
| 35 to 50 years | 181 (100.0%) | 0 (0.0%) |
| Total | 589 (95.6%) | 27 (4.4%) |
Fertility by Education in Levittown
Average fertility rate in Levittown is 53.0 births per 1,000 women. Women with the education attainment of graduate degree have the highest fertility rate of 74.0 births per 1,000 women, while women with the education attainment of less than high school have the lowest fertility at 23.0 births per 1,000 women. Women with the education attainment of college or associate's degree represent 30.5% of all women with births.
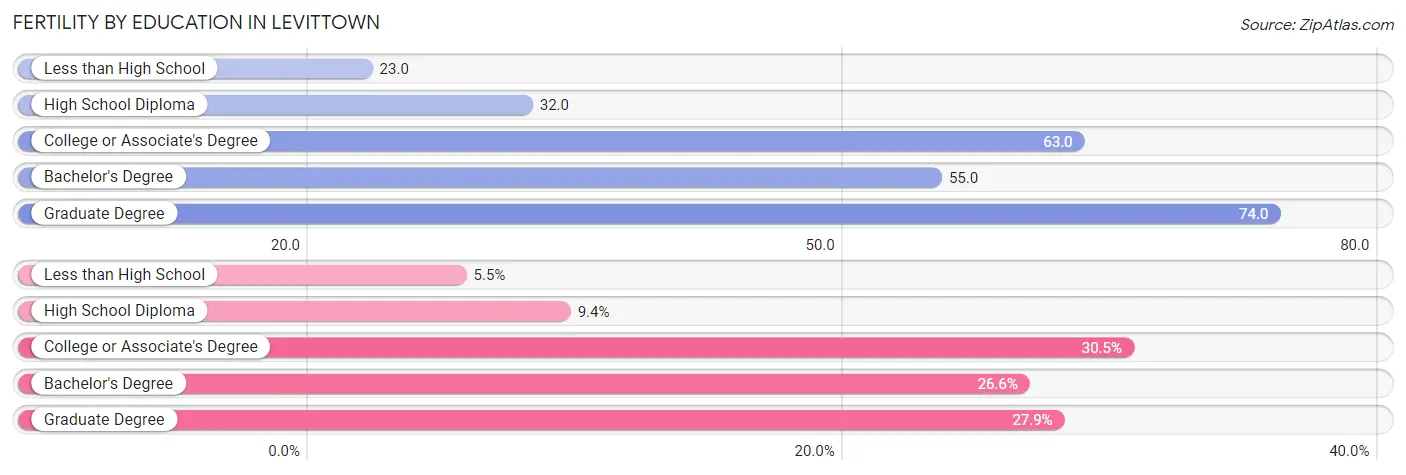
| Educational Attainment | Women with Births | Births / 1,000 Women |
| Less than High School | 34 (5.5%) | 23.0 |
| High School Diploma | 58 (9.4%) | 32.0 |
| College or Associate's Degree | 188 (30.5%) | 63.0 |
| Bachelor's Degree | 164 (26.6%) | 55.0 |
| Graduate Degree | 172 (27.9%) | 74.0 |
| Total | 616 (100.0%) | 53.0 |
Fertility by Education by Marriage Status in Levittown
4.4% of women with births in Levittown are unmarried. Women with the educational attainment of high school diploma are most likely to be married with 100.0% of them married at childbirth, while women with the educational attainment of less than high school are least likely to be married with 41.2% of them unmarried at childbirth.
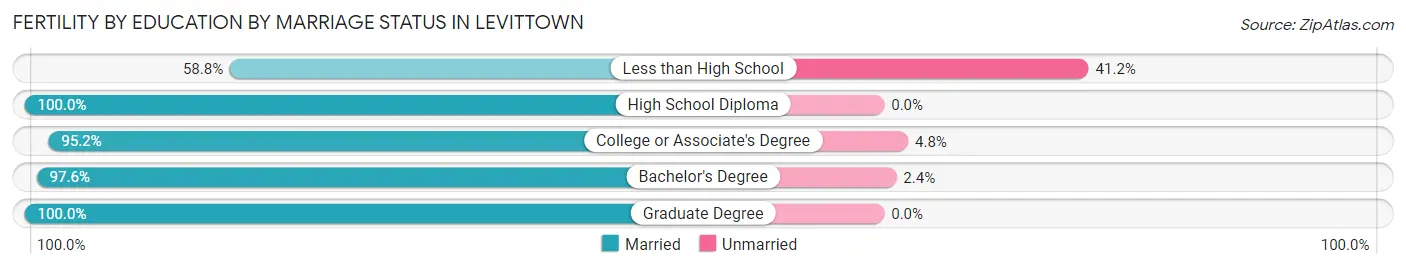
| Educational Attainment | Married | Unmarried |
| Less than High School | 20 (58.8%) | 14 (41.2%) |
| High School Diploma | 58 (100.0%) | 0 (0.0%) |
| College or Associate's Degree | 179 (95.2%) | 9 (4.8%) |
| Bachelor's Degree | 160 (97.6%) | 4 (2.4%) |
| Graduate Degree | 172 (100.0%) | 0 (0.0%) |
| Total | 589 (95.6%) | 27 (4.4%) |
Employment Characteristics in Levittown
Employment by Class of Employer in Levittown
Among the 27,651 employed individuals in Levittown, private company employees (18,322 | 66.3%), local government employees (3,691 | 13.4%), and not-for-profit organizations (2,461 | 8.9%) make up the most common classes of employment.
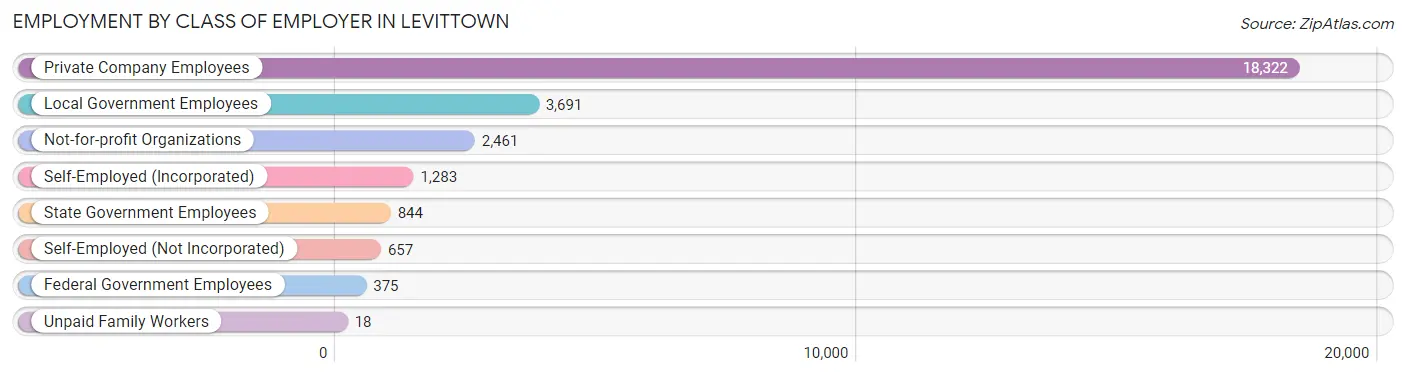
| Employer Class | # Employees | % Employees |
| Private Company Employees | 18,322 | 66.3% |
| Self-Employed (Incorporated) | 1,283 | 4.6% |
| Self-Employed (Not Incorporated) | 657 | 2.4% |
| Not-for-profit Organizations | 2,461 | 8.9% |
| Local Government Employees | 3,691 | 13.4% |
| State Government Employees | 844 | 3.0% |
| Federal Government Employees | 375 | 1.4% |
| Unpaid Family Workers | 18 | 0.1% |
| Total | 27,651 | 100.0% |
Employment Status by Age in Levittown
According to the labor force statistics for Levittown, out of the total population over 16 years of age (42,574), 70.1% or 29,844 individuals are in the labor force, with 5.4% or 1,612 of them unemployed. The age group with the highest labor force participation rate is 25 to 29 years, with 93.0% or 3,196 individuals in the labor force. Within the labor force, the 75 years and over age range has the highest percentage of unemployed individuals, with 18.2% or 40 of them being unemployed.
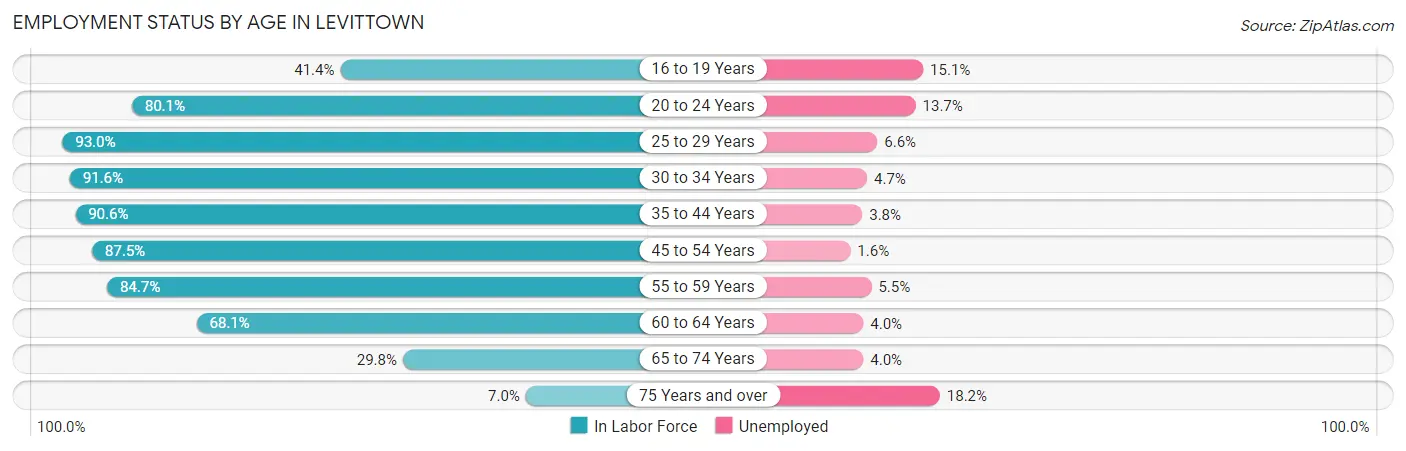
| Age Bracket | In Labor Force | Unemployed |
| 16 to 19 Years | 1,069 (41.4%) | 161 (15.1%) |
| 20 to 24 Years | 2,811 (80.1%) | 385 (13.7%) |
| 25 to 29 Years | 3,196 (93.0%) | 211 (6.6%) |
| 30 to 34 Years | 2,565 (91.6%) | 121 (4.7%) |
| 35 to 44 Years | 5,674 (90.6%) | 216 (3.8%) |
| 45 to 54 Years | 6,011 (87.5%) | 96 (1.6%) |
| 55 to 59 Years | 4,052 (84.7%) | 223 (5.5%) |
| 60 to 64 Years | 2,672 (68.1%) | 107 (4.0%) |
| 65 to 74 Years | 1,566 (29.8%) | 63 (4.0%) |
| 75 Years and over | 220 (7.0%) | 40 (18.2%) |
| Total | 29,844 (70.1%) | 1,612 (5.4%) |
Employment Status by Educational Attainment in Levittown
According to labor force statistics for Levittown, 86.1% of individuals (24,175) out of the total population between 25 and 64 years of age (28,078) are in the labor force, with 4.0% or 967 of them being unemployed. The group with the highest labor force participation rate are those with the educational attainment of bachelor's degree or higher, with 91.2% or 10,369 individuals in the labor force. Within the labor force, individuals with less than high school education have the highest percentage of unemployment, with 5.9% or 61 of them being unemployed.
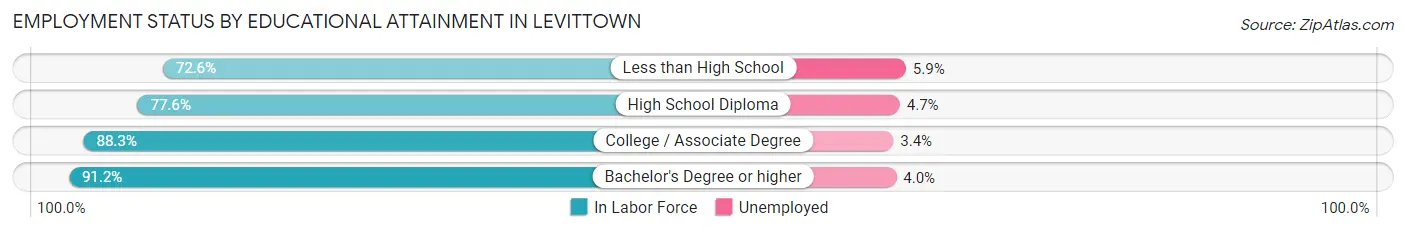
| Educational Attainment | In Labor Force | Unemployed |
| Less than High School | 1,032 (72.6%) | 84 (5.9%) |
| High School Diploma | 5,268 (77.6%) | 319 (4.7%) |
| College / Associate Degree | 7,503 (88.3%) | 289 (3.4%) |
| Bachelor's Degree or higher | 10,369 (91.2%) | 455 (4.0%) |
| Total | 24,175 (86.1%) | 1,123 (4.0%) |
Employment Occupations by Sex in Levittown
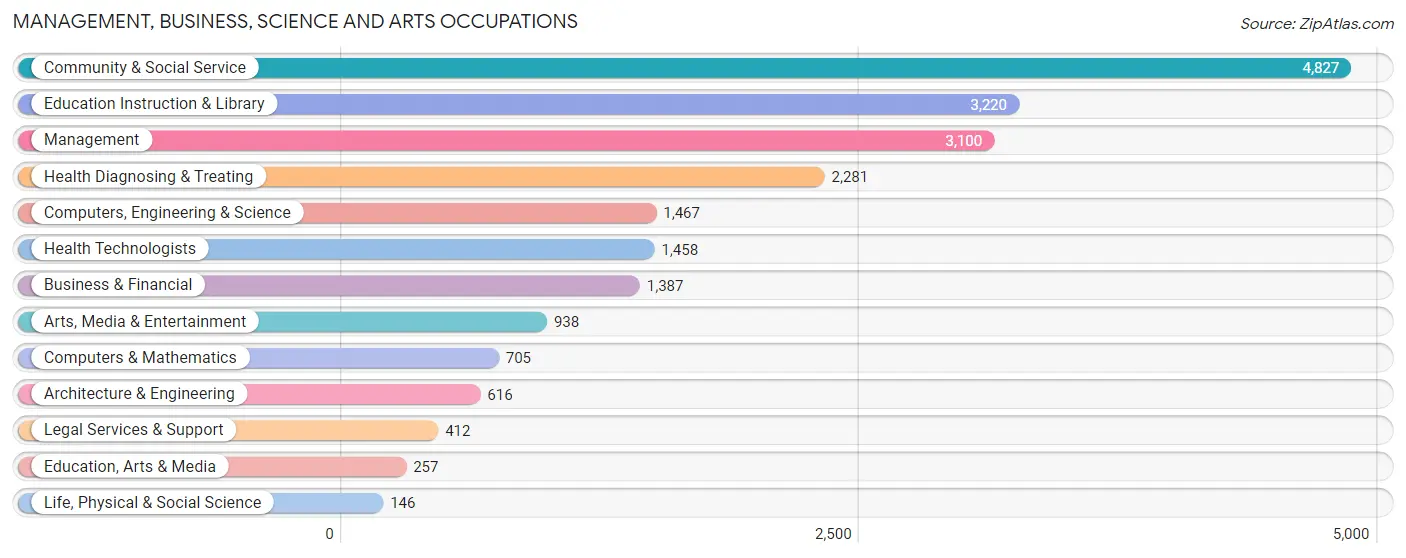
Management, Business, Science and Arts Occupations
The most common Management, Business, Science and Arts occupations in Levittown are Community & Social Service (4,827 | 17.1%), Education Instruction & Library (3,220 | 11.4%), Management (3,100 | 11.0%), Health Diagnosing & Treating (2,281 | 8.1%), and Computers, Engineering & Science (1,467 | 5.2%).
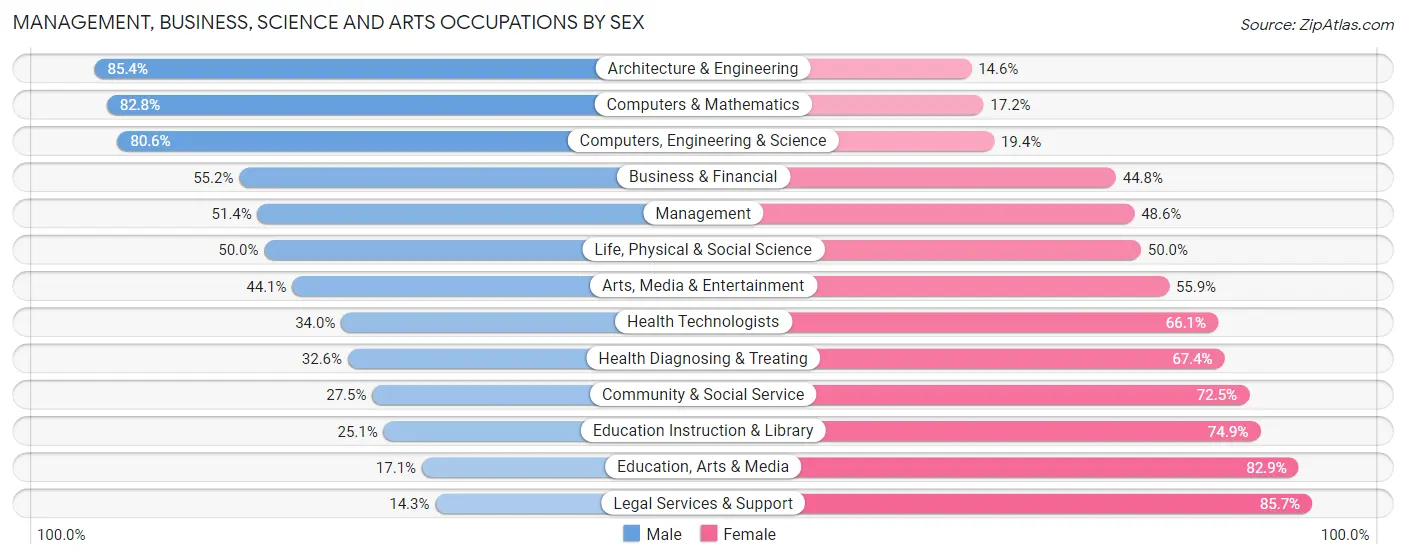
Management, Business, Science and Arts Occupations by Sex
Within the Management, Business, Science and Arts occupations in Levittown, the most male-oriented occupations are Architecture & Engineering (85.4%), Computers & Mathematics (82.8%), and Computers, Engineering & Science (80.6%), while the most female-oriented occupations are Legal Services & Support (85.7%), Education, Arts & Media (82.9%), and Education Instruction & Library (74.9%).
| Occupation | Male | Female |
| Management | 1,593 (51.4%) | 1,507 (48.6%) |
| Business & Financial | 766 (55.2%) | 621 (44.8%) |
| Computers, Engineering & Science | 1,183 (80.6%) | 284 (19.4%) |
| Computers & Mathematics | 584 (82.8%) | 121 (17.2%) |
| Architecture & Engineering | 526 (85.4%) | 90 (14.6%) |
| Life, Physical & Social Science | 73 (50.0%) | 73 (50.0%) |
| Community & Social Service | 1,326 (27.5%) | 3,501 (72.5%) |
| Education, Arts & Media | 44 (17.1%) | 213 (82.9%) |
| Legal Services & Support | 59 (14.3%) | 353 (85.7%) |
| Education Instruction & Library | 809 (25.1%) | 2,411 (74.9%) |
| Arts, Media & Entertainment | 414 (44.1%) | 524 (55.9%) |
| Health Diagnosing & Treating | 743 (32.6%) | 1,538 (67.4%) |
| Health Technologists | 495 (34.0%) | 963 (66.0%) |
| Total (Category) | 5,611 (43.0%) | 7,451 (57.0%) |
| Total (Overall) | 14,238 (50.5%) | 13,972 (49.5%) |
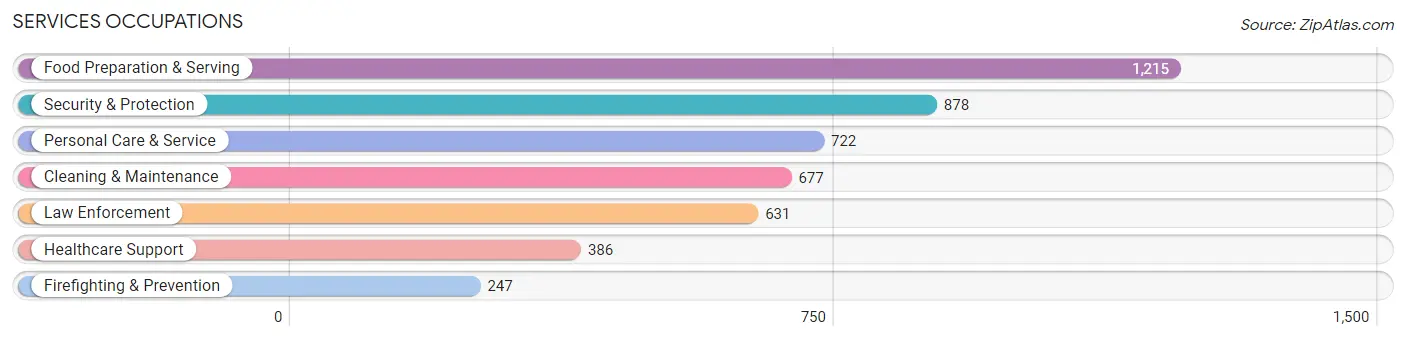
Services Occupations
The most common Services occupations in Levittown are Food Preparation & Serving (1,215 | 4.3%), Security & Protection (878 | 3.1%), Personal Care & Service (722 | 2.6%), Cleaning & Maintenance (677 | 2.4%), and Law Enforcement (631 | 2.2%).
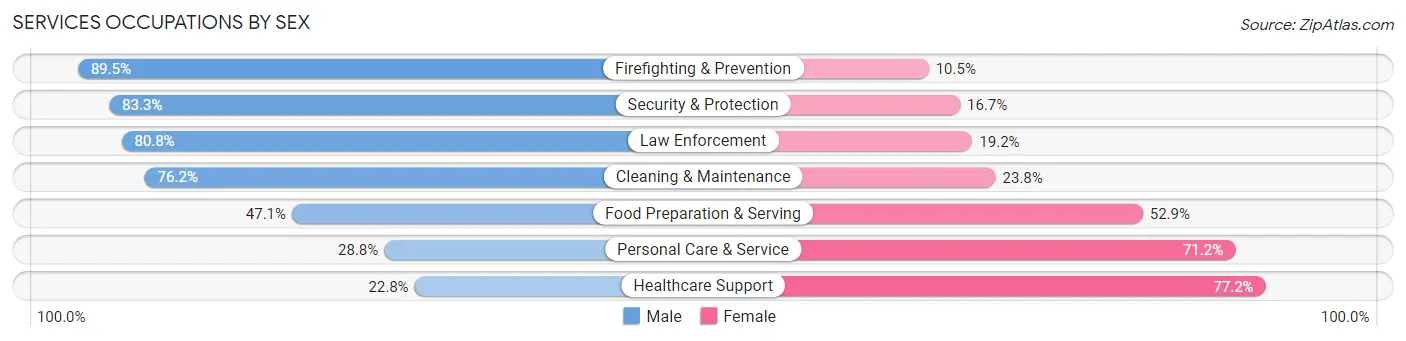
Services Occupations by Sex
Within the Services occupations in Levittown, the most male-oriented occupations are Firefighting & Prevention (89.5%), Security & Protection (83.3%), and Law Enforcement (80.8%), while the most female-oriented occupations are Healthcare Support (77.2%), Personal Care & Service (71.2%), and Food Preparation & Serving (52.9%).
| Occupation | Male | Female |
| Healthcare Support | 88 (22.8%) | 298 (77.2%) |
| Security & Protection | 731 (83.3%) | 147 (16.7%) |
| Firefighting & Prevention | 221 (89.5%) | 26 (10.5%) |
| Law Enforcement | 510 (80.8%) | 121 (19.2%) |
| Food Preparation & Serving | 572 (47.1%) | 643 (52.9%) |
| Cleaning & Maintenance | 516 (76.2%) | 161 (23.8%) |
| Personal Care & Service | 208 (28.8%) | 514 (71.2%) |
| Total (Category) | 2,115 (54.5%) | 1,763 (45.5%) |
| Total (Overall) | 14,238 (50.5%) | 13,972 (49.5%) |
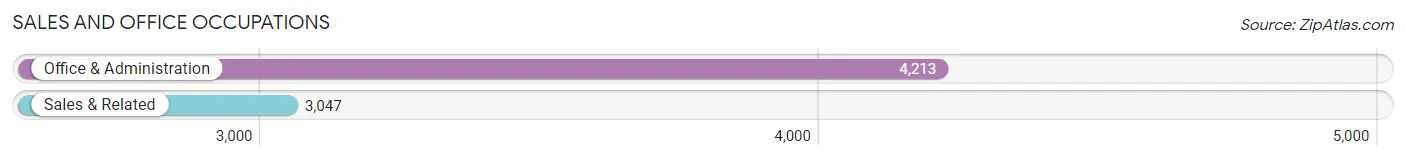
Sales and Office Occupations
The most common Sales and Office occupations in Levittown are Office & Administration (4,213 | 14.9%), and Sales & Related (3,047 | 10.8%).
Sales and Office Occupations by Sex
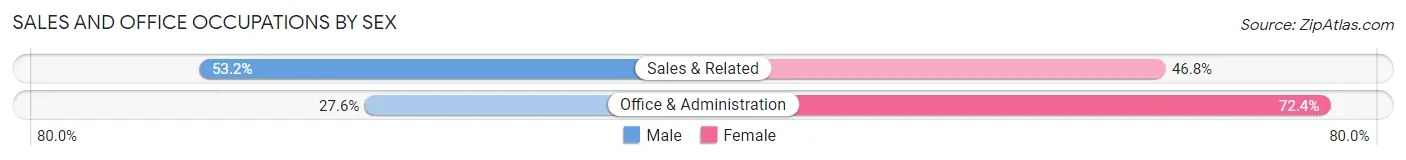
| Occupation | Male | Female |
| Sales & Related | 1,620 (53.2%) | 1,427 (46.8%) |
| Office & Administration | 1,163 (27.6%) | 3,050 (72.4%) |
| Total (Category) | 2,783 (38.3%) | 4,477 (61.7%) |
| Total (Overall) | 14,238 (50.5%) | 13,972 (49.5%) |
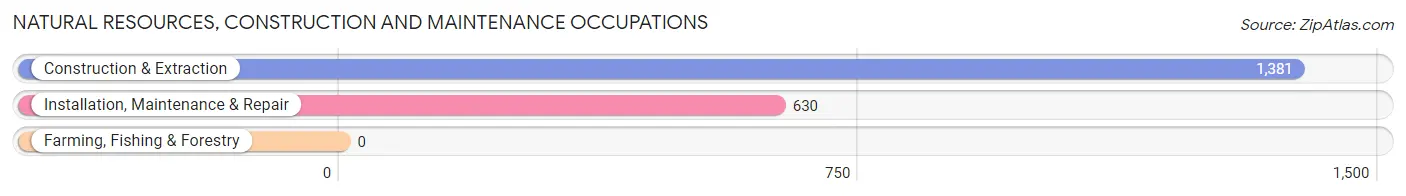
Natural Resources, Construction and Maintenance Occupations
The most common Natural Resources, Construction and Maintenance occupations in Levittown are Construction & Extraction (1,381 | 4.9%), and Installation, Maintenance & Repair (630 | 2.2%).
Natural Resources, Construction and Maintenance Occupations by Sex
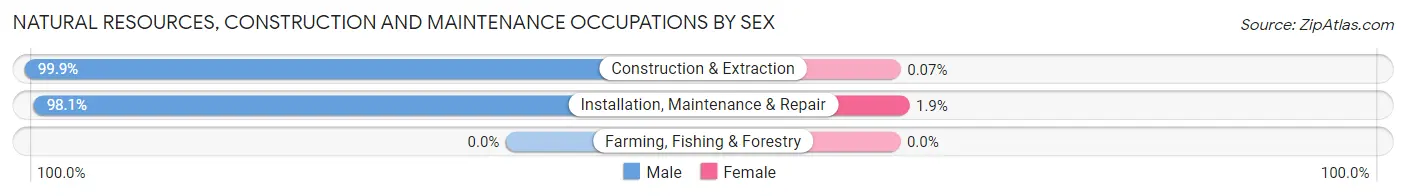
| Occupation | Male | Female |
| Farming, Fishing & Forestry | 0 (0.0%) | 0 (0.0%) |
| Construction & Extraction | 1,380 (99.9%) | 1 (0.1%) |
| Installation, Maintenance & Repair | 618 (98.1%) | 12 (1.9%) |
| Total (Category) | 1,998 (99.4%) | 13 (0.6%) |
| Total (Overall) | 14,238 (50.5%) | 13,972 (49.5%) |
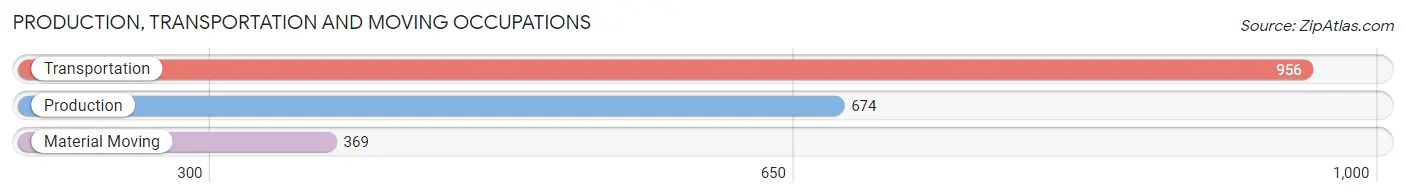
Production, Transportation and Moving Occupations
The most common Production, Transportation and Moving occupations in Levittown are Transportation (956 | 3.4%), Production (674 | 2.4%), and Material Moving (369 | 1.3%).
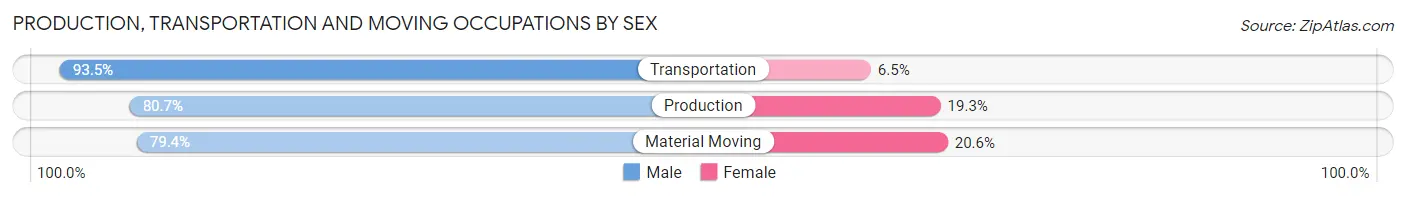
Production, Transportation and Moving Occupations by Sex
| Occupation | Male | Female |
| Production | 544 (80.7%) | 130 (19.3%) |
| Transportation | 894 (93.5%) | 62 (6.5%) |
| Material Moving | 293 (79.4%) | 76 (20.6%) |
| Total (Category) | 1,731 (86.6%) | 268 (13.4%) |
| Total (Overall) | 14,238 (50.5%) | 13,972 (49.5%) |
Employment Industries by Sex in Levittown
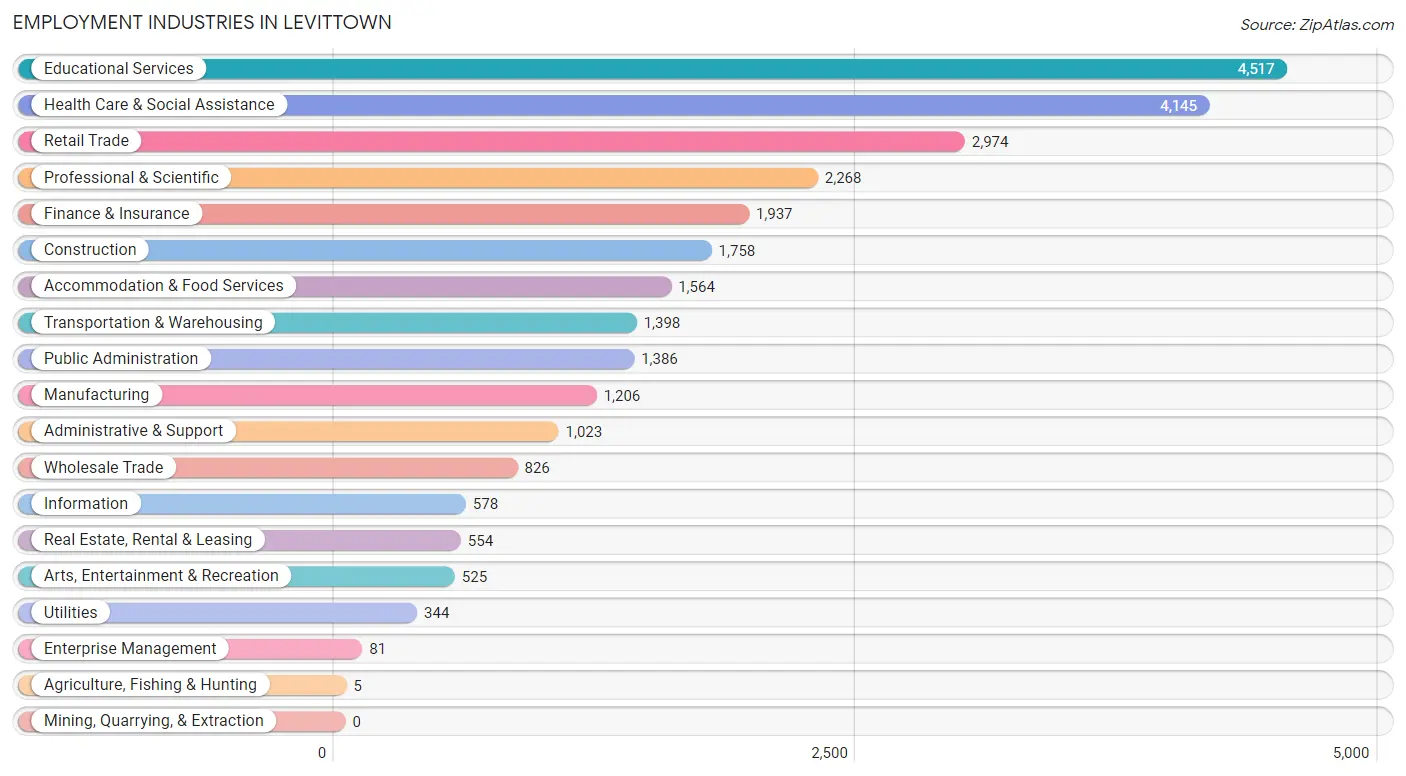
Employment Industries in Levittown
The major employment industries in Levittown include Educational Services (4,517 | 16.0%), Health Care & Social Assistance (4,145 | 14.7%), Retail Trade (2,974 | 10.5%), Professional & Scientific (2,268 | 8.0%), and Finance & Insurance (1,937 | 6.9%).
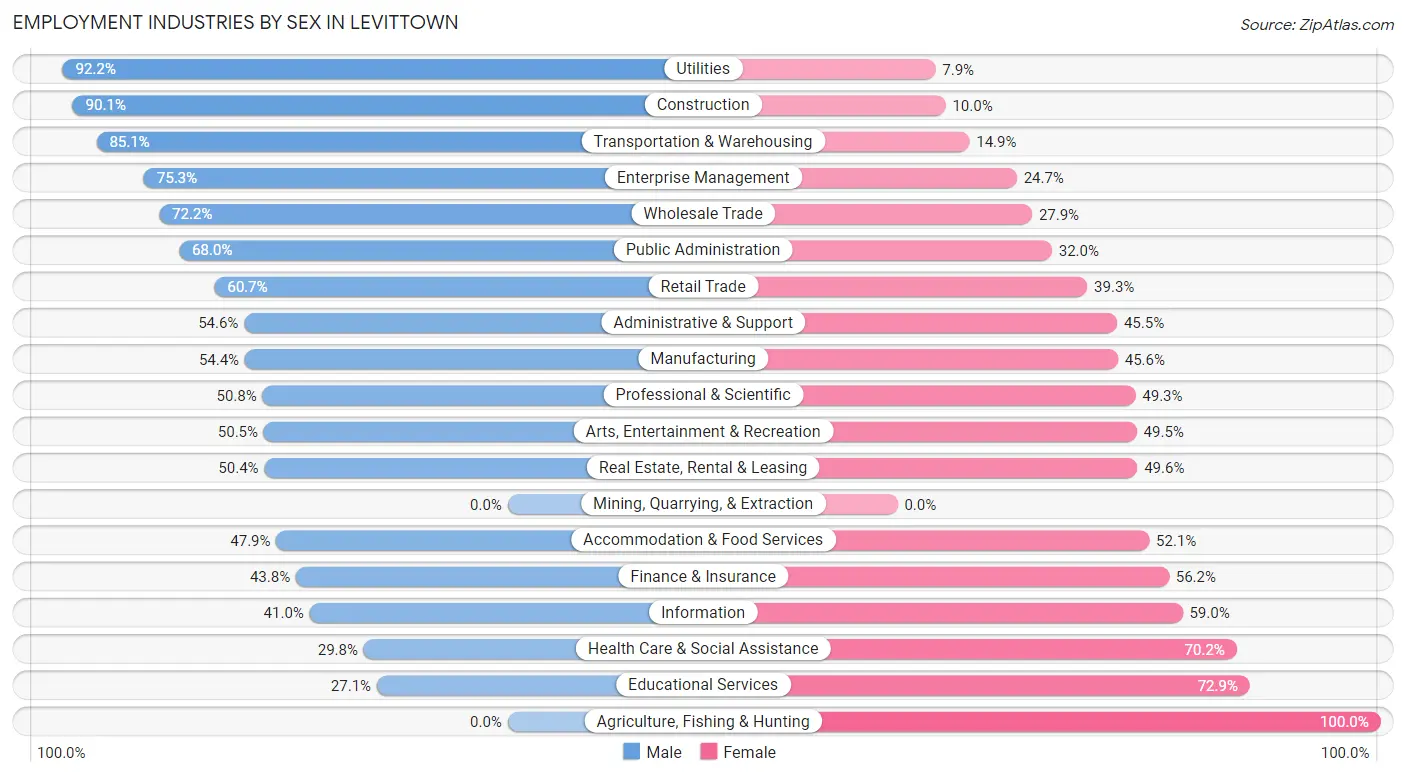
Employment Industries by Sex in Levittown
The Levittown industries that see more men than women are Utilities (92.1%), Construction (90.0%), and Transportation & Warehousing (85.1%), whereas the industries that tend to have a higher number of women are Agriculture, Fishing & Hunting (100.0%), Educational Services (72.9%), and Health Care & Social Assistance (70.2%).
| Industry | Male | Female |
| Agriculture, Fishing & Hunting | 0 (0.0%) | 5 (100.0%) |
| Mining, Quarrying, & Extraction | 0 (0.0%) | 0 (0.0%) |
| Construction | 1,583 (90.0%) | 175 (10.0%) |
| Manufacturing | 656 (54.4%) | 550 (45.6%) |
| Wholesale Trade | 596 (72.2%) | 230 (27.9%) |
| Retail Trade | 1,806 (60.7%) | 1,168 (39.3%) |
| Transportation & Warehousing | 1,190 (85.1%) | 208 (14.9%) |
| Utilities | 317 (92.1%) | 27 (7.9%) |
| Information | 237 (41.0%) | 341 (59.0%) |
| Finance & Insurance | 849 (43.8%) | 1,088 (56.2%) |
| Real Estate, Rental & Leasing | 279 (50.4%) | 275 (49.6%) |
| Professional & Scientific | 1,151 (50.7%) | 1,117 (49.2%) |
| Enterprise Management | 61 (75.3%) | 20 (24.7%) |
| Administrative & Support | 558 (54.5%) | 465 (45.5%) |
| Educational Services | 1,223 (27.1%) | 3,294 (72.9%) |
| Health Care & Social Assistance | 1,235 (29.8%) | 2,910 (70.2%) |
| Arts, Entertainment & Recreation | 265 (50.5%) | 260 (49.5%) |
| Accommodation & Food Services | 749 (47.9%) | 815 (52.1%) |
| Public Administration | 943 (68.0%) | 443 (32.0%) |
| Total | 14,238 (50.5%) | 13,972 (49.5%) |
Education in Levittown
School Enrollment in Levittown
The most common levels of schooling among the 10,789 students in Levittown are college / undergraduate (2,655 | 24.6%), high school (2,364 | 21.9%), and middle school (2,190 | 20.3%).
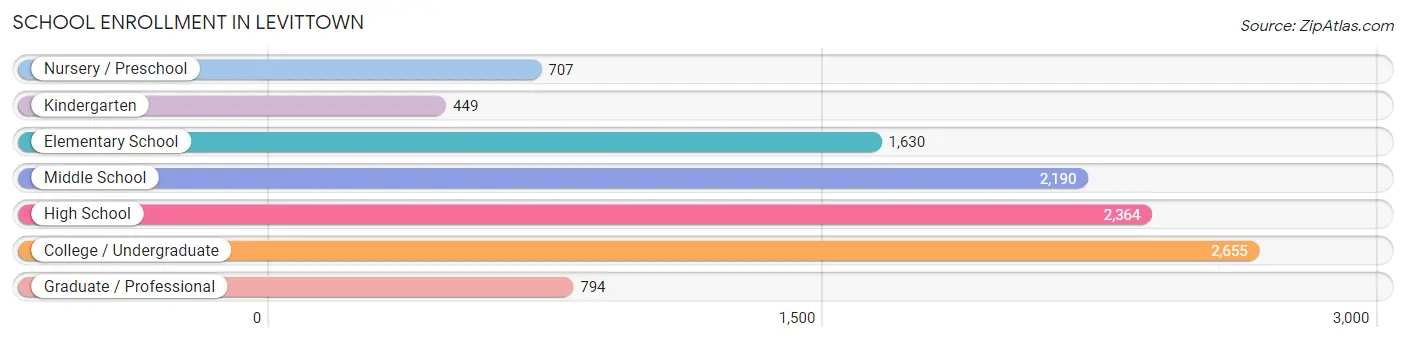
| School Level | # Students | % Students |
| Nursery / Preschool | 707 | 6.6% |
| Kindergarten | 449 | 4.2% |
| Elementary School | 1,630 | 15.1% |
| Middle School | 2,190 | 20.3% |
| High School | 2,364 | 21.9% |
| College / Undergraduate | 2,655 | 24.6% |
| Graduate / Professional | 794 | 7.4% |
| Total | 10,789 | 100.0% |
School Enrollment by Age by Funding Source in Levittown
Out of a total of 10,789 students who are enrolled in schools in Levittown, 2,244 (20.8%) attend a private institution, while the remaining 8,545 (79.2%) are enrolled in public schools. The age group of 25 to 34 year olds has the highest likelihood of being enrolled in private schools, with 312 (60.4% in the age bracket) enrolled. Conversely, the age group of 10 to 14 year olds has the lowest likelihood of being enrolled in a private school, with 2,427 (93.9% in the age bracket) attending a public institution.
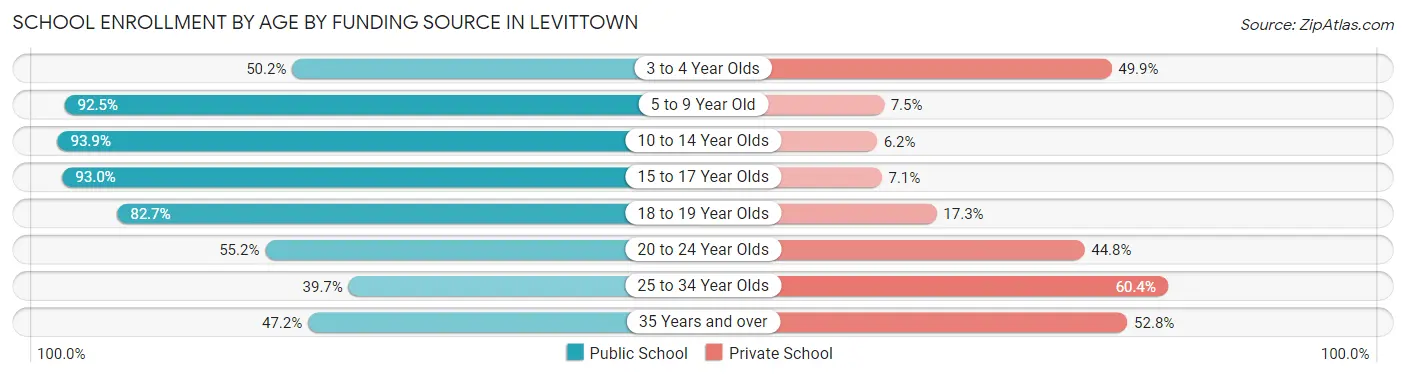
| Age Bracket | Public School | Private School |
| 3 to 4 Year Olds | 332 (50.1%) | 330 (49.8%) |
| 5 to 9 Year Old | 1,812 (92.5%) | 146 (7.5%) |
| 10 to 14 Year Olds | 2,427 (93.9%) | 159 (6.1%) |
| 15 to 17 Year Olds | 1,634 (92.9%) | 124 (7.0%) |
| 18 to 19 Year Olds | 1,025 (82.7%) | 214 (17.3%) |
| 20 to 24 Year Olds | 895 (55.2%) | 727 (44.8%) |
| 25 to 34 Year Olds | 205 (39.7%) | 312 (60.4%) |
| 35 Years and over | 211 (47.2%) | 236 (52.8%) |
| Total | 8,545 (79.2%) | 2,244 (20.8%) |
Educational Attainment by Field of Study in Levittown
Business (2,820 | 19.5%), science & technology (1,944 | 13.4%), education (1,882 | 13.0%), engineering (1,084 | 7.5%), and social sciences (947 | 6.6%) are the most common fields of study among 14,463 individuals in Levittown who have obtained a bachelor's degree or higher.
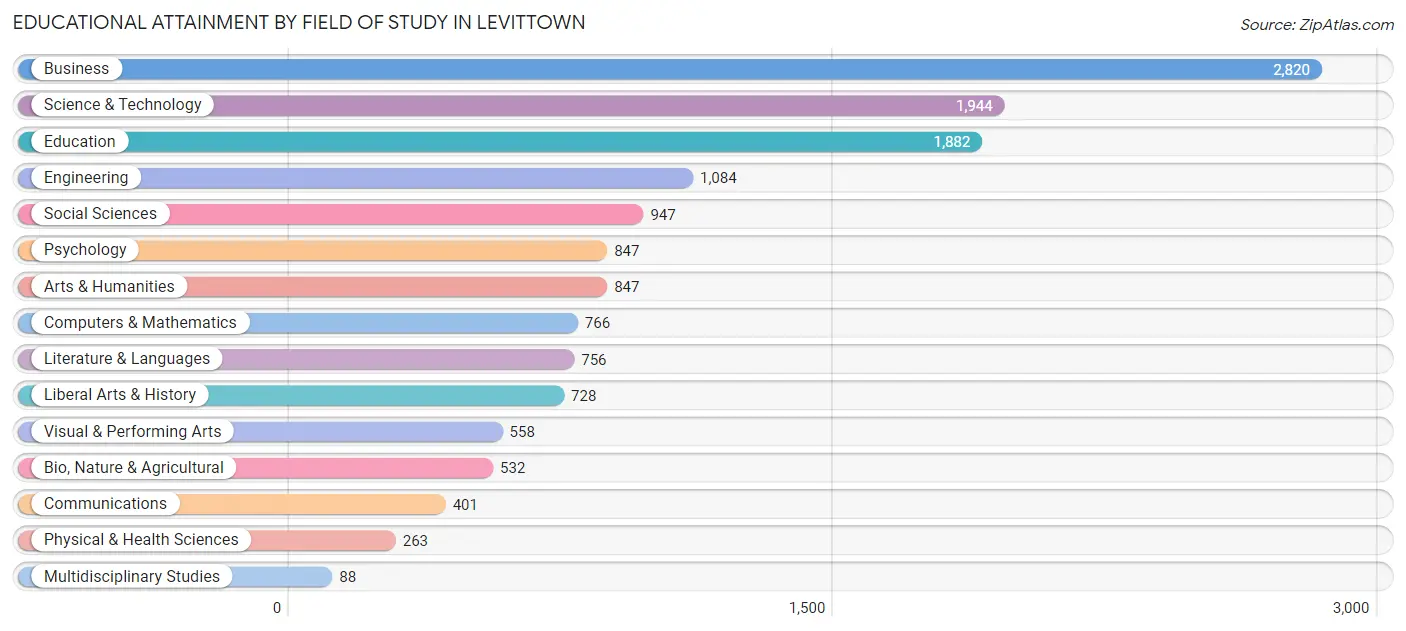
| Field of Study | # Graduates | % Graduates |
| Computers & Mathematics | 766 | 5.3% |
| Bio, Nature & Agricultural | 532 | 3.7% |
| Physical & Health Sciences | 263 | 1.8% |
| Psychology | 847 | 5.9% |
| Social Sciences | 947 | 6.6% |
| Engineering | 1,084 | 7.5% |
| Multidisciplinary Studies | 88 | 0.6% |
| Science & Technology | 1,944 | 13.4% |
| Business | 2,820 | 19.5% |
| Education | 1,882 | 13.0% |
| Literature & Languages | 756 | 5.2% |
| Liberal Arts & History | 728 | 5.0% |
| Visual & Performing Arts | 558 | 3.9% |
| Communications | 401 | 2.8% |
| Arts & Humanities | 847 | 5.9% |
| Total | 14,463 | 100.0% |
Transportation & Commute in Levittown
Vehicle Availability by Sex in Levittown
The most prevalent vehicle ownership categories in Levittown are males with 2 vehicles (5,537, accounting for 39.5%) and females with 2 vehicles (5,259, making up 40.6%).
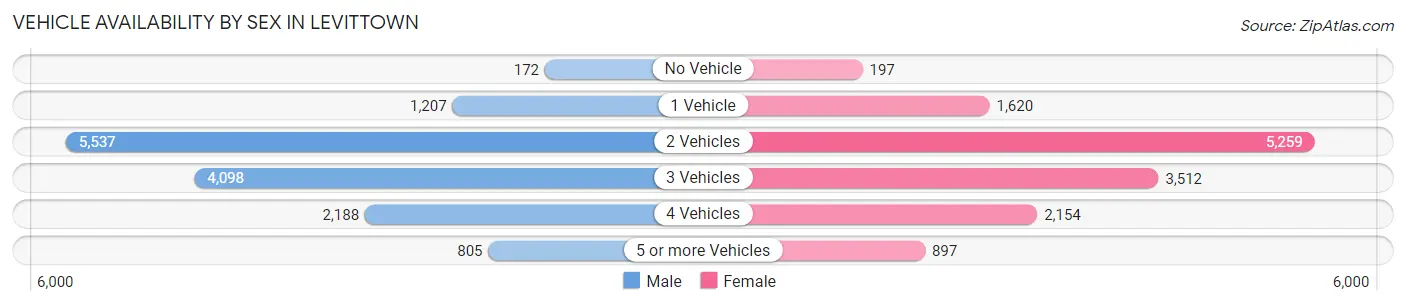
| Vehicles Available | Male | Female |
| No Vehicle | 172 (1.2%) | 197 (1.4%) |
| 1 Vehicle | 1,207 (8.6%) | 1,620 (11.9%) |
| 2 Vehicles | 5,537 (39.5%) | 5,259 (38.6%) |
| 3 Vehicles | 4,098 (29.3%) | 3,512 (25.8%) |
| 4 Vehicles | 2,188 (15.6%) | 2,154 (15.8%) |
| 5 or more Vehicles | 805 (5.8%) | 897 (6.6%) |
| Total | 14,007 (100.0%) | 13,639 (100.0%) |
Commute Time in Levittown
The most frequently occuring commute durations in Levittown are 30 to 34 minutes (3,753 commuters, 14.7%), 15 to 19 minutes (3,666 commuters, 14.4%), and 20 to 24 minutes (3,207 commuters, 12.6%).
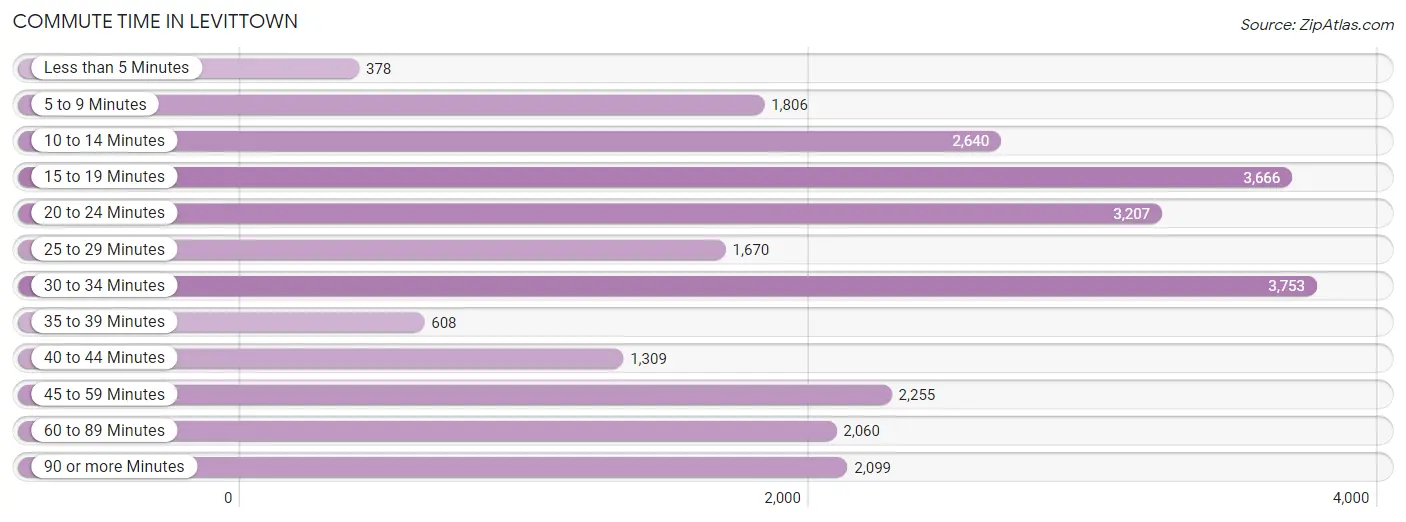
| Commute Time | # Commuters | % Commuters |
| Less than 5 Minutes | 378 | 1.5% |
| 5 to 9 Minutes | 1,806 | 7.1% |
| 10 to 14 Minutes | 2,640 | 10.4% |
| 15 to 19 Minutes | 3,666 | 14.4% |
| 20 to 24 Minutes | 3,207 | 12.6% |
| 25 to 29 Minutes | 1,670 | 6.6% |
| 30 to 34 Minutes | 3,753 | 14.7% |
| 35 to 39 Minutes | 608 | 2.4% |
| 40 to 44 Minutes | 1,309 | 5.1% |
| 45 to 59 Minutes | 2,255 | 8.9% |
| 60 to 89 Minutes | 2,060 | 8.1% |
| 90 or more Minutes | 2,099 | 8.3% |
Commute Time by Sex in Levittown
The most common commute times in Levittown are 15 to 19 minutes (2,030 commuters, 15.8%) for males and 30 to 34 minutes (2,091 commuters, 16.6%) for females.
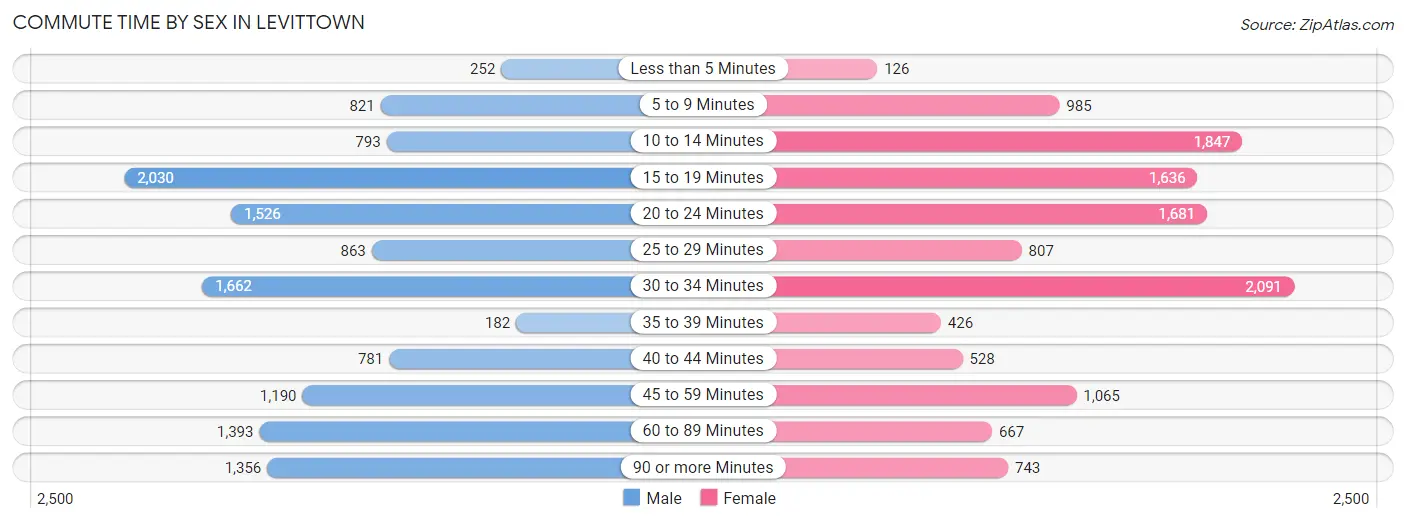
| Commute Time | Male | Female |
| Less than 5 Minutes | 252 (2.0%) | 126 (1.0%) |
| 5 to 9 Minutes | 821 (6.4%) | 985 (7.8%) |
| 10 to 14 Minutes | 793 (6.2%) | 1,847 (14.7%) |
| 15 to 19 Minutes | 2,030 (15.8%) | 1,636 (13.0%) |
| 20 to 24 Minutes | 1,526 (11.9%) | 1,681 (13.3%) |
| 25 to 29 Minutes | 863 (6.7%) | 807 (6.4%) |
| 30 to 34 Minutes | 1,662 (12.9%) | 2,091 (16.6%) |
| 35 to 39 Minutes | 182 (1.4%) | 426 (3.4%) |
| 40 to 44 Minutes | 781 (6.1%) | 528 (4.2%) |
| 45 to 59 Minutes | 1,190 (9.3%) | 1,065 (8.5%) |
| 60 to 89 Minutes | 1,393 (10.8%) | 667 (5.3%) |
| 90 or more Minutes | 1,356 (10.5%) | 743 (5.9%) |
Time of Departure to Work by Sex in Levittown
The most frequent times of departure to work in Levittown are 6:00 AM to 6:29 AM (1,701, 13.2%) for males and 7:00 AM to 7:29 AM (2,162, 17.2%) for females.
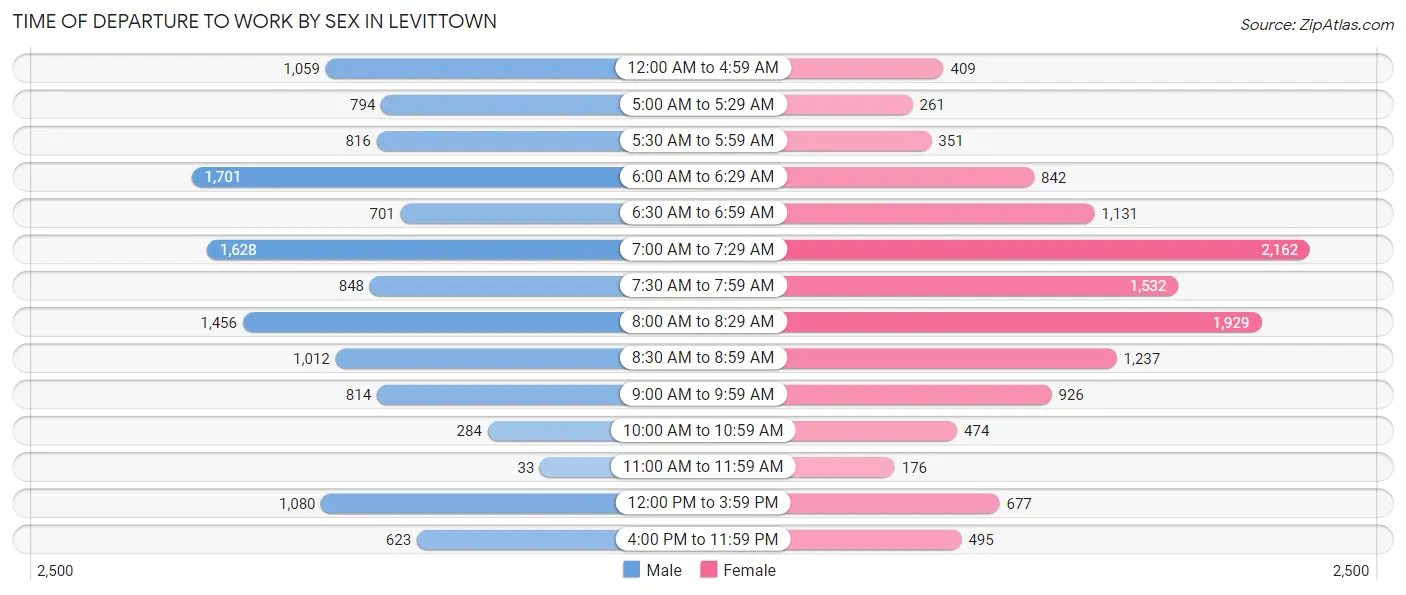
| Time of Departure | Male | Female |
| 12:00 AM to 4:59 AM | 1,059 (8.2%) | 409 (3.3%) |
| 5:00 AM to 5:29 AM | 794 (6.2%) | 261 (2.1%) |
| 5:30 AM to 5:59 AM | 816 (6.4%) | 351 (2.8%) |
| 6:00 AM to 6:29 AM | 1,701 (13.2%) | 842 (6.7%) |
| 6:30 AM to 6:59 AM | 701 (5.5%) | 1,131 (9.0%) |
| 7:00 AM to 7:29 AM | 1,628 (12.7%) | 2,162 (17.2%) |
| 7:30 AM to 7:59 AM | 848 (6.6%) | 1,532 (12.2%) |
| 8:00 AM to 8:29 AM | 1,456 (11.3%) | 1,929 (15.3%) |
| 8:30 AM to 8:59 AM | 1,012 (7.9%) | 1,237 (9.8%) |
| 9:00 AM to 9:59 AM | 814 (6.3%) | 926 (7.3%) |
| 10:00 AM to 10:59 AM | 284 (2.2%) | 474 (3.8%) |
| 11:00 AM to 11:59 AM | 33 (0.3%) | 176 (1.4%) |
| 12:00 PM to 3:59 PM | 1,080 (8.4%) | 677 (5.4%) |
| 4:00 PM to 11:59 PM | 623 (4.9%) | 495 (3.9%) |
| Total | 12,849 (100.0%) | 12,602 (100.0%) |
Housing Occupancy in Levittown
Occupancy by Ownership in Levittown
Of the total 16,833 dwellings in Levittown, owner-occupied units account for 15,901 (94.5%), while renter-occupied units make up 932 (5.5%).
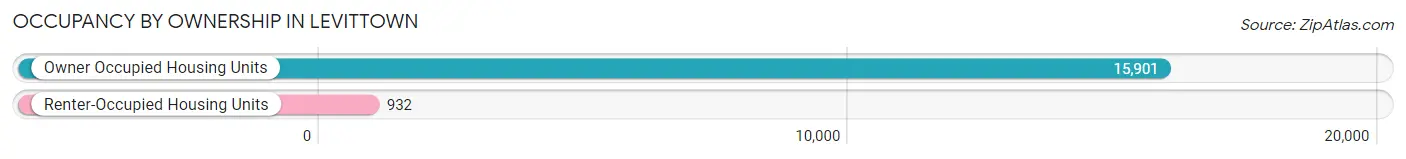
| Occupancy | # Housing Units | % Housing Units |
| Owner Occupied Housing Units | 15,901 | 94.5% |
| Renter-Occupied Housing Units | 932 | 5.5% |
| Total Occupied Housing Units | 16,833 | 100.0% |
Occupancy by Household Size in Levittown
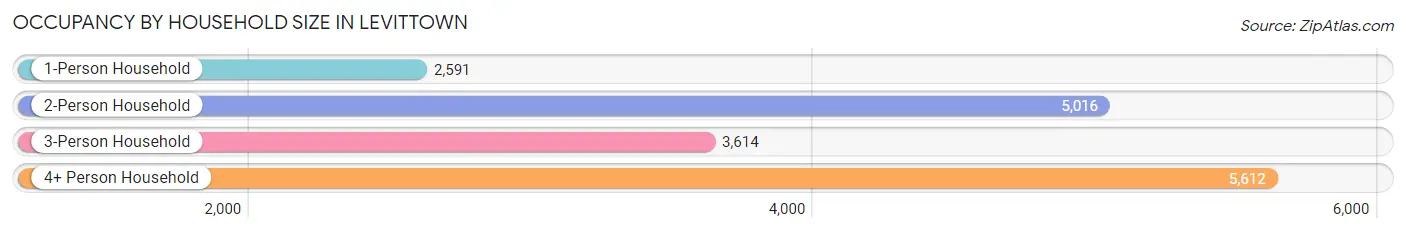
| Household Size | # Housing Units | % Housing Units |
| 1-Person Household | 2,591 | 15.4% |
| 2-Person Household | 5,016 | 29.8% |
| 3-Person Household | 3,614 | 21.5% |
| 4+ Person Household | 5,612 | 33.3% |
| Total Housing Units | 16,833 | 100.0% |
Occupancy by Ownership by Household Size in Levittown
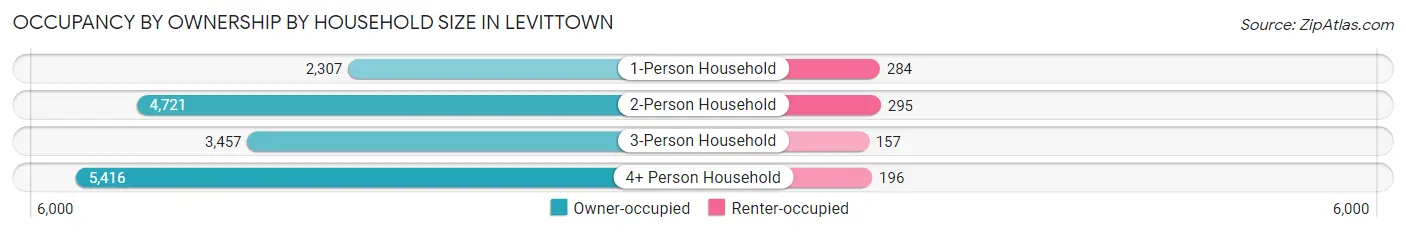
| Household Size | Owner-occupied | Renter-occupied |
| 1-Person Household | 2,307 (89.0%) | 284 (11.0%) |
| 2-Person Household | 4,721 (94.1%) | 295 (5.9%) |
| 3-Person Household | 3,457 (95.7%) | 157 (4.3%) |
| 4+ Person Household | 5,416 (96.5%) | 196 (3.5%) |
| Total Housing Units | 15,901 (94.5%) | 932 (5.5%) |
Occupancy by Educational Attainment in Levittown
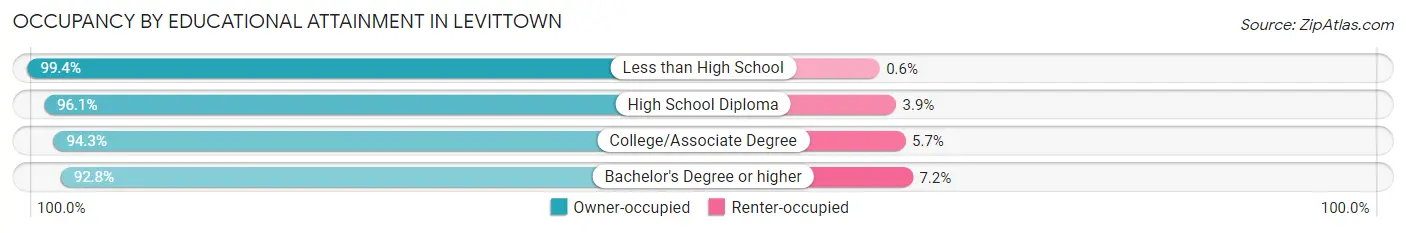
| Household Size | Owner-occupied | Renter-occupied |
| Less than High School | 833 (99.4%) | 5 (0.6%) |
| High School Diploma | 4,164 (96.1%) | 167 (3.9%) |
| College/Associate Degree | 5,108 (94.3%) | 311 (5.7%) |
| Bachelor's Degree or higher | 5,796 (92.8%) | 449 (7.2%) |
Occupancy by Age of Householder in Levittown
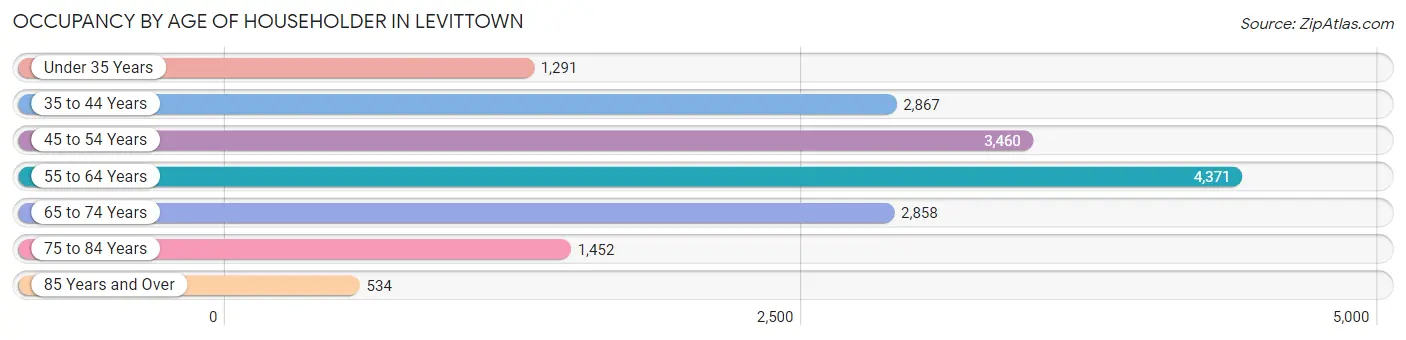
| Age Bracket | # Households | % Households |
| Under 35 Years | 1,291 | 7.7% |
| 35 to 44 Years | 2,867 | 17.0% |
| 45 to 54 Years | 3,460 | 20.5% |
| 55 to 64 Years | 4,371 | 26.0% |
| 65 to 74 Years | 2,858 | 17.0% |
| 75 to 84 Years | 1,452 | 8.6% |
| 85 Years and Over | 534 | 3.2% |
| Total | 16,833 | 100.0% |
Housing Finances in Levittown
Median Income by Occupancy in Levittown
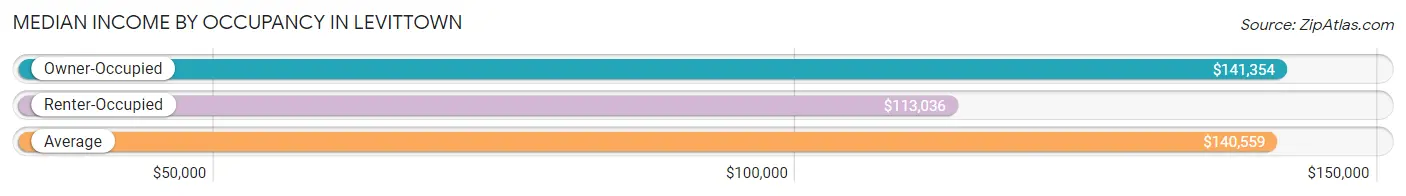
| Occupancy Type | # Households | Median Income |
| Owner-Occupied | 15,901 (94.5%) | $141,354 |
| Renter-Occupied | 932 (5.5%) | $113,036 |
| Average | 16,833 (100.0%) | $140,559 |
Occupancy by Householder Income Bracket in Levittown
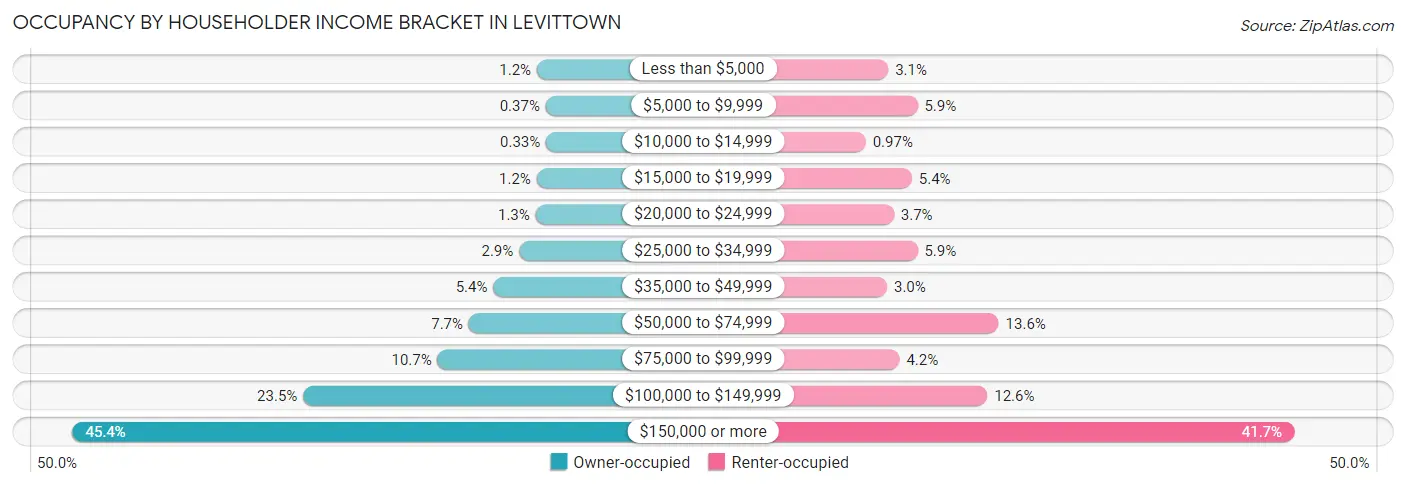
| Income Bracket | Owner-occupied | Renter-occupied |
| Less than $5,000 | 192 (1.2%) | 29 (3.1%) |
| $5,000 to $9,999 | 59 (0.4%) | 55 (5.9%) |
| $10,000 to $14,999 | 53 (0.3%) | 9 (1.0%) |
| $15,000 to $19,999 | 196 (1.2%) | 50 (5.4%) |
| $20,000 to $24,999 | 211 (1.3%) | 34 (3.6%) |
| $25,000 to $34,999 | 461 (2.9%) | 55 (5.9%) |
| $35,000 to $49,999 | 853 (5.4%) | 28 (3.0%) |
| $50,000 to $74,999 | 1,222 (7.7%) | 127 (13.6%) |
| $75,000 to $99,999 | 1,696 (10.7%) | 39 (4.2%) |
| $100,000 to $149,999 | 3,732 (23.5%) | 117 (12.6%) |
| $150,000 or more | 7,226 (45.4%) | 389 (41.7%) |
| Total | 15,901 (100.0%) | 932 (100.0%) |
Monthly Housing Cost Tiers in Levittown
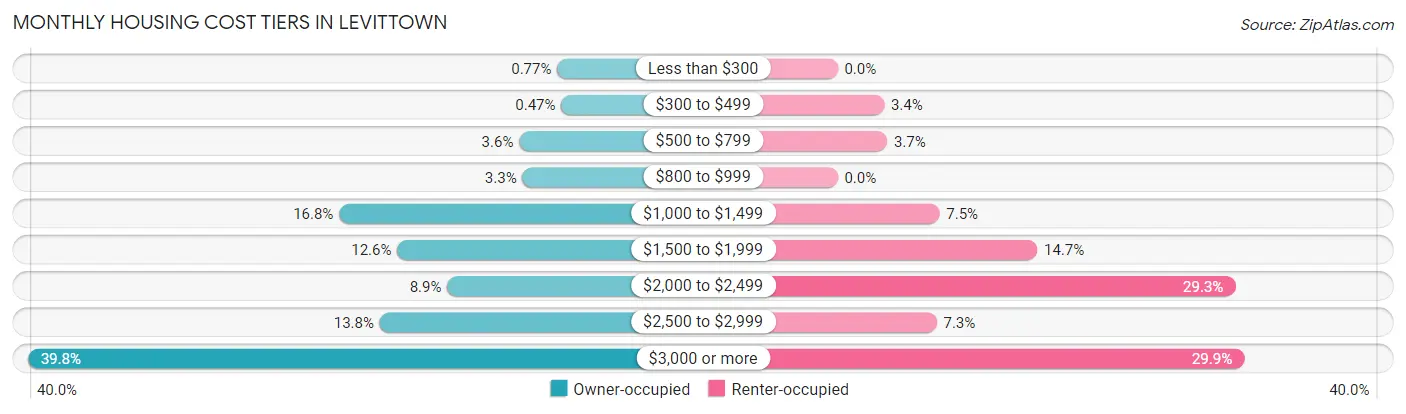
| Monthly Cost | Owner-occupied | Renter-occupied |
| Less than $300 | 122 (0.8%) | 0 (0.0%) |
| $300 to $499 | 74 (0.5%) | 32 (3.4%) |
| $500 to $799 | 568 (3.6%) | 34 (3.6%) |
| $800 to $999 | 530 (3.3%) | 0 (0.0%) |
| $1,000 to $1,499 | 2,676 (16.8%) | 70 (7.5%) |
| $1,500 to $1,999 | 1,995 (12.6%) | 137 (14.7%) |
| $2,000 to $2,499 | 1,411 (8.9%) | 273 (29.3%) |
| $2,500 to $2,999 | 2,201 (13.8%) | 68 (7.3%) |
| $3,000 or more | 6,324 (39.8%) | 279 (29.9%) |
| Total | 15,901 (100.0%) | 932 (100.0%) |
Physical Housing Characteristics in Levittown
Housing Structures in Levittown
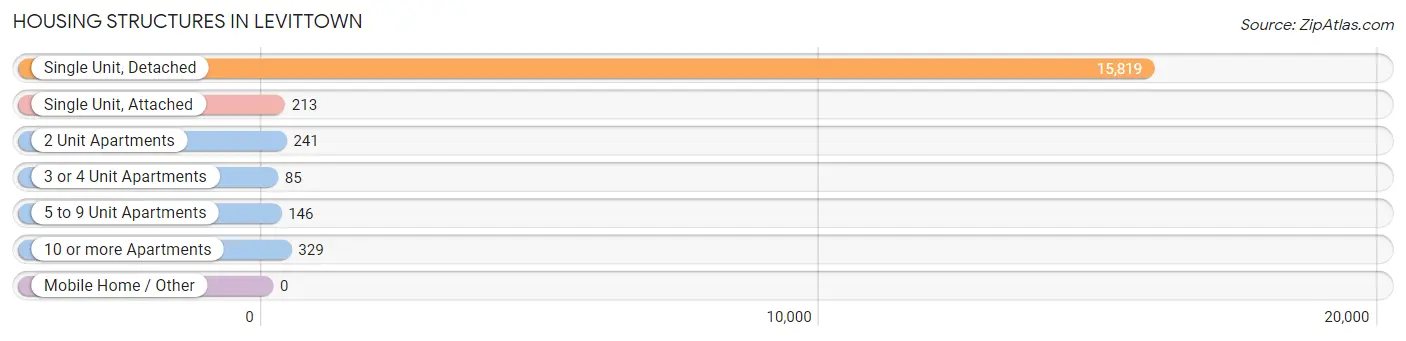
| Structure Type | # Housing Units | % Housing Units |
| Single Unit, Detached | 15,819 | 94.0% |
| Single Unit, Attached | 213 | 1.3% |
| 2 Unit Apartments | 241 | 1.4% |
| 3 or 4 Unit Apartments | 85 | 0.5% |
| 5 to 9 Unit Apartments | 146 | 0.9% |
| 10 or more Apartments | 329 | 1.9% |
| Mobile Home / Other | 0 | 0.0% |
| Total | 16,833 | 100.0% |
Housing Structures by Occupancy in Levittown
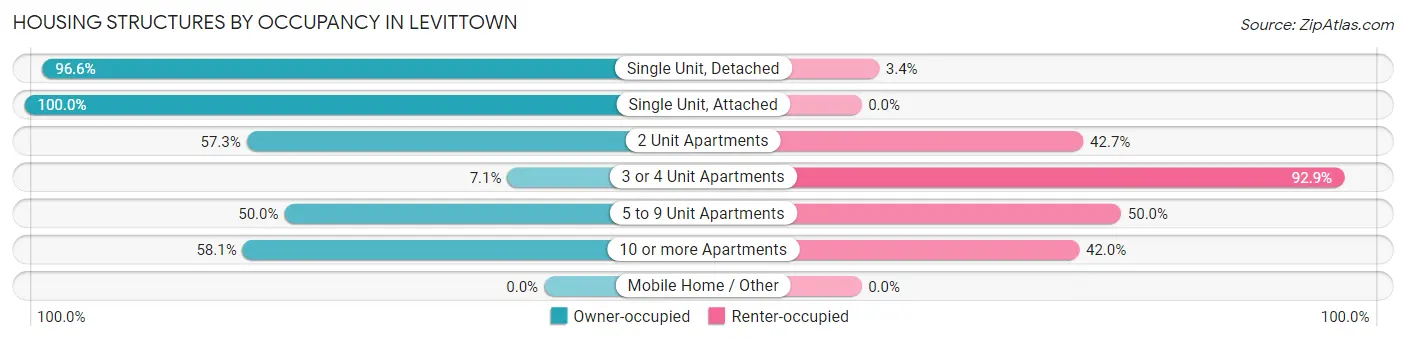
| Structure Type | Owner-occupied | Renter-occupied |
| Single Unit, Detached | 15,280 (96.6%) | 539 (3.4%) |
| Single Unit, Attached | 213 (100.0%) | 0 (0.0%) |
| 2 Unit Apartments | 138 (57.3%) | 103 (42.7%) |
| 3 or 4 Unit Apartments | 6 (7.1%) | 79 (92.9%) |
| 5 to 9 Unit Apartments | 73 (50.0%) | 73 (50.0%) |
| 10 or more Apartments | 191 (58.1%) | 138 (41.9%) |
| Mobile Home / Other | 0 (0.0%) | 0 (0.0%) |
| Total | 15,901 (94.5%) | 932 (5.5%) |
Housing Structures by Number of Rooms in Levittown
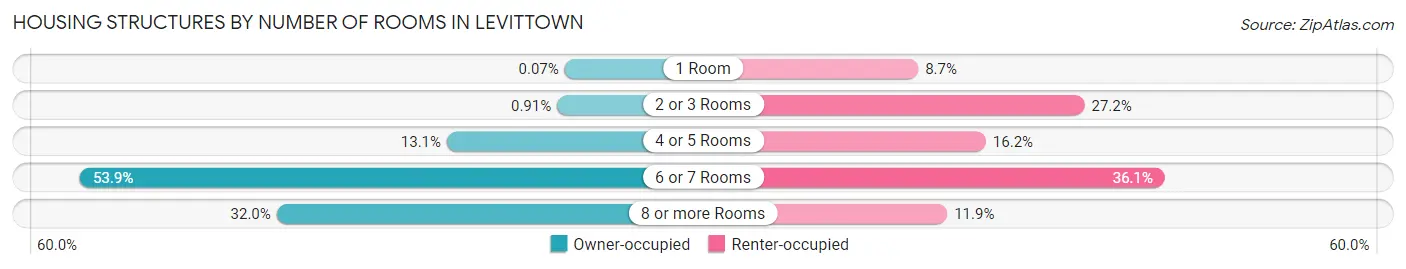
| Number of Rooms | Owner-occupied | Renter-occupied |
| 1 Room | 11 (0.1%) | 81 (8.7%) |
| 2 or 3 Rooms | 144 (0.9%) | 253 (27.2%) |
| 4 or 5 Rooms | 2,090 (13.1%) | 151 (16.2%) |
| 6 or 7 Rooms | 8,563 (53.8%) | 336 (36.0%) |
| 8 or more Rooms | 5,093 (32.0%) | 111 (11.9%) |
| Total | 15,901 (100.0%) | 932 (100.0%) |
Housing Structure by Heating Type in Levittown
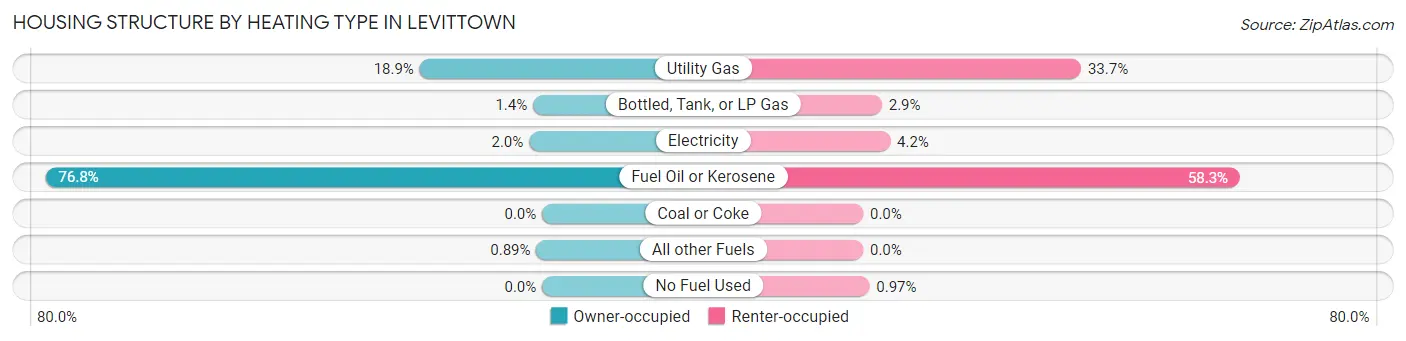
| Heating Type | Owner-occupied | Renter-occupied |
| Utility Gas | 3,008 (18.9%) | 314 (33.7%) |
| Bottled, Tank, or LP Gas | 222 (1.4%) | 27 (2.9%) |
| Electricity | 320 (2.0%) | 39 (4.2%) |
| Fuel Oil or Kerosene | 12,209 (76.8%) | 543 (58.3%) |
| Coal or Coke | 0 (0.0%) | 0 (0.0%) |
| All other Fuels | 142 (0.9%) | 0 (0.0%) |
| No Fuel Used | 0 (0.0%) | 9 (1.0%) |
| Total | 15,901 (100.0%) | 932 (100.0%) |
Household Vehicle Usage in Levittown
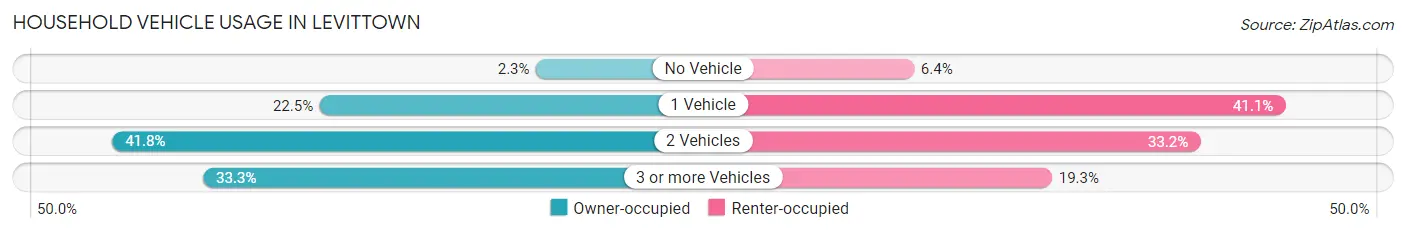
| Vehicles per Household | Owner-occupied | Renter-occupied |
| No Vehicle | 369 (2.3%) | 60 (6.4%) |
| 1 Vehicle | 3,581 (22.5%) | 383 (41.1%) |
| 2 Vehicles | 6,650 (41.8%) | 309 (33.2%) |
| 3 or more Vehicles | 5,301 (33.3%) | 180 (19.3%) |
| Total | 15,901 (100.0%) | 932 (100.0%) |
Real Estate & Mortgages in Levittown
Real Estate and Mortgage Overview in Levittown
| Characteristic | Without Mortgage | With Mortgage |
| Housing Units | 5,548 | 10,353 |
| Median Property Value | $479,900 | $538,400 |
| Median Household Income | $105,240 | $5,501 |
| Monthly Housing Costs | $1,340 | $6,321 |
| Real Estate Taxes | $10,001 | $104 |
Property Value by Mortgage Status in Levittown
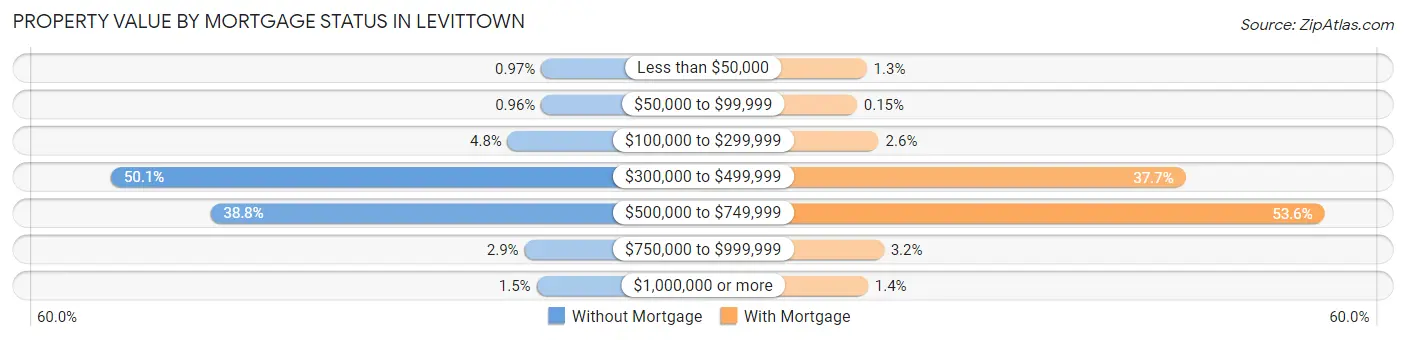
| Property Value | Without Mortgage | With Mortgage |
| Less than $50,000 | 54 (1.0%) | 132 (1.3%) |
| $50,000 to $99,999 | 53 (1.0%) | 16 (0.2%) |
| $100,000 to $299,999 | 266 (4.8%) | 273 (2.6%) |
| $300,000 to $499,999 | 2,781 (50.1%) | 3,904 (37.7%) |
| $500,000 to $749,999 | 2,151 (38.8%) | 5,549 (53.6%) |
| $750,000 to $999,999 | 160 (2.9%) | 333 (3.2%) |
| $1,000,000 or more | 83 (1.5%) | 146 (1.4%) |
| Total | 5,548 (100.0%) | 10,353 (100.0%) |
Household Income by Mortgage Status in Levittown
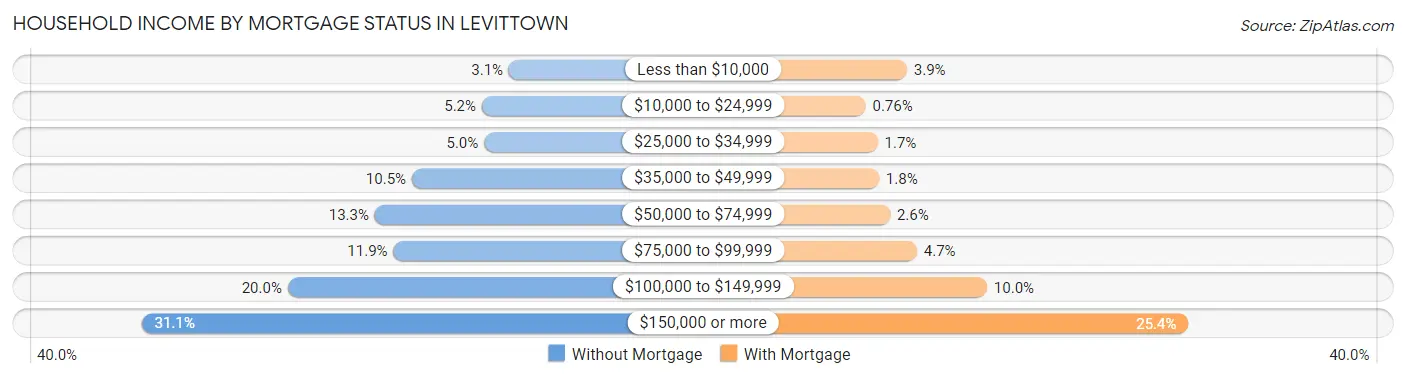
| Household Income | Without Mortgage | With Mortgage |
| Less than $10,000 | 172 (3.1%) | 405 (3.9%) |
| $10,000 to $24,999 | 286 (5.2%) | 79 (0.8%) |
| $25,000 to $34,999 | 277 (5.0%) | 174 (1.7%) |
| $35,000 to $49,999 | 582 (10.5%) | 184 (1.8%) |
| $50,000 to $74,999 | 739 (13.3%) | 271 (2.6%) |
| $75,000 to $99,999 | 660 (11.9%) | 483 (4.7%) |
| $100,000 to $149,999 | 1,107 (20.0%) | 1,036 (10.0%) |
| $150,000 or more | 1,725 (31.1%) | 2,625 (25.4%) |
| Total | 5,548 (100.0%) | 10,353 (100.0%) |
Property Value to Household Income Ratio in Levittown
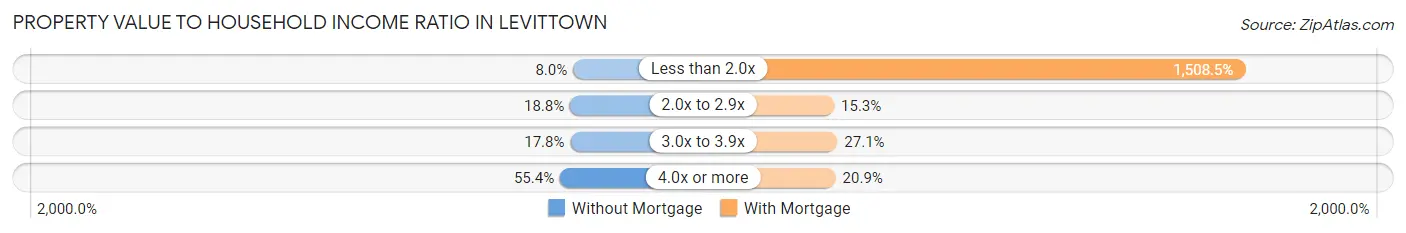
| Value-to-Income Ratio | Without Mortgage | With Mortgage |
| Less than 2.0x | 443 (8.0%) | 156,176 (1,508.5%) |
| 2.0x to 2.9x | 1,042 (18.8%) | 1,586 (15.3%) |
| 3.0x to 3.9x | 985 (17.7%) | 2,810 (27.1%) |
| 4.0x or more | 3,073 (55.4%) | 2,161 (20.9%) |
| Total | 5,548 (100.0%) | 10,353 (100.0%) |
Real Estate Taxes by Mortgage Status in Levittown
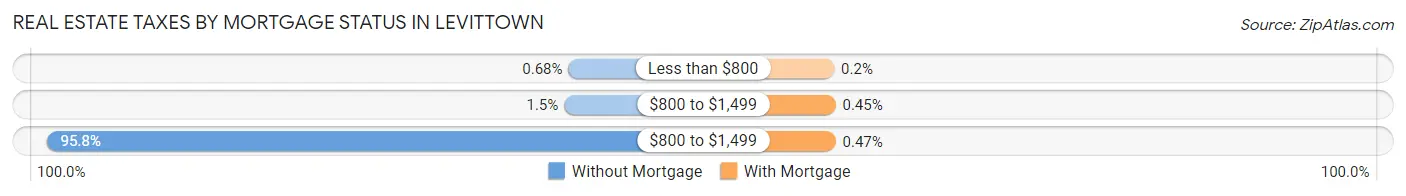
| Property Taxes | Without Mortgage | With Mortgage |
| Less than $800 | 38 (0.7%) | 21 (0.2%) |
| $800 to $1,499 | 81 (1.5%) | 47 (0.4%) |
| $800 to $1,499 | 5,315 (95.8%) | 49 (0.5%) |
| Total | 5,548 (100.0%) | 10,353 (100.0%) |
Health & Disability in Levittown
Health Insurance Coverage by Age in Levittown
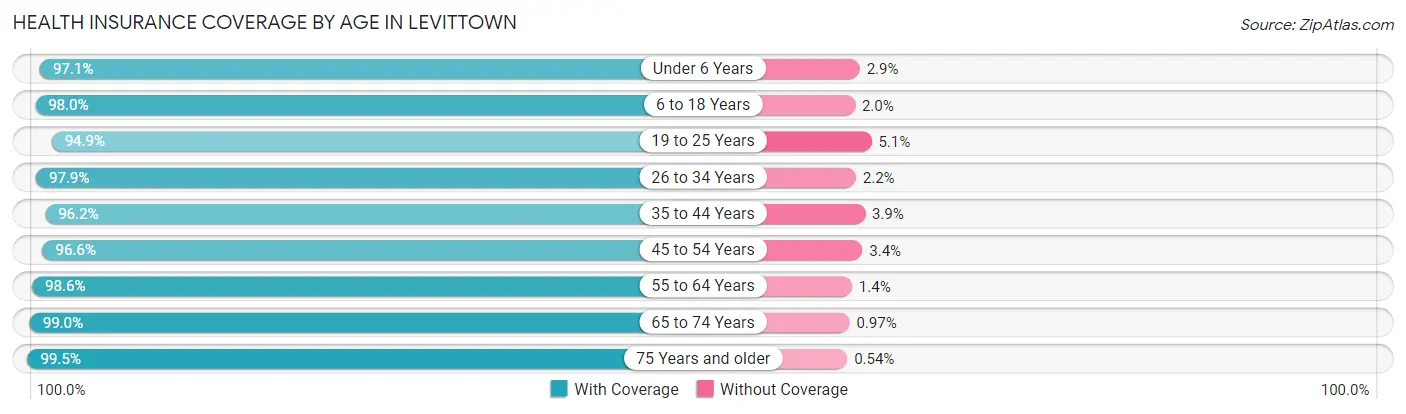
| Age Bracket | With Coverage | Without Coverage |
| Under 6 Years | 2,971 (97.1%) | 88 (2.9%) |
| 6 to 18 Years | 6,927 (98.0%) | 141 (2.0%) |
| 19 to 25 Years | 4,789 (94.9%) | 255 (5.1%) |
| 26 to 34 Years | 5,272 (97.9%) | 116 (2.1%) |
| 35 to 44 Years | 6,022 (96.2%) | 241 (3.8%) |
| 45 to 54 Years | 6,639 (96.6%) | 231 (3.4%) |
| 55 to 64 Years | 8,584 (98.6%) | 124 (1.4%) |
| 65 to 74 Years | 5,204 (99.0%) | 51 (1.0%) |
| 75 Years and older | 3,132 (99.5%) | 17 (0.5%) |
| Total | 49,540 (97.5%) | 1,264 (2.5%) |
Health Insurance Coverage by Citizenship Status in Levittown
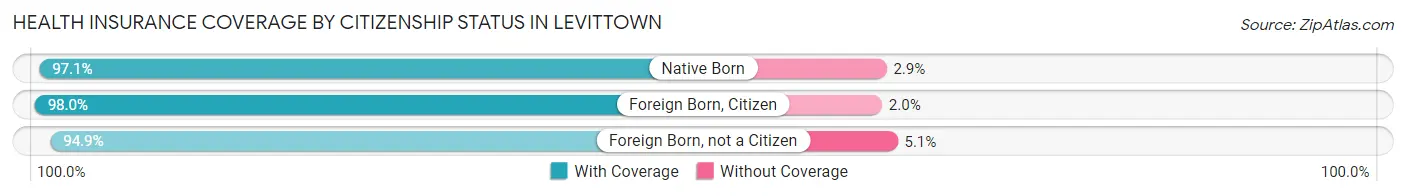
| Citizenship Status | With Coverage | Without Coverage |
| Native Born | 2,971 (97.1%) | 88 (2.9%) |
| Foreign Born, Citizen | 6,927 (98.0%) | 141 (2.0%) |
| Foreign Born, not a Citizen | 4,789 (94.9%) | 255 (5.1%) |
Health Insurance Coverage by Household Income in Levittown
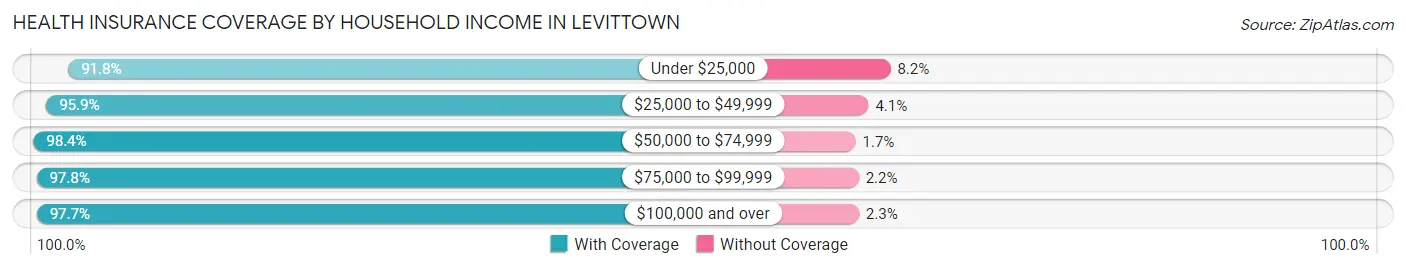
| Household Income | With Coverage | Without Coverage |
| Under $25,000 | 1,314 (91.8%) | 117 (8.2%) |
| $25,000 to $49,999 | 2,600 (95.9%) | 110 (4.1%) |
| $50,000 to $74,999 | 3,390 (98.4%) | 57 (1.7%) |
| $75,000 to $99,999 | 3,983 (97.8%) | 91 (2.2%) |
| $100,000 and over | 38,124 (97.7%) | 887 (2.3%) |
Public vs Private Health Insurance Coverage by Age in Levittown
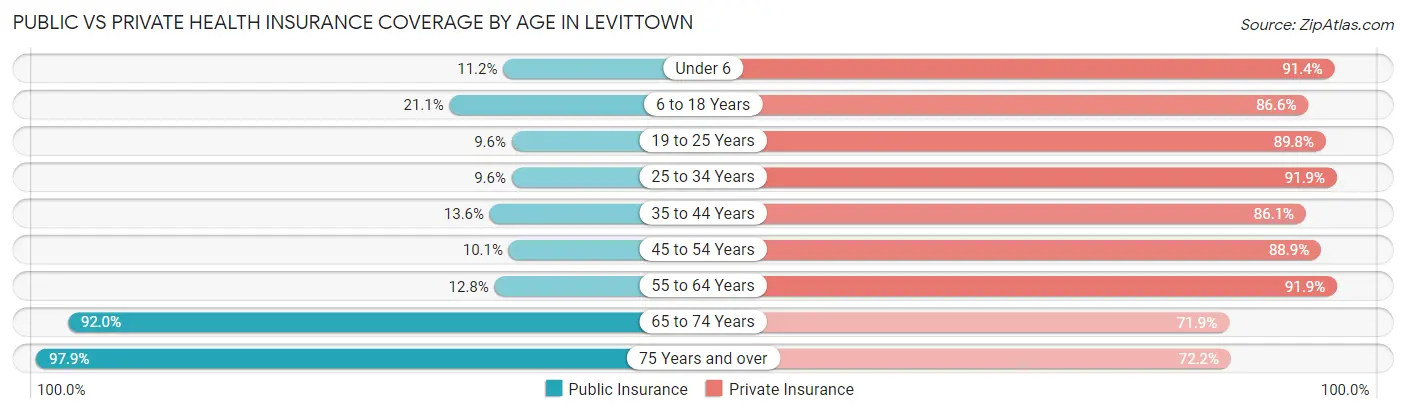
| Age Bracket | Public Insurance | Private Insurance |
| Under 6 | 341 (11.2%) | 2,797 (91.4%) |
| 6 to 18 Years | 1,493 (21.1%) | 6,119 (86.6%) |
| 19 to 25 Years | 482 (9.6%) | 4,531 (89.8%) |
| 25 to 34 Years | 515 (9.6%) | 4,951 (91.9%) |
| 35 to 44 Years | 854 (13.6%) | 5,395 (86.1%) |
| 45 to 54 Years | 696 (10.1%) | 6,110 (88.9%) |
| 55 to 64 Years | 1,111 (12.8%) | 8,005 (91.9%) |
| 65 to 74 Years | 4,833 (92.0%) | 3,776 (71.9%) |
| 75 Years and over | 3,082 (97.9%) | 2,274 (72.2%) |
| Total | 13,407 (26.4%) | 43,958 (86.5%) |
Disability Status by Sex by Age in Levittown
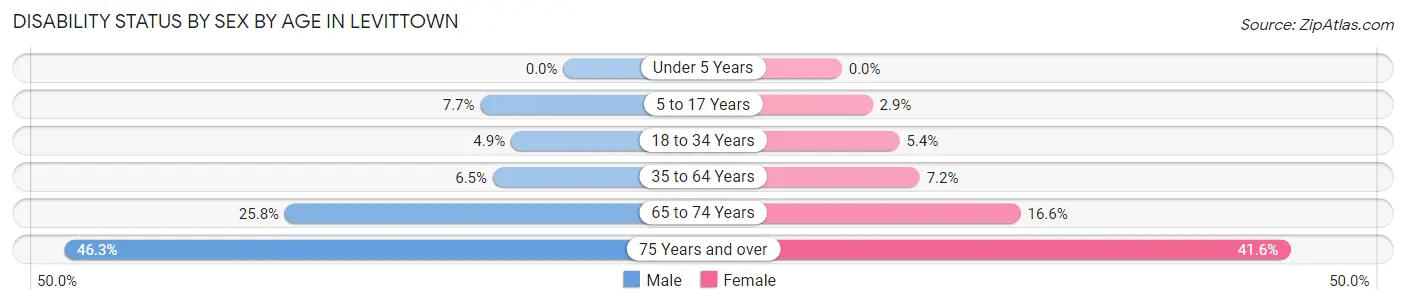
| Age Bracket | Male | Female |
| Under 5 Years | 0 (0.0%) | 0 (0.0%) |
| 5 to 17 Years | 244 (7.7%) | 98 (2.9%) |
| 18 to 34 Years | 279 (4.9%) | 298 (5.4%) |
| 35 to 64 Years | 701 (6.5%) | 805 (7.2%) |
| 65 to 74 Years | 590 (25.8%) | 493 (16.6%) |
| 75 Years and over | 588 (46.3%) | 782 (41.6%) |
Disability Class by Sex by Age in Levittown
Disability Class: Hearing Difficulty
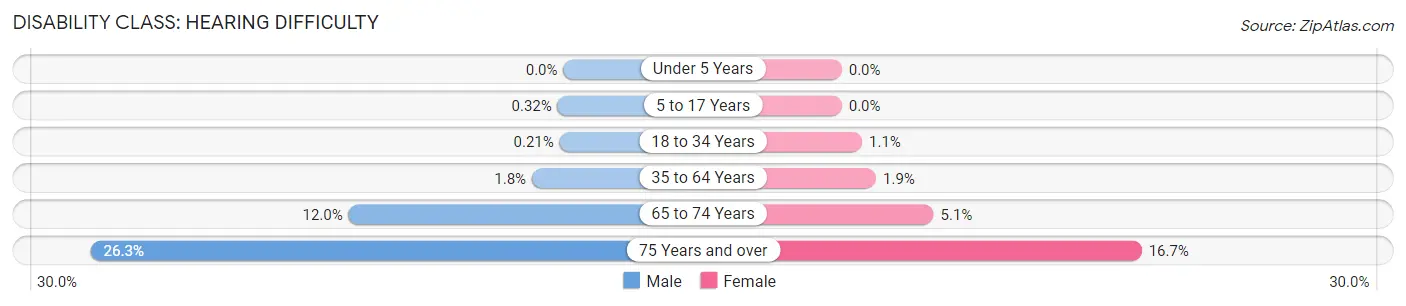
| Age Bracket | Male | Female |
| Under 5 Years | 0 (0.0%) | 0 (0.0%) |
| 5 to 17 Years | 10 (0.3%) | 0 (0.0%) |
| 18 to 34 Years | 12 (0.2%) | 63 (1.1%) |
| 35 to 64 Years | 187 (1.8%) | 213 (1.9%) |
| 65 to 74 Years | 273 (12.0%) | 152 (5.1%) |
| 75 Years and over | 334 (26.3%) | 314 (16.7%) |
Disability Class: Vision Difficulty
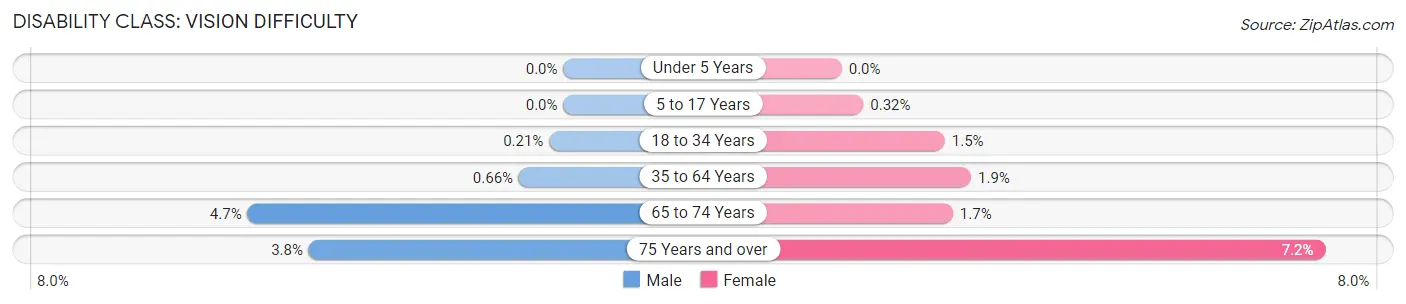
| Age Bracket | Male | Female |
| Under 5 Years | 0 (0.0%) | 0 (0.0%) |
| 5 to 17 Years | 0 (0.0%) | 11 (0.3%) |
| 18 to 34 Years | 12 (0.2%) | 85 (1.5%) |
| 35 to 64 Years | 71 (0.7%) | 214 (1.9%) |
| 65 to 74 Years | 107 (4.7%) | 49 (1.7%) |
| 75 Years and over | 48 (3.8%) | 135 (7.2%) |
Disability Class: Cognitive Difficulty
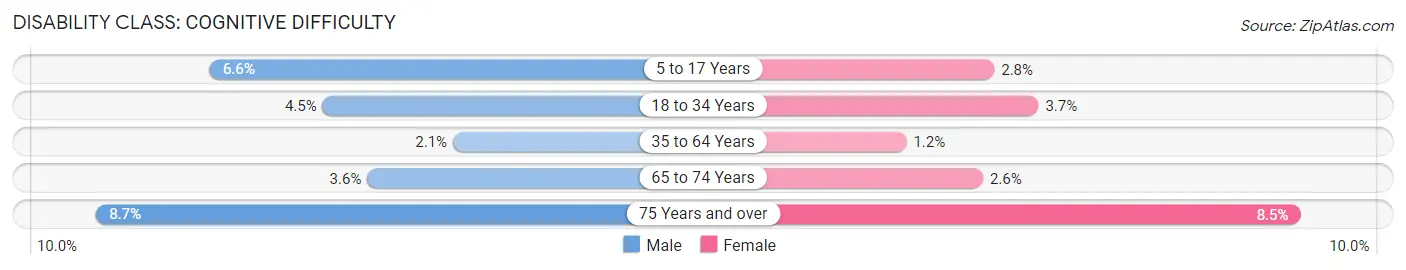
| Age Bracket | Male | Female |
| 5 to 17 Years | 208 (6.6%) | 97 (2.8%) |
| 18 to 34 Years | 257 (4.5%) | 203 (3.6%) |
| 35 to 64 Years | 220 (2.1%) | 134 (1.2%) |
| 65 to 74 Years | 83 (3.6%) | 78 (2.6%) |
| 75 Years and over | 110 (8.7%) | 160 (8.5%) |
Disability Class: Ambulatory Difficulty
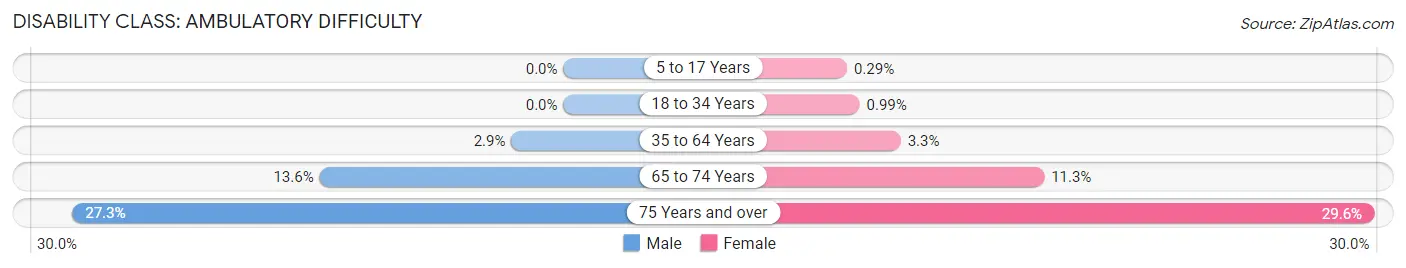
| Age Bracket | Male | Female |
| 5 to 17 Years | 0 (0.0%) | 10 (0.3%) |
| 18 to 34 Years | 0 (0.0%) | 55 (1.0%) |
| 35 to 64 Years | 311 (2.9%) | 365 (3.3%) |
| 65 to 74 Years | 310 (13.6%) | 335 (11.3%) |
| 75 Years and over | 347 (27.3%) | 557 (29.6%) |
Disability Class: Self-Care Difficulty
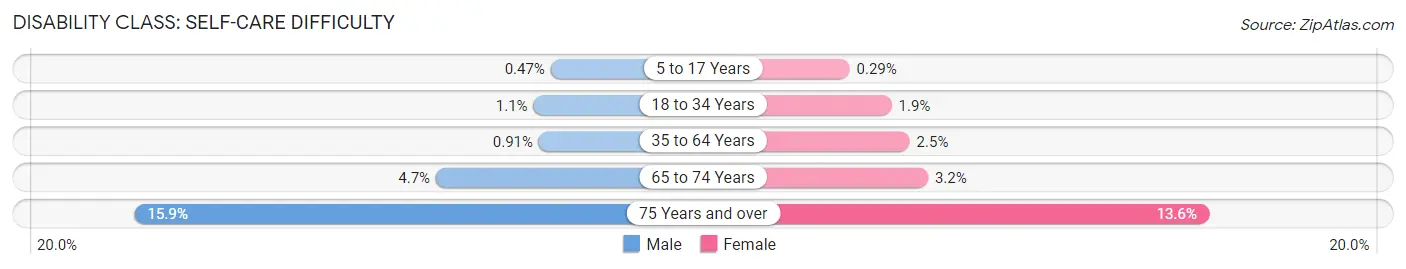
| Age Bracket | Male | Female |
| 5 to 17 Years | 15 (0.5%) | 10 (0.3%) |
| 18 to 34 Years | 64 (1.1%) | 103 (1.8%) |
| 35 to 64 Years | 98 (0.9%) | 280 (2.5%) |
| 65 to 74 Years | 108 (4.7%) | 95 (3.2%) |
| 75 Years and over | 202 (15.9%) | 256 (13.6%) |
Technology Access in Levittown
Computing Device Access in Levittown
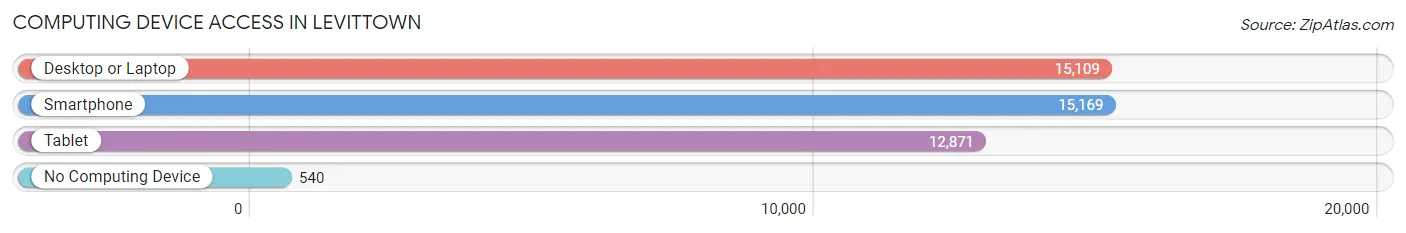
| Device Type | # Households | % Households |
| Desktop or Laptop | 15,109 | 89.8% |
| Smartphone | 15,169 | 90.1% |
| Tablet | 12,871 | 76.5% |
| No Computing Device | 540 | 3.2% |
| Total | 16,833 | 100.0% |
Internet Access in Levittown
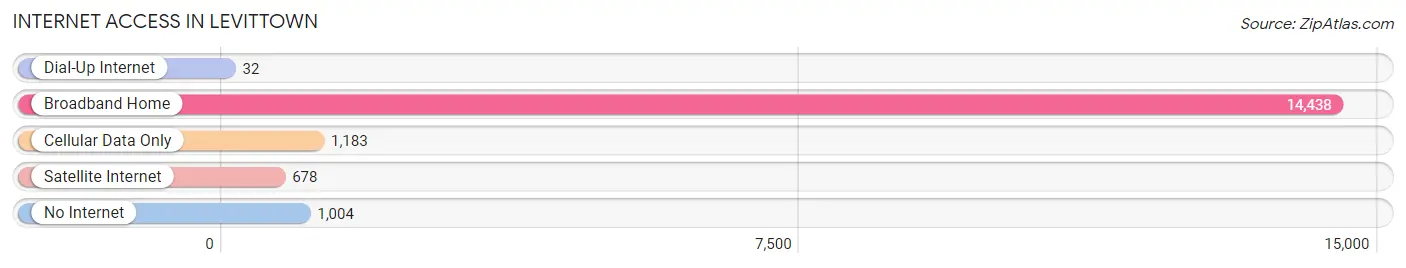
| Internet Type | # Households | % Households |
| Dial-Up Internet | 32 | 0.2% |
| Broadband Home | 14,438 | 85.8% |
| Cellular Data Only | 1,183 | 7.0% |
| Satellite Internet | 678 | 4.0% |
| No Internet | 1,004 | 6.0% |
| Total | 16,833 | 100.0% |
Levittown Summary
Levittown, NY is a hamlet located in the Town of Hempstead in Nassau County, New York. It is located on Long Island, approximately 25 miles east of Manhattan. Levittown is one of the most famous and iconic suburbs in the United States, and is often cited as the first modern American suburb. It was developed in the late 1940s and early 1950s by William Levitt, who is credited with popularizing the concept of mass-produced housing.
History
Levittown was developed in the late 1940s and early 1950s by William Levitt, who is credited with popularizing the concept of mass-produced housing. Levitt had previously developed a similar community in Bucks County, Pennsylvania, and he used the same model for Levittown, NY. The community was designed to provide affordable housing for returning World War II veterans and their families. The homes were designed to be simple and efficient, and were constructed using a modular assembly line process. The first homes were completed in 1947, and the community quickly grew in popularity. By 1951, Levittown had grown to a population of over 17,000 people.
Geography
Levittown is located in the Town of Hempstead in Nassau County, New York. It is located on Long Island, approximately 25 miles east of Manhattan. The community is bordered by the communities of East Meadow, Wantagh, and Seaford. Levittown is located in the Nassau-Suffolk metropolitan area, which is part of the larger New York metropolitan area.
The community is situated on a flat plain, with an elevation of approximately 20 feet above sea level. The climate is temperate, with hot summers and cold winters. The average annual temperature is around 50 degrees Fahrenheit.
Economy
Levittown is primarily a residential community, and the majority of its residents are employed in the surrounding communities. The largest employers in the area are the Nassau County government, the Northwell Health System, and the Long Island Rail Road. Other major employers include the Town of Hempstead, the Nassau County Police Department, and the Nassau County Fire Department.
Demographics
As of the 2010 census, the population of Levittown was 51,881. The racial makeup of the community was 79.3% White, 8.3% African American, 0.3% Native American, 5.2% Asian, and 6.9% from other races. The median household income was $90,837, and the median family income was $97,945. The per capita income was $35,945.
Levittown is a diverse community, with a variety of religious and cultural backgrounds. The largest religious denominations are Catholic, Protestant, and Jewish. The community is also home to a large number of immigrants from Latin America, Asia, and the Middle East.
Common Questions
What is Per Capita Income in Levittown?
Per Capita income in Levittown is $51,562.
What is the Median Family Income in Levittown?
Median Family Income in Levittown is $151,189.
What is the Median Household income in Levittown?
Median Household Income in Levittown is $140,559.
What is Income or Wage Gap in Levittown?
Income or Wage Gap in Levittown is 39.8%.
Women in Levittown earn 60.2 cents for every dollar earned by a man.
What is Inequality or Gini Index in Levittown?
Inequality or Gini Index in Levittown is 0.35.
What is the Total Population of Levittown?
Total Population of Levittown is 50,804.
What is the Total Male Population of Levittown?
Total Male Population of Levittown is 24,559.
What is the Total Female Population of Levittown?
Total Female Population of Levittown is 26,245.
What is the Ratio of Males per 100 Females in Levittown?
There are 93.58 Males per 100 Females in Levittown.
What is the Ratio of Females per 100 Males in Levittown?
There are 106.87 Females per 100 Males in Levittown.
What is the Median Population Age in Levittown?
Median Population Age in Levittown is 42.3 Years.
What is the Average Family Size in Levittown
Average Family Size in Levittown is 3.4 People.
What is the Average Household Size in Levittown
Average Household Size in Levittown is 3.0 People.
How Large is the Labor Force in Levittown?
There are 29,844 People in the Labor Forcein in Levittown.
What is the Percentage of People in the Labor Force in Levittown?
70.1% of People are in the Labor Force in Levittown.
What is the Unemployment Rate in Levittown?
Unemployment Rate in Levittown is 5.4%.