Lake Erie Beach, NY Map & Demographics
Lake Erie Beach Map
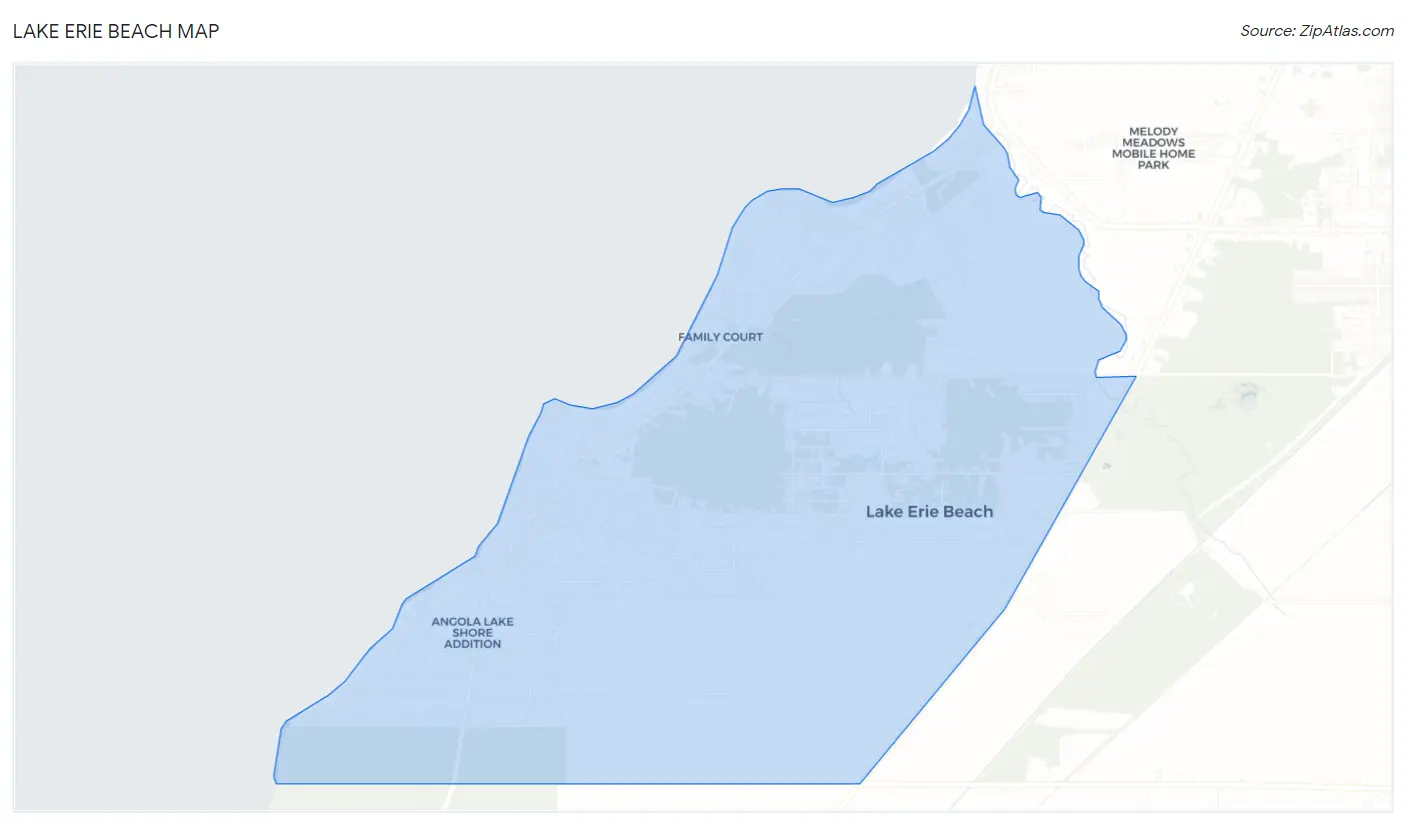
Lake Erie Beach Overview
$35,895
PER CAPITA INCOME
$74,924
AVG FAMILY INCOME
$60,132
AVG HOUSEHOLD INCOME
18.9%
WAGE / INCOME GAP [ % ]
81.1¢/ $1
WAGE / INCOME GAP [ $ ]
0.48
INEQUALITY / GINI INDEX
3,282
TOTAL POPULATION
1,536
MALE POPULATION
1,746
FEMALE POPULATION
87.97
MALES / 100 FEMALES
113.67
FEMALES / 100 MALES
53.3
MEDIAN AGE
2.7
AVG FAMILY SIZE
2.2
AVG HOUSEHOLD SIZE
1,324
LABOR FORCE [ PEOPLE ]
48.3%
PERCENT IN LABOR FORCE
3.2%
UNEMPLOYMENT RATE
Income in Lake Erie Beach
Income Overview in Lake Erie Beach
Per Capita Income in Lake Erie Beach is $35,895, while median incomes of families and households are $74,924 and $60,132 respectively.
| Characteristic | Number | Measure |
| Per Capita Income | 3,282 | $35,895 |
| Median Family Income | 922 | $74,924 |
| Mean Family Income | 922 | $85,794 |
| Median Household Income | 1,498 | $60,132 |
| Mean Household Income | 1,498 | $78,041 |
| Income Deficit | 922 | $0 |
| Wage / Income Gap (%) | 3,282 | 18.89% |
| Wage / Income Gap ($) | 3,282 | 81.11¢ per $1 |
| Gini / Inequality Index | 3,282 | 0.48 |
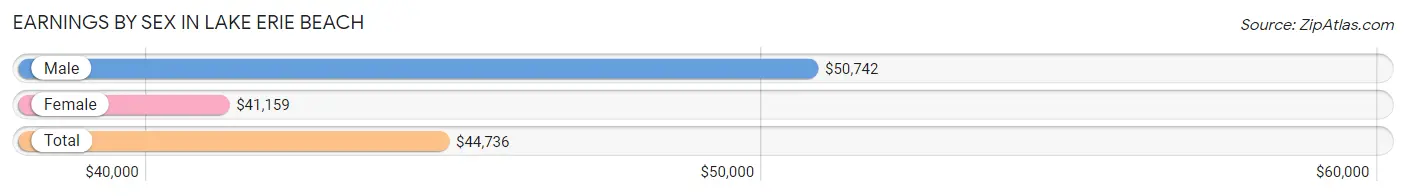
Earnings by Sex in Lake Erie Beach
Average Earnings in Lake Erie Beach are $44,736, $50,742 for men and $41,159 for women, a difference of 18.9%.
| Sex | Number | Average Earnings |
| Male | 673 (47.6%) | $50,742 |
| Female | 740 (52.4%) | $41,159 |
| Total | 1,413 (100.0%) | $44,736 |
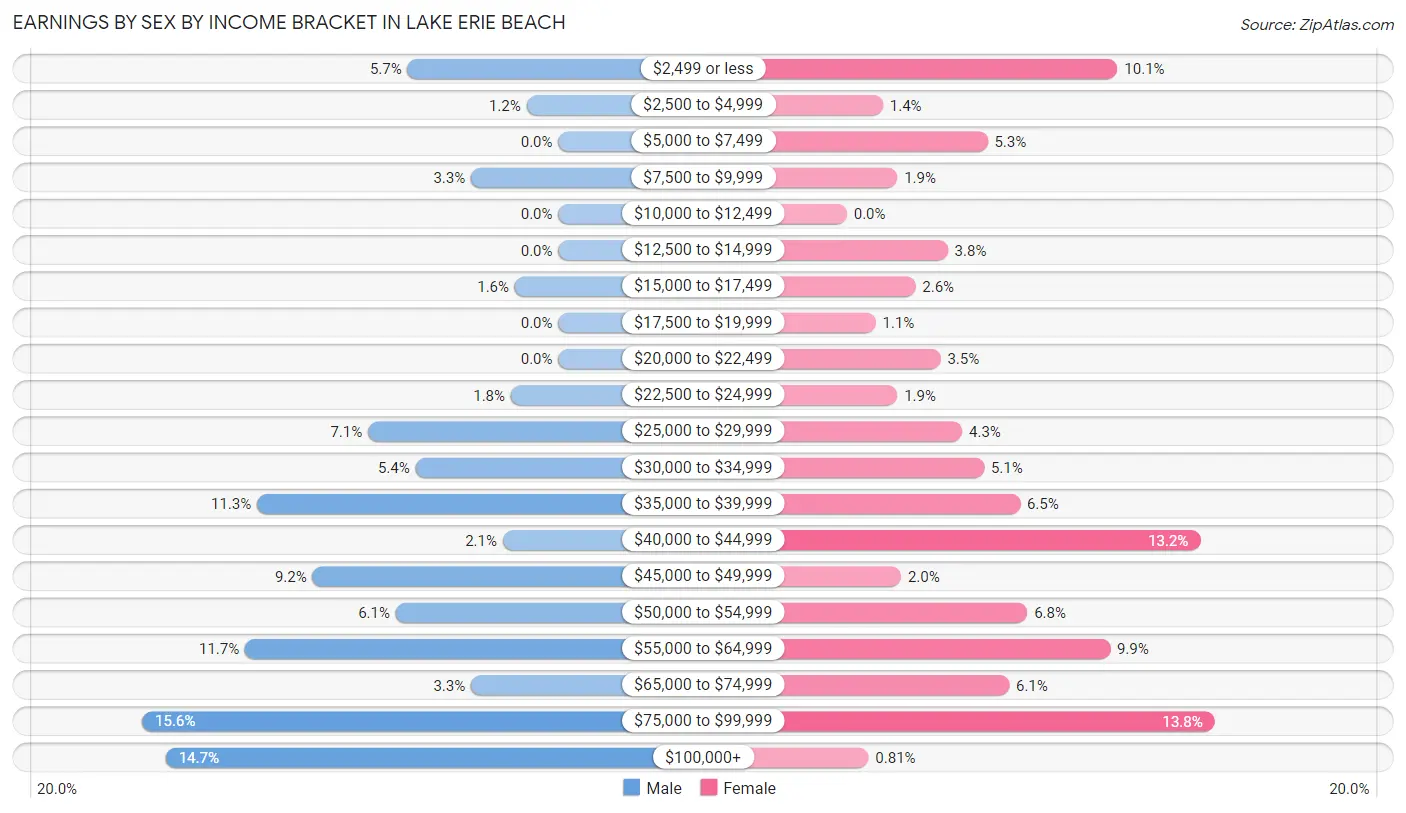
Earnings by Sex by Income Bracket in Lake Erie Beach
The most common earnings brackets in Lake Erie Beach are $75,000 to $99,999 for men (105 | 15.6%) and $75,000 to $99,999 for women (102 | 13.8%).
| Income | Male | Female |
| $2,499 or less | 38 (5.7%) | 75 (10.1%) |
| $2,500 to $4,999 | 8 (1.2%) | 10 (1.3%) |
| $5,000 to $7,499 | 0 (0.0%) | 39 (5.3%) |
| $7,500 to $9,999 | 22 (3.3%) | 14 (1.9%) |
| $10,000 to $12,499 | 0 (0.0%) | 0 (0.0%) |
| $12,500 to $14,999 | 0 (0.0%) | 28 (3.8%) |
| $15,000 to $17,499 | 11 (1.6%) | 19 (2.6%) |
| $17,500 to $19,999 | 0 (0.0%) | 8 (1.1%) |
| $20,000 to $22,499 | 0 (0.0%) | 26 (3.5%) |
| $22,500 to $24,999 | 12 (1.8%) | 14 (1.9%) |
| $25,000 to $29,999 | 48 (7.1%) | 32 (4.3%) |
| $30,000 to $34,999 | 36 (5.3%) | 38 (5.1%) |
| $35,000 to $39,999 | 76 (11.3%) | 48 (6.5%) |
| $40,000 to $44,999 | 14 (2.1%) | 98 (13.2%) |
| $45,000 to $49,999 | 62 (9.2%) | 15 (2.0%) |
| $50,000 to $54,999 | 41 (6.1%) | 50 (6.8%) |
| $55,000 to $64,999 | 79 (11.7%) | 73 (9.9%) |
| $65,000 to $74,999 | 22 (3.3%) | 45 (6.1%) |
| $75,000 to $99,999 | 105 (15.6%) | 102 (13.8%) |
| $100,000+ | 99 (14.7%) | 6 (0.8%) |
| Total | 673 (100.0%) | 740 (100.0%) |
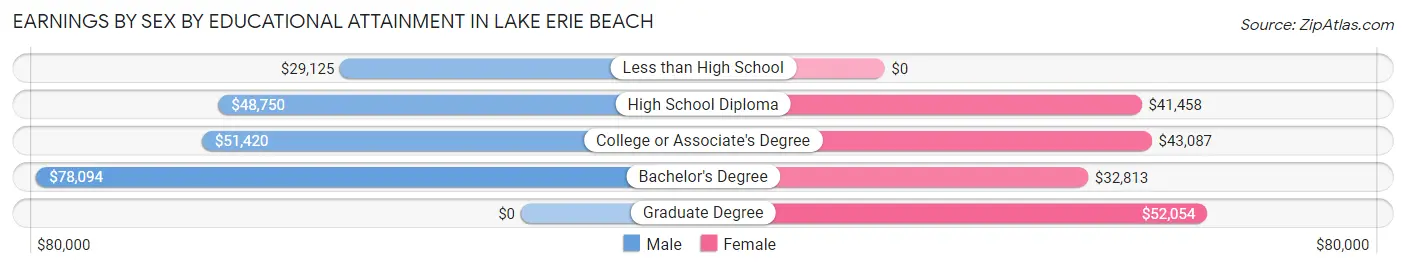
Earnings by Sex by Educational Attainment in Lake Erie Beach
Average earnings in Lake Erie Beach are $52,500 for men and $43,618 for women, a difference of 16.9%. Men with an educational attainment of bachelor's degree enjoy the highest average annual earnings of $78,094, while those with less than high school education earn the least with $29,125. Women with an educational attainment of graduate degree earn the most with the average annual earnings of $52,054, while those with bachelor's degree education have the smallest earnings of $32,813.
| Educational Attainment | Male Income | Female Income |
| Less than High School | $29,125 | $0 |
| High School Diploma | $48,750 | $41,458 |
| College or Associate's Degree | $51,420 | $43,087 |
| Bachelor's Degree | $78,094 | $32,813 |
| Graduate Degree | - | - |
| Total | $52,500 | $43,618 |
Family Income in Lake Erie Beach
Family Income Brackets in Lake Erie Beach
According to the Lake Erie Beach family income data, there are 220 families falling into the $50,000 to $74,999 income range, which is the most common income bracket and makes up 23.9% of all families. Conversely, the $10,000 to $14,999 income bracket is the least frequent group with only 7 families (0.8%) belonging to this category.
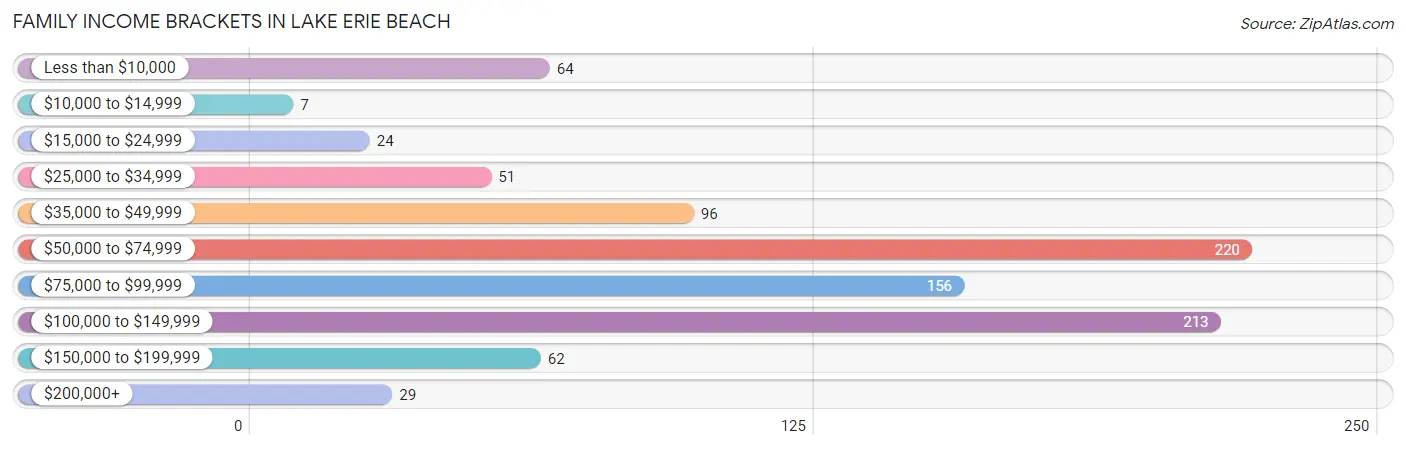
| Income Bracket | # Families | % Families |
| Less than $10,000 | 64 | 6.9% |
| $10,000 to $14,999 | 7 | 0.8% |
| $15,000 to $24,999 | 24 | 2.6% |
| $25,000 to $34,999 | 51 | 5.5% |
| $35,000 to $49,999 | 96 | 10.4% |
| $50,000 to $74,999 | 220 | 23.9% |
| $75,000 to $99,999 | 156 | 16.9% |
| $100,000 to $149,999 | 213 | 23.1% |
| $150,000 to $199,999 | 62 | 6.7% |
| $200,000+ | 29 | 3.1% |
Family Income by Famaliy Size in Lake Erie Beach
4-person families (110 | 11.9%) account for the highest median family income in Lake Erie Beach with $121,026 per family, while 3-person families (184 | 20.0%) have the highest median income of $36,429 per family member.
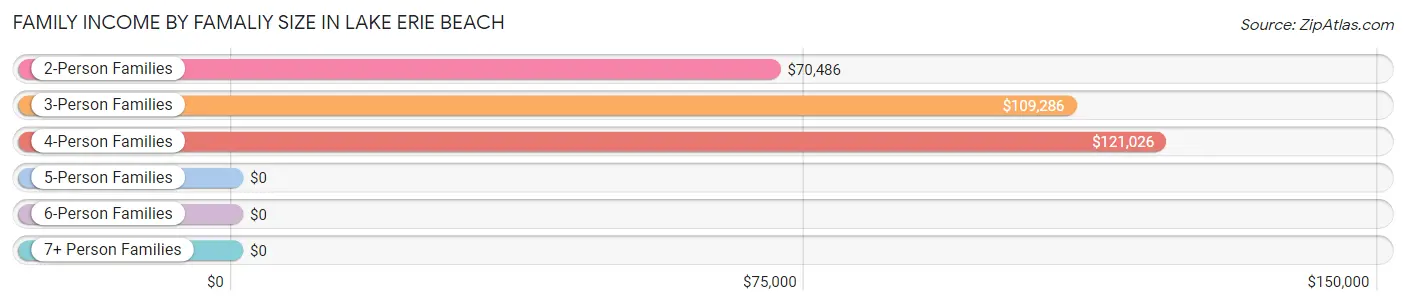
| Income Bracket | # Families | Median Income |
| 2-Person Families | 567 (61.5%) | $70,486 |
| 3-Person Families | 184 (20.0%) | $109,286 |
| 4-Person Families | 110 (11.9%) | $121,026 |
| 5-Person Families | 16 (1.7%) | $0 |
| 6-Person Families | 28 (3.0%) | $0 |
| 7+ Person Families | 17 (1.8%) | $0 |
| Total | 922 (100.0%) | $74,924 |
Family Income by Number of Earners in Lake Erie Beach
The median family income in Lake Erie Beach is $74,924, with families comprising 3+ earners (62) having the highest median family income of $145,167, while families with no earners (300) have the lowest median family income of $46,111, accounting for 6.7% and 32.5% of families, respectively.
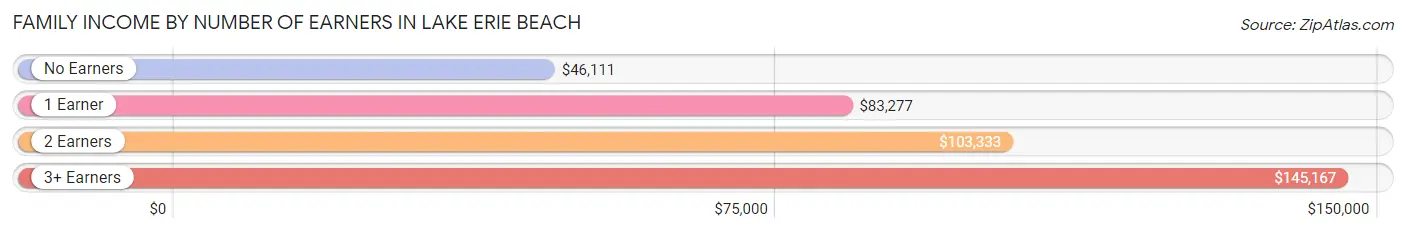
| Number of Earners | # Families | Median Income |
| No Earners | 300 (32.5%) | $46,111 |
| 1 Earner | 258 (28.0%) | $83,277 |
| 2 Earners | 302 (32.8%) | $103,333 |
| 3+ Earners | 62 (6.7%) | $145,167 |
| Total | 922 (100.0%) | $74,924 |
Household Income in Lake Erie Beach
Household Income Brackets in Lake Erie Beach
With 306 households falling in the category, the $50,000 to $74,999 income range is the most frequent in Lake Erie Beach, accounting for 20.4% of all households. In contrast, only 40 households (2.7%) fall into the $200,000+ income bracket, making it the least populous group.
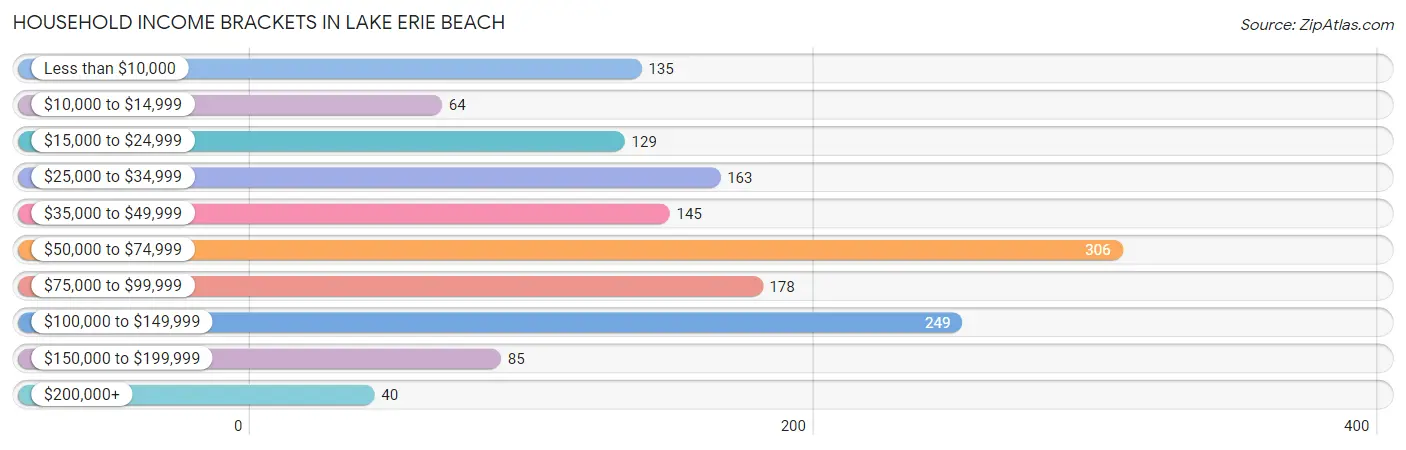
| Income Bracket | # Households | % Households |
| Less than $10,000 | 135 | 9.0% |
| $10,000 to $14,999 | 64 | 4.3% |
| $15,000 to $24,999 | 129 | 8.6% |
| $25,000 to $34,999 | 163 | 10.9% |
| $35,000 to $49,999 | 145 | 9.7% |
| $50,000 to $74,999 | 306 | 20.4% |
| $75,000 to $99,999 | 178 | 11.9% |
| $100,000 to $149,999 | 249 | 16.6% |
| $150,000 to $199,999 | 85 | 5.7% |
| $200,000+ | 40 | 2.7% |
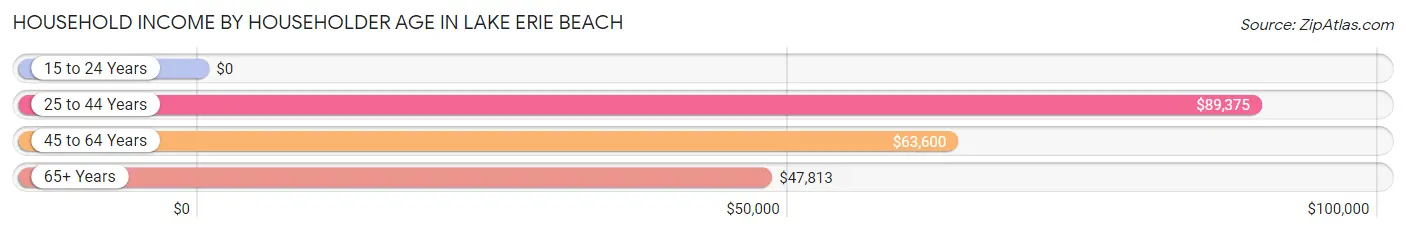
Household Income by Householder Age in Lake Erie Beach
The median household income in Lake Erie Beach is $60,132, with the highest median household income of $89,375 found in the 25 to 44 years age bracket for the primary householder. A total of 257 households (17.2%) fall into this category.
| Income Bracket | # Households | Median Income |
| 15 to 24 Years | 0 (0.0%) | $0 |
| 25 to 44 Years | 257 (17.2%) | $89,375 |
| 45 to 64 Years | 754 (50.3%) | $63,600 |
| 65+ Years | 487 (32.5%) | $47,813 |
| Total | 1,498 (100.0%) | $60,132 |
Poverty in Lake Erie Beach
Income Below Poverty by Sex and Age in Lake Erie Beach
With 11.0% poverty level for males and 20.6% for females among the residents of Lake Erie Beach, 75 year old and over males and 12 to 14 year old females are the most vulnerable to poverty, with 46 males (32.4%) and 48 females (47.5%) in their respective age groups living below the poverty level.
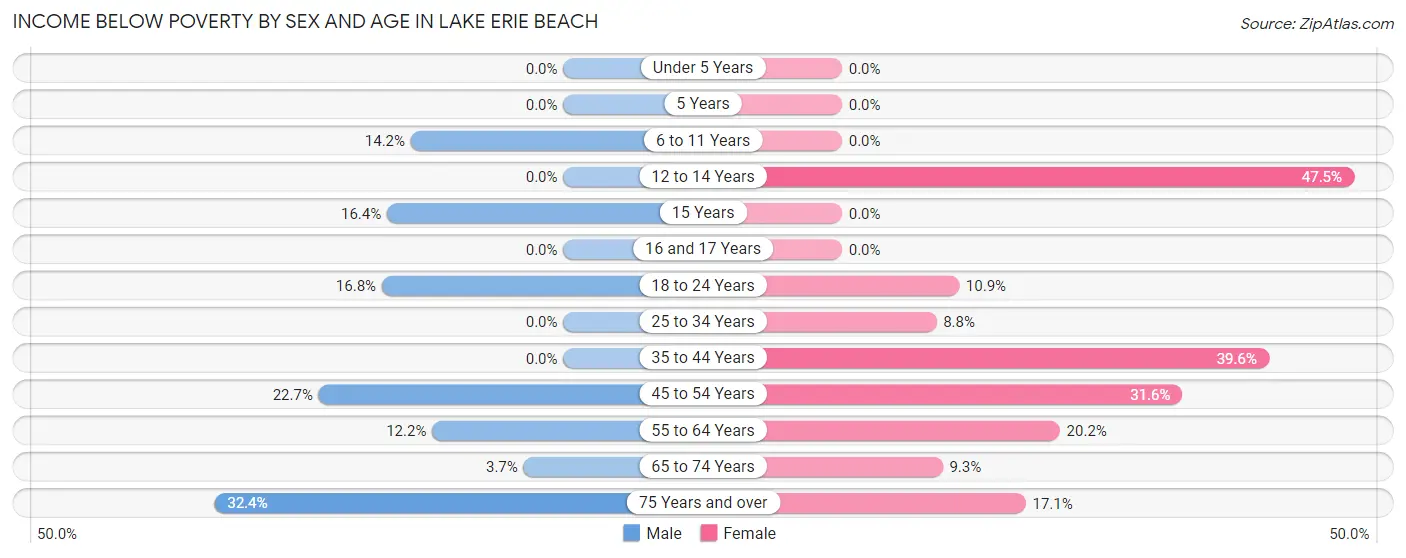
| Age Bracket | Male | Female |
| Under 5 Years | 0 (0.0%) | 0 (0.0%) |
| 5 Years | 0 (0.0%) | 0 (0.0%) |
| 6 to 11 Years | 15 (14.1%) | 0 (0.0%) |
| 12 to 14 Years | 0 (0.0%) | 48 (47.5%) |
| 15 Years | 9 (16.4%) | 0 (0.0%) |
| 16 and 17 Years | 0 (0.0%) | 0 (0.0%) |
| 18 to 24 Years | 16 (16.8%) | 15 (10.9%) |
| 25 to 34 Years | 0 (0.0%) | 12 (8.8%) |
| 35 to 44 Years | 0 (0.0%) | 63 (39.6%) |
| 45 to 54 Years | 37 (22.7%) | 85 (31.6%) |
| 55 to 64 Years | 37 (12.2%) | 90 (20.2%) |
| 65 to 74 Years | 8 (3.7%) | 24 (9.3%) |
| 75 Years and over | 46 (32.4%) | 22 (17.1%) |
| Total | 168 (11.0%) | 359 (20.6%) |
Income Above Poverty by Sex and Age in Lake Erie Beach
According to the poverty statistics in Lake Erie Beach, males aged under 5 years and females aged under 5 years are the age groups that are most secure financially, with 100.0% of males and 100.0% of females in these age groups living above the poverty line.
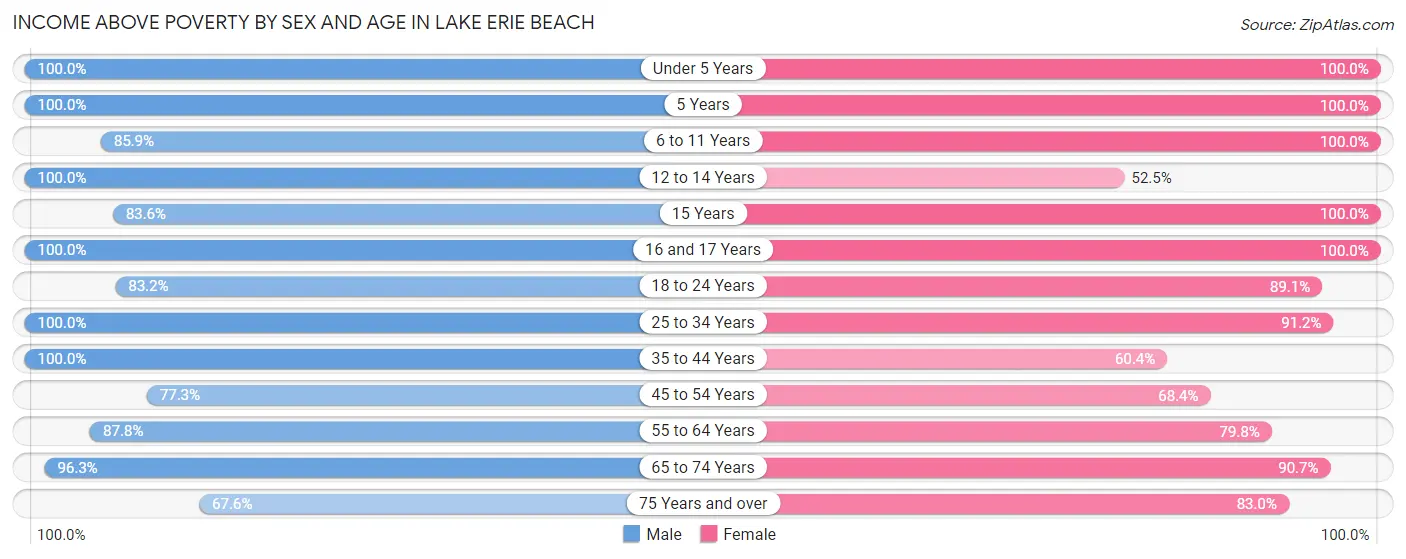
| Age Bracket | Male | Female |
| Under 5 Years | 110 (100.0%) | 33 (100.0%) |
| 5 Years | 39 (100.0%) | 25 (100.0%) |
| 6 to 11 Years | 91 (85.9%) | 26 (100.0%) |
| 12 to 14 Years | 19 (100.0%) | 53 (52.5%) |
| 15 Years | 46 (83.6%) | 18 (100.0%) |
| 16 and 17 Years | 26 (100.0%) | 9 (100.0%) |
| 18 to 24 Years | 79 (83.2%) | 123 (89.1%) |
| 25 to 34 Years | 115 (100.0%) | 125 (91.2%) |
| 35 to 44 Years | 136 (100.0%) | 96 (60.4%) |
| 45 to 54 Years | 126 (77.3%) | 184 (68.4%) |
| 55 to 64 Years | 267 (87.8%) | 355 (79.8%) |
| 65 to 74 Years | 209 (96.3%) | 233 (90.7%) |
| 75 Years and over | 96 (67.6%) | 107 (83.0%) |
| Total | 1,359 (89.0%) | 1,387 (79.4%) |
Income Below Poverty Among Married-Couple Families in Lake Erie Beach
The poverty statistics for married-couple families in Lake Erie Beach show that 10.4% or 70 of the total 671 families live below the poverty line. Families with 3 or 4 children have the highest poverty rate of 24.3%, comprising of 9 families. On the other hand, families with 1 or 2 children have the lowest poverty rate of 0.0%, which includes 0 families.
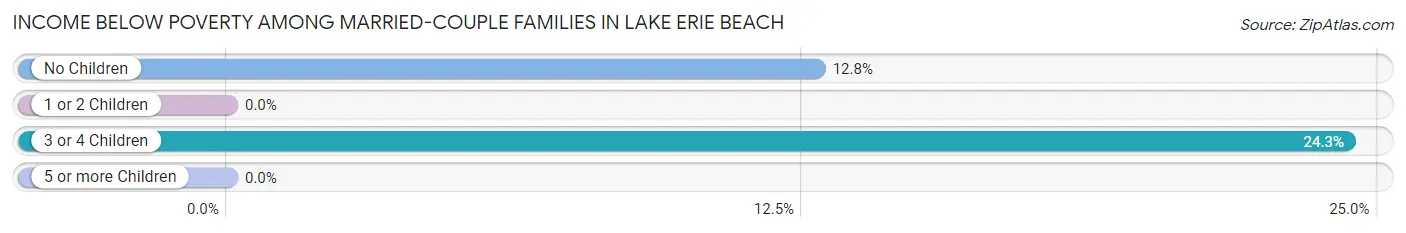
| Children | Above Poverty | Below Poverty |
| No Children | 416 (87.2%) | 61 (12.8%) |
| 1 or 2 Children | 157 (100.0%) | 0 (0.0%) |
| 3 or 4 Children | 28 (75.7%) | 9 (24.3%) |
| 5 or more Children | 0 (0.0%) | 0 (0.0%) |
| Total | 601 (89.6%) | 70 (10.4%) |
Income Below Poverty Among Single-Parent Households in Lake Erie Beach
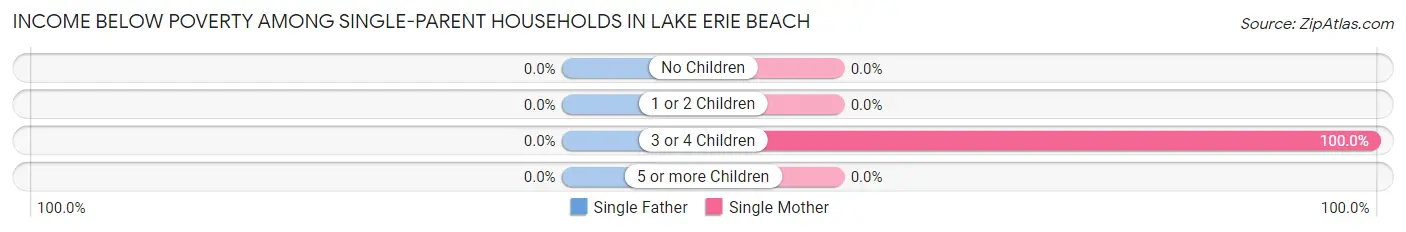
| Children | Single Father | Single Mother |
| No Children | 0 (0.0%) | 0 (0.0%) |
| 1 or 2 Children | 0 (0.0%) | 0 (0.0%) |
| 3 or 4 Children | 0 (0.0%) | 14 (100.0%) |
| 5 or more Children | 0 (0.0%) | 0 (0.0%) |
| Total | 0 (0.0%) | 14 (7.6%) |
Income Below Poverty Among Married-Couple vs Single-Parent Households in Lake Erie Beach
The poverty data for Lake Erie Beach shows that 70 of the married-couple family households (10.4%) and 14 of the single-parent households (5.6%) are living below the poverty level. Within the married-couple family households, those with 3 or 4 children have the highest poverty rate, with 9 households (24.3%) falling below the poverty line. Among the single-parent households, those with 3 or 4 children have the highest poverty rate, with 14 household (100.0%) living below poverty.
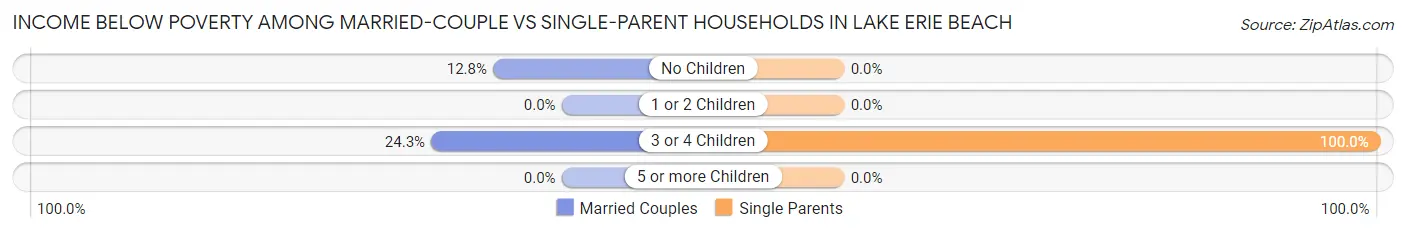
| Children | Married-Couple Families | Single-Parent Households |
| No Children | 61 (12.8%) | 0 (0.0%) |
| 1 or 2 Children | 0 (0.0%) | 0 (0.0%) |
| 3 or 4 Children | 9 (24.3%) | 14 (100.0%) |
| 5 or more Children | 0 (0.0%) | 0 (0.0%) |
| Total | 70 (10.4%) | 14 (5.6%) |
Race in Lake Erie Beach
The most populous races in Lake Erie Beach are White / Caucasian (3,099 | 94.4%), Black / African American (73 | 2.2%), and Asian (70 | 2.1%).
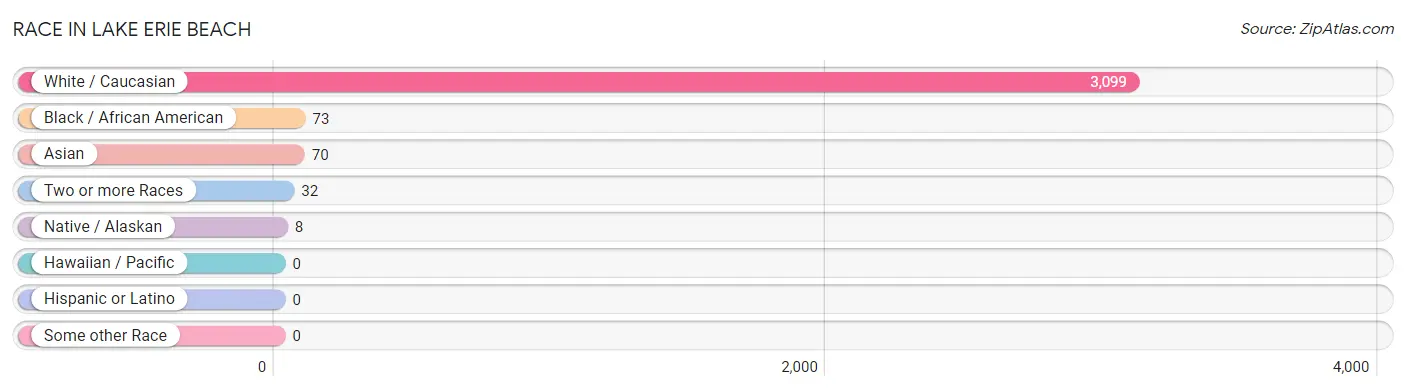
| Race | # Population | % Population |
| Asian | 70 | 2.1% |
| Black / African American | 73 | 2.2% |
| Hawaiian / Pacific | 0 | 0.0% |
| Hispanic or Latino | 0 | 0.0% |
| Native / Alaskan | 8 | 0.2% |
| White / Caucasian | 3,099 | 94.4% |
| Two or more Races | 32 | 1.0% |
| Some other Race | 0 | 0.0% |
| Total | 3,282 | 100.0% |
Ancestry in Lake Erie Beach
The most populous ancestries reported in Lake Erie Beach are German (859 | 26.2%), Irish (586 | 17.8%), Polish (413 | 12.6%), American (371 | 11.3%), and Italian (329 | 10.0%), together accounting for 77.9% of all Lake Erie Beach residents.
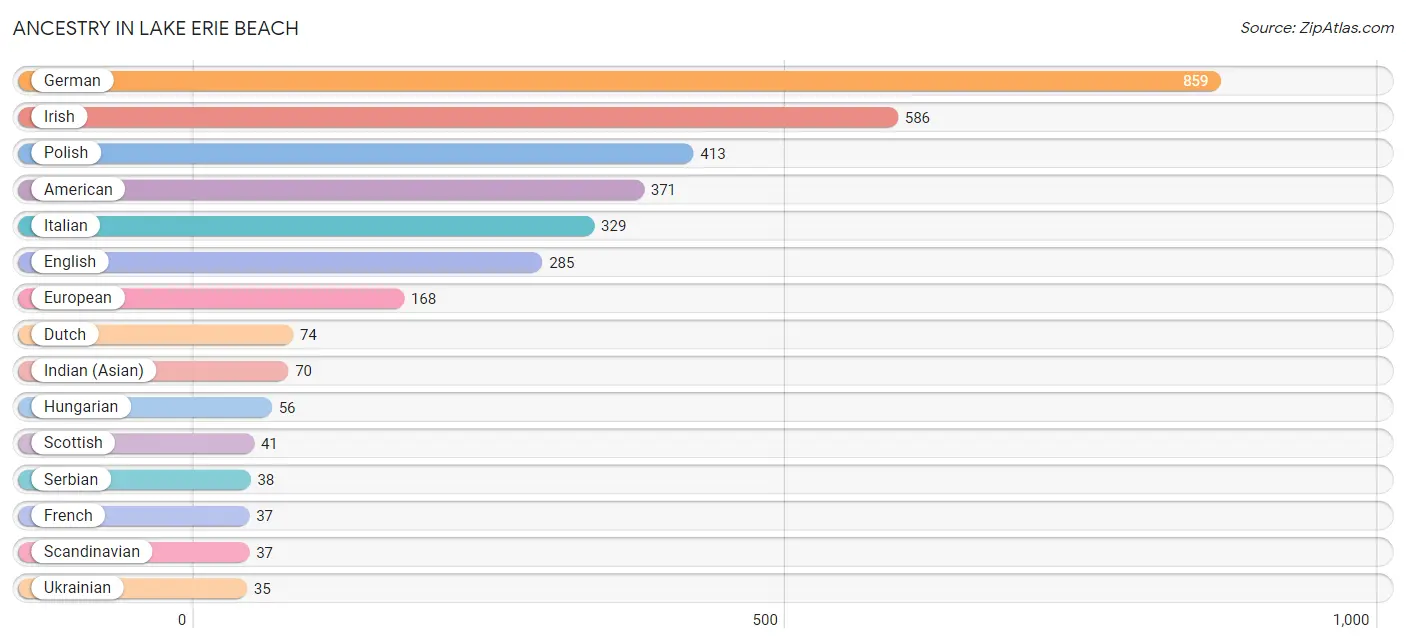
| Ancestry | # Population | % Population |
| American | 371 | 11.3% |
| Croatian | 11 | 0.3% |
| Czech | 9 | 0.3% |
| Delaware | 8 | 0.2% |
| Dutch | 74 | 2.2% |
| Eastern European | 8 | 0.2% |
| English | 285 | 8.7% |
| European | 168 | 5.1% |
| French | 37 | 1.1% |
| French Canadian | 29 | 0.9% |
| German | 859 | 26.2% |
| Hungarian | 56 | 1.7% |
| Indian (Asian) | 70 | 2.1% |
| Irish | 586 | 17.8% |
| Italian | 329 | 10.0% |
| Lithuanian | 7 | 0.2% |
| Pennsylvania German | 24 | 0.7% |
| Polish | 413 | 12.6% |
| Russian | 14 | 0.4% |
| Scandinavian | 37 | 1.1% |
| Scottish | 41 | 1.3% |
| Serbian | 38 | 1.2% |
| Swedish | 21 | 0.6% |
| Ukrainian | 35 | 1.1% |
| Welsh | 20 | 0.6% | View All 25 Rows |
Immigrants in Lake Erie Beach
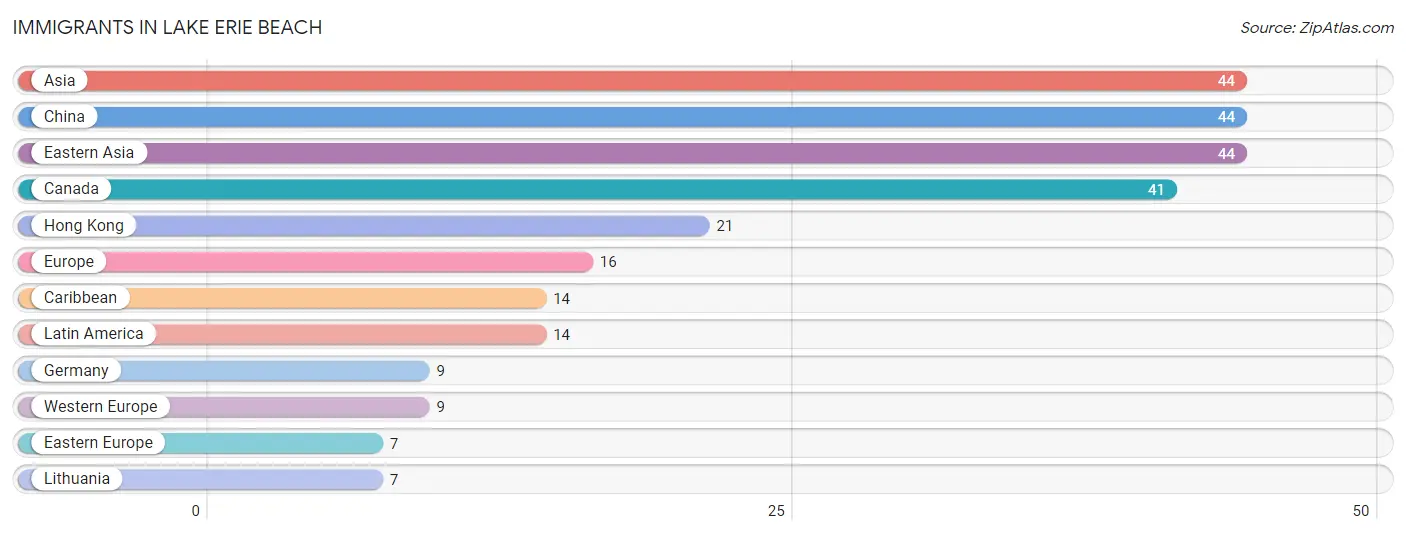
The most numerous immigrant groups reported in Lake Erie Beach came from Asia (44 | 1.3%), China (44 | 1.3%), Eastern Asia (44 | 1.3%), Canada (41 | 1.3%), and Hong Kong (21 | 0.6%), together accounting for 5.9% of all Lake Erie Beach residents.
| Immigration Origin | # Population | % Population |
| Asia | 44 | 1.3% |
| Canada | 41 | 1.3% |
| Caribbean | 14 | 0.4% |
| China | 44 | 1.3% |
| Eastern Asia | 44 | 1.3% |
| Eastern Europe | 7 | 0.2% |
| Europe | 16 | 0.5% |
| Germany | 9 | 0.3% |
| Hong Kong | 21 | 0.6% |
| Latin America | 14 | 0.4% |
| Lithuania | 7 | 0.2% |
| Western Europe | 9 | 0.3% | View All 12 Rows |
Sex and Age in Lake Erie Beach
Sex and Age in Lake Erie Beach
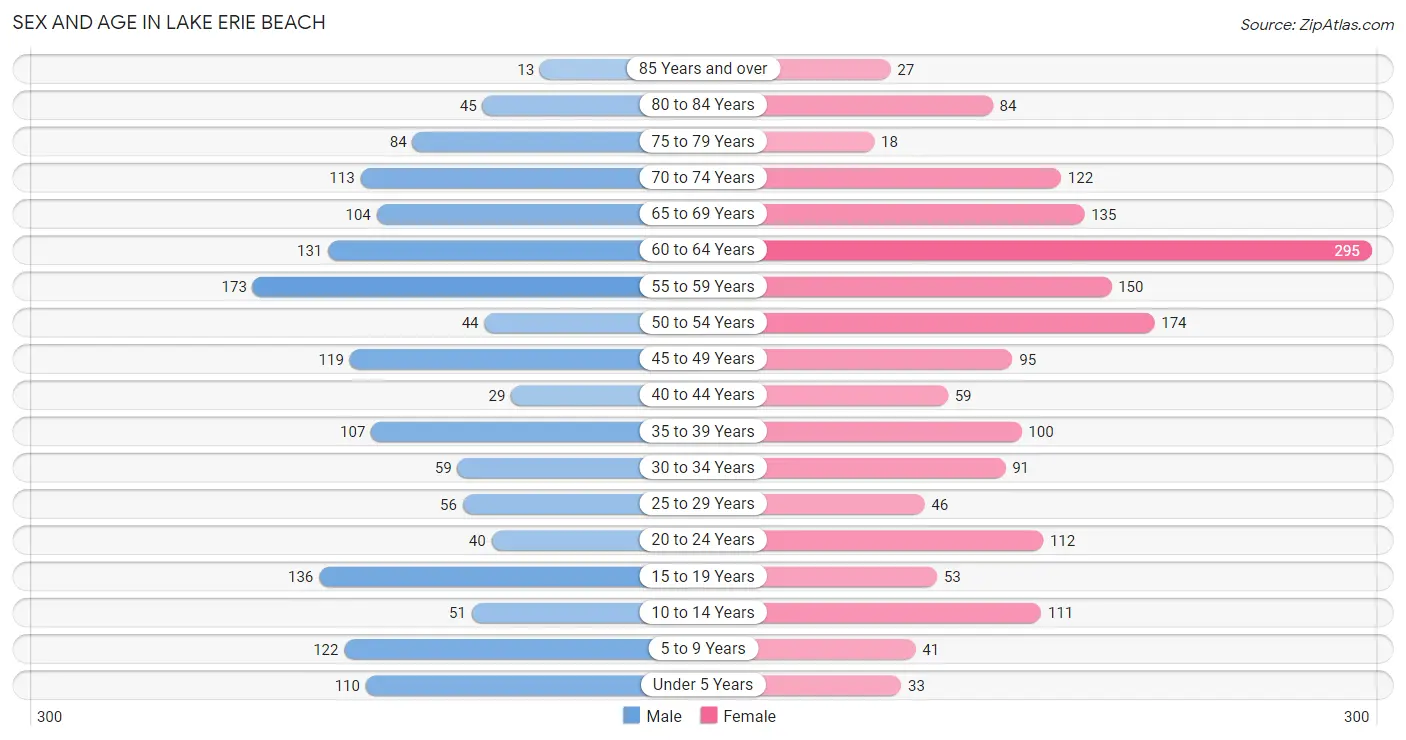
The most populous age groups in Lake Erie Beach are 55 to 59 Years (173 | 11.3%) for men and 60 to 64 Years (295 | 16.9%) for women.
| Age Bracket | Male | Female |
| Under 5 Years | 110 (7.2%) | 33 (1.9%) |
| 5 to 9 Years | 122 (7.9%) | 41 (2.4%) |
| 10 to 14 Years | 51 (3.3%) | 111 (6.4%) |
| 15 to 19 Years | 136 (8.8%) | 53 (3.0%) |
| 20 to 24 Years | 40 (2.6%) | 112 (6.4%) |
| 25 to 29 Years | 56 (3.6%) | 46 (2.6%) |
| 30 to 34 Years | 59 (3.8%) | 91 (5.2%) |
| 35 to 39 Years | 107 (7.0%) | 100 (5.7%) |
| 40 to 44 Years | 29 (1.9%) | 59 (3.4%) |
| 45 to 49 Years | 119 (7.7%) | 95 (5.4%) |
| 50 to 54 Years | 44 (2.9%) | 174 (10.0%) |
| 55 to 59 Years | 173 (11.3%) | 150 (8.6%) |
| 60 to 64 Years | 131 (8.5%) | 295 (16.9%) |
| 65 to 69 Years | 104 (6.8%) | 135 (7.7%) |
| 70 to 74 Years | 113 (7.4%) | 122 (7.0%) |
| 75 to 79 Years | 84 (5.5%) | 18 (1.0%) |
| 80 to 84 Years | 45 (2.9%) | 84 (4.8%) |
| 85 Years and over | 13 (0.9%) | 27 (1.5%) |
| Total | 1,536 (100.0%) | 1,746 (100.0%) |
Families and Households in Lake Erie Beach
Median Family Size in Lake Erie Beach
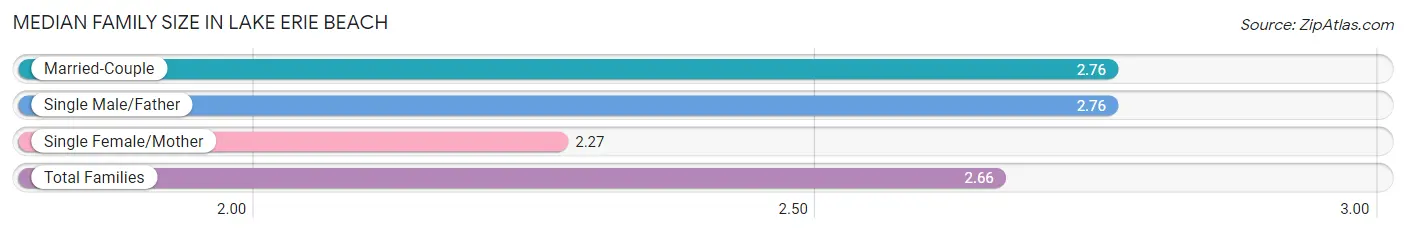
The median family size in Lake Erie Beach is 2.66 persons per family, with married-couple families (671 | 72.8%) accounting for the largest median family size of 2.76 persons per family. On the other hand, single female/mother families (183 | 19.9%) represent the smallest median family size with 2.27 persons per family.
| Family Type | # Families | Family Size |
| Married-Couple | 671 (72.8%) | 2.76 |
| Single Male/Father | 68 (7.4%) | 2.76 |
| Single Female/Mother | 183 (19.9%) | 2.27 |
| Total Families | 922 (100.0%) | 2.66 |
Median Household Size in Lake Erie Beach
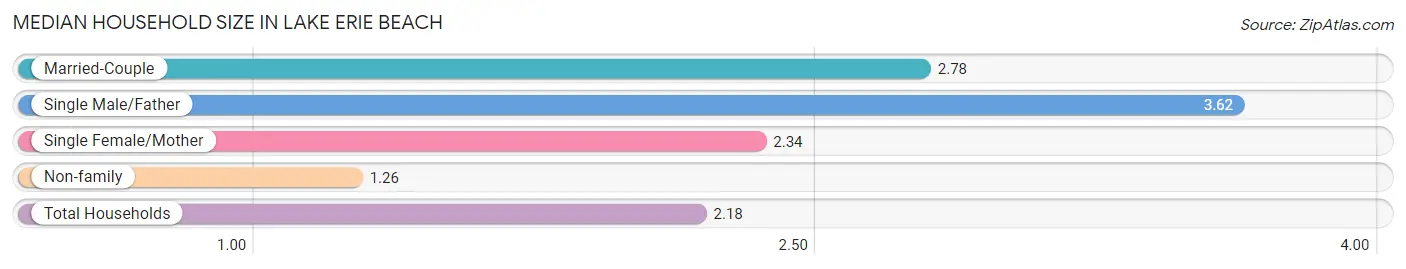
The median household size in Lake Erie Beach is 2.18 persons per household, with single male/father households (68 | 4.5%) accounting for the largest median household size of 3.62 persons per household. non-family households (576 | 38.5%) represent the smallest median household size with 1.26 persons per household.
| Household Type | # Households | Household Size |
| Married-Couple | 671 (44.8%) | 2.78 |
| Single Male/Father | 68 (4.5%) | 3.62 |
| Single Female/Mother | 183 (12.2%) | 2.34 |
| Non-family | 576 (38.5%) | 1.26 |
| Total Households | 1,498 (100.0%) | 2.18 |
Household Size by Marriage Status in Lake Erie Beach
Out of a total of 1,498 households in Lake Erie Beach, 922 (61.6%) are family households, while 576 (38.5%) are nonfamily households. The most numerous type of family households are 2-person households, comprising 548, and the most common type of nonfamily households are 1-person households, comprising 458.
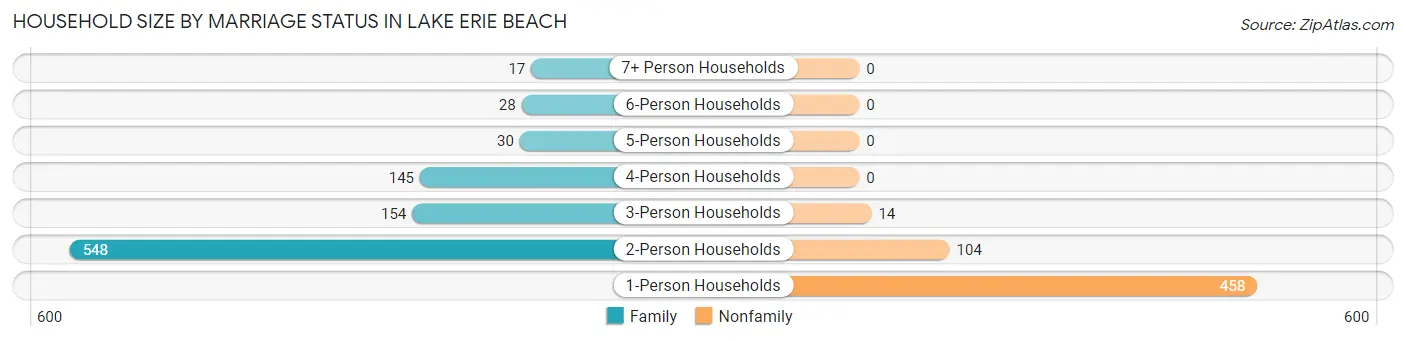
| Household Size | Family Households | Nonfamily Households |
| 1-Person Households | - | 458 (30.6%) |
| 2-Person Households | 548 (36.6%) | 104 (6.9%) |
| 3-Person Households | 154 (10.3%) | 14 (0.9%) |
| 4-Person Households | 145 (9.7%) | 0 (0.0%) |
| 5-Person Households | 30 (2.0%) | 0 (0.0%) |
| 6-Person Households | 28 (1.9%) | 0 (0.0%) |
| 7+ Person Households | 17 (1.1%) | 0 (0.0%) |
| Total | 922 (61.6%) | 576 (38.5%) |
Female Fertility in Lake Erie Beach
Fertility by Age in Lake Erie Beach
Average fertility rate in Lake Erie Beach is 12.0 births per 1,000 women. Women in the age bracket of 35 to 50 years have the highest fertility rate with 25.0 births per 1,000 women. Women in the age bracket of 35 to 50 years acount for 100.0% of all women with births.
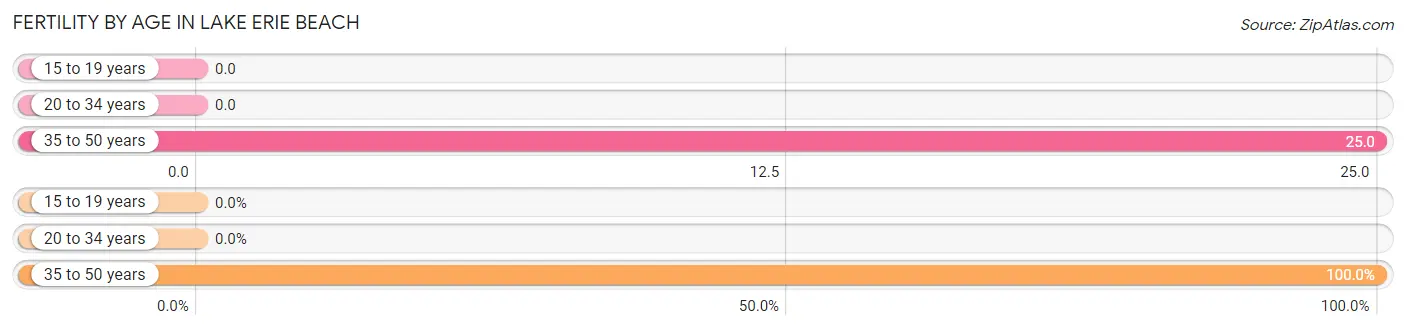
| Age Bracket | Women with Births | Births / 1,000 Women |
| 15 to 19 years | 0 (0.0%) | 0.0 |
| 20 to 34 years | 0 (0.0%) | 0.0 |
| 35 to 50 years | 7 (100.0%) | 25.0 |
| Total | 7 (100.0%) | 12.0 |
Fertility by Age by Marriage Status in Lake Erie Beach
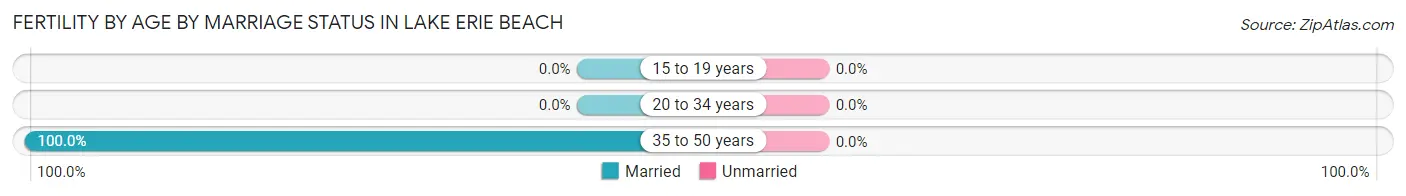
| Age Bracket | Married | Unmarried |
| 15 to 19 years | 0 (0.0%) | 0 (0.0%) |
| 20 to 34 years | 0 (0.0%) | 0 (0.0%) |
| 35 to 50 years | 7 (100.0%) | 0 (0.0%) |
| Total | 7 (100.0%) | 0 (0.0%) |
Fertility by Education in Lake Erie Beach
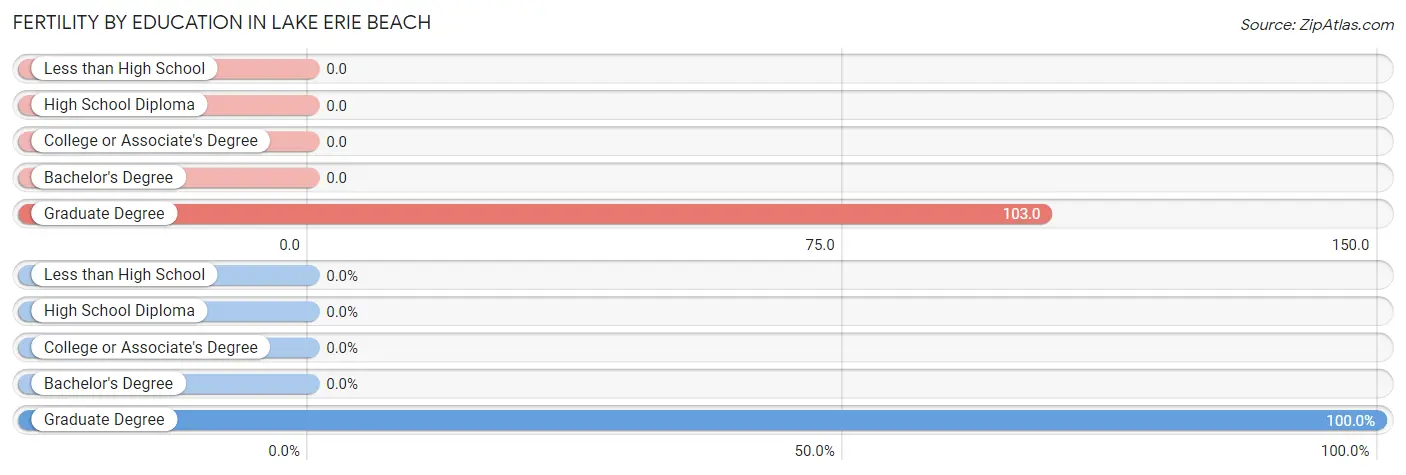
| Educational Attainment | Women with Births | Births / 1,000 Women |
| Less than High School | 0 (0.0%) | 0.0 |
| High School Diploma | 0 (0.0%) | 0.0 |
| College or Associate's Degree | 0 (0.0%) | 0.0 |
| Bachelor's Degree | 0 (0.0%) | 0.0 |
| Graduate Degree | 7 (100.0%) | 103.0 |
| Total | 7 (100.0%) | 12.0 |
Fertility by Education by Marriage Status in Lake Erie Beach
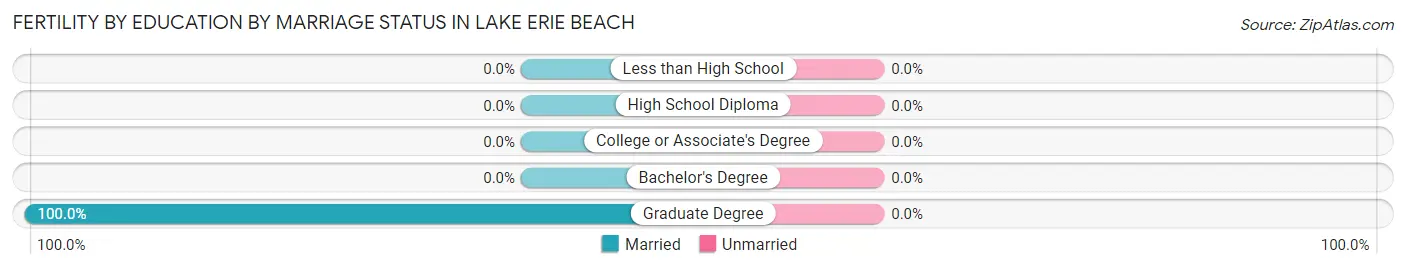
| Educational Attainment | Married | Unmarried |
| Less than High School | 0 (0.0%) | 0 (0.0%) |
| High School Diploma | 0 (0.0%) | 0 (0.0%) |
| College or Associate's Degree | 0 (0.0%) | 0 (0.0%) |
| Bachelor's Degree | 0 (0.0%) | 0 (0.0%) |
| Graduate Degree | 7 (100.0%) | 0 (0.0%) |
| Total | 7 (100.0%) | 0 (0.0%) |
Employment Characteristics in Lake Erie Beach
Employment by Class of Employer in Lake Erie Beach
Among the 1,245 employed individuals in Lake Erie Beach, private company employees (795 | 63.9%), state government employees (193 | 15.5%), and not-for-profit organizations (159 | 12.8%) make up the most common classes of employment.
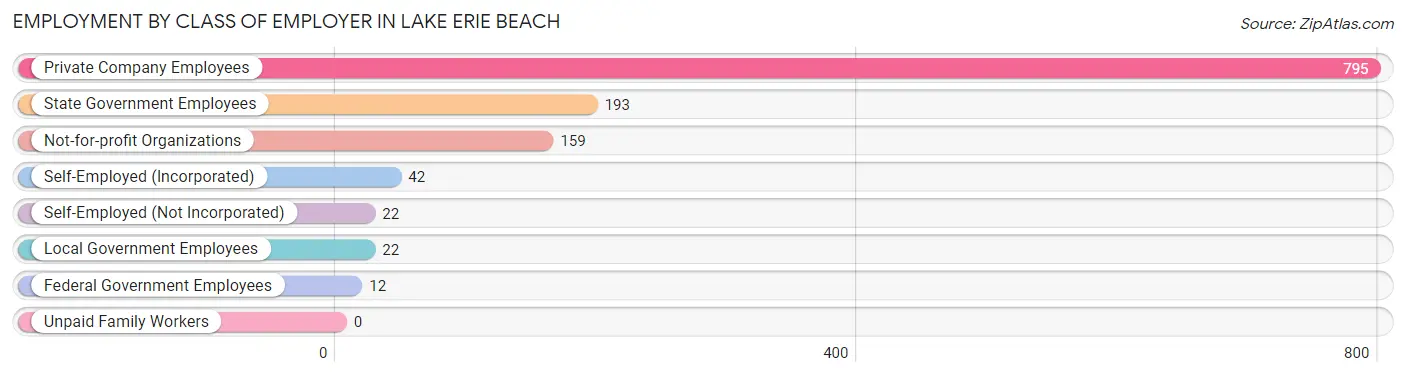
| Employer Class | # Employees | % Employees |
| Private Company Employees | 795 | 63.9% |
| Self-Employed (Incorporated) | 42 | 3.4% |
| Self-Employed (Not Incorporated) | 22 | 1.8% |
| Not-for-profit Organizations | 159 | 12.8% |
| Local Government Employees | 22 | 1.8% |
| State Government Employees | 193 | 15.5% |
| Federal Government Employees | 12 | 1.0% |
| Unpaid Family Workers | 0 | 0.0% |
| Total | 1,245 | 100.0% |
Employment Status by Age in Lake Erie Beach
According to the labor force statistics for Lake Erie Beach, out of the total population over 16 years of age (2,741), 48.3% or 1,324 individuals are in the labor force, with 3.2% or 42 of them unemployed. The age group with the highest labor force participation rate is 35 to 44 years, with 84.7% or 250 individuals in the labor force. Within the labor force, the 60 to 64 years age range has the highest percentage of unemployed individuals, with 15.4% or 27 of them being unemployed.
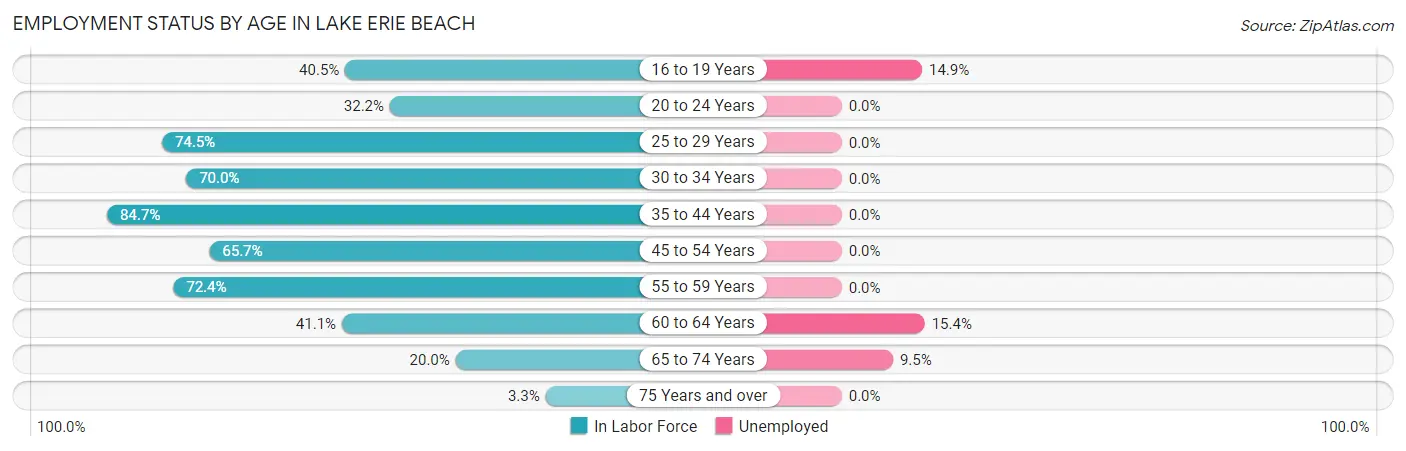
| Age Bracket | In Labor Force | Unemployed |
| 16 to 19 Years | 47 (40.5%) | 7 (14.9%) |
| 20 to 24 Years | 49 (32.2%) | 0 (0.0%) |
| 25 to 29 Years | 76 (74.5%) | 0 (0.0%) |
| 30 to 34 Years | 105 (70.0%) | 0 (0.0%) |
| 35 to 44 Years | 250 (84.7%) | 0 (0.0%) |
| 45 to 54 Years | 284 (65.7%) | 0 (0.0%) |
| 55 to 59 Years | 234 (72.4%) | 0 (0.0%) |
| 60 to 64 Years | 175 (41.1%) | 27 (15.4%) |
| 65 to 74 Years | 95 (20.0%) | 9 (9.5%) |
| 75 Years and over | 9 (3.3%) | 0 (0.0%) |
| Total | 1,324 (48.3%) | 42 (3.2%) |
Employment Status by Educational Attainment in Lake Erie Beach
According to labor force statistics for Lake Erie Beach, 65.0% of individuals (1,123) out of the total population between 25 and 64 years of age (1,728) are in the labor force, with 2.4% or 27 of them being unemployed. The group with the highest labor force participation rate are those with the educational attainment of college / associate degree, with 77.1% or 528 individuals in the labor force. Within the labor force, individuals with bachelor's degree or higher education have the highest percentage of unemployment, with 5.4% or 16 of them being unemployed.
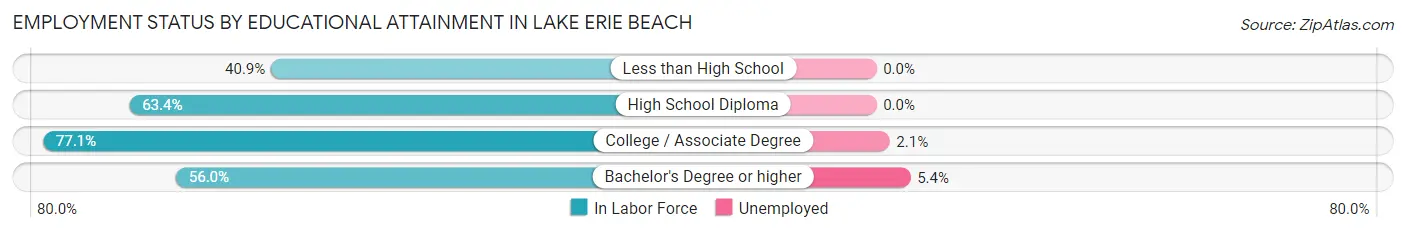
| Educational Attainment | In Labor Force | Unemployed |
| Less than High School | 47 (40.9%) | 0 (0.0%) |
| High School Diploma | 251 (63.4%) | 0 (0.0%) |
| College / Associate Degree | 528 (77.1%) | 14 (2.1%) |
| Bachelor's Degree or higher | 298 (56.0%) | 29 (5.4%) |
| Total | 1,123 (65.0%) | 41 (2.4%) |
Employment Occupations by Sex in Lake Erie Beach
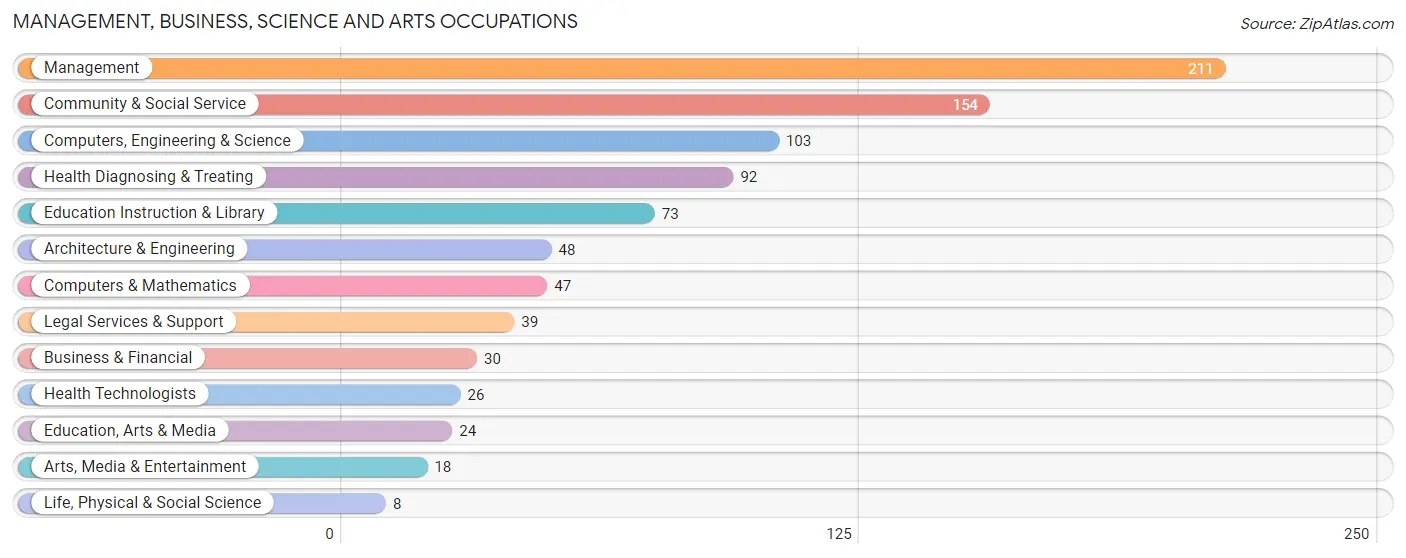
Management, Business, Science and Arts Occupations
The most common Management, Business, Science and Arts occupations in Lake Erie Beach are Management (211 | 16.5%), Community & Social Service (154 | 12.0%), Computers, Engineering & Science (103 | 8.0%), Health Diagnosing & Treating (92 | 7.2%), and Education Instruction & Library (73 | 5.7%).
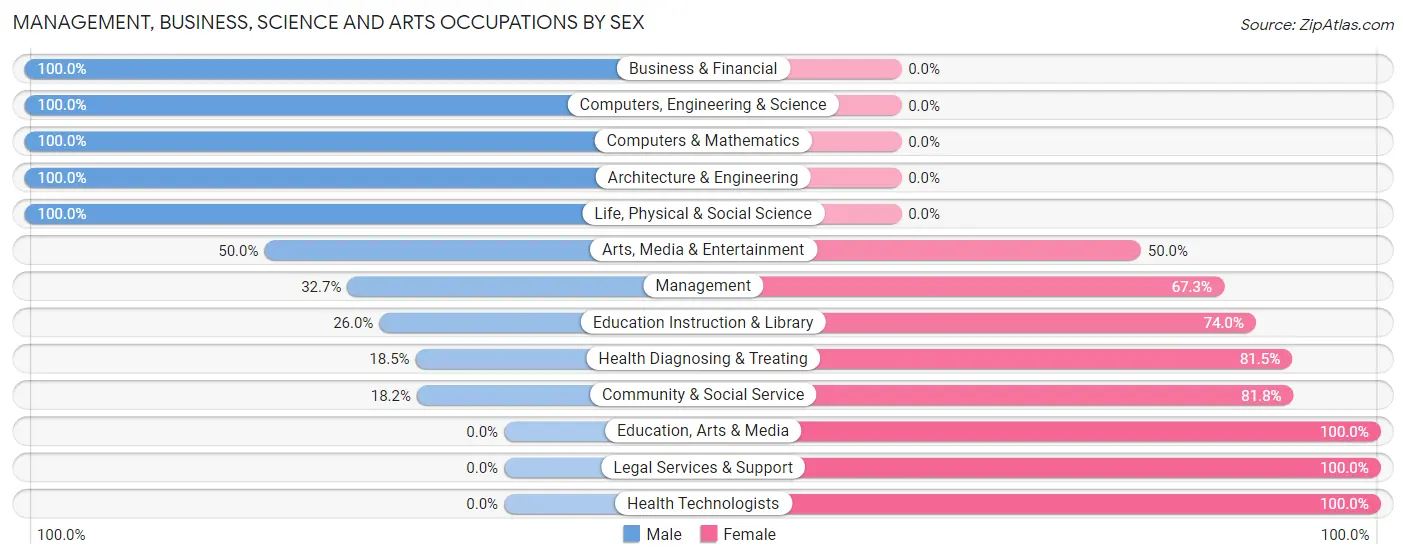
Management, Business, Science and Arts Occupations by Sex
Within the Management, Business, Science and Arts occupations in Lake Erie Beach, the most male-oriented occupations are Business & Financial (100.0%), Computers, Engineering & Science (100.0%), and Computers & Mathematics (100.0%), while the most female-oriented occupations are Education, Arts & Media (100.0%), Legal Services & Support (100.0%), and Health Technologists (100.0%).
| Occupation | Male | Female |
| Management | 69 (32.7%) | 142 (67.3%) |
| Business & Financial | 30 (100.0%) | 0 (0.0%) |
| Computers, Engineering & Science | 103 (100.0%) | 0 (0.0%) |
| Computers & Mathematics | 47 (100.0%) | 0 (0.0%) |
| Architecture & Engineering | 48 (100.0%) | 0 (0.0%) |
| Life, Physical & Social Science | 8 (100.0%) | 0 (0.0%) |
| Community & Social Service | 28 (18.2%) | 126 (81.8%) |
| Education, Arts & Media | 0 (0.0%) | 24 (100.0%) |
| Legal Services & Support | 0 (0.0%) | 39 (100.0%) |
| Education Instruction & Library | 19 (26.0%) | 54 (74.0%) |
| Arts, Media & Entertainment | 9 (50.0%) | 9 (50.0%) |
| Health Diagnosing & Treating | 17 (18.5%) | 75 (81.5%) |
| Health Technologists | 0 (0.0%) | 26 (100.0%) |
| Total (Category) | 247 (41.9%) | 343 (58.1%) |
| Total (Overall) | 650 (50.7%) | 631 (49.3%) |
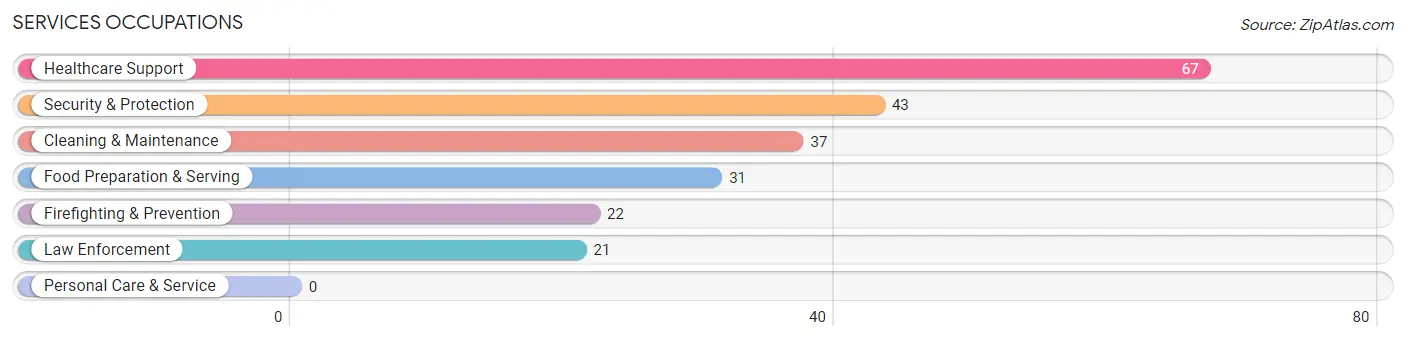
Services Occupations
The most common Services occupations in Lake Erie Beach are Healthcare Support (67 | 5.2%), Security & Protection (43 | 3.4%), Cleaning & Maintenance (37 | 2.9%), Food Preparation & Serving (31 | 2.4%), and Firefighting & Prevention (22 | 1.7%).
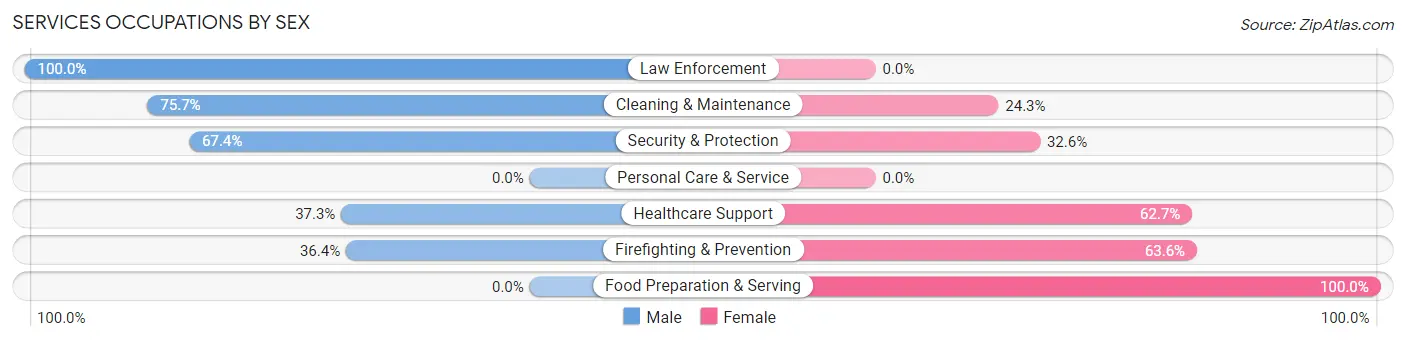
Services Occupations by Sex
Within the Services occupations in Lake Erie Beach, the most male-oriented occupations are Law Enforcement (100.0%), Cleaning & Maintenance (75.7%), and Security & Protection (67.4%), while the most female-oriented occupations are Food Preparation & Serving (100.0%), Firefighting & Prevention (63.6%), and Healthcare Support (62.7%).
| Occupation | Male | Female |
| Healthcare Support | 25 (37.3%) | 42 (62.7%) |
| Security & Protection | 29 (67.4%) | 14 (32.6%) |
| Firefighting & Prevention | 8 (36.4%) | 14 (63.6%) |
| Law Enforcement | 21 (100.0%) | 0 (0.0%) |
| Food Preparation & Serving | 0 (0.0%) | 31 (100.0%) |
| Cleaning & Maintenance | 28 (75.7%) | 9 (24.3%) |
| Personal Care & Service | 0 (0.0%) | 0 (0.0%) |
| Total (Category) | 82 (46.1%) | 96 (53.9%) |
| Total (Overall) | 650 (50.7%) | 631 (49.3%) |
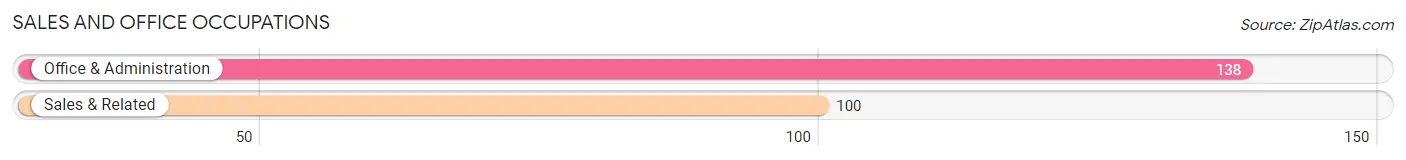
Sales and Office Occupations
The most common Sales and Office occupations in Lake Erie Beach are Office & Administration (138 | 10.8%), and Sales & Related (100 | 7.8%).
Sales and Office Occupations by Sex
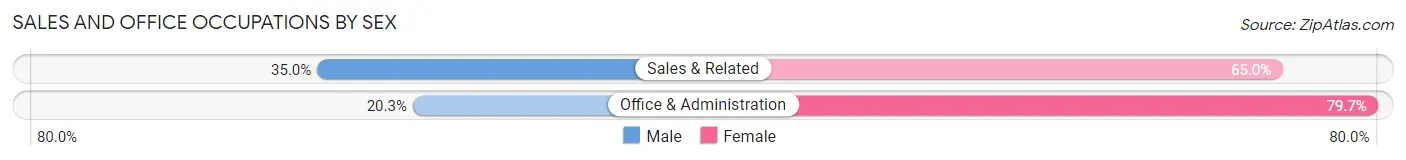
| Occupation | Male | Female |
| Sales & Related | 35 (35.0%) | 65 (65.0%) |
| Office & Administration | 28 (20.3%) | 110 (79.7%) |
| Total (Category) | 63 (26.5%) | 175 (73.5%) |
| Total (Overall) | 650 (50.7%) | 631 (49.3%) |
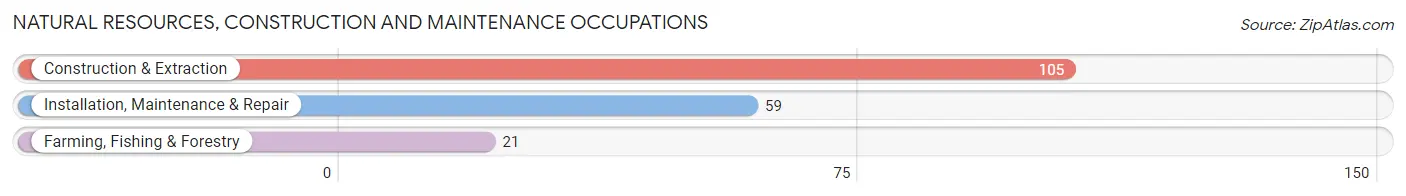
Natural Resources, Construction and Maintenance Occupations
The most common Natural Resources, Construction and Maintenance occupations in Lake Erie Beach are Construction & Extraction (105 | 8.2%), Installation, Maintenance & Repair (59 | 4.6%), and Farming, Fishing & Forestry (21 | 1.6%).
Natural Resources, Construction and Maintenance Occupations by Sex
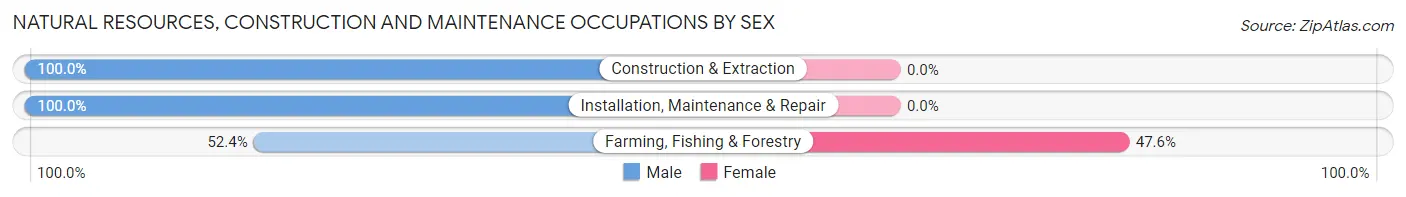
| Occupation | Male | Female |
| Farming, Fishing & Forestry | 11 (52.4%) | 10 (47.6%) |
| Construction & Extraction | 105 (100.0%) | 0 (0.0%) |
| Installation, Maintenance & Repair | 59 (100.0%) | 0 (0.0%) |
| Total (Category) | 175 (94.6%) | 10 (5.4%) |
| Total (Overall) | 650 (50.7%) | 631 (49.3%) |
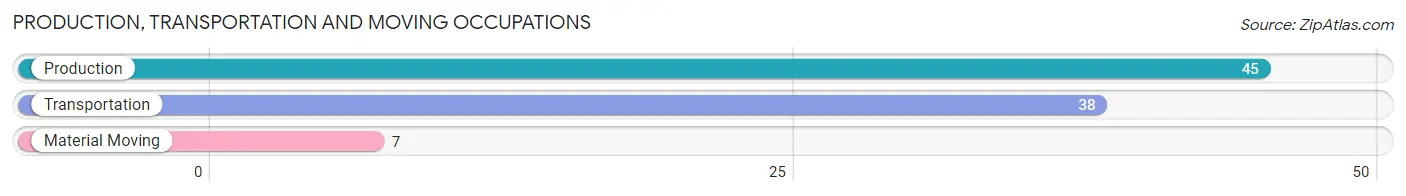
Production, Transportation and Moving Occupations
The most common Production, Transportation and Moving occupations in Lake Erie Beach are Production (45 | 3.5%), Transportation (38 | 3.0%), and Material Moving (7 | 0.5%).
Production, Transportation and Moving Occupations by Sex
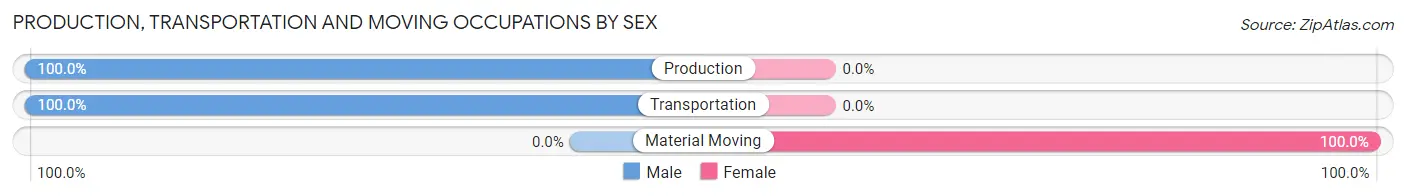
| Occupation | Male | Female |
| Production | 45 (100.0%) | 0 (0.0%) |
| Transportation | 38 (100.0%) | 0 (0.0%) |
| Material Moving | 0 (0.0%) | 7 (100.0%) |
| Total (Category) | 83 (92.2%) | 7 (7.8%) |
| Total (Overall) | 650 (50.7%) | 631 (49.3%) |
Employment Industries by Sex in Lake Erie Beach
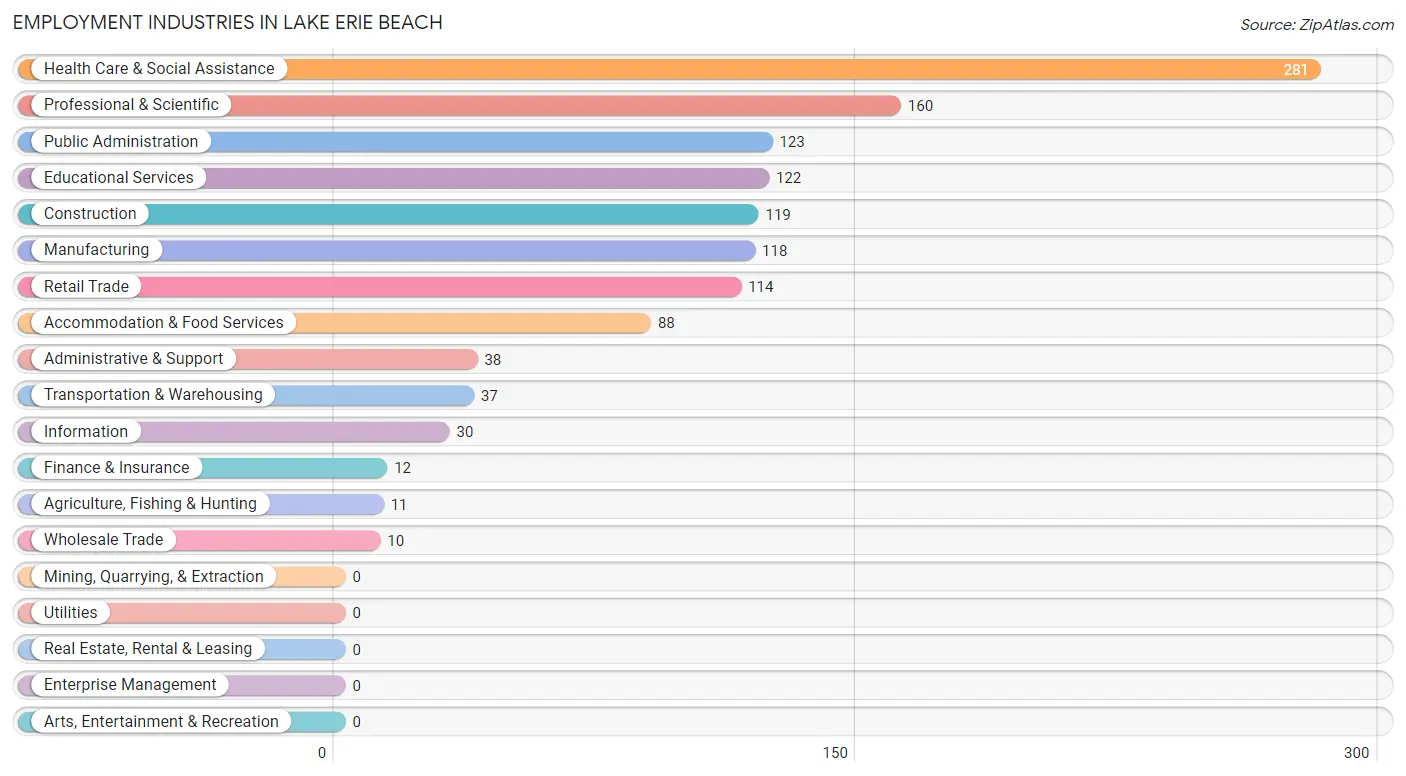
Employment Industries in Lake Erie Beach
The major employment industries in Lake Erie Beach include Health Care & Social Assistance (281 | 21.9%), Professional & Scientific (160 | 12.5%), Public Administration (123 | 9.6%), Educational Services (122 | 9.5%), and Construction (119 | 9.3%).
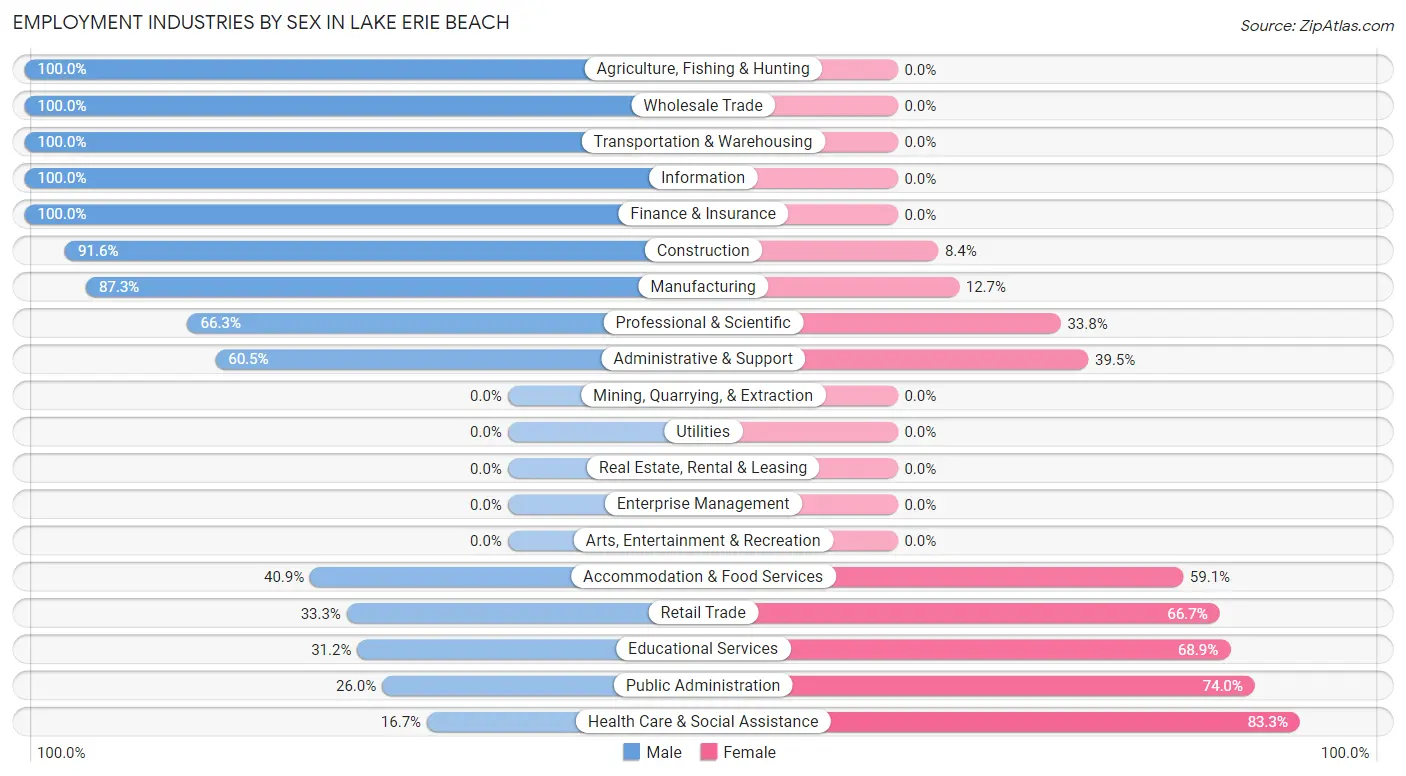
Employment Industries by Sex in Lake Erie Beach
The Lake Erie Beach industries that see more men than women are Agriculture, Fishing & Hunting (100.0%), Wholesale Trade (100.0%), and Transportation & Warehousing (100.0%), whereas the industries that tend to have a higher number of women are Health Care & Social Assistance (83.3%), Public Administration (74.0%), and Educational Services (68.9%).
| Industry | Male | Female |
| Agriculture, Fishing & Hunting | 11 (100.0%) | 0 (0.0%) |
| Mining, Quarrying, & Extraction | 0 (0.0%) | 0 (0.0%) |
| Construction | 109 (91.6%) | 10 (8.4%) |
| Manufacturing | 103 (87.3%) | 15 (12.7%) |
| Wholesale Trade | 10 (100.0%) | 0 (0.0%) |
| Retail Trade | 38 (33.3%) | 76 (66.7%) |
| Transportation & Warehousing | 37 (100.0%) | 0 (0.0%) |
| Utilities | 0 (0.0%) | 0 (0.0%) |
| Information | 30 (100.0%) | 0 (0.0%) |
| Finance & Insurance | 12 (100.0%) | 0 (0.0%) |
| Real Estate, Rental & Leasing | 0 (0.0%) | 0 (0.0%) |
| Professional & Scientific | 106 (66.2%) | 54 (33.8%) |
| Enterprise Management | 0 (0.0%) | 0 (0.0%) |
| Administrative & Support | 23 (60.5%) | 15 (39.5%) |
| Educational Services | 38 (31.1%) | 84 (68.9%) |
| Health Care & Social Assistance | 47 (16.7%) | 234 (83.3%) |
| Arts, Entertainment & Recreation | 0 (0.0%) | 0 (0.0%) |
| Accommodation & Food Services | 36 (40.9%) | 52 (59.1%) |
| Public Administration | 32 (26.0%) | 91 (74.0%) |
| Total | 650 (50.7%) | 631 (49.3%) |
Education in Lake Erie Beach
School Enrollment in Lake Erie Beach
The most common levels of schooling among the 690 students in Lake Erie Beach are college / undergraduate (190 | 27.5%), high school (165 | 23.9%), and middle school (104 | 15.1%).
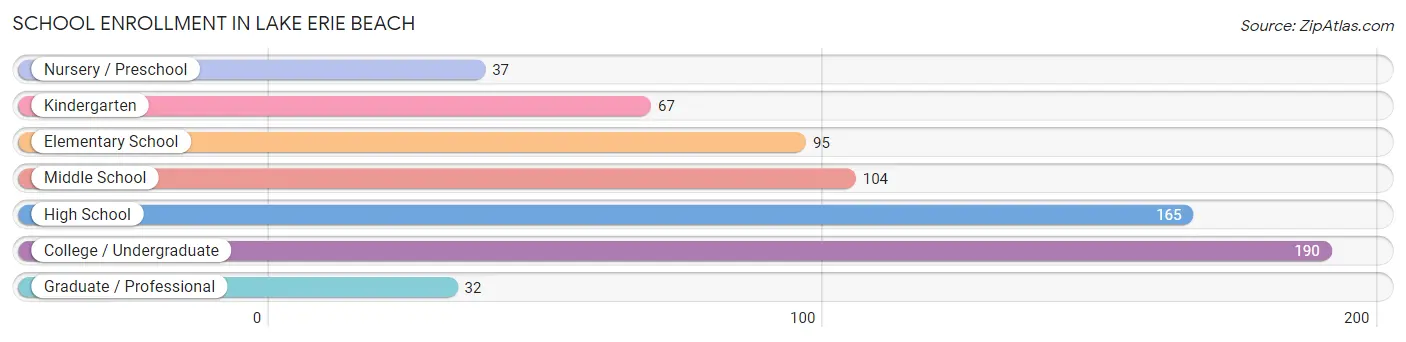
| School Level | # Students | % Students |
| Nursery / Preschool | 37 | 5.4% |
| Kindergarten | 67 | 9.7% |
| Elementary School | 95 | 13.8% |
| Middle School | 104 | 15.1% |
| High School | 165 | 23.9% |
| College / Undergraduate | 190 | 27.5% |
| Graduate / Professional | 32 | 4.6% |
| Total | 690 | 100.0% |
School Enrollment by Age by Funding Source in Lake Erie Beach
Out of a total of 690 students who are enrolled in schools in Lake Erie Beach, 80 (11.6%) attend a private institution, while the remaining 610 (88.4%) are enrolled in public schools. The age group of 25 to 34 year olds has the highest likelihood of being enrolled in private schools, with 34 (54.8% in the age bracket) enrolled. Conversely, the age group of 3 to 4 year olds has the lowest likelihood of being enrolled in a private school, with 28 (100.0% in the age bracket) attending a public institution.
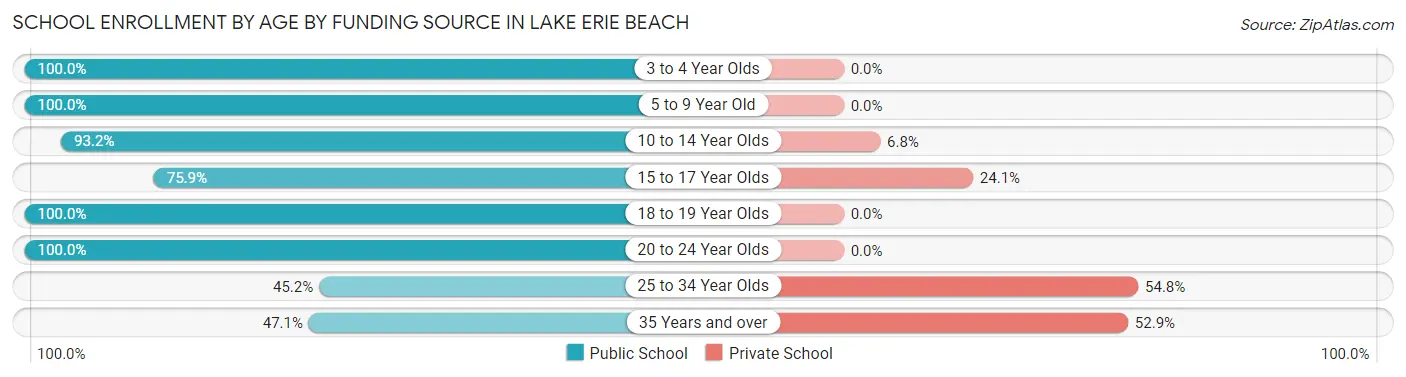
| Age Bracket | Public School | Private School |
| 3 to 4 Year Olds | 28 (100.0%) | 0 (0.0%) |
| 5 to 9 Year Old | 163 (100.0%) | 0 (0.0%) |
| 10 to 14 Year Olds | 151 (93.2%) | 11 (6.8%) |
| 15 to 17 Year Olds | 82 (75.9%) | 26 (24.1%) |
| 18 to 19 Year Olds | 55 (100.0%) | 0 (0.0%) |
| 20 to 24 Year Olds | 95 (100.0%) | 0 (0.0%) |
| 25 to 34 Year Olds | 28 (45.2%) | 34 (54.8%) |
| 35 Years and over | 8 (47.1%) | 9 (52.9%) |
| Total | 610 (88.4%) | 80 (11.6%) |
Educational Attainment by Field of Study in Lake Erie Beach
Science & technology (134 | 17.8%), business (115 | 15.3%), education (114 | 15.2%), liberal arts & history (58 | 7.7%), and physical & health sciences (52 | 6.9%) are the most common fields of study among 751 individuals in Lake Erie Beach who have obtained a bachelor's degree or higher.
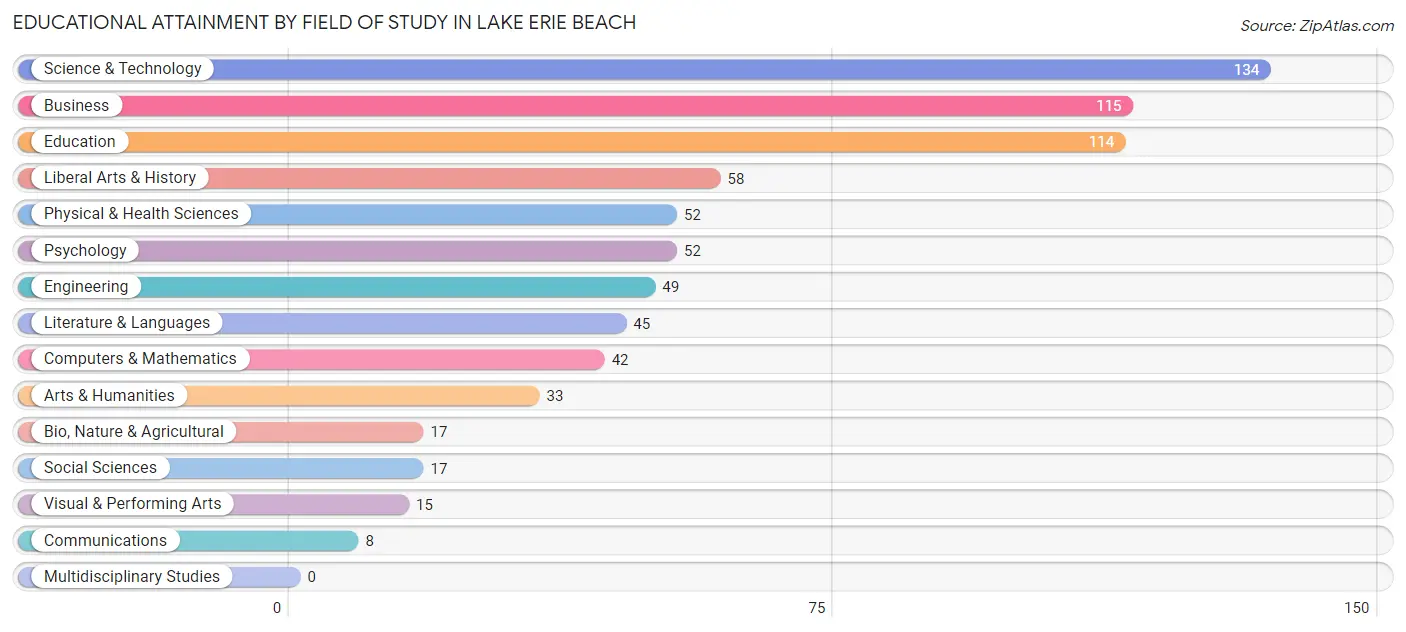
| Field of Study | # Graduates | % Graduates |
| Computers & Mathematics | 42 | 5.6% |
| Bio, Nature & Agricultural | 17 | 2.3% |
| Physical & Health Sciences | 52 | 6.9% |
| Psychology | 52 | 6.9% |
| Social Sciences | 17 | 2.3% |
| Engineering | 49 | 6.5% |
| Multidisciplinary Studies | 0 | 0.0% |
| Science & Technology | 134 | 17.8% |
| Business | 115 | 15.3% |
| Education | 114 | 15.2% |
| Literature & Languages | 45 | 6.0% |
| Liberal Arts & History | 58 | 7.7% |
| Visual & Performing Arts | 15 | 2.0% |
| Communications | 8 | 1.1% |
| Arts & Humanities | 33 | 4.4% |
| Total | 751 | 100.0% |
Transportation & Commute in Lake Erie Beach
Vehicle Availability by Sex in Lake Erie Beach
The most prevalent vehicle ownership categories in Lake Erie Beach are males with 2 vehicles (314, accounting for 49.1%) and females with 2 vehicles (276, making up 51.8%).
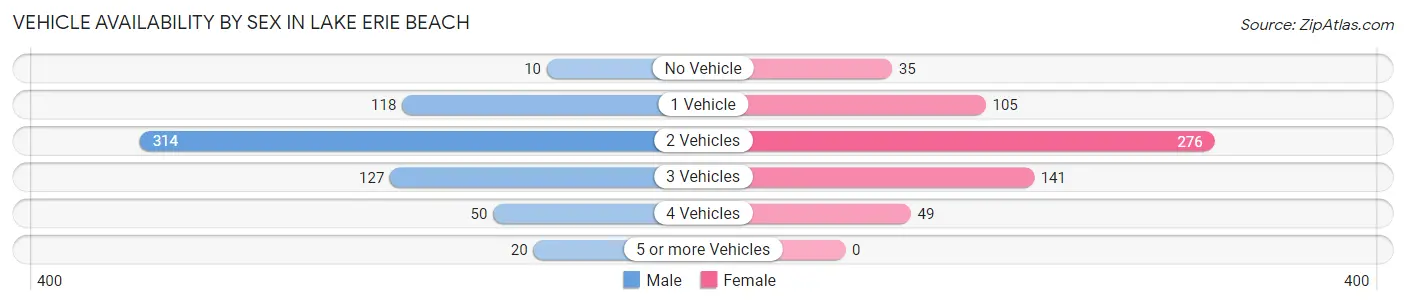
| Vehicles Available | Male | Female |
| No Vehicle | 10 (1.6%) | 35 (5.8%) |
| 1 Vehicle | 118 (18.5%) | 105 (17.3%) |
| 2 Vehicles | 314 (49.1%) | 276 (45.5%) |
| 3 Vehicles | 127 (19.9%) | 141 (23.3%) |
| 4 Vehicles | 50 (7.8%) | 49 (8.1%) |
| 5 or more Vehicles | 20 (3.1%) | 0 (0.0%) |
| Total | 639 (100.0%) | 606 (100.0%) |
Commute Time in Lake Erie Beach
The most frequently occuring commute durations in Lake Erie Beach are 30 to 34 minutes (325 commuters, 27.1%), 45 to 59 minutes (207 commuters, 17.2%), and 5 to 9 minutes (175 commuters, 14.6%).
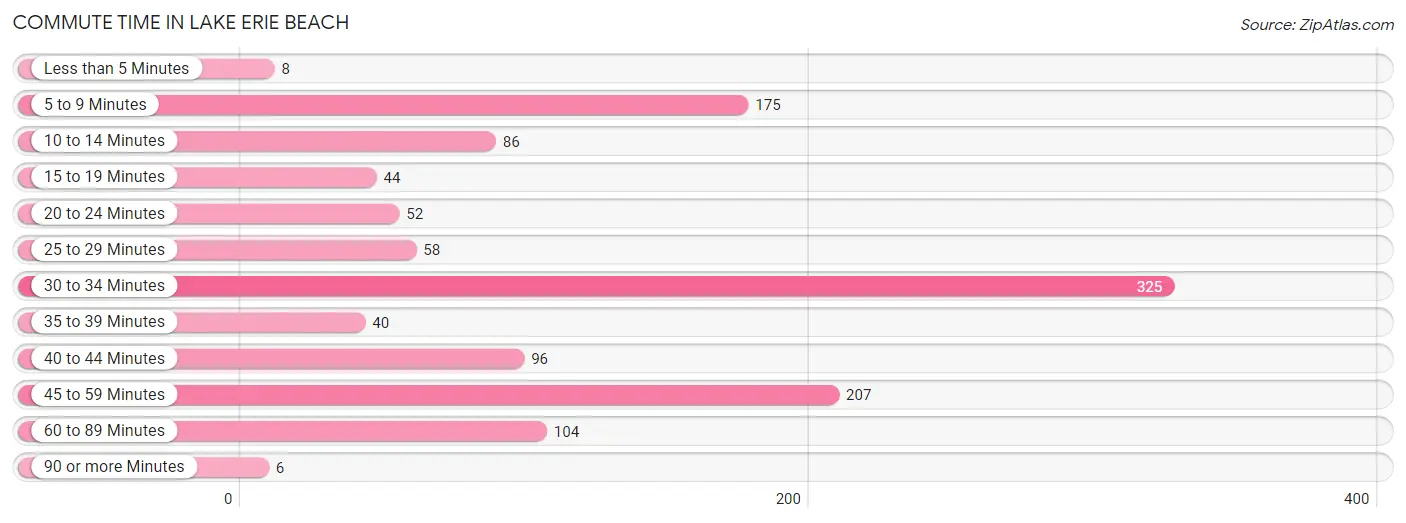
| Commute Time | # Commuters | % Commuters |
| Less than 5 Minutes | 8 | 0.7% |
| 5 to 9 Minutes | 175 | 14.6% |
| 10 to 14 Minutes | 86 | 7.2% |
| 15 to 19 Minutes | 44 | 3.7% |
| 20 to 24 Minutes | 52 | 4.3% |
| 25 to 29 Minutes | 58 | 4.8% |
| 30 to 34 Minutes | 325 | 27.1% |
| 35 to 39 Minutes | 40 | 3.3% |
| 40 to 44 Minutes | 96 | 8.0% |
| 45 to 59 Minutes | 207 | 17.2% |
| 60 to 89 Minutes | 104 | 8.7% |
| 90 or more Minutes | 6 | 0.5% |
Commute Time by Sex in Lake Erie Beach
The most common commute times in Lake Erie Beach are 30 to 34 minutes (168 commuters, 28.0%) for males and 30 to 34 minutes (157 commuters, 26.2%) for females.
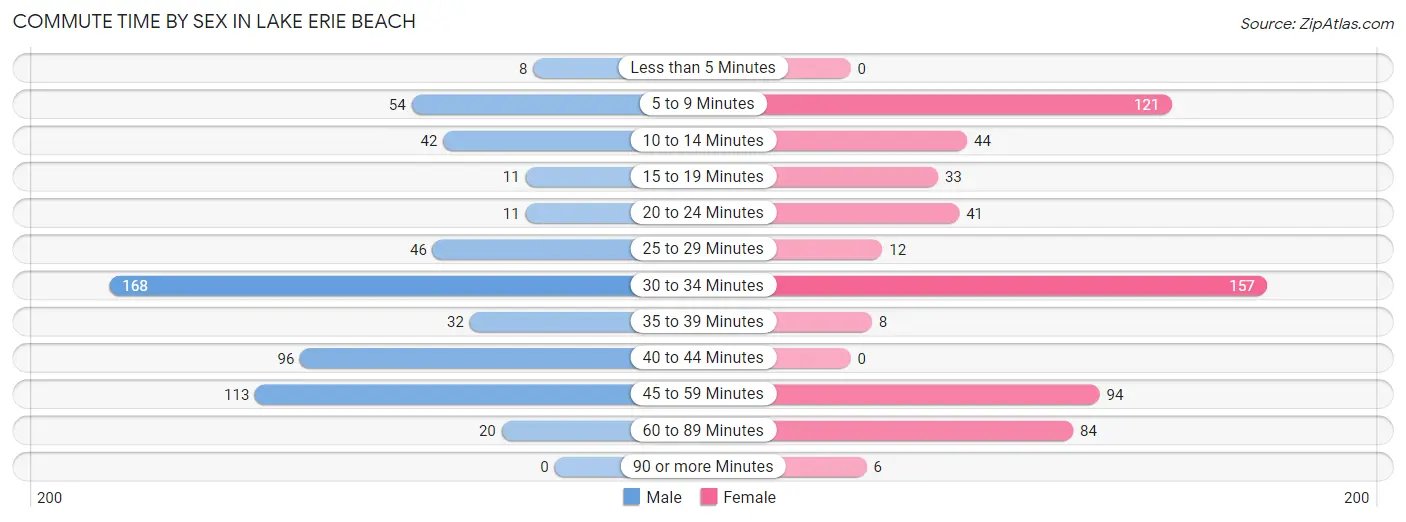
| Commute Time | Male | Female |
| Less than 5 Minutes | 8 (1.3%) | 0 (0.0%) |
| 5 to 9 Minutes | 54 (9.0%) | 121 (20.2%) |
| 10 to 14 Minutes | 42 (7.0%) | 44 (7.3%) |
| 15 to 19 Minutes | 11 (1.8%) | 33 (5.5%) |
| 20 to 24 Minutes | 11 (1.8%) | 41 (6.8%) |
| 25 to 29 Minutes | 46 (7.6%) | 12 (2.0%) |
| 30 to 34 Minutes | 168 (28.0%) | 157 (26.2%) |
| 35 to 39 Minutes | 32 (5.3%) | 8 (1.3%) |
| 40 to 44 Minutes | 96 (16.0%) | 0 (0.0%) |
| 45 to 59 Minutes | 113 (18.8%) | 94 (15.7%) |
| 60 to 89 Minutes | 20 (3.3%) | 84 (14.0%) |
| 90 or more Minutes | 0 (0.0%) | 6 (1.0%) |
Time of Departure to Work by Sex in Lake Erie Beach
The most frequent times of departure to work in Lake Erie Beach are 7:00 AM to 7:29 AM (178, 29.6%) for males and 6:00 AM to 6:29 AM (131, 21.8%) for females.
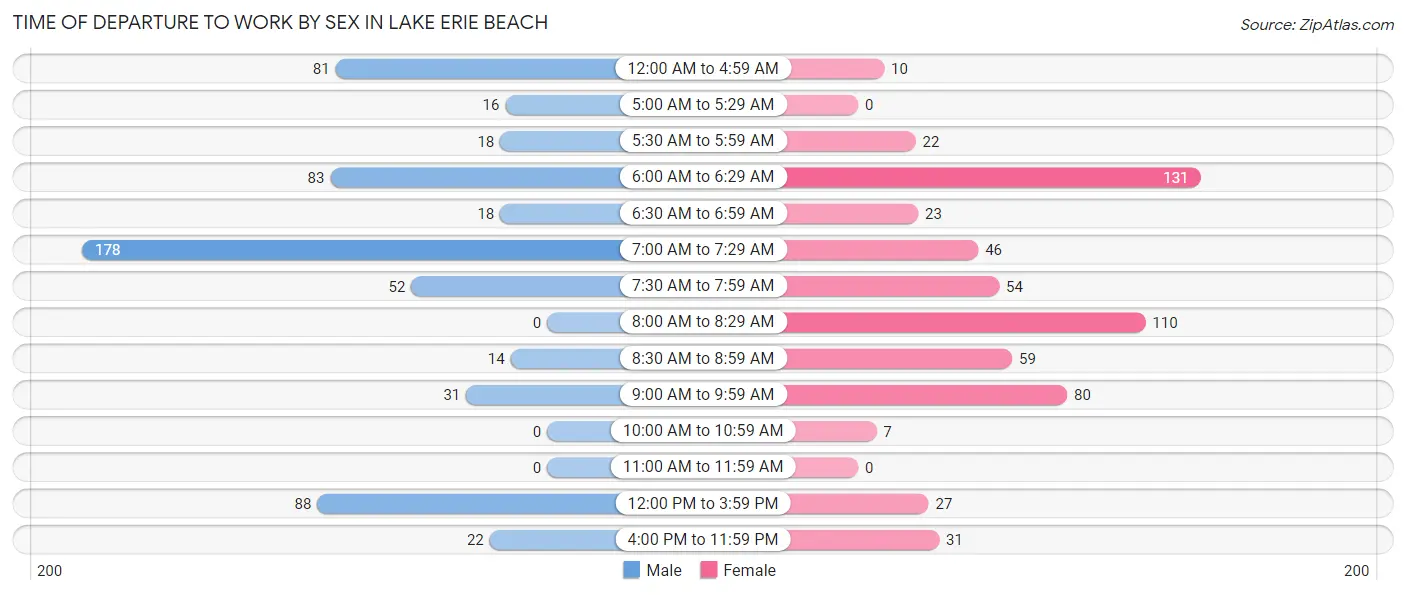
| Time of Departure | Male | Female |
| 12:00 AM to 4:59 AM | 81 (13.5%) | 10 (1.7%) |
| 5:00 AM to 5:29 AM | 16 (2.7%) | 0 (0.0%) |
| 5:30 AM to 5:59 AM | 18 (3.0%) | 22 (3.7%) |
| 6:00 AM to 6:29 AM | 83 (13.8%) | 131 (21.8%) |
| 6:30 AM to 6:59 AM | 18 (3.0%) | 23 (3.8%) |
| 7:00 AM to 7:29 AM | 178 (29.6%) | 46 (7.7%) |
| 7:30 AM to 7:59 AM | 52 (8.6%) | 54 (9.0%) |
| 8:00 AM to 8:29 AM | 0 (0.0%) | 110 (18.3%) |
| 8:30 AM to 8:59 AM | 14 (2.3%) | 59 (9.8%) |
| 9:00 AM to 9:59 AM | 31 (5.2%) | 80 (13.3%) |
| 10:00 AM to 10:59 AM | 0 (0.0%) | 7 (1.2%) |
| 11:00 AM to 11:59 AM | 0 (0.0%) | 0 (0.0%) |
| 12:00 PM to 3:59 PM | 88 (14.6%) | 27 (4.5%) |
| 4:00 PM to 11:59 PM | 22 (3.7%) | 31 (5.2%) |
| Total | 601 (100.0%) | 600 (100.0%) |
Housing Occupancy in Lake Erie Beach
Occupancy by Ownership in Lake Erie Beach
Of the total 1,498 dwellings in Lake Erie Beach, owner-occupied units account for 1,416 (94.5%), while renter-occupied units make up 82 (5.5%).
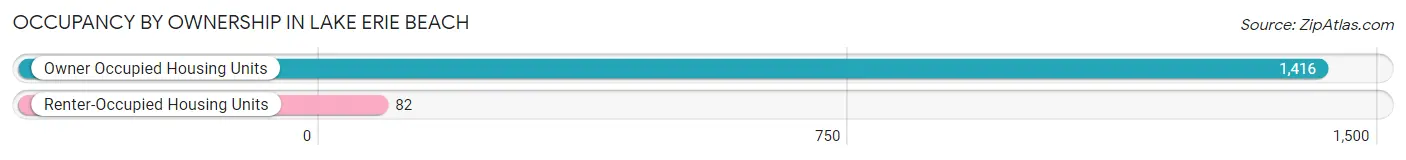
| Occupancy | # Housing Units | % Housing Units |
| Owner Occupied Housing Units | 1,416 | 94.5% |
| Renter-Occupied Housing Units | 82 | 5.5% |
| Total Occupied Housing Units | 1,498 | 100.0% |
Occupancy by Household Size in Lake Erie Beach
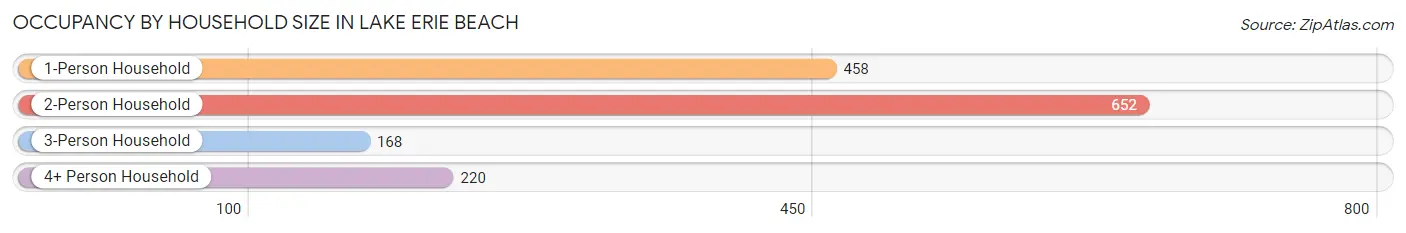
| Household Size | # Housing Units | % Housing Units |
| 1-Person Household | 458 | 30.6% |
| 2-Person Household | 652 | 43.5% |
| 3-Person Household | 168 | 11.2% |
| 4+ Person Household | 220 | 14.7% |
| Total Housing Units | 1,498 | 100.0% |
Occupancy by Ownership by Household Size in Lake Erie Beach
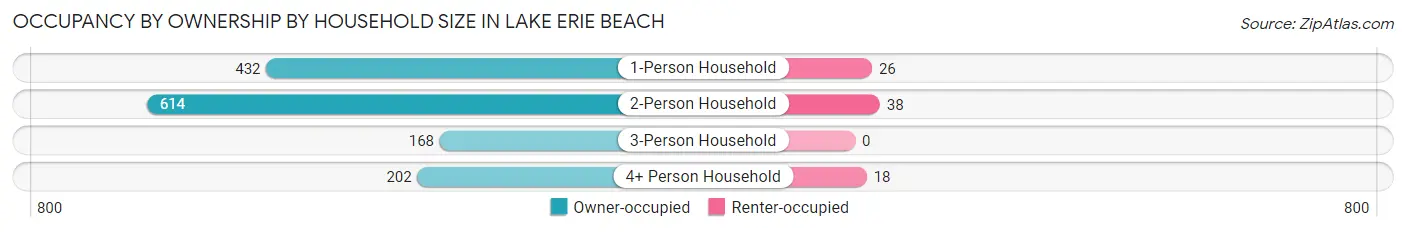
| Household Size | Owner-occupied | Renter-occupied |
| 1-Person Household | 432 (94.3%) | 26 (5.7%) |
| 2-Person Household | 614 (94.2%) | 38 (5.8%) |
| 3-Person Household | 168 (100.0%) | 0 (0.0%) |
| 4+ Person Household | 202 (91.8%) | 18 (8.2%) |
| Total Housing Units | 1,416 (94.5%) | 82 (5.5%) |
Occupancy by Educational Attainment in Lake Erie Beach
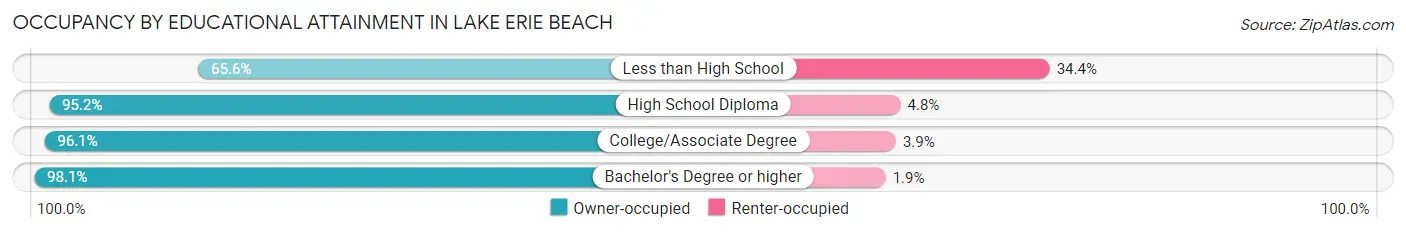
| Household Size | Owner-occupied | Renter-occupied |
| Less than High School | 61 (65.6%) | 32 (34.4%) |
| High School Diploma | 354 (95.2%) | 18 (4.8%) |
| College/Associate Degree | 589 (96.1%) | 24 (3.9%) |
| Bachelor's Degree or higher | 412 (98.1%) | 8 (1.9%) |
Occupancy by Age of Householder in Lake Erie Beach
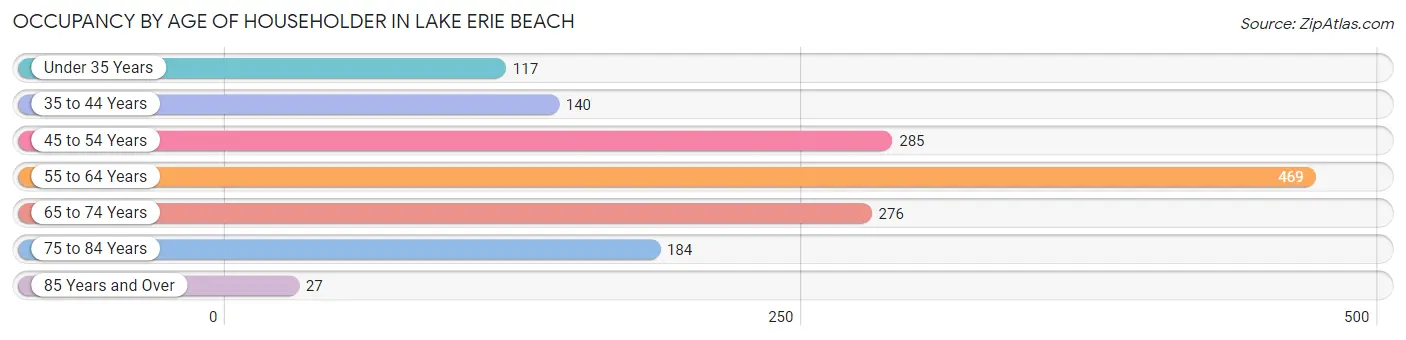
| Age Bracket | # Households | % Households |
| Under 35 Years | 117 | 7.8% |
| 35 to 44 Years | 140 | 9.3% |
| 45 to 54 Years | 285 | 19.0% |
| 55 to 64 Years | 469 | 31.3% |
| 65 to 74 Years | 276 | 18.4% |
| 75 to 84 Years | 184 | 12.3% |
| 85 Years and Over | 27 | 1.8% |
| Total | 1,498 | 100.0% |
Housing Finances in Lake Erie Beach
Median Income by Occupancy in Lake Erie Beach
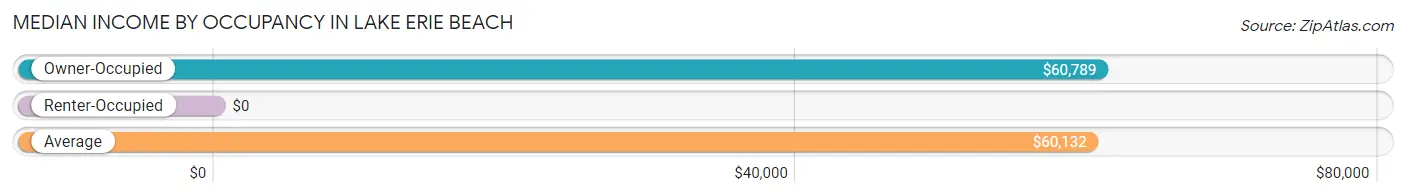
| Occupancy Type | # Households | Median Income |
| Owner-Occupied | 1,416 (94.5%) | $60,789 |
| Renter-Occupied | 82 (5.5%) | $0 |
| Average | 1,498 (100.0%) | $60,132 |
Occupancy by Householder Income Bracket in Lake Erie Beach
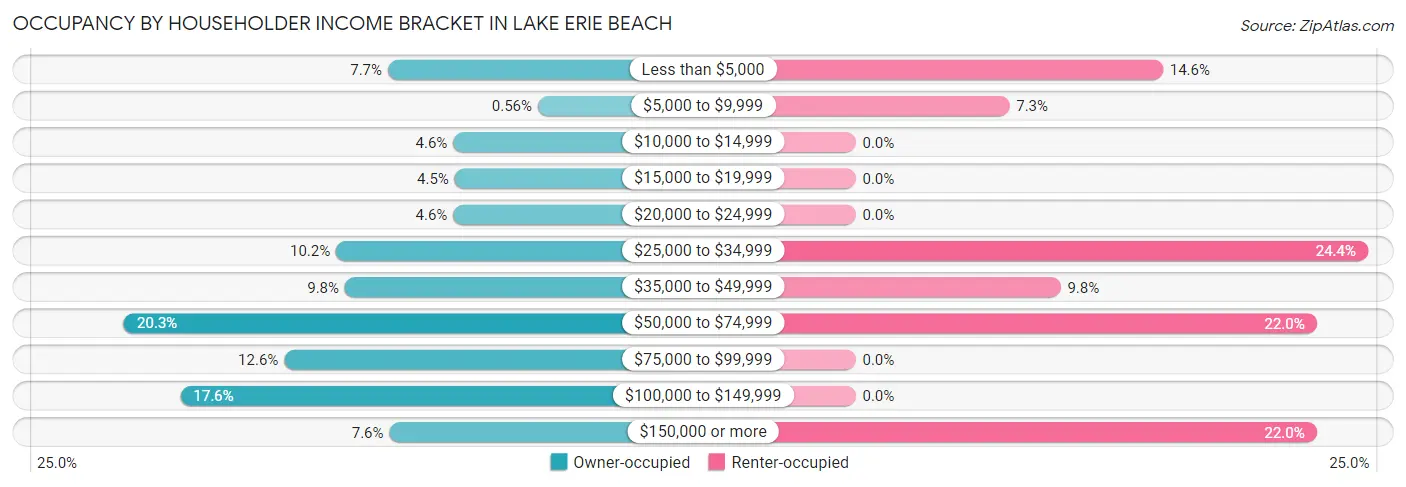
| Income Bracket | Owner-occupied | Renter-occupied |
| Less than $5,000 | 109 (7.7%) | 12 (14.6%) |
| $5,000 to $9,999 | 8 (0.6%) | 6 (7.3%) |
| $10,000 to $14,999 | 65 (4.6%) | 0 (0.0%) |
| $15,000 to $19,999 | 64 (4.5%) | 0 (0.0%) |
| $20,000 to $24,999 | 65 (4.6%) | 0 (0.0%) |
| $25,000 to $34,999 | 144 (10.2%) | 20 (24.4%) |
| $35,000 to $49,999 | 138 (9.8%) | 8 (9.8%) |
| $50,000 to $74,999 | 287 (20.3%) | 18 (22.0%) |
| $75,000 to $99,999 | 179 (12.6%) | 0 (0.0%) |
| $100,000 to $149,999 | 249 (17.6%) | 0 (0.0%) |
| $150,000 or more | 108 (7.6%) | 18 (22.0%) |
| Total | 1,416 (100.0%) | 82 (100.0%) |
Monthly Housing Cost Tiers in Lake Erie Beach
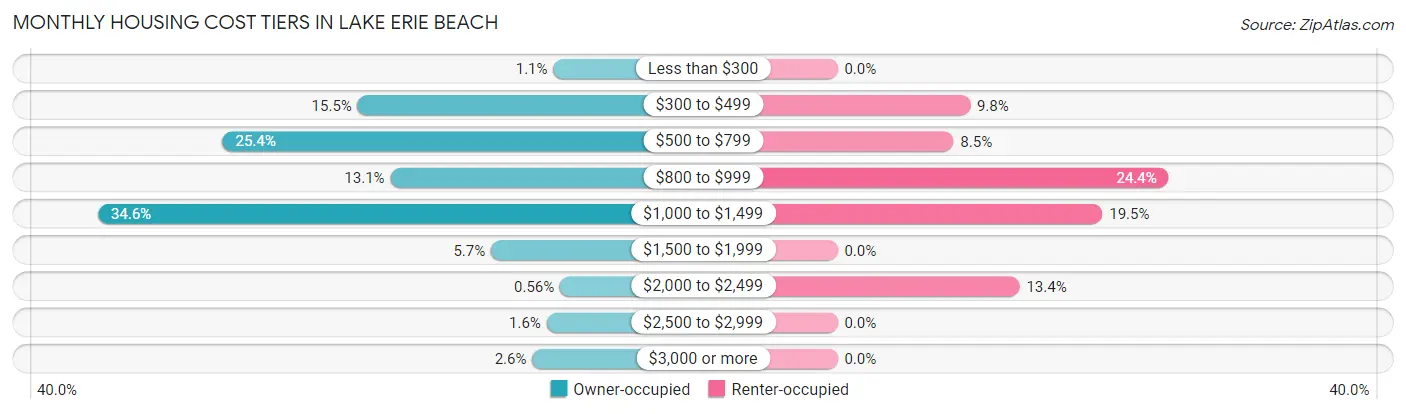
| Monthly Cost | Owner-occupied | Renter-occupied |
| Less than $300 | 15 (1.1%) | 0 (0.0%) |
| $300 to $499 | 219 (15.5%) | 8 (9.8%) |
| $500 to $799 | 360 (25.4%) | 7 (8.5%) |
| $800 to $999 | 185 (13.1%) | 20 (24.4%) |
| $1,000 to $1,499 | 490 (34.6%) | 16 (19.5%) |
| $1,500 to $1,999 | 80 (5.7%) | 0 (0.0%) |
| $2,000 to $2,499 | 8 (0.6%) | 11 (13.4%) |
| $2,500 to $2,999 | 22 (1.5%) | 0 (0.0%) |
| $3,000 or more | 37 (2.6%) | 0 (0.0%) |
| Total | 1,416 (100.0%) | 82 (100.0%) |
Physical Housing Characteristics in Lake Erie Beach
Housing Structures in Lake Erie Beach
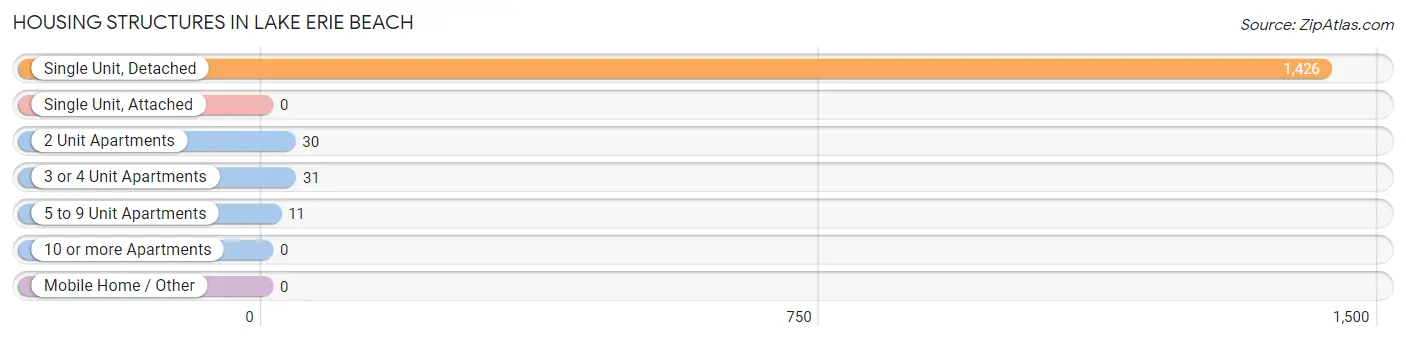
| Structure Type | # Housing Units | % Housing Units |
| Single Unit, Detached | 1,426 | 95.2% |
| Single Unit, Attached | 0 | 0.0% |
| 2 Unit Apartments | 30 | 2.0% |
| 3 or 4 Unit Apartments | 31 | 2.1% |
| 5 to 9 Unit Apartments | 11 | 0.7% |
| 10 or more Apartments | 0 | 0.0% |
| Mobile Home / Other | 0 | 0.0% |
| Total | 1,498 | 100.0% |
Housing Structures by Occupancy in Lake Erie Beach
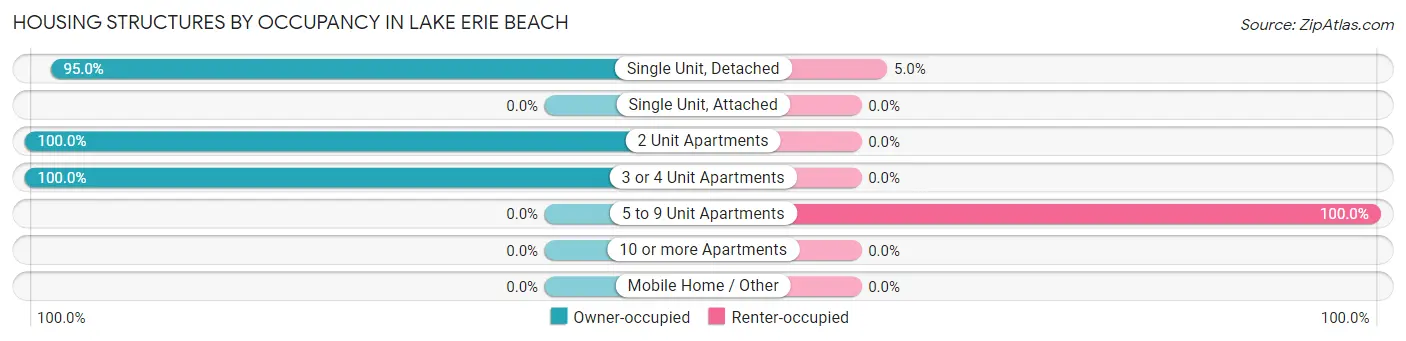
| Structure Type | Owner-occupied | Renter-occupied |
| Single Unit, Detached | 1,355 (95.0%) | 71 (5.0%) |
| Single Unit, Attached | 0 (0.0%) | 0 (0.0%) |
| 2 Unit Apartments | 30 (100.0%) | 0 (0.0%) |
| 3 or 4 Unit Apartments | 31 (100.0%) | 0 (0.0%) |
| 5 to 9 Unit Apartments | 0 (0.0%) | 11 (100.0%) |
| 10 or more Apartments | 0 (0.0%) | 0 (0.0%) |
| Mobile Home / Other | 0 (0.0%) | 0 (0.0%) |
| Total | 1,416 (94.5%) | 82 (5.5%) |
Housing Structures by Number of Rooms in Lake Erie Beach
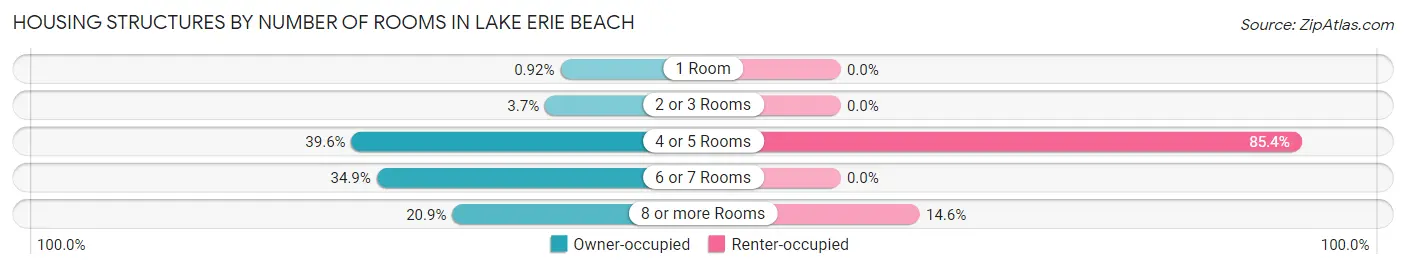
| Number of Rooms | Owner-occupied | Renter-occupied |
| 1 Room | 13 (0.9%) | 0 (0.0%) |
| 2 or 3 Rooms | 53 (3.7%) | 0 (0.0%) |
| 4 or 5 Rooms | 560 (39.6%) | 70 (85.4%) |
| 6 or 7 Rooms | 494 (34.9%) | 0 (0.0%) |
| 8 or more Rooms | 296 (20.9%) | 12 (14.6%) |
| Total | 1,416 (100.0%) | 82 (100.0%) |
Housing Structure by Heating Type in Lake Erie Beach
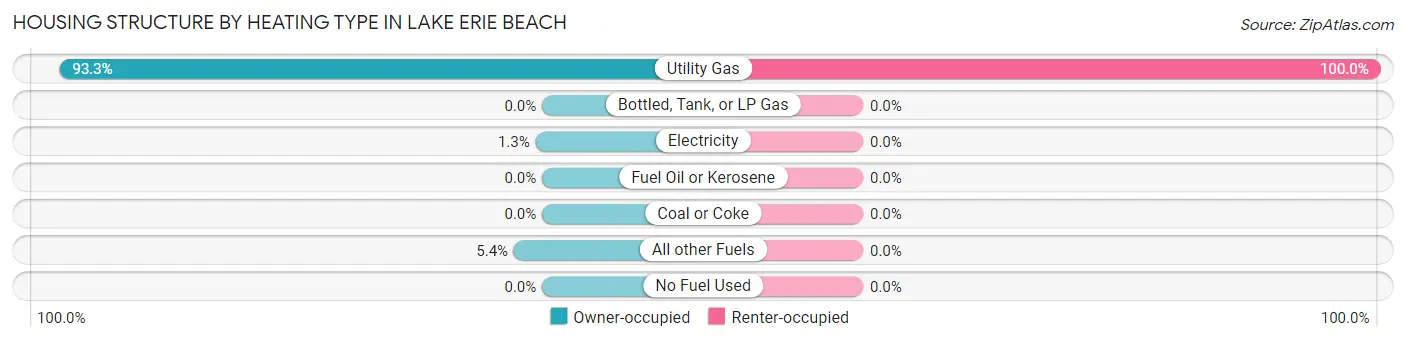
| Heating Type | Owner-occupied | Renter-occupied |
| Utility Gas | 1,321 (93.3%) | 82 (100.0%) |
| Bottled, Tank, or LP Gas | 0 (0.0%) | 0 (0.0%) |
| Electricity | 18 (1.3%) | 0 (0.0%) |
| Fuel Oil or Kerosene | 0 (0.0%) | 0 (0.0%) |
| Coal or Coke | 0 (0.0%) | 0 (0.0%) |
| All other Fuels | 77 (5.4%) | 0 (0.0%) |
| No Fuel Used | 0 (0.0%) | 0 (0.0%) |
| Total | 1,416 (100.0%) | 82 (100.0%) |
Household Vehicle Usage in Lake Erie Beach
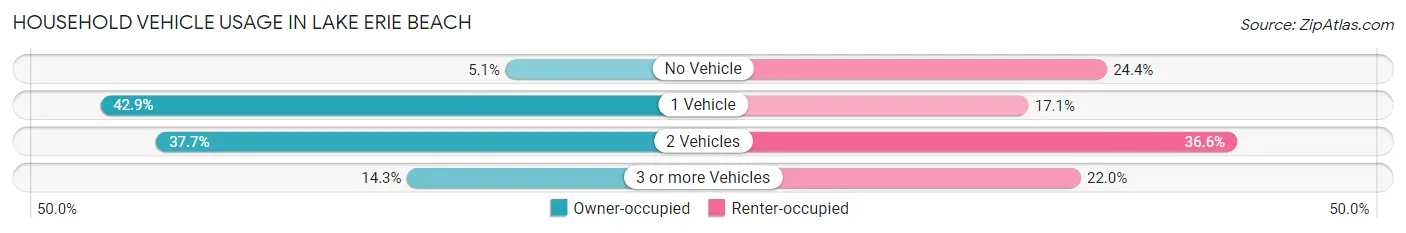
| Vehicles per Household | Owner-occupied | Renter-occupied |
| No Vehicle | 72 (5.1%) | 20 (24.4%) |
| 1 Vehicle | 608 (42.9%) | 14 (17.1%) |
| 2 Vehicles | 534 (37.7%) | 30 (36.6%) |
| 3 or more Vehicles | 202 (14.3%) | 18 (22.0%) |
| Total | 1,416 (100.0%) | 82 (100.0%) |
Real Estate & Mortgages in Lake Erie Beach
Real Estate and Mortgage Overview in Lake Erie Beach
| Characteristic | Without Mortgage | With Mortgage |
| Housing Units | 696 | 720 |
| Median Property Value | $153,600 | $99,100 |
| Median Household Income | $30,556 | $68 |
| Monthly Housing Costs | $626 | $12 |
| Real Estate Taxes | $3,902 | $24 |
Property Value by Mortgage Status in Lake Erie Beach
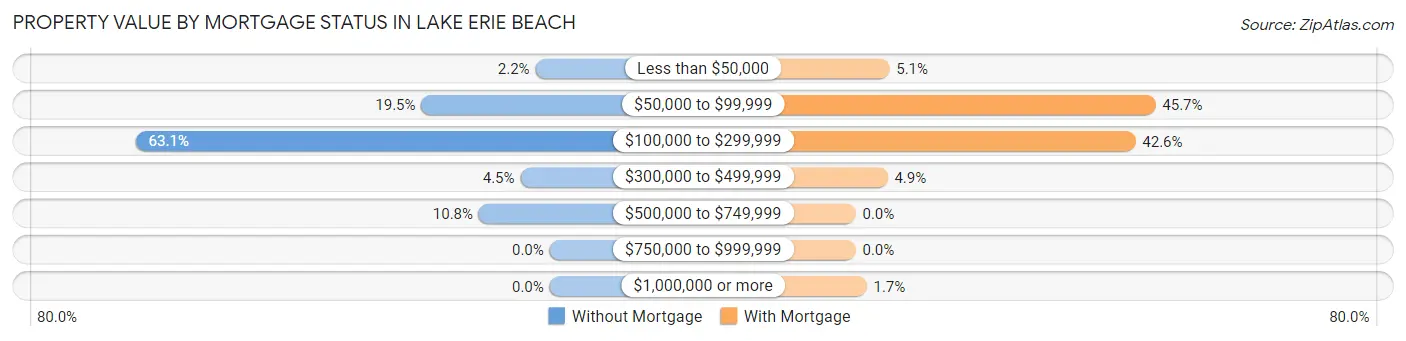
| Property Value | Without Mortgage | With Mortgage |
| Less than $50,000 | 15 (2.2%) | 37 (5.1%) |
| $50,000 to $99,999 | 136 (19.5%) | 329 (45.7%) |
| $100,000 to $299,999 | 439 (63.1%) | 307 (42.6%) |
| $300,000 to $499,999 | 31 (4.4%) | 35 (4.9%) |
| $500,000 to $749,999 | 75 (10.8%) | 0 (0.0%) |
| $750,000 to $999,999 | 0 (0.0%) | 0 (0.0%) |
| $1,000,000 or more | 0 (0.0%) | 12 (1.7%) |
| Total | 696 (100.0%) | 720 (100.0%) |
Household Income by Mortgage Status in Lake Erie Beach
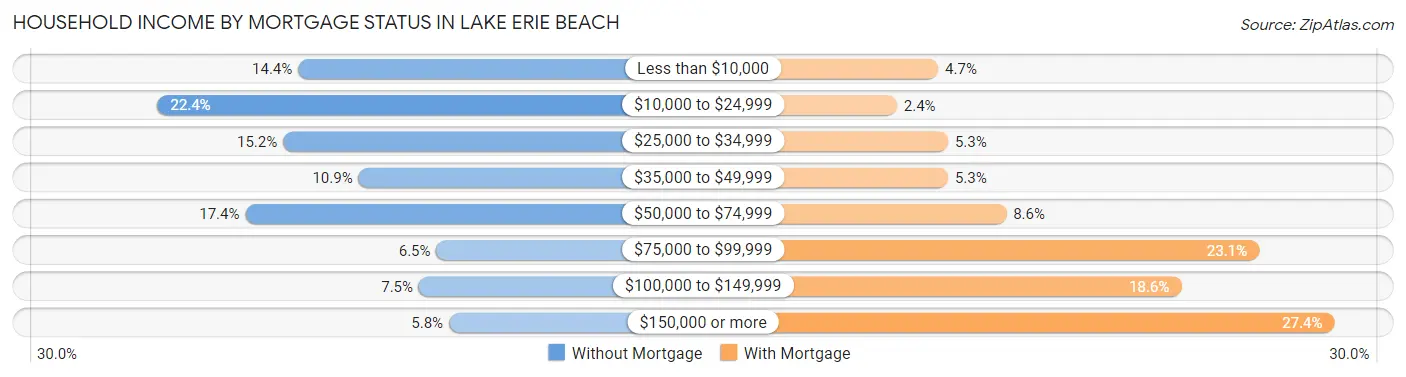
| Household Income | Without Mortgage | With Mortgage |
| Less than $10,000 | 100 (14.4%) | 34 (4.7%) |
| $10,000 to $24,999 | 156 (22.4%) | 17 (2.4%) |
| $25,000 to $34,999 | 106 (15.2%) | 38 (5.3%) |
| $35,000 to $49,999 | 76 (10.9%) | 38 (5.3%) |
| $50,000 to $74,999 | 121 (17.4%) | 62 (8.6%) |
| $75,000 to $99,999 | 45 (6.5%) | 166 (23.1%) |
| $100,000 to $149,999 | 52 (7.5%) | 134 (18.6%) |
| $150,000 or more | 40 (5.8%) | 197 (27.4%) |
| Total | 696 (100.0%) | 720 (100.0%) |
Property Value to Household Income Ratio in Lake Erie Beach
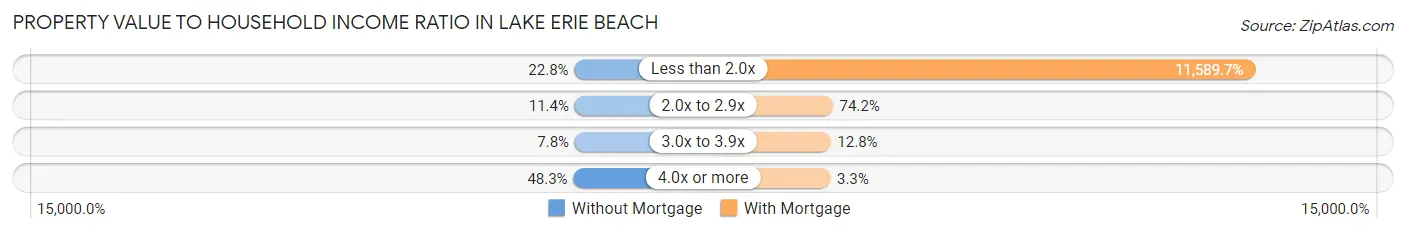
| Value-to-Income Ratio | Without Mortgage | With Mortgage |
| Less than 2.0x | 159 (22.8%) | 83,446 (11,589.7%) |
| 2.0x to 2.9x | 79 (11.4%) | 534 (74.2%) |
| 3.0x to 3.9x | 54 (7.8%) | 92 (12.8%) |
| 4.0x or more | 336 (48.3%) | 24 (3.3%) |
| Total | 696 (100.0%) | 720 (100.0%) |
Real Estate Taxes by Mortgage Status in Lake Erie Beach
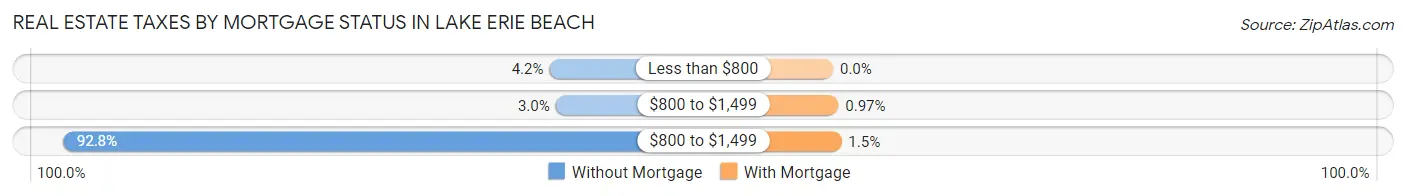
| Property Taxes | Without Mortgage | With Mortgage |
| Less than $800 | 29 (4.2%) | 0 (0.0%) |
| $800 to $1,499 | 21 (3.0%) | 7 (1.0%) |
| $800 to $1,499 | 646 (92.8%) | 11 (1.5%) |
| Total | 696 (100.0%) | 720 (100.0%) |
Health & Disability in Lake Erie Beach
Health Insurance Coverage by Age in Lake Erie Beach
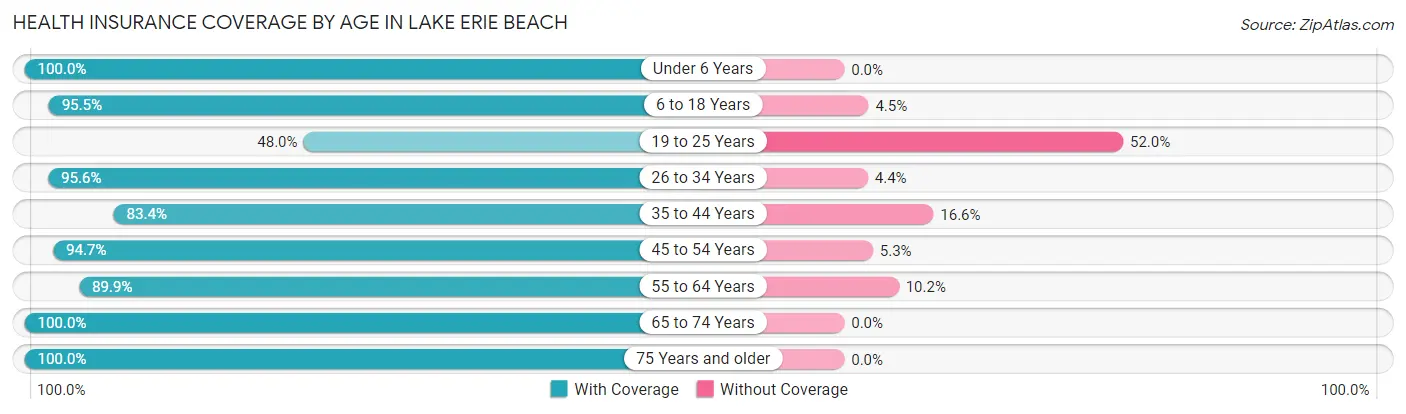
| Age Bracket | With Coverage | Without Coverage |
| Under 6 Years | 207 (100.0%) | 0 (0.0%) |
| 6 to 18 Years | 381 (95.5%) | 18 (4.5%) |
| 19 to 25 Years | 109 (48.0%) | 118 (52.0%) |
| 26 to 34 Years | 218 (95.6%) | 10 (4.4%) |
| 35 to 44 Years | 246 (83.4%) | 49 (16.6%) |
| 45 to 54 Years | 409 (94.7%) | 23 (5.3%) |
| 55 to 64 Years | 673 (89.8%) | 76 (10.2%) |
| 65 to 74 Years | 474 (100.0%) | 0 (0.0%) |
| 75 Years and older | 271 (100.0%) | 0 (0.0%) |
| Total | 2,988 (91.0%) | 294 (9.0%) |
Health Insurance Coverage by Citizenship Status in Lake Erie Beach
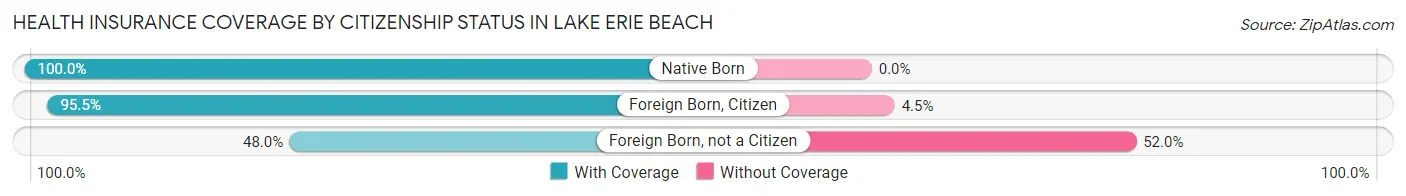
| Citizenship Status | With Coverage | Without Coverage |
| Native Born | 207 (100.0%) | 0 (0.0%) |
| Foreign Born, Citizen | 381 (95.5%) | 18 (4.5%) |
| Foreign Born, not a Citizen | 109 (48.0%) | 118 (52.0%) |
Health Insurance Coverage by Household Income in Lake Erie Beach
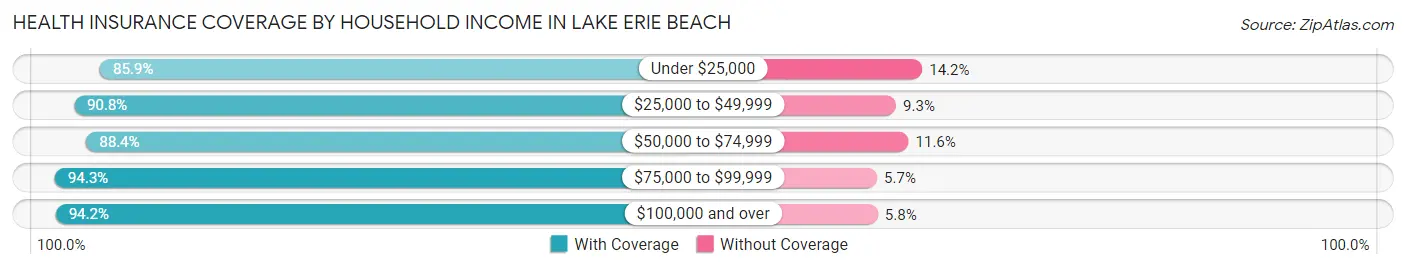
| Household Income | With Coverage | Without Coverage |
| Under $25,000 | 461 (85.9%) | 76 (14.1%) |
| $25,000 to $49,999 | 569 (90.7%) | 58 (9.2%) |
| $50,000 to $74,999 | 588 (88.4%) | 77 (11.6%) |
| $75,000 to $99,999 | 348 (94.3%) | 21 (5.7%) |
| $100,000 and over | 1,002 (94.2%) | 62 (5.8%) |
Public vs Private Health Insurance Coverage by Age in Lake Erie Beach
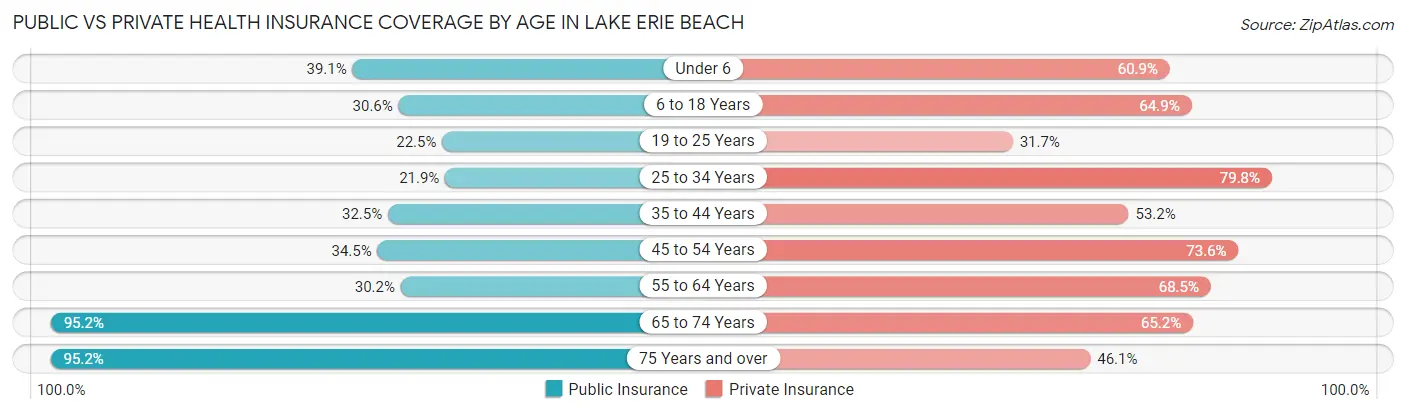
| Age Bracket | Public Insurance | Private Insurance |
| Under 6 | 81 (39.1%) | 126 (60.9%) |
| 6 to 18 Years | 122 (30.6%) | 259 (64.9%) |
| 19 to 25 Years | 51 (22.5%) | 72 (31.7%) |
| 25 to 34 Years | 50 (21.9%) | 182 (79.8%) |
| 35 to 44 Years | 96 (32.5%) | 157 (53.2%) |
| 45 to 54 Years | 149 (34.5%) | 318 (73.6%) |
| 55 to 64 Years | 226 (30.2%) | 513 (68.5%) |
| 65 to 74 Years | 451 (95.2%) | 309 (65.2%) |
| 75 Years and over | 258 (95.2%) | 125 (46.1%) |
| Total | 1,484 (45.2%) | 2,061 (62.8%) |
Disability Status by Sex by Age in Lake Erie Beach
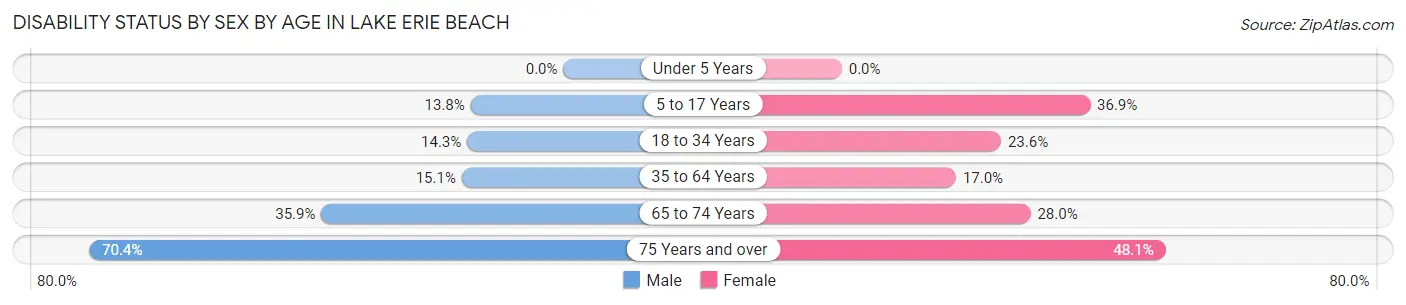
| Age Bracket | Male | Female |
| Under 5 Years | 0 (0.0%) | 0 (0.0%) |
| 5 to 17 Years | 35 (13.8%) | 66 (36.9%) |
| 18 to 34 Years | 30 (14.3%) | 65 (23.6%) |
| 35 to 64 Years | 91 (15.1%) | 148 (17.0%) |
| 65 to 74 Years | 78 (35.9%) | 72 (28.0%) |
| 75 Years and over | 100 (70.4%) | 62 (48.1%) |
Disability Class by Sex by Age in Lake Erie Beach
Disability Class: Hearing Difficulty
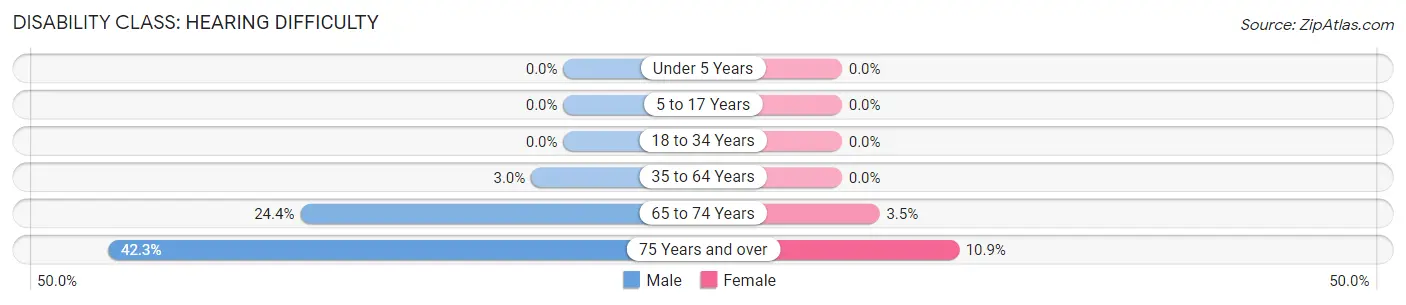
| Age Bracket | Male | Female |
| Under 5 Years | 0 (0.0%) | 0 (0.0%) |
| 5 to 17 Years | 0 (0.0%) | 0 (0.0%) |
| 18 to 34 Years | 0 (0.0%) | 0 (0.0%) |
| 35 to 64 Years | 18 (3.0%) | 0 (0.0%) |
| 65 to 74 Years | 53 (24.4%) | 9 (3.5%) |
| 75 Years and over | 60 (42.2%) | 14 (10.8%) |
Disability Class: Vision Difficulty
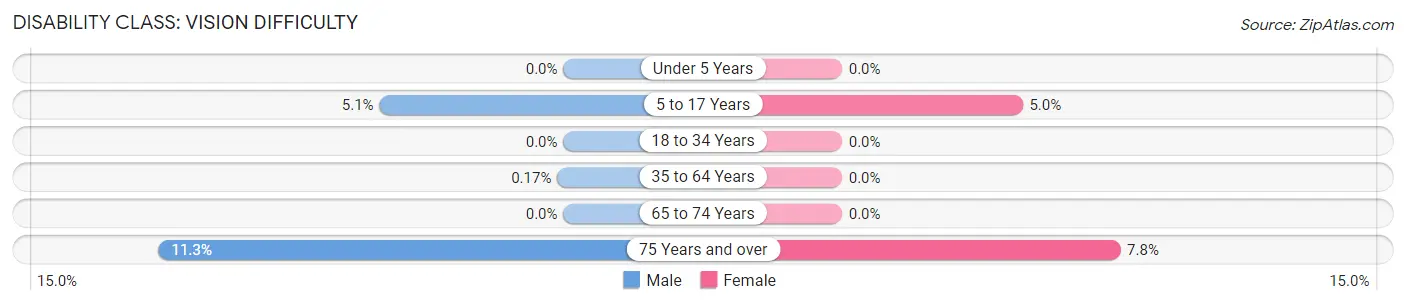
| Age Bracket | Male | Female |
| Under 5 Years | 0 (0.0%) | 0 (0.0%) |
| 5 to 17 Years | 13 (5.1%) | 9 (5.0%) |
| 18 to 34 Years | 0 (0.0%) | 0 (0.0%) |
| 35 to 64 Years | 1 (0.2%) | 0 (0.0%) |
| 65 to 74 Years | 0 (0.0%) | 0 (0.0%) |
| 75 Years and over | 16 (11.3%) | 10 (7.7%) |
Disability Class: Cognitive Difficulty
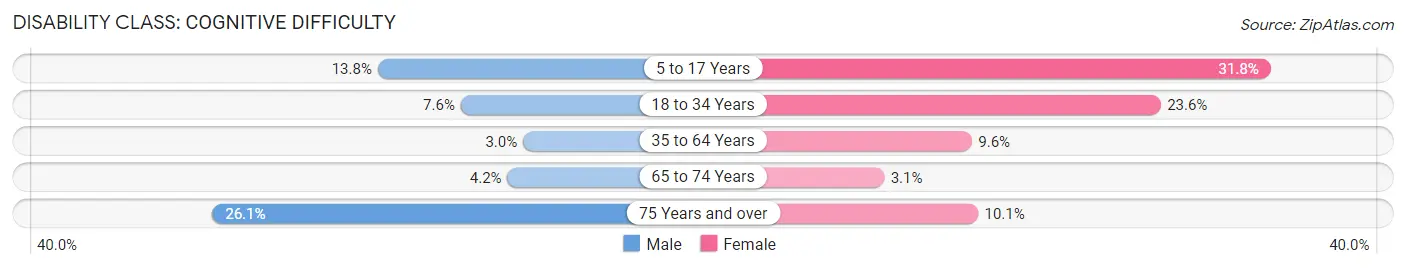
| Age Bracket | Male | Female |
| 5 to 17 Years | 35 (13.8%) | 57 (31.8%) |
| 18 to 34 Years | 16 (7.6%) | 65 (23.6%) |
| 35 to 64 Years | 18 (3.0%) | 84 (9.6%) |
| 65 to 74 Years | 9 (4.2%) | 8 (3.1%) |
| 75 Years and over | 37 (26.1%) | 13 (10.1%) |
Disability Class: Ambulatory Difficulty
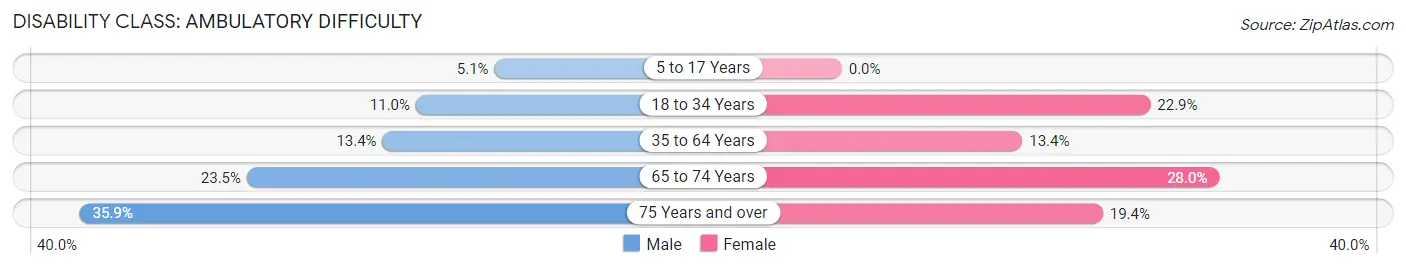
| Age Bracket | Male | Female |
| 5 to 17 Years | 13 (5.1%) | 0 (0.0%) |
| 18 to 34 Years | 23 (11.0%) | 63 (22.9%) |
| 35 to 64 Years | 81 (13.4%) | 117 (13.4%) |
| 65 to 74 Years | 51 (23.5%) | 72 (28.0%) |
| 75 Years and over | 51 (35.9%) | 25 (19.4%) |
Disability Class: Self-Care Difficulty
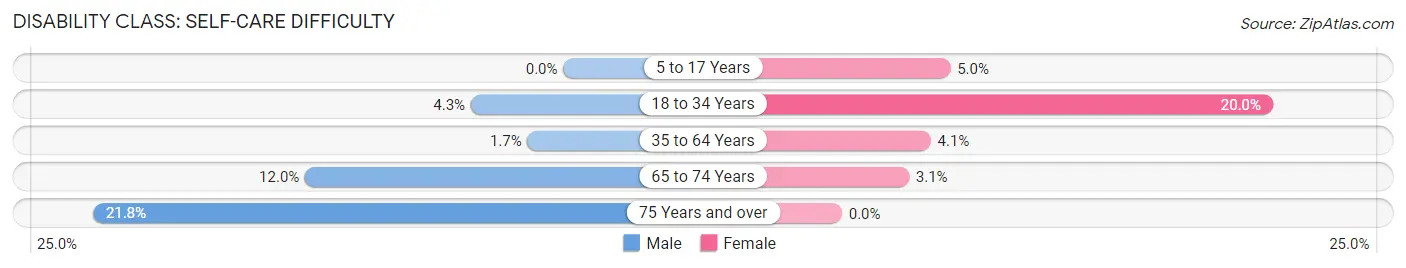
| Age Bracket | Male | Female |
| 5 to 17 Years | 0 (0.0%) | 9 (5.0%) |
| 18 to 34 Years | 9 (4.3%) | 55 (20.0%) |
| 35 to 64 Years | 10 (1.7%) | 36 (4.1%) |
| 65 to 74 Years | 26 (12.0%) | 8 (3.1%) |
| 75 Years and over | 31 (21.8%) | 0 (0.0%) |
Technology Access in Lake Erie Beach
Computing Device Access in Lake Erie Beach
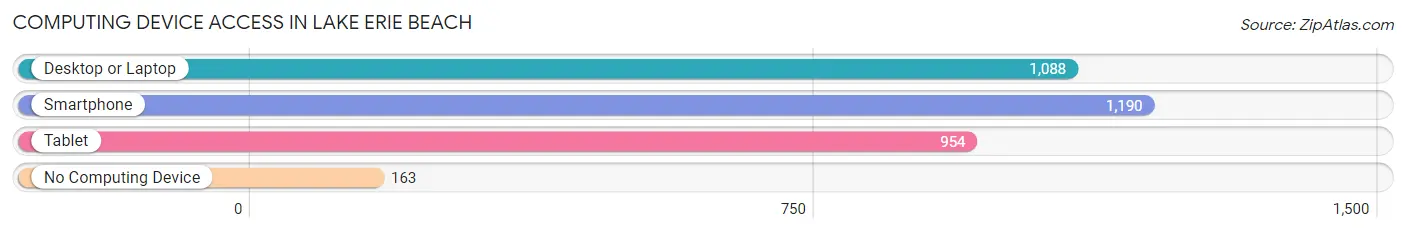
| Device Type | # Households | % Households |
| Desktop or Laptop | 1,088 | 72.6% |
| Smartphone | 1,190 | 79.4% |
| Tablet | 954 | 63.7% |
| No Computing Device | 163 | 10.9% |
| Total | 1,498 | 100.0% |
Internet Access in Lake Erie Beach
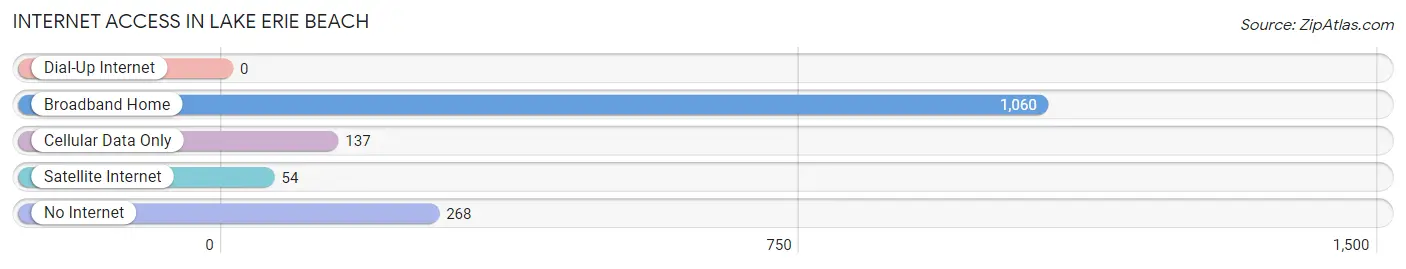
| Internet Type | # Households | % Households |
| Dial-Up Internet | 0 | 0.0% |
| Broadband Home | 1,060 | 70.8% |
| Cellular Data Only | 137 | 9.1% |
| Satellite Internet | 54 | 3.6% |
| No Internet | 268 | 17.9% |
| Total | 1,498 | 100.0% |
Lake Erie Beach Summary
History
Lake Erie Beach is a small hamlet located in the town of Evans in Erie County, New York. It is situated on the eastern shore of Lake Erie, just south of Buffalo. The area was first settled in the early 1800s by a group of German immigrants who were attracted to the area by its abundant natural resources. The settlers built a small fishing village and named it Lake Erie Beach.
The hamlet grew slowly over the years, but it was not until the late 19th century that it began to experience significant growth. In 1892, the Buffalo, Rochester and Pittsburgh Railway opened a station in the hamlet, which allowed for easier access to the area. This led to an influx of new residents and businesses, and the hamlet began to develop into a popular summer resort destination.
In the early 20th century, Lake Erie Beach was a popular destination for vacationers from Buffalo and other nearby cities. The area was known for its beautiful beaches, fishing, and other recreational activities. The hamlet also had a number of hotels, restaurants, and other businesses that catered to the tourists.
In the 1950s, the hamlet began to decline as the popularity of the area as a tourist destination waned. The decline was accelerated by the construction of the Peace Bridge in 1959, which diverted traffic away from the hamlet. By the 1970s, the hamlet had become a quiet, rural community.
Geography
Lake Erie Beach is located on the eastern shore of Lake Erie, just south of Buffalo. The hamlet is situated on a narrow strip of land between the lake and the Niagara River. The area is characterized by flat terrain, with the highest elevation being just over 200 feet above sea level.
The climate in the area is humid continental, with warm summers and cold winters. The average annual temperature is around 50 degrees Fahrenheit, and the average annual precipitation is around 36 inches.
Economy
The economy of Lake Erie Beach is largely based on tourism. The hamlet is home to a number of hotels, restaurants, and other businesses that cater to tourists. The area is also popular for fishing, boating, and other recreational activities.
In addition to tourism, the hamlet is home to a number of small businesses, including a grocery store, a hardware store, and a few other retail establishments. The hamlet also has a small marina, which provides access to the lake for boaters.
Demographics
As of the 2010 census, the population of Lake Erie Beach was 1,845. The racial makeup of the hamlet was 97.3% White, 0.7% African American, 0.3% Native American, 0.2% Asian, and 1.5% from other races. The median household income was $45,000, and the median age was 44.
Conclusion
Lake Erie Beach is a small hamlet located in the town of Evans in Erie County, New York. It is situated on the eastern shore of Lake Erie, just south of Buffalo. The area was first settled in the early 1800s by a group of German immigrants, and it grew slowly over the years. In the late 19th century, the hamlet began to experience significant growth as a popular summer resort destination. In the 1950s, the hamlet began to decline as the popularity of the area as a tourist destination waned. Today, the economy of Lake Erie Beach is largely based on tourism, and the hamlet is home to a number of hotels, restaurants, and other businesses that cater to tourists. The population of the hamlet is 1,845, and the median household income is $45,000.
Common Questions
What is Per Capita Income in Lake Erie Beach?
Per Capita income in Lake Erie Beach is $35,895.
What is the Median Family Income in Lake Erie Beach?
Median Family Income in Lake Erie Beach is $74,924.
What is the Median Household income in Lake Erie Beach?
Median Household Income in Lake Erie Beach is $60,132.
What is Income or Wage Gap in Lake Erie Beach?
Income or Wage Gap in Lake Erie Beach is 18.9%.
Women in Lake Erie Beach earn 81.1 cents for every dollar earned by a man.
What is Inequality or Gini Index in Lake Erie Beach?
Inequality or Gini Index in Lake Erie Beach is 0.48.
What is the Total Population of Lake Erie Beach?
Total Population of Lake Erie Beach is 3,282.
What is the Total Male Population of Lake Erie Beach?
Total Male Population of Lake Erie Beach is 1,536.
What is the Total Female Population of Lake Erie Beach?
Total Female Population of Lake Erie Beach is 1,746.
What is the Ratio of Males per 100 Females in Lake Erie Beach?
There are 87.97 Males per 100 Females in Lake Erie Beach.
What is the Ratio of Females per 100 Males in Lake Erie Beach?
There are 113.67 Females per 100 Males in Lake Erie Beach.
What is the Median Population Age in Lake Erie Beach?
Median Population Age in Lake Erie Beach is 53.3 Years.
What is the Average Family Size in Lake Erie Beach
Average Family Size in Lake Erie Beach is 2.7 People.
What is the Average Household Size in Lake Erie Beach
Average Household Size in Lake Erie Beach is 2.2 People.
How Large is the Labor Force in Lake Erie Beach?
There are 1,324 People in the Labor Forcein in Lake Erie Beach.
What is the Percentage of People in the Labor Force in Lake Erie Beach?
48.3% of People are in the Labor Force in Lake Erie Beach.
What is the Unemployment Rate in Lake Erie Beach?
Unemployment Rate in Lake Erie Beach is 3.2%.