North Massapequa, NY Map & Demographics
North Massapequa Map
North Massapequa Overview
$55,586
PER CAPITA INCOME
$157,514
AVG FAMILY INCOME
$134,666
AVG HOUSEHOLD INCOME
44.8%
WAGE / INCOME GAP [ % ]
55.2¢/ $1
WAGE / INCOME GAP [ $ ]
0.38
INEQUALITY / GINI INDEX
18,198
TOTAL POPULATION
8,760
MALE POPULATION
9,438
FEMALE POPULATION
92.82
MALES / 100 FEMALES
107.74
FEMALES / 100 MALES
44.1
MEDIAN AGE
3.3
AVG FAMILY SIZE
2.9
AVG HOUSEHOLD SIZE
10,452
LABOR FORCE [ PEOPLE ]
68.1%
PERCENT IN LABOR FORCE
2.9%
UNEMPLOYMENT RATE
Income in North Massapequa
Income Overview in North Massapequa
Per Capita Income in North Massapequa is $55,586, while median incomes of families and households are $157,514 and $134,666 respectively.
| Characteristic | Number | Measure |
| Per Capita Income | 18,198 | $55,586 |
| Median Family Income | 4,841 | $157,514 |
| Mean Family Income | 4,841 | $175,594 |
| Median Household Income | 6,330 | $134,666 |
| Mean Household Income | 6,330 | $156,389 |
| Income Deficit | 4,841 | $0 |
| Wage / Income Gap (%) | 18,198 | 44.78% |
| Wage / Income Gap ($) | 18,198 | 55.22¢ per $1 |
| Gini / Inequality Index | 18,198 | 0.38 |
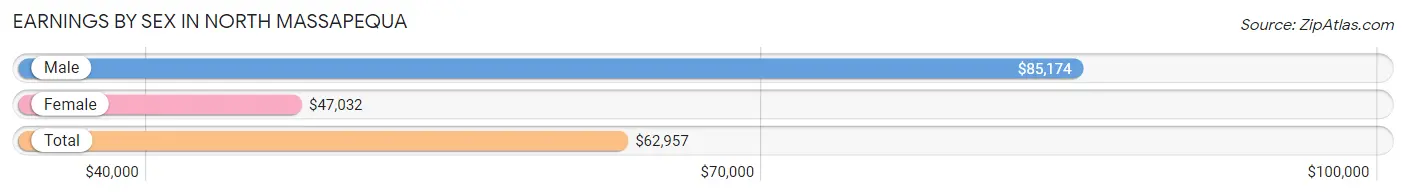
Earnings by Sex in North Massapequa
Average Earnings in North Massapequa are $62,957, $85,174 for men and $47,032 for women, a difference of 44.8%.
| Sex | Number | Average Earnings |
| Male | 5,465 (51.0%) | $85,174 |
| Female | 5,258 (49.0%) | $47,032 |
| Total | 10,723 (100.0%) | $62,957 |
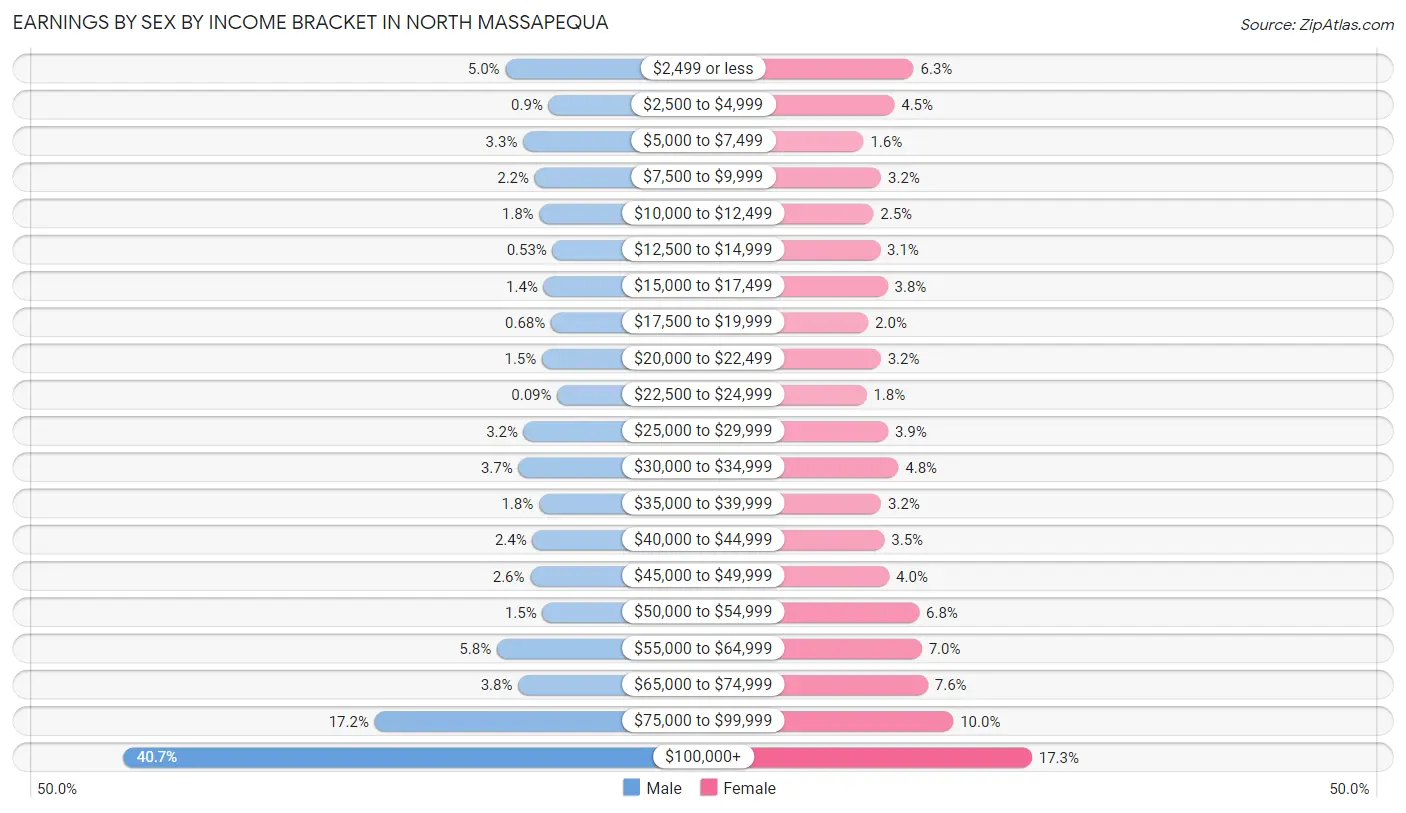
Earnings by Sex by Income Bracket in North Massapequa
The most common earnings brackets in North Massapequa are $100,000+ for men (2,224 | 40.7%) and $100,000+ for women (911 | 17.3%).
| Income | Male | Female |
| $2,499 or less | 271 (5.0%) | 329 (6.3%) |
| $2,500 to $4,999 | 49 (0.9%) | 234 (4.4%) |
| $5,000 to $7,499 | 180 (3.3%) | 82 (1.6%) |
| $7,500 to $9,999 | 120 (2.2%) | 169 (3.2%) |
| $10,000 to $12,499 | 97 (1.8%) | 131 (2.5%) |
| $12,500 to $14,999 | 29 (0.5%) | 164 (3.1%) |
| $15,000 to $17,499 | 75 (1.4%) | 201 (3.8%) |
| $17,500 to $19,999 | 37 (0.7%) | 105 (2.0%) |
| $20,000 to $22,499 | 83 (1.5%) | 167 (3.2%) |
| $22,500 to $24,999 | 5 (0.1%) | 97 (1.8%) |
| $25,000 to $29,999 | 177 (3.2%) | 203 (3.9%) |
| $30,000 to $34,999 | 204 (3.7%) | 254 (4.8%) |
| $35,000 to $39,999 | 99 (1.8%) | 169 (3.2%) |
| $40,000 to $44,999 | 132 (2.4%) | 185 (3.5%) |
| $45,000 to $49,999 | 143 (2.6%) | 209 (4.0%) |
| $50,000 to $54,999 | 81 (1.5%) | 356 (6.8%) |
| $55,000 to $64,999 | 314 (5.8%) | 369 (7.0%) |
| $65,000 to $74,999 | 205 (3.7%) | 399 (7.6%) |
| $75,000 to $99,999 | 940 (17.2%) | 524 (10.0%) |
| $100,000+ | 2,224 (40.7%) | 911 (17.3%) |
| Total | 5,465 (100.0%) | 5,258 (100.0%) |
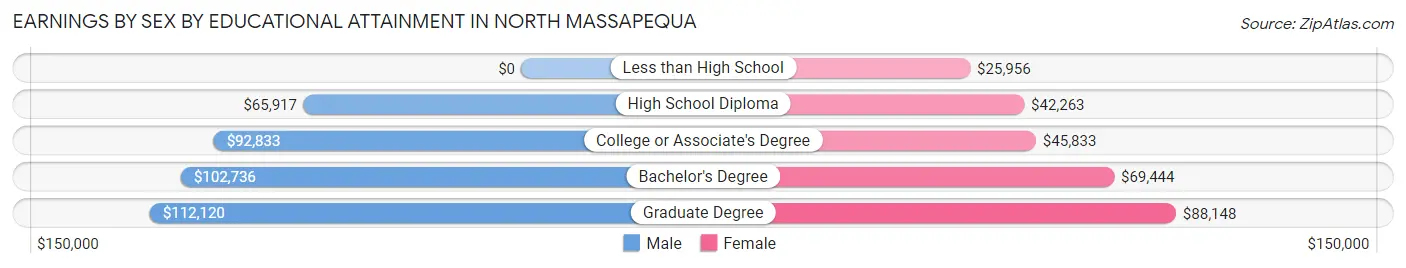
Earnings by Sex by Educational Attainment in North Massapequa
Average earnings in North Massapequa are $95,836 for men and $53,709 for women, a difference of 44.0%. Men with an educational attainment of graduate degree enjoy the highest average annual earnings of $112,120, while those with high school diploma education earn the least with $65,917. Women with an educational attainment of graduate degree earn the most with the average annual earnings of $88,148, while those with less than high school education have the smallest earnings of $25,956.
| Educational Attainment | Male Income | Female Income |
| Less than High School | - | - |
| High School Diploma | $65,917 | $42,263 |
| College or Associate's Degree | $92,833 | $45,833 |
| Bachelor's Degree | $102,736 | $69,444 |
| Graduate Degree | $112,120 | $88,148 |
| Total | $95,836 | $53,709 |
Family Income in North Massapequa
Family Income Brackets in North Massapequa
According to the North Massapequa family income data, there are 1,636 families falling into the $200,000+ income range, which is the most common income bracket and makes up 33.8% of all families. Conversely, the $10,000 to $14,999 income bracket is the least frequent group with only 15 families (0.3%) belonging to this category.
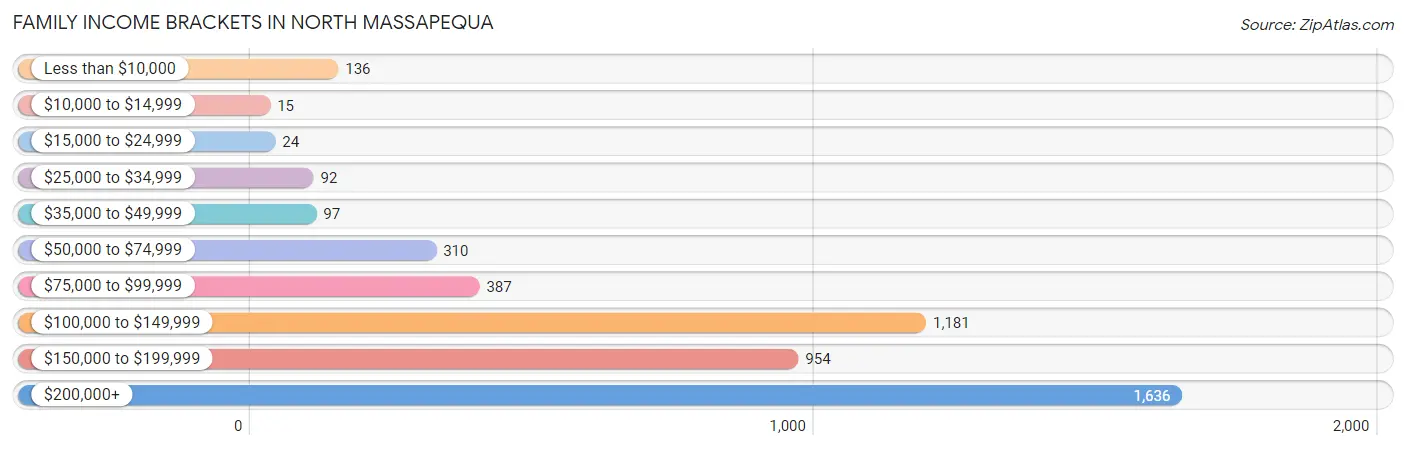
| Income Bracket | # Families | % Families |
| Less than $10,000 | 136 | 2.8% |
| $10,000 to $14,999 | 15 | 0.3% |
| $15,000 to $24,999 | 24 | 0.5% |
| $25,000 to $34,999 | 92 | 1.9% |
| $35,000 to $49,999 | 97 | 2.0% |
| $50,000 to $74,999 | 310 | 6.4% |
| $75,000 to $99,999 | 387 | 8.0% |
| $100,000 to $149,999 | 1,181 | 24.4% |
| $150,000 to $199,999 | 954 | 19.7% |
| $200,000+ | 1,636 | 33.8% |
Family Income by Famaliy Size in North Massapequa
6-person families (107 | 2.2%) account for the highest median family income in North Massapequa with $216,726 per family, while 2-person families (1,739 | 35.9%) have the highest median income of $62,370 per family member.
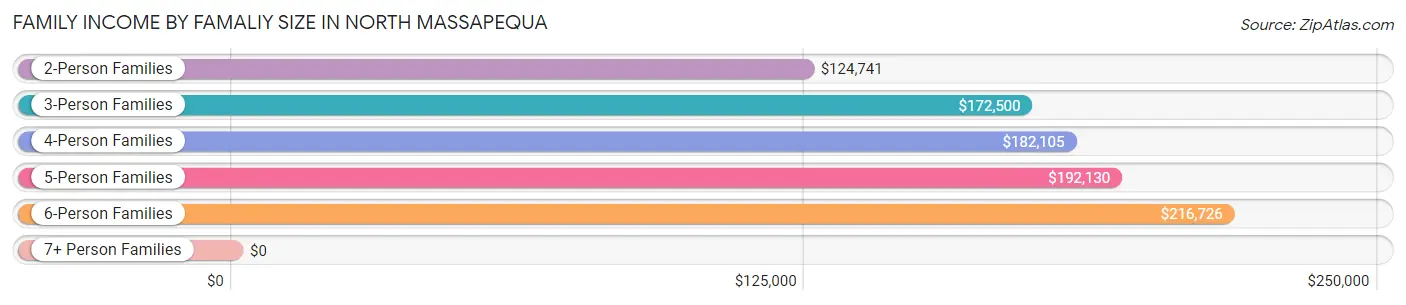
| Income Bracket | # Families | Median Income |
| 2-Person Families | 1,739 (35.9%) | $124,741 |
| 3-Person Families | 1,210 (25.0%) | $172,500 |
| 4-Person Families | 1,222 (25.2%) | $182,105 |
| 5-Person Families | 536 (11.1%) | $192,130 |
| 6-Person Families | 107 (2.2%) | $216,726 |
| 7+ Person Families | 27 (0.6%) | $0 |
| Total | 4,841 (100.0%) | $157,514 |
Family Income by Number of Earners in North Massapequa
The median family income in North Massapequa is $157,514, with families comprising 3+ earners (1,020) having the highest median family income of $224,000, while families with no earners (614) have the lowest median family income of $72,500, accounting for 21.1% and 12.7% of families, respectively.
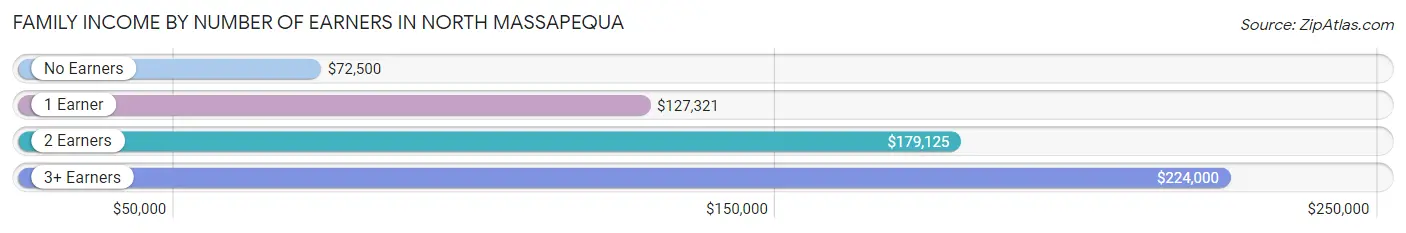
| Number of Earners | # Families | Median Income |
| No Earners | 614 (12.7%) | $72,500 |
| 1 Earner | 1,002 (20.7%) | $127,321 |
| 2 Earners | 2,205 (45.6%) | $179,125 |
| 3+ Earners | 1,020 (21.1%) | $224,000 |
| Total | 4,841 (100.0%) | $157,514 |
Household Income in North Massapequa
Household Income Brackets in North Massapequa
With 1,810 households falling in the category, the $200,000+ income range is the most frequent in North Massapequa, accounting for 28.6% of all households. In contrast, only 25 households (0.4%) fall into the $10,000 to $14,999 income bracket, making it the least populous group.
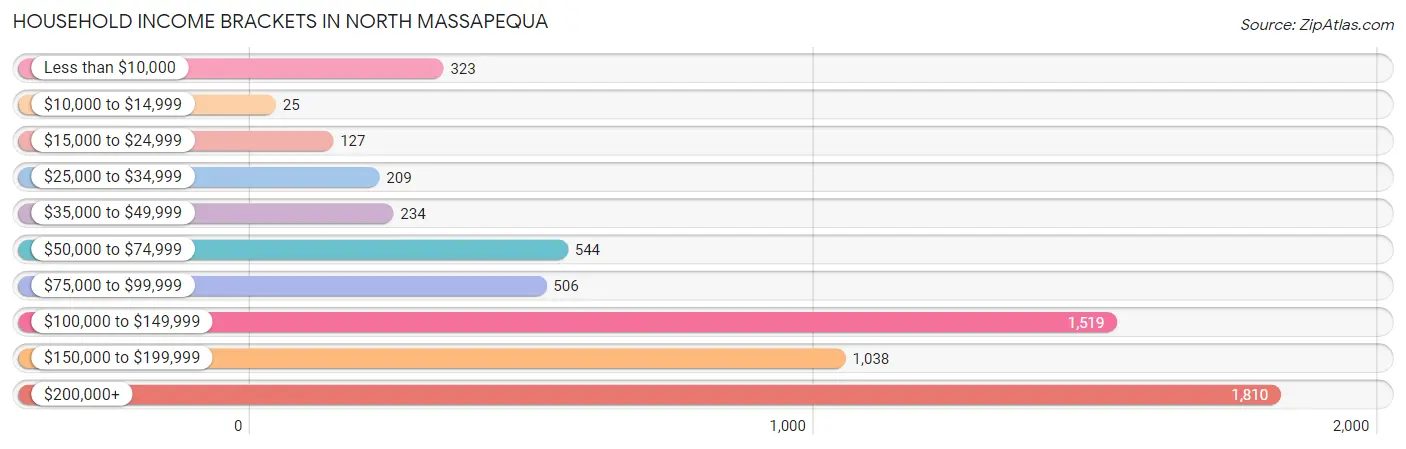
| Income Bracket | # Households | % Households |
| Less than $10,000 | 323 | 5.1% |
| $10,000 to $14,999 | 25 | 0.4% |
| $15,000 to $24,999 | 127 | 2.0% |
| $25,000 to $34,999 | 209 | 3.3% |
| $35,000 to $49,999 | 234 | 3.7% |
| $50,000 to $74,999 | 544 | 8.6% |
| $75,000 to $99,999 | 506 | 8.0% |
| $100,000 to $149,999 | 1,519 | 24.0% |
| $150,000 to $199,999 | 1,038 | 16.4% |
| $200,000+ | 1,810 | 28.6% |
Household Income by Householder Age in North Massapequa
The median household income in North Massapequa is $134,666, with the highest median household income of $176,968 found in the 25 to 44 years age bracket for the primary householder. A total of 1,508 households (23.8%) fall into this category.
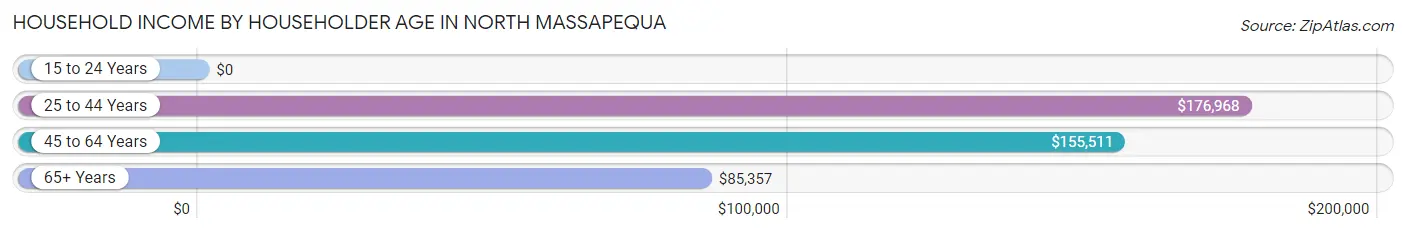
| Income Bracket | # Households | Median Income |
| 15 to 24 Years | 0 (0.0%) | $0 |
| 25 to 44 Years | 1,508 (23.8%) | $176,968 |
| 45 to 64 Years | 2,810 (44.4%) | $155,511 |
| 65+ Years | 2,012 (31.8%) | $85,357 |
| Total | 6,330 (100.0%) | $134,666 |
Poverty in North Massapequa
Income Below Poverty by Sex and Age in North Massapequa
With 3.6% poverty level for males and 6.5% for females among the residents of North Massapequa, 75 year old and over males and 16 and 17 year old females are the most vulnerable to poverty, with 80 males (12.1%) and 46 females (22.4%) in their respective age groups living below the poverty level.
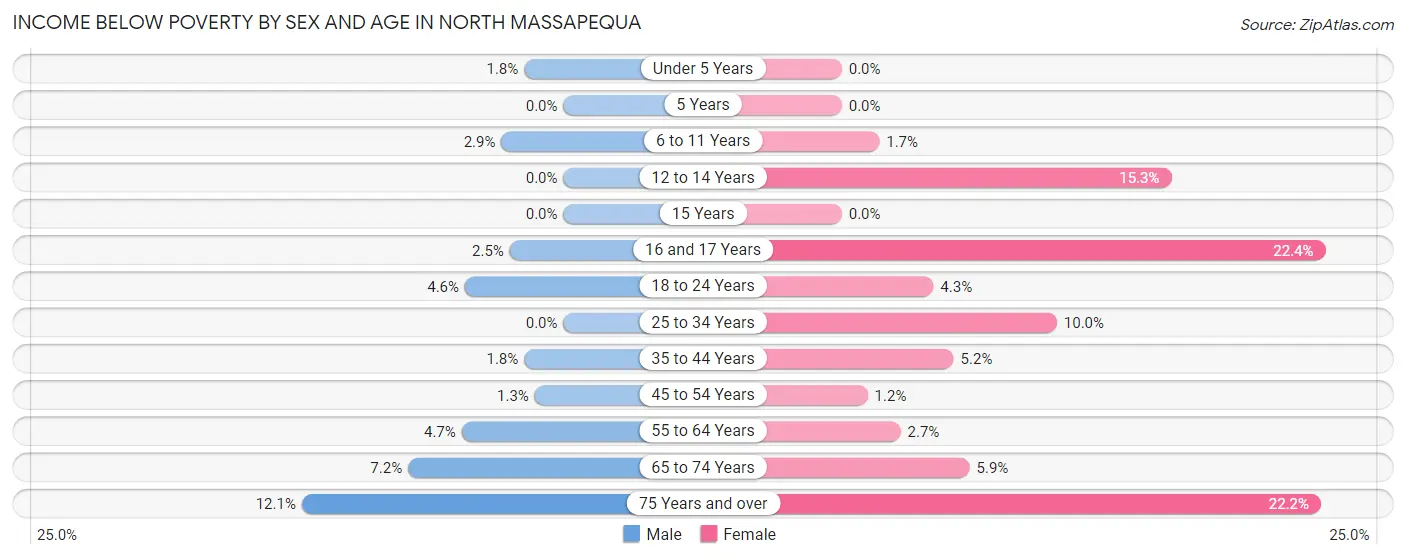
| Age Bracket | Male | Female |
| Under 5 Years | 11 (1.8%) | 0 (0.0%) |
| 5 Years | 0 (0.0%) | 0 (0.0%) |
| 6 to 11 Years | 12 (2.9%) | 10 (1.7%) |
| 12 to 14 Years | 0 (0.0%) | 24 (15.3%) |
| 15 Years | 0 (0.0%) | 0 (0.0%) |
| 16 and 17 Years | 6 (2.5%) | 46 (22.4%) |
| 18 to 24 Years | 36 (4.6%) | 37 (4.3%) |
| 25 to 34 Years | 0 (0.0%) | 121 (10.0%) |
| 35 to 44 Years | 16 (1.8%) | 49 (5.2%) |
| 45 to 54 Years | 14 (1.3%) | 12 (1.2%) |
| 55 to 64 Years | 76 (4.7%) | 50 (2.7%) |
| 65 to 74 Years | 62 (7.2%) | 54 (5.9%) |
| 75 Years and over | 80 (12.1%) | 211 (22.2%) |
| Total | 313 (3.6%) | 614 (6.5%) |
Income Above Poverty by Sex and Age in North Massapequa
According to the poverty statistics in North Massapequa, males aged 5 years and females aged under 5 years are the age groups that are most secure financially, with 100.0% of males and 100.0% of females in these age groups living above the poverty line.
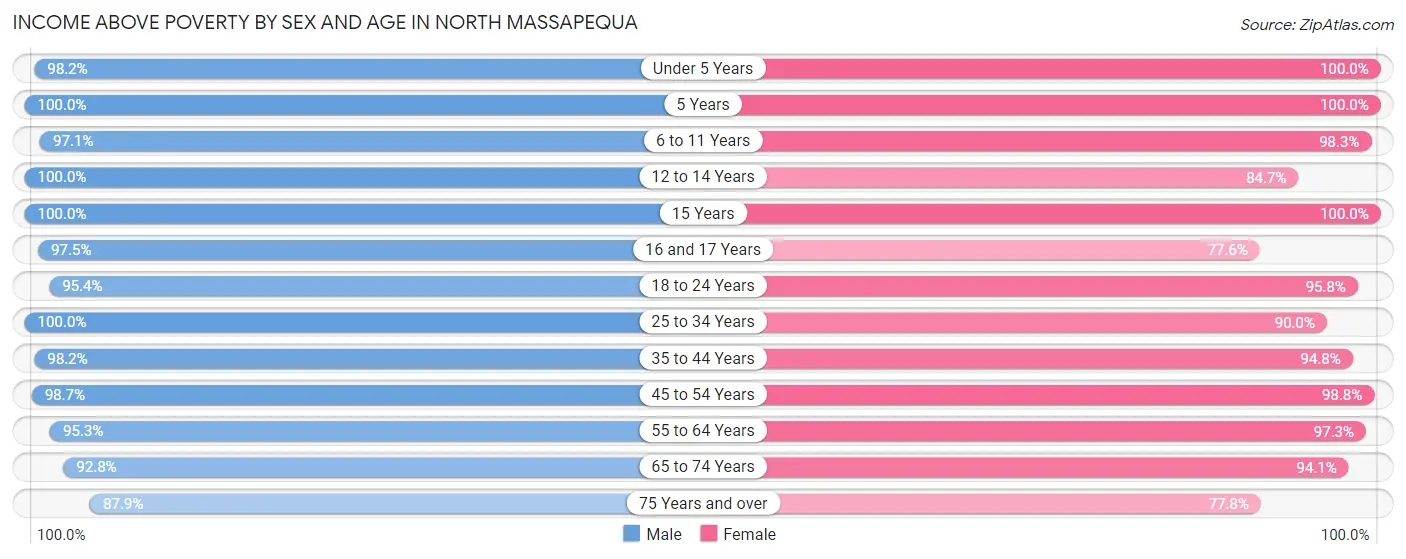
| Age Bracket | Male | Female |
| Under 5 Years | 592 (98.2%) | 529 (100.0%) |
| 5 Years | 74 (100.0%) | 143 (100.0%) |
| 6 to 11 Years | 405 (97.1%) | 565 (98.3%) |
| 12 to 14 Years | 211 (100.0%) | 133 (84.7%) |
| 15 Years | 31 (100.0%) | 110 (100.0%) |
| 16 and 17 Years | 235 (97.5%) | 159 (77.6%) |
| 18 to 24 Years | 752 (95.4%) | 834 (95.8%) |
| 25 to 34 Years | 1,335 (100.0%) | 1,092 (90.0%) |
| 35 to 44 Years | 861 (98.2%) | 895 (94.8%) |
| 45 to 54 Years | 1,039 (98.7%) | 990 (98.8%) |
| 55 to 64 Years | 1,535 (95.3%) | 1,779 (97.3%) |
| 65 to 74 Years | 798 (92.8%) | 857 (94.1%) |
| 75 Years and over | 579 (87.9%) | 738 (77.8%) |
| Total | 8,447 (96.4%) | 8,824 (93.5%) |
Income Below Poverty Among Married-Couple Families in North Massapequa
The poverty statistics for married-couple families in North Massapequa show that 4.0% or 161 of the total 4,024 families live below the poverty line. Families with no children have the highest poverty rate of 5.6%, comprising of 140 families. On the other hand, families with 1 or 2 children have the lowest poverty rate of 0.8%, which includes 10 families.
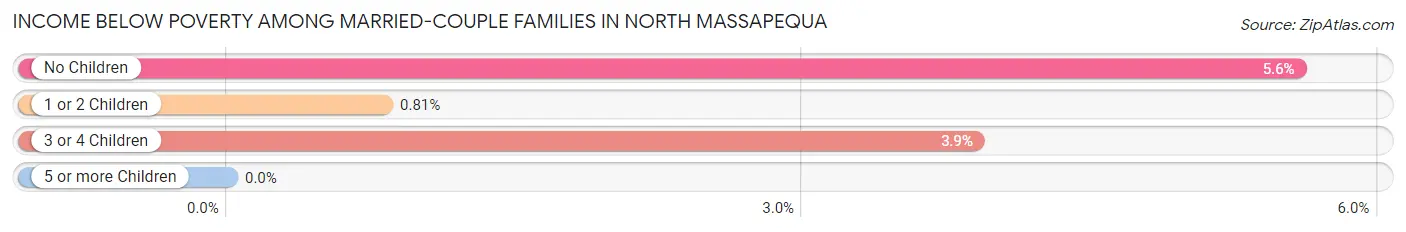
| Children | Above Poverty | Below Poverty |
| No Children | 2,367 (94.4%) | 140 (5.6%) |
| 1 or 2 Children | 1,225 (99.2%) | 10 (0.8%) |
| 3 or 4 Children | 271 (96.1%) | 11 (3.9%) |
| 5 or more Children | 0 (0.0%) | 0 (0.0%) |
| Total | 3,863 (96.0%) | 161 (4.0%) |
Income Below Poverty Among Single-Parent Households in North Massapequa
According to the poverty data in North Massapequa, 2.9% or 7 single-father households and 3.6% or 21 single-mother households are living below the poverty line. Among single-father households, those with 1 or 2 children have the highest poverty rate, with 7 households (12.5%) experiencing poverty. Likewise, among single-mother households, those with 1 or 2 children have the highest poverty rate, with 21 households (8.7%) falling below the poverty line.
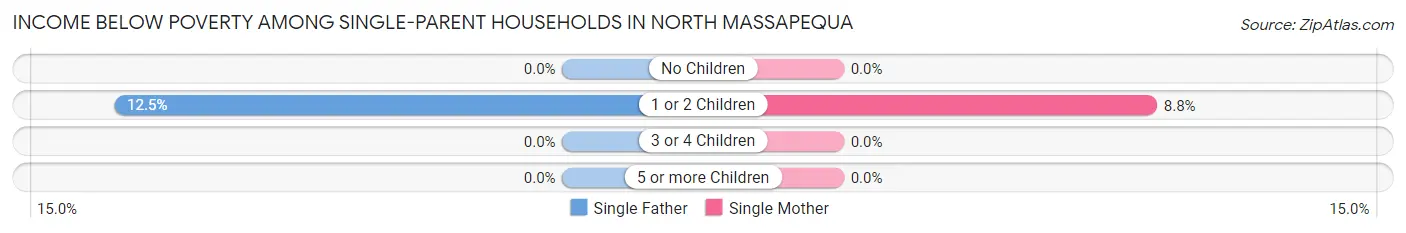
| Children | Single Father | Single Mother |
| No Children | 0 (0.0%) | 0 (0.0%) |
| 1 or 2 Children | 7 (12.5%) | 21 (8.7%) |
| 3 or 4 Children | 0 (0.0%) | 0 (0.0%) |
| 5 or more Children | 0 (0.0%) | 0 (0.0%) |
| Total | 7 (2.9%) | 21 (3.6%) |
Income Below Poverty Among Married-Couple vs Single-Parent Households in North Massapequa
The poverty data for North Massapequa shows that 161 of the married-couple family households (4.0%) and 28 of the single-parent households (3.4%) are living below the poverty level. Within the married-couple family households, those with no children have the highest poverty rate, with 140 households (5.6%) falling below the poverty line. Among the single-parent households, those with 1 or 2 children have the highest poverty rate, with 28 household (9.5%) living below poverty.
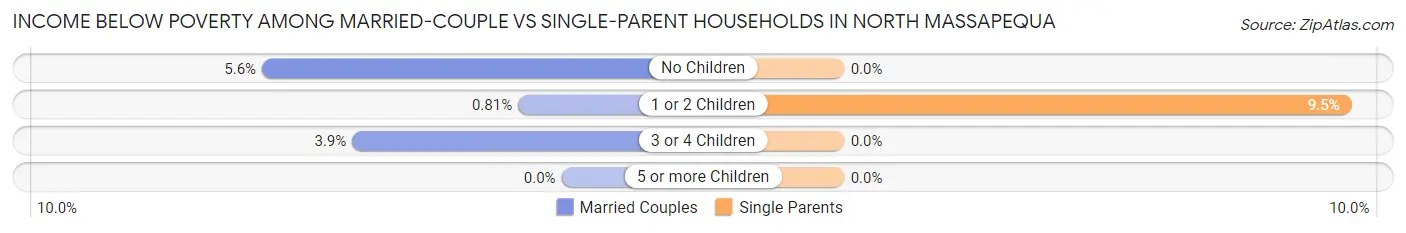
| Children | Married-Couple Families | Single-Parent Households |
| No Children | 140 (5.6%) | 0 (0.0%) |
| 1 or 2 Children | 10 (0.8%) | 28 (9.5%) |
| 3 or 4 Children | 11 (3.9%) | 0 (0.0%) |
| 5 or more Children | 0 (0.0%) | 0 (0.0%) |
| Total | 161 (4.0%) | 28 (3.4%) |
Race in North Massapequa
The most populous races in North Massapequa are White / Caucasian (16,590 | 91.2%), Hispanic or Latino (1,509 | 8.3%), and Two or more Races (745 | 4.1%).
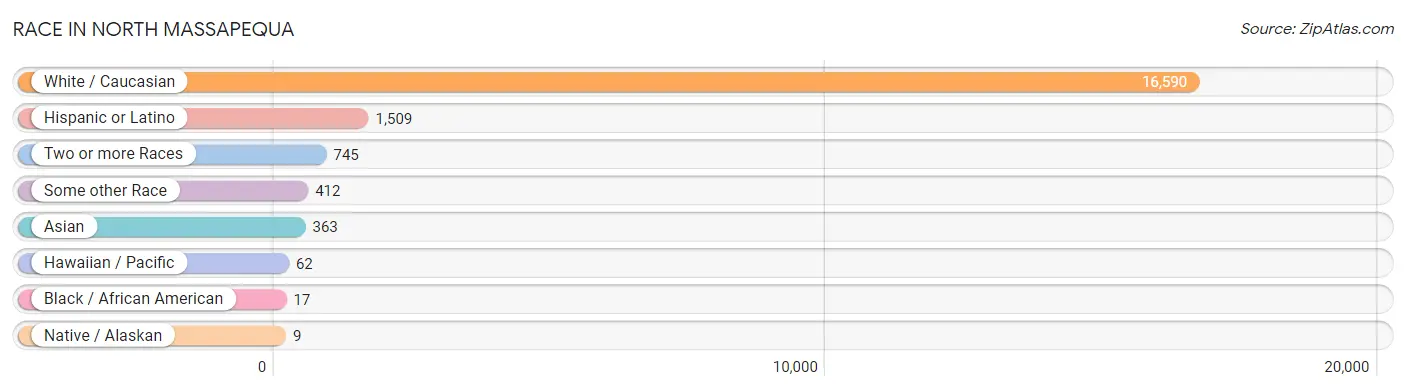
| Race | # Population | % Population |
| Asian | 363 | 2.0% |
| Black / African American | 17 | 0.1% |
| Hawaiian / Pacific | 62 | 0.3% |
| Hispanic or Latino | 1,509 | 8.3% |
| Native / Alaskan | 9 | 0.1% |
| White / Caucasian | 16,590 | 91.2% |
| Two or more Races | 745 | 4.1% |
| Some other Race | 412 | 2.3% |
| Total | 18,198 | 100.0% |
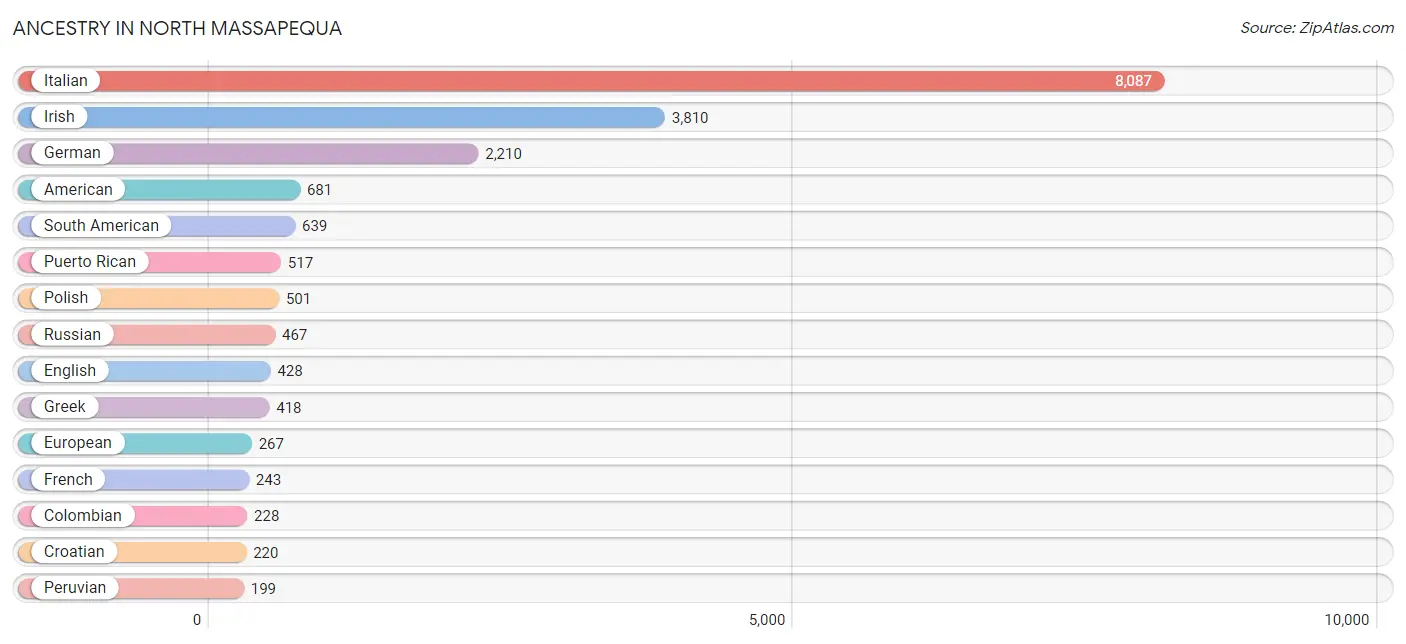
Ancestry in North Massapequa
The most populous ancestries reported in North Massapequa are Italian (8,087 | 44.4%), Irish (3,810 | 20.9%), German (2,210 | 12.1%), American (681 | 3.7%), and South American (639 | 3.5%), together accounting for 84.8% of all North Massapequa residents.
| Ancestry | # Population | % Population |
| African | 11 | 0.1% |
| Albanian | 84 | 0.5% |
| American | 681 | 3.7% |
| Arab | 130 | 0.7% |
| Argentinean | 135 | 0.7% |
| Australian | 9 | 0.1% |
| Austrian | 154 | 0.9% |
| Belizean | 12 | 0.1% |
| Brazilian | 13 | 0.1% |
| British | 51 | 0.3% |
| Burmese | 23 | 0.1% |
| Central American | 95 | 0.5% |
| Central American Indian | 9 | 0.1% |
| Cherokee | 12 | 0.1% |
| Chilean | 30 | 0.2% |
| Colombian | 228 | 1.3% |
| Croatian | 220 | 1.2% |
| Crow | 12 | 0.1% |
| Cuban | 89 | 0.5% |
| Czech | 61 | 0.3% |
| Danish | 27 | 0.2% |
| Dominican | 65 | 0.4% |
| Dutch | 24 | 0.1% |
| Eastern European | 171 | 0.9% |
| Ecuadorian | 10 | 0.1% |
| English | 428 | 2.4% |
| European | 267 | 1.5% |
| Filipino | 92 | 0.5% |
| French | 243 | 1.3% |
| French Canadian | 15 | 0.1% |
| German | 2,210 | 12.1% |
| Greek | 418 | 2.3% |
| Guamanian / Chamorro | 12 | 0.1% |
| Guatemalan | 9 | 0.1% |
| Guyanese | 66 | 0.4% |
| Hungarian | 47 | 0.3% |
| Indian (Asian) | 158 | 0.9% |
| Irish | 3,810 | 20.9% |
| Iroquois | 39 | 0.2% |
| Italian | 8,087 | 44.4% |
| Korean | 42 | 0.2% |
| Lebanese | 130 | 0.7% |
| Lithuanian | 126 | 0.7% |
| Macedonian | 96 | 0.5% |
| Maltese | 36 | 0.2% |
| Mexican | 32 | 0.2% |
| Northern European | 12 | 0.1% |
| Norwegian | 102 | 0.6% |
| Peruvian | 199 | 1.1% |
| Polish | 501 | 2.8% |
| Portuguese | 52 | 0.3% |
| Puerto Rican | 517 | 2.8% |
| Romanian | 45 | 0.3% |
| Russian | 467 | 2.6% |
| Salvadoran | 86 | 0.5% |
| Samoan | 50 | 0.3% |
| Scottish | 111 | 0.6% |
| Slovak | 18 | 0.1% |
| South American | 639 | 3.5% |
| Spaniard | 32 | 0.2% |
| Spanish | 9 | 0.1% |
| Subsaharan African | 11 | 0.1% |
| Swedish | 82 | 0.4% |
| Thai | 90 | 0.5% |
| Turkish | 82 | 0.4% |
| Ukrainian | 144 | 0.8% |
| Uruguayan | 28 | 0.2% |
| Venezuelan | 9 | 0.1% |
| Yugoslavian | 11 | 0.1% | View All 69 Rows |
Immigrants in North Massapequa
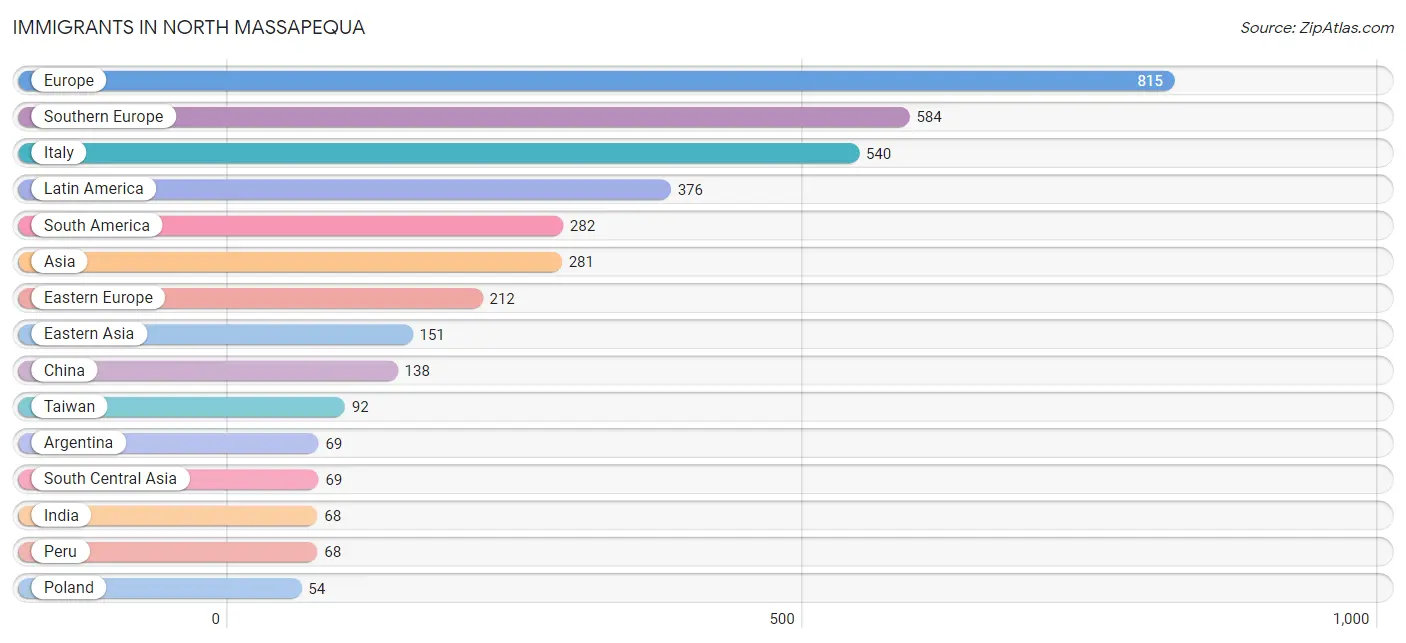
The most numerous immigrant groups reported in North Massapequa came from Europe (815 | 4.5%), Southern Europe (584 | 3.2%), Italy (540 | 3.0%), Latin America (376 | 2.1%), and South America (282 | 1.5%), together accounting for 14.3% of all North Massapequa residents.
| Immigration Origin | # Population | % Population |
| Africa | 25 | 0.1% |
| Albania | 29 | 0.2% |
| Argentina | 69 | 0.4% |
| Asia | 281 | 1.5% |
| Belize | 12 | 0.1% |
| Brazil | 13 | 0.1% |
| Caribbean | 42 | 0.2% |
| Central America | 52 | 0.3% |
| Chile | 30 | 0.2% |
| China | 138 | 0.8% |
| Colombia | 44 | 0.2% |
| Croatia | 9 | 0.1% |
| Cuba | 27 | 0.2% |
| Dominican Republic | 15 | 0.1% |
| Eastern Africa | 9 | 0.1% |
| Eastern Asia | 151 | 0.8% |
| Eastern Europe | 212 | 1.2% |
| Egypt | 16 | 0.1% |
| El Salvador | 31 | 0.2% |
| England | 8 | 0.0% |
| Ethiopia | 9 | 0.1% |
| Europe | 815 | 4.5% |
| Greece | 31 | 0.2% |
| Guatemala | 9 | 0.1% |
| Guyana | 14 | 0.1% |
| India | 68 | 0.4% |
| Ireland | 11 | 0.1% |
| Italy | 540 | 3.0% |
| Korea | 13 | 0.1% |
| Latin America | 376 | 2.1% |
| Lebanon | 22 | 0.1% |
| North Macedonia | 50 | 0.3% |
| Northern Africa | 16 | 0.1% |
| Northern Europe | 19 | 0.1% |
| Pakistan | 1 | 0.0% |
| Peru | 68 | 0.4% |
| Philippines | 33 | 0.2% |
| Poland | 54 | 0.3% |
| Portugal | 13 | 0.1% |
| Romania | 17 | 0.1% |
| Russia | 21 | 0.1% |
| South America | 282 | 1.5% |
| South Central Asia | 69 | 0.4% |
| South Eastern Asia | 39 | 0.2% |
| Southern Europe | 584 | 3.2% |
| Taiwan | 92 | 0.5% |
| Thailand | 6 | 0.0% |
| Ukraine | 32 | 0.2% |
| Venezuela | 19 | 0.1% |
| Western Asia | 22 | 0.1% | View All 50 Rows |
Sex and Age in North Massapequa
Sex and Age in North Massapequa
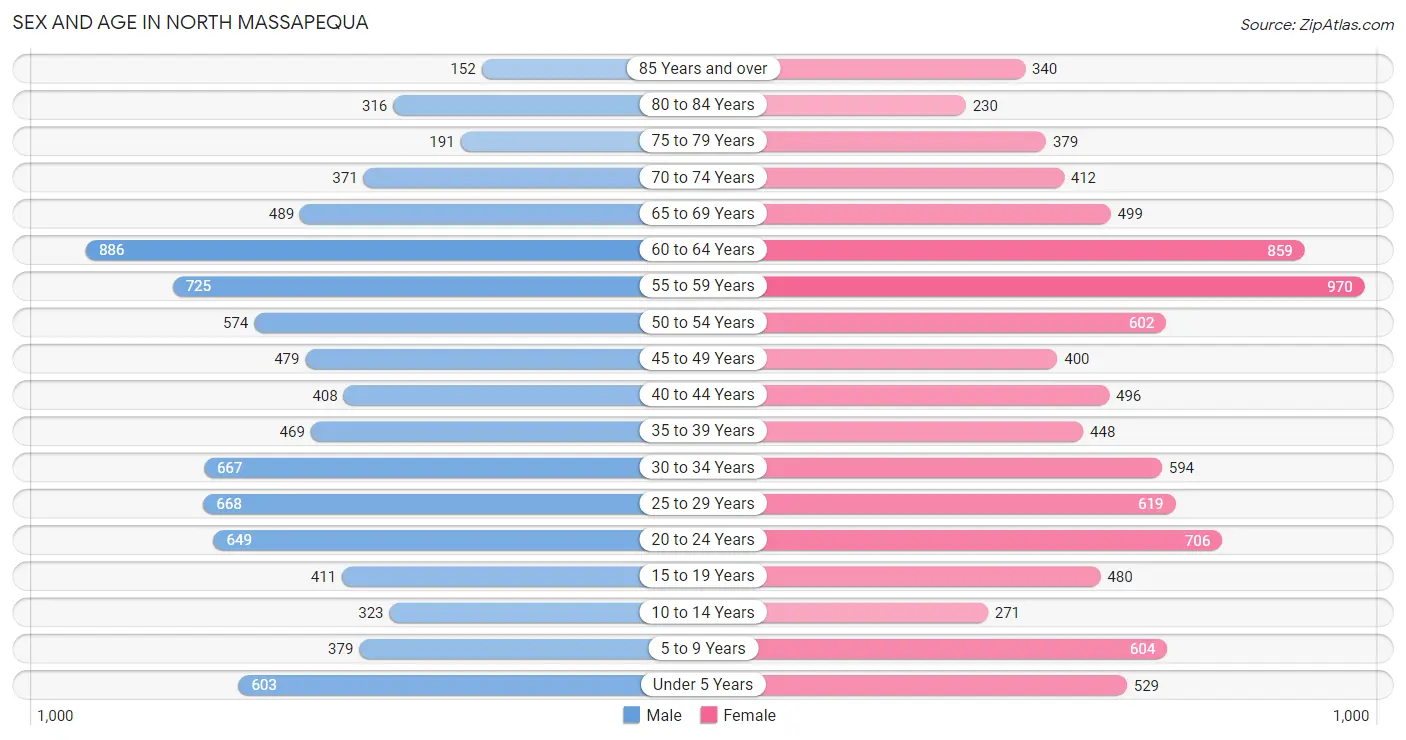
The most populous age groups in North Massapequa are 60 to 64 Years (886 | 10.1%) for men and 55 to 59 Years (970 | 10.3%) for women.
| Age Bracket | Male | Female |
| Under 5 Years | 603 (6.9%) | 529 (5.6%) |
| 5 to 9 Years | 379 (4.3%) | 604 (6.4%) |
| 10 to 14 Years | 323 (3.7%) | 271 (2.9%) |
| 15 to 19 Years | 411 (4.7%) | 480 (5.1%) |
| 20 to 24 Years | 649 (7.4%) | 706 (7.5%) |
| 25 to 29 Years | 668 (7.6%) | 619 (6.6%) |
| 30 to 34 Years | 667 (7.6%) | 594 (6.3%) |
| 35 to 39 Years | 469 (5.3%) | 448 (4.8%) |
| 40 to 44 Years | 408 (4.7%) | 496 (5.3%) |
| 45 to 49 Years | 479 (5.5%) | 400 (4.2%) |
| 50 to 54 Years | 574 (6.6%) | 602 (6.4%) |
| 55 to 59 Years | 725 (8.3%) | 970 (10.3%) |
| 60 to 64 Years | 886 (10.1%) | 859 (9.1%) |
| 65 to 69 Years | 489 (5.6%) | 499 (5.3%) |
| 70 to 74 Years | 371 (4.2%) | 412 (4.4%) |
| 75 to 79 Years | 191 (2.2%) | 379 (4.0%) |
| 80 to 84 Years | 316 (3.6%) | 230 (2.4%) |
| 85 Years and over | 152 (1.7%) | 340 (3.6%) |
| Total | 8,760 (100.0%) | 9,438 (100.0%) |
Families and Households in North Massapequa
Median Family Size in North Massapequa
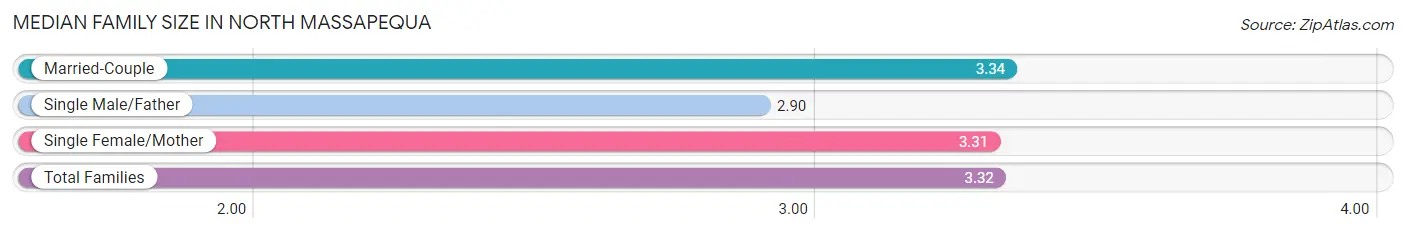
The median family size in North Massapequa is 3.32 persons per family, with married-couple families (4,024 | 83.1%) accounting for the largest median family size of 3.34 persons per family. On the other hand, single male/father families (241 | 5.0%) represent the smallest median family size with 2.90 persons per family.
| Family Type | # Families | Family Size |
| Married-Couple | 4,024 (83.1%) | 3.34 |
| Single Male/Father | 241 (5.0%) | 2.90 |
| Single Female/Mother | 576 (11.9%) | 3.31 |
| Total Families | 4,841 (100.0%) | 3.32 |
Median Household Size in North Massapequa
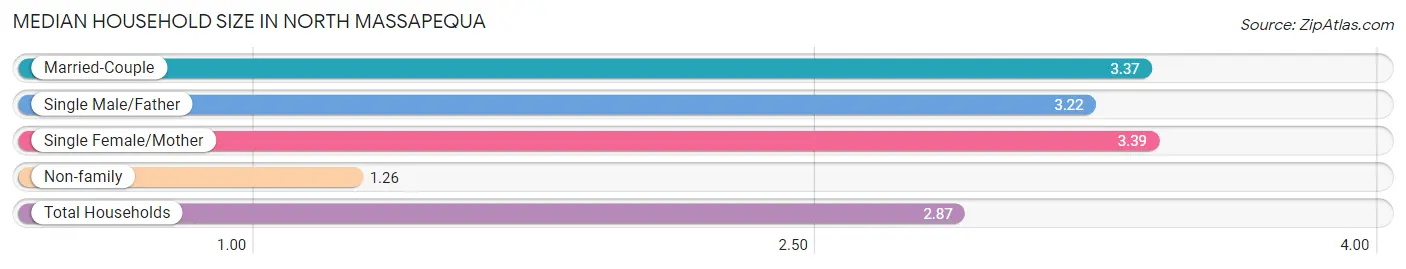
The median household size in North Massapequa is 2.87 persons per household, with single female/mother households (576 | 9.1%) accounting for the largest median household size of 3.39 persons per household. non-family households (1,489 | 23.5%) represent the smallest median household size with 1.26 persons per household.
| Household Type | # Households | Household Size |
| Married-Couple | 4,024 (63.6%) | 3.37 |
| Single Male/Father | 241 (3.8%) | 3.22 |
| Single Female/Mother | 576 (9.1%) | 3.39 |
| Non-family | 1,489 (23.5%) | 1.26 |
| Total Households | 6,330 (100.0%) | 2.87 |
Household Size by Marriage Status in North Massapequa
Out of a total of 6,330 households in North Massapequa, 4,841 (76.5%) are family households, while 1,489 (23.5%) are nonfamily households. The most numerous type of family households are 2-person households, comprising 1,688, and the most common type of nonfamily households are 1-person households, comprising 1,161.
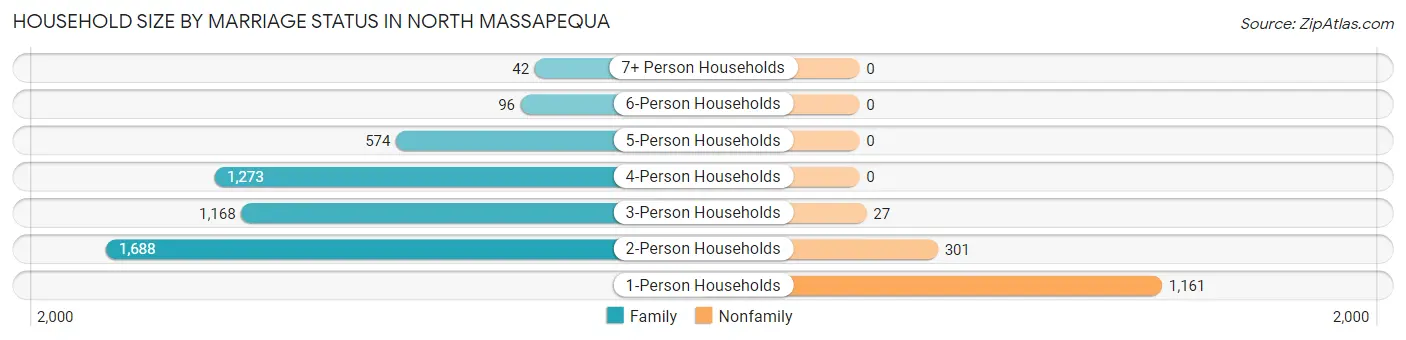
| Household Size | Family Households | Nonfamily Households |
| 1-Person Households | - | 1,161 (18.3%) |
| 2-Person Households | 1,688 (26.7%) | 301 (4.8%) |
| 3-Person Households | 1,168 (18.4%) | 27 (0.4%) |
| 4-Person Households | 1,273 (20.1%) | 0 (0.0%) |
| 5-Person Households | 574 (9.1%) | 0 (0.0%) |
| 6-Person Households | 96 (1.5%) | 0 (0.0%) |
| 7+ Person Households | 42 (0.7%) | 0 (0.0%) |
| Total | 4,841 (76.5%) | 1,489 (23.5%) |
Female Fertility in North Massapequa
Fertility by Age in North Massapequa
Average fertility rate in North Massapequa is 55.0 births per 1,000 women. Women in the age bracket of 35 to 50 years have the highest fertility rate with 65.0 births per 1,000 women. Women in the age bracket of 20 to 34 years acount for 56.6% of all women with births.
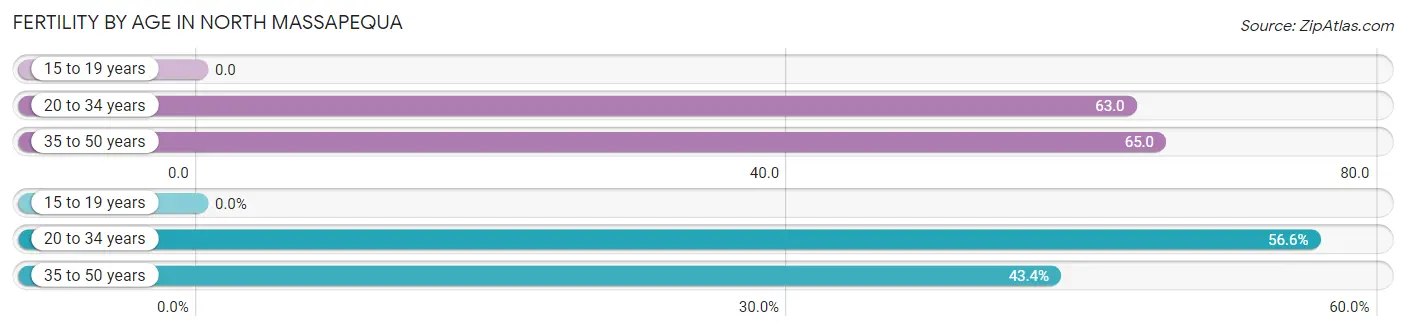
| Age Bracket | Women with Births | Births / 1,000 Women |
| 15 to 19 years | 0 (0.0%) | 0.0 |
| 20 to 34 years | 120 (56.6%) | 63.0 |
| 35 to 50 years | 92 (43.4%) | 65.0 |
| Total | 212 (100.0%) | 55.0 |
Fertility by Age by Marriage Status in North Massapequa
97.2% of women with births (212) in North Massapequa are married. The highest percentage of unmarried women with births falls into 20 to 34 years age bracket with 5.0% of them unmarried at the time of birth, while the lowest percentage of unmarried women with births belong to 35 to 50 years age bracket with 0.0% of them unmarried.
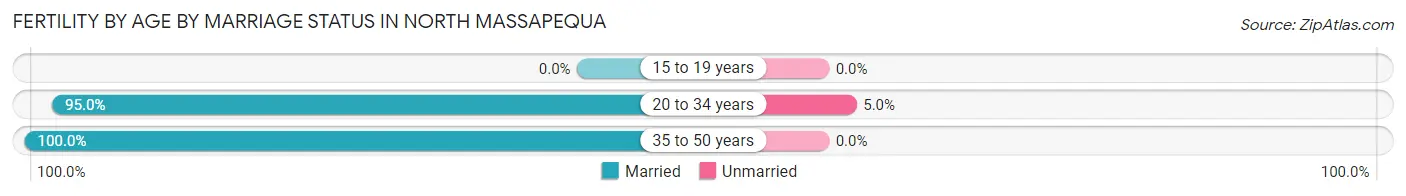
| Age Bracket | Married | Unmarried |
| 15 to 19 years | 0 (0.0%) | 0 (0.0%) |
| 20 to 34 years | 114 (95.0%) | 6 (5.0%) |
| 35 to 50 years | 92 (100.0%) | 0 (0.0%) |
| Total | 206 (97.2%) | 6 (2.8%) |
Fertility by Education in North Massapequa
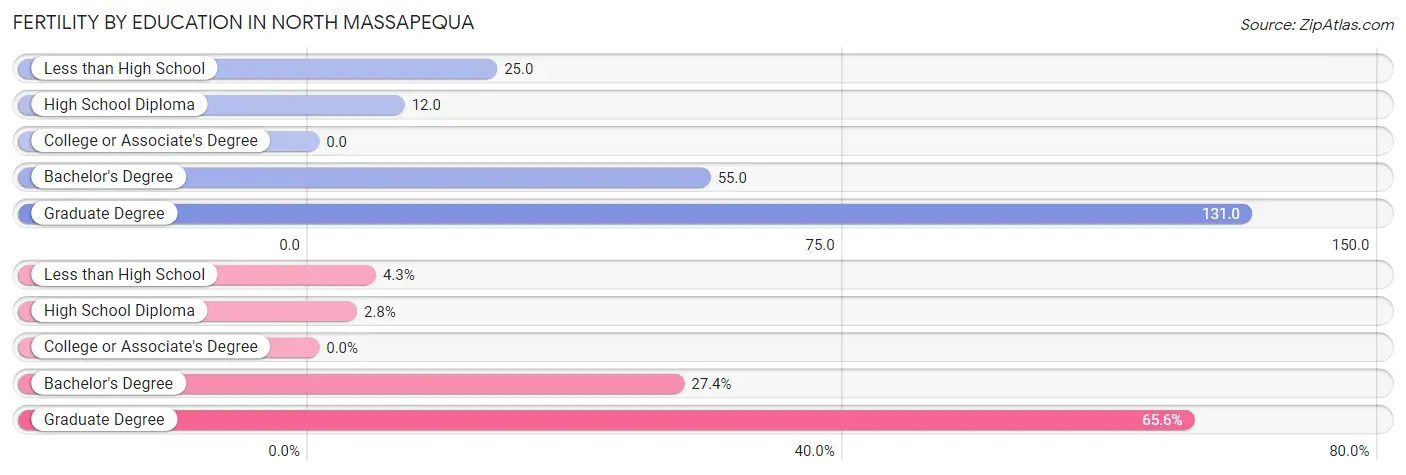
| Educational Attainment | Women with Births | Births / 1,000 Women |
| Less than High School | 9 (4.3%) | 25.0 |
| High School Diploma | 6 (2.8%) | 12.0 |
| College or Associate's Degree | 0 (0.0%) | 0.0 |
| Bachelor's Degree | 58 (27.4%) | 55.0 |
| Graduate Degree | 139 (65.6%) | 131.0 |
| Total | 212 (100.0%) | 55.0 |
Fertility by Education by Marriage Status in North Massapequa
2.8% of women with births in North Massapequa are unmarried. Women with the educational attainment of less than high school are most likely to be married with 100.0% of them married at childbirth, while women with the educational attainment of high school diploma are least likely to be married with 100.0% of them unmarried at childbirth.
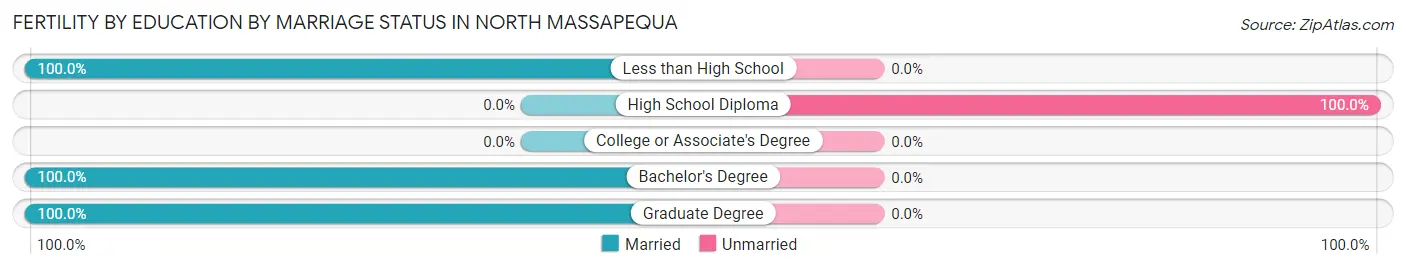
| Educational Attainment | Married | Unmarried |
| Less than High School | 9 (100.0%) | 0 (0.0%) |
| High School Diploma | 0 (0.0%) | 6 (100.0%) |
| College or Associate's Degree | 0 (0.0%) | 0 (0.0%) |
| Bachelor's Degree | 58 (100.0%) | 0 (0.0%) |
| Graduate Degree | 139 (100.0%) | 0 (0.0%) |
| Total | 206 (97.2%) | 6 (2.8%) |
Employment Characteristics in North Massapequa
Employment by Class of Employer in North Massapequa
Among the 10,038 employed individuals in North Massapequa, private company employees (6,178 | 61.6%), local government employees (1,471 | 14.6%), and not-for-profit organizations (986 | 9.8%) make up the most common classes of employment.
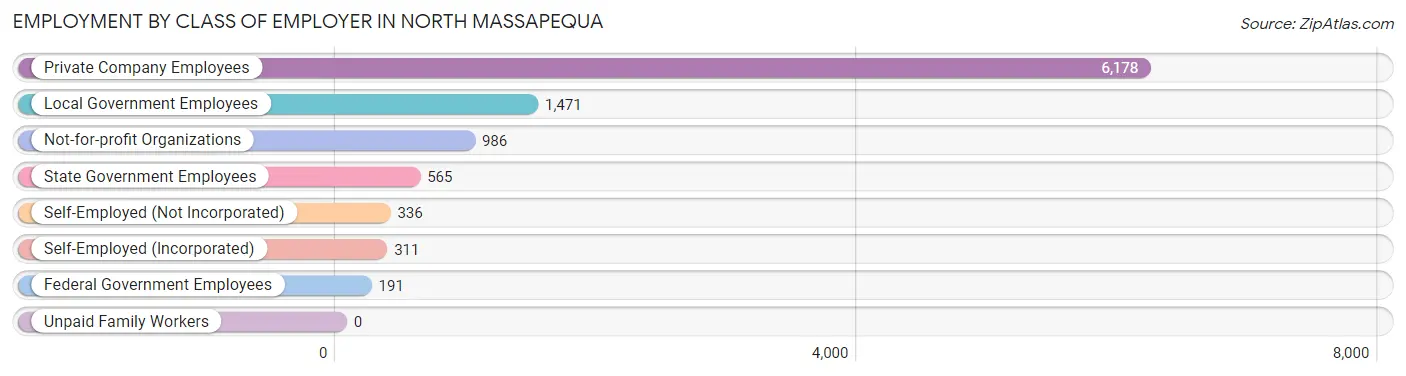
| Employer Class | # Employees | % Employees |
| Private Company Employees | 6,178 | 61.6% |
| Self-Employed (Incorporated) | 311 | 3.1% |
| Self-Employed (Not Incorporated) | 336 | 3.4% |
| Not-for-profit Organizations | 986 | 9.8% |
| Local Government Employees | 1,471 | 14.6% |
| State Government Employees | 565 | 5.6% |
| Federal Government Employees | 191 | 1.9% |
| Unpaid Family Workers | 0 | 0.0% |
| Total | 10,038 | 100.0% |
Employment Status by Age in North Massapequa
According to the labor force statistics for North Massapequa, out of the total population over 16 years of age (15,348), 68.1% or 10,452 individuals are in the labor force, with 2.9% or 303 of them unemployed. The age group with the highest labor force participation rate is 30 to 34 years, with 94.3% or 1,189 individuals in the labor force. Within the labor force, the 16 to 19 years age range has the highest percentage of unemployed individuals, with 16.7% or 58 of them being unemployed.
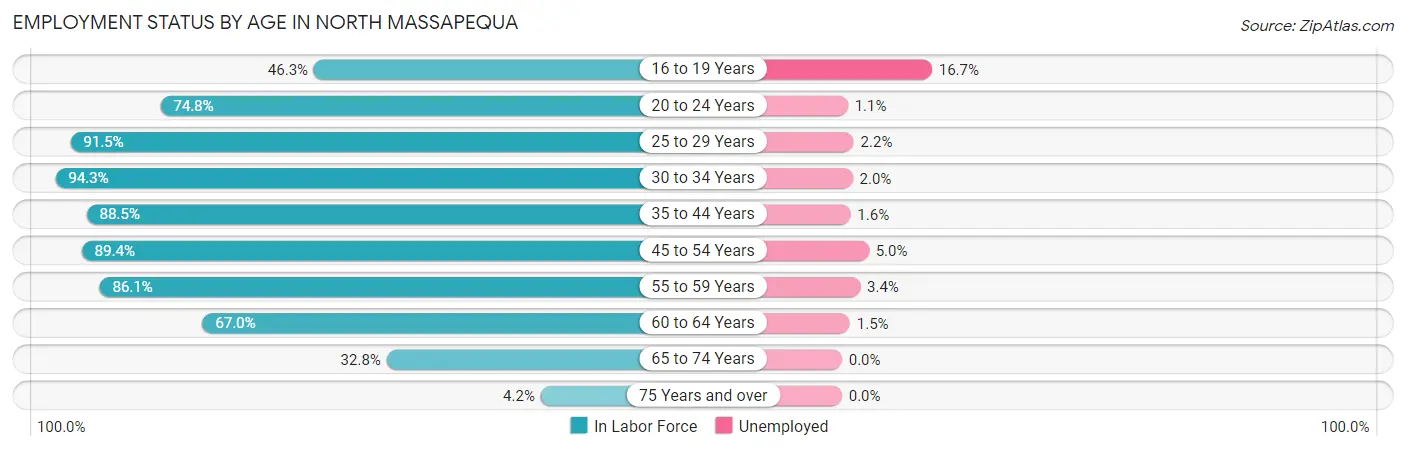
| Age Bracket | In Labor Force | Unemployed |
| 16 to 19 Years | 347 (46.3%) | 58 (16.7%) |
| 20 to 24 Years | 1,014 (74.8%) | 11 (1.1%) |
| 25 to 29 Years | 1,178 (91.5%) | 26 (2.2%) |
| 30 to 34 Years | 1,189 (94.3%) | 24 (2.0%) |
| 35 to 44 Years | 1,612 (88.5%) | 26 (1.6%) |
| 45 to 54 Years | 1,837 (89.4%) | 92 (5.0%) |
| 55 to 59 Years | 1,459 (86.1%) | 50 (3.4%) |
| 60 to 64 Years | 1,169 (67.0%) | 18 (1.5%) |
| 65 to 74 Years | 581 (32.8%) | 0 (0.0%) |
| 75 Years and over | 68 (4.2%) | 0 (0.0%) |
| Total | 10,452 (68.1%) | 303 (2.9%) |
Employment Status by Educational Attainment in North Massapequa
According to labor force statistics for North Massapequa, 85.6% of individuals (8,444) out of the total population between 25 and 64 years of age (9,864) are in the labor force, with 2.8% or 236 of them being unemployed. The group with the highest labor force participation rate are those with the educational attainment of bachelor's degree or higher, with 89.2% or 4,676 individuals in the labor force. Within the labor force, individuals with less than high school education have the highest percentage of unemployment, with 6.8% or 12 of them being unemployed.
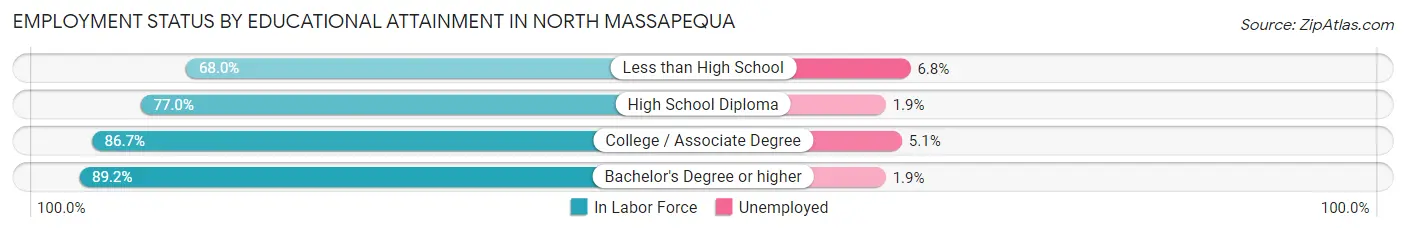
| Educational Attainment | In Labor Force | Unemployed |
| Less than High School | 176 (68.0%) | 18 (6.8%) |
| High School Diploma | 1,503 (77.0%) | 37 (1.9%) |
| College / Associate Degree | 2,090 (86.7%) | 123 (5.1%) |
| Bachelor's Degree or higher | 4,676 (89.2%) | 100 (1.9%) |
| Total | 8,444 (85.6%) | 276 (2.8%) |
Employment Occupations by Sex in North Massapequa
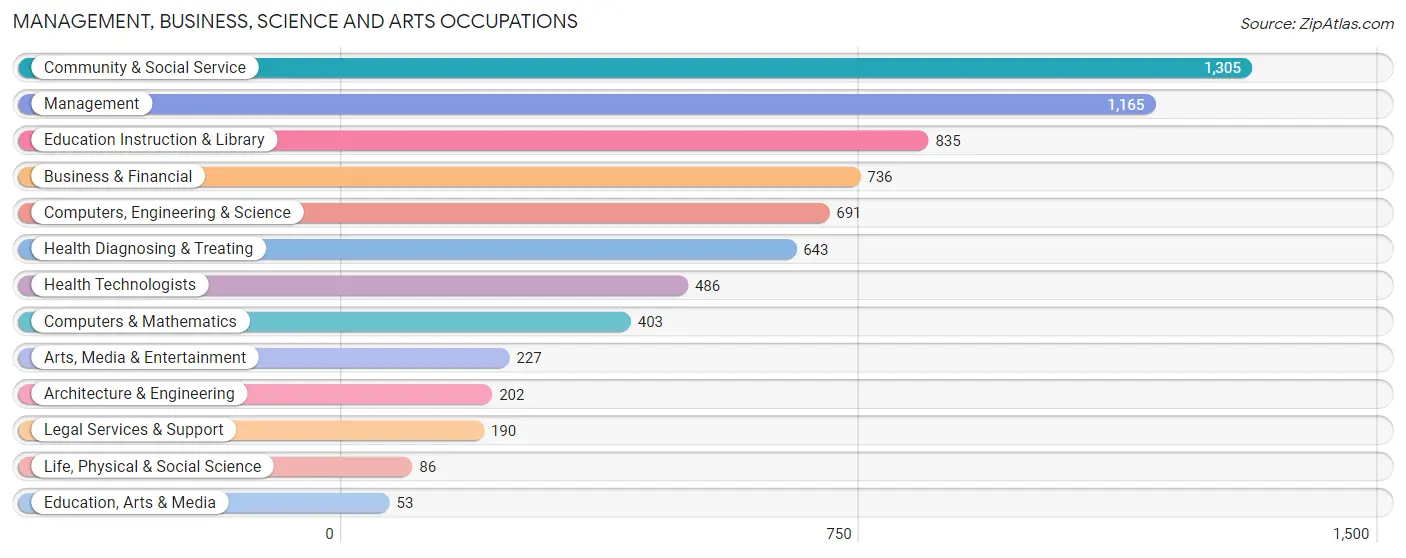
Management, Business, Science and Arts Occupations
The most common Management, Business, Science and Arts occupations in North Massapequa are Community & Social Service (1,305 | 12.9%), Management (1,165 | 11.5%), Education Instruction & Library (835 | 8.2%), Business & Financial (736 | 7.2%), and Computers, Engineering & Science (691 | 6.8%).
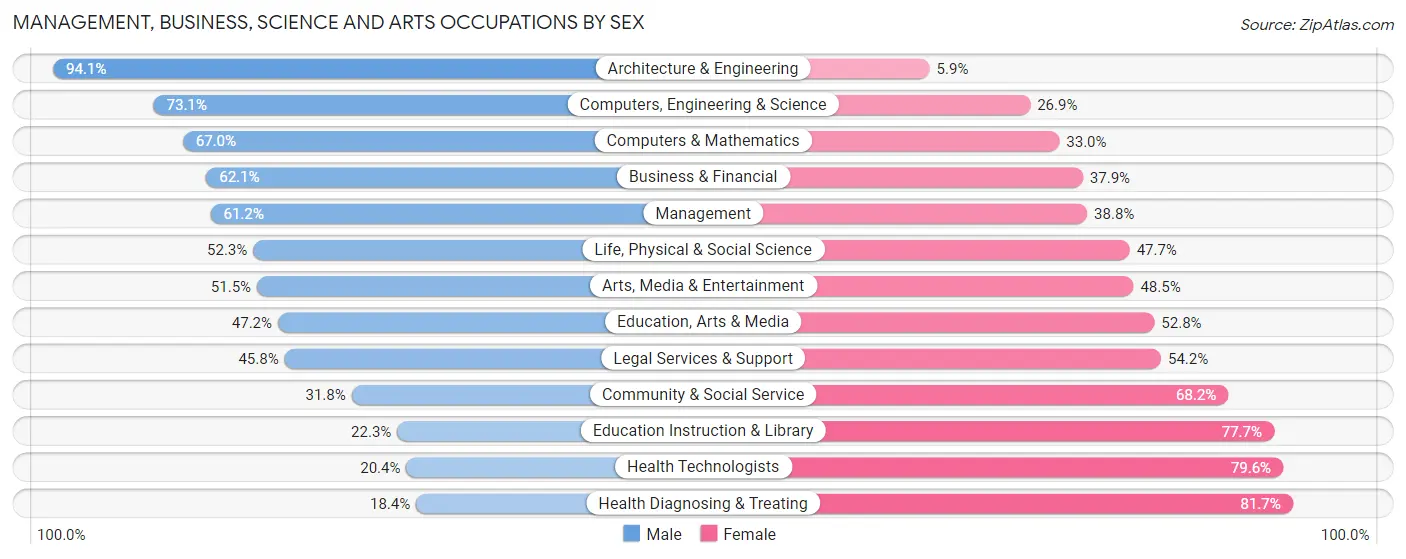
Management, Business, Science and Arts Occupations by Sex
Within the Management, Business, Science and Arts occupations in North Massapequa, the most male-oriented occupations are Architecture & Engineering (94.1%), Computers, Engineering & Science (73.1%), and Computers & Mathematics (67.0%), while the most female-oriented occupations are Health Diagnosing & Treating (81.7%), Health Technologists (79.6%), and Education Instruction & Library (77.7%).
| Occupation | Male | Female |
| Management | 713 (61.2%) | 452 (38.8%) |
| Business & Financial | 457 (62.1%) | 279 (37.9%) |
| Computers, Engineering & Science | 505 (73.1%) | 186 (26.9%) |
| Computers & Mathematics | 270 (67.0%) | 133 (33.0%) |
| Architecture & Engineering | 190 (94.1%) | 12 (5.9%) |
| Life, Physical & Social Science | 45 (52.3%) | 41 (47.7%) |
| Community & Social Service | 415 (31.8%) | 890 (68.2%) |
| Education, Arts & Media | 25 (47.2%) | 28 (52.8%) |
| Legal Services & Support | 87 (45.8%) | 103 (54.2%) |
| Education Instruction & Library | 186 (22.3%) | 649 (77.7%) |
| Arts, Media & Entertainment | 117 (51.5%) | 110 (48.5%) |
| Health Diagnosing & Treating | 118 (18.3%) | 525 (81.7%) |
| Health Technologists | 99 (20.4%) | 387 (79.6%) |
| Total (Category) | 2,208 (48.6%) | 2,332 (51.4%) |
| Total (Overall) | 5,225 (51.5%) | 4,927 (48.5%) |
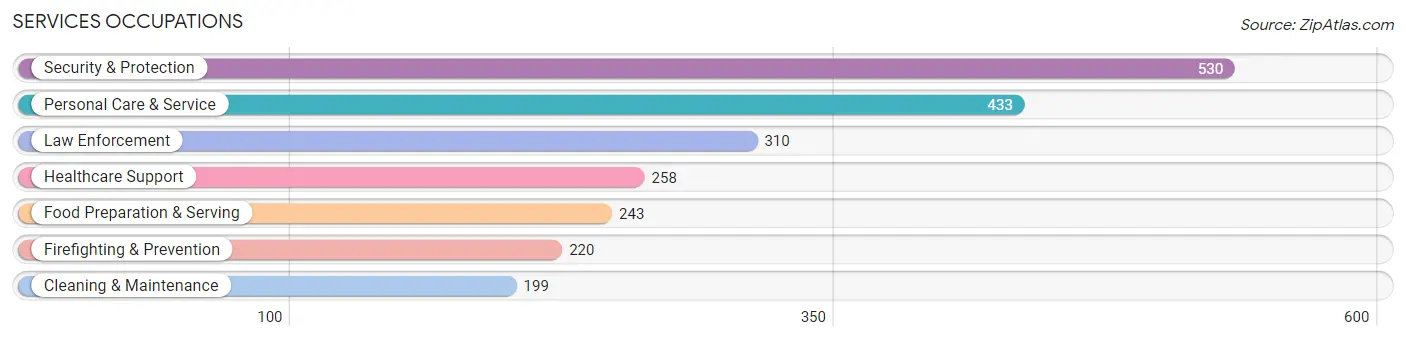
Services Occupations
The most common Services occupations in North Massapequa are Security & Protection (530 | 5.2%), Personal Care & Service (433 | 4.3%), Law Enforcement (310 | 3.0%), Healthcare Support (258 | 2.5%), and Food Preparation & Serving (243 | 2.4%).
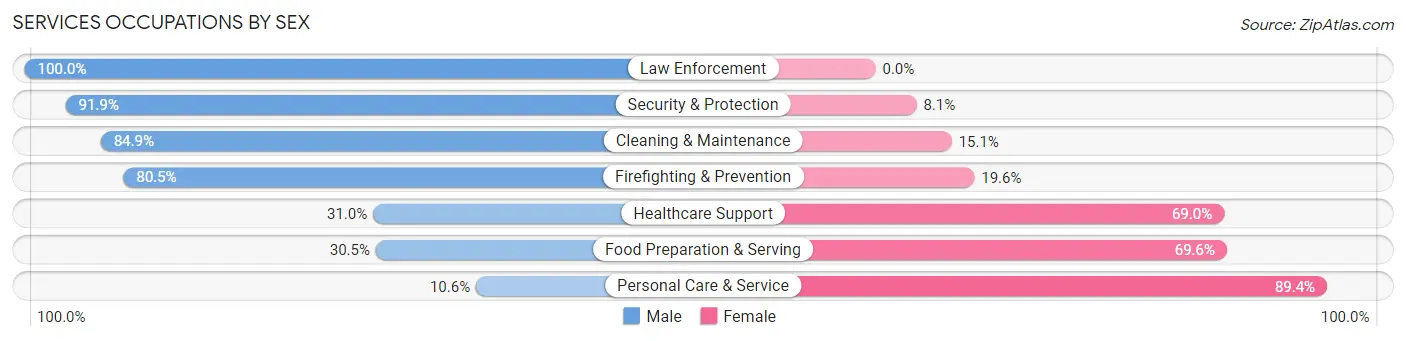
Services Occupations by Sex
Within the Services occupations in North Massapequa, the most male-oriented occupations are Law Enforcement (100.0%), Security & Protection (91.9%), and Cleaning & Maintenance (84.9%), while the most female-oriented occupations are Personal Care & Service (89.4%), Food Preparation & Serving (69.6%), and Healthcare Support (69.0%).
| Occupation | Male | Female |
| Healthcare Support | 80 (31.0%) | 178 (69.0%) |
| Security & Protection | 487 (91.9%) | 43 (8.1%) |
| Firefighting & Prevention | 177 (80.4%) | 43 (19.6%) |
| Law Enforcement | 310 (100.0%) | 0 (0.0%) |
| Food Preparation & Serving | 74 (30.4%) | 169 (69.6%) |
| Cleaning & Maintenance | 169 (84.9%) | 30 (15.1%) |
| Personal Care & Service | 46 (10.6%) | 387 (89.4%) |
| Total (Category) | 856 (51.5%) | 807 (48.5%) |
| Total (Overall) | 5,225 (51.5%) | 4,927 (48.5%) |
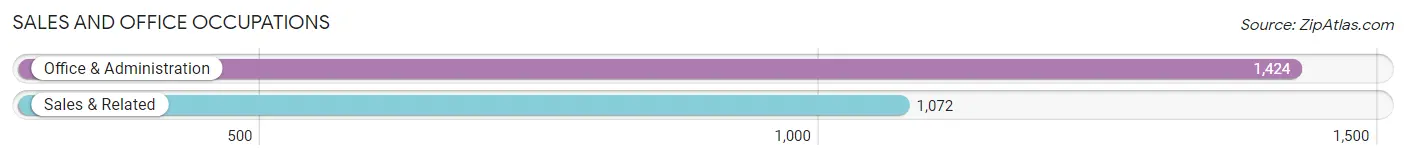
Sales and Office Occupations
The most common Sales and Office occupations in North Massapequa are Office & Administration (1,424 | 14.0%), and Sales & Related (1,072 | 10.6%).
Sales and Office Occupations by Sex
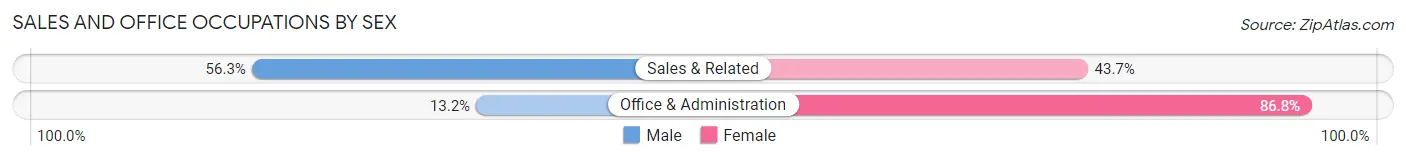
| Occupation | Male | Female |
| Sales & Related | 604 (56.3%) | 468 (43.7%) |
| Office & Administration | 188 (13.2%) | 1,236 (86.8%) |
| Total (Category) | 792 (31.7%) | 1,704 (68.3%) |
| Total (Overall) | 5,225 (51.5%) | 4,927 (48.5%) |
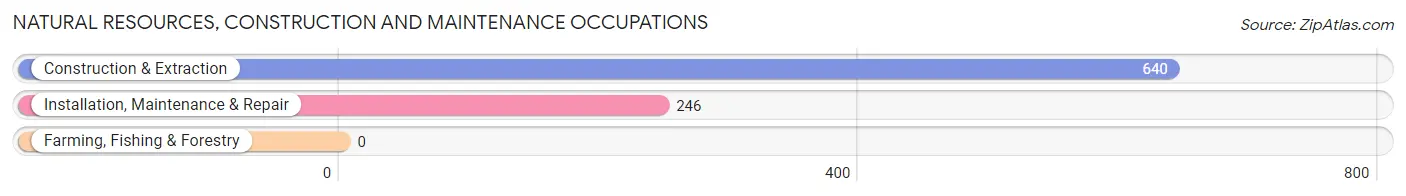
Natural Resources, Construction and Maintenance Occupations
The most common Natural Resources, Construction and Maintenance occupations in North Massapequa are Construction & Extraction (640 | 6.3%), and Installation, Maintenance & Repair (246 | 2.4%).
Natural Resources, Construction and Maintenance Occupations by Sex
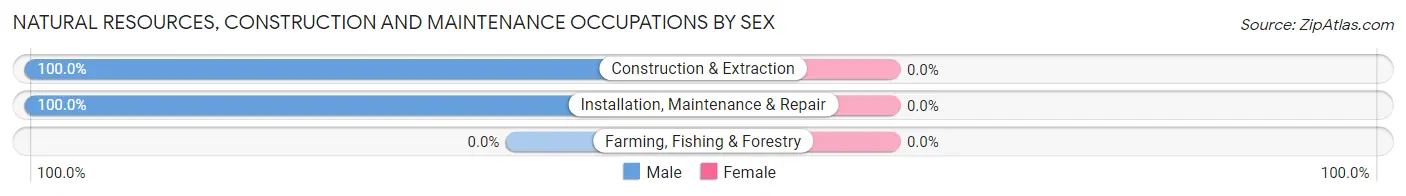
| Occupation | Male | Female |
| Farming, Fishing & Forestry | 0 (0.0%) | 0 (0.0%) |
| Construction & Extraction | 640 (100.0%) | 0 (0.0%) |
| Installation, Maintenance & Repair | 246 (100.0%) | 0 (0.0%) |
| Total (Category) | 886 (100.0%) | 0 (0.0%) |
| Total (Overall) | 5,225 (51.5%) | 4,927 (48.5%) |
Production, Transportation and Moving Occupations
The most common Production, Transportation and Moving occupations in North Massapequa are Transportation (196 | 1.9%), Material Moving (190 | 1.9%), and Production (181 | 1.8%).
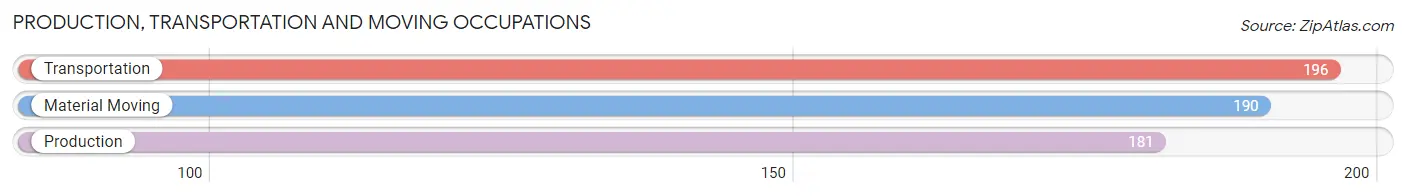
Production, Transportation and Moving Occupations by Sex
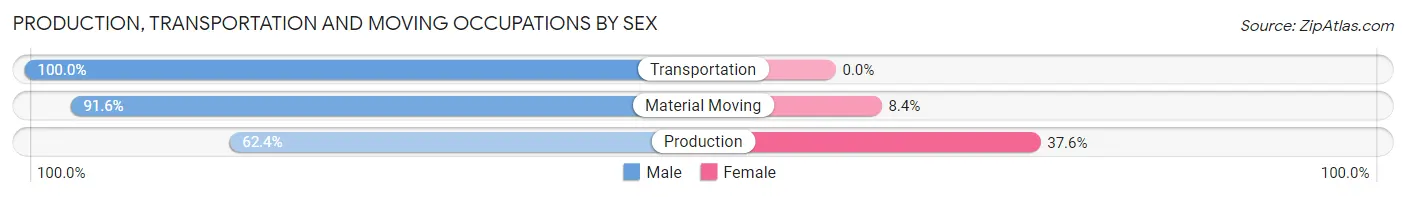
| Occupation | Male | Female |
| Production | 113 (62.4%) | 68 (37.6%) |
| Transportation | 196 (100.0%) | 0 (0.0%) |
| Material Moving | 174 (91.6%) | 16 (8.4%) |
| Total (Category) | 483 (85.2%) | 84 (14.8%) |
| Total (Overall) | 5,225 (51.5%) | 4,927 (48.5%) |
Employment Industries by Sex in North Massapequa
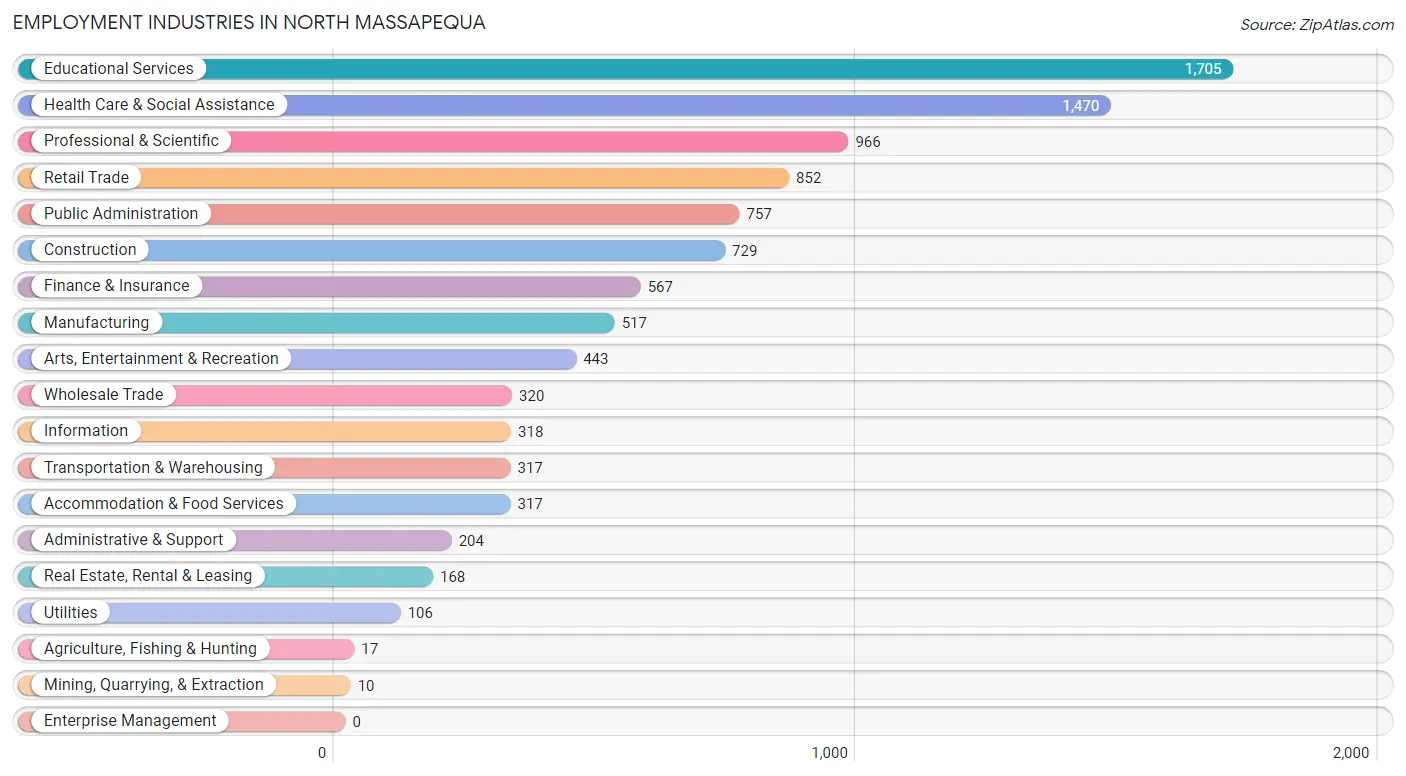
Employment Industries in North Massapequa
The major employment industries in North Massapequa include Educational Services (1,705 | 16.8%), Health Care & Social Assistance (1,470 | 14.5%), Professional & Scientific (966 | 9.5%), Retail Trade (852 | 8.4%), and Public Administration (757 | 7.5%).
Employment Industries by Sex in North Massapequa
The North Massapequa industries that see more men than women are Agriculture, Fishing & Hunting (100.0%), Construction (92.9%), and Utilities (91.5%), whereas the industries that tend to have a higher number of women are Mining, Quarrying, & Extraction (100.0%), Real Estate, Rental & Leasing (80.9%), and Educational Services (75.8%).
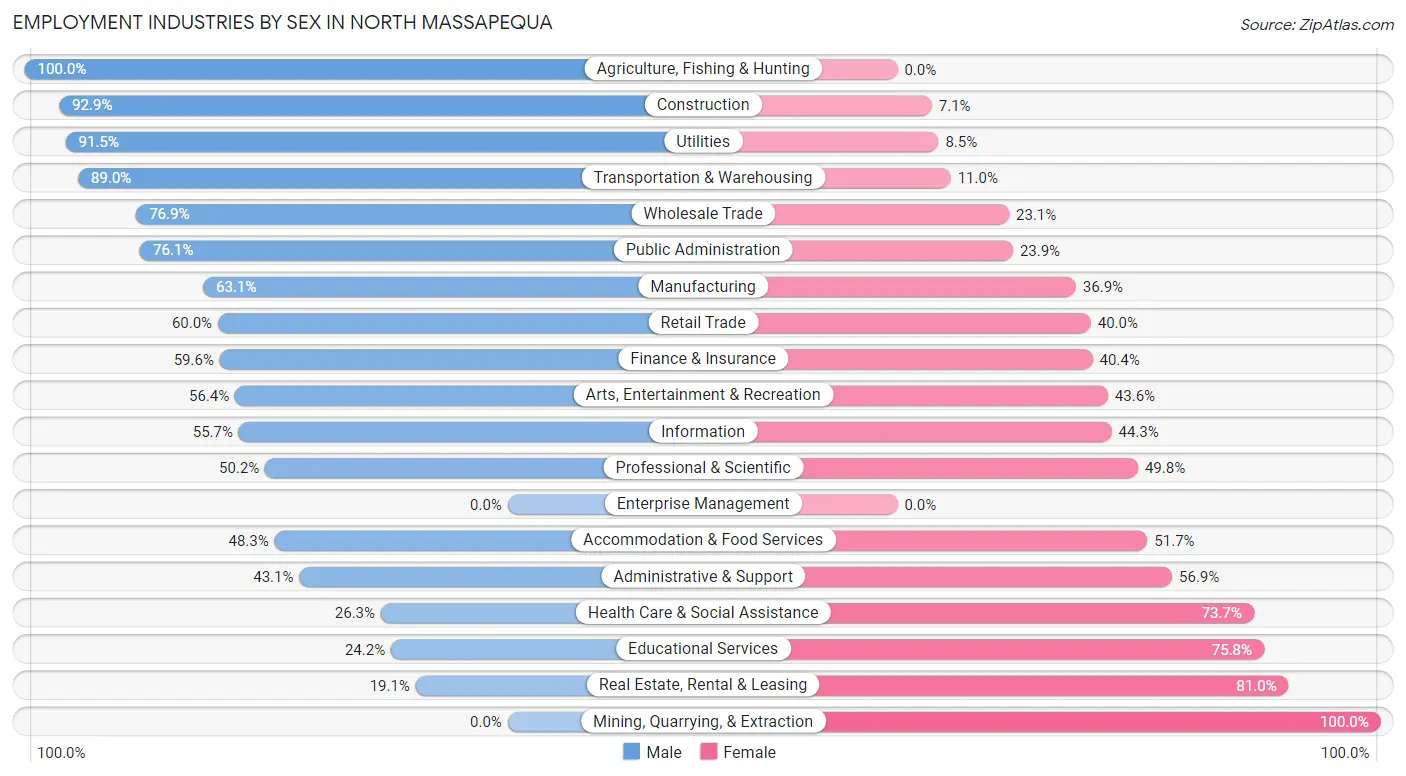
| Industry | Male | Female |
| Agriculture, Fishing & Hunting | 17 (100.0%) | 0 (0.0%) |
| Mining, Quarrying, & Extraction | 0 (0.0%) | 10 (100.0%) |
| Construction | 677 (92.9%) | 52 (7.1%) |
| Manufacturing | 326 (63.1%) | 191 (36.9%) |
| Wholesale Trade | 246 (76.9%) | 74 (23.1%) |
| Retail Trade | 511 (60.0%) | 341 (40.0%) |
| Transportation & Warehousing | 282 (89.0%) | 35 (11.0%) |
| Utilities | 97 (91.5%) | 9 (8.5%) |
| Information | 177 (55.7%) | 141 (44.3%) |
| Finance & Insurance | 338 (59.6%) | 229 (40.4%) |
| Real Estate, Rental & Leasing | 32 (19.1%) | 136 (80.9%) |
| Professional & Scientific | 485 (50.2%) | 481 (49.8%) |
| Enterprise Management | 0 (0.0%) | 0 (0.0%) |
| Administrative & Support | 88 (43.1%) | 116 (56.9%) |
| Educational Services | 412 (24.2%) | 1,293 (75.8%) |
| Health Care & Social Assistance | 386 (26.3%) | 1,084 (73.7%) |
| Arts, Entertainment & Recreation | 250 (56.4%) | 193 (43.6%) |
| Accommodation & Food Services | 153 (48.3%) | 164 (51.7%) |
| Public Administration | 576 (76.1%) | 181 (23.9%) |
| Total | 5,225 (51.5%) | 4,927 (48.5%) |
Education in North Massapequa
School Enrollment in North Massapequa
The most common levels of schooling among the 3,677 students in North Massapequa are college / undergraduate (1,107 | 30.1%), elementary school (778 | 21.2%), and high school (741 | 20.2%).
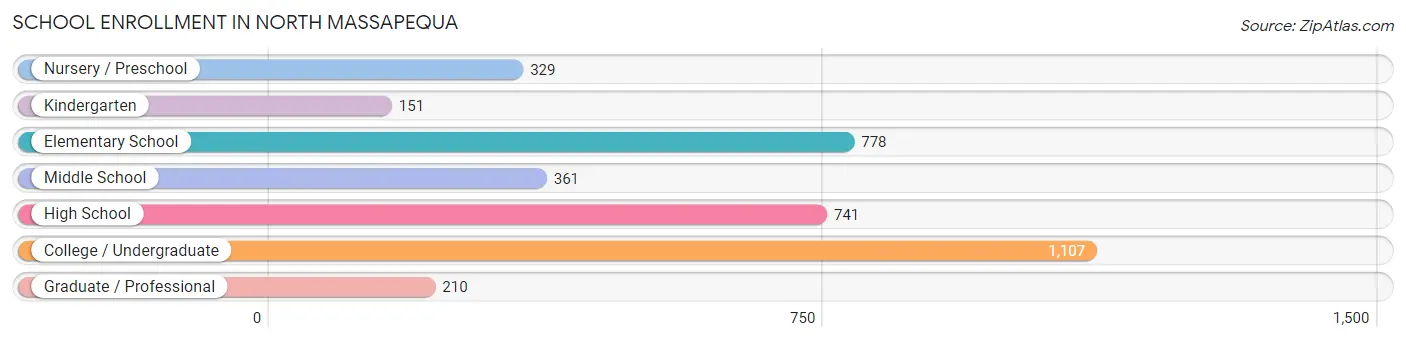
| School Level | # Students | % Students |
| Nursery / Preschool | 329 | 8.9% |
| Kindergarten | 151 | 4.1% |
| Elementary School | 778 | 21.2% |
| Middle School | 361 | 9.8% |
| High School | 741 | 20.2% |
| College / Undergraduate | 1,107 | 30.1% |
| Graduate / Professional | 210 | 5.7% |
| Total | 3,677 | 100.0% |
School Enrollment by Age by Funding Source in North Massapequa
Out of a total of 3,677 students who are enrolled in schools in North Massapequa, 824 (22.4%) attend a private institution, while the remaining 2,853 (77.6%) are enrolled in public schools. The age group of 35 years and over has the highest likelihood of being enrolled in private schools, with 55 (60.4% in the age bracket) enrolled. Conversely, the age group of 10 to 14 year olds has the lowest likelihood of being enrolled in a private school, with 594 (100.0% in the age bracket) attending a public institution.
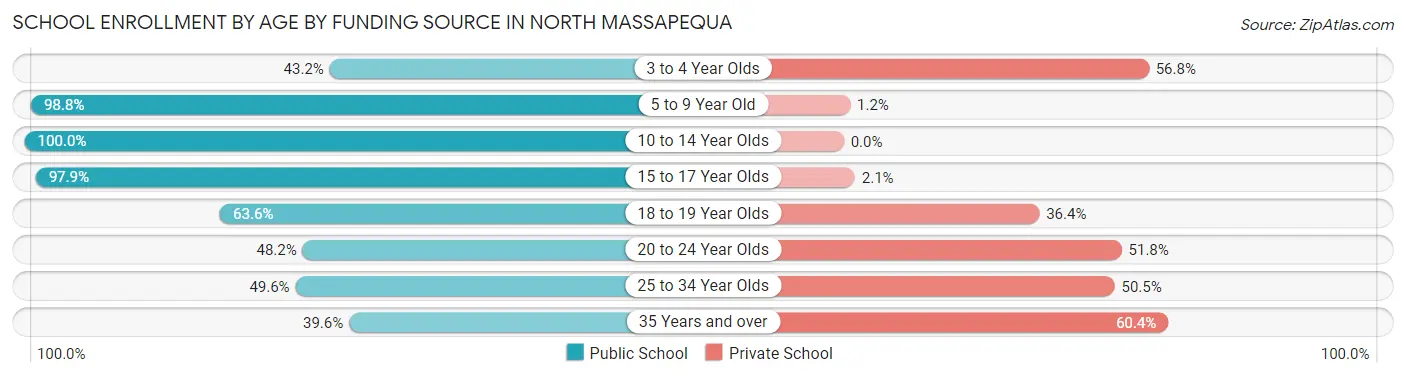
| Age Bracket | Public School | Private School |
| 3 to 4 Year Olds | 114 (43.2%) | 150 (56.8%) |
| 5 to 9 Year Old | 903 (98.8%) | 11 (1.2%) |
| 10 to 14 Year Olds | 594 (100.0%) | 0 (0.0%) |
| 15 to 17 Year Olds | 566 (97.9%) | 12 (2.1%) |
| 18 to 19 Year Olds | 178 (63.6%) | 102 (36.4%) |
| 20 to 24 Year Olds | 355 (48.2%) | 381 (51.8%) |
| 25 to 34 Year Olds | 109 (49.5%) | 111 (50.4%) |
| 35 Years and over | 36 (39.6%) | 55 (60.4%) |
| Total | 2,853 (77.6%) | 824 (22.4%) |
Educational Attainment by Field of Study in North Massapequa
Business (1,802 | 29.4%), education (920 | 15.0%), science & technology (610 | 9.9%), social sciences (425 | 6.9%), and arts & humanities (419 | 6.8%) are the most common fields of study among 6,137 individuals in North Massapequa who have obtained a bachelor's degree or higher.
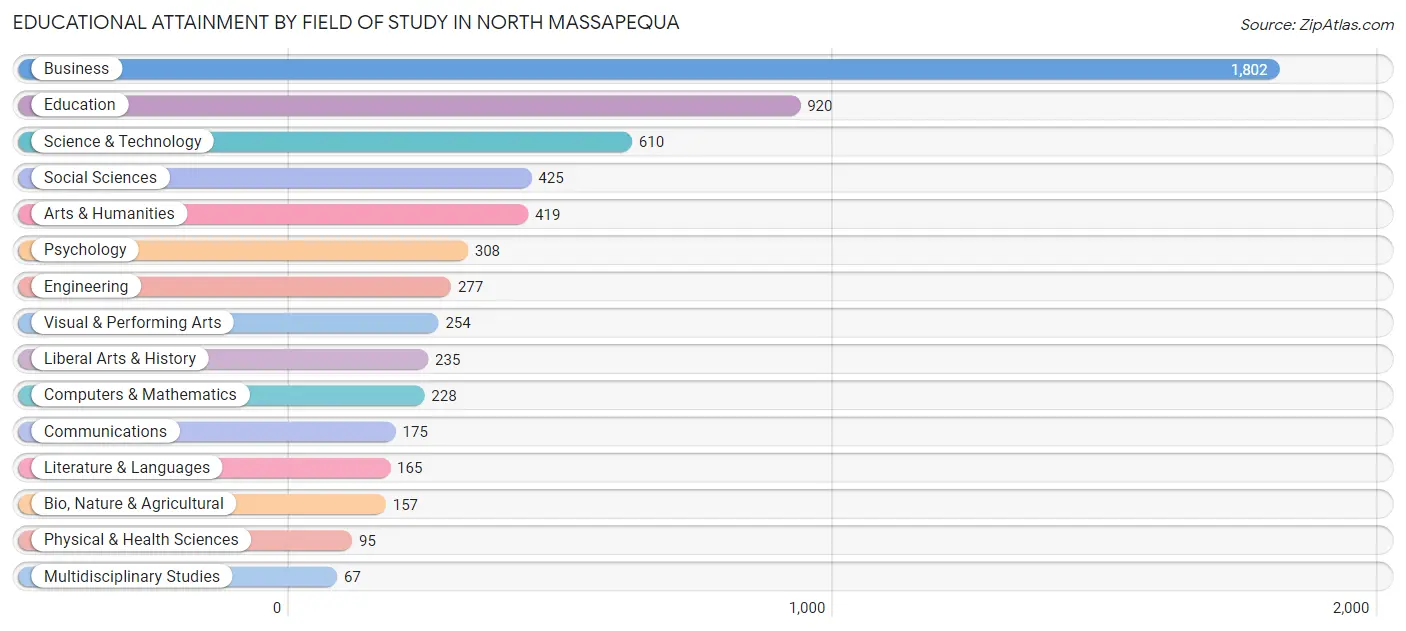
| Field of Study | # Graduates | % Graduates |
| Computers & Mathematics | 228 | 3.7% |
| Bio, Nature & Agricultural | 157 | 2.6% |
| Physical & Health Sciences | 95 | 1.5% |
| Psychology | 308 | 5.0% |
| Social Sciences | 425 | 6.9% |
| Engineering | 277 | 4.5% |
| Multidisciplinary Studies | 67 | 1.1% |
| Science & Technology | 610 | 9.9% |
| Business | 1,802 | 29.4% |
| Education | 920 | 15.0% |
| Literature & Languages | 165 | 2.7% |
| Liberal Arts & History | 235 | 3.8% |
| Visual & Performing Arts | 254 | 4.1% |
| Communications | 175 | 2.9% |
| Arts & Humanities | 419 | 6.8% |
| Total | 6,137 | 100.0% |
Transportation & Commute in North Massapequa
Vehicle Availability by Sex in North Massapequa
The most prevalent vehicle ownership categories in North Massapequa are males with 2 vehicles (2,128, accounting for 41.1%) and females with 2 vehicles (1,854, making up 43.8%).
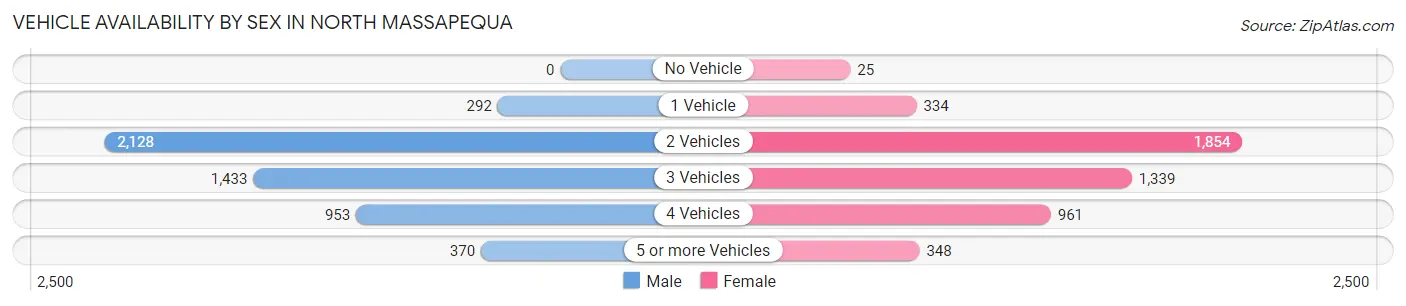
| Vehicles Available | Male | Female |
| No Vehicle | 0 (0.0%) | 25 (0.5%) |
| 1 Vehicle | 292 (5.6%) | 334 (6.9%) |
| 2 Vehicles | 2,128 (41.1%) | 1,854 (38.1%) |
| 3 Vehicles | 1,433 (27.7%) | 1,339 (27.6%) |
| 4 Vehicles | 953 (18.4%) | 961 (19.8%) |
| 5 or more Vehicles | 370 (7.1%) | 348 (7.2%) |
| Total | 5,176 (100.0%) | 4,861 (100.0%) |
Commute Time in North Massapequa
The most frequently occuring commute durations in North Massapequa are 15 to 19 minutes (1,313 commuters, 14.8%), 20 to 24 minutes (1,311 commuters, 14.8%), and 30 to 34 minutes (897 commuters, 10.1%).
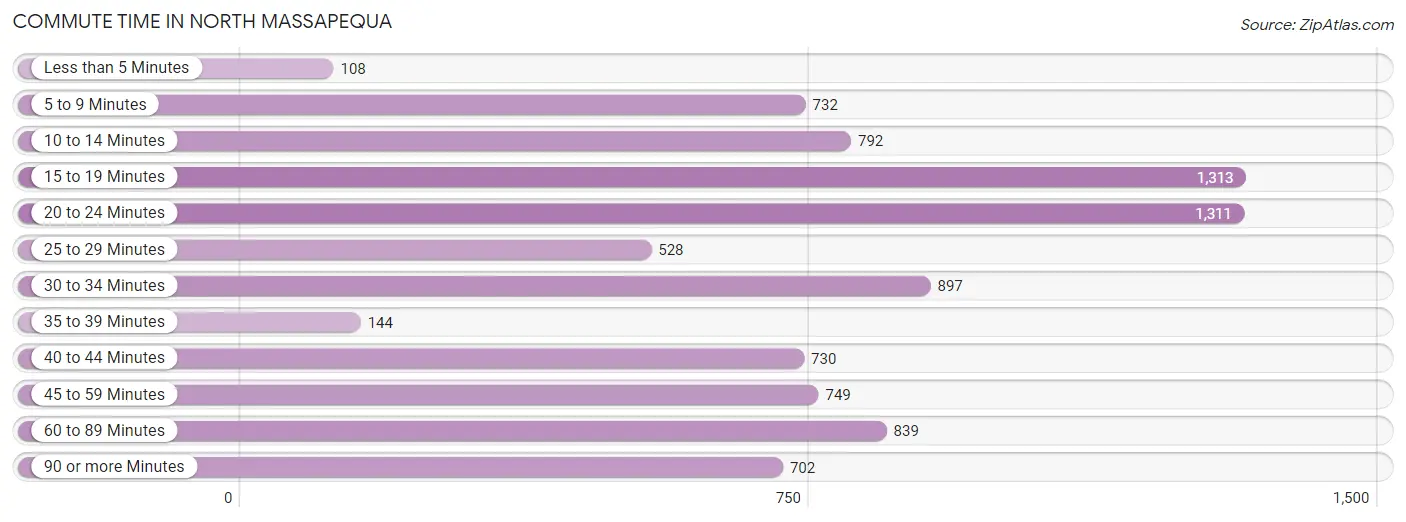
| Commute Time | # Commuters | % Commuters |
| Less than 5 Minutes | 108 | 1.2% |
| 5 to 9 Minutes | 732 | 8.3% |
| 10 to 14 Minutes | 792 | 8.9% |
| 15 to 19 Minutes | 1,313 | 14.8% |
| 20 to 24 Minutes | 1,311 | 14.8% |
| 25 to 29 Minutes | 528 | 6.0% |
| 30 to 34 Minutes | 897 | 10.1% |
| 35 to 39 Minutes | 144 | 1.6% |
| 40 to 44 Minutes | 730 | 8.3% |
| 45 to 59 Minutes | 749 | 8.5% |
| 60 to 89 Minutes | 839 | 9.5% |
| 90 or more Minutes | 702 | 7.9% |
Commute Time by Sex in North Massapequa
The most common commute times in North Massapequa are 60 to 89 minutes (599 commuters, 13.0%) for males and 15 to 19 minutes (825 commuters, 19.4%) for females.
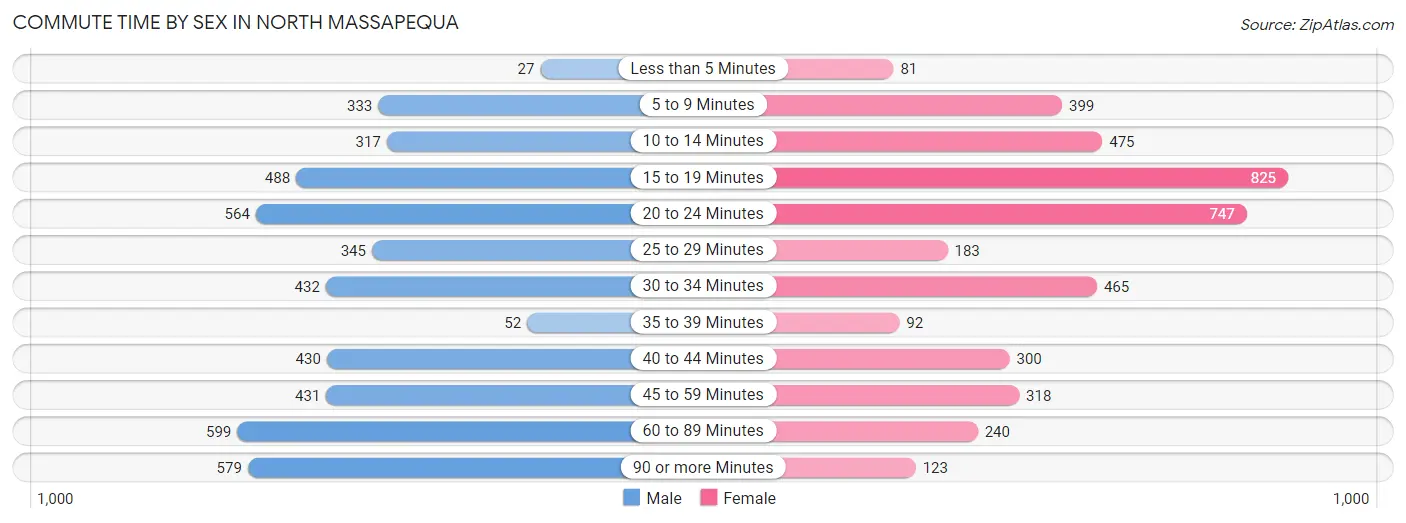
| Commute Time | Male | Female |
| Less than 5 Minutes | 27 (0.6%) | 81 (1.9%) |
| 5 to 9 Minutes | 333 (7.2%) | 399 (9.4%) |
| 10 to 14 Minutes | 317 (6.9%) | 475 (11.2%) |
| 15 to 19 Minutes | 488 (10.6%) | 825 (19.4%) |
| 20 to 24 Minutes | 564 (12.3%) | 747 (17.6%) |
| 25 to 29 Minutes | 345 (7.5%) | 183 (4.3%) |
| 30 to 34 Minutes | 432 (9.4%) | 465 (11.0%) |
| 35 to 39 Minutes | 52 (1.1%) | 92 (2.2%) |
| 40 to 44 Minutes | 430 (9.3%) | 300 (7.1%) |
| 45 to 59 Minutes | 431 (9.4%) | 318 (7.5%) |
| 60 to 89 Minutes | 599 (13.0%) | 240 (5.7%) |
| 90 or more Minutes | 579 (12.6%) | 123 (2.9%) |
Time of Departure to Work by Sex in North Massapequa
The most frequent times of departure to work in North Massapequa are 8:00 AM to 8:29 AM (675, 14.7%) for males and 8:00 AM to 8:29 AM (1,011, 23.8%) for females.
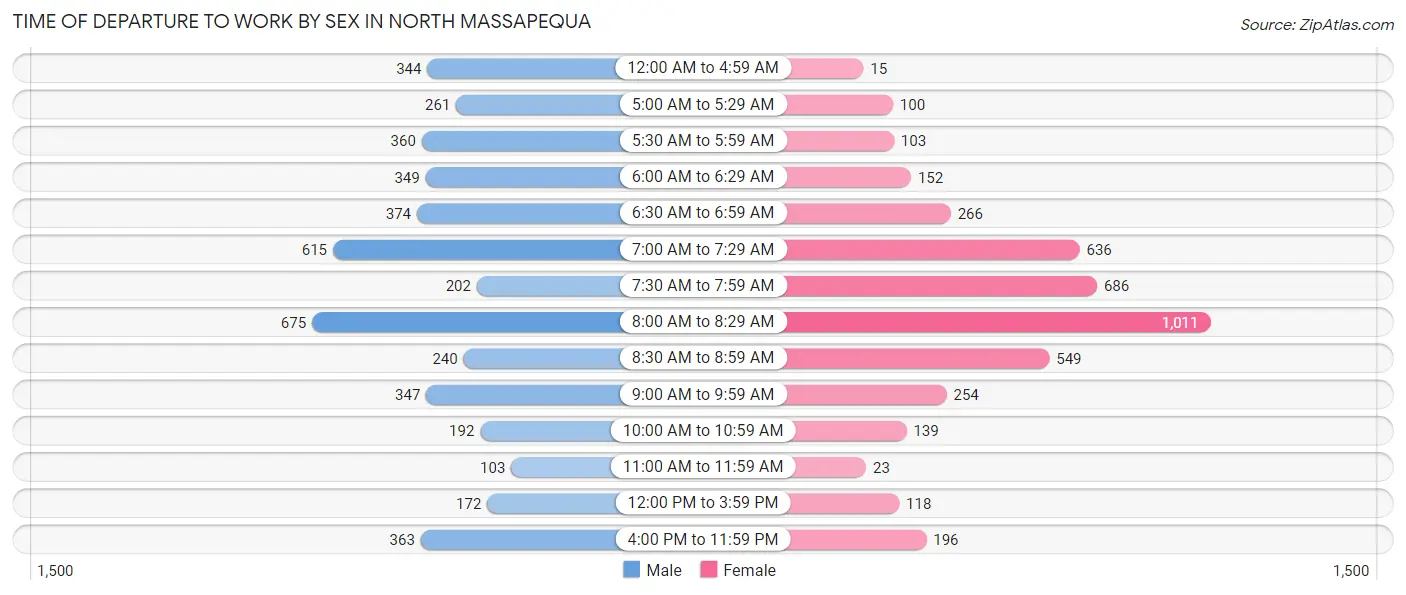
| Time of Departure | Male | Female |
| 12:00 AM to 4:59 AM | 344 (7.5%) | 15 (0.4%) |
| 5:00 AM to 5:29 AM | 261 (5.7%) | 100 (2.4%) |
| 5:30 AM to 5:59 AM | 360 (7.8%) | 103 (2.4%) |
| 6:00 AM to 6:29 AM | 349 (7.6%) | 152 (3.6%) |
| 6:30 AM to 6:59 AM | 374 (8.1%) | 266 (6.3%) |
| 7:00 AM to 7:29 AM | 615 (13.4%) | 636 (15.0%) |
| 7:30 AM to 7:59 AM | 202 (4.4%) | 686 (16.2%) |
| 8:00 AM to 8:29 AM | 675 (14.7%) | 1,011 (23.8%) |
| 8:30 AM to 8:59 AM | 240 (5.2%) | 549 (12.9%) |
| 9:00 AM to 9:59 AM | 347 (7.5%) | 254 (6.0%) |
| 10:00 AM to 10:59 AM | 192 (4.2%) | 139 (3.3%) |
| 11:00 AM to 11:59 AM | 103 (2.2%) | 23 (0.5%) |
| 12:00 PM to 3:59 PM | 172 (3.7%) | 118 (2.8%) |
| 4:00 PM to 11:59 PM | 363 (7.9%) | 196 (4.6%) |
| Total | 4,597 (100.0%) | 4,248 (100.0%) |
Housing Occupancy in North Massapequa
Occupancy by Ownership in North Massapequa
Of the total 6,330 dwellings in North Massapequa, owner-occupied units account for 5,995 (94.7%), while renter-occupied units make up 335 (5.3%).
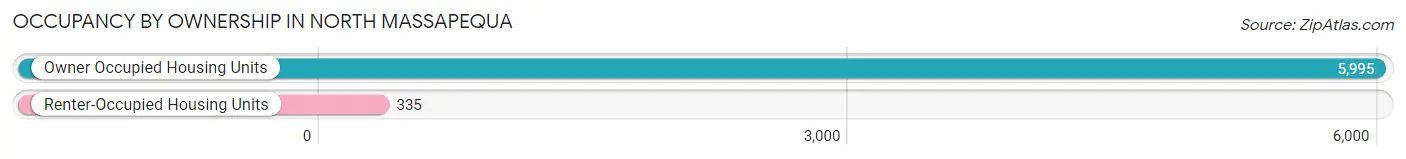
| Occupancy | # Housing Units | % Housing Units |
| Owner Occupied Housing Units | 5,995 | 94.7% |
| Renter-Occupied Housing Units | 335 | 5.3% |
| Total Occupied Housing Units | 6,330 | 100.0% |
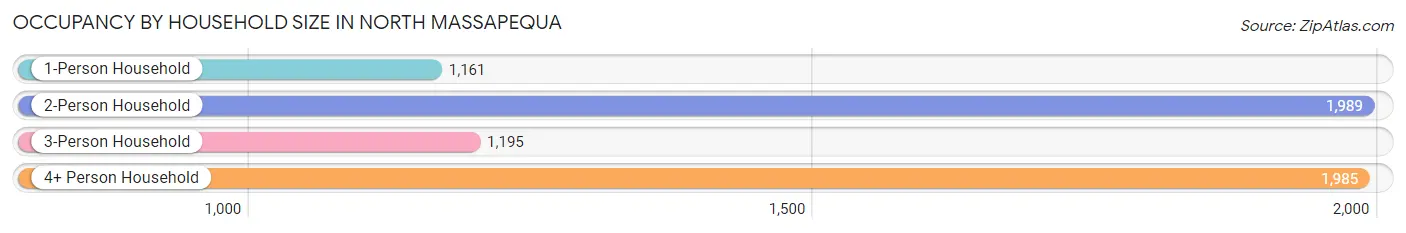
Occupancy by Household Size in North Massapequa
| Household Size | # Housing Units | % Housing Units |
| 1-Person Household | 1,161 | 18.3% |
| 2-Person Household | 1,989 | 31.4% |
| 3-Person Household | 1,195 | 18.9% |
| 4+ Person Household | 1,985 | 31.4% |
| Total Housing Units | 6,330 | 100.0% |
Occupancy by Ownership by Household Size in North Massapequa
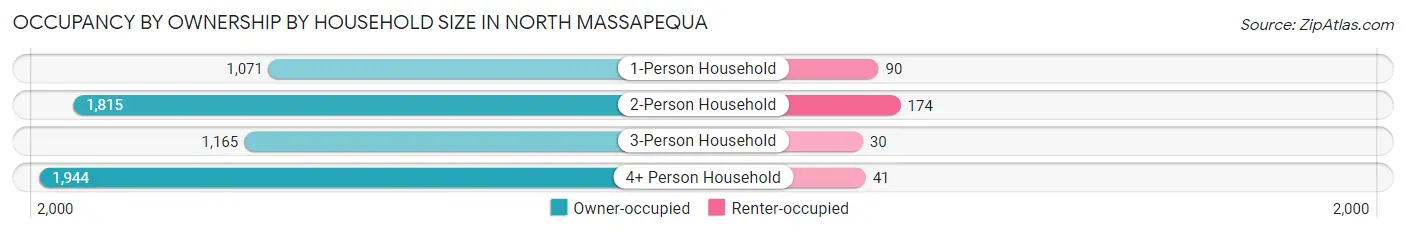
| Household Size | Owner-occupied | Renter-occupied |
| 1-Person Household | 1,071 (92.2%) | 90 (7.7%) |
| 2-Person Household | 1,815 (91.2%) | 174 (8.7%) |
| 3-Person Household | 1,165 (97.5%) | 30 (2.5%) |
| 4+ Person Household | 1,944 (97.9%) | 41 (2.1%) |
| Total Housing Units | 5,995 (94.7%) | 335 (5.3%) |
Occupancy by Educational Attainment in North Massapequa
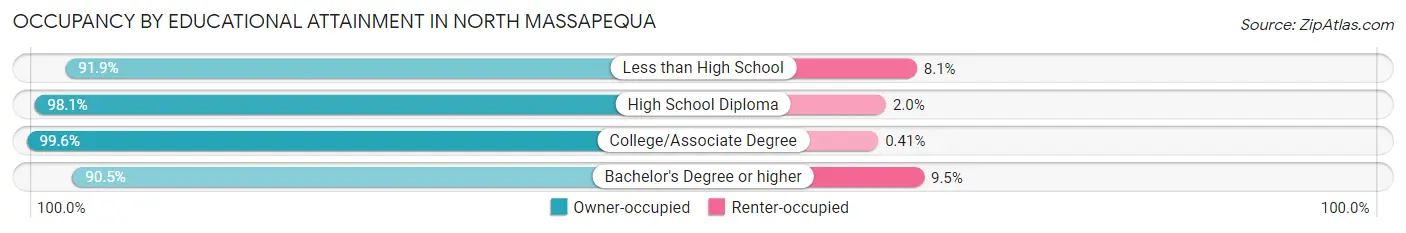
| Household Size | Owner-occupied | Renter-occupied |
| Less than High School | 262 (91.9%) | 23 (8.1%) |
| High School Diploma | 1,407 (98.1%) | 28 (1.9%) |
| College/Associate Degree | 1,684 (99.6%) | 7 (0.4%) |
| Bachelor's Degree or higher | 2,642 (90.5%) | 277 (9.5%) |
Occupancy by Age of Householder in North Massapequa
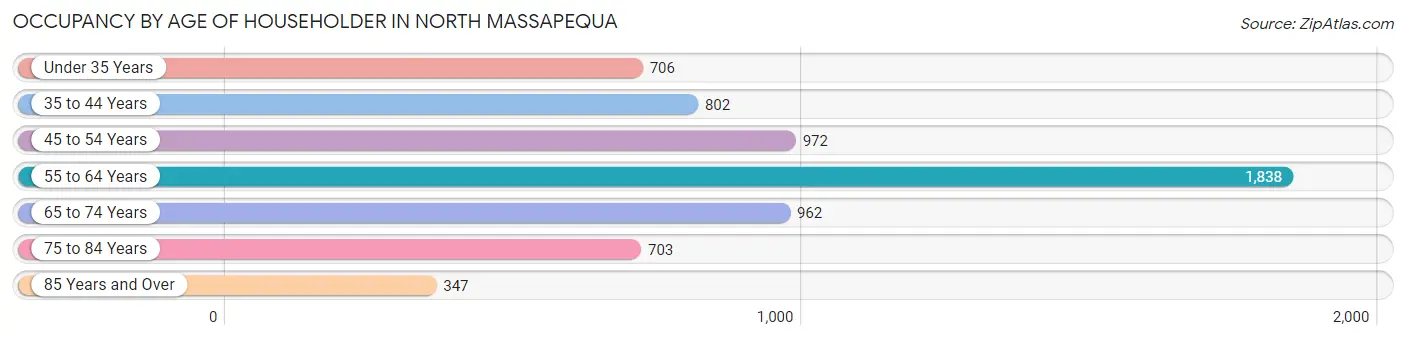
| Age Bracket | # Households | % Households |
| Under 35 Years | 706 | 11.2% |
| 35 to 44 Years | 802 | 12.7% |
| 45 to 54 Years | 972 | 15.4% |
| 55 to 64 Years | 1,838 | 29.0% |
| 65 to 74 Years | 962 | 15.2% |
| 75 to 84 Years | 703 | 11.1% |
| 85 Years and Over | 347 | 5.5% |
| Total | 6,330 | 100.0% |
Housing Finances in North Massapequa
Median Income by Occupancy in North Massapequa
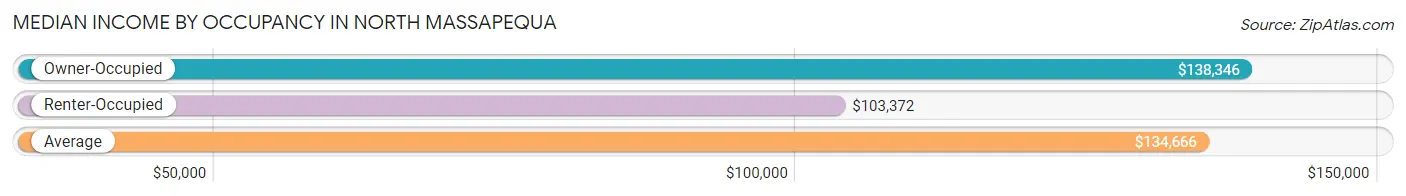
| Occupancy Type | # Households | Median Income |
| Owner-Occupied | 5,995 (94.7%) | $138,346 |
| Renter-Occupied | 335 (5.3%) | $103,372 |
| Average | 6,330 (100.0%) | $134,666 |
Occupancy by Householder Income Bracket in North Massapequa
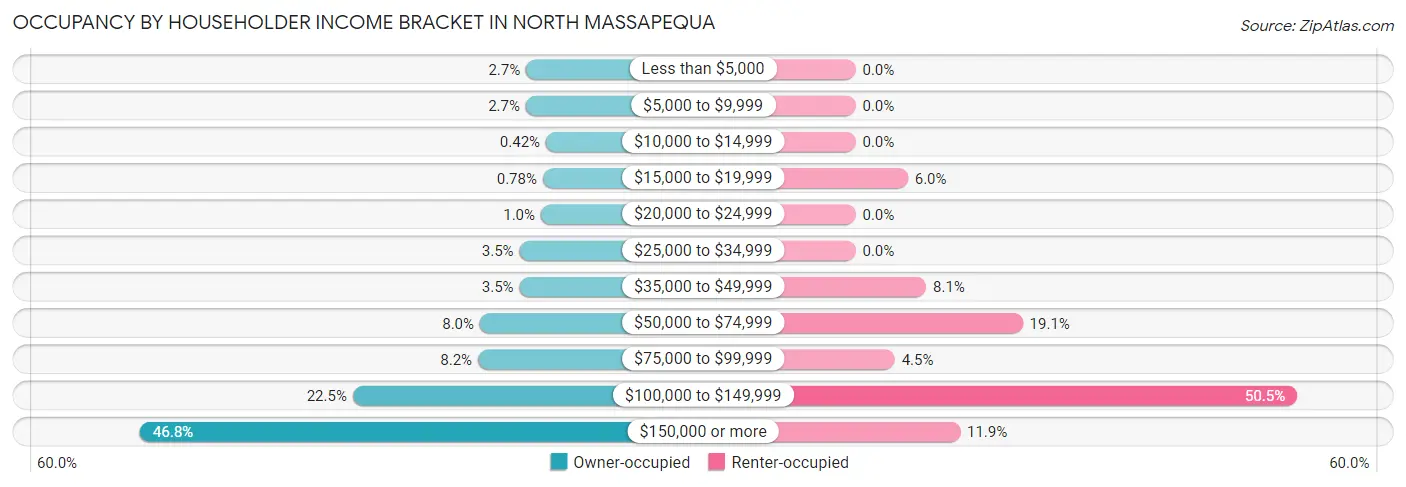
| Income Bracket | Owner-occupied | Renter-occupied |
| Less than $5,000 | 161 (2.7%) | 0 (0.0%) |
| $5,000 to $9,999 | 163 (2.7%) | 0 (0.0%) |
| $10,000 to $14,999 | 25 (0.4%) | 0 (0.0%) |
| $15,000 to $19,999 | 47 (0.8%) | 20 (6.0%) |
| $20,000 to $24,999 | 60 (1.0%) | 0 (0.0%) |
| $25,000 to $34,999 | 207 (3.5%) | 0 (0.0%) |
| $35,000 to $49,999 | 207 (3.5%) | 27 (8.1%) |
| $50,000 to $74,999 | 478 (8.0%) | 64 (19.1%) |
| $75,000 to $99,999 | 491 (8.2%) | 15 (4.5%) |
| $100,000 to $149,999 | 1,349 (22.5%) | 169 (50.4%) |
| $150,000 or more | 2,807 (46.8%) | 40 (11.9%) |
| Total | 5,995 (100.0%) | 335 (100.0%) |
Monthly Housing Cost Tiers in North Massapequa
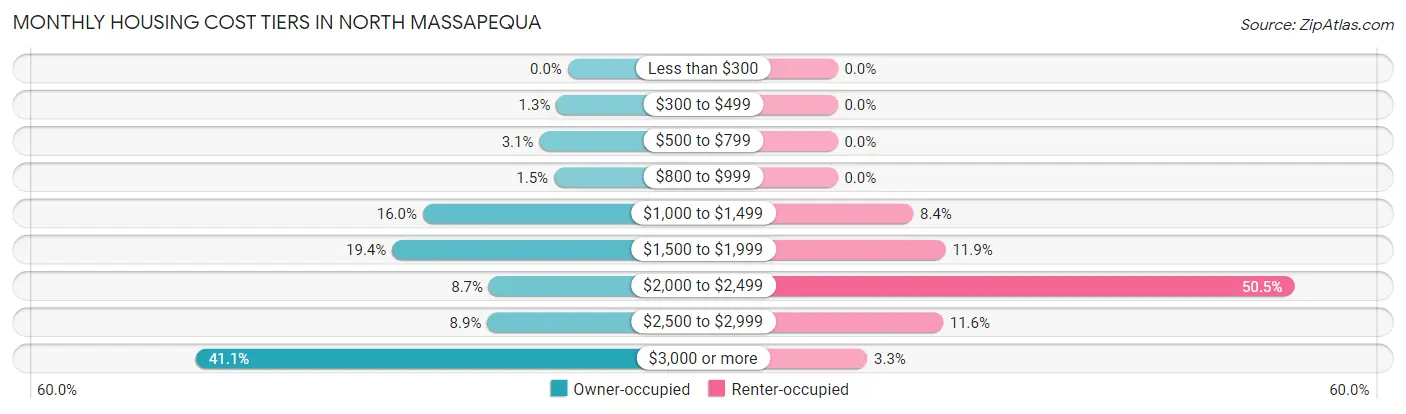
| Monthly Cost | Owner-occupied | Renter-occupied |
| Less than $300 | 0 (0.0%) | 0 (0.0%) |
| $300 to $499 | 76 (1.3%) | 0 (0.0%) |
| $500 to $799 | 188 (3.1%) | 0 (0.0%) |
| $800 to $999 | 91 (1.5%) | 0 (0.0%) |
| $1,000 to $1,499 | 960 (16.0%) | 28 (8.4%) |
| $1,500 to $1,999 | 1,163 (19.4%) | 40 (11.9%) |
| $2,000 to $2,499 | 522 (8.7%) | 169 (50.4%) |
| $2,500 to $2,999 | 533 (8.9%) | 39 (11.6%) |
| $3,000 or more | 2,462 (41.1%) | 11 (3.3%) |
| Total | 5,995 (100.0%) | 335 (100.0%) |
Physical Housing Characteristics in North Massapequa
Housing Structures in North Massapequa
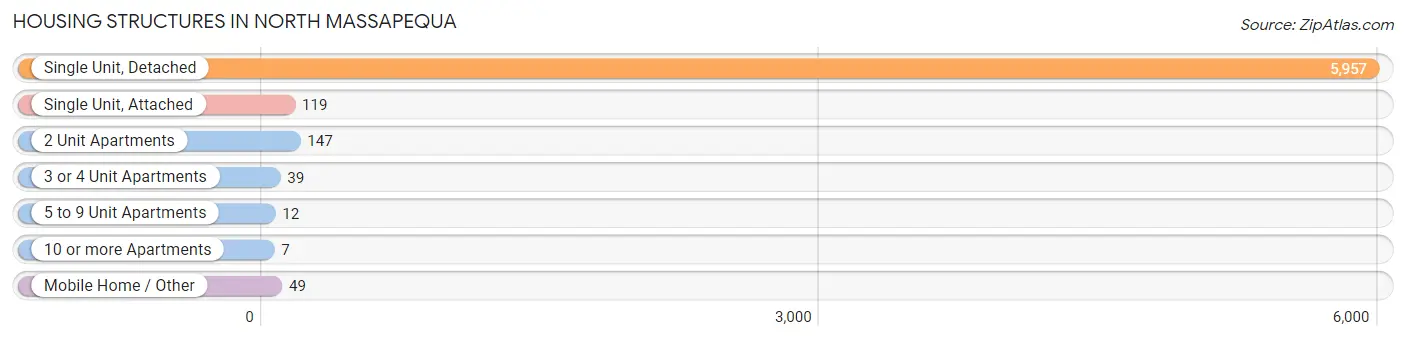
| Structure Type | # Housing Units | % Housing Units |
| Single Unit, Detached | 5,957 | 94.1% |
| Single Unit, Attached | 119 | 1.9% |
| 2 Unit Apartments | 147 | 2.3% |
| 3 or 4 Unit Apartments | 39 | 0.6% |
| 5 to 9 Unit Apartments | 12 | 0.2% |
| 10 or more Apartments | 7 | 0.1% |
| Mobile Home / Other | 49 | 0.8% |
| Total | 6,330 | 100.0% |
Housing Structures by Occupancy in North Massapequa
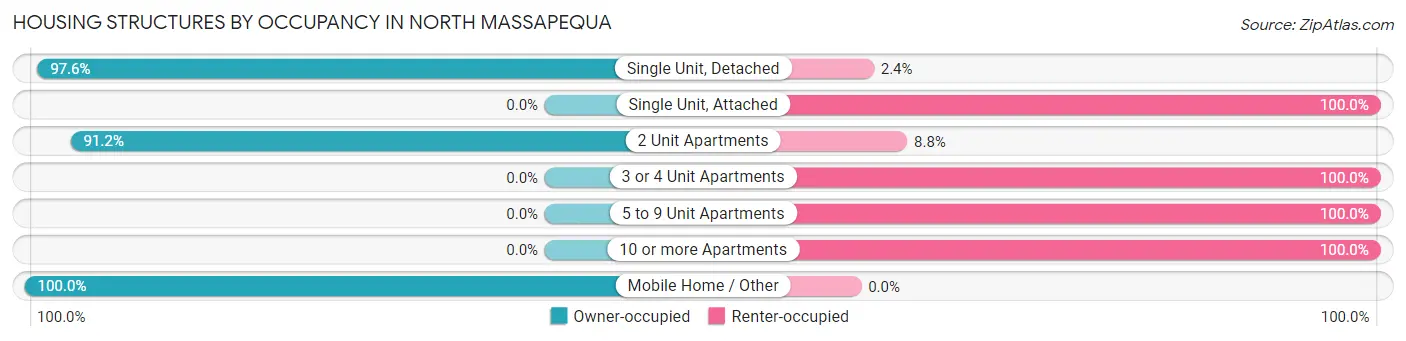
| Structure Type | Owner-occupied | Renter-occupied |
| Single Unit, Detached | 5,812 (97.6%) | 145 (2.4%) |
| Single Unit, Attached | 0 (0.0%) | 119 (100.0%) |
| 2 Unit Apartments | 134 (91.2%) | 13 (8.8%) |
| 3 or 4 Unit Apartments | 0 (0.0%) | 39 (100.0%) |
| 5 to 9 Unit Apartments | 0 (0.0%) | 12 (100.0%) |
| 10 or more Apartments | 0 (0.0%) | 7 (100.0%) |
| Mobile Home / Other | 49 (100.0%) | 0 (0.0%) |
| Total | 5,995 (94.7%) | 335 (5.3%) |
Housing Structures by Number of Rooms in North Massapequa
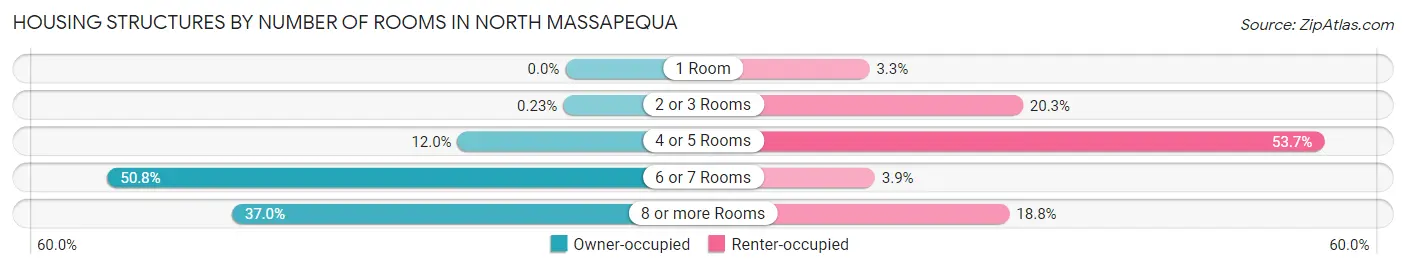
| Number of Rooms | Owner-occupied | Renter-occupied |
| 1 Room | 0 (0.0%) | 11 (3.3%) |
| 2 or 3 Rooms | 14 (0.2%) | 68 (20.3%) |
| 4 or 5 Rooms | 717 (12.0%) | 180 (53.7%) |
| 6 or 7 Rooms | 3,046 (50.8%) | 13 (3.9%) |
| 8 or more Rooms | 2,218 (37.0%) | 63 (18.8%) |
| Total | 5,995 (100.0%) | 335 (100.0%) |
Housing Structure by Heating Type in North Massapequa
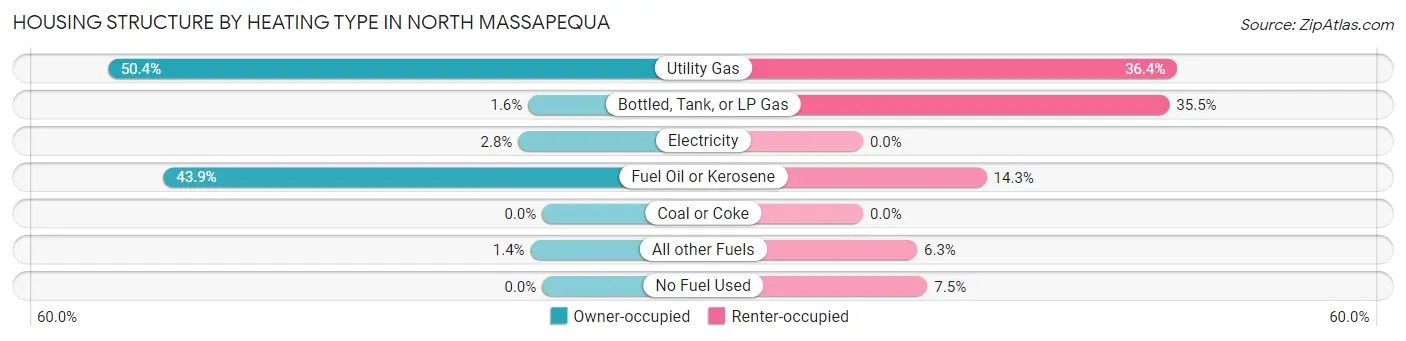
| Heating Type | Owner-occupied | Renter-occupied |
| Utility Gas | 3,019 (50.4%) | 122 (36.4%) |
| Bottled, Tank, or LP Gas | 97 (1.6%) | 119 (35.5%) |
| Electricity | 166 (2.8%) | 0 (0.0%) |
| Fuel Oil or Kerosene | 2,632 (43.9%) | 48 (14.3%) |
| Coal or Coke | 0 (0.0%) | 0 (0.0%) |
| All other Fuels | 81 (1.3%) | 21 (6.3%) |
| No Fuel Used | 0 (0.0%) | 25 (7.5%) |
| Total | 5,995 (100.0%) | 335 (100.0%) |
Household Vehicle Usage in North Massapequa
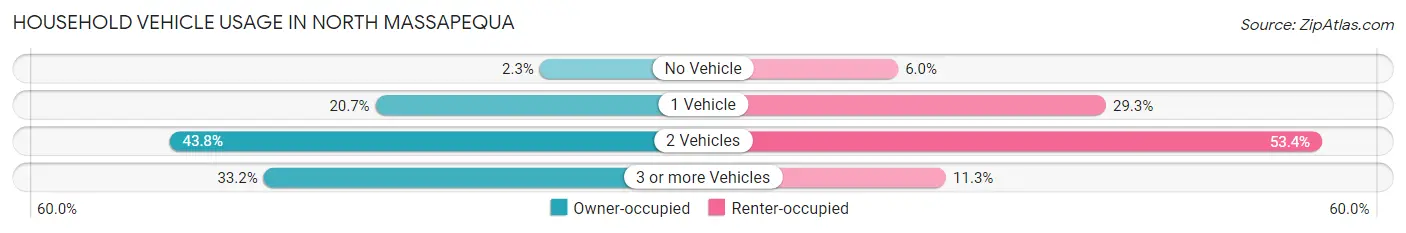
| Vehicles per Household | Owner-occupied | Renter-occupied |
| No Vehicle | 138 (2.3%) | 20 (6.0%) |
| 1 Vehicle | 1,241 (20.7%) | 98 (29.2%) |
| 2 Vehicles | 2,623 (43.8%) | 179 (53.4%) |
| 3 or more Vehicles | 1,993 (33.2%) | 38 (11.3%) |
| Total | 5,995 (100.0%) | 335 (100.0%) |
Real Estate & Mortgages in North Massapequa
Real Estate and Mortgage Overview in North Massapequa
| Characteristic | Without Mortgage | With Mortgage |
| Housing Units | 2,492 | 3,503 |
| Median Property Value | $540,500 | $609,700 |
| Median Household Income | $103,333 | $1,987 |
| Monthly Housing Costs | $1,483 | $2,462 |
| Real Estate Taxes | $10,001 | $40 |
Property Value by Mortgage Status in North Massapequa
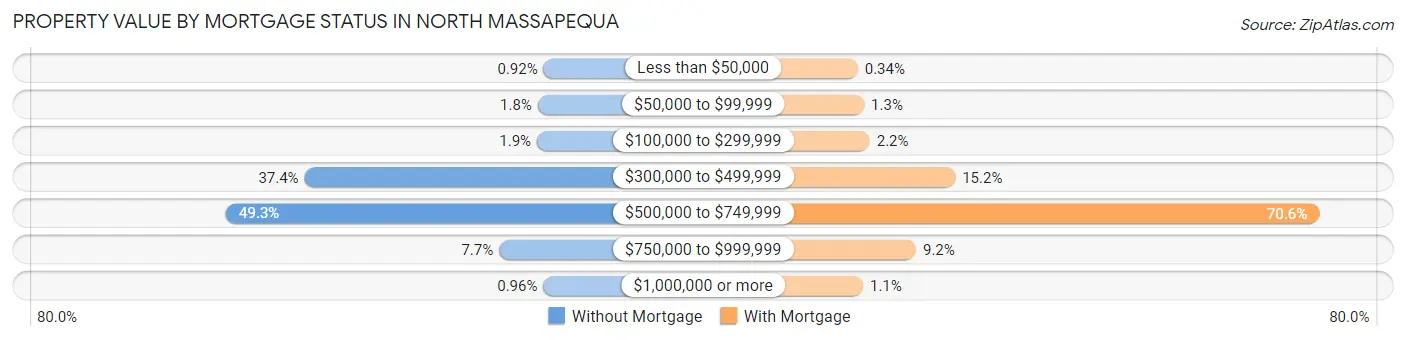
| Property Value | Without Mortgage | With Mortgage |
| Less than $50,000 | 23 (0.9%) | 12 (0.3%) |
| $50,000 to $99,999 | 45 (1.8%) | 46 (1.3%) |
| $100,000 to $299,999 | 48 (1.9%) | 76 (2.2%) |
| $300,000 to $499,999 | 931 (37.4%) | 532 (15.2%) |
| $500,000 to $749,999 | 1,229 (49.3%) | 2,474 (70.6%) |
| $750,000 to $999,999 | 192 (7.7%) | 323 (9.2%) |
| $1,000,000 or more | 24 (1.0%) | 40 (1.1%) |
| Total | 2,492 (100.0%) | 3,503 (100.0%) |
Household Income by Mortgage Status in North Massapequa
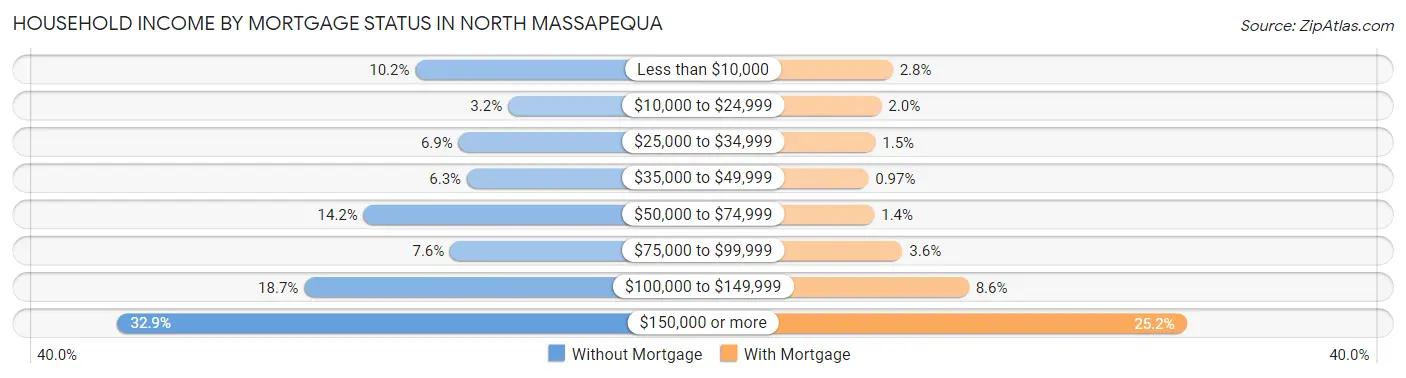
| Household Income | Without Mortgage | With Mortgage |
| Less than $10,000 | 255 (10.2%) | 99 (2.8%) |
| $10,000 to $24,999 | 79 (3.2%) | 69 (2.0%) |
| $25,000 to $34,999 | 173 (6.9%) | 53 (1.5%) |
| $35,000 to $49,999 | 157 (6.3%) | 34 (1.0%) |
| $50,000 to $74,999 | 353 (14.2%) | 50 (1.4%) |
| $75,000 to $99,999 | 189 (7.6%) | 125 (3.6%) |
| $100,000 to $149,999 | 466 (18.7%) | 302 (8.6%) |
| $150,000 or more | 820 (32.9%) | 883 (25.2%) |
| Total | 2,492 (100.0%) | 3,503 (100.0%) |
Property Value to Household Income Ratio in North Massapequa
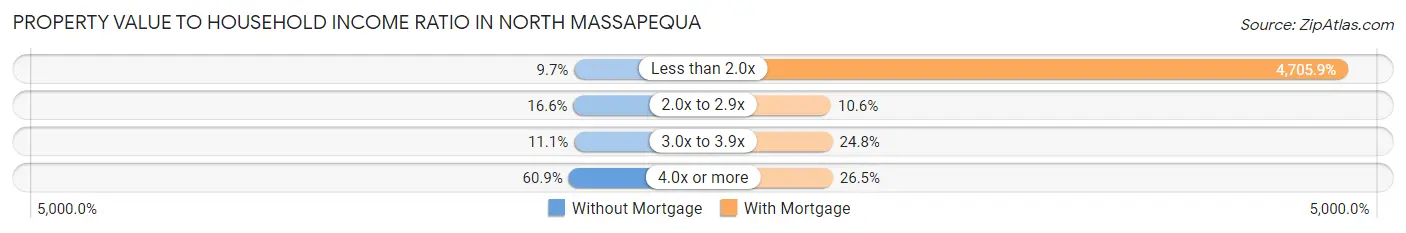
| Value-to-Income Ratio | Without Mortgage | With Mortgage |
| Less than 2.0x | 242 (9.7%) | 164,846 (4,705.9%) |
| 2.0x to 2.9x | 413 (16.6%) | 371 (10.6%) |
| 3.0x to 3.9x | 277 (11.1%) | 870 (24.8%) |
| 4.0x or more | 1,517 (60.9%) | 928 (26.5%) |
| Total | 2,492 (100.0%) | 3,503 (100.0%) |
Real Estate Taxes by Mortgage Status in North Massapequa
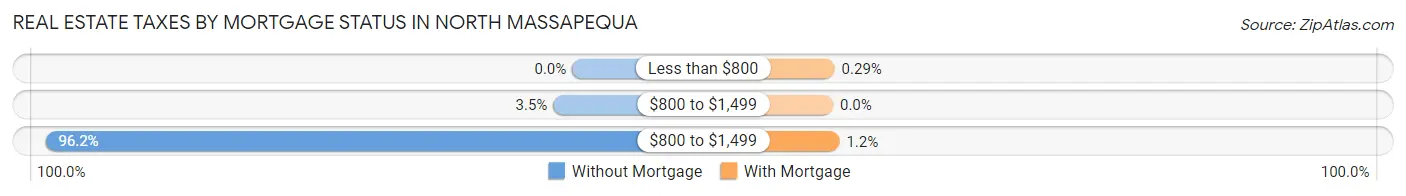
| Property Taxes | Without Mortgage | With Mortgage |
| Less than $800 | 0 (0.0%) | 10 (0.3%) |
| $800 to $1,499 | 86 (3.5%) | 0 (0.0%) |
| $800 to $1,499 | 2,397 (96.2%) | 41 (1.2%) |
| Total | 2,492 (100.0%) | 3,503 (100.0%) |
Health & Disability in North Massapequa
Health Insurance Coverage by Age in North Massapequa
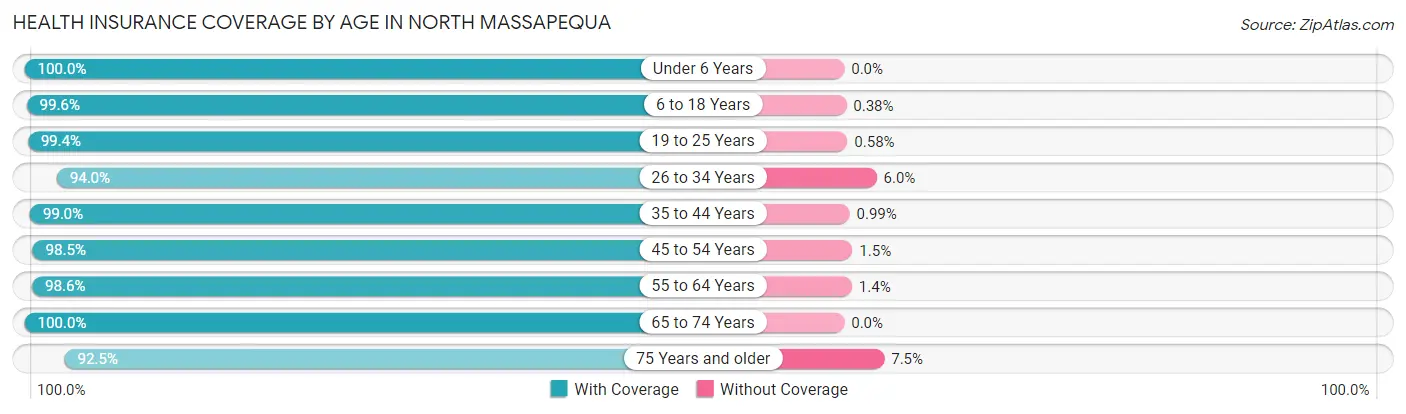
| Age Bracket | With Coverage | Without Coverage |
| Under 6 Years | 1,349 (100.0%) | 0 (0.0%) |
| 6 to 18 Years | 2,106 (99.6%) | 8 (0.4%) |
| 19 to 25 Years | 1,720 (99.4%) | 10 (0.6%) |
| 26 to 34 Years | 2,171 (94.0%) | 139 (6.0%) |
| 35 to 44 Years | 1,803 (99.0%) | 18 (1.0%) |
| 45 to 54 Years | 2,024 (98.5%) | 31 (1.5%) |
| 55 to 64 Years | 3,391 (98.6%) | 49 (1.4%) |
| 65 to 74 Years | 1,771 (100.0%) | 0 (0.0%) |
| 75 Years and older | 1,488 (92.5%) | 120 (7.5%) |
| Total | 17,823 (97.9%) | 375 (2.1%) |
Health Insurance Coverage by Citizenship Status in North Massapequa
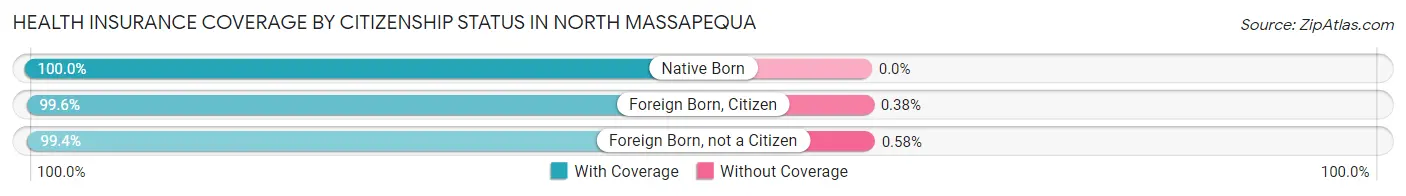
| Citizenship Status | With Coverage | Without Coverage |
| Native Born | 1,349 (100.0%) | 0 (0.0%) |
| Foreign Born, Citizen | 2,106 (99.6%) | 8 (0.4%) |
| Foreign Born, not a Citizen | 1,720 (99.4%) | 10 (0.6%) |
Health Insurance Coverage by Household Income in North Massapequa
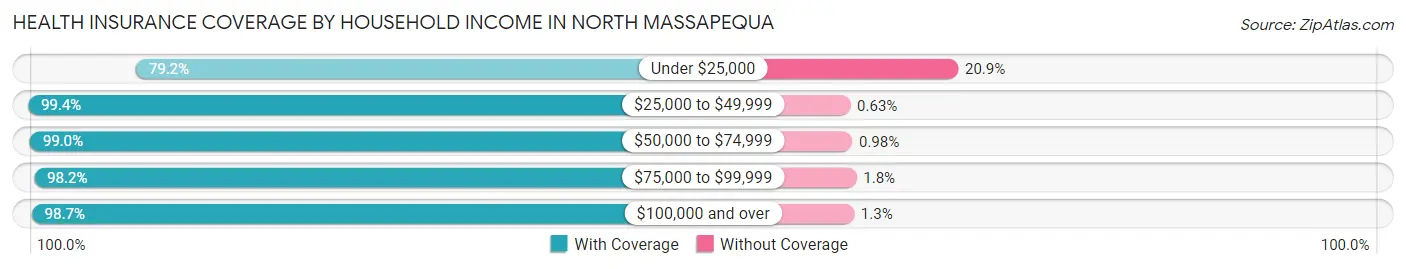
| Household Income | With Coverage | Without Coverage |
| Under $25,000 | 558 (79.1%) | 147 (20.8%) |
| $25,000 to $49,999 | 794 (99.4%) | 5 (0.6%) |
| $50,000 to $74,999 | 1,108 (99.0%) | 11 (1.0%) |
| $75,000 to $99,999 | 1,208 (98.2%) | 22 (1.8%) |
| $100,000 and over | 14,126 (98.7%) | 190 (1.3%) |
Public vs Private Health Insurance Coverage by Age in North Massapequa
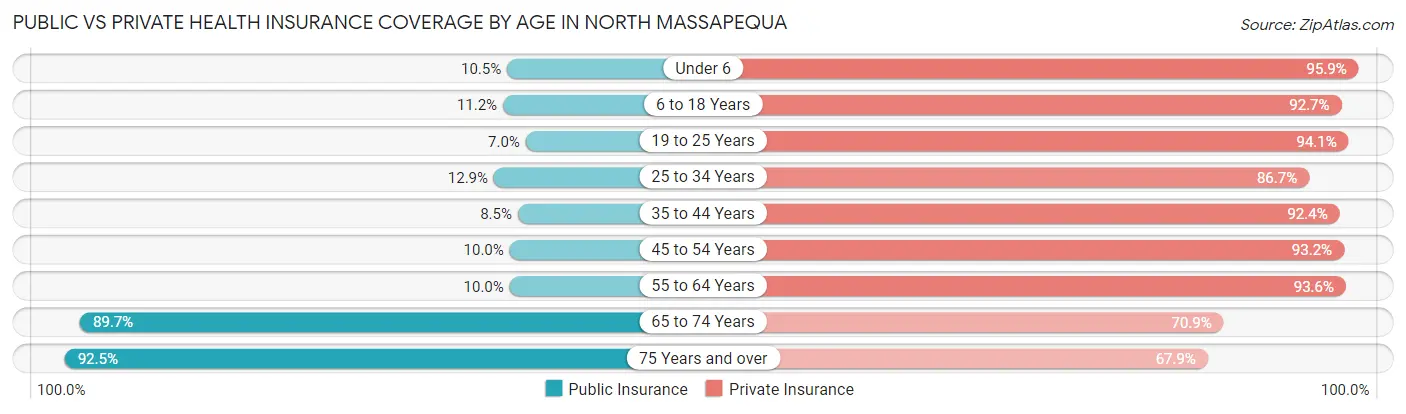
| Age Bracket | Public Insurance | Private Insurance |
| Under 6 | 141 (10.4%) | 1,294 (95.9%) |
| 6 to 18 Years | 237 (11.2%) | 1,960 (92.7%) |
| 19 to 25 Years | 121 (7.0%) | 1,627 (94.1%) |
| 25 to 34 Years | 298 (12.9%) | 2,003 (86.7%) |
| 35 to 44 Years | 154 (8.5%) | 1,682 (92.4%) |
| 45 to 54 Years | 205 (10.0%) | 1,915 (93.2%) |
| 55 to 64 Years | 343 (10.0%) | 3,218 (93.5%) |
| 65 to 74 Years | 1,589 (89.7%) | 1,255 (70.9%) |
| 75 Years and over | 1,488 (92.5%) | 1,092 (67.9%) |
| Total | 4,576 (25.2%) | 16,046 (88.2%) |
Disability Status by Sex by Age in North Massapequa
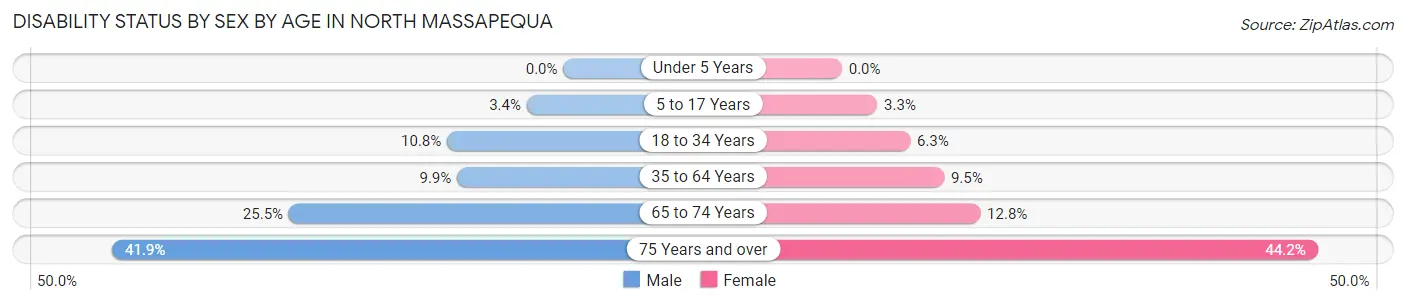
| Age Bracket | Male | Female |
| Under 5 Years | 0 (0.0%) | 0 (0.0%) |
| 5 to 17 Years | 33 (3.4%) | 39 (3.3%) |
| 18 to 34 Years | 229 (10.8%) | 132 (6.3%) |
| 35 to 64 Years | 349 (9.9%) | 358 (9.5%) |
| 65 to 74 Years | 219 (25.5%) | 117 (12.8%) |
| 75 Years and over | 276 (41.9%) | 419 (44.2%) |
Disability Class by Sex by Age in North Massapequa
Disability Class: Hearing Difficulty
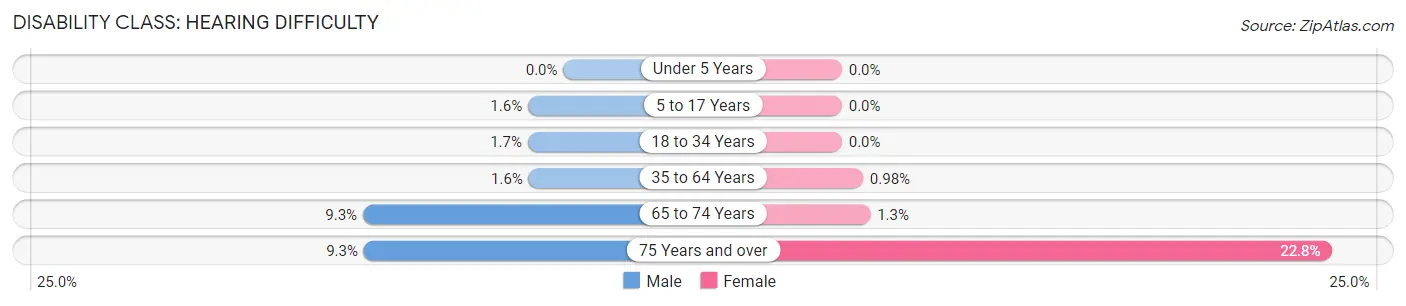
| Age Bracket | Male | Female |
| Under 5 Years | 0 (0.0%) | 0 (0.0%) |
| 5 to 17 Years | 16 (1.6%) | 0 (0.0%) |
| 18 to 34 Years | 35 (1.7%) | 0 (0.0%) |
| 35 to 64 Years | 57 (1.6%) | 37 (1.0%) |
| 65 to 74 Years | 80 (9.3%) | 12 (1.3%) |
| 75 Years and over | 61 (9.3%) | 216 (22.8%) |
Disability Class: Vision Difficulty
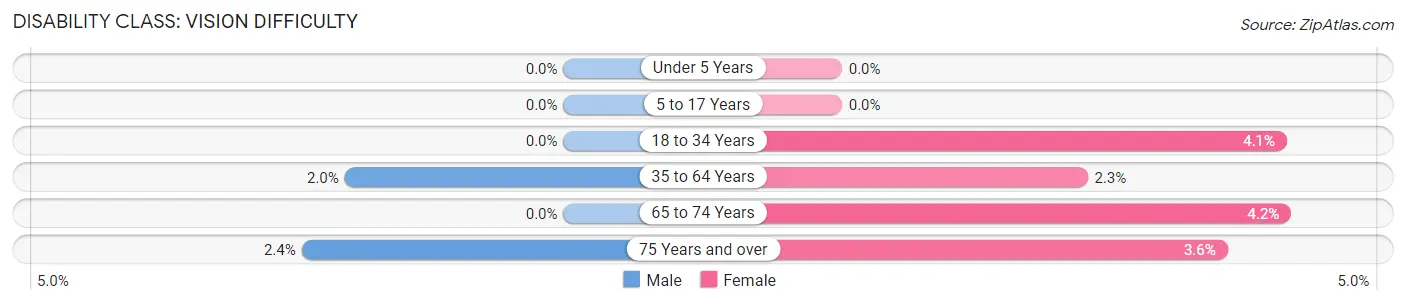
| Age Bracket | Male | Female |
| Under 5 Years | 0 (0.0%) | 0 (0.0%) |
| 5 to 17 Years | 0 (0.0%) | 0 (0.0%) |
| 18 to 34 Years | 0 (0.0%) | 86 (4.1%) |
| 35 to 64 Years | 72 (2.0%) | 86 (2.3%) |
| 65 to 74 Years | 0 (0.0%) | 38 (4.2%) |
| 75 Years and over | 16 (2.4%) | 34 (3.6%) |
Disability Class: Cognitive Difficulty
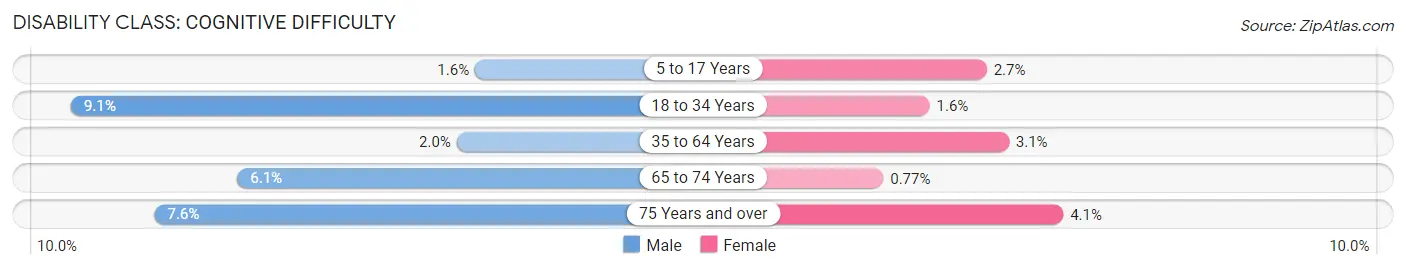
| Age Bracket | Male | Female |
| 5 to 17 Years | 16 (1.6%) | 32 (2.7%) |
| 18 to 34 Years | 194 (9.1%) | 34 (1.6%) |
| 35 to 64 Years | 70 (2.0%) | 117 (3.1%) |
| 65 to 74 Years | 52 (6.0%) | 7 (0.8%) |
| 75 Years and over | 50 (7.6%) | 39 (4.1%) |
Disability Class: Ambulatory Difficulty
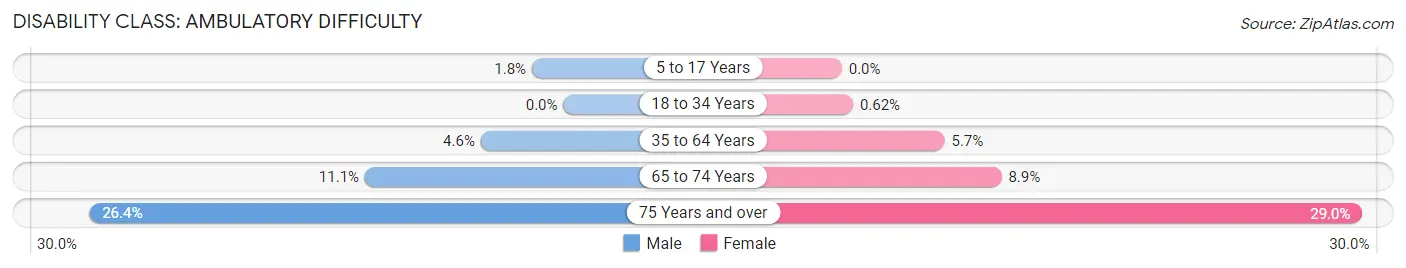
| Age Bracket | Male | Female |
| 5 to 17 Years | 17 (1.8%) | 0 (0.0%) |
| 18 to 34 Years | 0 (0.0%) | 13 (0.6%) |
| 35 to 64 Years | 163 (4.6%) | 216 (5.7%) |
| 65 to 74 Years | 95 (11.1%) | 81 (8.9%) |
| 75 Years and over | 174 (26.4%) | 275 (29.0%) |
Disability Class: Self-Care Difficulty
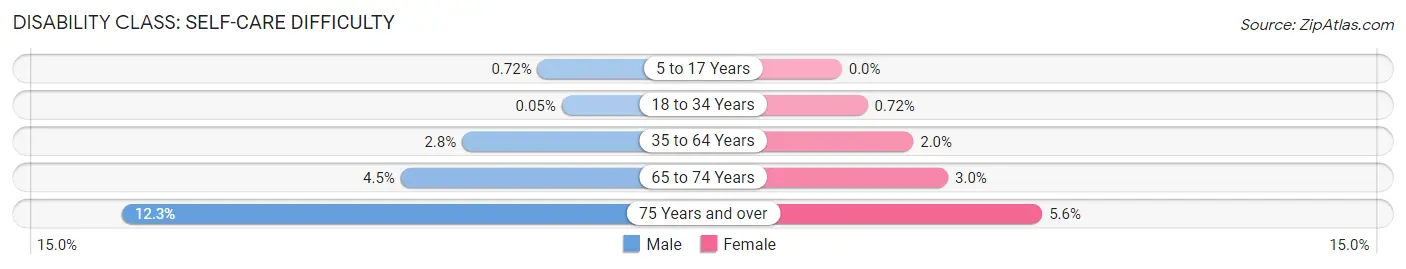
| Age Bracket | Male | Female |
| 5 to 17 Years | 7 (0.7%) | 0 (0.0%) |
| 18 to 34 Years | 1 (0.1%) | 15 (0.7%) |
| 35 to 64 Years | 100 (2.8%) | 75 (2.0%) |
| 65 to 74 Years | 39 (4.5%) | 27 (3.0%) |
| 75 Years and over | 81 (12.3%) | 53 (5.6%) |
Technology Access in North Massapequa
Computing Device Access in North Massapequa
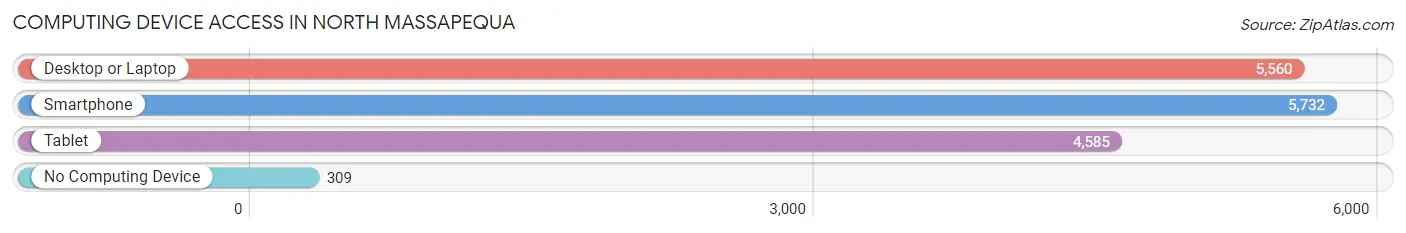
| Device Type | # Households | % Households |
| Desktop or Laptop | 5,560 | 87.8% |
| Smartphone | 5,732 | 90.5% |
| Tablet | 4,585 | 72.4% |
| No Computing Device | 309 | 4.9% |
| Total | 6,330 | 100.0% |
Internet Access in North Massapequa
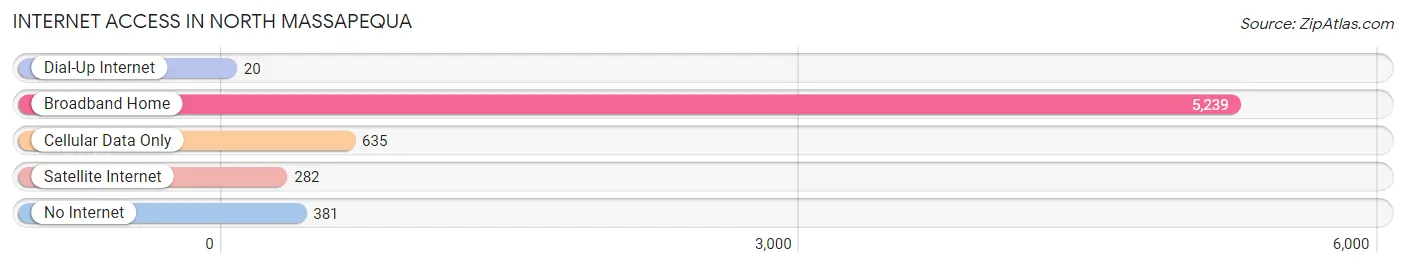
| Internet Type | # Households | % Households |
| Dial-Up Internet | 20 | 0.3% |
| Broadband Home | 5,239 | 82.8% |
| Cellular Data Only | 635 | 10.0% |
| Satellite Internet | 282 | 4.4% |
| No Internet | 381 | 6.0% |
| Total | 6,330 | 100.0% |
North Massapequa Summary
Massapequa is a hamlet and census-designated place (CDP) located in Nassau County, New York, United States. It is located within the Town of Oyster Bay. As of the 2010 census, the CDP had a population of 21,685.
History
The area now known as Massapequa was originally inhabited by the Massapequa Indians, a branch of the Meroke tribe. The name Massapequa is derived from the Native American word for “great water.” The area was first settled by Europeans in the mid-17th century. The first settlers were Dutch, who established farms in the area.
In the late 19th century, the area was developed as a summer resort for wealthy New Yorkers. The area was known as “Massapequa Park” and was home to several grand hotels. The area was also home to a number of amusement parks, including the famous “Massapequa Park” which opened in 1891.
In the early 20th century, the area began to be developed as a residential community. The area was incorporated as the Village of Massapequa in 1928. The village was annexed by the Town of Oyster Bay in 1929.
Geography
Massapequa is located at 40°39′N 73°27′W (40.65, -73.45). According to the United States Census Bureau, the CDP has a total area of 5.2 square miles (13.4 km2), of which 5.1 square miles (13.2 km2) is land and 0.1 square miles (0.2 km2) (1.90%) is water.
The hamlet is bordered by the hamlets of Amityville to the west, North Amityville to the northwest, North Massapequa to the north, Plainedge to the east, and Seaford to the south.
Economy
Massapequa is a primarily residential community, with a few small businesses located in the area. The largest employer in the area is the Massapequa School District, which employs over 1,000 people. Other major employers include the Northwell Health System, the Nassau County Police Department, and the Town of Oyster Bay.
Demographics
As of the 2010 census, there were 21,685 people, 7,845 households, and 5,845 families residing in the CDP. The population density was 4,241.3 people per square mile (1,633.2/km2). There were 8,093 housing units at an average density of 1,590.3 per square mile (614.2/km2). The racial makeup of the CDP was 87.2% White, 4.2% African American, 0.2% Native American, 4.3% Asian, 0.1% Pacific Islander, 1.7% from other races, and 2.3% from two or more races. Hispanic or Latino of any race were 7.3% of the population.
There were 7,845 households, out of which 33.2% had children under the age of 18 living with them, 57.2% were married couples living together, 11.2% had a female householder with no husband present, and 27.2% were non-families. 22.2% of all households were made up of individuals, and 11.2% had someone living alone who was 65 years of age or older. The average household size was 2.75 and the average family size was 3.25.
In the CDP, the population was spread out, with 24.2% under the age of 18, 6.7% from 18 to 24, 28.2% from 25 to 44, 24.2% from 45 to 64, and 16.7% who were 65 years of age or older. The median age was 39 years. For every 100 females, there were 93.2 males. For every 100 females age 18 and over, there were 90.2 males.
The median income for a household in the CDP was $76,845, and the median income for a family was $86,945. Males had a median income of $60,938 versus $41,919 for females. The per capita income for the CDP was $31,945. About 2.7% of families and 3.7% of the population were below the poverty line, including 4.2% of those under age 18 and 4.2% of those age 65 or over.
Common Questions
What is Per Capita Income in North Massapequa?
Per Capita income in North Massapequa is $55,586.
What is the Median Family Income in North Massapequa?
Median Family Income in North Massapequa is $157,514.
What is the Median Household income in North Massapequa?
Median Household Income in North Massapequa is $134,666.
What is Income or Wage Gap in North Massapequa?
Income or Wage Gap in North Massapequa is 44.8%.
Women in North Massapequa earn 55.2 cents for every dollar earned by a man.
What is Inequality or Gini Index in North Massapequa?
Inequality or Gini Index in North Massapequa is 0.38.
What is the Total Population of North Massapequa?
Total Population of North Massapequa is 18,198.
What is the Total Male Population of North Massapequa?
Total Male Population of North Massapequa is 8,760.
What is the Total Female Population of North Massapequa?
Total Female Population of North Massapequa is 9,438.
What is the Ratio of Males per 100 Females in North Massapequa?
There are 92.82 Males per 100 Females in North Massapequa.
What is the Ratio of Females per 100 Males in North Massapequa?
There are 107.74 Females per 100 Males in North Massapequa.
What is the Median Population Age in North Massapequa?
Median Population Age in North Massapequa is 44.1 Years.
What is the Average Family Size in North Massapequa
Average Family Size in North Massapequa is 3.3 People.
What is the Average Household Size in North Massapequa
Average Household Size in North Massapequa is 2.9 People.
How Large is the Labor Force in North Massapequa?
There are 10,452 People in the Labor Forcein in North Massapequa.
What is the Percentage of People in the Labor Force in North Massapequa?
68.1% of People are in the Labor Force in North Massapequa.
What is the Unemployment Rate in North Massapequa?
Unemployment Rate in North Massapequa is 2.9%.