Mount Sinai, NY Map & Demographics
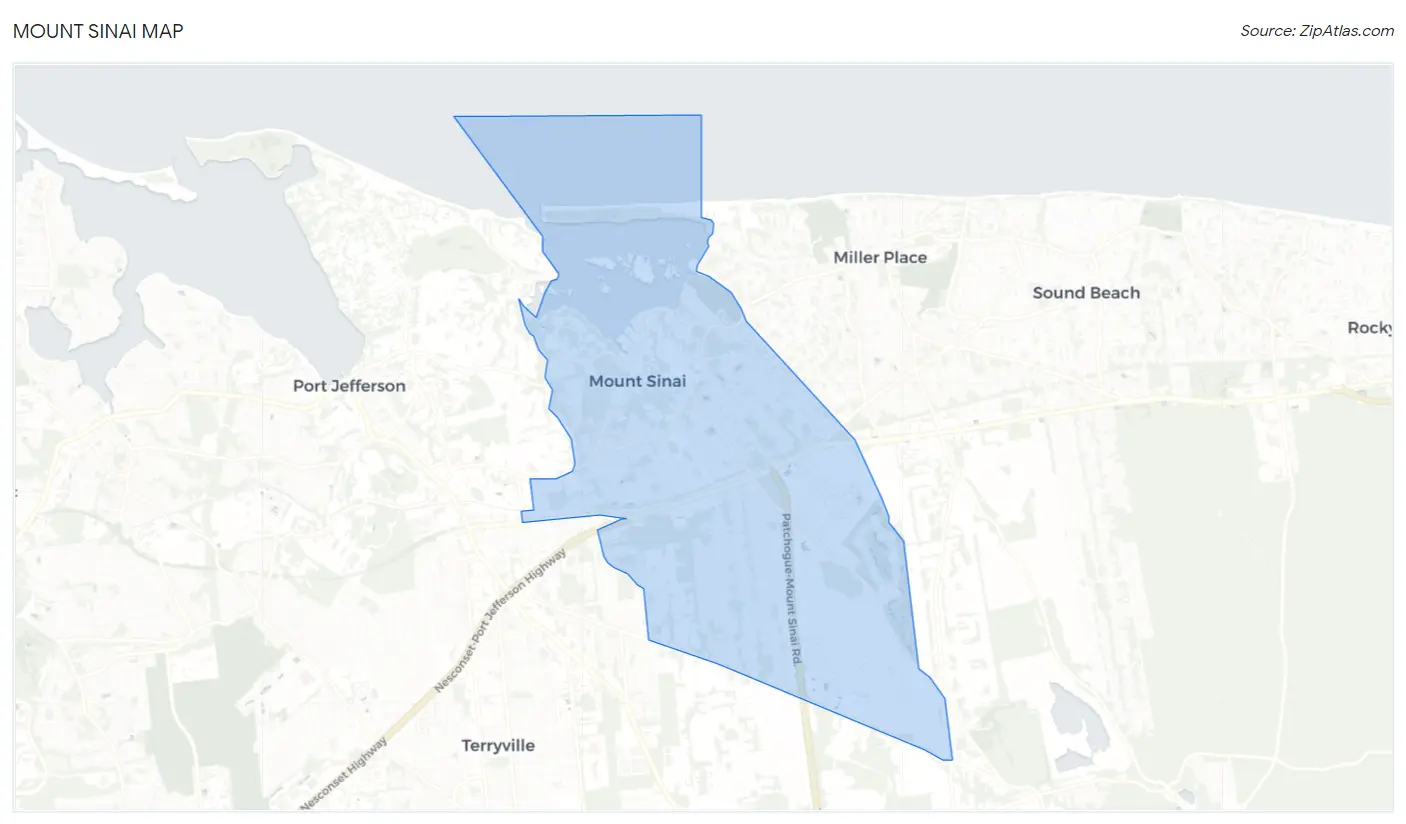
Mount Sinai Map
Mount Sinai Overview
$59,994
PER CAPITA INCOME
$170,030
AVG FAMILY INCOME
$152,586
AVG HOUSEHOLD INCOME
34.9%
WAGE / INCOME GAP [ % ]
65.1¢/ $1
WAGE / INCOME GAP [ $ ]
$7,127
FAMILY INCOME DEFICIT
0.38
INEQUALITY / GINI INDEX
11,641
TOTAL POPULATION
6,082
MALE POPULATION
5,559
FEMALE POPULATION
109.41
MALES / 100 FEMALES
91.40
FEMALES / 100 MALES
45.3
MEDIAN AGE
3.4
AVG FAMILY SIZE
3.0
AVG HOUSEHOLD SIZE
5,625
LABOR FORCE [ PEOPLE ]
60.1%
PERCENT IN LABOR FORCE
6.1%
UNEMPLOYMENT RATE
Mount Sinai Zip Codes
Income in Mount Sinai
Income Overview in Mount Sinai
Per Capita Income in Mount Sinai is $59,994, while median incomes of families and households are $170,030 and $152,586 respectively.
| Characteristic | Number | Measure |
| Per Capita Income | 11,641 | $59,994 |
| Median Family Income | 3,238 | $170,030 |
| Mean Family Income | 3,238 | $194,224 |
| Median Household Income | 3,860 | $152,586 |
| Mean Household Income | 3,860 | $176,164 |
| Income Deficit | 3,238 | $7,127 |
| Wage / Income Gap (%) | 11,641 | 34.88% |
| Wage / Income Gap ($) | 11,641 | 65.12¢ per $1 |
| Gini / Inequality Index | 11,641 | 0.38 |
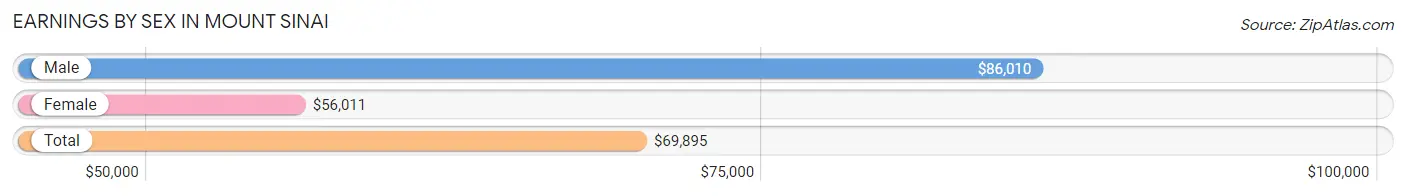
Earnings by Sex in Mount Sinai
Average Earnings in Mount Sinai are $69,895, $86,010 for men and $56,011 for women, a difference of 34.9%.
| Sex | Number | Average Earnings |
| Male | 2,917 (50.8%) | $86,010 |
| Female | 2,820 (49.1%) | $56,011 |
| Total | 5,737 (100.0%) | $69,895 |
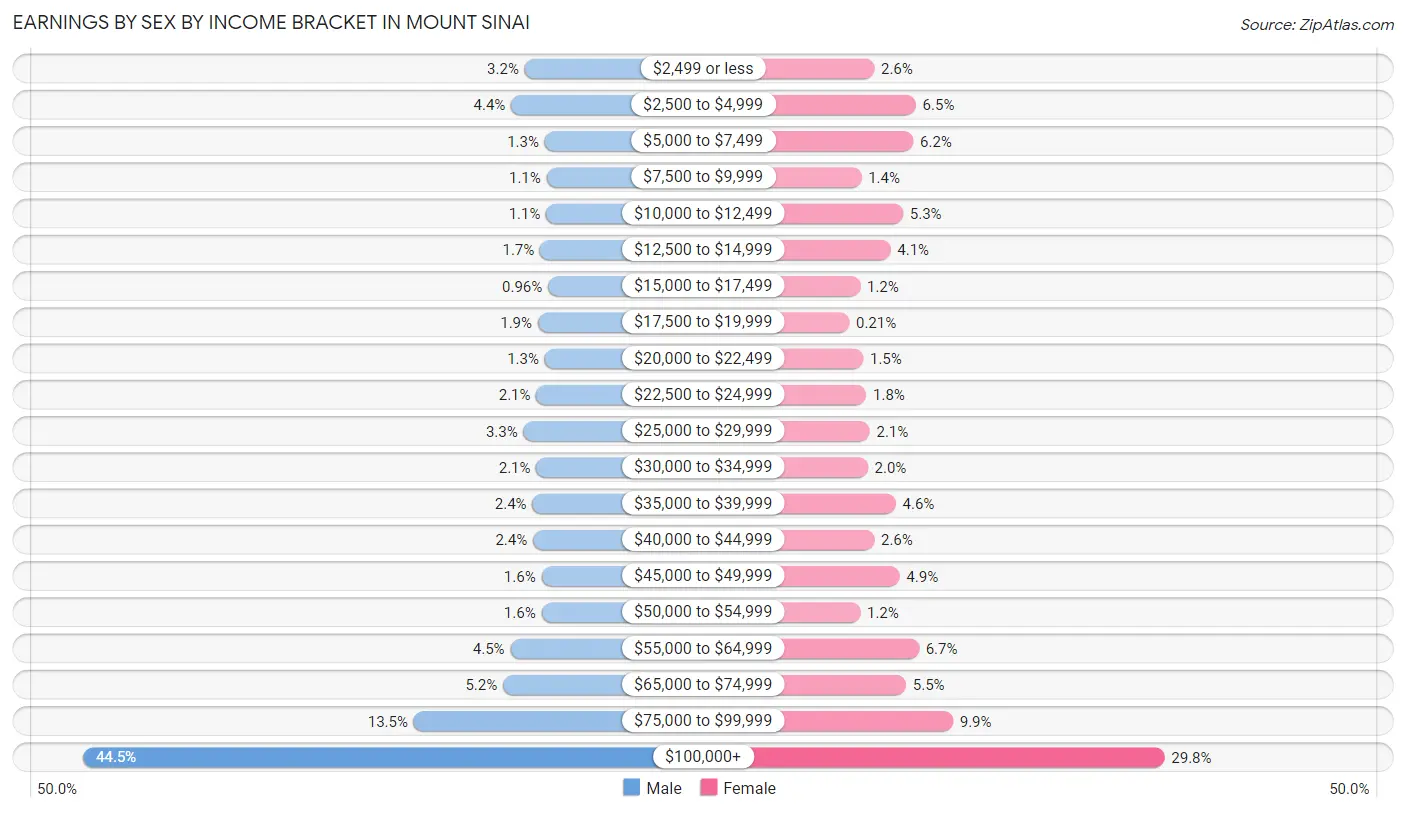
Earnings by Sex by Income Bracket in Mount Sinai
The most common earnings brackets in Mount Sinai are $100,000+ for men (1,299 | 44.5%) and $100,000+ for women (839 | 29.7%).
| Income | Male | Female |
| $2,499 or less | 92 (3.2%) | 72 (2.5%) |
| $2,500 to $4,999 | 129 (4.4%) | 182 (6.5%) |
| $5,000 to $7,499 | 37 (1.3%) | 175 (6.2%) |
| $7,500 to $9,999 | 32 (1.1%) | 38 (1.3%) |
| $10,000 to $12,499 | 33 (1.1%) | 148 (5.2%) |
| $12,500 to $14,999 | 50 (1.7%) | 115 (4.1%) |
| $15,000 to $17,499 | 28 (1.0%) | 35 (1.2%) |
| $17,500 to $19,999 | 56 (1.9%) | 6 (0.2%) |
| $20,000 to $22,499 | 37 (1.3%) | 43 (1.5%) |
| $22,500 to $24,999 | 60 (2.1%) | 51 (1.8%) |
| $25,000 to $29,999 | 95 (3.3%) | 60 (2.1%) |
| $30,000 to $34,999 | 60 (2.1%) | 55 (1.9%) |
| $35,000 to $39,999 | 71 (2.4%) | 129 (4.6%) |
| $40,000 to $44,999 | 69 (2.4%) | 72 (2.5%) |
| $45,000 to $49,999 | 46 (1.6%) | 139 (4.9%) |
| $50,000 to $54,999 | 46 (1.6%) | 35 (1.2%) |
| $55,000 to $64,999 | 131 (4.5%) | 190 (6.7%) |
| $65,000 to $74,999 | 151 (5.2%) | 156 (5.5%) |
| $75,000 to $99,999 | 395 (13.5%) | 280 (9.9%) |
| $100,000+ | 1,299 (44.5%) | 839 (29.7%) |
| Total | 2,917 (100.0%) | 2,820 (100.0%) |
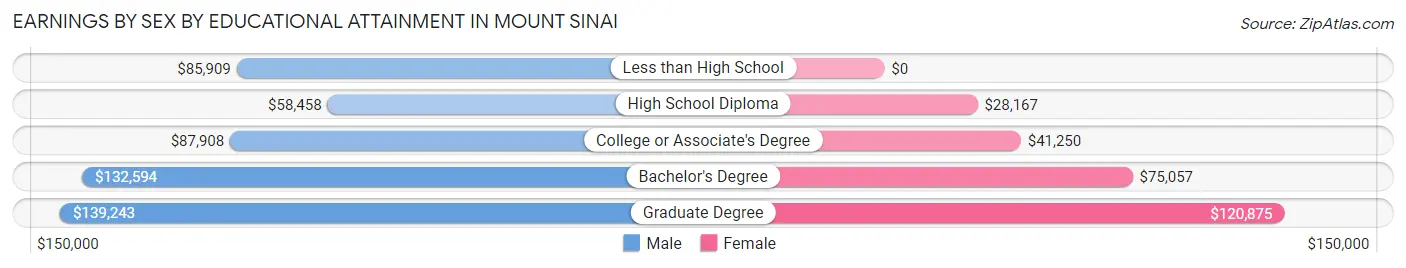
Earnings by Sex by Educational Attainment in Mount Sinai
Average earnings in Mount Sinai are $94,467 for men and $69,281 for women, a difference of 26.7%. Men with an educational attainment of graduate degree enjoy the highest average annual earnings of $139,243, while those with high school diploma education earn the least with $58,458. Women with an educational attainment of graduate degree earn the most with the average annual earnings of $120,875, while those with high school diploma education have the smallest earnings of $28,167.
| Educational Attainment | Male Income | Female Income |
| Less than High School | $85,909 | $0 |
| High School Diploma | $58,458 | $28,167 |
| College or Associate's Degree | $87,908 | $41,250 |
| Bachelor's Degree | $132,594 | $75,057 |
| Graduate Degree | $139,243 | $120,875 |
| Total | $94,467 | $69,281 |
Family Income in Mount Sinai
Family Income Brackets in Mount Sinai
According to the Mount Sinai family income data, there are 1,279 families falling into the $200,000+ income range, which is the most common income bracket and makes up 39.5% of all families. Conversely, the less than $10,000 income bracket is the least frequent group with only 6 families (0.2%) belonging to this category.
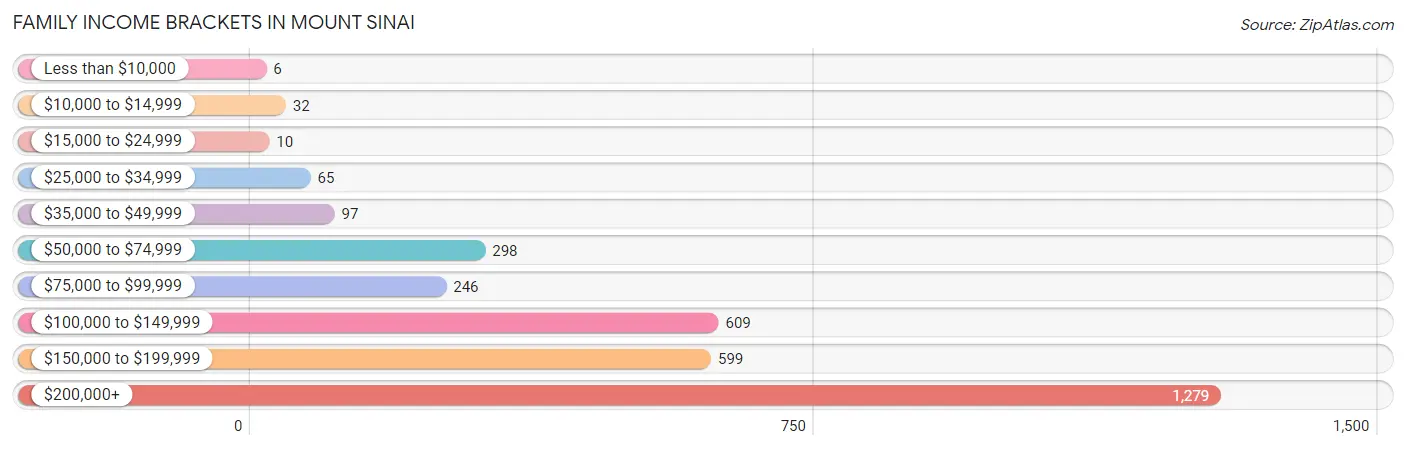
| Income Bracket | # Families | % Families |
| Less than $10,000 | 6 | 0.2% |
| $10,000 to $14,999 | 32 | 1.0% |
| $15,000 to $24,999 | 10 | 0.3% |
| $25,000 to $34,999 | 65 | 2.0% |
| $35,000 to $49,999 | 97 | 3.0% |
| $50,000 to $74,999 | 298 | 9.2% |
| $75,000 to $99,999 | 246 | 7.6% |
| $100,000 to $149,999 | 609 | 18.8% |
| $150,000 to $199,999 | 599 | 18.5% |
| $200,000+ | 1,279 | 39.5% |
Family Income by Famaliy Size in Mount Sinai
5-person families (212 | 6.6%) account for the highest median family income in Mount Sinai with $250,001 per family, while 2-person families (1,473 | 45.5%) have the highest median income of $65,586 per family member.
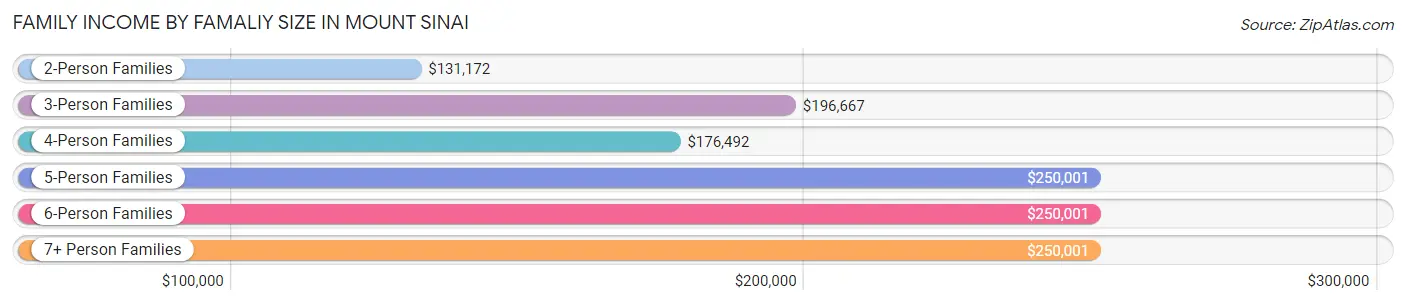
| Income Bracket | # Families | Median Income |
| 2-Person Families | 1,473 (45.5%) | $131,172 |
| 3-Person Families | 516 (15.9%) | $196,667 |
| 4-Person Families | 799 (24.7%) | $176,492 |
| 5-Person Families | 212 (6.6%) | $250,001 |
| 6-Person Families | 181 (5.6%) | $250,001 |
| 7+ Person Families | 57 (1.8%) | $250,001 |
| Total | 3,238 (100.0%) | $170,030 |
Family Income by Number of Earners in Mount Sinai
The median family income in Mount Sinai is $170,030, with families comprising 2 earners (1,327) having the highest median family income of $230,494, while families with no earners (766) have the lowest median family income of $92,000, accounting for 41.0% and 23.7% of families, respectively.
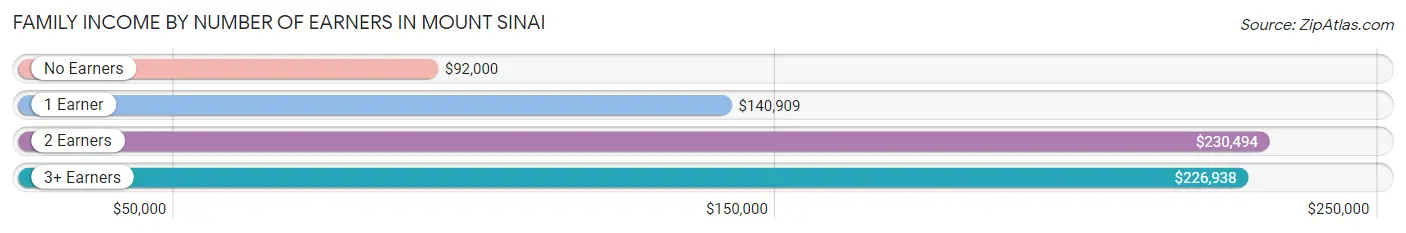
| Number of Earners | # Families | Median Income |
| No Earners | 766 (23.7%) | $92,000 |
| 1 Earner | 642 (19.8%) | $140,909 |
| 2 Earners | 1,327 (41.0%) | $230,494 |
| 3+ Earners | 503 (15.5%) | $226,938 |
| Total | 3,238 (100.0%) | $170,030 |
Household Income in Mount Sinai
Household Income Brackets in Mount Sinai
With 1,339 households falling in the category, the $200,000+ income range is the most frequent in Mount Sinai, accounting for 34.7% of all households. In contrast, only 35 households (0.9%) fall into the less than $10,000 income bracket, making it the least populous group.
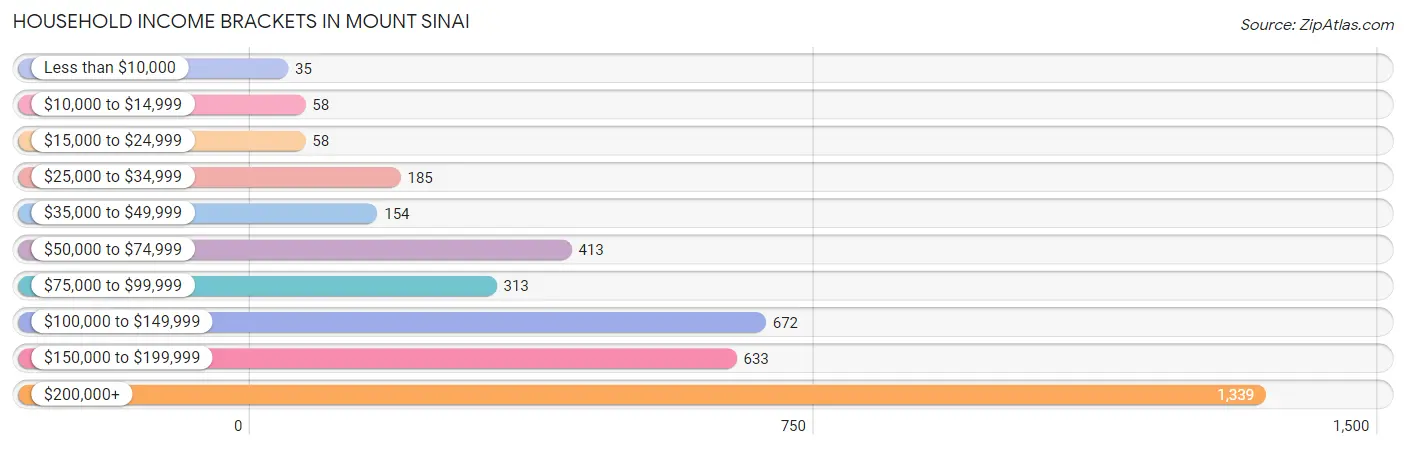
| Income Bracket | # Households | % Households |
| Less than $10,000 | 35 | 0.9% |
| $10,000 to $14,999 | 58 | 1.5% |
| $15,000 to $24,999 | 58 | 1.5% |
| $25,000 to $34,999 | 185 | 4.8% |
| $35,000 to $49,999 | 154 | 4.0% |
| $50,000 to $74,999 | 413 | 10.7% |
| $75,000 to $99,999 | 313 | 8.1% |
| $100,000 to $149,999 | 672 | 17.4% |
| $150,000 to $199,999 | 633 | 16.4% |
| $200,000+ | 1,339 | 34.7% |
Household Income by Householder Age in Mount Sinai
The median household income in Mount Sinai is $152,586, with the highest median household income of $227,976 found in the 25 to 44 years age bracket for the primary householder. A total of 758 households (19.6%) fall into this category. Meanwhile, the 15 to 24 years age bracket for the primary householder has the lowest median household income of $0, with 32 households (0.8%) in this group.
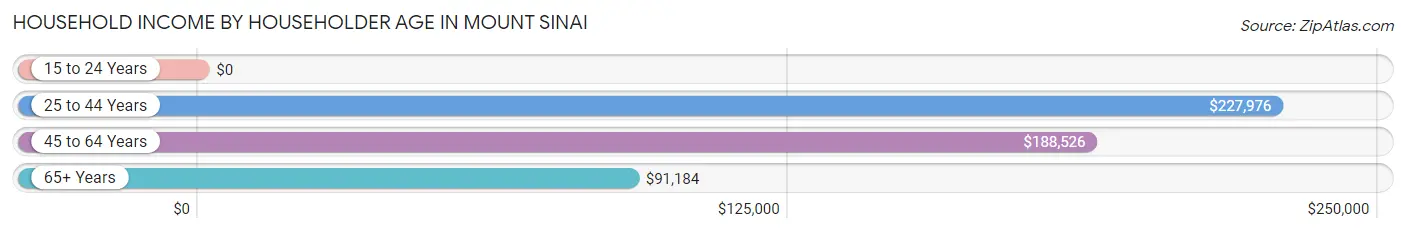
| Income Bracket | # Households | Median Income |
| 15 to 24 Years | 32 (0.8%) | $0 |
| 25 to 44 Years | 758 (19.6%) | $227,976 |
| 45 to 64 Years | 1,520 (39.4%) | $188,526 |
| 65+ Years | 1,550 (40.2%) | $91,184 |
| Total | 3,860 (100.0%) | $152,586 |
Poverty in Mount Sinai
Income Below Poverty by Sex and Age in Mount Sinai
With 1.1% poverty level for males and 2.1% for females among the residents of Mount Sinai, 55 to 64 year old males and 75 year old and over females are the most vulnerable to poverty, with 24 males (3.8%) and 28 females (4.4%) in their respective age groups living below the poverty level.
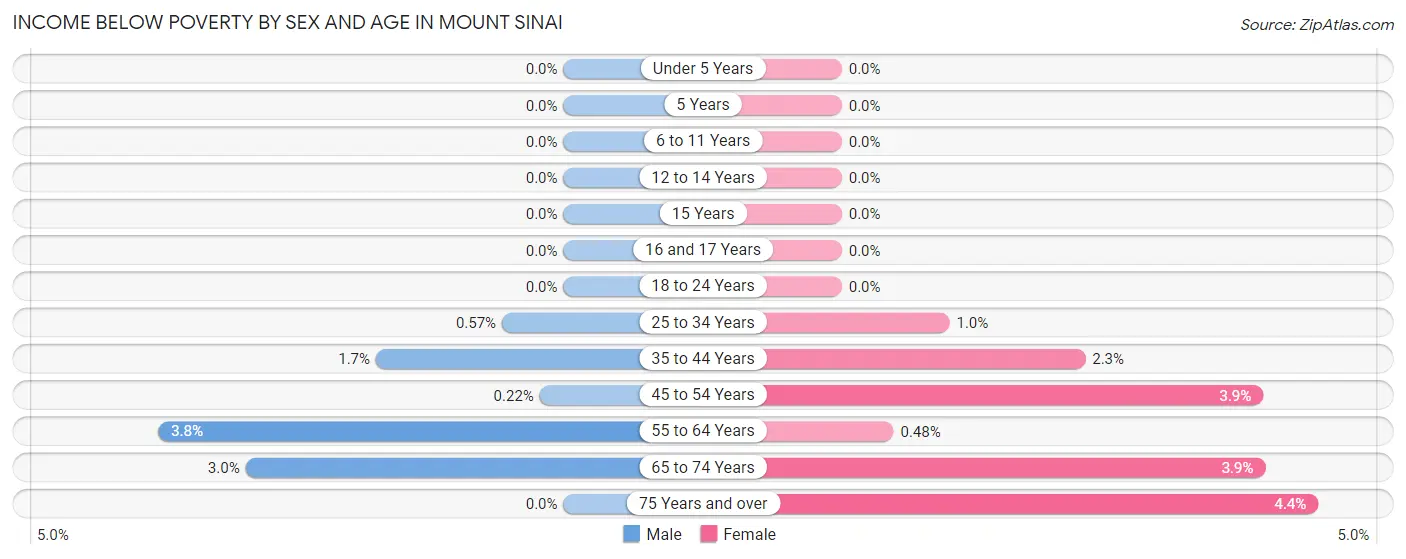
| Age Bracket | Male | Female |
| Under 5 Years | 0 (0.0%) | 0 (0.0%) |
| 5 Years | 0 (0.0%) | 0 (0.0%) |
| 6 to 11 Years | 0 (0.0%) | 0 (0.0%) |
| 12 to 14 Years | 0 (0.0%) | 0 (0.0%) |
| 15 Years | 0 (0.0%) | 0 (0.0%) |
| 16 and 17 Years | 0 (0.0%) | 0 (0.0%) |
| 18 to 24 Years | 0 (0.0%) | 0 (0.0%) |
| 25 to 34 Years | 2 (0.6%) | 4 (1.0%) |
| 35 to 44 Years | 13 (1.7%) | 17 (2.3%) |
| 45 to 54 Years | 2 (0.2%) | 34 (3.9%) |
| 55 to 64 Years | 24 (3.8%) | 3 (0.5%) |
| 65 to 74 Years | 23 (2.9%) | 30 (3.9%) |
| 75 Years and over | 0 (0.0%) | 28 (4.4%) |
| Total | 64 (1.1%) | 116 (2.1%) |
Income Above Poverty by Sex and Age in Mount Sinai
According to the poverty statistics in Mount Sinai, males aged under 5 years and females aged under 5 years are the age groups that are most secure financially, with 100.0% of males and 100.0% of females in these age groups living above the poverty line.
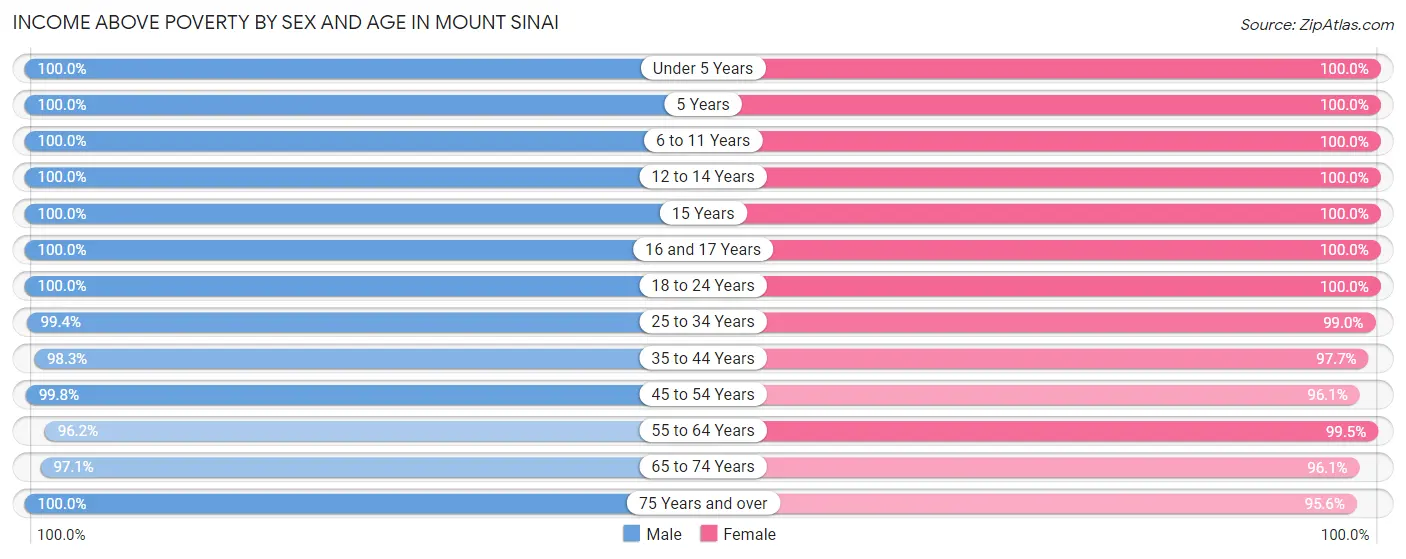
| Age Bracket | Male | Female |
| Under 5 Years | 343 (100.0%) | 151 (100.0%) |
| 5 Years | 50 (100.0%) | 170 (100.0%) |
| 6 to 11 Years | 518 (100.0%) | 273 (100.0%) |
| 12 to 14 Years | 304 (100.0%) | 233 (100.0%) |
| 15 Years | 190 (100.0%) | 49 (100.0%) |
| 16 and 17 Years | 199 (100.0%) | 180 (100.0%) |
| 18 to 24 Years | 400 (100.0%) | 463 (100.0%) |
| 25 to 34 Years | 348 (99.4%) | 396 (99.0%) |
| 35 to 44 Years | 735 (98.3%) | 736 (97.7%) |
| 45 to 54 Years | 893 (99.8%) | 836 (96.1%) |
| 55 to 64 Years | 615 (96.2%) | 617 (99.5%) |
| 65 to 74 Years | 756 (97.1%) | 734 (96.1%) |
| 75 Years and over | 667 (100.0%) | 605 (95.6%) |
| Total | 6,018 (99.0%) | 5,443 (97.9%) |
Income Below Poverty Among Married-Couple Families in Mount Sinai
The poverty statistics for married-couple families in Mount Sinai show that 1.2% or 37 of the total 2,986 families live below the poverty line. Families with no children have the highest poverty rate of 2.1%, comprising of 37 families. On the other hand, families with 1 or 2 children have the lowest poverty rate of 0.0%, which includes 0 families.
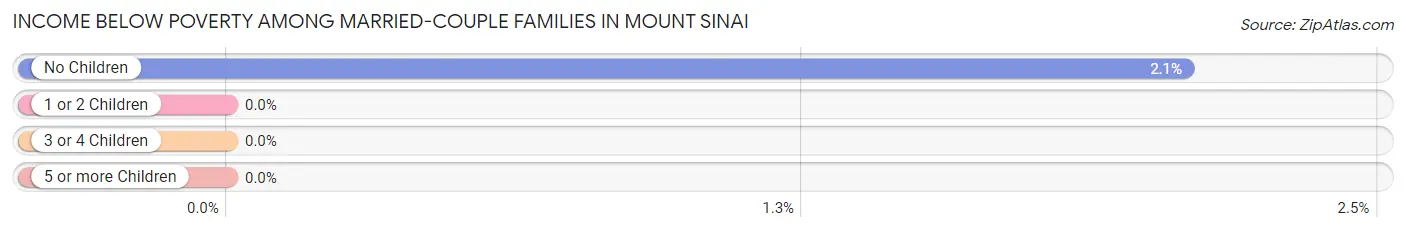
| Children | Above Poverty | Below Poverty |
| No Children | 1,745 (97.9%) | 37 (2.1%) |
| 1 or 2 Children | 926 (100.0%) | 0 (0.0%) |
| 3 or 4 Children | 257 (100.0%) | 0 (0.0%) |
| 5 or more Children | 21 (100.0%) | 0 (0.0%) |
| Total | 2,949 (98.8%) | 37 (1.2%) |
Income Below Poverty Among Single-Parent Households in Mount Sinai
| Children | Single Father | Single Mother |
| No Children | 0 (0.0%) | 0 (0.0%) |
| 1 or 2 Children | 0 (0.0%) | 0 (0.0%) |
| 3 or 4 Children | 0 (0.0%) | 0 (0.0%) |
| 5 or more Children | 0 (0.0%) | 0 (0.0%) |
| Total | 0 (0.0%) | 0 (0.0%) |
Income Below Poverty Among Married-Couple vs Single-Parent Households in Mount Sinai
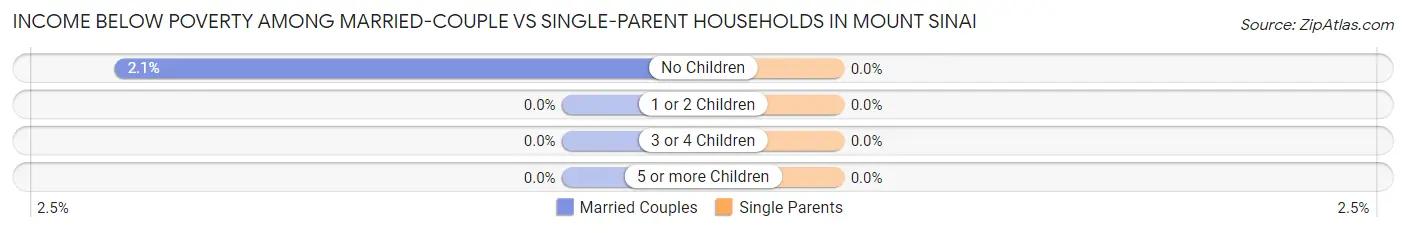
| Children | Married-Couple Families | Single-Parent Households |
| No Children | 37 (2.1%) | 0 (0.0%) |
| 1 or 2 Children | 0 (0.0%) | 0 (0.0%) |
| 3 or 4 Children | 0 (0.0%) | 0 (0.0%) |
| 5 or more Children | 0 (0.0%) | 0 (0.0%) |
| Total | 37 (1.2%) | 0 (0.0%) |
Race in Mount Sinai
The most populous races in Mount Sinai are White / Caucasian (10,108 | 86.8%), Hispanic or Latino (898 | 7.7%), and Two or more Races (513 | 4.4%).
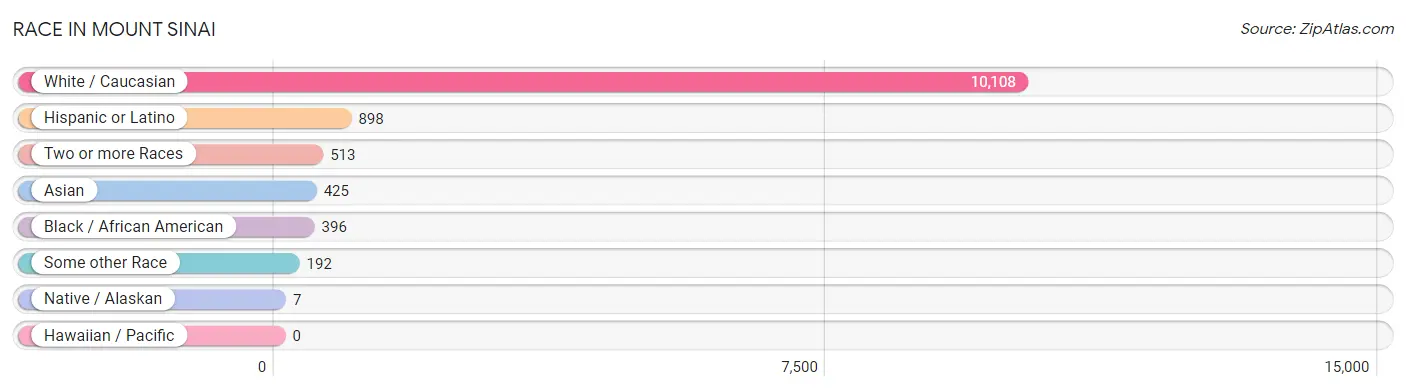
| Race | # Population | % Population |
| Asian | 425 | 3.6% |
| Black / African American | 396 | 3.4% |
| Hawaiian / Pacific | 0 | 0.0% |
| Hispanic or Latino | 898 | 7.7% |
| Native / Alaskan | 7 | 0.1% |
| White / Caucasian | 10,108 | 86.8% |
| Two or more Races | 513 | 4.4% |
| Some other Race | 192 | 1.7% |
| Total | 11,641 | 100.0% |
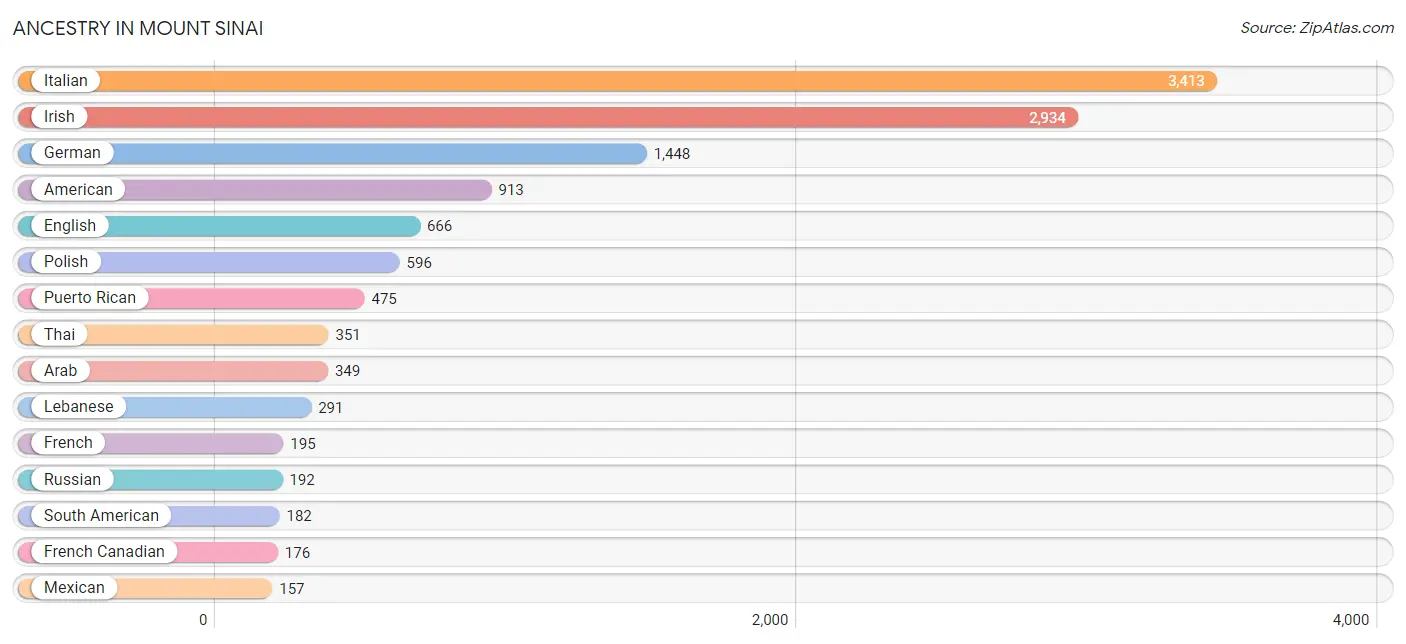
Ancestry in Mount Sinai
The most populous ancestries reported in Mount Sinai are Italian (3,413 | 29.3%), Irish (2,934 | 25.2%), German (1,448 | 12.4%), American (913 | 7.8%), and English (666 | 5.7%), together accounting for 80.5% of all Mount Sinai residents.
| Ancestry | # Population | % Population |
| African | 12 | 0.1% |
| Albanian | 5 | 0.0% |
| American | 913 | 7.8% |
| Arab | 349 | 3.0% |
| Armenian | 9 | 0.1% |
| Austrian | 102 | 0.9% |
| Belgian | 10 | 0.1% |
| Bhutanese | 5 | 0.0% |
| British | 16 | 0.1% |
| Burmese | 57 | 0.5% |
| Canadian | 20 | 0.2% |
| Central American | 23 | 0.2% |
| Chilean | 48 | 0.4% |
| Colombian | 16 | 0.1% |
| Costa Rican | 4 | 0.0% |
| Croatian | 4 | 0.0% |
| Cuban | 17 | 0.2% |
| Czech | 52 | 0.4% |
| Czechoslovakian | 16 | 0.1% |
| Danish | 12 | 0.1% |
| Dutch | 131 | 1.1% |
| Eastern European | 9 | 0.1% |
| English | 666 | 5.7% |
| European | 94 | 0.8% |
| Finnish | 10 | 0.1% |
| French | 195 | 1.7% |
| French Canadian | 176 | 1.5% |
| German | 1,448 | 12.4% |
| Greek | 48 | 0.4% |
| Haitian | 29 | 0.3% |
| Hungarian | 4 | 0.0% |
| Indian (Asian) | 74 | 0.6% |
| Iranian | 6 | 0.1% |
| Irish | 2,934 | 25.2% |
| Italian | 3,413 | 29.3% |
| Korean | 28 | 0.2% |
| Laotian | 4 | 0.0% |
| Lebanese | 291 | 2.5% |
| Lithuanian | 36 | 0.3% |
| Maltese | 43 | 0.4% |
| Mexican | 157 | 1.3% |
| Mexican American Indian | 7 | 0.1% |
| Northern European | 14 | 0.1% |
| Norwegian | 65 | 0.6% |
| Pakistani | 27 | 0.2% |
| Panamanian | 19 | 0.2% |
| Peruvian | 118 | 1.0% |
| Polish | 596 | 5.1% |
| Portuguese | 15 | 0.1% |
| Puerto Rican | 475 | 4.1% |
| Romanian | 25 | 0.2% |
| Russian | 192 | 1.7% |
| Scotch-Irish | 83 | 0.7% |
| Scottish | 89 | 0.8% |
| Slovak | 9 | 0.1% |
| South American | 182 | 1.6% |
| Spaniard | 29 | 0.3% |
| Spanish | 15 | 0.1% |
| Sri Lankan | 27 | 0.2% |
| Subsaharan African | 12 | 0.1% |
| Swedish | 111 | 0.9% |
| Swiss | 14 | 0.1% |
| Syrian | 58 | 0.5% |
| Thai | 351 | 3.0% |
| Turkish | 19 | 0.2% |
| Ukrainian | 17 | 0.2% |
| Welsh | 21 | 0.2% |
| West Indian | 8 | 0.1% | View All 68 Rows |
Immigrants in Mount Sinai
The most numerous immigrant groups reported in Mount Sinai came from Europe (344 | 3.0%), Asia (280 | 2.4%), Latin America (219 | 1.9%), Southern Europe (164 | 1.4%), and South Central Asia (134 | 1.1%), together accounting for 9.8% of all Mount Sinai residents.
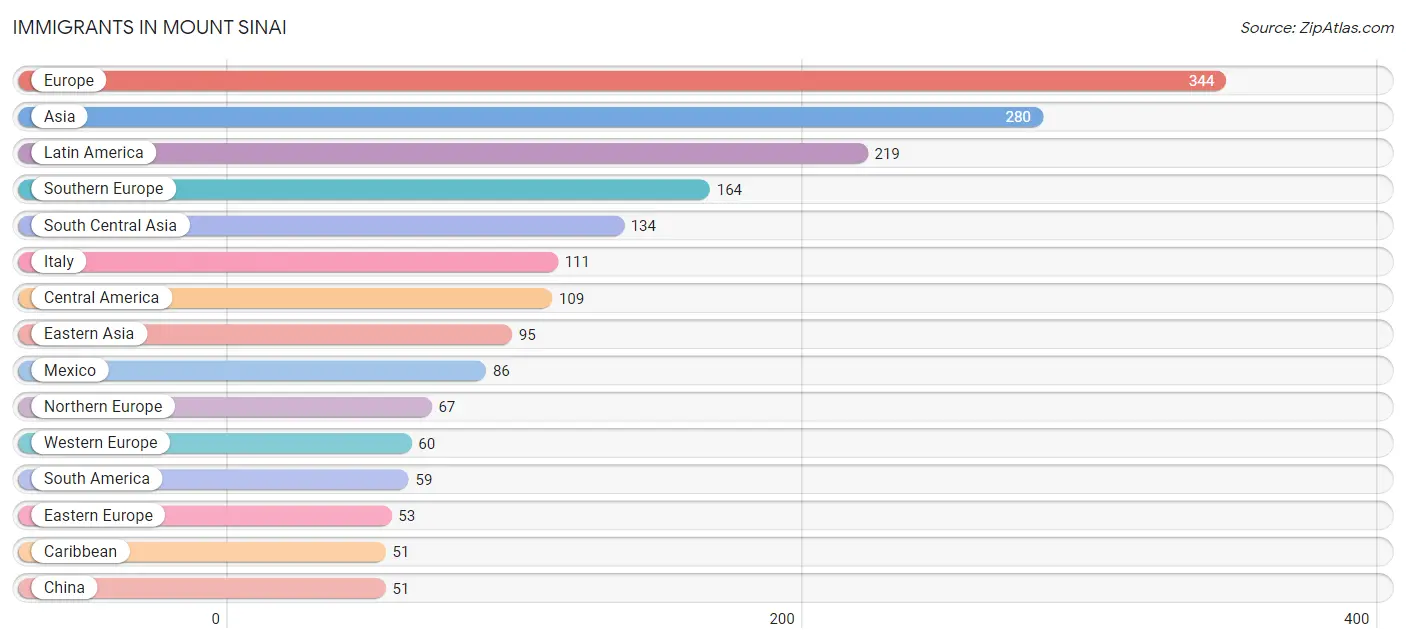
| Immigration Origin | # Population | % Population |
| Asia | 280 | 2.4% |
| Austria | 15 | 0.1% |
| Bangladesh | 43 | 0.4% |
| Caribbean | 51 | 0.4% |
| Central America | 109 | 0.9% |
| Chile | 15 | 0.1% |
| China | 51 | 0.4% |
| Colombia | 16 | 0.1% |
| Costa Rica | 4 | 0.0% |
| Cuba | 14 | 0.1% |
| Czechoslovakia | 15 | 0.1% |
| Eastern Asia | 95 | 0.8% |
| Eastern Europe | 53 | 0.5% |
| England | 36 | 0.3% |
| Europe | 344 | 3.0% |
| Germany | 41 | 0.4% |
| Haiti | 29 | 0.3% |
| Hong Kong | 4 | 0.0% |
| India | 49 | 0.4% |
| Iran | 6 | 0.1% |
| Ireland | 15 | 0.1% |
| Italy | 111 | 0.9% |
| Korea | 44 | 0.4% |
| Latin America | 219 | 1.9% |
| Mexico | 86 | 0.7% |
| Nepal | 12 | 0.1% |
| Netherlands | 4 | 0.0% |
| Northern Europe | 67 | 0.6% |
| Pakistan | 24 | 0.2% |
| Panama | 19 | 0.2% |
| Peru | 28 | 0.2% |
| Philippines | 32 | 0.3% |
| Poland | 38 | 0.3% |
| South America | 59 | 0.5% |
| South Central Asia | 134 | 1.1% |
| South Eastern Asia | 32 | 0.3% |
| Southern Europe | 164 | 1.4% |
| Spain | 10 | 0.1% |
| Taiwan | 29 | 0.3% |
| Turkey | 19 | 0.2% |
| West Indies | 8 | 0.1% |
| Western Asia | 19 | 0.2% |
| Western Europe | 60 | 0.5% | View All 43 Rows |
Sex and Age in Mount Sinai
Sex and Age in Mount Sinai
The most populous age groups in Mount Sinai are 50 to 54 Years (525 | 8.6%) for men and 40 to 44 Years (516 | 9.3%) for women.
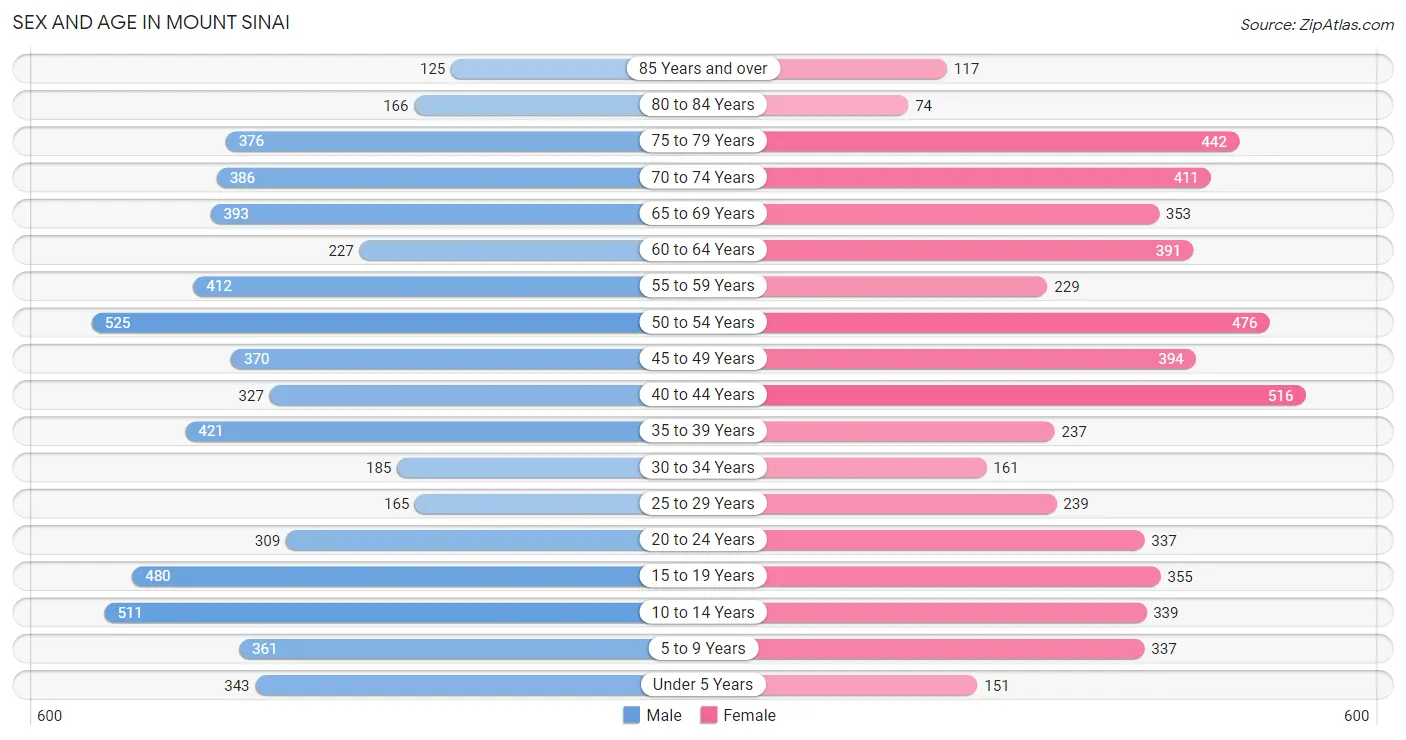
| Age Bracket | Male | Female |
| Under 5 Years | 343 (5.6%) | 151 (2.7%) |
| 5 to 9 Years | 361 (5.9%) | 337 (6.1%) |
| 10 to 14 Years | 511 (8.4%) | 339 (6.1%) |
| 15 to 19 Years | 480 (7.9%) | 355 (6.4%) |
| 20 to 24 Years | 309 (5.1%) | 337 (6.1%) |
| 25 to 29 Years | 165 (2.7%) | 239 (4.3%) |
| 30 to 34 Years | 185 (3.0%) | 161 (2.9%) |
| 35 to 39 Years | 421 (6.9%) | 237 (4.3%) |
| 40 to 44 Years | 327 (5.4%) | 516 (9.3%) |
| 45 to 49 Years | 370 (6.1%) | 394 (7.1%) |
| 50 to 54 Years | 525 (8.6%) | 476 (8.6%) |
| 55 to 59 Years | 412 (6.8%) | 229 (4.1%) |
| 60 to 64 Years | 227 (3.7%) | 391 (7.0%) |
| 65 to 69 Years | 393 (6.5%) | 353 (6.4%) |
| 70 to 74 Years | 386 (6.4%) | 411 (7.4%) |
| 75 to 79 Years | 376 (6.2%) | 442 (8.0%) |
| 80 to 84 Years | 166 (2.7%) | 74 (1.3%) |
| 85 Years and over | 125 (2.1%) | 117 (2.1%) |
| Total | 6,082 (100.0%) | 5,559 (100.0%) |
Families and Households in Mount Sinai
Median Family Size in Mount Sinai
The median family size in Mount Sinai is 3.35 persons per family, with married-couple families (2,986 | 92.2%) accounting for the largest median family size of 3.42 persons per family. On the other hand, single male/father families (104 | 3.2%) represent the smallest median family size with 2.42 persons per family.
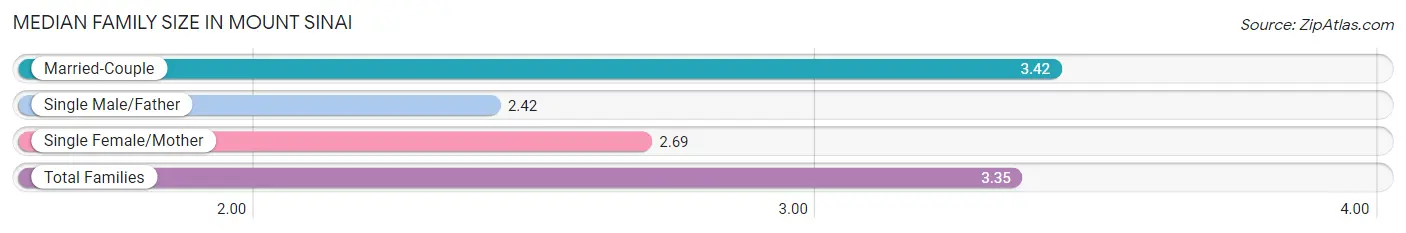
| Family Type | # Families | Family Size |
| Married-Couple | 2,986 (92.2%) | 3.42 |
| Single Male/Father | 104 (3.2%) | 2.42 |
| Single Female/Mother | 148 (4.6%) | 2.69 |
| Total Families | 3,238 (100.0%) | 3.35 |
Median Household Size in Mount Sinai
The median household size in Mount Sinai is 3.00 persons per household, with married-couple households (2,986 | 77.4%) accounting for the largest median household size of 3.42 persons per household. non-family households (622 | 16.1%) represent the smallest median household size with 1.11 persons per household.
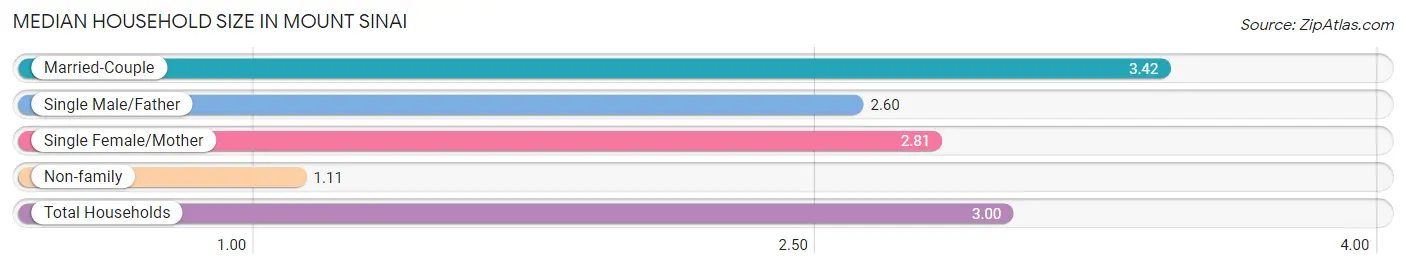
| Household Type | # Households | Household Size |
| Married-Couple | 2,986 (77.4%) | 3.42 |
| Single Male/Father | 104 (2.7%) | 2.60 |
| Single Female/Mother | 148 (3.8%) | 2.81 |
| Non-family | 622 (16.1%) | 1.11 |
| Total Households | 3,860 (100.0%) | 3.00 |
Household Size by Marriage Status in Mount Sinai
Out of a total of 3,860 households in Mount Sinai, 3,238 (83.9%) are family households, while 622 (16.1%) are nonfamily households. The most numerous type of family households are 2-person households, comprising 1,456, and the most common type of nonfamily households are 1-person households, comprising 571.
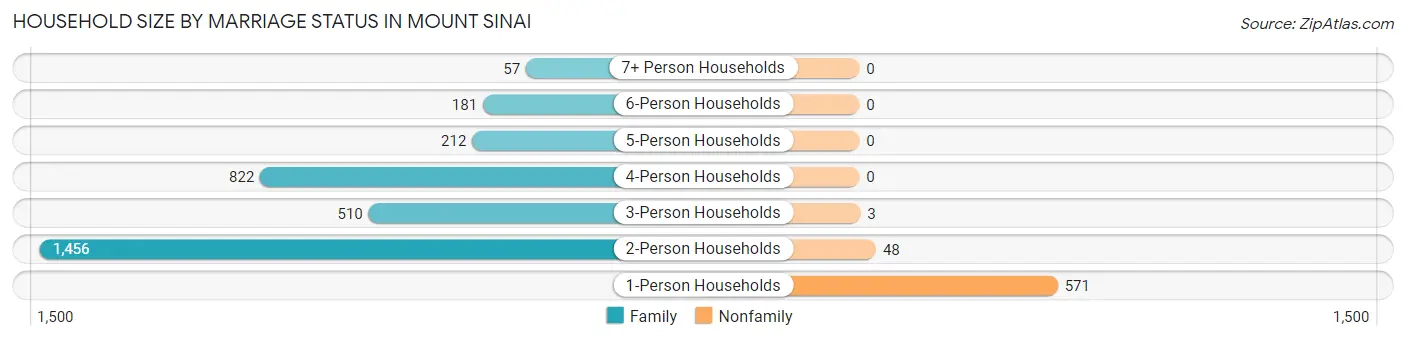
| Household Size | Family Households | Nonfamily Households |
| 1-Person Households | - | 571 (14.8%) |
| 2-Person Households | 1,456 (37.7%) | 48 (1.2%) |
| 3-Person Households | 510 (13.2%) | 3 (0.1%) |
| 4-Person Households | 822 (21.3%) | 0 (0.0%) |
| 5-Person Households | 212 (5.5%) | 0 (0.0%) |
| 6-Person Households | 181 (4.7%) | 0 (0.0%) |
| 7+ Person Households | 57 (1.5%) | 0 (0.0%) |
| Total | 3,238 (83.9%) | 622 (16.1%) |
Female Fertility in Mount Sinai
Fertility by Age in Mount Sinai
Average fertility rate in Mount Sinai is 48.0 births per 1,000 women. Women in the age bracket of 20 to 34 years have the highest fertility rate with 115.0 births per 1,000 women. Women in the age bracket of 20 to 34 years acount for 74.6% of all women with births.
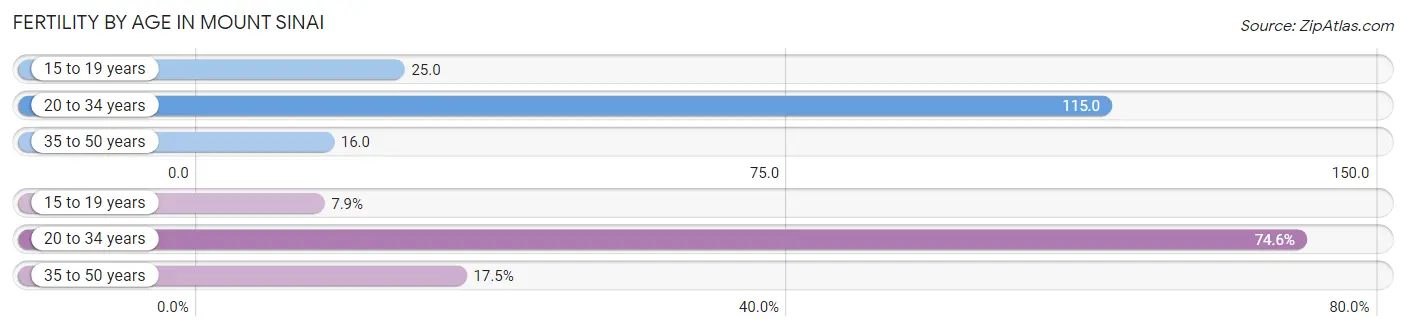
| Age Bracket | Women with Births | Births / 1,000 Women |
| 15 to 19 years | 9 (7.9%) | 25.0 |
| 20 to 34 years | 85 (74.6%) | 115.0 |
| 35 to 50 years | 20 (17.5%) | 16.0 |
| Total | 114 (100.0%) | 48.0 |
Fertility by Age by Marriage Status in Mount Sinai
92.1% of women with births (114) in Mount Sinai are married. The highest percentage of unmarried women with births falls into 15 to 19 years age bracket with 100.0% of them unmarried at the time of birth, while the lowest percentage of unmarried women with births belong to 20 to 34 years age bracket with 0.0% of them unmarried.
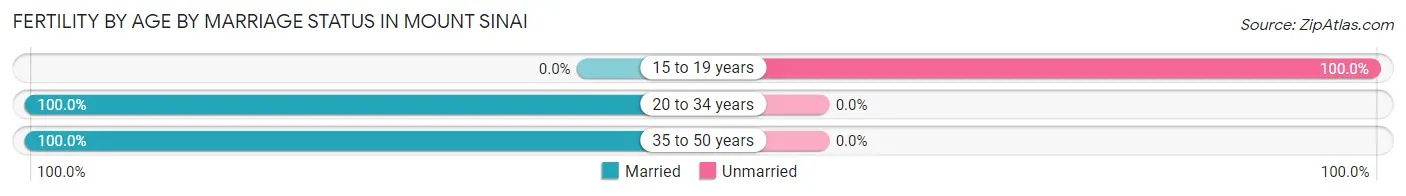
| Age Bracket | Married | Unmarried |
| 15 to 19 years | 0 (0.0%) | 9 (100.0%) |
| 20 to 34 years | 85 (100.0%) | 0 (0.0%) |
| 35 to 50 years | 20 (100.0%) | 0 (0.0%) |
| Total | 105 (92.1%) | 9 (7.9%) |
Fertility by Education in Mount Sinai
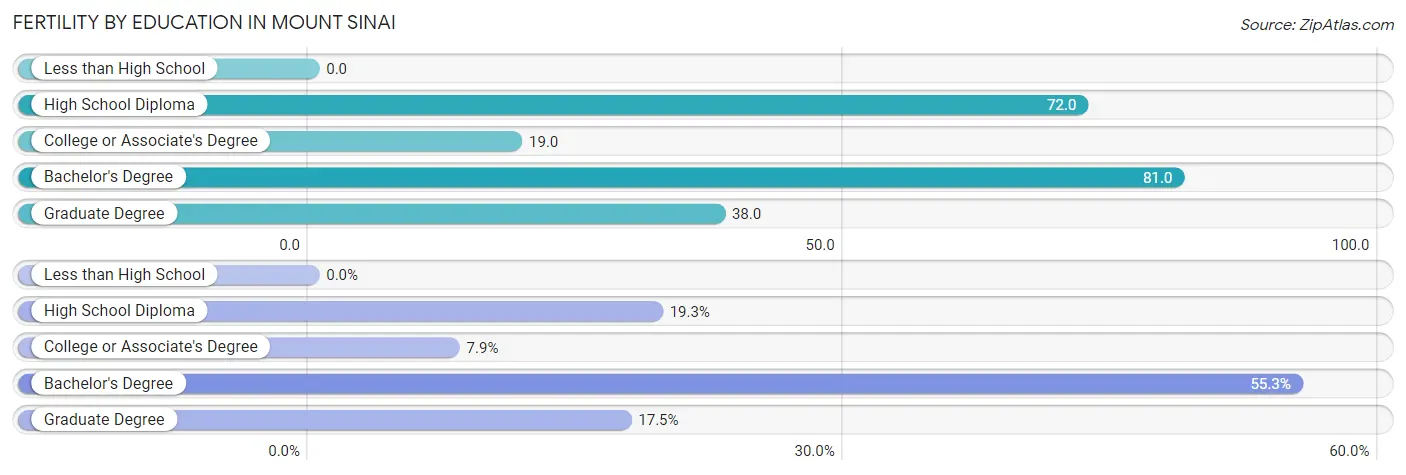
| Educational Attainment | Women with Births | Births / 1,000 Women |
| Less than High School | 0 (0.0%) | 0.0 |
| High School Diploma | 22 (19.3%) | 72.0 |
| College or Associate's Degree | 9 (7.9%) | 19.0 |
| Bachelor's Degree | 63 (55.3%) | 81.0 |
| Graduate Degree | 20 (17.5%) | 38.0 |
| Total | 114 (100.0%) | 48.0 |
Fertility by Education by Marriage Status in Mount Sinai
7.9% of women with births in Mount Sinai are unmarried. Women with the educational attainment of high school diploma are most likely to be married with 100.0% of them married at childbirth, while women with the educational attainment of college or associate's degree are least likely to be married with 100.0% of them unmarried at childbirth.
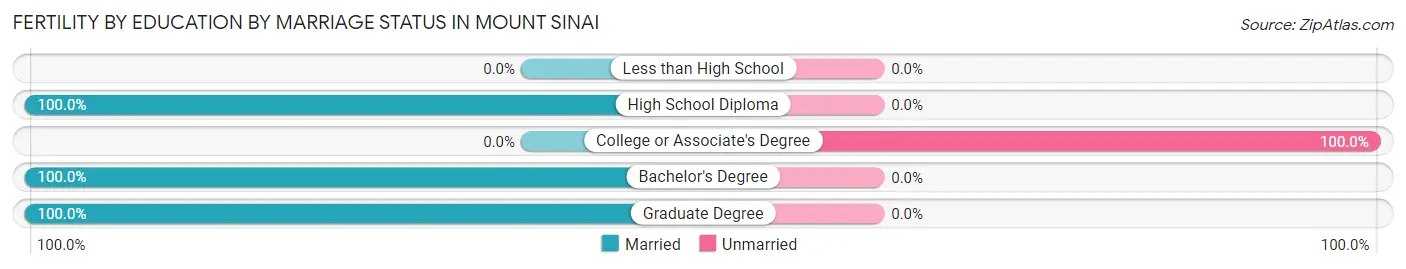
| Educational Attainment | Married | Unmarried |
| Less than High School | 0 (0.0%) | 0 (0.0%) |
| High School Diploma | 22 (100.0%) | 0 (0.0%) |
| College or Associate's Degree | 0 (0.0%) | 9 (100.0%) |
| Bachelor's Degree | 63 (100.0%) | 0 (0.0%) |
| Graduate Degree | 20 (100.0%) | 0 (0.0%) |
| Total | 105 (92.1%) | 9 (7.9%) |
Employment Characteristics in Mount Sinai
Employment by Class of Employer in Mount Sinai
Among the 5,163 employed individuals in Mount Sinai, private company employees (2,897 | 56.1%), state government employees (634 | 12.3%), and local government employees (529 | 10.2%) make up the most common classes of employment.
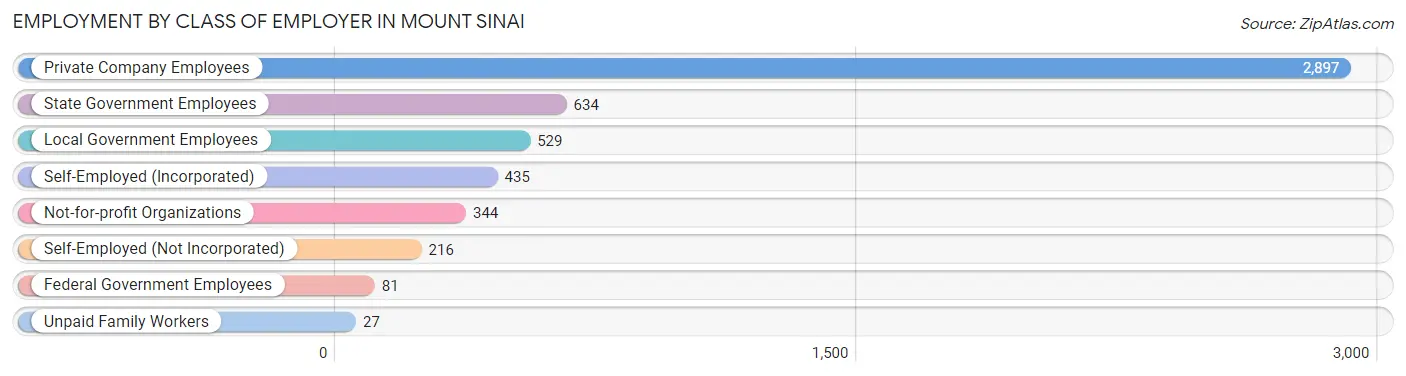
| Employer Class | # Employees | % Employees |
| Private Company Employees | 2,897 | 56.1% |
| Self-Employed (Incorporated) | 435 | 8.4% |
| Self-Employed (Not Incorporated) | 216 | 4.2% |
| Not-for-profit Organizations | 344 | 6.7% |
| Local Government Employees | 529 | 10.2% |
| State Government Employees | 634 | 12.3% |
| Federal Government Employees | 81 | 1.6% |
| Unpaid Family Workers | 27 | 0.5% |
| Total | 5,163 | 100.0% |
Employment Status by Age in Mount Sinai
According to the labor force statistics for Mount Sinai, out of the total population over 16 years of age (9,360), 60.1% or 5,625 individuals are in the labor force, with 6.1% or 343 of them unemployed. The age group with the highest labor force participation rate is 30 to 34 years, with 90.5% or 313 individuals in the labor force. Within the labor force, the 20 to 24 years age range has the highest percentage of unemployed individuals, with 18.1% or 99 of them being unemployed.
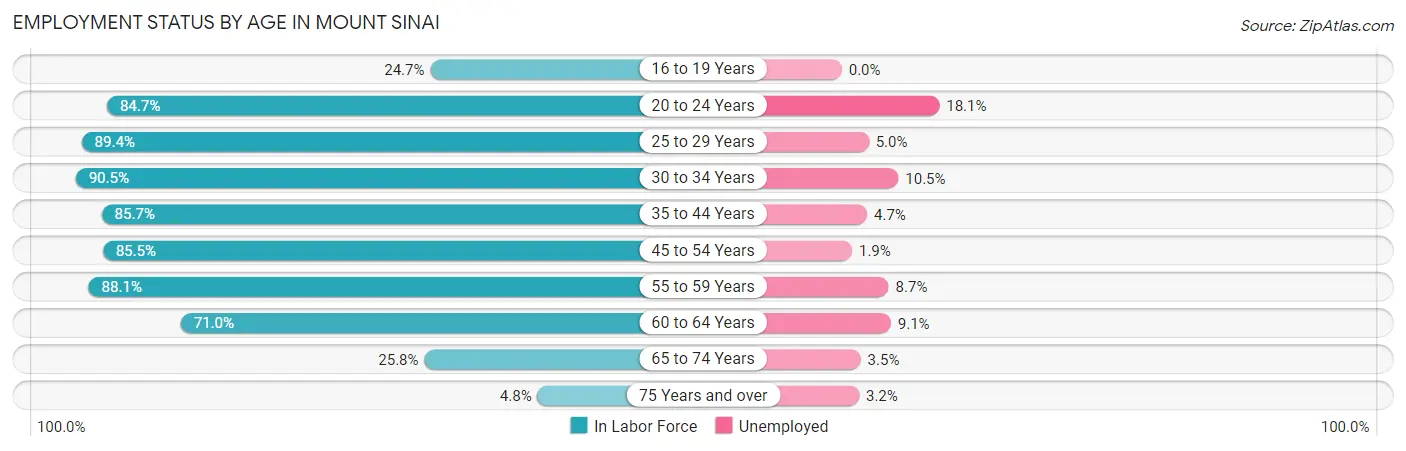
| Age Bracket | In Labor Force | Unemployed |
| 16 to 19 Years | 147 (24.7%) | 0 (0.0%) |
| 20 to 24 Years | 547 (84.7%) | 99 (18.1%) |
| 25 to 29 Years | 361 (89.4%) | 18 (5.0%) |
| 30 to 34 Years | 313 (90.5%) | 33 (10.5%) |
| 35 to 44 Years | 1,286 (85.7%) | 60 (4.7%) |
| 45 to 54 Years | 1,509 (85.5%) | 29 (1.9%) |
| 55 to 59 Years | 565 (88.1%) | 49 (8.7%) |
| 60 to 64 Years | 439 (71.0%) | 40 (9.1%) |
| 65 to 74 Years | 398 (25.8%) | 14 (3.5%) |
| 75 Years and over | 62 (4.8%) | 2 (3.2%) |
| Total | 5,625 (60.1%) | 343 (6.1%) |
Employment Status by Educational Attainment in Mount Sinai
According to labor force statistics for Mount Sinai, 84.8% of individuals (4,473) out of the total population between 25 and 64 years of age (5,275) are in the labor force, with 5.1% or 228 of them being unemployed. The group with the highest labor force participation rate are those with the educational attainment of bachelor's degree or higher, with 92.4% or 2,866 individuals in the labor force. Within the labor force, individuals with college / associate degree education have the highest percentage of unemployment, with 8.5% or 78 of them being unemployed.
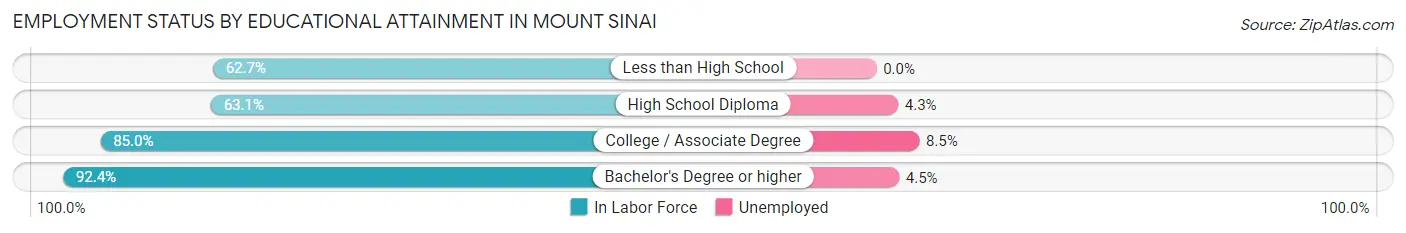
| Educational Attainment | In Labor Force | Unemployed |
| Less than High School | 156 (62.7%) | 0 (0.0%) |
| High School Diploma | 529 (63.1%) | 36 (4.3%) |
| College / Associate Degree | 922 (85.0%) | 92 (8.5%) |
| Bachelor's Degree or higher | 2,866 (92.4%) | 140 (4.5%) |
| Total | 4,473 (84.8%) | 269 (5.1%) |
Employment Occupations by Sex in Mount Sinai
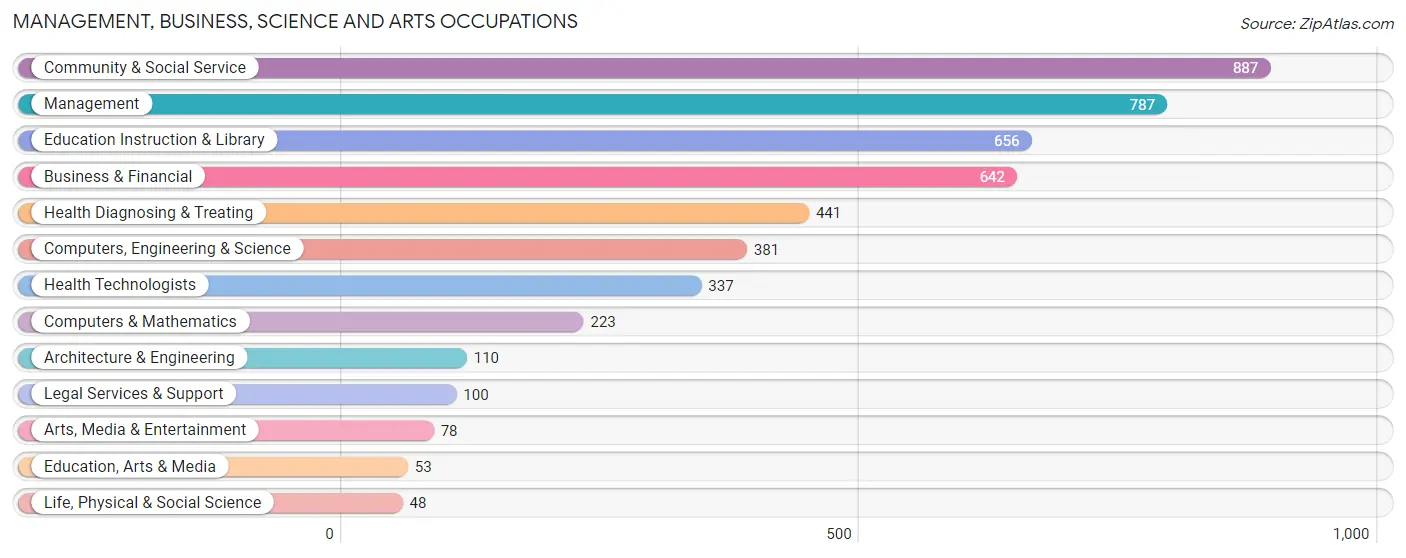
Management, Business, Science and Arts Occupations
The most common Management, Business, Science and Arts occupations in Mount Sinai are Community & Social Service (887 | 16.8%), Management (787 | 14.9%), Education Instruction & Library (656 | 12.4%), Business & Financial (642 | 12.1%), and Health Diagnosing & Treating (441 | 8.3%).
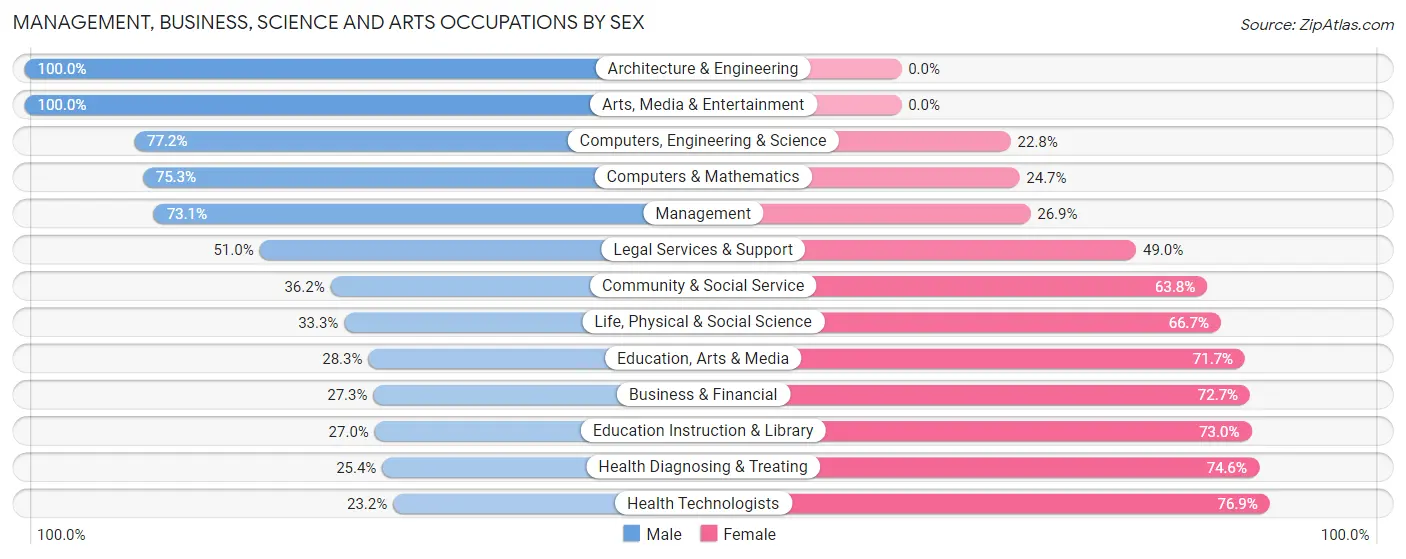
Management, Business, Science and Arts Occupations by Sex
Within the Management, Business, Science and Arts occupations in Mount Sinai, the most male-oriented occupations are Architecture & Engineering (100.0%), Arts, Media & Entertainment (100.0%), and Computers, Engineering & Science (77.2%), while the most female-oriented occupations are Health Technologists (76.8%), Health Diagnosing & Treating (74.6%), and Education Instruction & Library (73.0%).
| Occupation | Male | Female |
| Management | 575 (73.1%) | 212 (26.9%) |
| Business & Financial | 175 (27.3%) | 467 (72.7%) |
| Computers, Engineering & Science | 294 (77.2%) | 87 (22.8%) |
| Computers & Mathematics | 168 (75.3%) | 55 (24.7%) |
| Architecture & Engineering | 110 (100.0%) | 0 (0.0%) |
| Life, Physical & Social Science | 16 (33.3%) | 32 (66.7%) |
| Community & Social Service | 321 (36.2%) | 566 (63.8%) |
| Education, Arts & Media | 15 (28.3%) | 38 (71.7%) |
| Legal Services & Support | 51 (51.0%) | 49 (49.0%) |
| Education Instruction & Library | 177 (27.0%) | 479 (73.0%) |
| Arts, Media & Entertainment | 78 (100.0%) | 0 (0.0%) |
| Health Diagnosing & Treating | 112 (25.4%) | 329 (74.6%) |
| Health Technologists | 78 (23.2%) | 259 (76.8%) |
| Total (Category) | 1,477 (47.1%) | 1,661 (52.9%) |
| Total (Overall) | 2,671 (50.5%) | 2,614 (49.5%) |
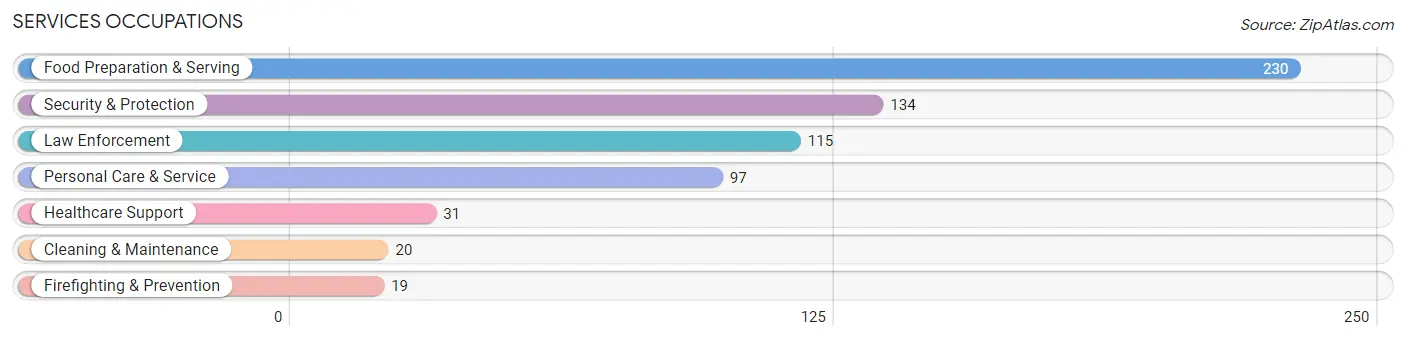
Services Occupations
The most common Services occupations in Mount Sinai are Food Preparation & Serving (230 | 4.3%), Security & Protection (134 | 2.5%), Law Enforcement (115 | 2.2%), Personal Care & Service (97 | 1.8%), and Healthcare Support (31 | 0.6%).
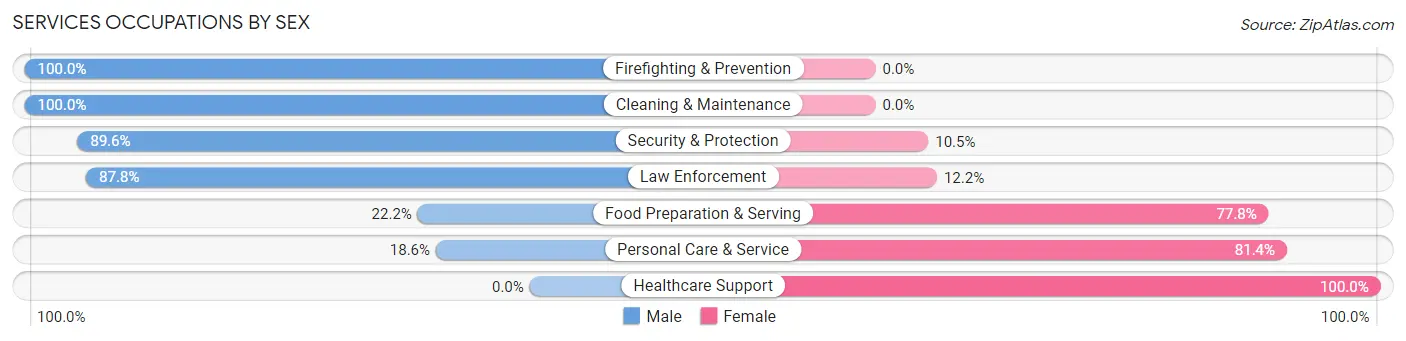
Services Occupations by Sex
Within the Services occupations in Mount Sinai, the most male-oriented occupations are Firefighting & Prevention (100.0%), Cleaning & Maintenance (100.0%), and Security & Protection (89.5%), while the most female-oriented occupations are Healthcare Support (100.0%), Personal Care & Service (81.4%), and Food Preparation & Serving (77.8%).
| Occupation | Male | Female |
| Healthcare Support | 0 (0.0%) | 31 (100.0%) |
| Security & Protection | 120 (89.5%) | 14 (10.4%) |
| Firefighting & Prevention | 19 (100.0%) | 0 (0.0%) |
| Law Enforcement | 101 (87.8%) | 14 (12.2%) |
| Food Preparation & Serving | 51 (22.2%) | 179 (77.8%) |
| Cleaning & Maintenance | 20 (100.0%) | 0 (0.0%) |
| Personal Care & Service | 18 (18.6%) | 79 (81.4%) |
| Total (Category) | 209 (40.8%) | 303 (59.2%) |
| Total (Overall) | 2,671 (50.5%) | 2,614 (49.5%) |
Sales and Office Occupations
The most common Sales and Office occupations in Mount Sinai are Sales & Related (536 | 10.1%), and Office & Administration (440 | 8.3%).
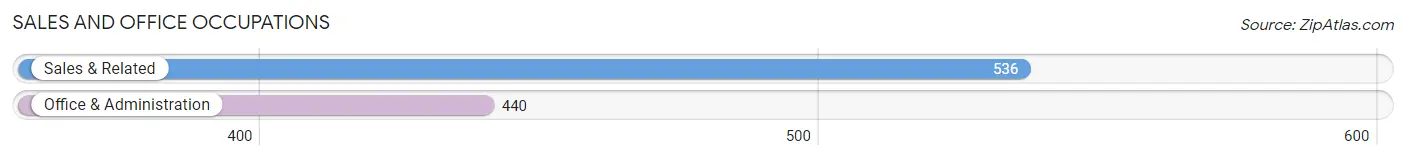
Sales and Office Occupations by Sex
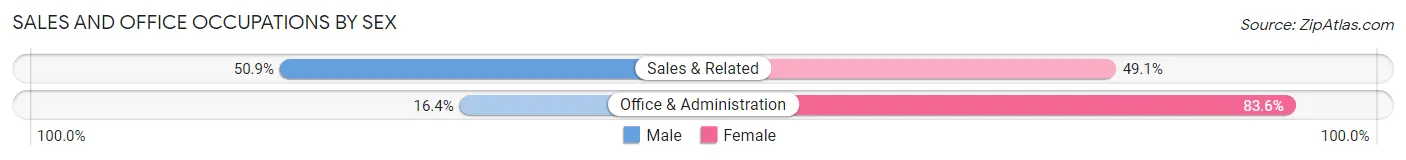
| Occupation | Male | Female |
| Sales & Related | 273 (50.9%) | 263 (49.1%) |
| Office & Administration | 72 (16.4%) | 368 (83.6%) |
| Total (Category) | 345 (35.3%) | 631 (64.6%) |
| Total (Overall) | 2,671 (50.5%) | 2,614 (49.5%) |
Natural Resources, Construction and Maintenance Occupations
The most common Natural Resources, Construction and Maintenance occupations in Mount Sinai are Construction & Extraction (244 | 4.6%), and Installation, Maintenance & Repair (191 | 3.6%).
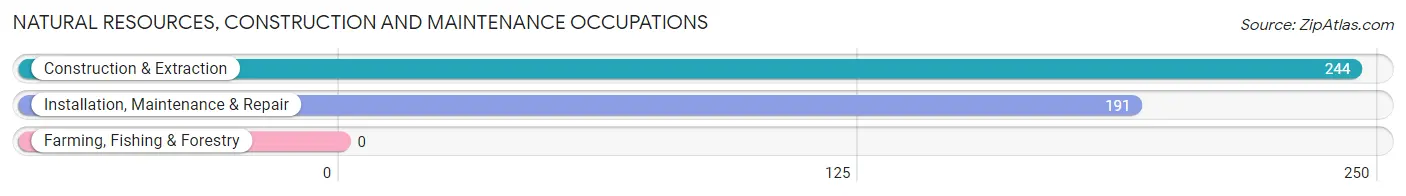
Natural Resources, Construction and Maintenance Occupations by Sex
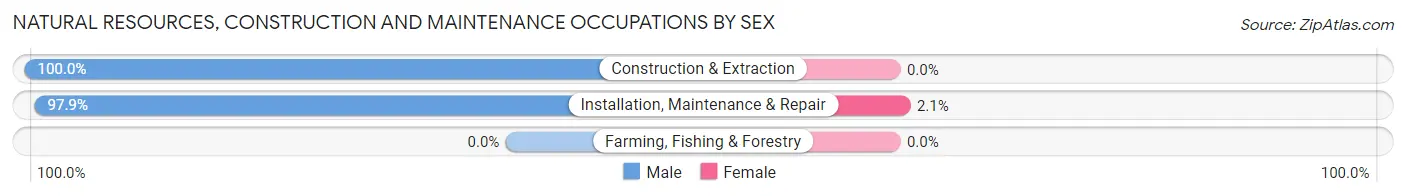
| Occupation | Male | Female |
| Farming, Fishing & Forestry | 0 (0.0%) | 0 (0.0%) |
| Construction & Extraction | 244 (100.0%) | 0 (0.0%) |
| Installation, Maintenance & Repair | 187 (97.9%) | 4 (2.1%) |
| Total (Category) | 431 (99.1%) | 4 (0.9%) |
| Total (Overall) | 2,671 (50.5%) | 2,614 (49.5%) |
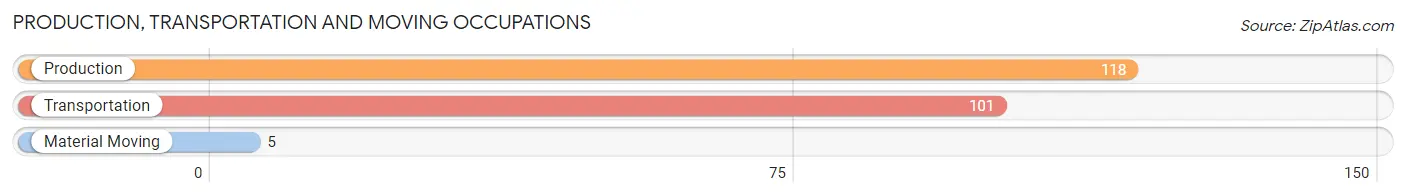
Production, Transportation and Moving Occupations
The most common Production, Transportation and Moving occupations in Mount Sinai are Production (118 | 2.2%), Transportation (101 | 1.9%), and Material Moving (5 | 0.1%).
Production, Transportation and Moving Occupations by Sex
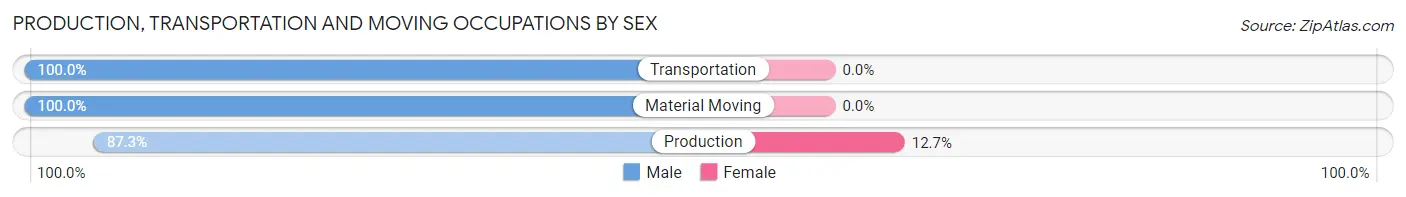
| Occupation | Male | Female |
| Production | 103 (87.3%) | 15 (12.7%) |
| Transportation | 101 (100.0%) | 0 (0.0%) |
| Material Moving | 5 (100.0%) | 0 (0.0%) |
| Total (Category) | 209 (93.3%) | 15 (6.7%) |
| Total (Overall) | 2,671 (50.5%) | 2,614 (49.5%) |
Employment Industries by Sex in Mount Sinai
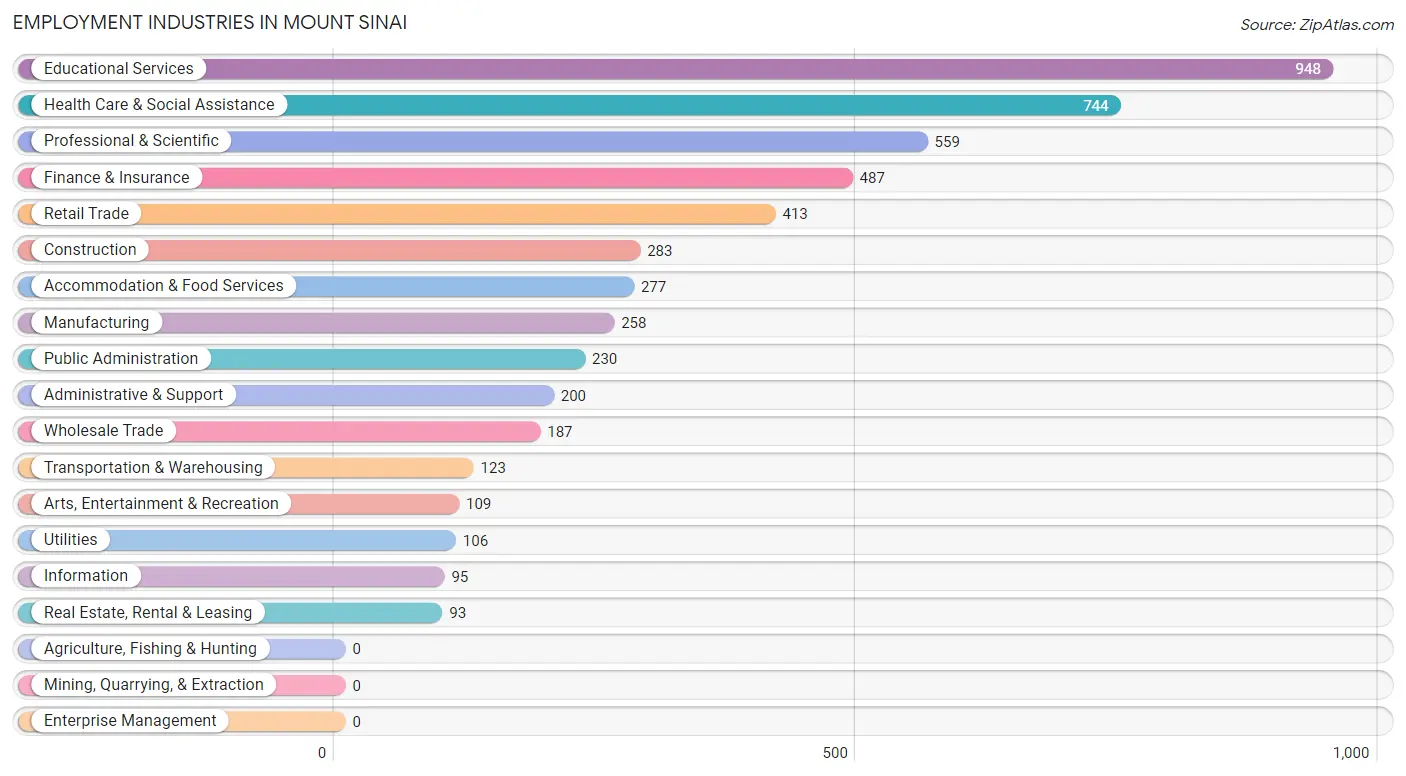
Employment Industries in Mount Sinai
The major employment industries in Mount Sinai include Educational Services (948 | 17.9%), Health Care & Social Assistance (744 | 14.1%), Professional & Scientific (559 | 10.6%), Finance & Insurance (487 | 9.2%), and Retail Trade (413 | 7.8%).
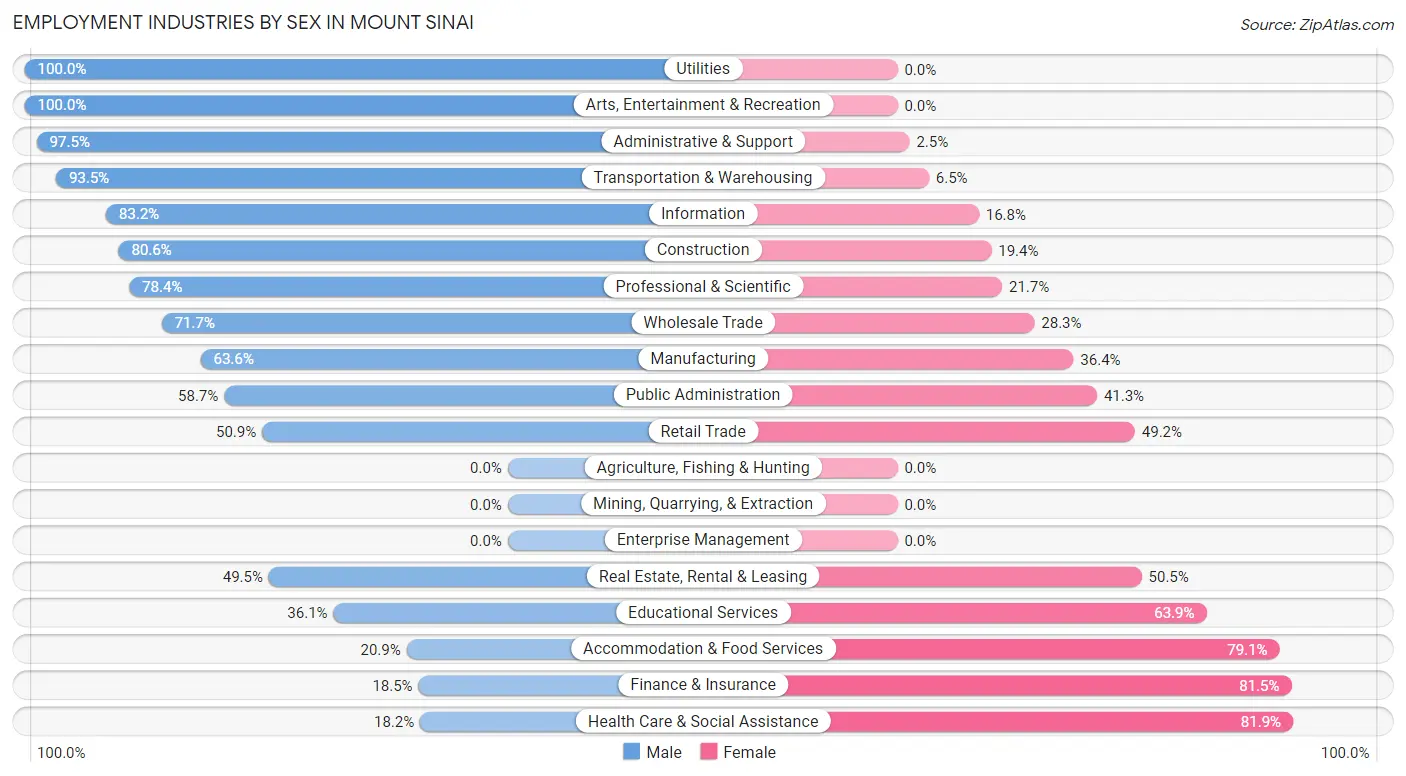
Employment Industries by Sex in Mount Sinai
The Mount Sinai industries that see more men than women are Utilities (100.0%), Arts, Entertainment & Recreation (100.0%), and Administrative & Support (97.5%), whereas the industries that tend to have a higher number of women are Health Care & Social Assistance (81.9%), Finance & Insurance (81.5%), and Accommodation & Food Services (79.1%).
| Industry | Male | Female |
| Agriculture, Fishing & Hunting | 0 (0.0%) | 0 (0.0%) |
| Mining, Quarrying, & Extraction | 0 (0.0%) | 0 (0.0%) |
| Construction | 228 (80.6%) | 55 (19.4%) |
| Manufacturing | 164 (63.6%) | 94 (36.4%) |
| Wholesale Trade | 134 (71.7%) | 53 (28.3%) |
| Retail Trade | 210 (50.8%) | 203 (49.1%) |
| Transportation & Warehousing | 115 (93.5%) | 8 (6.5%) |
| Utilities | 106 (100.0%) | 0 (0.0%) |
| Information | 79 (83.2%) | 16 (16.8%) |
| Finance & Insurance | 90 (18.5%) | 397 (81.5%) |
| Real Estate, Rental & Leasing | 46 (49.5%) | 47 (50.5%) |
| Professional & Scientific | 438 (78.3%) | 121 (21.6%) |
| Enterprise Management | 0 (0.0%) | 0 (0.0%) |
| Administrative & Support | 195 (97.5%) | 5 (2.5%) |
| Educational Services | 342 (36.1%) | 606 (63.9%) |
| Health Care & Social Assistance | 135 (18.1%) | 609 (81.9%) |
| Arts, Entertainment & Recreation | 109 (100.0%) | 0 (0.0%) |
| Accommodation & Food Services | 58 (20.9%) | 219 (79.1%) |
| Public Administration | 135 (58.7%) | 95 (41.3%) |
| Total | 2,671 (50.5%) | 2,614 (49.5%) |
Education in Mount Sinai
School Enrollment in Mount Sinai
The most common levels of schooling among the 2,964 students in Mount Sinai are middle school (737 | 24.9%), high school (724 | 24.4%), and college / undergraduate (585 | 19.7%).
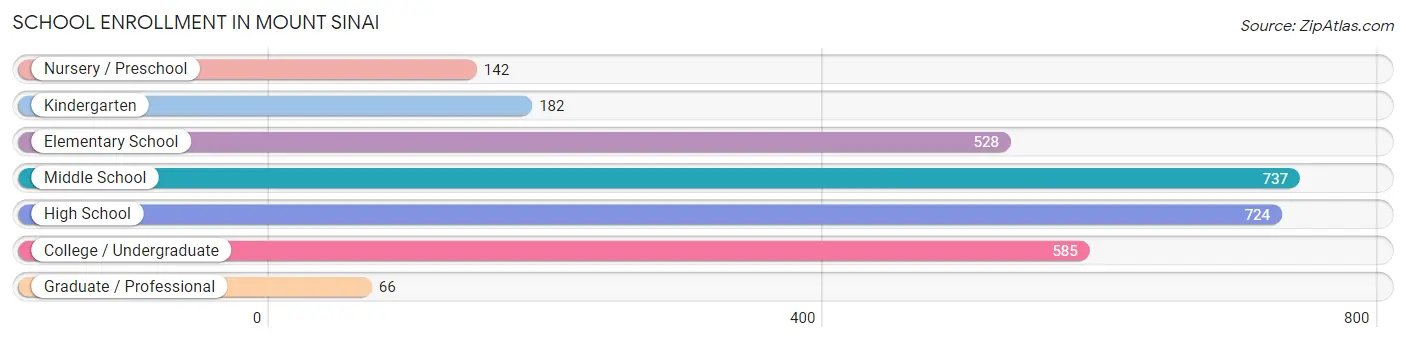
| School Level | # Students | % Students |
| Nursery / Preschool | 142 | 4.8% |
| Kindergarten | 182 | 6.1% |
| Elementary School | 528 | 17.8% |
| Middle School | 737 | 24.9% |
| High School | 724 | 24.4% |
| College / Undergraduate | 585 | 19.7% |
| Graduate / Professional | 66 | 2.2% |
| Total | 2,964 | 100.0% |
School Enrollment by Age by Funding Source in Mount Sinai
Out of a total of 2,964 students who are enrolled in schools in Mount Sinai, 255 (8.6%) attend a private institution, while the remaining 2,709 (91.4%) are enrolled in public schools. The age group of 3 to 4 year olds has the highest likelihood of being enrolled in private schools, with 62 (56.4% in the age bracket) enrolled. Conversely, the age group of 25 to 34 year olds has the lowest likelihood of being enrolled in a private school, with 17 (100.0% in the age bracket) attending a public institution.
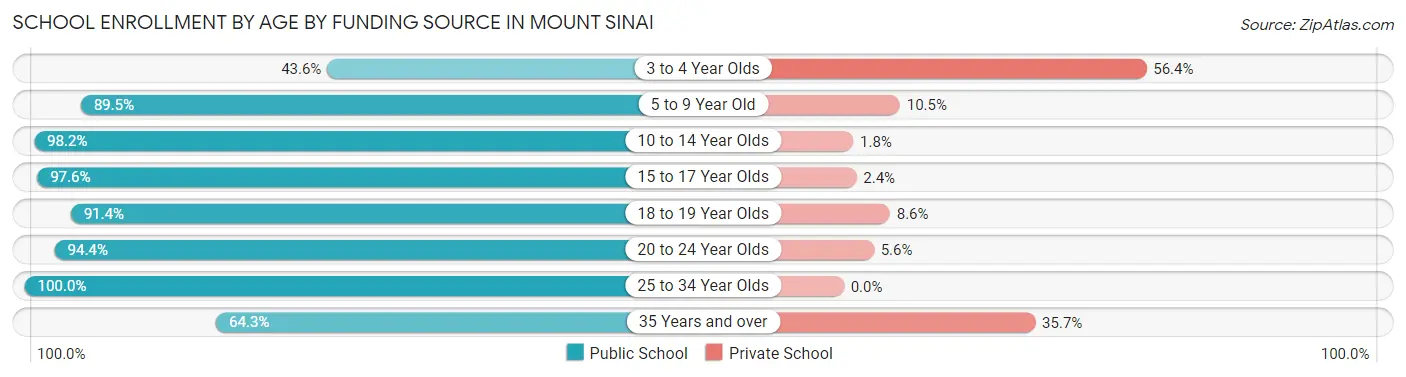
| Age Bracket | Public School | Private School |
| 3 to 4 Year Olds | 48 (43.6%) | 62 (56.4%) |
| 5 to 9 Year Old | 625 (89.5%) | 73 (10.5%) |
| 10 to 14 Year Olds | 835 (98.2%) | 15 (1.8%) |
| 15 to 17 Year Olds | 580 (97.6%) | 14 (2.4%) |
| 18 to 19 Year Olds | 149 (91.4%) | 14 (8.6%) |
| 20 to 24 Year Olds | 354 (94.4%) | 21 (5.6%) |
| 25 to 34 Year Olds | 17 (100.0%) | 0 (0.0%) |
| 35 Years and over | 101 (64.3%) | 56 (35.7%) |
| Total | 2,709 (91.4%) | 255 (8.6%) |
Educational Attainment by Field of Study in Mount Sinai
Business (962 | 21.4%), education (710 | 15.8%), science & technology (618 | 13.8%), engineering (295 | 6.6%), and social sciences (286 | 6.4%) are the most common fields of study among 4,484 individuals in Mount Sinai who have obtained a bachelor's degree or higher.
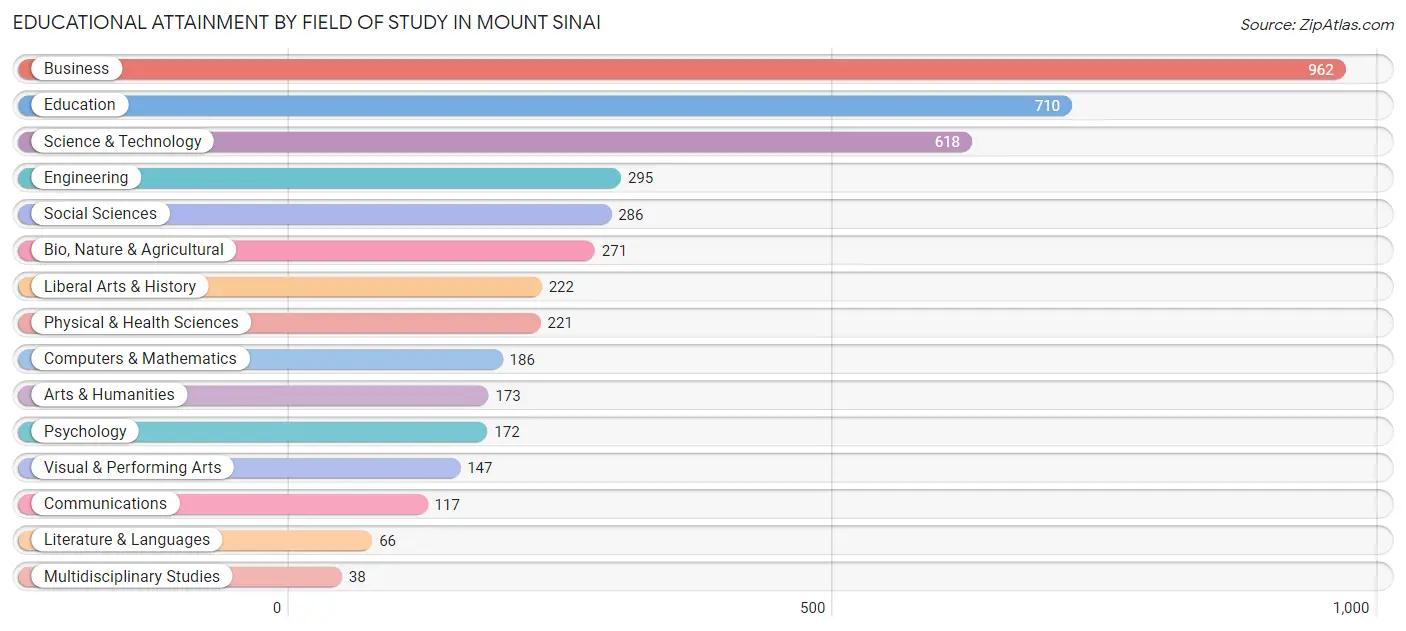
| Field of Study | # Graduates | % Graduates |
| Computers & Mathematics | 186 | 4.2% |
| Bio, Nature & Agricultural | 271 | 6.0% |
| Physical & Health Sciences | 221 | 4.9% |
| Psychology | 172 | 3.8% |
| Social Sciences | 286 | 6.4% |
| Engineering | 295 | 6.6% |
| Multidisciplinary Studies | 38 | 0.9% |
| Science & Technology | 618 | 13.8% |
| Business | 962 | 21.4% |
| Education | 710 | 15.8% |
| Literature & Languages | 66 | 1.5% |
| Liberal Arts & History | 222 | 5.0% |
| Visual & Performing Arts | 147 | 3.3% |
| Communications | 117 | 2.6% |
| Arts & Humanities | 173 | 3.9% |
| Total | 4,484 | 100.0% |
Transportation & Commute in Mount Sinai
Vehicle Availability by Sex in Mount Sinai
The most prevalent vehicle ownership categories in Mount Sinai are males with 2 vehicles (991, accounting for 38.4%) and females with 2 vehicles (897, making up 38.4%).
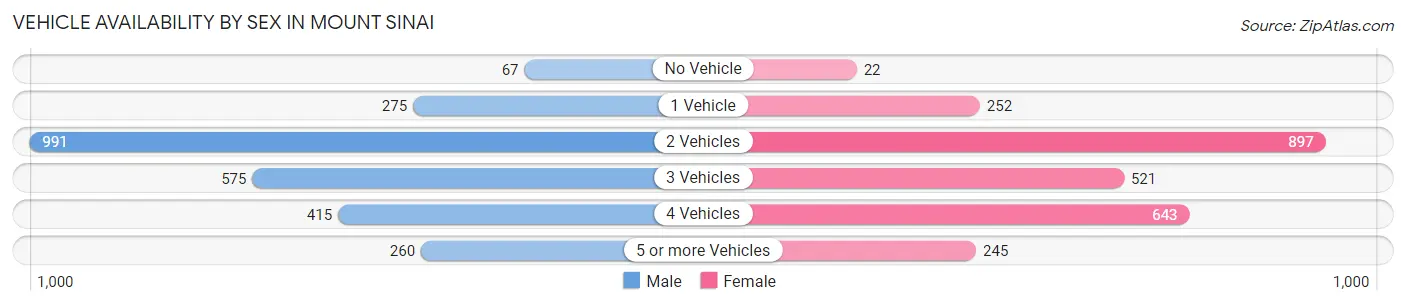
| Vehicles Available | Male | Female |
| No Vehicle | 67 (2.6%) | 22 (0.9%) |
| 1 Vehicle | 275 (10.6%) | 252 (9.8%) |
| 2 Vehicles | 991 (38.4%) | 897 (34.8%) |
| 3 Vehicles | 575 (22.3%) | 521 (20.2%) |
| 4 Vehicles | 415 (16.1%) | 643 (24.9%) |
| 5 or more Vehicles | 260 (10.1%) | 245 (9.5%) |
| Total | 2,583 (100.0%) | 2,580 (100.0%) |
Commute Time in Mount Sinai
The most frequently occuring commute durations in Mount Sinai are 20 to 24 minutes (653 commuters, 14.4%), 5 to 9 minutes (604 commuters, 13.3%), and 45 to 59 minutes (597 commuters, 13.2%).
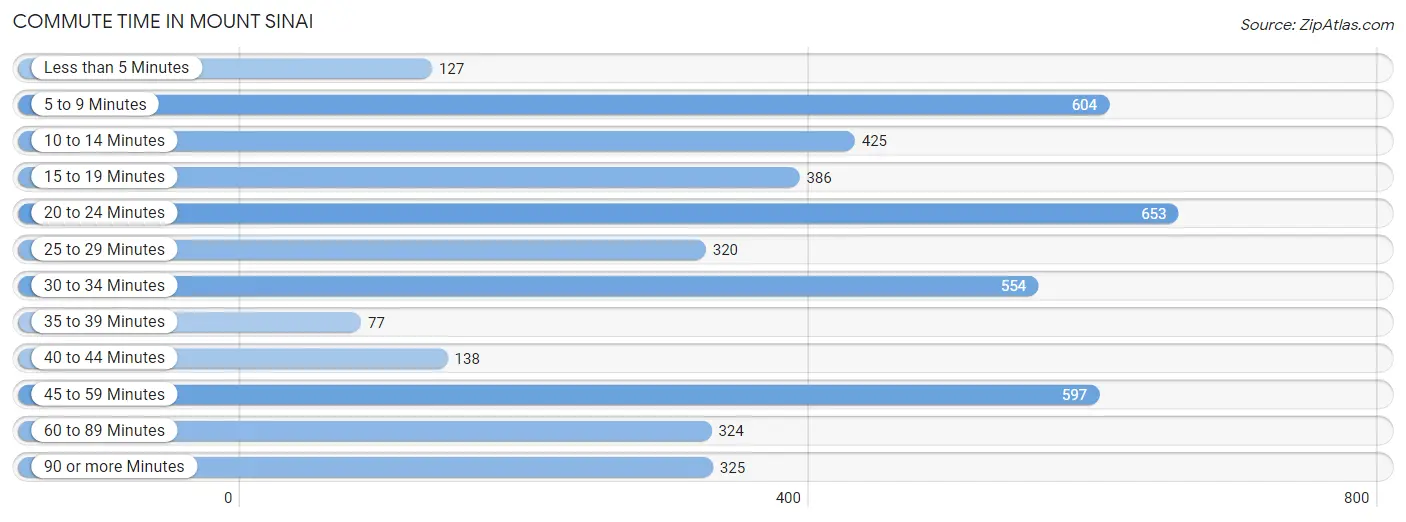
| Commute Time | # Commuters | % Commuters |
| Less than 5 Minutes | 127 | 2.8% |
| 5 to 9 Minutes | 604 | 13.3% |
| 10 to 14 Minutes | 425 | 9.4% |
| 15 to 19 Minutes | 386 | 8.5% |
| 20 to 24 Minutes | 653 | 14.4% |
| 25 to 29 Minutes | 320 | 7.1% |
| 30 to 34 Minutes | 554 | 12.2% |
| 35 to 39 Minutes | 77 | 1.7% |
| 40 to 44 Minutes | 138 | 3.0% |
| 45 to 59 Minutes | 597 | 13.2% |
| 60 to 89 Minutes | 324 | 7.1% |
| 90 or more Minutes | 325 | 7.2% |
Commute Time by Sex in Mount Sinai
The most common commute times in Mount Sinai are 30 to 34 minutes (461 commuters, 20.6%) for males and 5 to 9 minutes (407 commuters, 17.7%) for females.
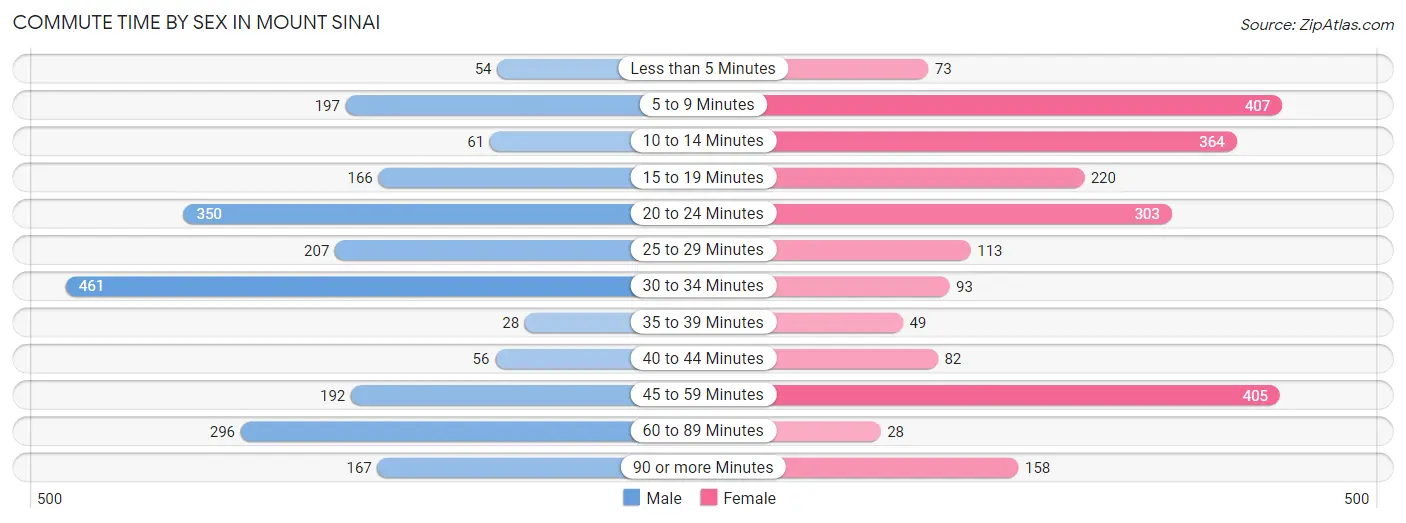
| Commute Time | Male | Female |
| Less than 5 Minutes | 54 (2.4%) | 73 (3.2%) |
| 5 to 9 Minutes | 197 (8.8%) | 407 (17.7%) |
| 10 to 14 Minutes | 61 (2.7%) | 364 (15.9%) |
| 15 to 19 Minutes | 166 (7.4%) | 220 (9.6%) |
| 20 to 24 Minutes | 350 (15.7%) | 303 (13.2%) |
| 25 to 29 Minutes | 207 (9.3%) | 113 (4.9%) |
| 30 to 34 Minutes | 461 (20.6%) | 93 (4.1%) |
| 35 to 39 Minutes | 28 (1.3%) | 49 (2.1%) |
| 40 to 44 Minutes | 56 (2.5%) | 82 (3.6%) |
| 45 to 59 Minutes | 192 (8.6%) | 405 (17.6%) |
| 60 to 89 Minutes | 296 (13.2%) | 28 (1.2%) |
| 90 or more Minutes | 167 (7.5%) | 158 (6.9%) |
Time of Departure to Work by Sex in Mount Sinai
The most frequent times of departure to work in Mount Sinai are 8:00 AM to 8:29 AM (681, 30.5%) for males and 8:00 AM to 8:29 AM (686, 29.9%) for females.
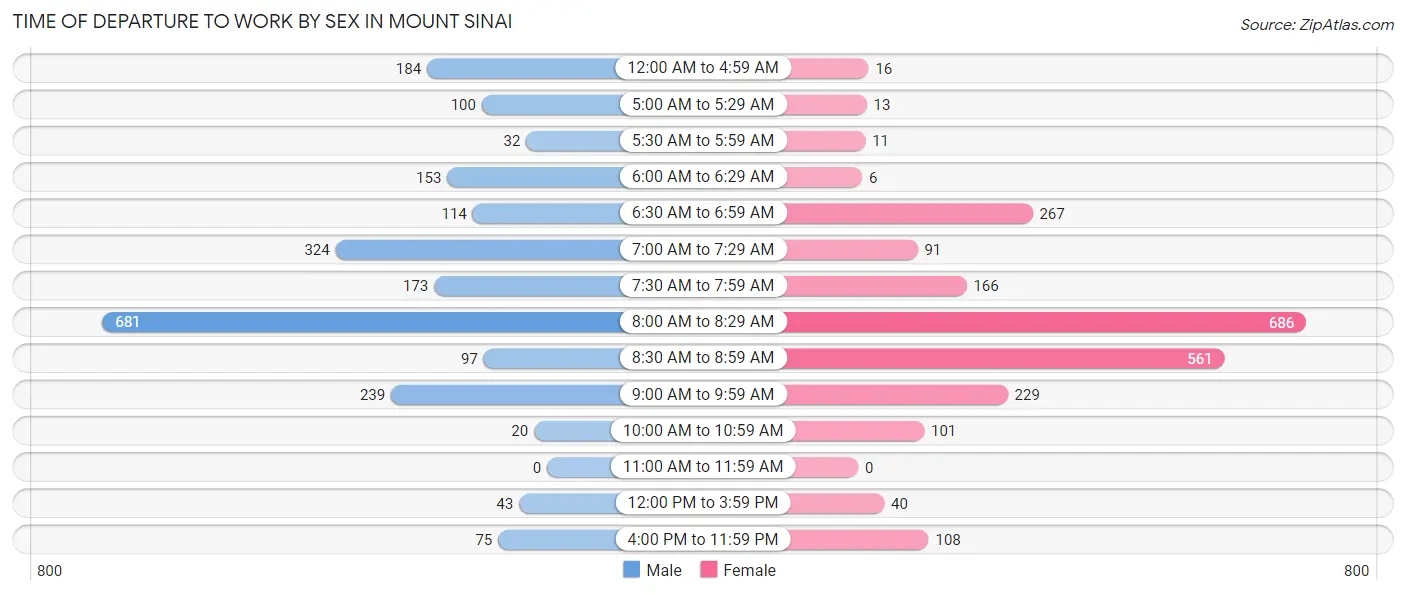
| Time of Departure | Male | Female |
| 12:00 AM to 4:59 AM | 184 (8.2%) | 16 (0.7%) |
| 5:00 AM to 5:29 AM | 100 (4.5%) | 13 (0.6%) |
| 5:30 AM to 5:59 AM | 32 (1.4%) | 11 (0.5%) |
| 6:00 AM to 6:29 AM | 153 (6.9%) | 6 (0.3%) |
| 6:30 AM to 6:59 AM | 114 (5.1%) | 267 (11.6%) |
| 7:00 AM to 7:29 AM | 324 (14.5%) | 91 (4.0%) |
| 7:30 AM to 7:59 AM | 173 (7.7%) | 166 (7.2%) |
| 8:00 AM to 8:29 AM | 681 (30.5%) | 686 (29.9%) |
| 8:30 AM to 8:59 AM | 97 (4.3%) | 561 (24.4%) |
| 9:00 AM to 9:59 AM | 239 (10.7%) | 229 (10.0%) |
| 10:00 AM to 10:59 AM | 20 (0.9%) | 101 (4.4%) |
| 11:00 AM to 11:59 AM | 0 (0.0%) | 0 (0.0%) |
| 12:00 PM to 3:59 PM | 43 (1.9%) | 40 (1.7%) |
| 4:00 PM to 11:59 PM | 75 (3.4%) | 108 (4.7%) |
| Total | 2,235 (100.0%) | 2,295 (100.0%) |
Housing Occupancy in Mount Sinai
Occupancy by Ownership in Mount Sinai
Of the total 3,860 dwellings in Mount Sinai, owner-occupied units account for 3,739 (96.9%), while renter-occupied units make up 121 (3.1%).
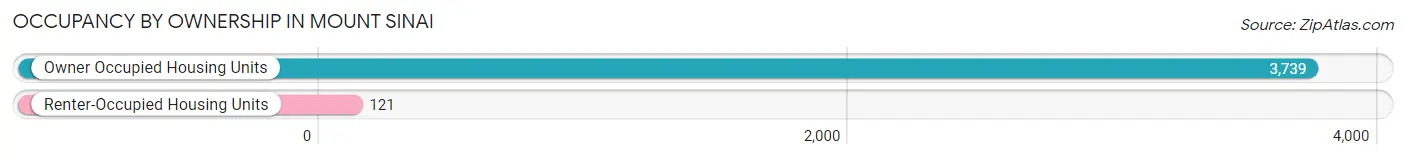
| Occupancy | # Housing Units | % Housing Units |
| Owner Occupied Housing Units | 3,739 | 96.9% |
| Renter-Occupied Housing Units | 121 | 3.1% |
| Total Occupied Housing Units | 3,860 | 100.0% |
Occupancy by Household Size in Mount Sinai
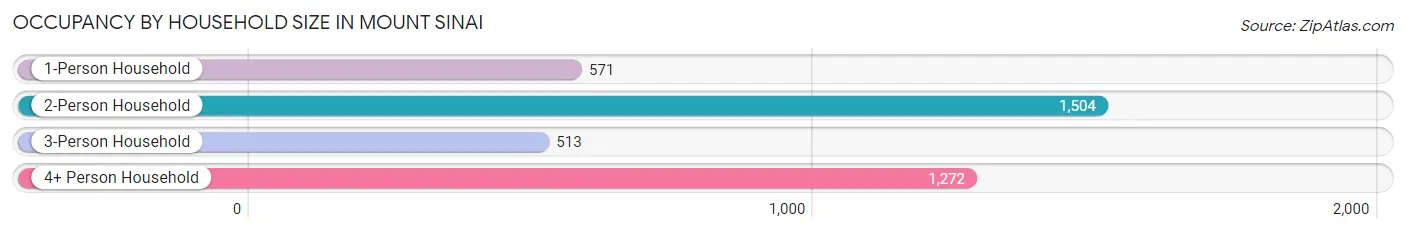
| Household Size | # Housing Units | % Housing Units |
| 1-Person Household | 571 | 14.8% |
| 2-Person Household | 1,504 | 39.0% |
| 3-Person Household | 513 | 13.3% |
| 4+ Person Household | 1,272 | 33.0% |
| Total Housing Units | 3,860 | 100.0% |
Occupancy by Ownership by Household Size in Mount Sinai
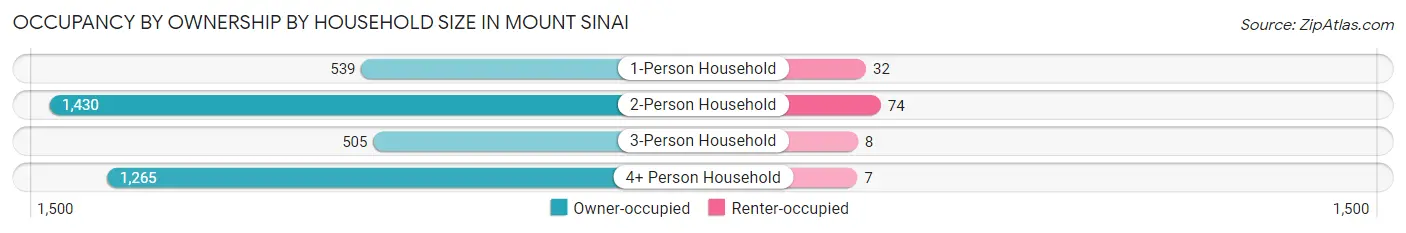
| Household Size | Owner-occupied | Renter-occupied |
| 1-Person Household | 539 (94.4%) | 32 (5.6%) |
| 2-Person Household | 1,430 (95.1%) | 74 (4.9%) |
| 3-Person Household | 505 (98.4%) | 8 (1.6%) |
| 4+ Person Household | 1,265 (99.5%) | 7 (0.5%) |
| Total Housing Units | 3,739 (96.9%) | 121 (3.1%) |
Occupancy by Educational Attainment in Mount Sinai
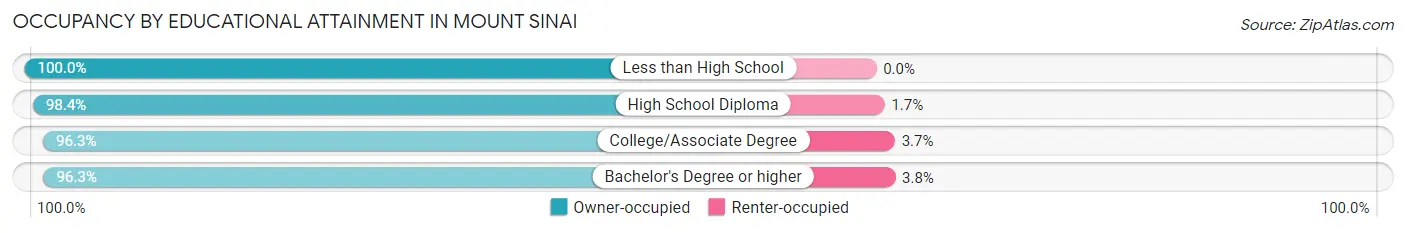
| Household Size | Owner-occupied | Renter-occupied |
| Less than High School | 175 (100.0%) | 0 (0.0%) |
| High School Diploma | 777 (98.4%) | 13 (1.7%) |
| College/Associate Degree | 758 (96.3%) | 29 (3.7%) |
| Bachelor's Degree or higher | 2,029 (96.3%) | 79 (3.7%) |
Occupancy by Age of Householder in Mount Sinai
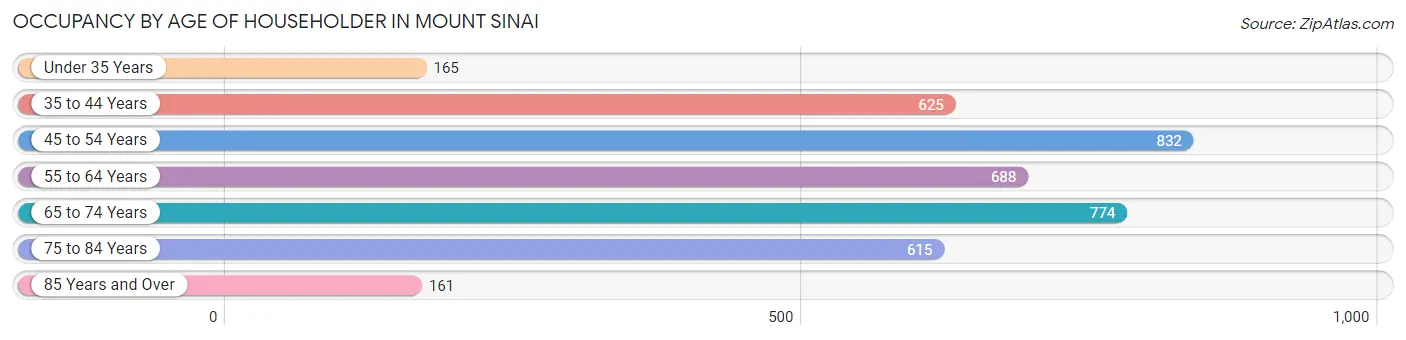
| Age Bracket | # Households | % Households |
| Under 35 Years | 165 | 4.3% |
| 35 to 44 Years | 625 | 16.2% |
| 45 to 54 Years | 832 | 21.5% |
| 55 to 64 Years | 688 | 17.8% |
| 65 to 74 Years | 774 | 20.1% |
| 75 to 84 Years | 615 | 15.9% |
| 85 Years and Over | 161 | 4.2% |
| Total | 3,860 | 100.0% |
Housing Finances in Mount Sinai
Median Income by Occupancy in Mount Sinai
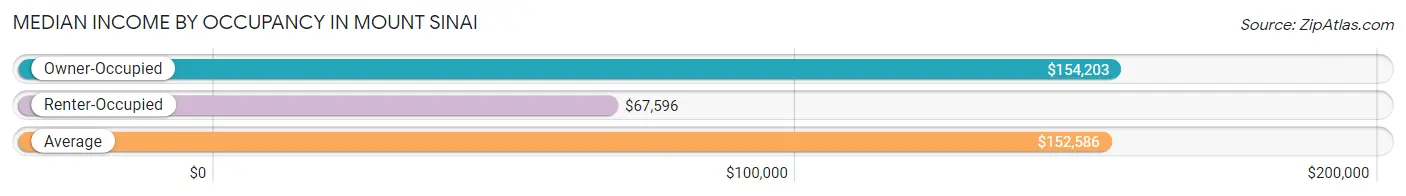
| Occupancy Type | # Households | Median Income |
| Owner-Occupied | 3,739 (96.9%) | $154,203 |
| Renter-Occupied | 121 (3.1%) | $67,596 |
| Average | 3,860 (100.0%) | $152,586 |
Occupancy by Householder Income Bracket in Mount Sinai
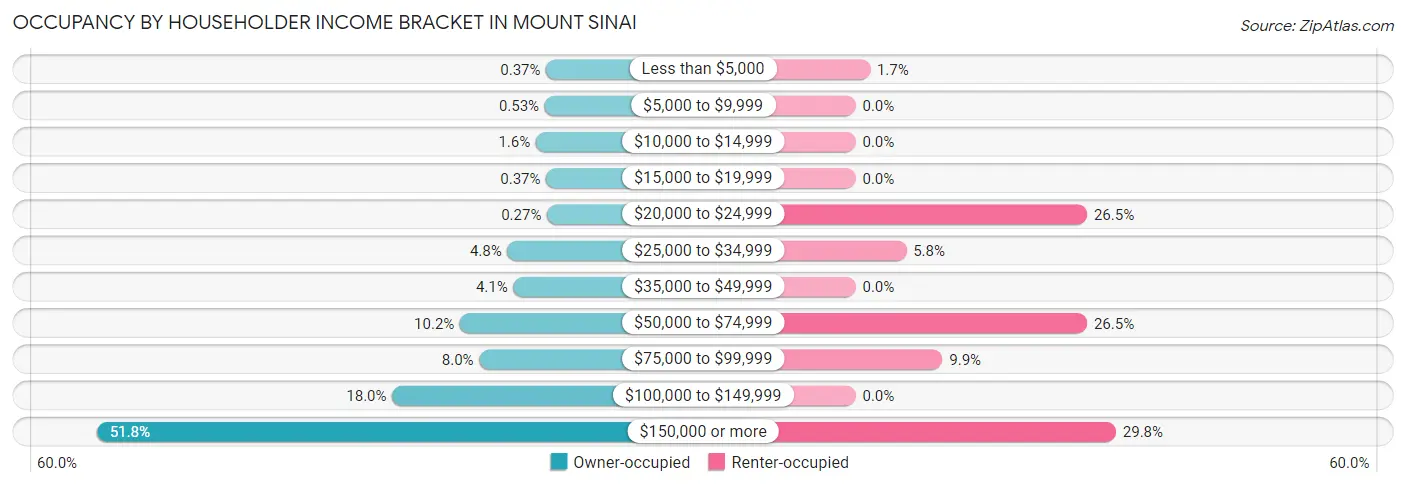
| Income Bracket | Owner-occupied | Renter-occupied |
| Less than $5,000 | 14 (0.4%) | 2 (1.7%) |
| $5,000 to $9,999 | 20 (0.5%) | 0 (0.0%) |
| $10,000 to $14,999 | 58 (1.5%) | 0 (0.0%) |
| $15,000 to $19,999 | 14 (0.4%) | 0 (0.0%) |
| $20,000 to $24,999 | 10 (0.3%) | 32 (26.5%) |
| $25,000 to $34,999 | 180 (4.8%) | 7 (5.8%) |
| $35,000 to $49,999 | 154 (4.1%) | 0 (0.0%) |
| $50,000 to $74,999 | 382 (10.2%) | 32 (26.5%) |
| $75,000 to $99,999 | 300 (8.0%) | 12 (9.9%) |
| $100,000 to $149,999 | 672 (18.0%) | 0 (0.0%) |
| $150,000 or more | 1,935 (51.7%) | 36 (29.7%) |
| Total | 3,739 (100.0%) | 121 (100.0%) |
Monthly Housing Cost Tiers in Mount Sinai
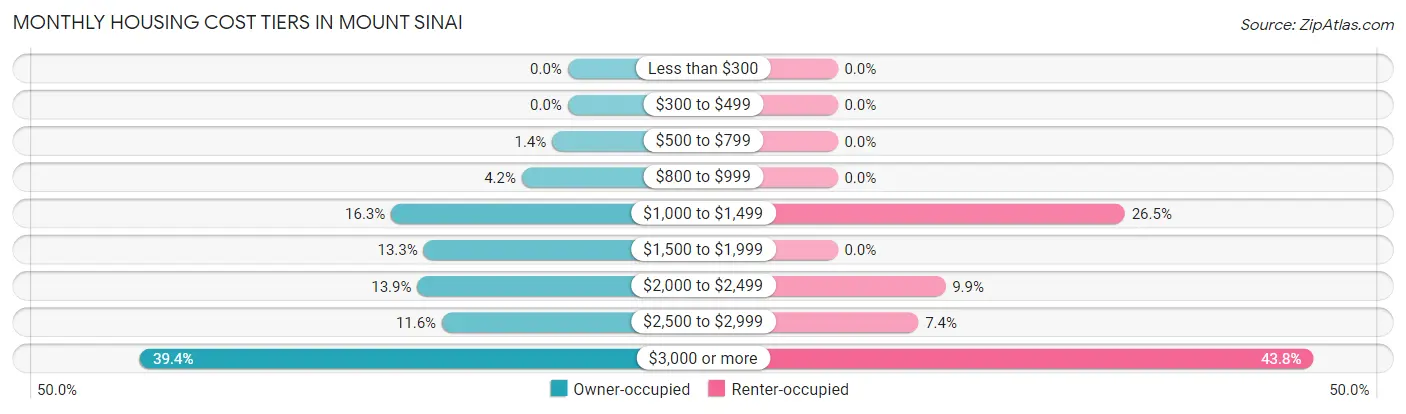
| Monthly Cost | Owner-occupied | Renter-occupied |
| Less than $300 | 0 (0.0%) | 0 (0.0%) |
| $300 to $499 | 0 (0.0%) | 0 (0.0%) |
| $500 to $799 | 54 (1.4%) | 0 (0.0%) |
| $800 to $999 | 158 (4.2%) | 0 (0.0%) |
| $1,000 to $1,499 | 608 (16.3%) | 32 (26.5%) |
| $1,500 to $1,999 | 496 (13.3%) | 0 (0.0%) |
| $2,000 to $2,499 | 518 (13.9%) | 12 (9.9%) |
| $2,500 to $2,999 | 433 (11.6%) | 9 (7.4%) |
| $3,000 or more | 1,472 (39.4%) | 53 (43.8%) |
| Total | 3,739 (100.0%) | 121 (100.0%) |
Physical Housing Characteristics in Mount Sinai
Housing Structures in Mount Sinai
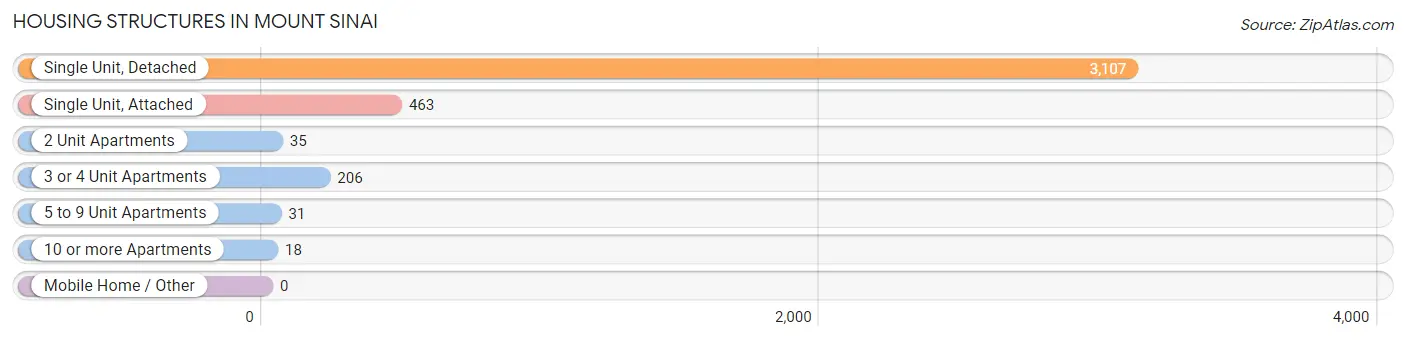
| Structure Type | # Housing Units | % Housing Units |
| Single Unit, Detached | 3,107 | 80.5% |
| Single Unit, Attached | 463 | 12.0% |
| 2 Unit Apartments | 35 | 0.9% |
| 3 or 4 Unit Apartments | 206 | 5.3% |
| 5 to 9 Unit Apartments | 31 | 0.8% |
| 10 or more Apartments | 18 | 0.5% |
| Mobile Home / Other | 0 | 0.0% |
| Total | 3,860 | 100.0% |
Housing Structures by Occupancy in Mount Sinai
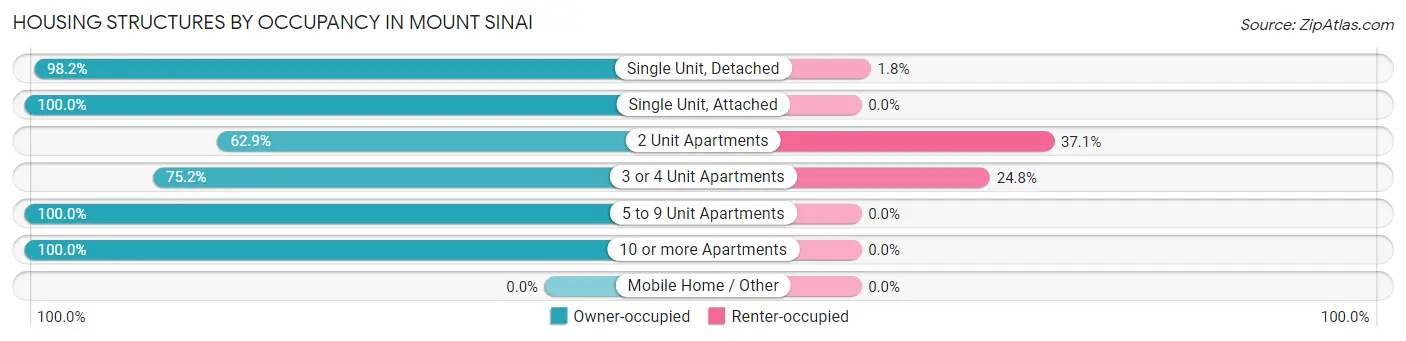
| Structure Type | Owner-occupied | Renter-occupied |
| Single Unit, Detached | 3,050 (98.2%) | 57 (1.8%) |
| Single Unit, Attached | 463 (100.0%) | 0 (0.0%) |
| 2 Unit Apartments | 22 (62.9%) | 13 (37.1%) |
| 3 or 4 Unit Apartments | 155 (75.2%) | 51 (24.8%) |
| 5 to 9 Unit Apartments | 31 (100.0%) | 0 (0.0%) |
| 10 or more Apartments | 18 (100.0%) | 0 (0.0%) |
| Mobile Home / Other | 0 (0.0%) | 0 (0.0%) |
| Total | 3,739 (96.9%) | 121 (3.1%) |
Housing Structures by Number of Rooms in Mount Sinai
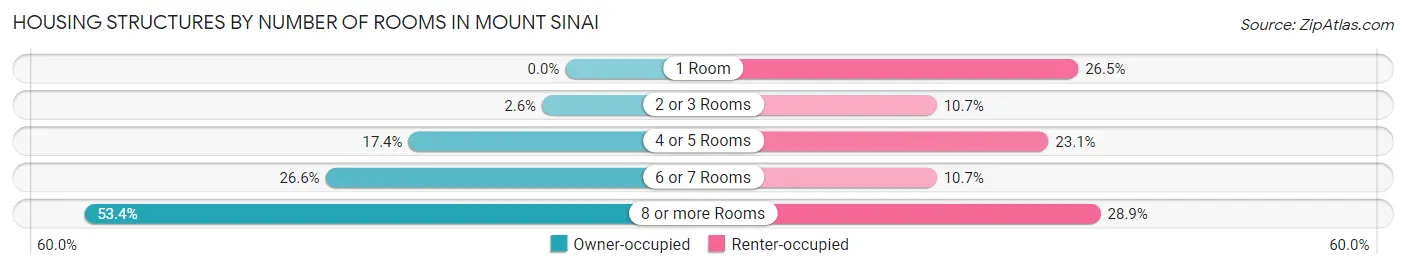
| Number of Rooms | Owner-occupied | Renter-occupied |
| 1 Room | 0 (0.0%) | 32 (26.5%) |
| 2 or 3 Rooms | 97 (2.6%) | 13 (10.7%) |
| 4 or 5 Rooms | 651 (17.4%) | 28 (23.1%) |
| 6 or 7 Rooms | 995 (26.6%) | 13 (10.7%) |
| 8 or more Rooms | 1,996 (53.4%) | 35 (28.9%) |
| Total | 3,739 (100.0%) | 121 (100.0%) |
Housing Structure by Heating Type in Mount Sinai
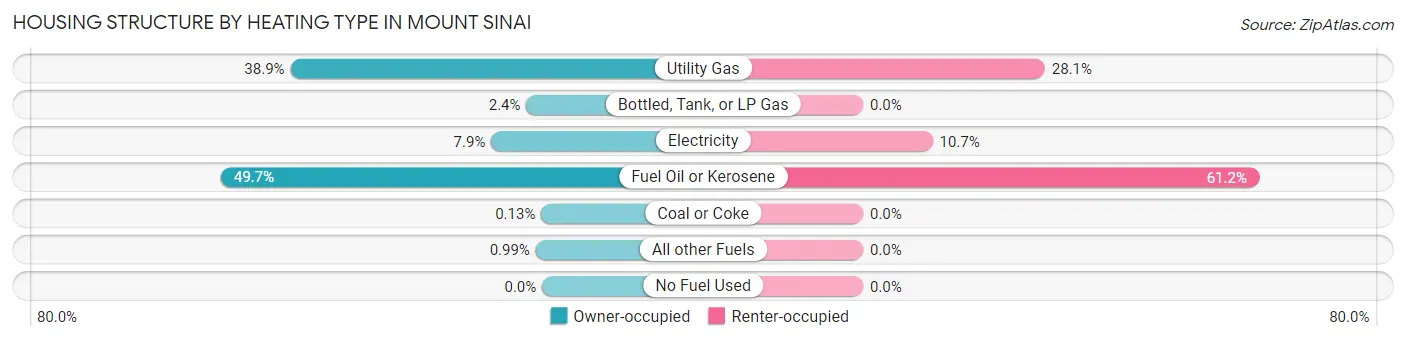
| Heating Type | Owner-occupied | Renter-occupied |
| Utility Gas | 1,455 (38.9%) | 34 (28.1%) |
| Bottled, Tank, or LP Gas | 91 (2.4%) | 0 (0.0%) |
| Electricity | 294 (7.9%) | 13 (10.7%) |
| Fuel Oil or Kerosene | 1,857 (49.7%) | 74 (61.2%) |
| Coal or Coke | 5 (0.1%) | 0 (0.0%) |
| All other Fuels | 37 (1.0%) | 0 (0.0%) |
| No Fuel Used | 0 (0.0%) | 0 (0.0%) |
| Total | 3,739 (100.0%) | 121 (100.0%) |
Household Vehicle Usage in Mount Sinai
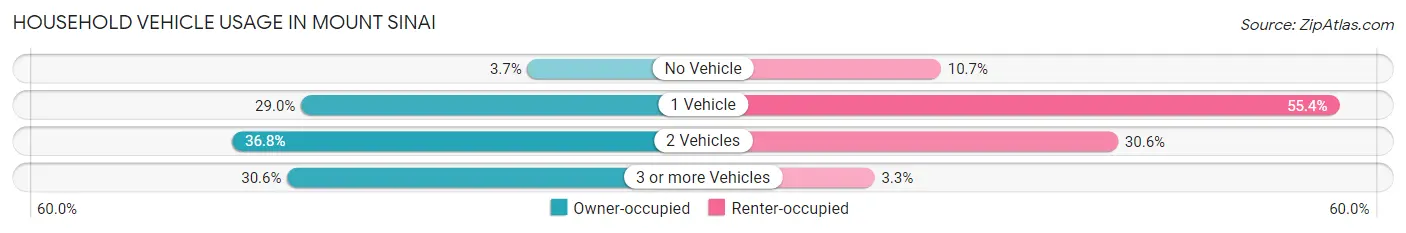
| Vehicles per Household | Owner-occupied | Renter-occupied |
| No Vehicle | 137 (3.7%) | 13 (10.7%) |
| 1 Vehicle | 1,085 (29.0%) | 67 (55.4%) |
| 2 Vehicles | 1,374 (36.7%) | 37 (30.6%) |
| 3 or more Vehicles | 1,143 (30.6%) | 4 (3.3%) |
| Total | 3,739 (100.0%) | 121 (100.0%) |
Real Estate & Mortgages in Mount Sinai
Real Estate and Mortgage Overview in Mount Sinai
| Characteristic | Without Mortgage | With Mortgage |
| Housing Units | 1,530 | 2,209 |
| Median Property Value | $596,900 | $594,200 |
| Median Household Income | $118,500 | $1,364 |
| Monthly Housing Costs | $1,501 | $1,374 |
| Real Estate Taxes | $10,001 | $59 |
Property Value by Mortgage Status in Mount Sinai
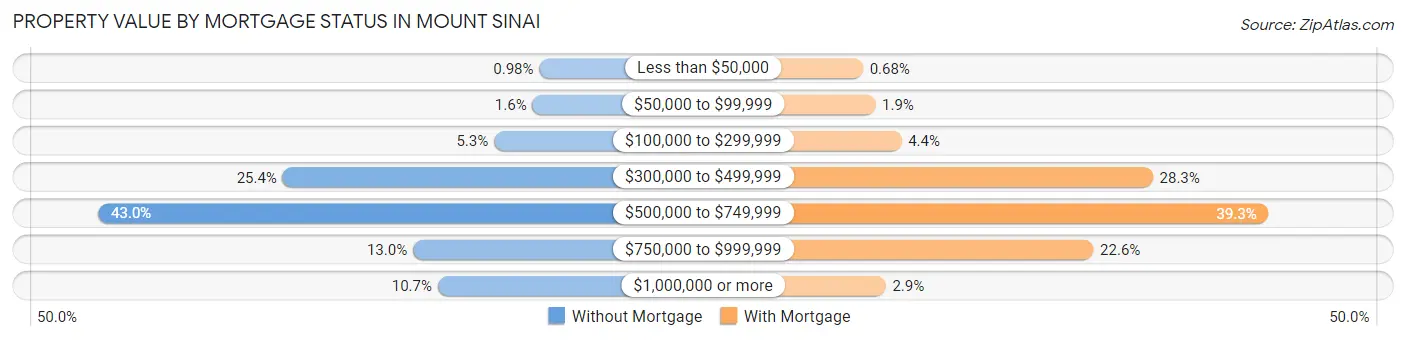
| Property Value | Without Mortgage | With Mortgage |
| Less than $50,000 | 15 (1.0%) | 15 (0.7%) |
| $50,000 to $99,999 | 25 (1.6%) | 41 (1.9%) |
| $100,000 to $299,999 | 81 (5.3%) | 96 (4.3%) |
| $300,000 to $499,999 | 389 (25.4%) | 625 (28.3%) |
| $500,000 to $749,999 | 658 (43.0%) | 869 (39.3%) |
| $750,000 to $999,999 | 199 (13.0%) | 500 (22.6%) |
| $1,000,000 or more | 163 (10.6%) | 63 (2.9%) |
| Total | 1,530 (100.0%) | 2,209 (100.0%) |
Household Income by Mortgage Status in Mount Sinai
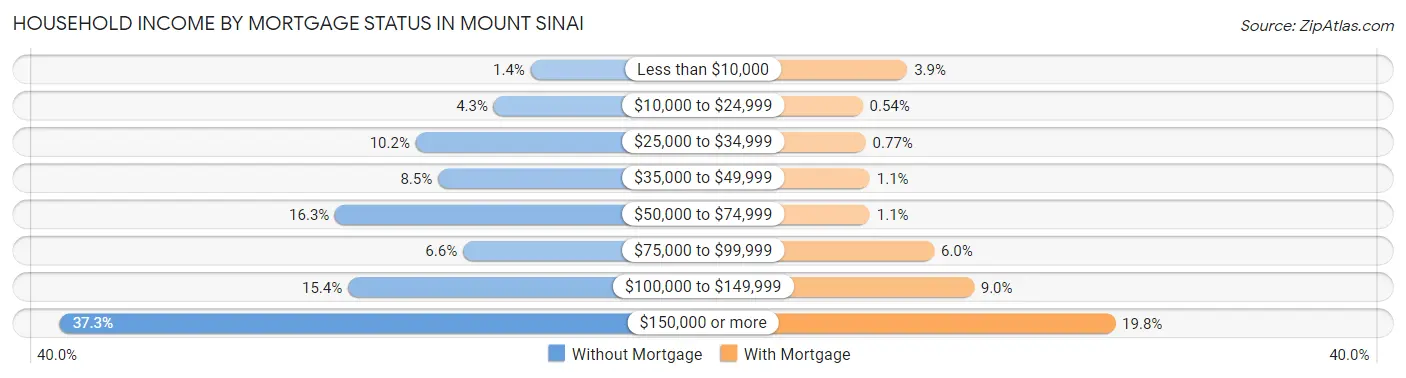
| Household Income | Without Mortgage | With Mortgage |
| Less than $10,000 | 22 (1.4%) | 87 (3.9%) |
| $10,000 to $24,999 | 65 (4.3%) | 12 (0.5%) |
| $25,000 to $34,999 | 156 (10.2%) | 17 (0.8%) |
| $35,000 to $49,999 | 130 (8.5%) | 24 (1.1%) |
| $50,000 to $74,999 | 250 (16.3%) | 24 (1.1%) |
| $75,000 to $99,999 | 101 (6.6%) | 132 (6.0%) |
| $100,000 to $149,999 | 235 (15.4%) | 199 (9.0%) |
| $150,000 or more | 571 (37.3%) | 437 (19.8%) |
| Total | 1,530 (100.0%) | 2,209 (100.0%) |
Property Value to Household Income Ratio in Mount Sinai
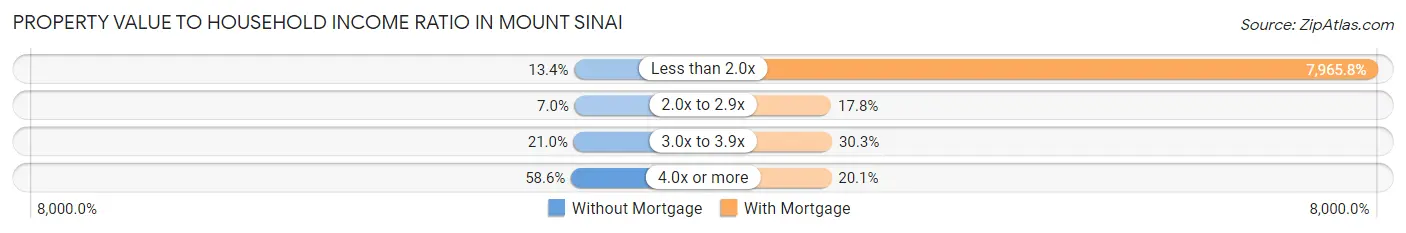
| Value-to-Income Ratio | Without Mortgage | With Mortgage |
| Less than 2.0x | 205 (13.4%) | 175,964 (7,965.8%) |
| 2.0x to 2.9x | 107 (7.0%) | 393 (17.8%) |
| 3.0x to 3.9x | 321 (21.0%) | 670 (30.3%) |
| 4.0x or more | 897 (58.6%) | 445 (20.1%) |
| Total | 1,530 (100.0%) | 2,209 (100.0%) |
Real Estate Taxes by Mortgage Status in Mount Sinai
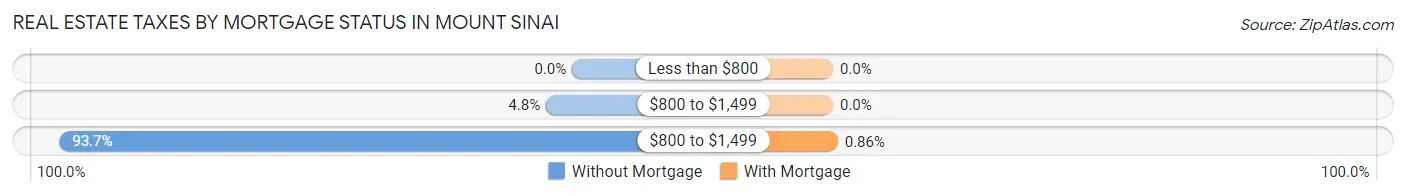
| Property Taxes | Without Mortgage | With Mortgage |
| Less than $800 | 0 (0.0%) | 0 (0.0%) |
| $800 to $1,499 | 73 (4.8%) | 0 (0.0%) |
| $800 to $1,499 | 1,433 (93.7%) | 19 (0.9%) |
| Total | 1,530 (100.0%) | 2,209 (100.0%) |
Health & Disability in Mount Sinai
Health Insurance Coverage by Age in Mount Sinai
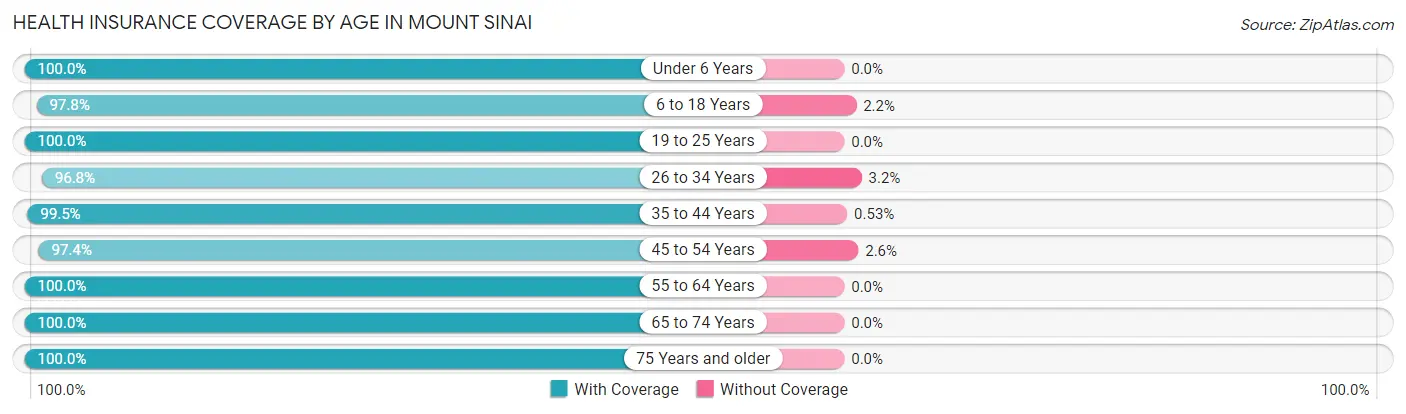
| Age Bracket | With Coverage | Without Coverage |
| Under 6 Years | 714 (100.0%) | 0 (0.0%) |
| 6 to 18 Years | 2,027 (97.8%) | 46 (2.2%) |
| 19 to 25 Years | 927 (100.0%) | 0 (0.0%) |
| 26 to 34 Years | 541 (96.8%) | 18 (3.2%) |
| 35 to 44 Years | 1,493 (99.5%) | 8 (0.5%) |
| 45 to 54 Years | 1,719 (97.4%) | 46 (2.6%) |
| 55 to 64 Years | 1,259 (100.0%) | 0 (0.0%) |
| 65 to 74 Years | 1,543 (100.0%) | 0 (0.0%) |
| 75 Years and older | 1,300 (100.0%) | 0 (0.0%) |
| Total | 11,523 (99.0%) | 118 (1.0%) |
Health Insurance Coverage by Citizenship Status in Mount Sinai
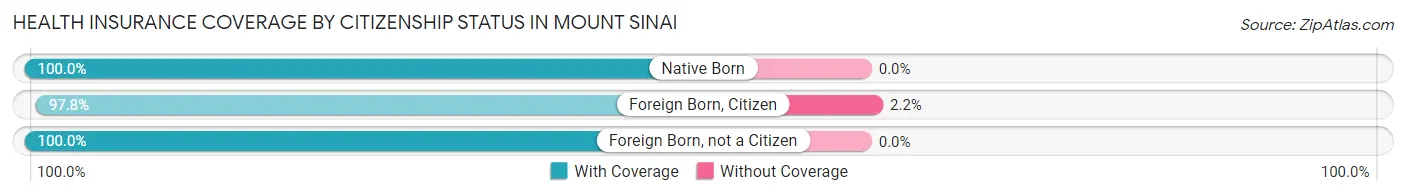
| Citizenship Status | With Coverage | Without Coverage |
| Native Born | 714 (100.0%) | 0 (0.0%) |
| Foreign Born, Citizen | 2,027 (97.8%) | 46 (2.2%) |
| Foreign Born, not a Citizen | 927 (100.0%) | 0 (0.0%) |
Health Insurance Coverage by Household Income in Mount Sinai
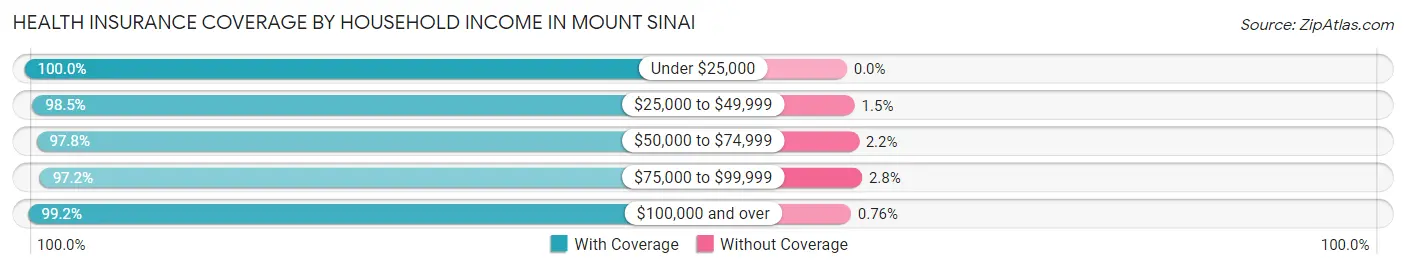
| Household Income | With Coverage | Without Coverage |
| Under $25,000 | 212 (100.0%) | 0 (0.0%) |
| $25,000 to $49,999 | 535 (98.5%) | 8 (1.5%) |
| $50,000 to $74,999 | 788 (97.8%) | 18 (2.2%) |
| $75,000 to $99,999 | 754 (97.2%) | 22 (2.8%) |
| $100,000 and over | 9,185 (99.2%) | 70 (0.8%) |
Public vs Private Health Insurance Coverage by Age in Mount Sinai
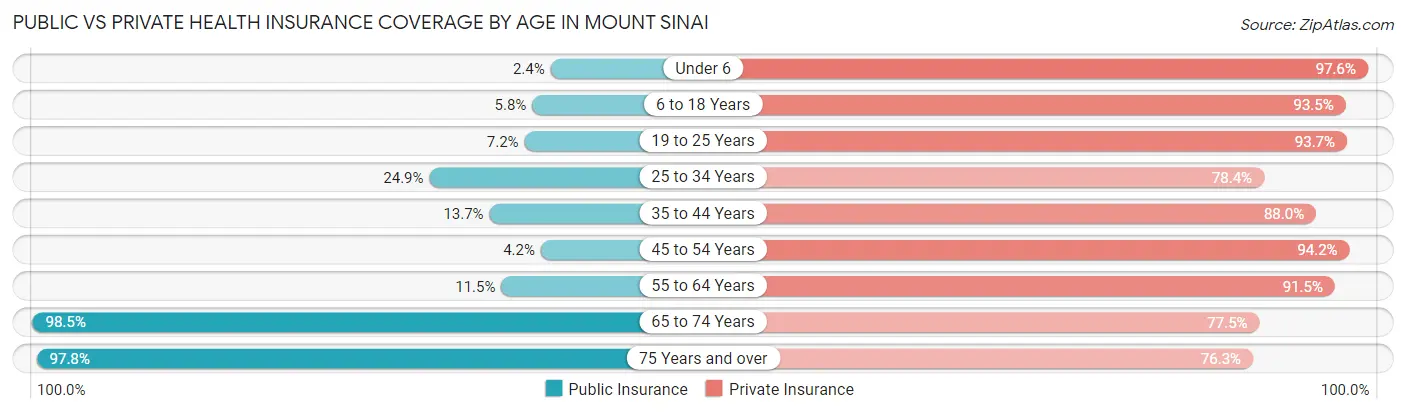
| Age Bracket | Public Insurance | Private Insurance |
| Under 6 | 17 (2.4%) | 697 (97.6%) |
| 6 to 18 Years | 120 (5.8%) | 1,938 (93.5%) |
| 19 to 25 Years | 67 (7.2%) | 869 (93.7%) |
| 25 to 34 Years | 139 (24.9%) | 438 (78.3%) |
| 35 to 44 Years | 206 (13.7%) | 1,321 (88.0%) |
| 45 to 54 Years | 74 (4.2%) | 1,663 (94.2%) |
| 55 to 64 Years | 145 (11.5%) | 1,152 (91.5%) |
| 65 to 74 Years | 1,520 (98.5%) | 1,196 (77.5%) |
| 75 Years and over | 1,271 (97.8%) | 992 (76.3%) |
| Total | 3,559 (30.6%) | 10,266 (88.2%) |
Disability Status by Sex by Age in Mount Sinai
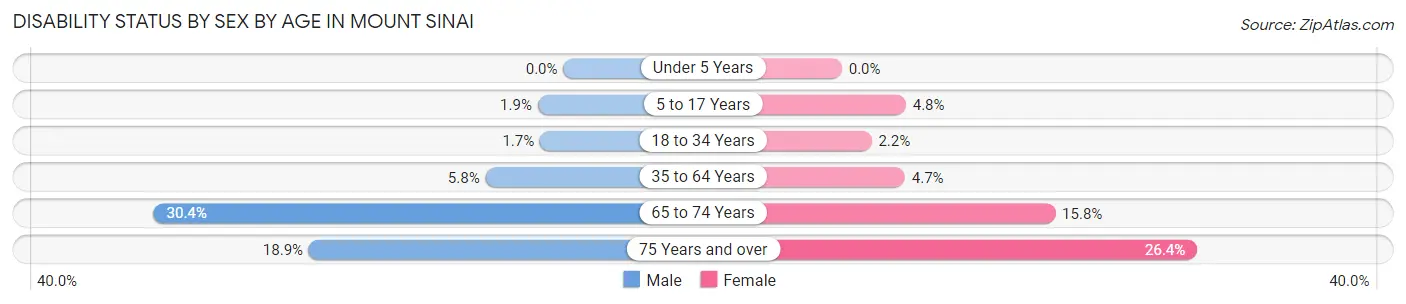
| Age Bracket | Male | Female |
| Under 5 Years | 0 (0.0%) | 0 (0.0%) |
| 5 to 17 Years | 24 (1.9%) | 43 (4.8%) |
| 18 to 34 Years | 13 (1.7%) | 19 (2.2%) |
| 35 to 64 Years | 132 (5.8%) | 105 (4.7%) |
| 65 to 74 Years | 237 (30.4%) | 121 (15.8%) |
| 75 Years and over | 126 (18.9%) | 167 (26.4%) |
Disability Class by Sex by Age in Mount Sinai
Disability Class: Hearing Difficulty
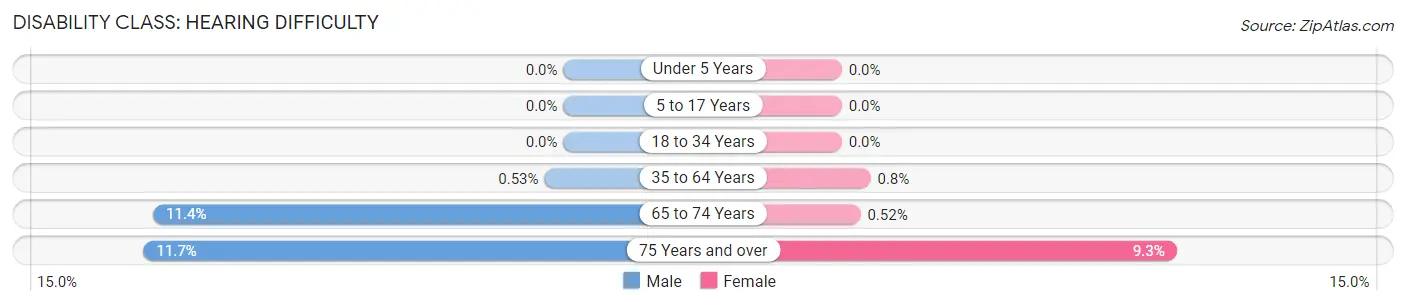
| Age Bracket | Male | Female |
| Under 5 Years | 0 (0.0%) | 0 (0.0%) |
| 5 to 17 Years | 0 (0.0%) | 0 (0.0%) |
| 18 to 34 Years | 0 (0.0%) | 0 (0.0%) |
| 35 to 64 Years | 12 (0.5%) | 18 (0.8%) |
| 65 to 74 Years | 89 (11.4%) | 4 (0.5%) |
| 75 Years and over | 78 (11.7%) | 59 (9.3%) |
Disability Class: Vision Difficulty
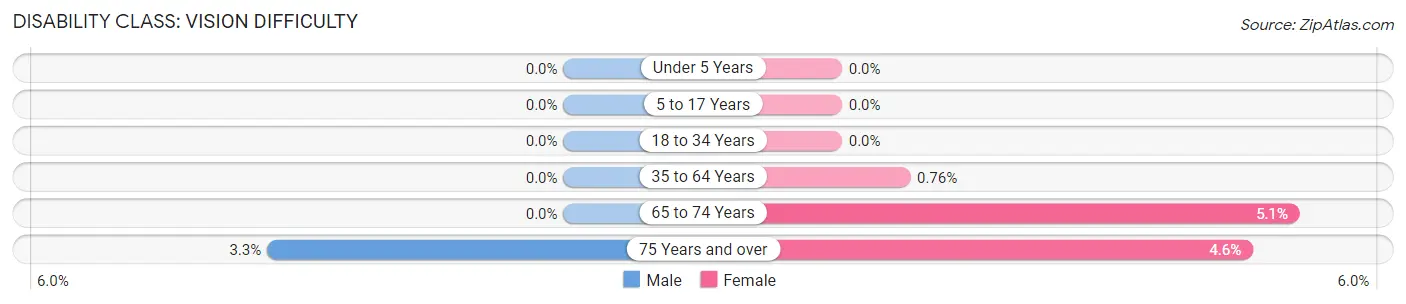
| Age Bracket | Male | Female |
| Under 5 Years | 0 (0.0%) | 0 (0.0%) |
| 5 to 17 Years | 0 (0.0%) | 0 (0.0%) |
| 18 to 34 Years | 0 (0.0%) | 0 (0.0%) |
| 35 to 64 Years | 0 (0.0%) | 17 (0.8%) |
| 65 to 74 Years | 0 (0.0%) | 39 (5.1%) |
| 75 Years and over | 22 (3.3%) | 29 (4.6%) |
Disability Class: Cognitive Difficulty
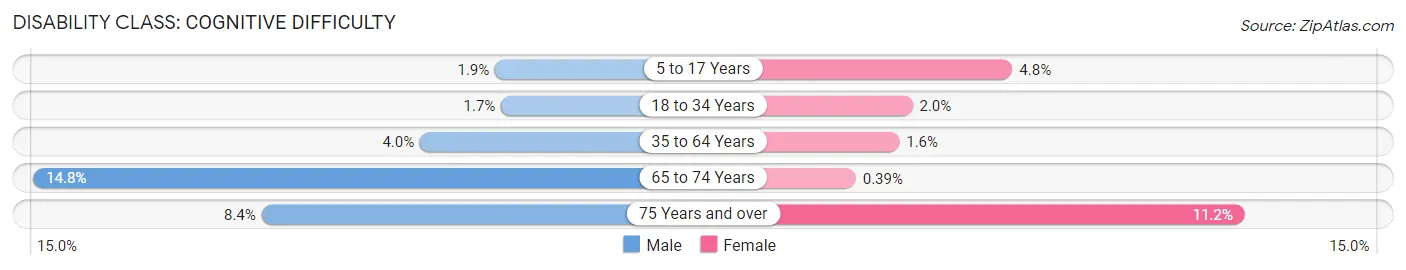
| Age Bracket | Male | Female |
| 5 to 17 Years | 24 (1.9%) | 43 (4.8%) |
| 18 to 34 Years | 13 (1.7%) | 17 (2.0%) |
| 35 to 64 Years | 91 (4.0%) | 36 (1.6%) |
| 65 to 74 Years | 115 (14.8%) | 3 (0.4%) |
| 75 Years and over | 56 (8.4%) | 71 (11.2%) |
Disability Class: Ambulatory Difficulty
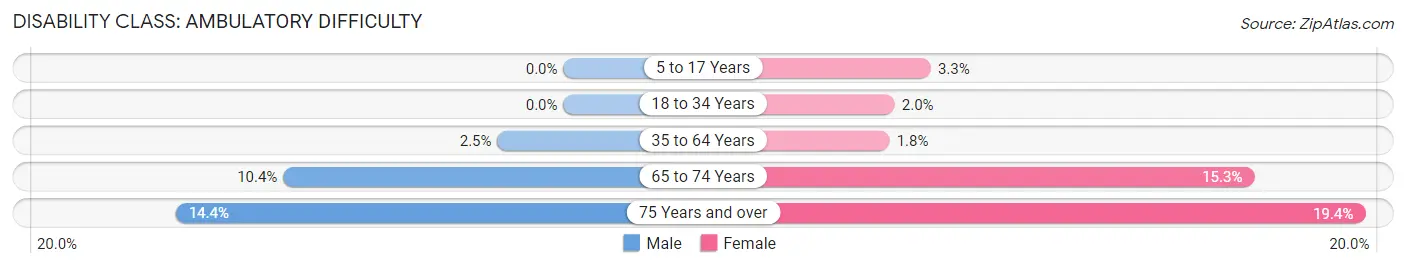
| Age Bracket | Male | Female |
| 5 to 17 Years | 0 (0.0%) | 30 (3.3%) |
| 18 to 34 Years | 0 (0.0%) | 17 (2.0%) |
| 35 to 64 Years | 56 (2.5%) | 40 (1.8%) |
| 65 to 74 Years | 81 (10.4%) | 117 (15.3%) |
| 75 Years and over | 96 (14.4%) | 123 (19.4%) |
Disability Class: Self-Care Difficulty
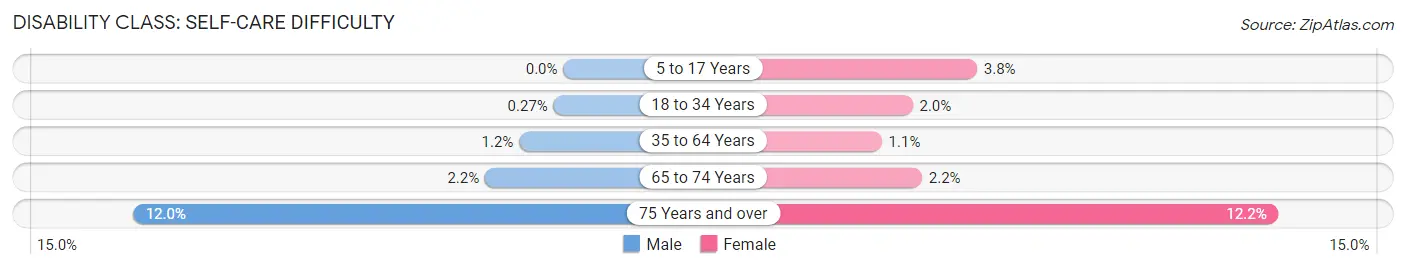
| Age Bracket | Male | Female |
| 5 to 17 Years | 0 (0.0%) | 34 (3.8%) |
| 18 to 34 Years | 2 (0.3%) | 17 (2.0%) |
| 35 to 64 Years | 28 (1.2%) | 25 (1.1%) |
| 65 to 74 Years | 17 (2.2%) | 17 (2.2%) |
| 75 Years and over | 80 (12.0%) | 77 (12.2%) |
Technology Access in Mount Sinai
Computing Device Access in Mount Sinai
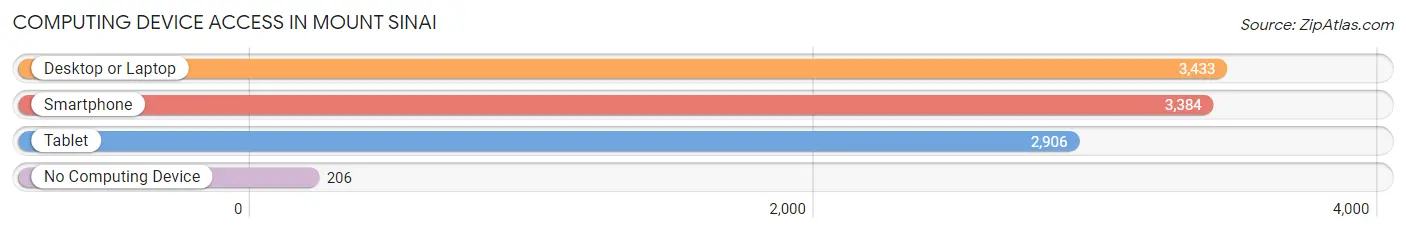
| Device Type | # Households | % Households |
| Desktop or Laptop | 3,433 | 88.9% |
| Smartphone | 3,384 | 87.7% |
| Tablet | 2,906 | 75.3% |
| No Computing Device | 206 | 5.3% |
| Total | 3,860 | 100.0% |
Internet Access in Mount Sinai
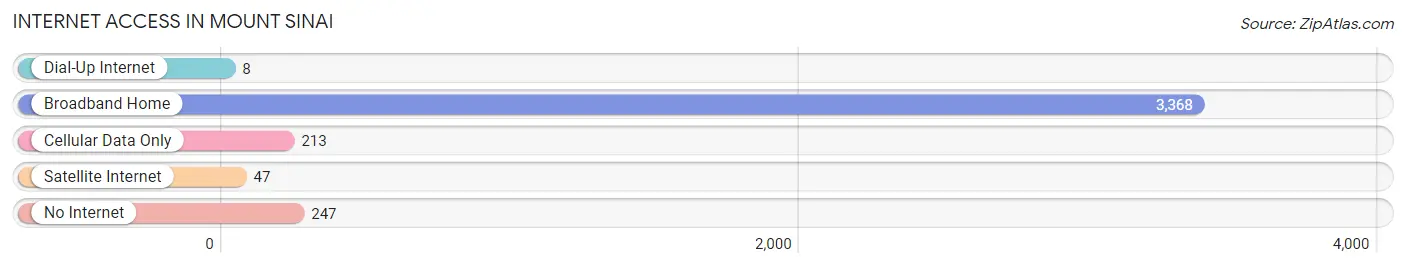
| Internet Type | # Households | % Households |
| Dial-Up Internet | 8 | 0.2% |
| Broadband Home | 3,368 | 87.3% |
| Cellular Data Only | 213 | 5.5% |
| Satellite Internet | 47 | 1.2% |
| No Internet | 247 | 6.4% |
| Total | 3,860 | 100.0% |
Mount Sinai Summary
Sinai, New York is a hamlet located in the Town of Brookhaven in Suffolk County, New York. It is located on the north shore of Long Island, approximately 60 miles east of New York City. The hamlet is bordered by the hamlets of Port Jefferson Station to the west, Miller Place to the east, and Mount Sinai Harbor to the south.
History
The area now known as Mount Sinai was originally inhabited by the Setalcott Indians, a branch of the Algonquin tribe. The first European settlers arrived in the area in the late 1600s, and the hamlet was officially established in 1788. The hamlet was named after the biblical Mount Sinai, and the first church in the area was named after the mountain.
In the late 1800s, the hamlet began to grow as a summer resort destination. The area was known for its beautiful beaches and scenic views of the Long Island Sound. The hamlet also became a popular spot for fishing and hunting.
In the early 1900s, the hamlet began to develop into a residential community. The hamlet was home to several large estates, and many of the original homes still stand today. The hamlet also became home to several businesses, including a post office, a general store, and a blacksmith shop.
Geography
Mount Sinai is located on the north shore of Long Island, approximately 60 miles east of New York City. The hamlet is bordered by the hamlets of Port Jefferson Station to the west, Miller Place to the east, and Mount Sinai Harbor to the south. The hamlet is situated on a peninsula, with the Long Island Sound to the north and the Mount Sinai Harbor to the south.
The hamlet is home to several parks, including Mount Sinai Harbor Park, which offers a beach, picnic areas, and a boat launch. The hamlet is also home to several nature preserves, including the Mount Sinai Nature Preserve, which offers hiking trails and wildlife viewing opportunities.
Economy
The economy of Mount Sinai is largely based on tourism and retail. The hamlet is home to several restaurants, shops, and other businesses. The hamlet is also home to several marinas, which offer boat rentals and other services.
The hamlet is also home to several medical facilities, including the Mount Sinai Hospital and the Mount Sinai Medical Center. The hamlet is also home to several educational institutions, including the Mount Sinai School District and the Mount Sinai High School.
Demographics
As of the 2010 census, the population of Mount Sinai was 10,822. The racial makeup of the hamlet was 94.3% White, 1.7% African American, 0.3% Native American, 1.2% Asian, 0.1% Pacific Islander, 1.2% from other races, and 1.3% from two or more races. Hispanic or Latino of any race were 4.3% of the population.
The median household income in Mount Sinai was $97,917, and the median family income was $106,917. The per capita income in the hamlet was $41,945. About 2.7% of families and 3.7% of the population were below the poverty line, including 4.3% of those under age 18 and 2.2% of those age 65 or over.
Common Questions
What is Per Capita Income in Mount Sinai?
Per Capita income in Mount Sinai is $59,994.
What is the Median Family Income in Mount Sinai?
Median Family Income in Mount Sinai is $170,030.
What is the Median Household income in Mount Sinai?
Median Household Income in Mount Sinai is $152,586.
What is Income or Wage Gap in Mount Sinai?
Income or Wage Gap in Mount Sinai is 34.9%.
Women in Mount Sinai earn 65.1 cents for every dollar earned by a man.
What is Family Income Deficit in Mount Sinai?
Family Income Deficit in Mount Sinai is $7,127.
Families that are below poverty line in Mount Sinai earn $7,127 less on average than the poverty threshold level.
What is Inequality or Gini Index in Mount Sinai?
Inequality or Gini Index in Mount Sinai is 0.38.
What is the Total Population of Mount Sinai?
Total Population of Mount Sinai is 11,641.
What is the Total Male Population of Mount Sinai?
Total Male Population of Mount Sinai is 6,082.
What is the Total Female Population of Mount Sinai?
Total Female Population of Mount Sinai is 5,559.
What is the Ratio of Males per 100 Females in Mount Sinai?
There are 109.41 Males per 100 Females in Mount Sinai.
What is the Ratio of Females per 100 Males in Mount Sinai?
There are 91.40 Females per 100 Males in Mount Sinai.
What is the Median Population Age in Mount Sinai?
Median Population Age in Mount Sinai is 45.3 Years.
What is the Average Family Size in Mount Sinai
Average Family Size in Mount Sinai is 3.4 People.
What is the Average Household Size in Mount Sinai
Average Household Size in Mount Sinai is 3.0 People.
How Large is the Labor Force in Mount Sinai?
There are 5,625 People in the Labor Forcein in Mount Sinai.
What is the Percentage of People in the Labor Force in Mount Sinai?
60.1% of People are in the Labor Force in Mount Sinai.
What is the Unemployment Rate in Mount Sinai?
Unemployment Rate in Mount Sinai is 6.1%.