North Merrick, NY Map & Demographics
North Merrick Map
North Merrick Overview
$62,130
PER CAPITA INCOME
$168,750
AVG FAMILY INCOME
$154,179
AVG HOUSEHOLD INCOME
31.5%
WAGE / INCOME GAP [ % ]
68.5¢/ $1
WAGE / INCOME GAP [ $ ]
0.40
INEQUALITY / GINI INDEX
12,192
TOTAL POPULATION
6,230
MALE POPULATION
5,962
FEMALE POPULATION
104.50
MALES / 100 FEMALES
95.70
FEMALES / 100 MALES
42.2
MEDIAN AGE
3.3
AVG FAMILY SIZE
3.0
AVG HOUSEHOLD SIZE
6,645
LABOR FORCE [ PEOPLE ]
67.7%
PERCENT IN LABOR FORCE
2.6%
UNEMPLOYMENT RATE
North Merrick Area Codes
Income in North Merrick
Income Overview in North Merrick
Per Capita Income in North Merrick is $62,130, while median incomes of families and households are $168,750 and $154,179 respectively.
| Characteristic | Number | Measure |
| Per Capita Income | 12,192 | $62,130 |
| Median Family Income | 3,320 | $168,750 |
| Mean Family Income | 3,320 | $203,524 |
| Median Household Income | 4,043 | $154,179 |
| Mean Household Income | 4,043 | $182,012 |
| Income Deficit | 3,320 | $0 |
| Wage / Income Gap (%) | 12,192 | 31.50% |
| Wage / Income Gap ($) | 12,192 | 68.50¢ per $1 |
| Gini / Inequality Index | 12,192 | 0.40 |
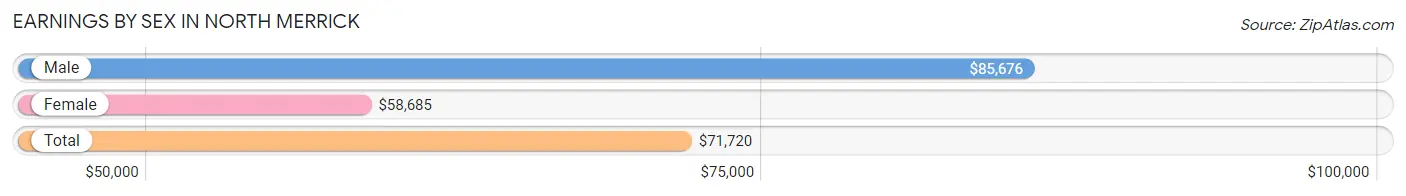
Earnings by Sex in North Merrick
Average Earnings in North Merrick are $71,720, $85,676 for men and $58,685 for women, a difference of 31.5%.
| Sex | Number | Average Earnings |
| Male | 3,848 (55.8%) | $85,676 |
| Female | 3,043 (44.2%) | $58,685 |
| Total | 6,891 (100.0%) | $71,720 |
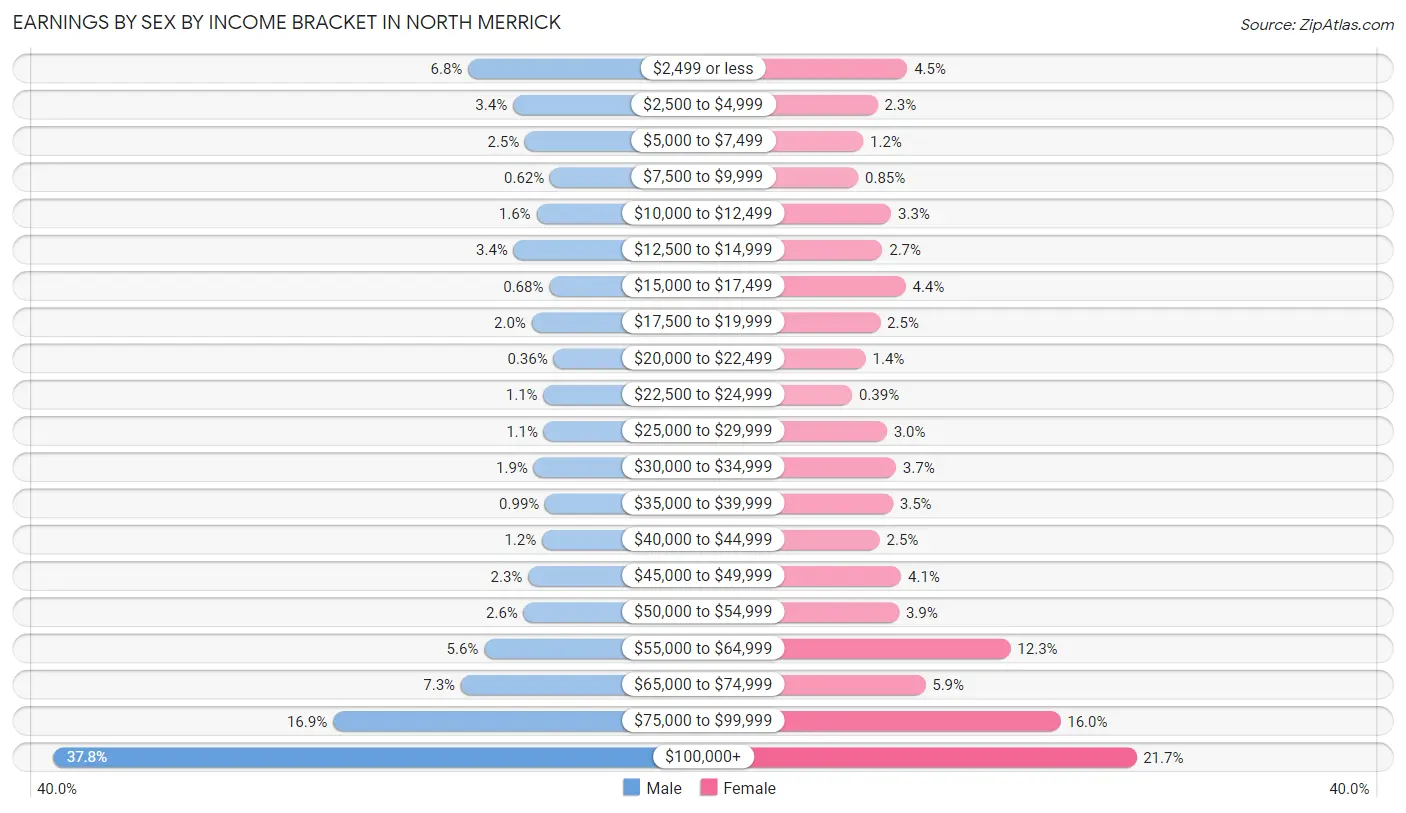
Earnings by Sex by Income Bracket in North Merrick
The most common earnings brackets in North Merrick are $100,000+ for men (1,455 | 37.8%) and $100,000+ for women (660 | 21.7%).
| Income | Male | Female |
| $2,499 or less | 260 (6.8%) | 138 (4.5%) |
| $2,500 to $4,999 | 131 (3.4%) | 70 (2.3%) |
| $5,000 to $7,499 | 96 (2.5%) | 37 (1.2%) |
| $7,500 to $9,999 | 24 (0.6%) | 26 (0.9%) |
| $10,000 to $12,499 | 63 (1.6%) | 101 (3.3%) |
| $12,500 to $14,999 | 129 (3.4%) | 81 (2.7%) |
| $15,000 to $17,499 | 26 (0.7%) | 134 (4.4%) |
| $17,500 to $19,999 | 77 (2.0%) | 76 (2.5%) |
| $20,000 to $22,499 | 14 (0.4%) | 43 (1.4%) |
| $22,500 to $24,999 | 43 (1.1%) | 12 (0.4%) |
| $25,000 to $29,999 | 42 (1.1%) | 91 (3.0%) |
| $30,000 to $34,999 | 71 (1.8%) | 112 (3.7%) |
| $35,000 to $39,999 | 38 (1.0%) | 105 (3.5%) |
| $40,000 to $44,999 | 47 (1.2%) | 75 (2.5%) |
| $45,000 to $49,999 | 87 (2.3%) | 124 (4.1%) |
| $50,000 to $54,999 | 100 (2.6%) | 119 (3.9%) |
| $55,000 to $64,999 | 214 (5.6%) | 373 (12.3%) |
| $65,000 to $74,999 | 281 (7.3%) | 179 (5.9%) |
| $75,000 to $99,999 | 650 (16.9%) | 487 (16.0%) |
| $100,000+ | 1,455 (37.8%) | 660 (21.7%) |
| Total | 3,848 (100.0%) | 3,043 (100.0%) |
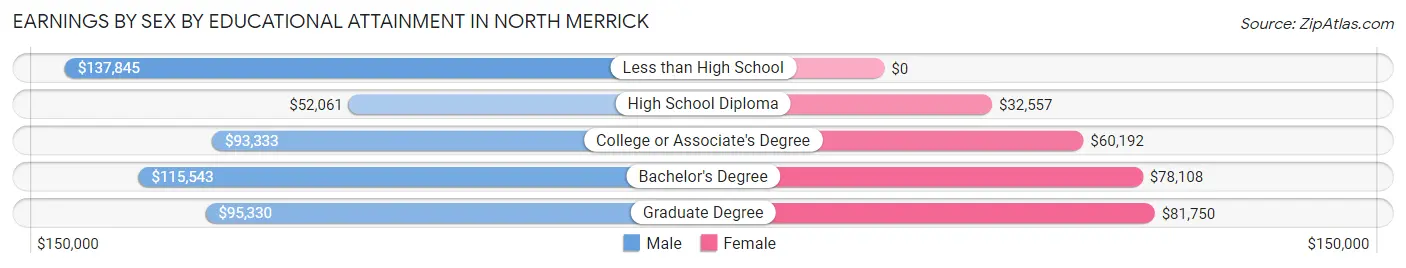
Earnings by Sex by Educational Attainment in North Merrick
Average earnings in North Merrick are $92,490 for men and $63,917 for women, a difference of 30.9%. Men with an educational attainment of less than high school enjoy the highest average annual earnings of $137,845, while those with high school diploma education earn the least with $52,061. Women with an educational attainment of graduate degree earn the most with the average annual earnings of $81,750, while those with high school diploma education have the smallest earnings of $32,557.
| Educational Attainment | Male Income | Female Income |
| Less than High School | $137,845 | $0 |
| High School Diploma | $52,061 | $32,557 |
| College or Associate's Degree | $93,333 | $60,192 |
| Bachelor's Degree | $115,543 | $78,108 |
| Graduate Degree | $95,330 | $81,750 |
| Total | $92,490 | $63,917 |
Family Income in North Merrick
Family Income Brackets in North Merrick
According to the North Merrick family income data, there are 1,371 families falling into the $200,000+ income range, which is the most common income bracket and makes up 41.3% of all families. Conversely, the less than $10,000 income bracket is the least frequent group with only 7 families (0.2%) belonging to this category.
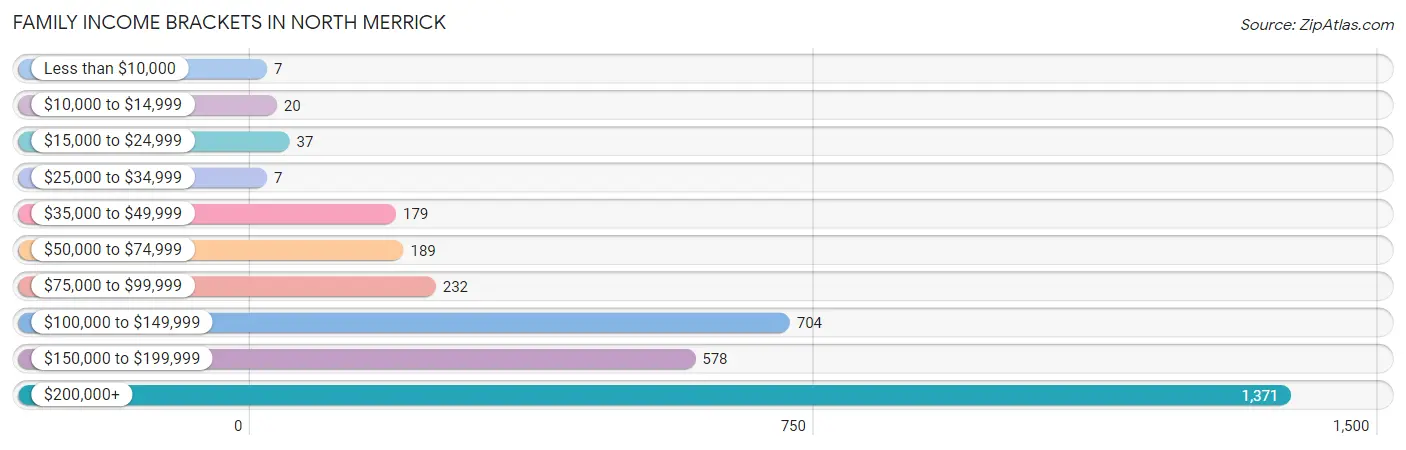
| Income Bracket | # Families | % Families |
| Less than $10,000 | 7 | 0.2% |
| $10,000 to $14,999 | 20 | 0.6% |
| $15,000 to $24,999 | 37 | 1.1% |
| $25,000 to $34,999 | 7 | 0.2% |
| $35,000 to $49,999 | 179 | 5.4% |
| $50,000 to $74,999 | 189 | 5.7% |
| $75,000 to $99,999 | 232 | 7.0% |
| $100,000 to $149,999 | 704 | 21.2% |
| $150,000 to $199,999 | 578 | 17.4% |
| $200,000+ | 1,371 | 41.3% |
Family Income by Famaliy Size in North Merrick
6-person families (34 | 1.0%) account for the highest median family income in North Merrick with $201,786 per family, while 2-person families (1,143 | 34.4%) have the highest median income of $69,458 per family member.
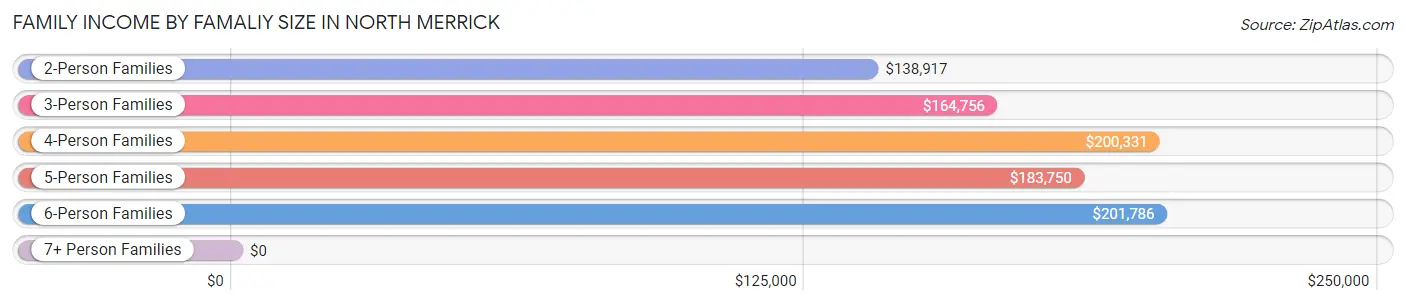
| Income Bracket | # Families | Median Income |
| 2-Person Families | 1,143 (34.4%) | $138,917 |
| 3-Person Families | 878 (26.5%) | $164,756 |
| 4-Person Families | 979 (29.5%) | $200,331 |
| 5-Person Families | 266 (8.0%) | $183,750 |
| 6-Person Families | 34 (1.0%) | $201,786 |
| 7+ Person Families | 20 (0.6%) | $0 |
| Total | 3,320 (100.0%) | $168,750 |
Family Income by Number of Earners in North Merrick
The median family income in North Merrick is $168,750, with families comprising 3+ earners (578) having the highest median family income of $241,389, while families with no earners (395) have the lowest median family income of $62,961, accounting for 17.4% and 11.9% of families, respectively.
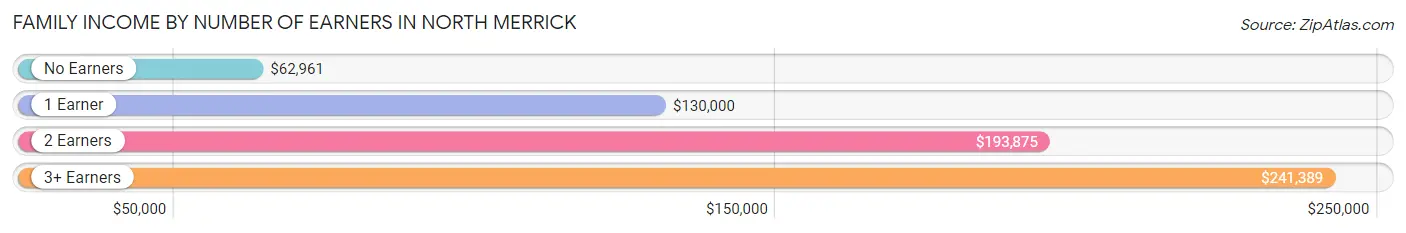
| Number of Earners | # Families | Median Income |
| No Earners | 395 (11.9%) | $62,961 |
| 1 Earner | 762 (23.0%) | $130,000 |
| 2 Earners | 1,585 (47.7%) | $193,875 |
| 3+ Earners | 578 (17.4%) | $241,389 |
| Total | 3,320 (100.0%) | $168,750 |
Household Income in North Merrick
Household Income Brackets in North Merrick
With 1,443 households falling in the category, the $200,000+ income range is the most frequent in North Merrick, accounting for 35.7% of all households. In contrast, only 44 households (1.1%) fall into the less than $10,000 income bracket, making it the least populous group.
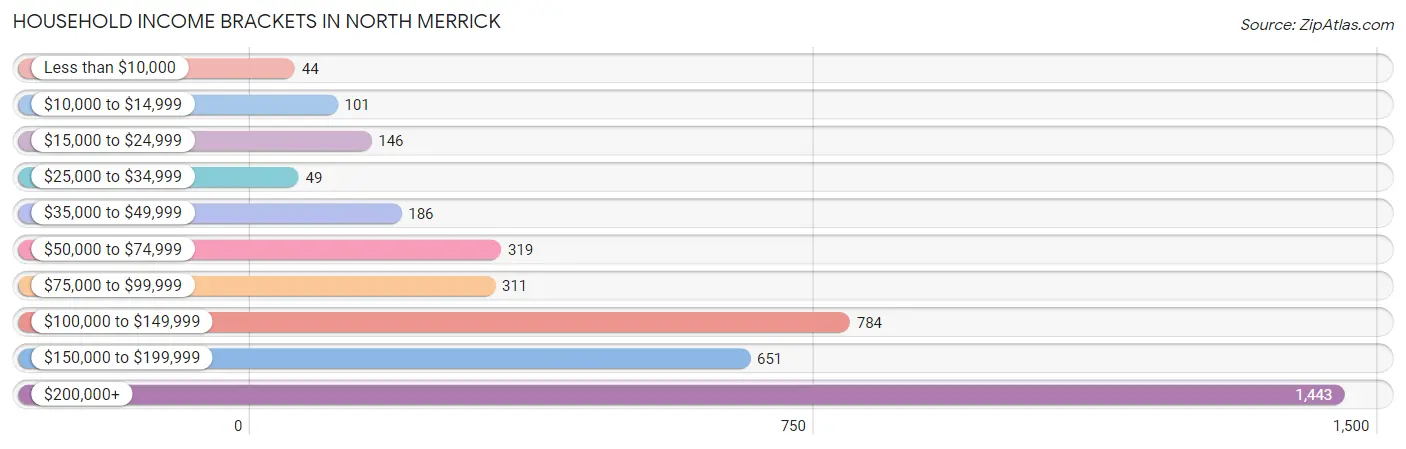
| Income Bracket | # Households | % Households |
| Less than $10,000 | 44 | 1.1% |
| $10,000 to $14,999 | 101 | 2.5% |
| $15,000 to $24,999 | 146 | 3.6% |
| $25,000 to $34,999 | 49 | 1.2% |
| $35,000 to $49,999 | 186 | 4.6% |
| $50,000 to $74,999 | 319 | 7.9% |
| $75,000 to $99,999 | 311 | 7.7% |
| $100,000 to $149,999 | 784 | 19.4% |
| $150,000 to $199,999 | 651 | 16.1% |
| $200,000+ | 1,443 | 35.7% |
Household Income by Householder Age in North Merrick
The median household income in North Merrick is $154,179, with the highest median household income of $203,291 found in the 45 to 64 years age bracket for the primary householder. A total of 1,697 households (42.0%) fall into this category.
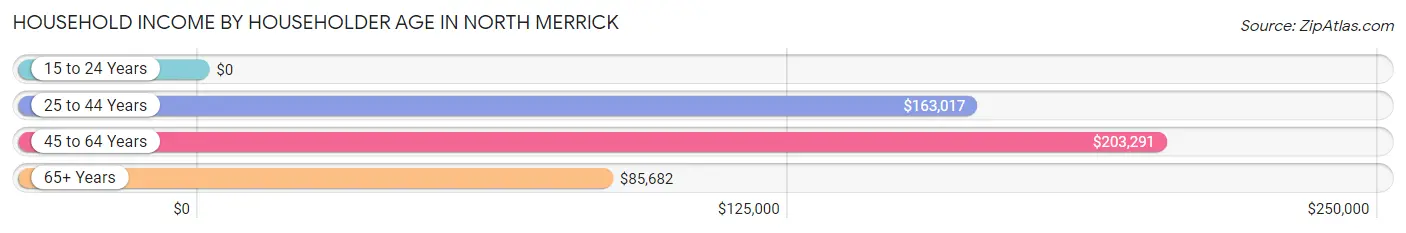
| Income Bracket | # Households | Median Income |
| 15 to 24 Years | 0 (0.0%) | $0 |
| 25 to 44 Years | 1,006 (24.9%) | $163,017 |
| 45 to 64 Years | 1,697 (42.0%) | $203,291 |
| 65+ Years | 1,340 (33.1%) | $85,682 |
| Total | 4,043 (100.0%) | $154,179 |
Poverty in North Merrick
Income Below Poverty by Sex and Age in North Merrick
With 3.8% poverty level for males and 3.3% for females among the residents of North Merrick, under 5 year old males and 6 to 11 year old females are the most vulnerable to poverty, with 36 males (10.0%) and 40 females (9.0%) in their respective age groups living below the poverty level.
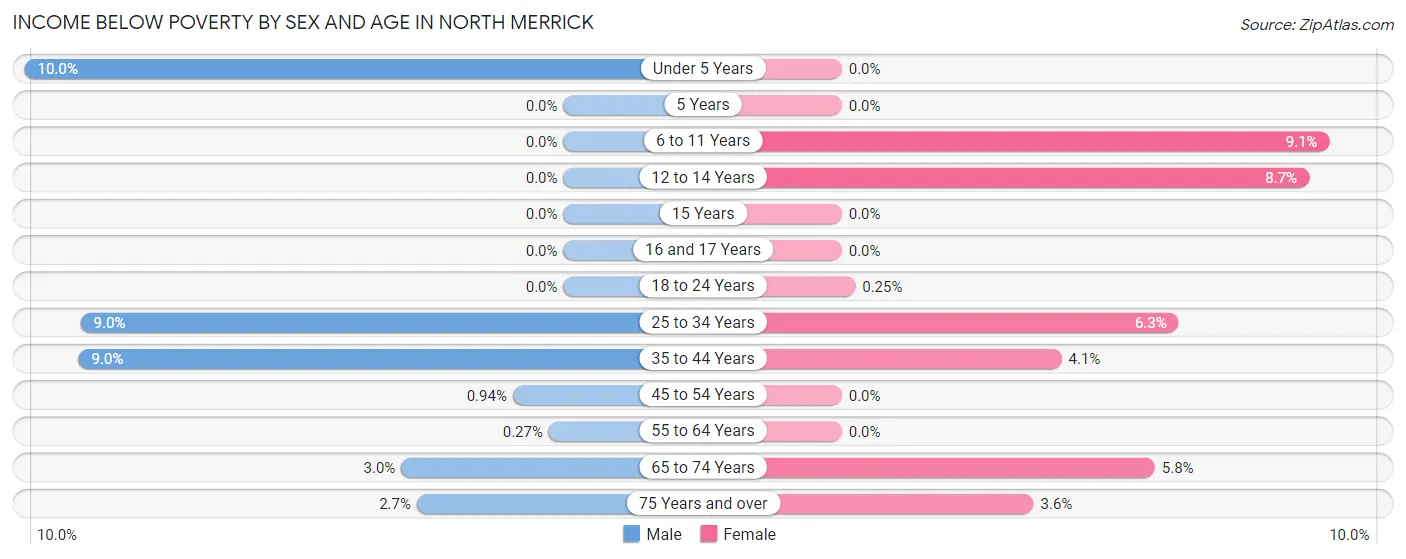
| Age Bracket | Male | Female |
| Under 5 Years | 36 (10.0%) | 0 (0.0%) |
| 5 Years | 0 (0.0%) | 0 (0.0%) |
| 6 to 11 Years | 0 (0.0%) | 40 (9.0%) |
| 12 to 14 Years | 0 (0.0%) | 28 (8.7%) |
| 15 Years | 0 (0.0%) | 0 (0.0%) |
| 16 and 17 Years | 0 (0.0%) | 0 (0.0%) |
| 18 to 24 Years | 0 (0.0%) | 1 (0.3%) |
| 25 to 34 Years | 80 (9.0%) | 38 (6.2%) |
| 35 to 44 Years | 76 (9.0%) | 27 (4.1%) |
| 45 to 54 Years | 9 (0.9%) | 0 (0.0%) |
| 55 to 64 Years | 2 (0.3%) | 0 (0.0%) |
| 65 to 74 Years | 20 (3.0%) | 47 (5.8%) |
| 75 Years and over | 10 (2.7%) | 16 (3.6%) |
| Total | 233 (3.8%) | 197 (3.3%) |
Income Above Poverty by Sex and Age in North Merrick
According to the poverty statistics in North Merrick, males aged 5 years and females aged under 5 years are the age groups that are most secure financially, with 100.0% of males and 100.0% of females in these age groups living above the poverty line.
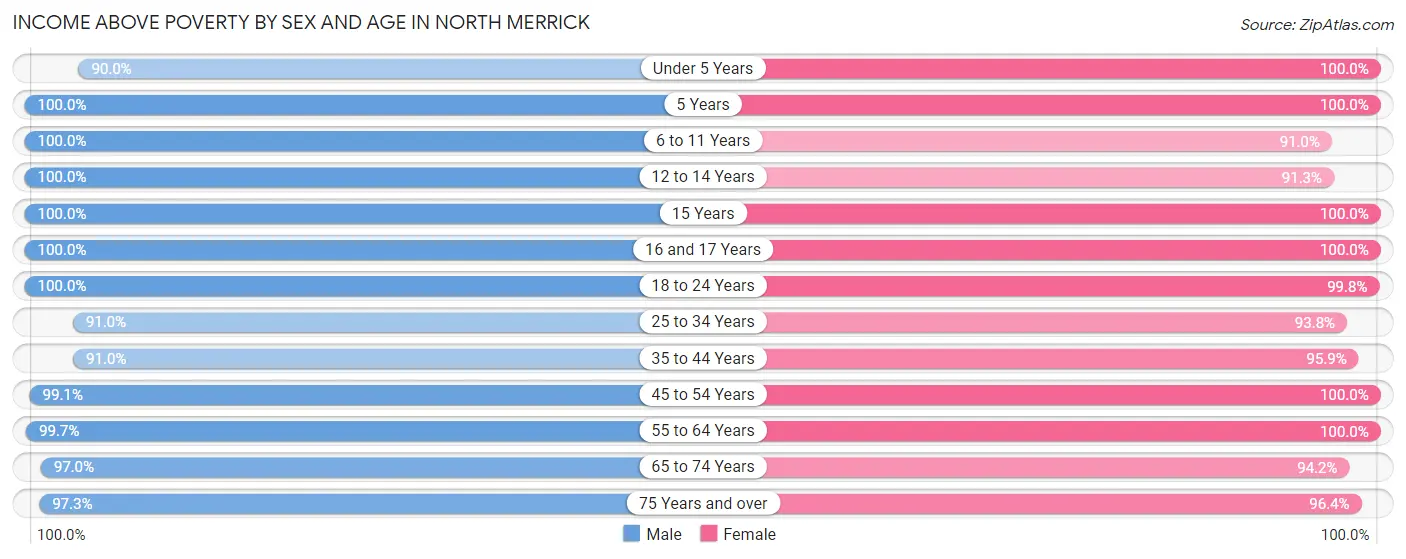
| Age Bracket | Male | Female |
| Under 5 Years | 324 (90.0%) | 373 (100.0%) |
| 5 Years | 45 (100.0%) | 79 (100.0%) |
| 6 to 11 Years | 284 (100.0%) | 402 (90.9%) |
| 12 to 14 Years | 141 (100.0%) | 295 (91.3%) |
| 15 Years | 102 (100.0%) | 67 (100.0%) |
| 16 and 17 Years | 278 (100.0%) | 102 (100.0%) |
| 18 to 24 Years | 395 (100.0%) | 406 (99.8%) |
| 25 to 34 Years | 813 (91.0%) | 570 (93.8%) |
| 35 to 44 Years | 768 (91.0%) | 634 (95.9%) |
| 45 to 54 Years | 952 (99.1%) | 810 (100.0%) |
| 55 to 64 Years | 734 (99.7%) | 830 (100.0%) |
| 65 to 74 Years | 644 (97.0%) | 762 (94.2%) |
| 75 Years and over | 358 (97.3%) | 433 (96.4%) |
| Total | 5,838 (96.2%) | 5,763 (96.7%) |
Income Below Poverty Among Married-Couple Families in North Merrick
The poverty statistics for married-couple families in North Merrick show that 1.7% or 45 of the total 2,733 families live below the poverty line. Families with 1 or 2 children have the highest poverty rate of 3.3%, comprising of 38 families. On the other hand, families with 3 or 4 children have the lowest poverty rate of 0.0%, which includes 0 families.
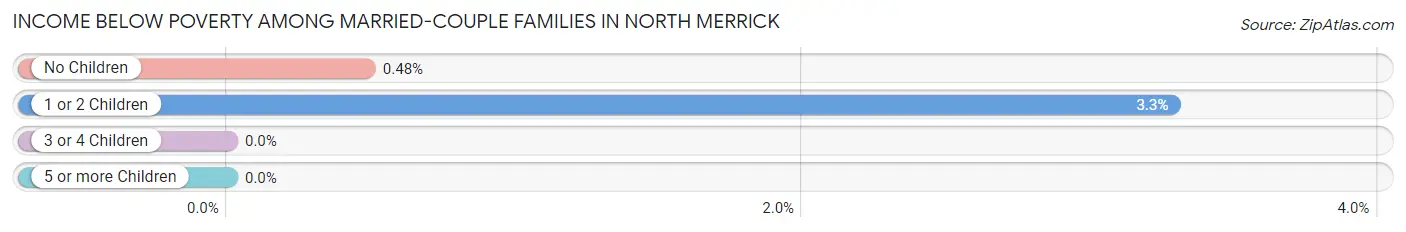
| Children | Above Poverty | Below Poverty |
| No Children | 1,447 (99.5%) | 7 (0.5%) |
| 1 or 2 Children | 1,120 (96.7%) | 38 (3.3%) |
| 3 or 4 Children | 121 (100.0%) | 0 (0.0%) |
| 5 or more Children | 0 (0.0%) | 0 (0.0%) |
| Total | 2,688 (98.4%) | 45 (1.7%) |
Income Below Poverty Among Single-Parent Households in North Merrick
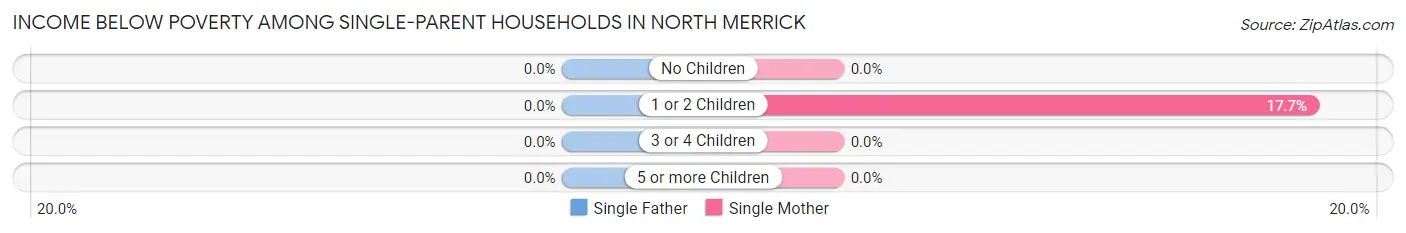
| Children | Single Father | Single Mother |
| No Children | 0 (0.0%) | 0 (0.0%) |
| 1 or 2 Children | 0 (0.0%) | 20 (17.7%) |
| 3 or 4 Children | 0 (0.0%) | 0 (0.0%) |
| 5 or more Children | 0 (0.0%) | 0 (0.0%) |
| Total | 0 (0.0%) | 20 (6.4%) |
Income Below Poverty Among Married-Couple vs Single-Parent Households in North Merrick
The poverty data for North Merrick shows that 45 of the married-couple family households (1.7%) and 20 of the single-parent households (3.4%) are living below the poverty level. Within the married-couple family households, those with 1 or 2 children have the highest poverty rate, with 38 households (3.3%) falling below the poverty line. Among the single-parent households, those with 1 or 2 children have the highest poverty rate, with 20 household (14.9%) living below poverty.
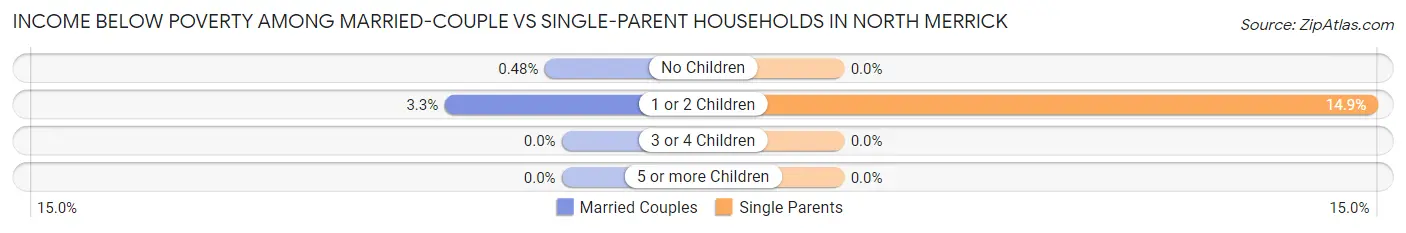
| Children | Married-Couple Families | Single-Parent Households |
| No Children | 7 (0.5%) | 0 (0.0%) |
| 1 or 2 Children | 38 (3.3%) | 20 (14.9%) |
| 3 or 4 Children | 0 (0.0%) | 0 (0.0%) |
| 5 or more Children | 0 (0.0%) | 0 (0.0%) |
| Total | 45 (1.7%) | 20 (3.4%) |
Race in North Merrick
The most populous races in North Merrick are White / Caucasian (10,274 | 84.3%), Hispanic or Latino (1,486 | 12.2%), and Two or more Races (840 | 6.9%).
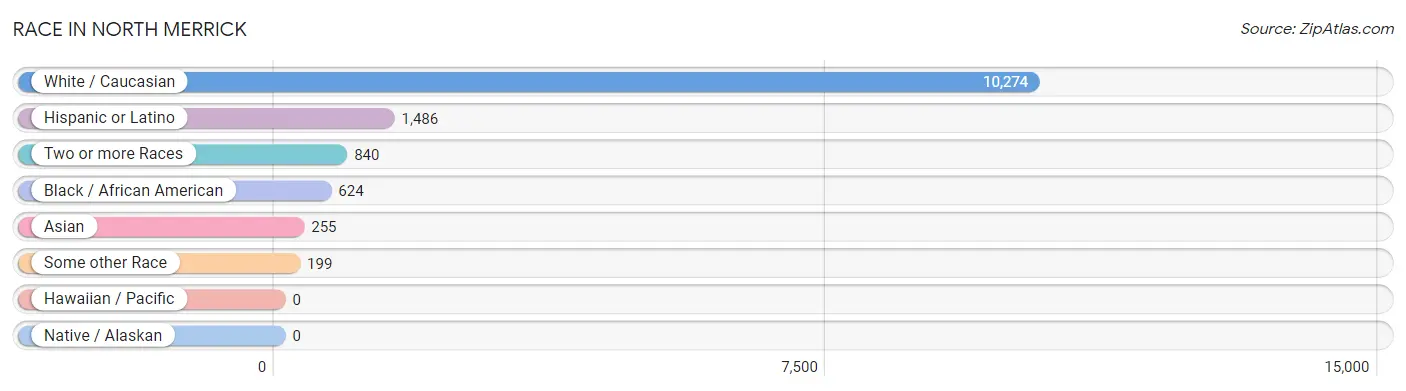
| Race | # Population | % Population |
| Asian | 255 | 2.1% |
| Black / African American | 624 | 5.1% |
| Hawaiian / Pacific | 0 | 0.0% |
| Hispanic or Latino | 1,486 | 12.2% |
| Native / Alaskan | 0 | 0.0% |
| White / Caucasian | 10,274 | 84.3% |
| Two or more Races | 840 | 6.9% |
| Some other Race | 199 | 1.6% |
| Total | 12,192 | 100.0% |
Ancestry in North Merrick
The most populous ancestries reported in North Merrick are Italian (3,993 | 32.8%), Irish (2,821 | 23.1%), German (2,012 | 16.5%), Polish (679 | 5.6%), and American (410 | 3.4%), together accounting for 81.3% of all North Merrick residents.
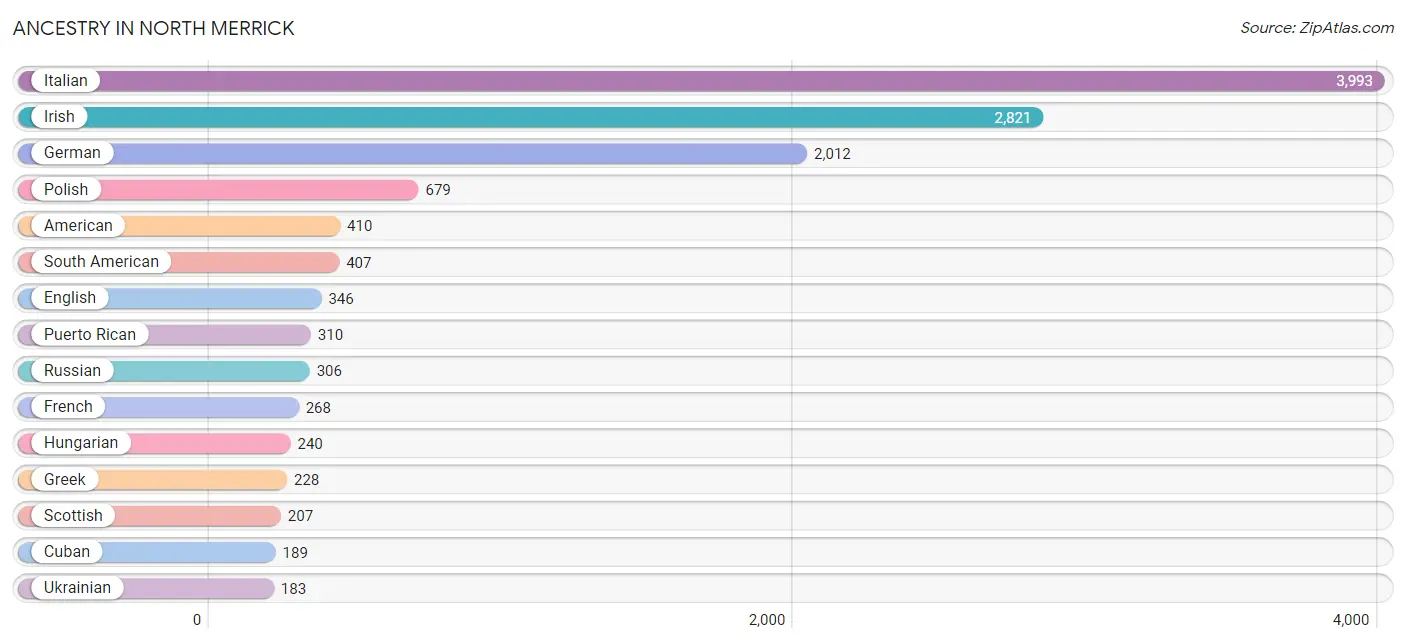
| Ancestry | # Population | % Population |
| African | 10 | 0.1% |
| American | 410 | 3.4% |
| Arab | 100 | 0.8% |
| Argentinean | 38 | 0.3% |
| Armenian | 11 | 0.1% |
| Austrian | 63 | 0.5% |
| Belgian | 9 | 0.1% |
| Blackfeet | 61 | 0.5% |
| British | 1 | 0.0% |
| British West Indian | 49 | 0.4% |
| Burmese | 115 | 0.9% |
| Central American | 32 | 0.3% |
| Cherokee | 61 | 0.5% |
| Colombian | 114 | 0.9% |
| Costa Rican | 11 | 0.1% |
| Croatian | 60 | 0.5% |
| Cuban | 189 | 1.5% |
| Cypriot | 6 | 0.1% |
| Czech | 33 | 0.3% |
| Dominican | 167 | 1.4% |
| Dutch | 60 | 0.5% |
| Eastern European | 86 | 0.7% |
| Ecuadorian | 161 | 1.3% |
| Egyptian | 62 | 0.5% |
| English | 346 | 2.8% |
| European | 136 | 1.1% |
| French | 268 | 2.2% |
| French Canadian | 29 | 0.2% |
| German | 2,012 | 16.5% |
| Greek | 228 | 1.9% |
| Haitian | 131 | 1.1% |
| Hungarian | 240 | 2.0% |
| Indian (Asian) | 136 | 1.1% |
| Irish | 2,821 | 23.1% |
| Iroquois | 15 | 0.1% |
| Israeli | 23 | 0.2% |
| Italian | 3,993 | 32.8% |
| Korean | 20 | 0.2% |
| Lebanese | 10 | 0.1% |
| Lithuanian | 68 | 0.6% |
| Malaysian | 1 | 0.0% |
| Maltese | 20 | 0.2% |
| Mexican | 6 | 0.1% |
| Mongolian | 9 | 0.1% |
| Norwegian | 26 | 0.2% |
| Pakistani | 1 | 0.0% |
| Peruvian | 94 | 0.8% |
| Polish | 679 | 5.6% |
| Portuguese | 35 | 0.3% |
| Puerto Rican | 310 | 2.5% |
| Romanian | 9 | 0.1% |
| Russian | 306 | 2.5% |
| Salvadoran | 21 | 0.2% |
| Scottish | 207 | 1.7% |
| Slovak | 13 | 0.1% |
| Slovene | 14 | 0.1% |
| South African | 11 | 0.1% |
| South American | 407 | 3.3% |
| Spaniard | 143 | 1.2% |
| Subsaharan African | 21 | 0.2% |
| Swedish | 124 | 1.0% |
| Syrian | 28 | 0.2% |
| Thai | 47 | 0.4% |
| Ukrainian | 183 | 1.5% |
| Welsh | 34 | 0.3% |
| West Indian | 138 | 1.1% | View All 66 Rows |
Immigrants in North Merrick
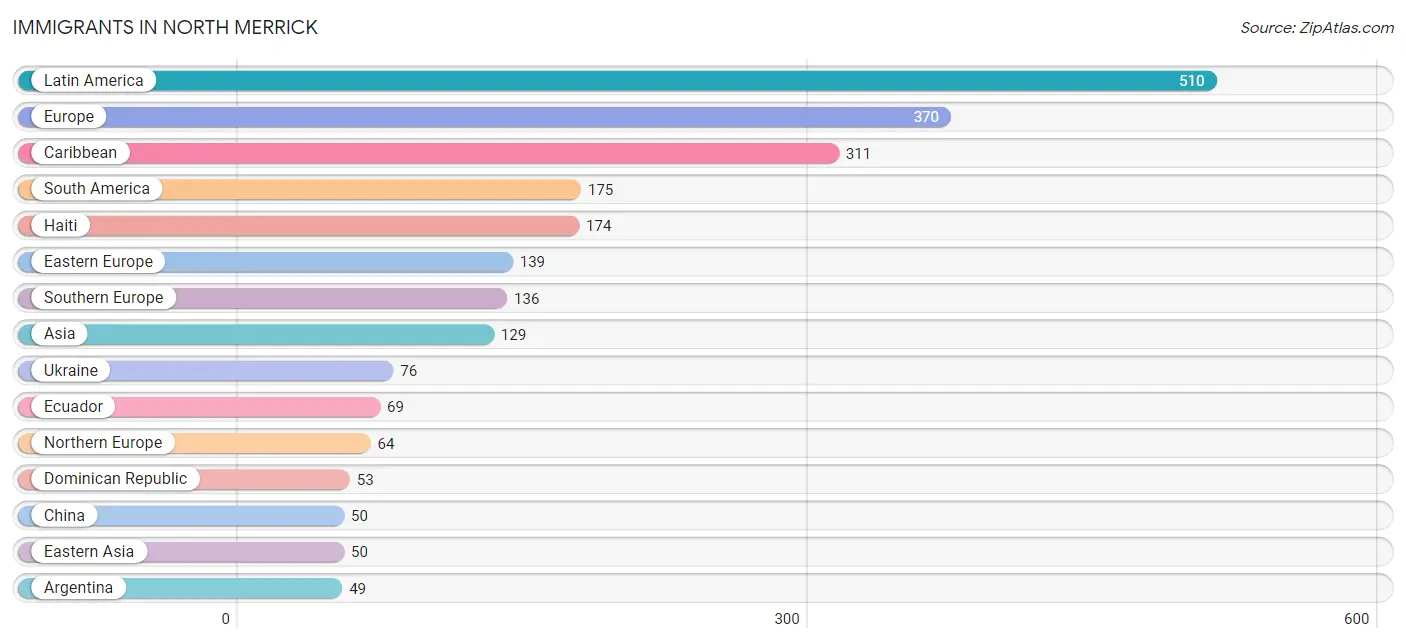
The most numerous immigrant groups reported in North Merrick came from Latin America (510 | 4.2%), Europe (370 | 3.0%), Caribbean (311 | 2.5%), South America (175 | 1.4%), and Haiti (174 | 1.4%), together accounting for 12.6% of all North Merrick residents.
| Immigration Origin | # Population | % Population |
| Africa | 15 | 0.1% |
| Argentina | 49 | 0.4% |
| Asia | 129 | 1.1% |
| Canada | 6 | 0.1% |
| Caribbean | 311 | 2.5% |
| Central America | 24 | 0.2% |
| China | 50 | 0.4% |
| Colombia | 17 | 0.1% |
| Croatia | 13 | 0.1% |
| Dominican Republic | 53 | 0.4% |
| Eastern Asia | 50 | 0.4% |
| Eastern Europe | 139 | 1.1% |
| Ecuador | 69 | 0.6% |
| Egypt | 15 | 0.1% |
| El Salvador | 19 | 0.2% |
| England | 9 | 0.1% |
| Europe | 370 | 3.0% |
| France | 7 | 0.1% |
| Germany | 16 | 0.1% |
| Greece | 18 | 0.2% |
| Grenada | 10 | 0.1% |
| Guyana | 24 | 0.2% |
| Haiti | 174 | 1.4% |
| Hong Kong | 5 | 0.0% |
| India | 10 | 0.1% |
| Israel | 8 | 0.1% |
| Italy | 39 | 0.3% |
| Latin America | 510 | 4.2% |
| Malaysia | 9 | 0.1% |
| Mexico | 5 | 0.0% |
| Moldova | 9 | 0.1% |
| Netherlands | 8 | 0.1% |
| Northern Africa | 15 | 0.1% |
| Northern Europe | 64 | 0.5% |
| Pakistan | 5 | 0.0% |
| Peru | 16 | 0.1% |
| Philippines | 36 | 0.3% |
| Poland | 41 | 0.3% |
| South America | 175 | 1.4% |
| South Central Asia | 15 | 0.1% |
| South Eastern Asia | 45 | 0.4% |
| Southern Europe | 136 | 1.1% |
| Spain | 12 | 0.1% |
| St. Vincent and the Grenadines | 11 | 0.1% |
| Trinidad and Tobago | 25 | 0.2% |
| Ukraine | 76 | 0.6% |
| Western Asia | 19 | 0.2% |
| Western Europe | 31 | 0.3% | View All 48 Rows |
Sex and Age in North Merrick
Sex and Age in North Merrick
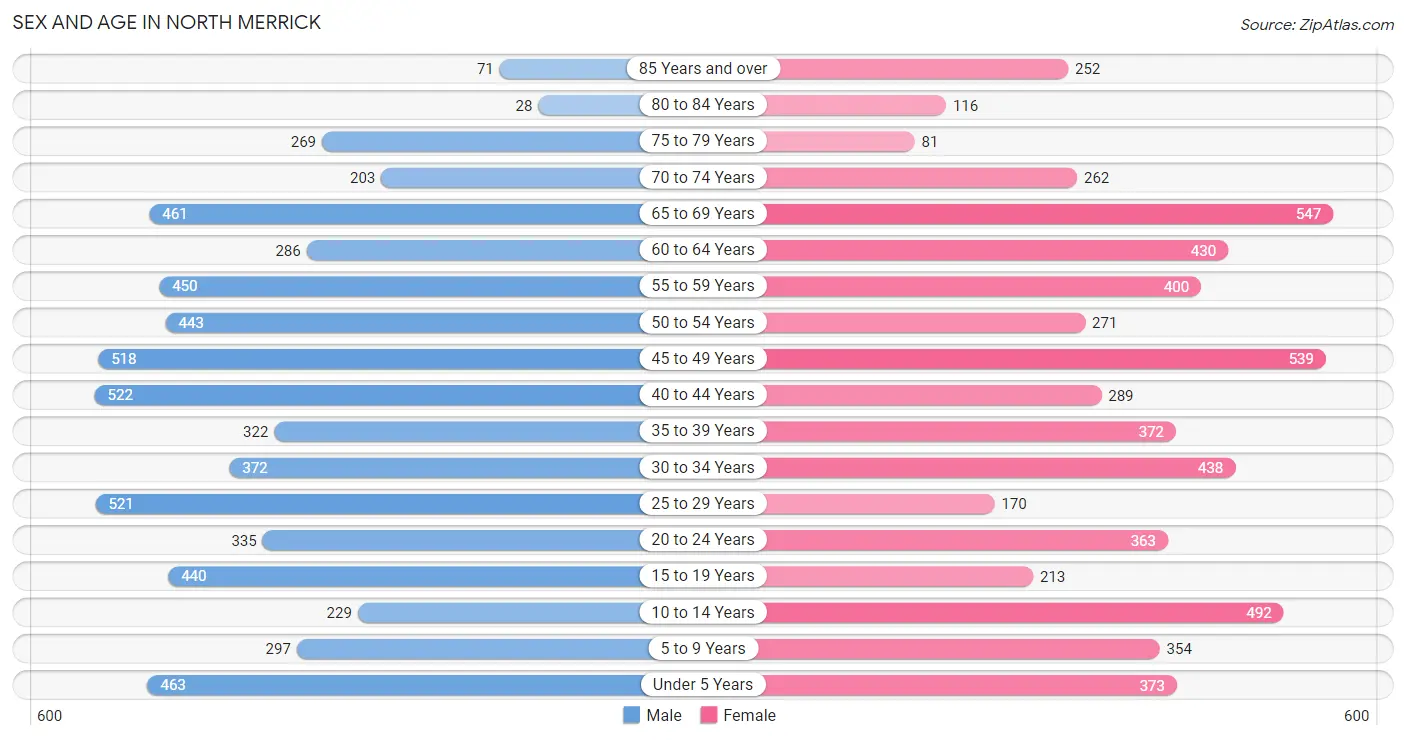
The most populous age groups in North Merrick are 40 to 44 Years (522 | 8.4%) for men and 65 to 69 Years (547 | 9.2%) for women.
| Age Bracket | Male | Female |
| Under 5 Years | 463 (7.4%) | 373 (6.3%) |
| 5 to 9 Years | 297 (4.8%) | 354 (5.9%) |
| 10 to 14 Years | 229 (3.7%) | 492 (8.3%) |
| 15 to 19 Years | 440 (7.1%) | 213 (3.6%) |
| 20 to 24 Years | 335 (5.4%) | 363 (6.1%) |
| 25 to 29 Years | 521 (8.4%) | 170 (2.9%) |
| 30 to 34 Years | 372 (6.0%) | 438 (7.3%) |
| 35 to 39 Years | 322 (5.2%) | 372 (6.2%) |
| 40 to 44 Years | 522 (8.4%) | 289 (4.9%) |
| 45 to 49 Years | 518 (8.3%) | 539 (9.0%) |
| 50 to 54 Years | 443 (7.1%) | 271 (4.5%) |
| 55 to 59 Years | 450 (7.2%) | 400 (6.7%) |
| 60 to 64 Years | 286 (4.6%) | 430 (7.2%) |
| 65 to 69 Years | 461 (7.4%) | 547 (9.2%) |
| 70 to 74 Years | 203 (3.3%) | 262 (4.4%) |
| 75 to 79 Years | 269 (4.3%) | 81 (1.4%) |
| 80 to 84 Years | 28 (0.4%) | 116 (1.9%) |
| 85 Years and over | 71 (1.1%) | 252 (4.2%) |
| Total | 6,230 (100.0%) | 5,962 (100.0%) |
Families and Households in North Merrick
Median Family Size in North Merrick
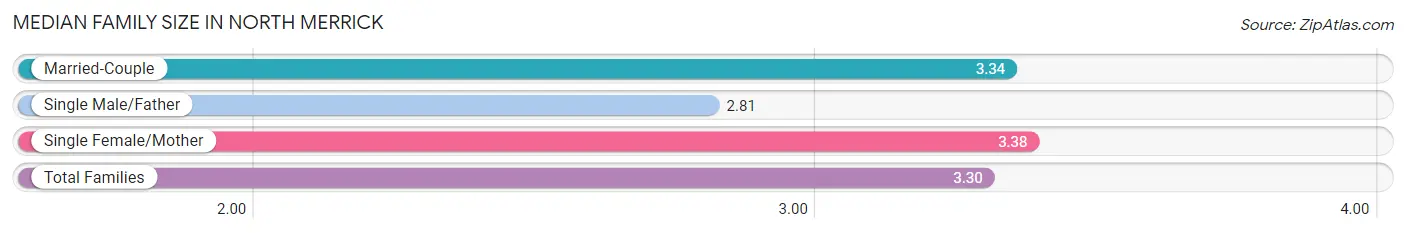
The median family size in North Merrick is 3.30 persons per family, with single female/mother families (313 | 9.4%) accounting for the largest median family size of 3.38 persons per family. On the other hand, single male/father families (274 | 8.3%) represent the smallest median family size with 2.81 persons per family.
| Family Type | # Families | Family Size |
| Married-Couple | 2,733 (82.3%) | 3.34 |
| Single Male/Father | 274 (8.3%) | 2.81 |
| Single Female/Mother | 313 (9.4%) | 3.38 |
| Total Families | 3,320 (100.0%) | 3.30 |
Median Household Size in North Merrick
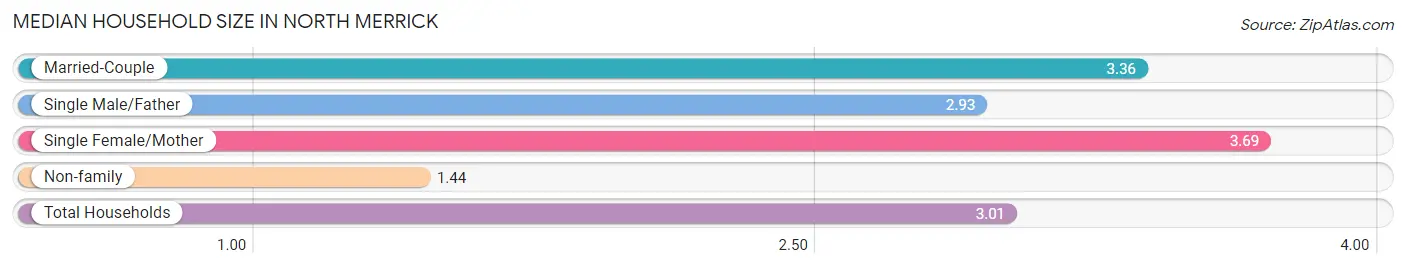
The median household size in North Merrick is 3.01 persons per household, with single female/mother households (313 | 7.7%) accounting for the largest median household size of 3.69 persons per household. non-family households (723 | 17.9%) represent the smallest median household size with 1.44 persons per household.
| Household Type | # Households | Household Size |
| Married-Couple | 2,733 (67.6%) | 3.36 |
| Single Male/Father | 274 (6.8%) | 2.93 |
| Single Female/Mother | 313 (7.7%) | 3.69 |
| Non-family | 723 (17.9%) | 1.44 |
| Total Households | 4,043 (100.0%) | 3.01 |
Household Size by Marriage Status in North Merrick
Out of a total of 4,043 households in North Merrick, 3,320 (82.1%) are family households, while 723 (17.9%) are nonfamily households. The most numerous type of family households are 2-person households, comprising 1,082, and the most common type of nonfamily households are 1-person households, comprising 614.
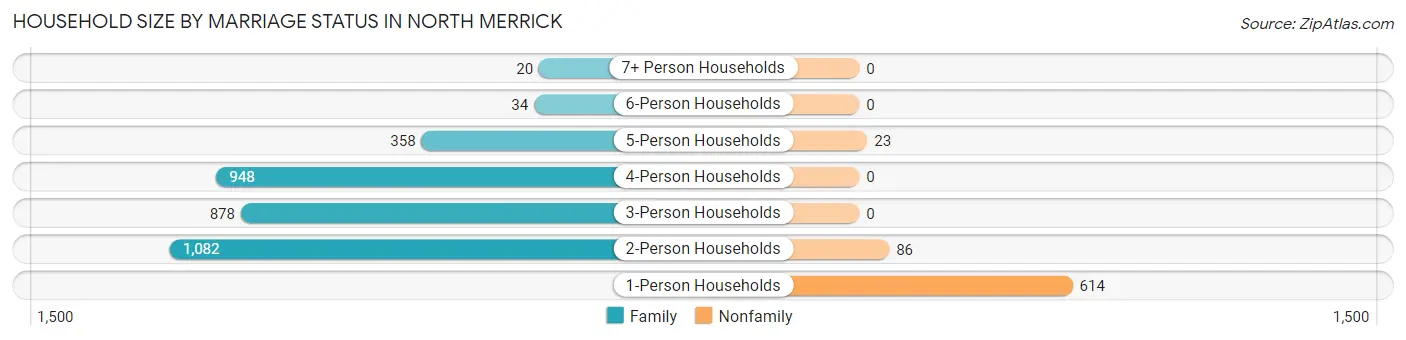
| Household Size | Family Households | Nonfamily Households |
| 1-Person Households | - | 614 (15.2%) |
| 2-Person Households | 1,082 (26.8%) | 86 (2.1%) |
| 3-Person Households | 878 (21.7%) | 0 (0.0%) |
| 4-Person Households | 948 (23.4%) | 0 (0.0%) |
| 5-Person Households | 358 (8.8%) | 23 (0.6%) |
| 6-Person Households | 34 (0.8%) | 0 (0.0%) |
| 7+ Person Households | 20 (0.5%) | 0 (0.0%) |
| Total | 3,320 (82.1%) | 723 (17.9%) |
Female Fertility in North Merrick
Fertility by Age in North Merrick
Average fertility rate in North Merrick is 77.0 births per 1,000 women. Women in the age bracket of 20 to 34 years have the highest fertility rate with 117.0 births per 1,000 women. Women in the age bracket of 20 to 34 years acount for 61.3% of all women with births.
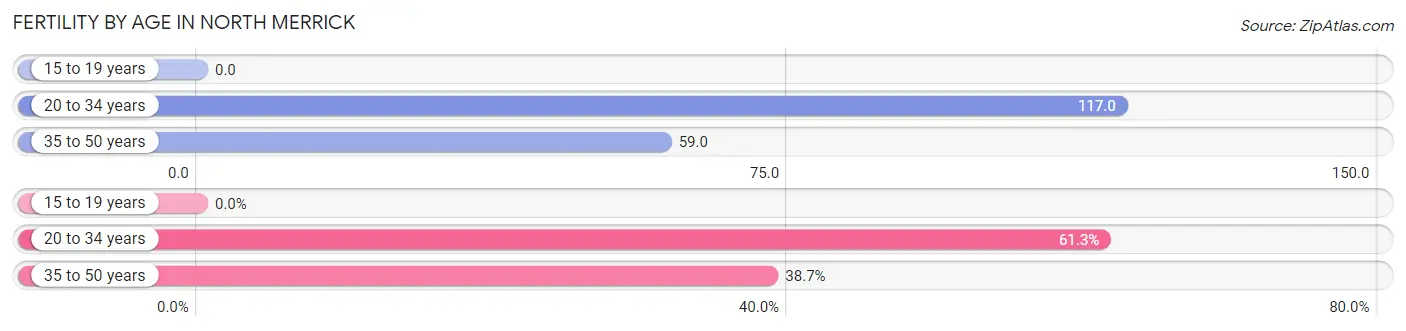
| Age Bracket | Women with Births | Births / 1,000 Women |
| 15 to 19 years | 0 (0.0%) | 0.0 |
| 20 to 34 years | 114 (61.3%) | 117.0 |
| 35 to 50 years | 72 (38.7%) | 59.0 |
| Total | 186 (100.0%) | 77.0 |
Fertility by Age by Marriage Status in North Merrick
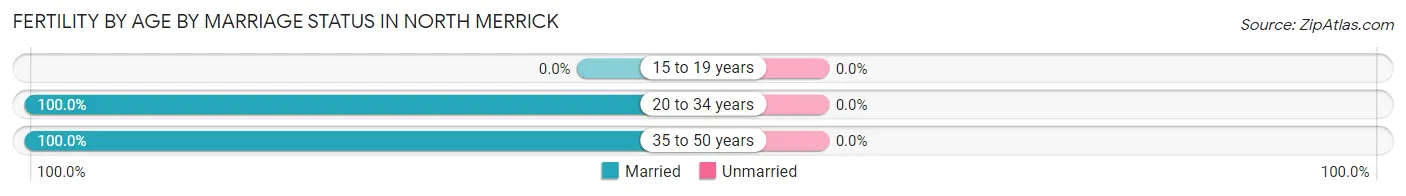
| Age Bracket | Married | Unmarried |
| 15 to 19 years | 0 (0.0%) | 0 (0.0%) |
| 20 to 34 years | 114 (100.0%) | 0 (0.0%) |
| 35 to 50 years | 72 (100.0%) | 0 (0.0%) |
| Total | 186 (100.0%) | 0 (0.0%) |
Fertility by Education in North Merrick
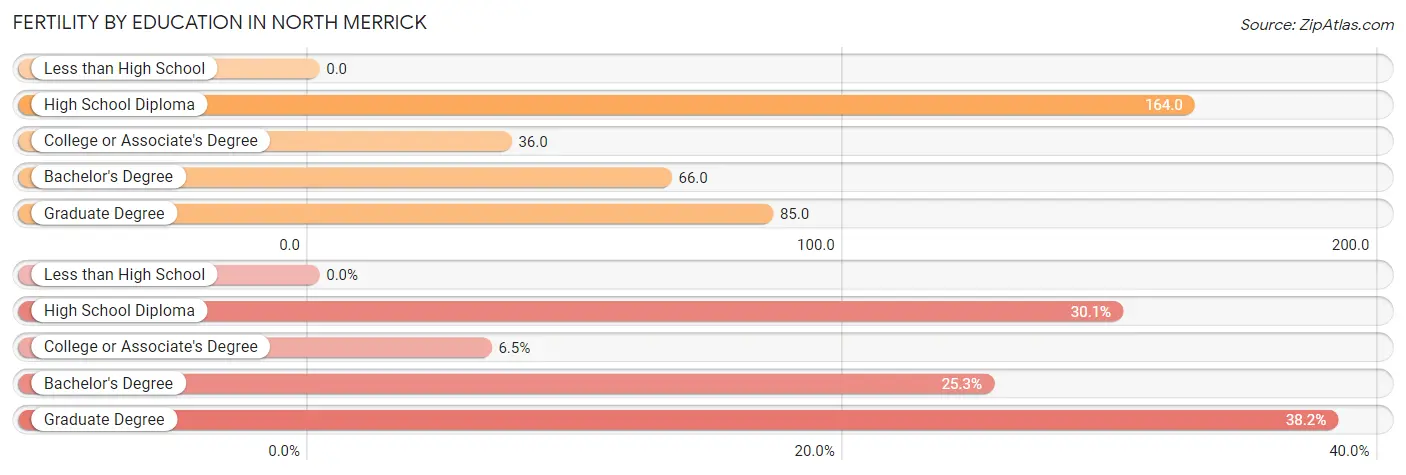
| Educational Attainment | Women with Births | Births / 1,000 Women |
| Less than High School | 0 (0.0%) | 0.0 |
| High School Diploma | 56 (30.1%) | 164.0 |
| College or Associate's Degree | 12 (6.5%) | 36.0 |
| Bachelor's Degree | 47 (25.3%) | 66.0 |
| Graduate Degree | 71 (38.2%) | 85.0 |
| Total | 186 (100.0%) | 77.0 |
Fertility by Education by Marriage Status in North Merrick
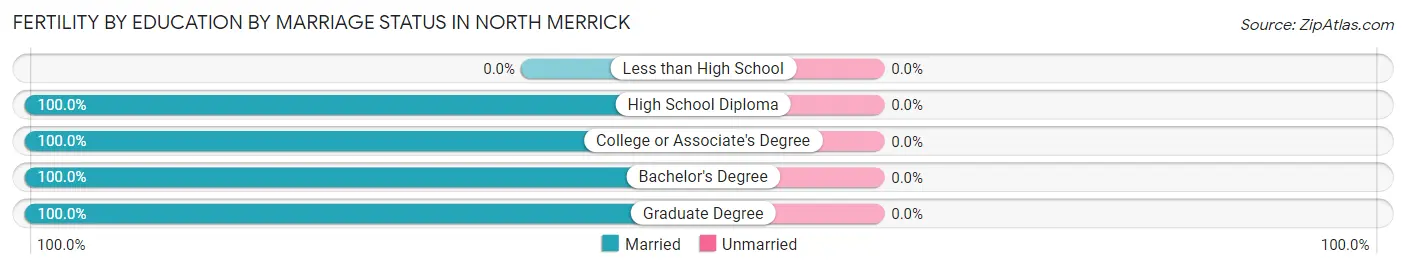
| Educational Attainment | Married | Unmarried |
| Less than High School | 0 (0.0%) | 0 (0.0%) |
| High School Diploma | 56 (100.0%) | 0 (0.0%) |
| College or Associate's Degree | 12 (100.0%) | 0 (0.0%) |
| Bachelor's Degree | 47 (100.0%) | 0 (0.0%) |
| Graduate Degree | 71 (100.0%) | 0 (0.0%) |
| Total | 186 (100.0%) | 0 (0.0%) |
Employment Characteristics in North Merrick
Employment by Class of Employer in North Merrick
Among the 6,322 employed individuals in North Merrick, private company employees (3,461 | 54.7%), local government employees (1,231 | 19.5%), and not-for-profit organizations (793 | 12.5%) make up the most common classes of employment.
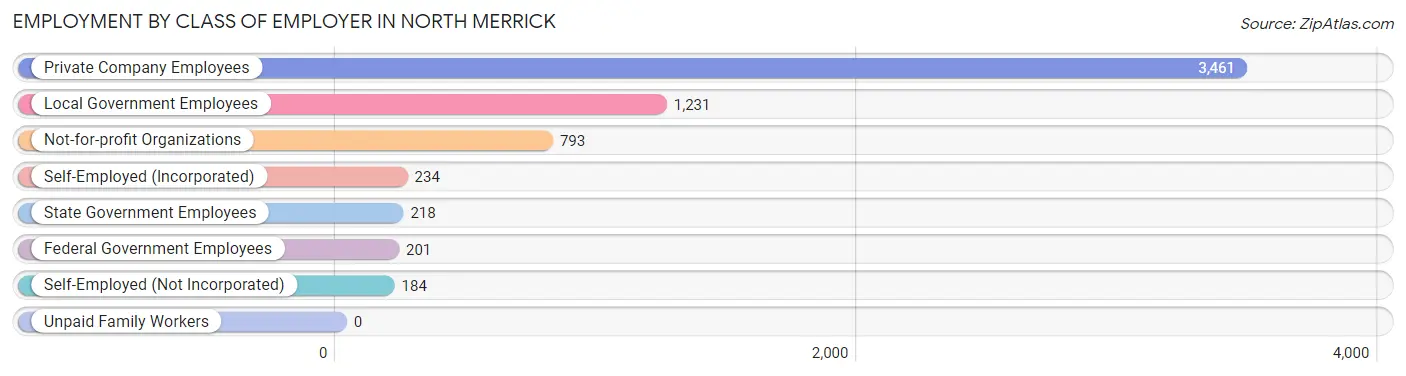
| Employer Class | # Employees | % Employees |
| Private Company Employees | 3,461 | 54.7% |
| Self-Employed (Incorporated) | 234 | 3.7% |
| Self-Employed (Not Incorporated) | 184 | 2.9% |
| Not-for-profit Organizations | 793 | 12.5% |
| Local Government Employees | 1,231 | 19.5% |
| State Government Employees | 218 | 3.5% |
| Federal Government Employees | 201 | 3.2% |
| Unpaid Family Workers | 0 | 0.0% |
| Total | 6,322 | 100.0% |
Employment Status by Age in North Merrick
According to the labor force statistics for North Merrick, out of the total population over 16 years of age (9,815), 67.7% or 6,645 individuals are in the labor force, with 2.6% or 173 of them unemployed. The age group with the highest labor force participation rate is 25 to 29 years, with 94.2% or 651 individuals in the labor force. Within the labor force, the 16 to 19 years age range has the highest percentage of unemployed individuals, with 13.3% or 30 of them being unemployed.
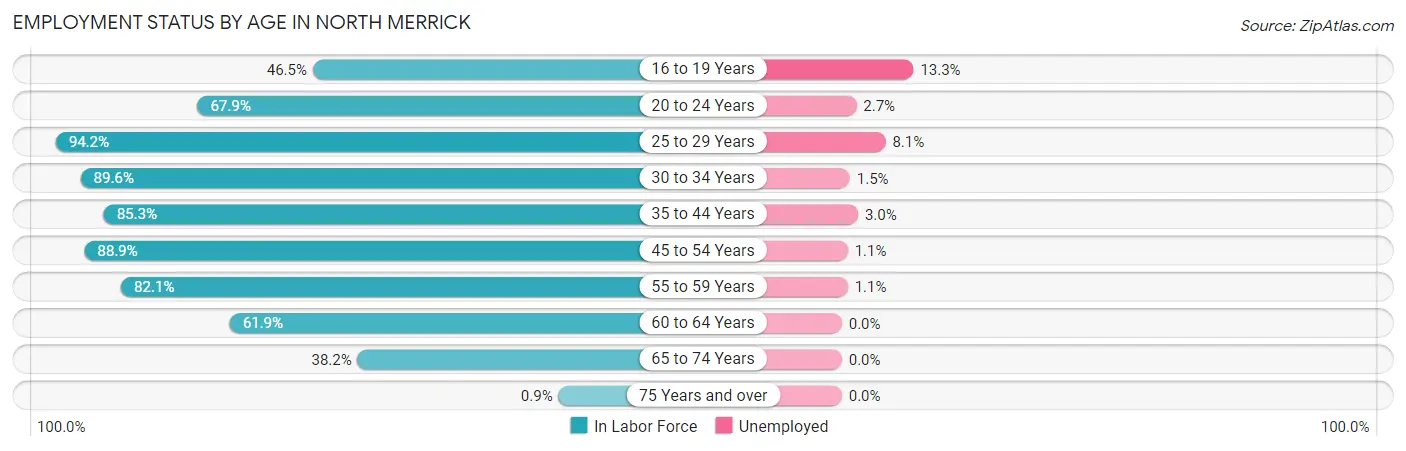
| Age Bracket | In Labor Force | Unemployed |
| 16 to 19 Years | 225 (46.5%) | 30 (13.3%) |
| 20 to 24 Years | 474 (67.9%) | 13 (2.7%) |
| 25 to 29 Years | 651 (94.2%) | 53 (8.1%) |
| 30 to 34 Years | 726 (89.6%) | 11 (1.5%) |
| 35 to 44 Years | 1,284 (85.3%) | 39 (3.0%) |
| 45 to 54 Years | 1,574 (88.9%) | 17 (1.1%) |
| 55 to 59 Years | 698 (82.1%) | 8 (1.1%) |
| 60 to 64 Years | 443 (61.9%) | 0 (0.0%) |
| 65 to 74 Years | 563 (38.2%) | 0 (0.0%) |
| 75 Years and over | 7 (0.9%) | 0 (0.0%) |
| Total | 6,645 (67.7%) | 173 (2.6%) |
Employment Status by Educational Attainment in North Merrick
According to labor force statistics for North Merrick, 84.8% of individuals (5,379) out of the total population between 25 and 64 years of age (6,343) are in the labor force, with 2.4% or 129 of them being unemployed. The group with the highest labor force participation rate are those with the educational attainment of bachelor's degree or higher, with 88.7% or 3,159 individuals in the labor force. Within the labor force, individuals with high school diploma education have the highest percentage of unemployment, with 3.3% or 30 of them being unemployed.
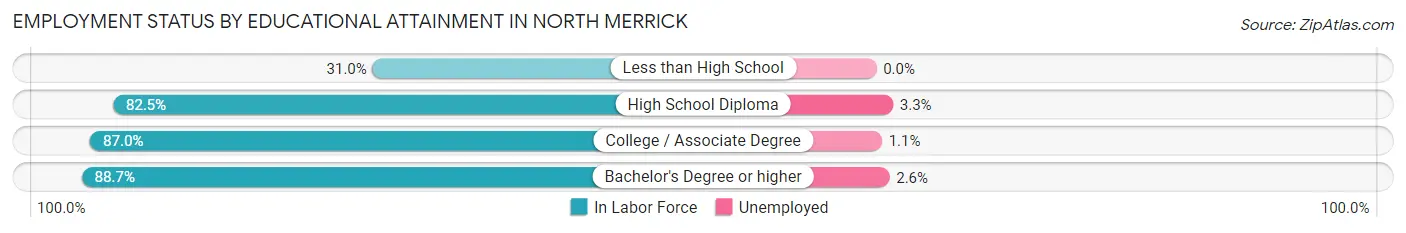
| Educational Attainment | In Labor Force | Unemployed |
| Less than High School | 85 (31.0%) | 0 (0.0%) |
| High School Diploma | 911 (82.5%) | 36 (3.3%) |
| College / Associate Degree | 1,221 (87.0%) | 15 (1.1%) |
| Bachelor's Degree or higher | 3,159 (88.7%) | 93 (2.6%) |
| Total | 5,379 (84.8%) | 152 (2.4%) |
Employment Occupations by Sex in North Merrick
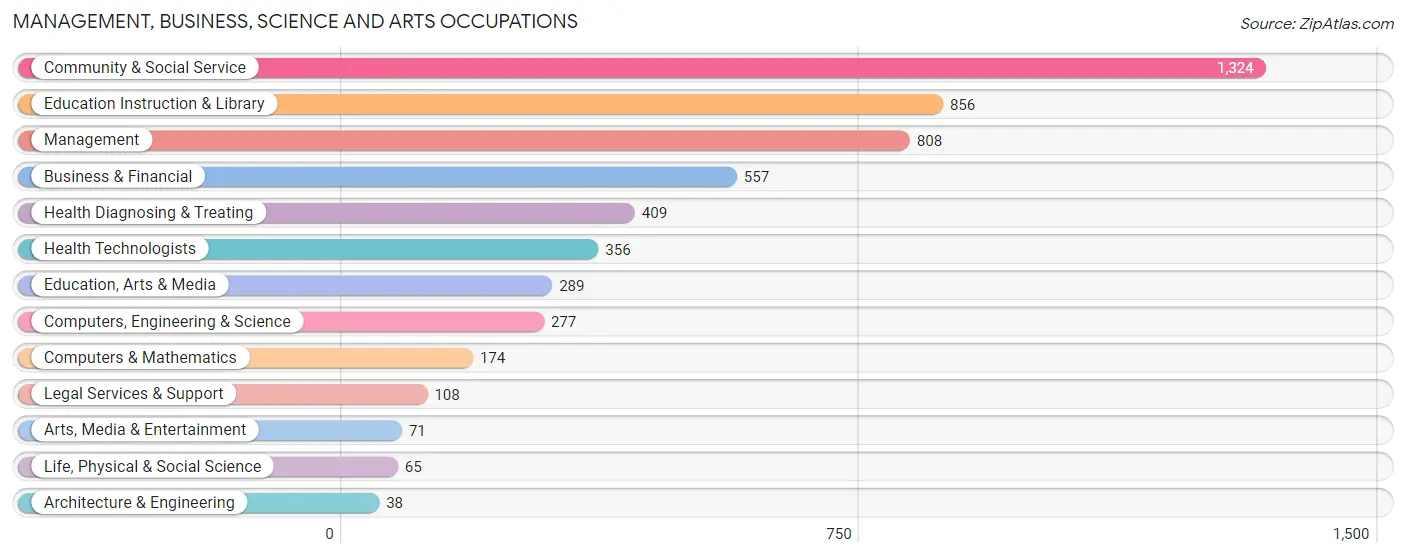
Management, Business, Science and Arts Occupations
The most common Management, Business, Science and Arts occupations in North Merrick are Community & Social Service (1,324 | 20.4%), Education Instruction & Library (856 | 13.2%), Management (808 | 12.5%), Business & Financial (557 | 8.6%), and Health Diagnosing & Treating (409 | 6.3%).
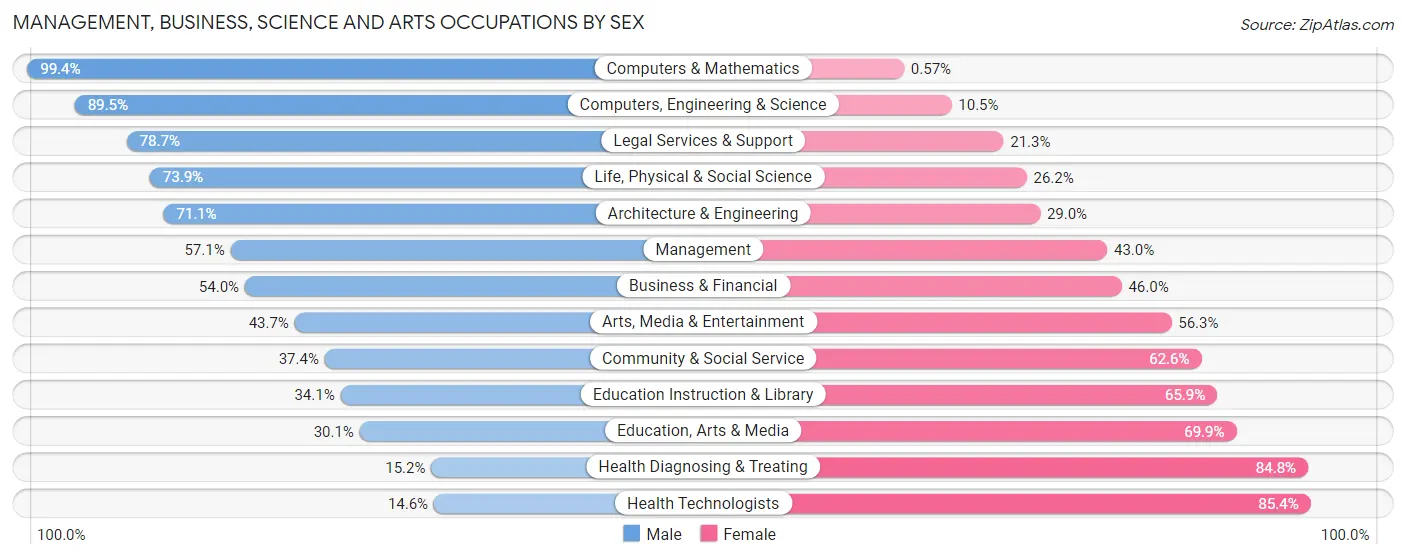
Management, Business, Science and Arts Occupations by Sex
Within the Management, Business, Science and Arts occupations in North Merrick, the most male-oriented occupations are Computers & Mathematics (99.4%), Computers, Engineering & Science (89.5%), and Legal Services & Support (78.7%), while the most female-oriented occupations are Health Technologists (85.4%), Health Diagnosing & Treating (84.8%), and Education, Arts & Media (69.9%).
| Occupation | Male | Female |
| Management | 461 (57.1%) | 347 (42.9%) |
| Business & Financial | 301 (54.0%) | 256 (46.0%) |
| Computers, Engineering & Science | 248 (89.5%) | 29 (10.5%) |
| Computers & Mathematics | 173 (99.4%) | 1 (0.6%) |
| Architecture & Engineering | 27 (71.1%) | 11 (28.9%) |
| Life, Physical & Social Science | 48 (73.9%) | 17 (26.2%) |
| Community & Social Service | 495 (37.4%) | 829 (62.6%) |
| Education, Arts & Media | 87 (30.1%) | 202 (69.9%) |
| Legal Services & Support | 85 (78.7%) | 23 (21.3%) |
| Education Instruction & Library | 292 (34.1%) | 564 (65.9%) |
| Arts, Media & Entertainment | 31 (43.7%) | 40 (56.3%) |
| Health Diagnosing & Treating | 62 (15.2%) | 347 (84.8%) |
| Health Technologists | 52 (14.6%) | 304 (85.4%) |
| Total (Category) | 1,567 (46.4%) | 1,808 (53.6%) |
| Total (Overall) | 3,658 (56.5%) | 2,818 (43.5%) |
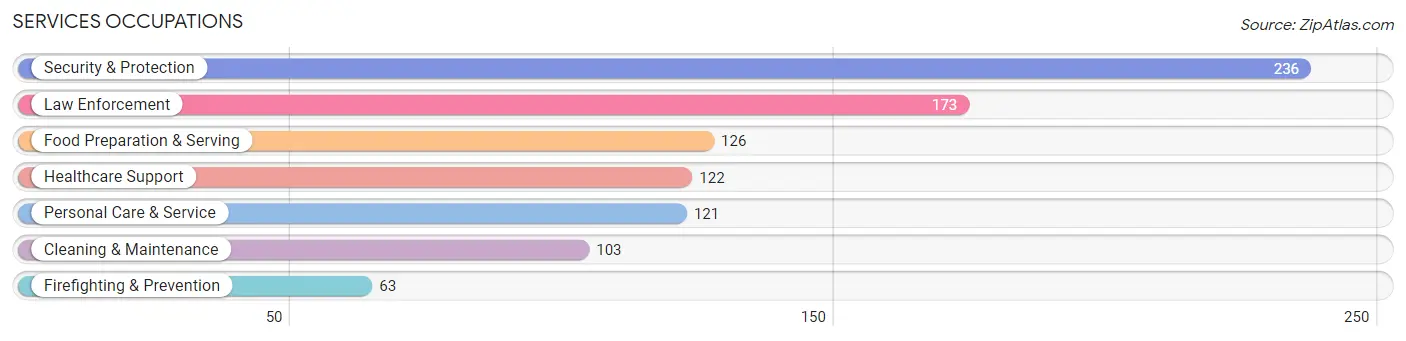
Services Occupations
The most common Services occupations in North Merrick are Security & Protection (236 | 3.6%), Law Enforcement (173 | 2.7%), Food Preparation & Serving (126 | 1.9%), Healthcare Support (122 | 1.9%), and Personal Care & Service (121 | 1.9%).
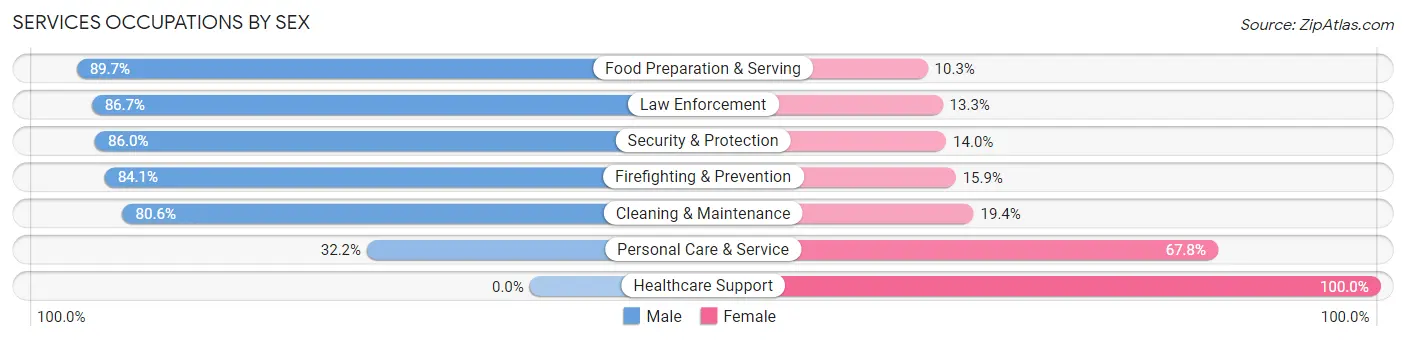
Services Occupations by Sex
Within the Services occupations in North Merrick, the most male-oriented occupations are Food Preparation & Serving (89.7%), Law Enforcement (86.7%), and Security & Protection (86.0%), while the most female-oriented occupations are Healthcare Support (100.0%), Personal Care & Service (67.8%), and Cleaning & Maintenance (19.4%).
| Occupation | Male | Female |
| Healthcare Support | 0 (0.0%) | 122 (100.0%) |
| Security & Protection | 203 (86.0%) | 33 (14.0%) |
| Firefighting & Prevention | 53 (84.1%) | 10 (15.9%) |
| Law Enforcement | 150 (86.7%) | 23 (13.3%) |
| Food Preparation & Serving | 113 (89.7%) | 13 (10.3%) |
| Cleaning & Maintenance | 83 (80.6%) | 20 (19.4%) |
| Personal Care & Service | 39 (32.2%) | 82 (67.8%) |
| Total (Category) | 438 (61.9%) | 270 (38.1%) |
| Total (Overall) | 3,658 (56.5%) | 2,818 (43.5%) |
Sales and Office Occupations
The most common Sales and Office occupations in North Merrick are Office & Administration (896 | 13.8%), and Sales & Related (544 | 8.4%).
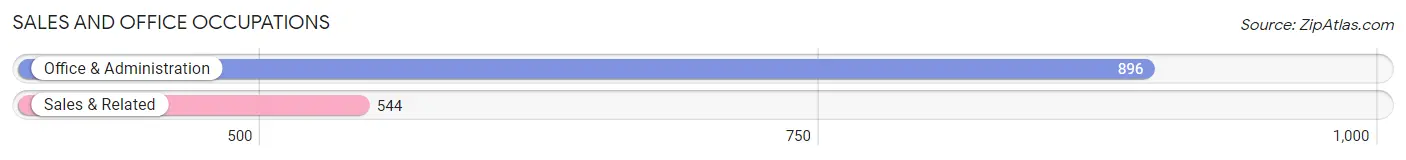
Sales and Office Occupations by Sex
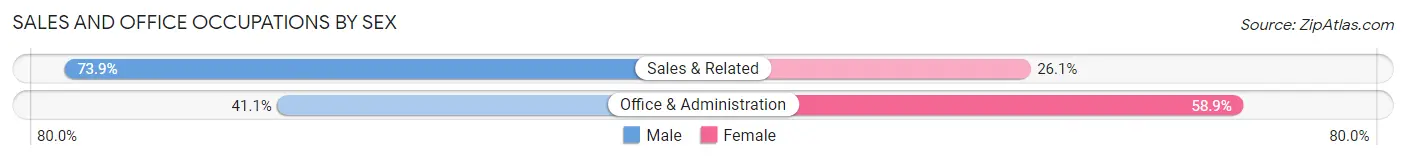
| Occupation | Male | Female |
| Sales & Related | 402 (73.9%) | 142 (26.1%) |
| Office & Administration | 368 (41.1%) | 528 (58.9%) |
| Total (Category) | 770 (53.5%) | 670 (46.5%) |
| Total (Overall) | 3,658 (56.5%) | 2,818 (43.5%) |
Natural Resources, Construction and Maintenance Occupations
The most common Natural Resources, Construction and Maintenance occupations in North Merrick are Construction & Extraction (363 | 5.6%), and Installation, Maintenance & Repair (97 | 1.5%).
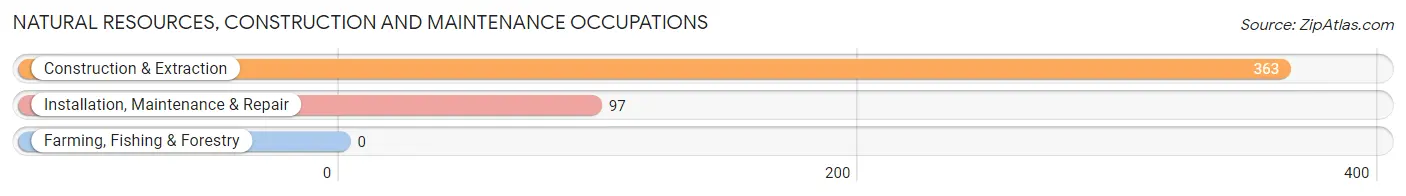
Natural Resources, Construction and Maintenance Occupations by Sex
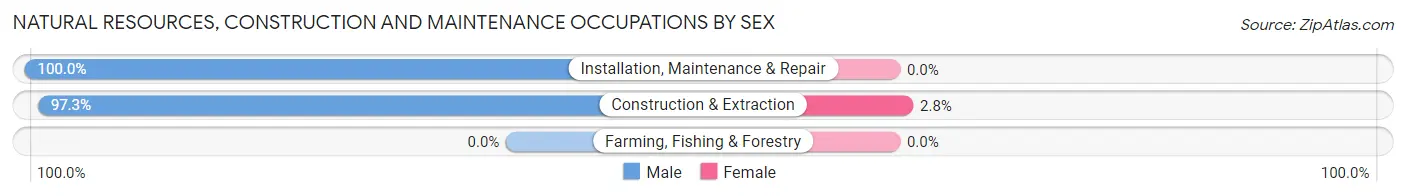
| Occupation | Male | Female |
| Farming, Fishing & Forestry | 0 (0.0%) | 0 (0.0%) |
| Construction & Extraction | 353 (97.3%) | 10 (2.8%) |
| Installation, Maintenance & Repair | 97 (100.0%) | 0 (0.0%) |
| Total (Category) | 450 (97.8%) | 10 (2.2%) |
| Total (Overall) | 3,658 (56.5%) | 2,818 (43.5%) |
Production, Transportation and Moving Occupations
The most common Production, Transportation and Moving occupations in North Merrick are Production (256 | 4.0%), Transportation (172 | 2.7%), and Material Moving (65 | 1.0%).
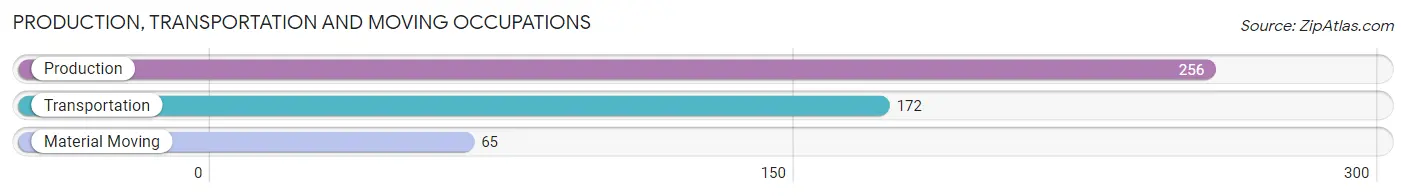
Production, Transportation and Moving Occupations by Sex
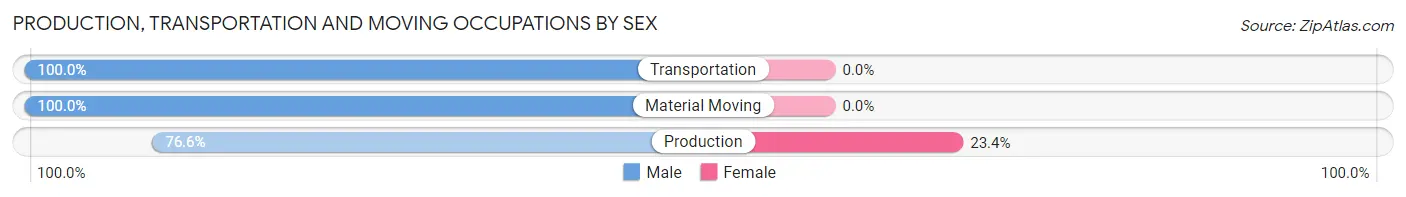
| Occupation | Male | Female |
| Production | 196 (76.6%) | 60 (23.4%) |
| Transportation | 172 (100.0%) | 0 (0.0%) |
| Material Moving | 65 (100.0%) | 0 (0.0%) |
| Total (Category) | 433 (87.8%) | 60 (12.2%) |
| Total (Overall) | 3,658 (56.5%) | 2,818 (43.5%) |
Employment Industries by Sex in North Merrick
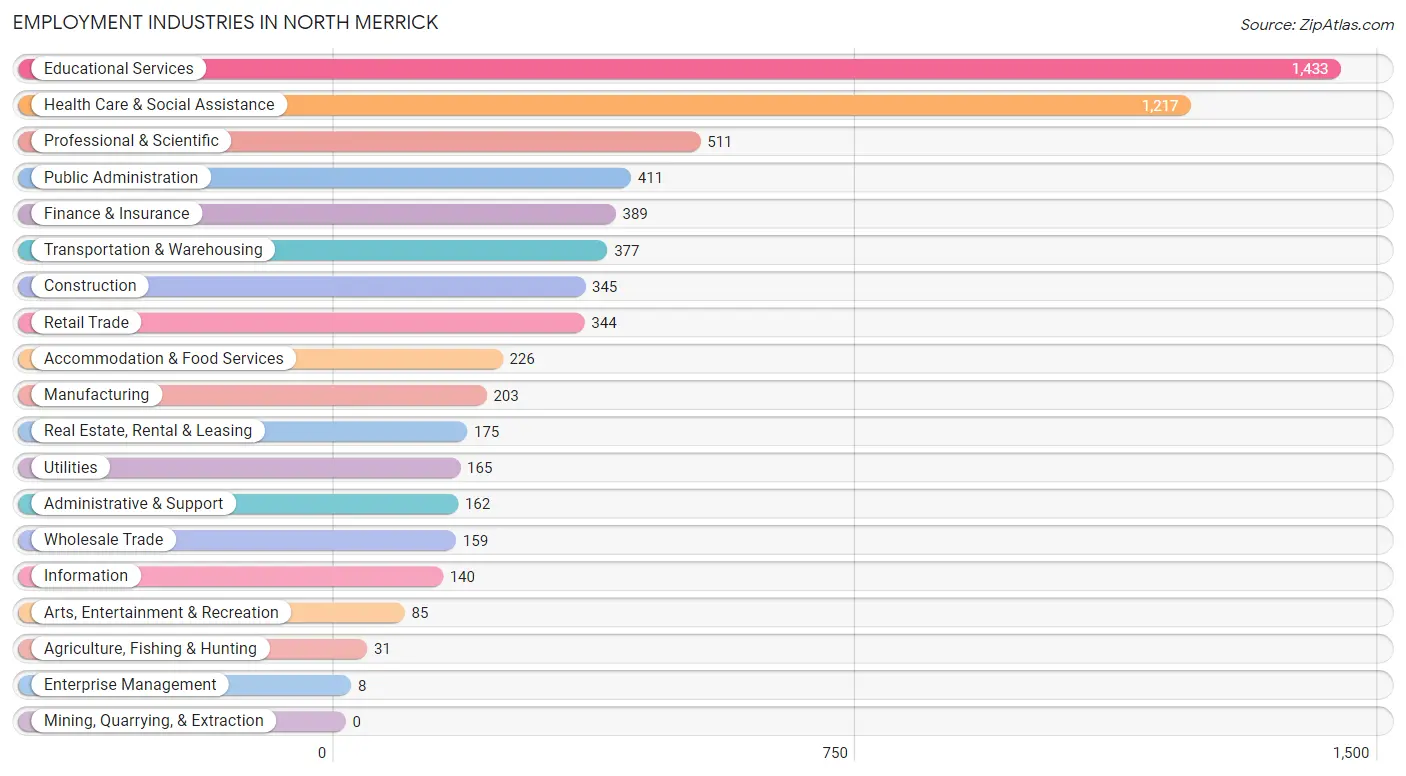
Employment Industries in North Merrick
The major employment industries in North Merrick include Educational Services (1,433 | 22.1%), Health Care & Social Assistance (1,217 | 18.8%), Professional & Scientific (511 | 7.9%), Public Administration (411 | 6.4%), and Finance & Insurance (389 | 6.0%).
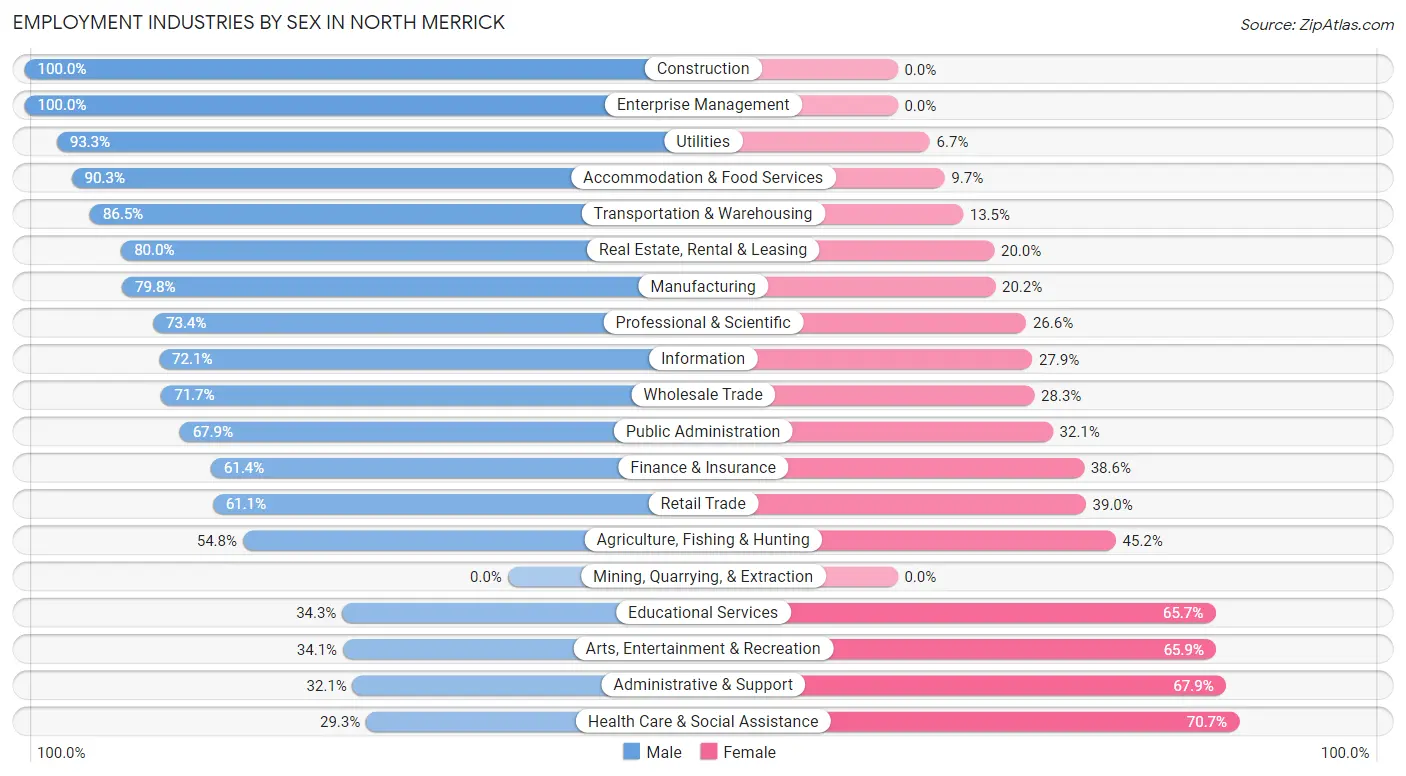
Employment Industries by Sex in North Merrick
The North Merrick industries that see more men than women are Construction (100.0%), Enterprise Management (100.0%), and Utilities (93.3%), whereas the industries that tend to have a higher number of women are Health Care & Social Assistance (70.7%), Administrative & Support (67.9%), and Arts, Entertainment & Recreation (65.9%).
| Industry | Male | Female |
| Agriculture, Fishing & Hunting | 17 (54.8%) | 14 (45.2%) |
| Mining, Quarrying, & Extraction | 0 (0.0%) | 0 (0.0%) |
| Construction | 345 (100.0%) | 0 (0.0%) |
| Manufacturing | 162 (79.8%) | 41 (20.2%) |
| Wholesale Trade | 114 (71.7%) | 45 (28.3%) |
| Retail Trade | 210 (61.1%) | 134 (39.0%) |
| Transportation & Warehousing | 326 (86.5%) | 51 (13.5%) |
| Utilities | 154 (93.3%) | 11 (6.7%) |
| Information | 101 (72.1%) | 39 (27.9%) |
| Finance & Insurance | 239 (61.4%) | 150 (38.6%) |
| Real Estate, Rental & Leasing | 140 (80.0%) | 35 (20.0%) |
| Professional & Scientific | 375 (73.4%) | 136 (26.6%) |
| Enterprise Management | 8 (100.0%) | 0 (0.0%) |
| Administrative & Support | 52 (32.1%) | 110 (67.9%) |
| Educational Services | 491 (34.3%) | 942 (65.7%) |
| Health Care & Social Assistance | 357 (29.3%) | 860 (70.7%) |
| Arts, Entertainment & Recreation | 29 (34.1%) | 56 (65.9%) |
| Accommodation & Food Services | 204 (90.3%) | 22 (9.7%) |
| Public Administration | 279 (67.9%) | 132 (32.1%) |
| Total | 3,658 (56.5%) | 2,818 (43.5%) |
Education in North Merrick
School Enrollment in North Merrick
The most common levels of schooling among the 2,830 students in North Merrick are high school (746 | 26.4%), elementary school (565 | 20.0%), and middle school (533 | 18.8%).
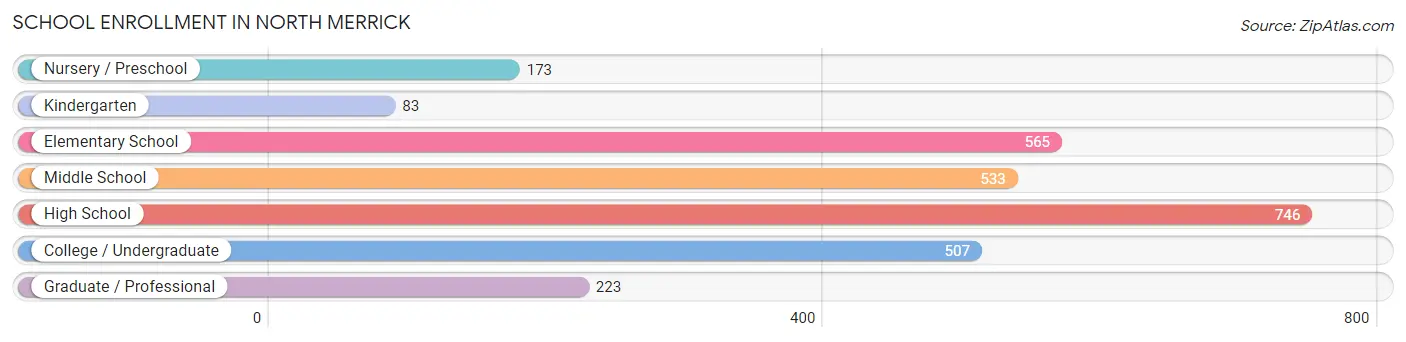
| School Level | # Students | % Students |
| Nursery / Preschool | 173 | 6.1% |
| Kindergarten | 83 | 2.9% |
| Elementary School | 565 | 20.0% |
| Middle School | 533 | 18.8% |
| High School | 746 | 26.4% |
| College / Undergraduate | 507 | 17.9% |
| Graduate / Professional | 223 | 7.9% |
| Total | 2,830 | 100.0% |
School Enrollment by Age by Funding Source in North Merrick
Out of a total of 2,830 students who are enrolled in schools in North Merrick, 668 (23.6%) attend a private institution, while the remaining 2,162 (76.4%) are enrolled in public schools. The age group of 3 to 4 year olds has the highest likelihood of being enrolled in private schools, with 125 (78.1% in the age bracket) enrolled. Conversely, the age group of 10 to 14 year olds has the lowest likelihood of being enrolled in a private school, with 669 (92.8% in the age bracket) attending a public institution.
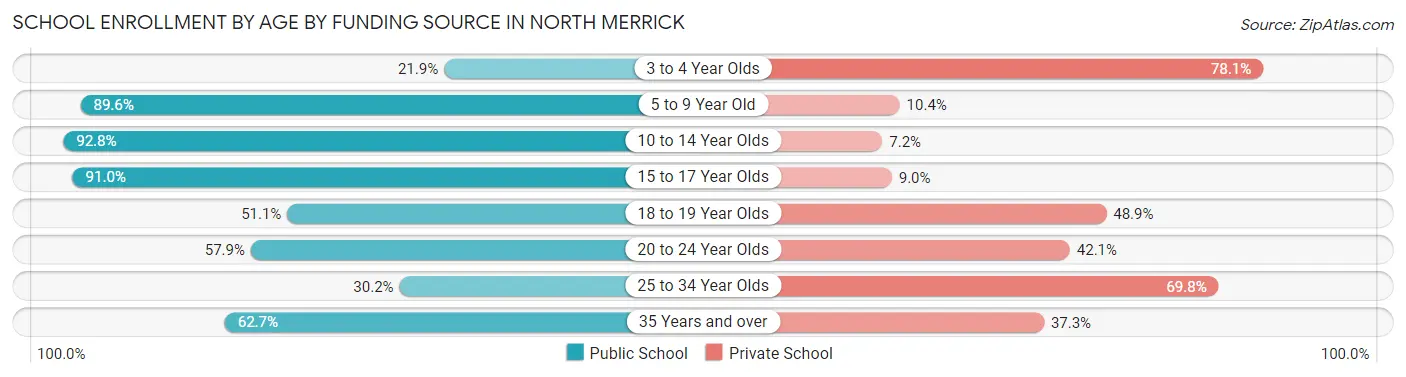
| Age Bracket | Public School | Private School |
| 3 to 4 Year Olds | 35 (21.9%) | 125 (78.1%) |
| 5 to 9 Year Old | 558 (89.6%) | 65 (10.4%) |
| 10 to 14 Year Olds | 669 (92.8%) | 52 (7.2%) |
| 15 to 17 Year Olds | 488 (91.0%) | 48 (9.0%) |
| 18 to 19 Year Olds | 47 (51.1%) | 45 (48.9%) |
| 20 to 24 Year Olds | 239 (57.9%) | 174 (42.1%) |
| 25 to 34 Year Olds | 48 (30.2%) | 111 (69.8%) |
| 35 Years and over | 79 (62.7%) | 47 (37.3%) |
| Total | 2,162 (76.4%) | 668 (23.6%) |
Educational Attainment by Field of Study in North Merrick
Business (1,095 | 21.9%), education (654 | 13.1%), social sciences (550 | 11.0%), science & technology (522 | 10.4%), and psychology (356 | 7.1%) are the most common fields of study among 5,000 individuals in North Merrick who have obtained a bachelor's degree or higher.
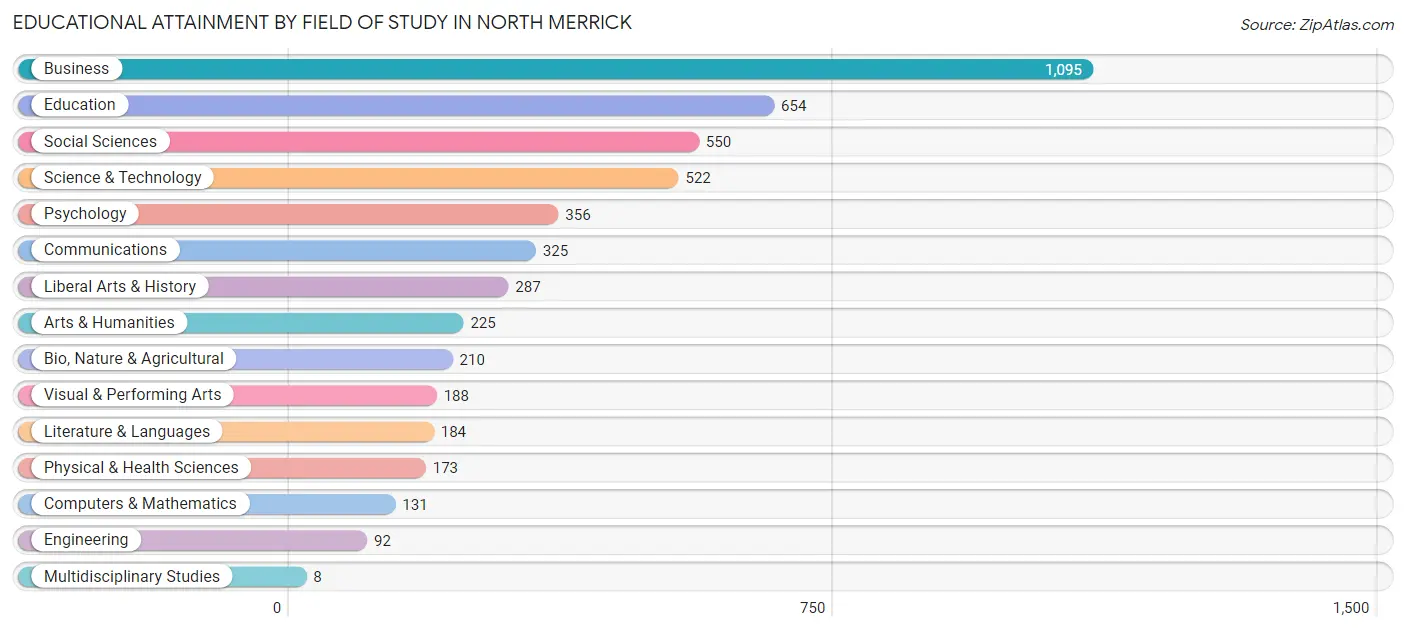
| Field of Study | # Graduates | % Graduates |
| Computers & Mathematics | 131 | 2.6% |
| Bio, Nature & Agricultural | 210 | 4.2% |
| Physical & Health Sciences | 173 | 3.5% |
| Psychology | 356 | 7.1% |
| Social Sciences | 550 | 11.0% |
| Engineering | 92 | 1.8% |
| Multidisciplinary Studies | 8 | 0.2% |
| Science & Technology | 522 | 10.4% |
| Business | 1,095 | 21.9% |
| Education | 654 | 13.1% |
| Literature & Languages | 184 | 3.7% |
| Liberal Arts & History | 287 | 5.7% |
| Visual & Performing Arts | 188 | 3.8% |
| Communications | 325 | 6.5% |
| Arts & Humanities | 225 | 4.5% |
| Total | 5,000 | 100.0% |
Transportation & Commute in North Merrick
Vehicle Availability by Sex in North Merrick
The most prevalent vehicle ownership categories in North Merrick are males with 2 vehicles (1,584, accounting for 44.2%) and females with 2 vehicles (1,251, making up 58.0%).
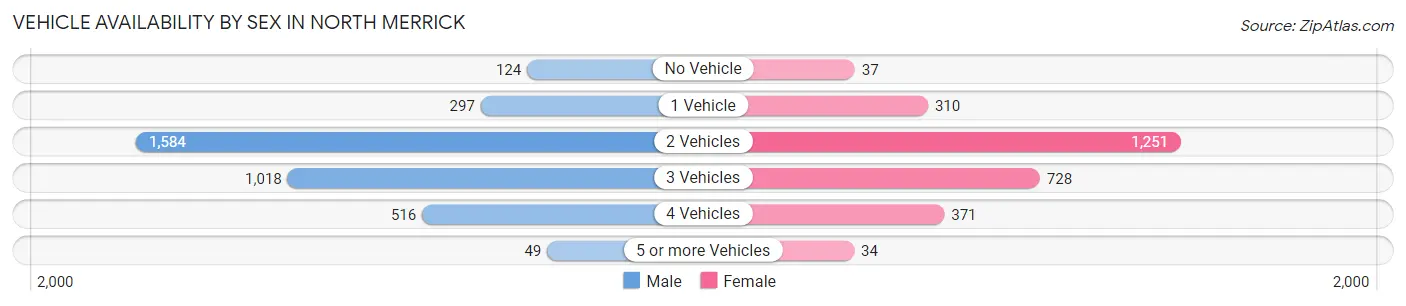
| Vehicles Available | Male | Female |
| No Vehicle | 124 (3.5%) | 37 (1.3%) |
| 1 Vehicle | 297 (8.3%) | 310 (11.4%) |
| 2 Vehicles | 1,584 (44.2%) | 1,251 (45.8%) |
| 3 Vehicles | 1,018 (28.4%) | 728 (26.7%) |
| 4 Vehicles | 516 (14.4%) | 371 (13.6%) |
| 5 or more Vehicles | 49 (1.4%) | 34 (1.2%) |
| Total | 3,588 (100.0%) | 2,731 (100.0%) |
Commute Time in North Merrick
The most frequently occuring commute durations in North Merrick are 30 to 34 minutes (932 commuters, 16.3%), 60 to 89 minutes (769 commuters, 13.5%), and 45 to 59 minutes (623 commuters, 10.9%).
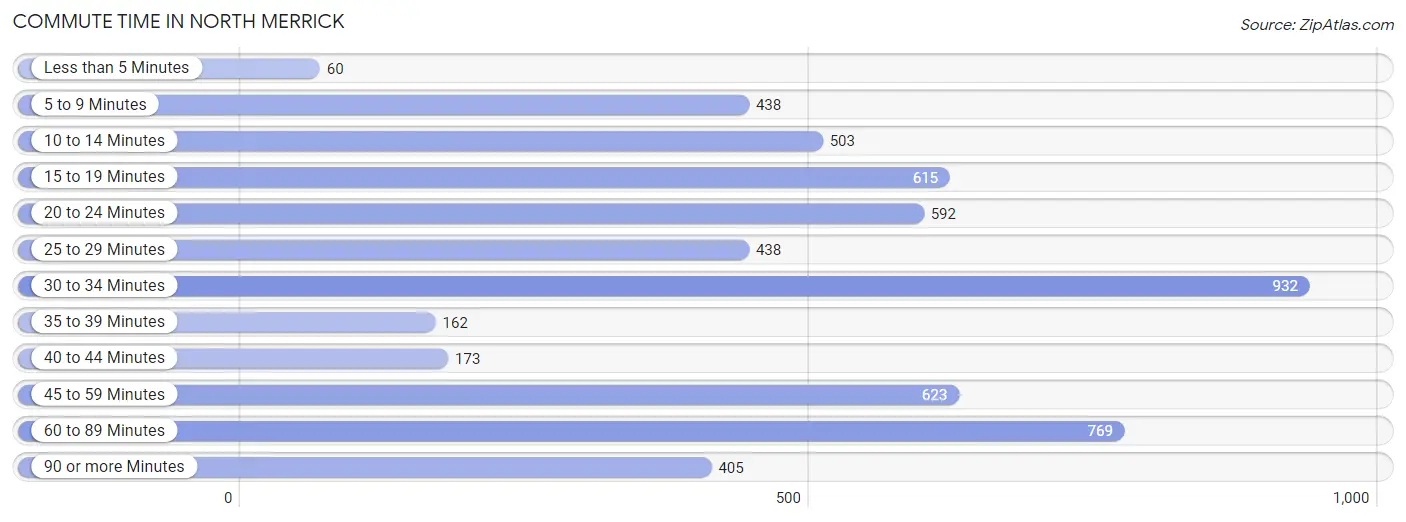
| Commute Time | # Commuters | % Commuters |
| Less than 5 Minutes | 60 | 1.1% |
| 5 to 9 Minutes | 438 | 7.7% |
| 10 to 14 Minutes | 503 | 8.8% |
| 15 to 19 Minutes | 615 | 10.8% |
| 20 to 24 Minutes | 592 | 10.4% |
| 25 to 29 Minutes | 438 | 7.7% |
| 30 to 34 Minutes | 932 | 16.3% |
| 35 to 39 Minutes | 162 | 2.8% |
| 40 to 44 Minutes | 173 | 3.0% |
| 45 to 59 Minutes | 623 | 10.9% |
| 60 to 89 Minutes | 769 | 13.5% |
| 90 or more Minutes | 405 | 7.1% |
Commute Time by Sex in North Merrick
The most common commute times in North Merrick are 30 to 34 minutes (684 commuters, 21.2%) for males and 5 to 9 minutes (330 commuters, 13.3%) for females.
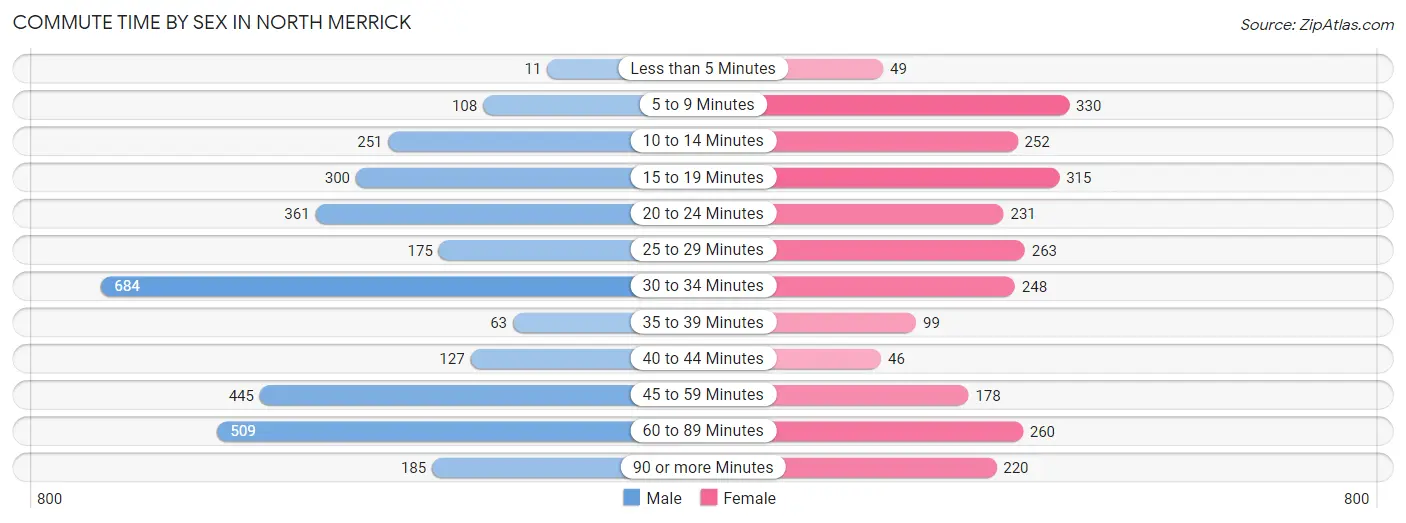
| Commute Time | Male | Female |
| Less than 5 Minutes | 11 (0.3%) | 49 (2.0%) |
| 5 to 9 Minutes | 108 (3.4%) | 330 (13.3%) |
| 10 to 14 Minutes | 251 (7.8%) | 252 (10.1%) |
| 15 to 19 Minutes | 300 (9.3%) | 315 (12.7%) |
| 20 to 24 Minutes | 361 (11.2%) | 231 (9.3%) |
| 25 to 29 Minutes | 175 (5.4%) | 263 (10.6%) |
| 30 to 34 Minutes | 684 (21.2%) | 248 (10.0%) |
| 35 to 39 Minutes | 63 (2.0%) | 99 (4.0%) |
| 40 to 44 Minutes | 127 (4.0%) | 46 (1.8%) |
| 45 to 59 Minutes | 445 (13.8%) | 178 (7.1%) |
| 60 to 89 Minutes | 509 (15.8%) | 260 (10.4%) |
| 90 or more Minutes | 185 (5.8%) | 220 (8.8%) |
Time of Departure to Work by Sex in North Merrick
The most frequent times of departure to work in North Merrick are 7:00 AM to 7:29 AM (612, 19.0%) for males and 8:00 AM to 8:29 AM (648, 26.0%) for females.
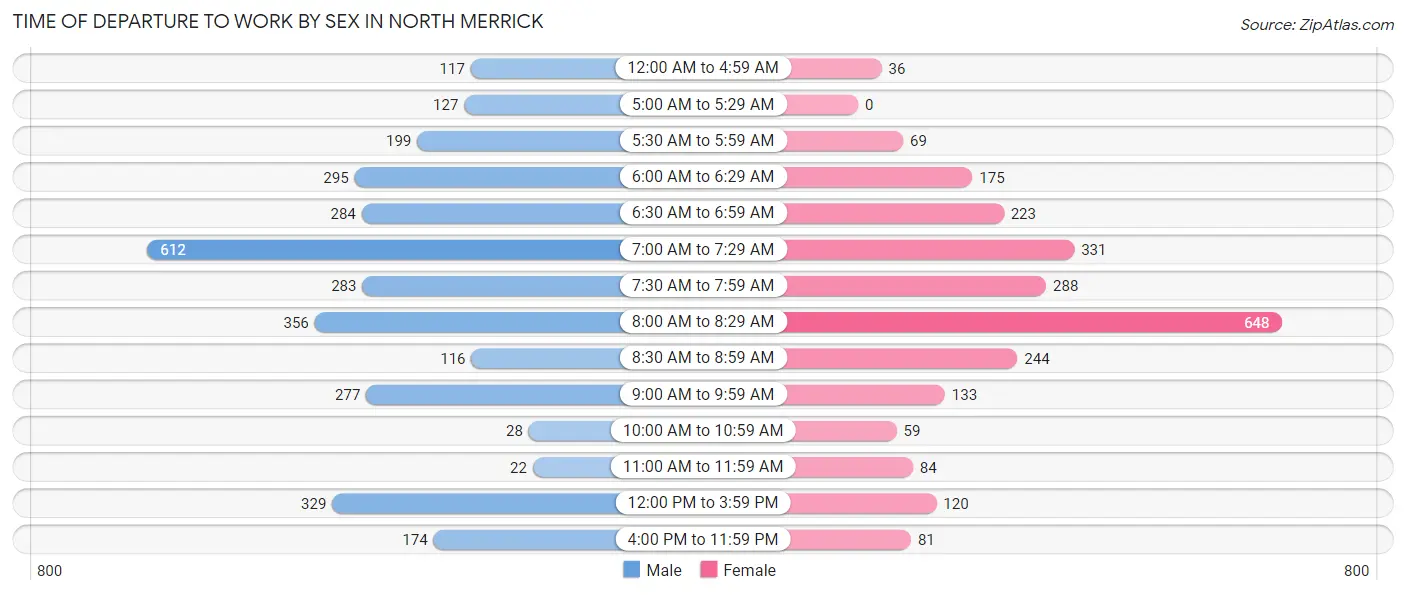
| Time of Departure | Male | Female |
| 12:00 AM to 4:59 AM | 117 (3.6%) | 36 (1.5%) |
| 5:00 AM to 5:29 AM | 127 (4.0%) | 0 (0.0%) |
| 5:30 AM to 5:59 AM | 199 (6.2%) | 69 (2.8%) |
| 6:00 AM to 6:29 AM | 295 (9.2%) | 175 (7.0%) |
| 6:30 AM to 6:59 AM | 284 (8.8%) | 223 (8.9%) |
| 7:00 AM to 7:29 AM | 612 (19.0%) | 331 (13.3%) |
| 7:30 AM to 7:59 AM | 283 (8.8%) | 288 (11.6%) |
| 8:00 AM to 8:29 AM | 356 (11.1%) | 648 (26.0%) |
| 8:30 AM to 8:59 AM | 116 (3.6%) | 244 (9.8%) |
| 9:00 AM to 9:59 AM | 277 (8.6%) | 133 (5.3%) |
| 10:00 AM to 10:59 AM | 28 (0.9%) | 59 (2.4%) |
| 11:00 AM to 11:59 AM | 22 (0.7%) | 84 (3.4%) |
| 12:00 PM to 3:59 PM | 329 (10.2%) | 120 (4.8%) |
| 4:00 PM to 11:59 PM | 174 (5.4%) | 81 (3.3%) |
| Total | 3,219 (100.0%) | 2,491 (100.0%) |
Housing Occupancy in North Merrick
Occupancy by Ownership in North Merrick
Of the total 4,043 dwellings in North Merrick, owner-occupied units account for 3,837 (94.9%), while renter-occupied units make up 206 (5.1%).
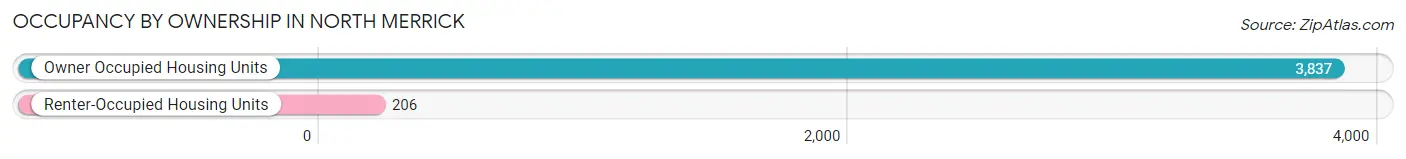
| Occupancy | # Housing Units | % Housing Units |
| Owner Occupied Housing Units | 3,837 | 94.9% |
| Renter-Occupied Housing Units | 206 | 5.1% |
| Total Occupied Housing Units | 4,043 | 100.0% |
Occupancy by Household Size in North Merrick
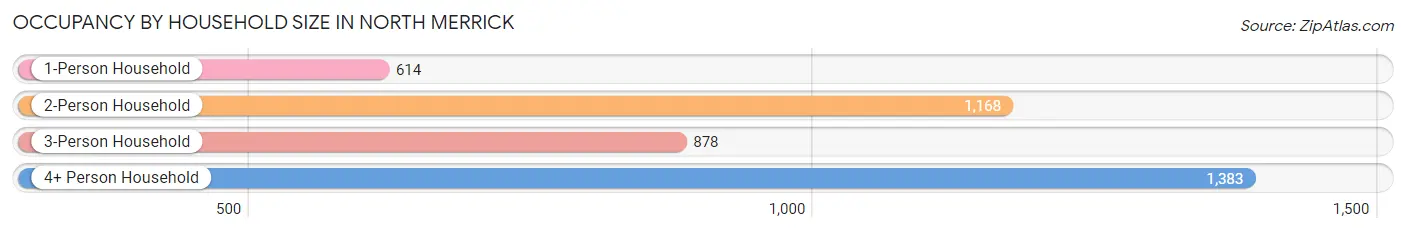
| Household Size | # Housing Units | % Housing Units |
| 1-Person Household | 614 | 15.2% |
| 2-Person Household | 1,168 | 28.9% |
| 3-Person Household | 878 | 21.7% |
| 4+ Person Household | 1,383 | 34.2% |
| Total Housing Units | 4,043 | 100.0% |
Occupancy by Ownership by Household Size in North Merrick
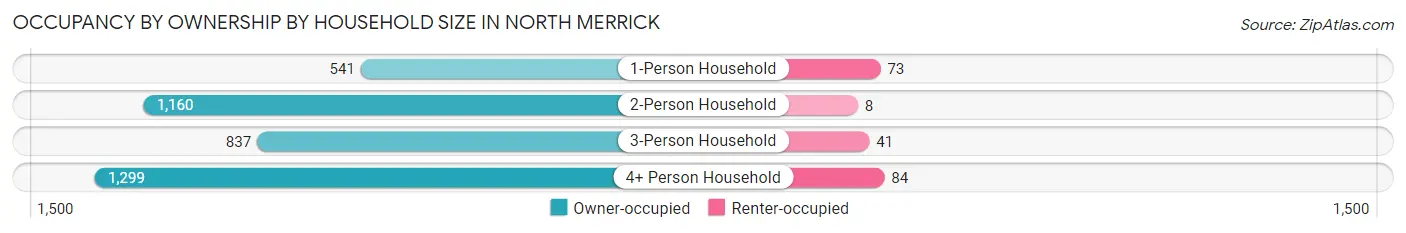
| Household Size | Owner-occupied | Renter-occupied |
| 1-Person Household | 541 (88.1%) | 73 (11.9%) |
| 2-Person Household | 1,160 (99.3%) | 8 (0.7%) |
| 3-Person Household | 837 (95.3%) | 41 (4.7%) |
| 4+ Person Household | 1,299 (93.9%) | 84 (6.1%) |
| Total Housing Units | 3,837 (94.9%) | 206 (5.1%) |
Occupancy by Educational Attainment in North Merrick
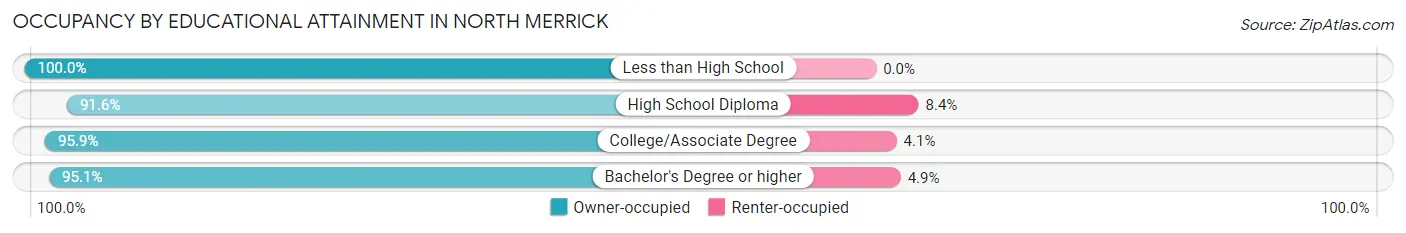
| Household Size | Owner-occupied | Renter-occupied |
| Less than High School | 198 (100.0%) | 0 (0.0%) |
| High School Diploma | 686 (91.6%) | 63 (8.4%) |
| College/Associate Degree | 899 (95.9%) | 38 (4.1%) |
| Bachelor's Degree or higher | 2,054 (95.1%) | 105 (4.9%) |
Occupancy by Age of Householder in North Merrick
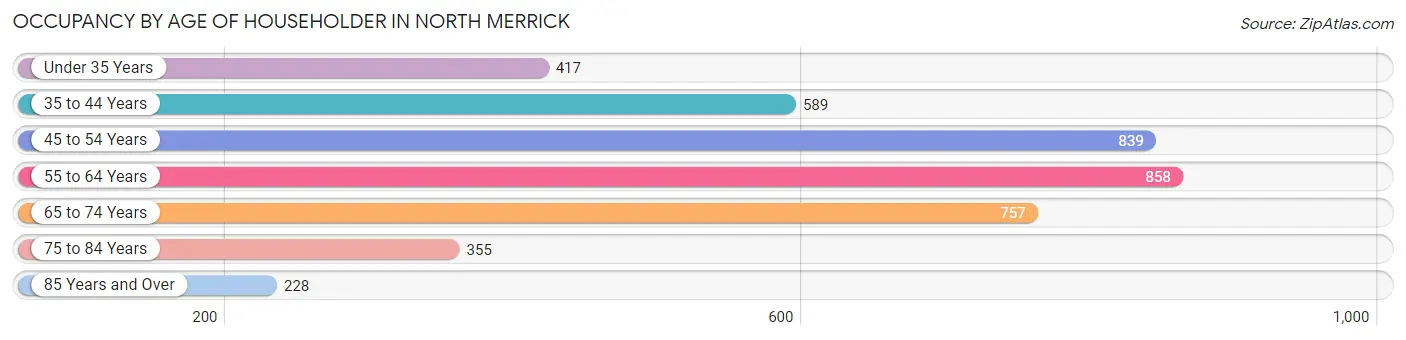
| Age Bracket | # Households | % Households |
| Under 35 Years | 417 | 10.3% |
| 35 to 44 Years | 589 | 14.6% |
| 45 to 54 Years | 839 | 20.7% |
| 55 to 64 Years | 858 | 21.2% |
| 65 to 74 Years | 757 | 18.7% |
| 75 to 84 Years | 355 | 8.8% |
| 85 Years and Over | 228 | 5.6% |
| Total | 4,043 | 100.0% |
Housing Finances in North Merrick
Median Income by Occupancy in North Merrick
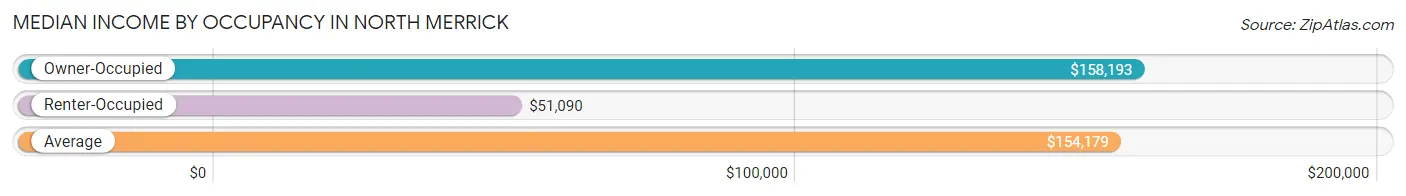
| Occupancy Type | # Households | Median Income |
| Owner-Occupied | 3,837 (94.9%) | $158,193 |
| Renter-Occupied | 206 (5.1%) | $51,090 |
| Average | 4,043 (100.0%) | $154,179 |
Occupancy by Householder Income Bracket in North Merrick
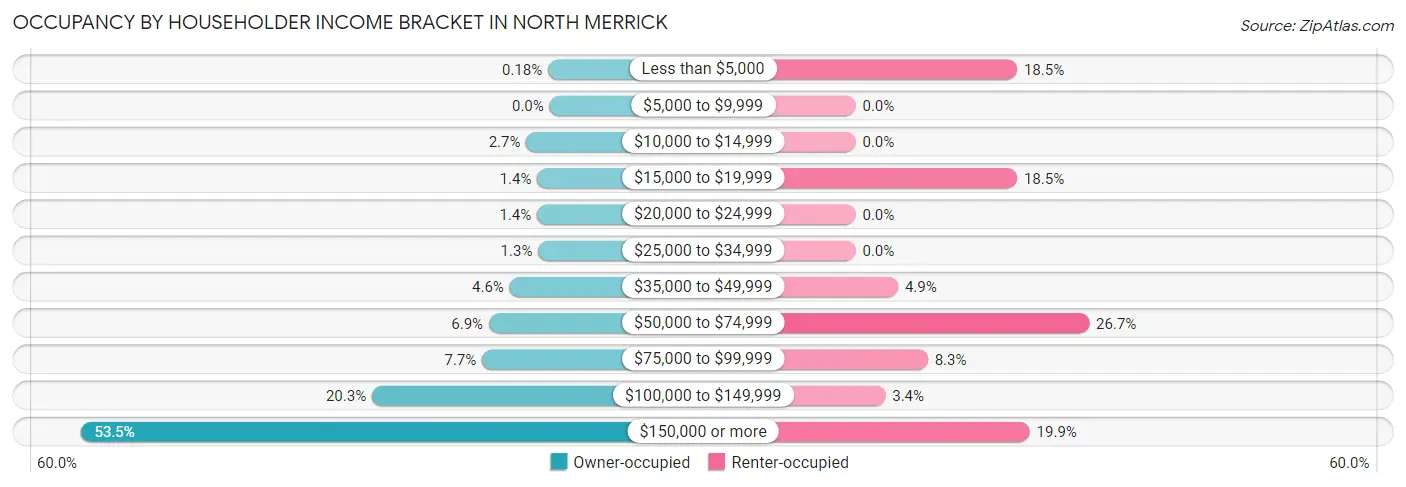
| Income Bracket | Owner-occupied | Renter-occupied |
| Less than $5,000 | 7 (0.2%) | 38 (18.4%) |
| $5,000 to $9,999 | 0 (0.0%) | 0 (0.0%) |
| $10,000 to $14,999 | 102 (2.7%) | 0 (0.0%) |
| $15,000 to $19,999 | 54 (1.4%) | 38 (18.4%) |
| $20,000 to $24,999 | 55 (1.4%) | 0 (0.0%) |
| $25,000 to $34,999 | 50 (1.3%) | 0 (0.0%) |
| $35,000 to $49,999 | 175 (4.6%) | 10 (4.9%) |
| $50,000 to $74,999 | 266 (6.9%) | 55 (26.7%) |
| $75,000 to $99,999 | 296 (7.7%) | 17 (8.3%) |
| $100,000 to $149,999 | 779 (20.3%) | 7 (3.4%) |
| $150,000 or more | 2,053 (53.5%) | 41 (19.9%) |
| Total | 3,837 (100.0%) | 206 (100.0%) |
Monthly Housing Cost Tiers in North Merrick
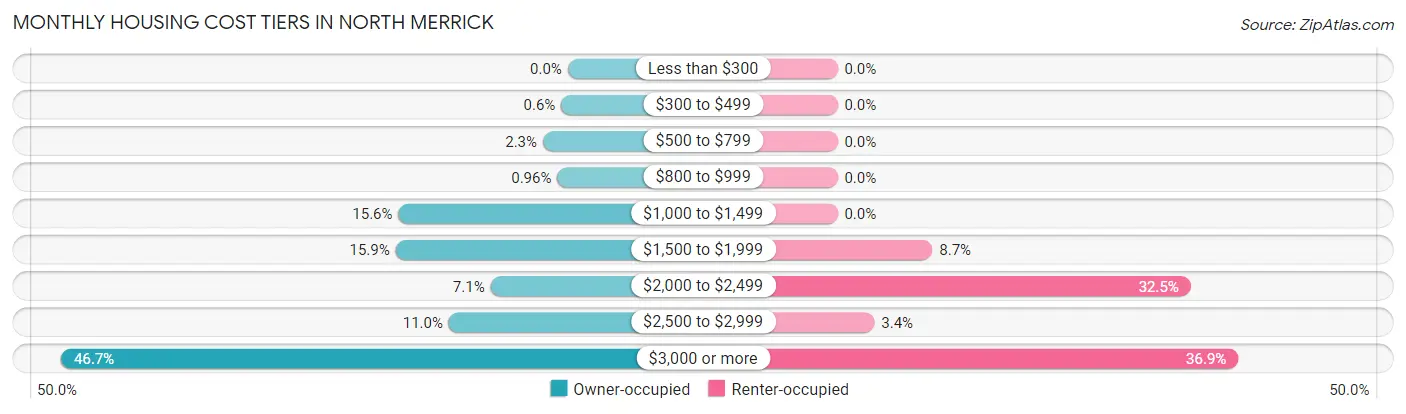
| Monthly Cost | Owner-occupied | Renter-occupied |
| Less than $300 | 0 (0.0%) | 0 (0.0%) |
| $300 to $499 | 23 (0.6%) | 0 (0.0%) |
| $500 to $799 | 88 (2.3%) | 0 (0.0%) |
| $800 to $999 | 37 (1.0%) | 0 (0.0%) |
| $1,000 to $1,499 | 598 (15.6%) | 0 (0.0%) |
| $1,500 to $1,999 | 608 (15.9%) | 18 (8.7%) |
| $2,000 to $2,499 | 273 (7.1%) | 67 (32.5%) |
| $2,500 to $2,999 | 420 (11.0%) | 7 (3.4%) |
| $3,000 or more | 1,790 (46.7%) | 76 (36.9%) |
| Total | 3,837 (100.0%) | 206 (100.0%) |
Physical Housing Characteristics in North Merrick
Housing Structures in North Merrick
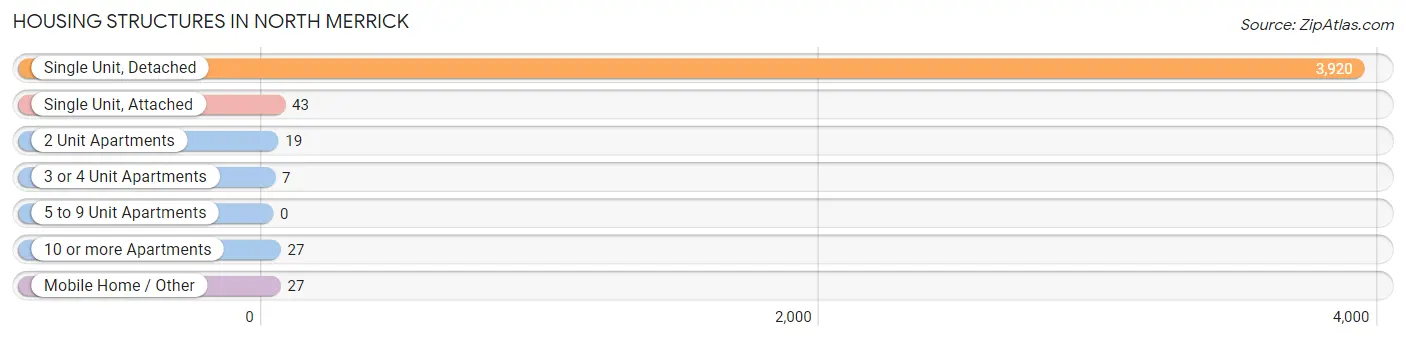
| Structure Type | # Housing Units | % Housing Units |
| Single Unit, Detached | 3,920 | 97.0% |
| Single Unit, Attached | 43 | 1.1% |
| 2 Unit Apartments | 19 | 0.5% |
| 3 or 4 Unit Apartments | 7 | 0.2% |
| 5 to 9 Unit Apartments | 0 | 0.0% |
| 10 or more Apartments | 27 | 0.7% |
| Mobile Home / Other | 27 | 0.7% |
| Total | 4,043 | 100.0% |
Housing Structures by Occupancy in North Merrick
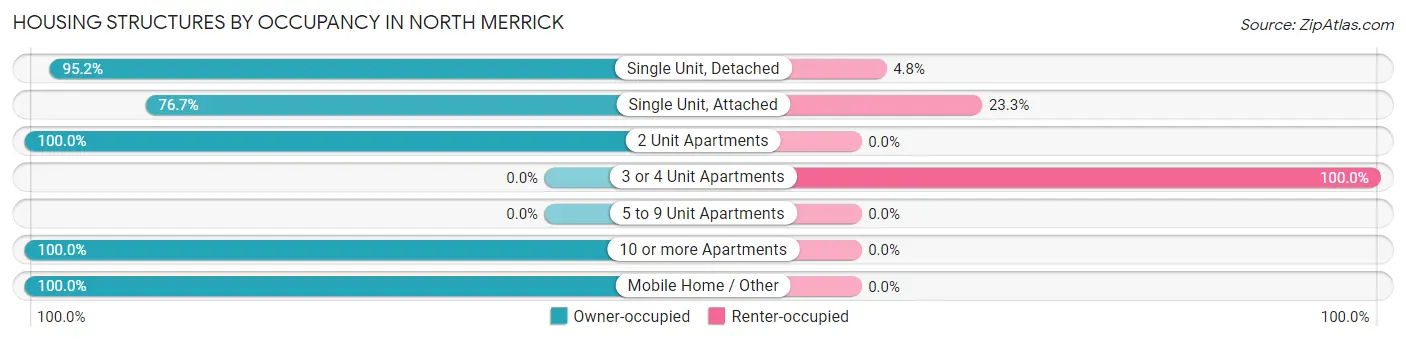
| Structure Type | Owner-occupied | Renter-occupied |
| Single Unit, Detached | 3,731 (95.2%) | 189 (4.8%) |
| Single Unit, Attached | 33 (76.7%) | 10 (23.3%) |
| 2 Unit Apartments | 19 (100.0%) | 0 (0.0%) |
| 3 or 4 Unit Apartments | 0 (0.0%) | 7 (100.0%) |
| 5 to 9 Unit Apartments | 0 (0.0%) | 0 (0.0%) |
| 10 or more Apartments | 27 (100.0%) | 0 (0.0%) |
| Mobile Home / Other | 27 (100.0%) | 0 (0.0%) |
| Total | 3,837 (94.9%) | 206 (5.1%) |
Housing Structures by Number of Rooms in North Merrick
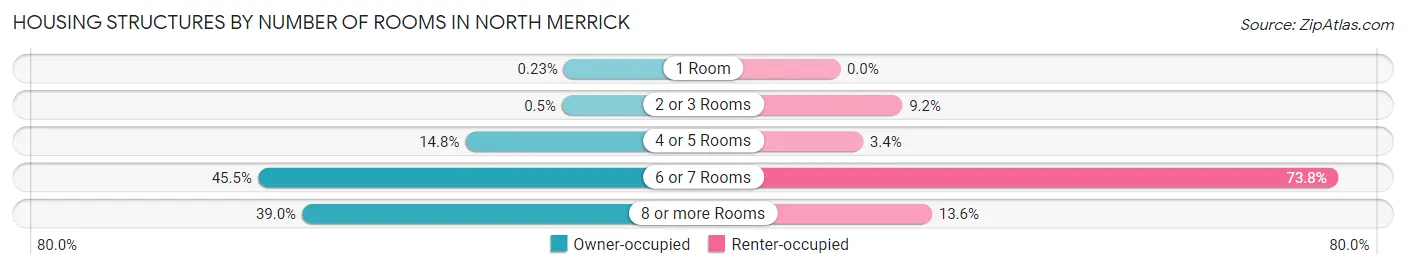
| Number of Rooms | Owner-occupied | Renter-occupied |
| 1 Room | 9 (0.2%) | 0 (0.0%) |
| 2 or 3 Rooms | 19 (0.5%) | 19 (9.2%) |
| 4 or 5 Rooms | 568 (14.8%) | 7 (3.4%) |
| 6 or 7 Rooms | 1,746 (45.5%) | 152 (73.8%) |
| 8 or more Rooms | 1,495 (39.0%) | 28 (13.6%) |
| Total | 3,837 (100.0%) | 206 (100.0%) |
Housing Structure by Heating Type in North Merrick
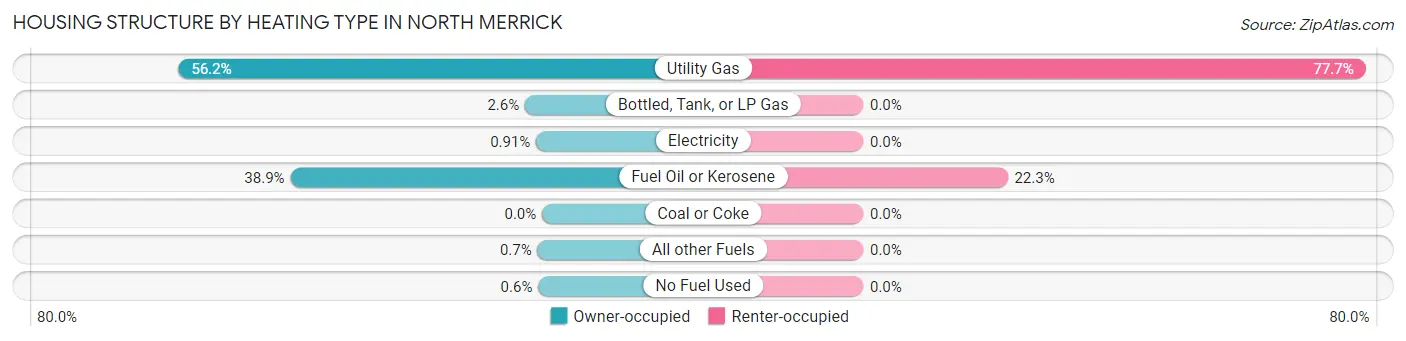
| Heating Type | Owner-occupied | Renter-occupied |
| Utility Gas | 2,158 (56.2%) | 160 (77.7%) |
| Bottled, Tank, or LP Gas | 101 (2.6%) | 0 (0.0%) |
| Electricity | 35 (0.9%) | 0 (0.0%) |
| Fuel Oil or Kerosene | 1,493 (38.9%) | 46 (22.3%) |
| Coal or Coke | 0 (0.0%) | 0 (0.0%) |
| All other Fuels | 27 (0.7%) | 0 (0.0%) |
| No Fuel Used | 23 (0.6%) | 0 (0.0%) |
| Total | 3,837 (100.0%) | 206 (100.0%) |
Household Vehicle Usage in North Merrick
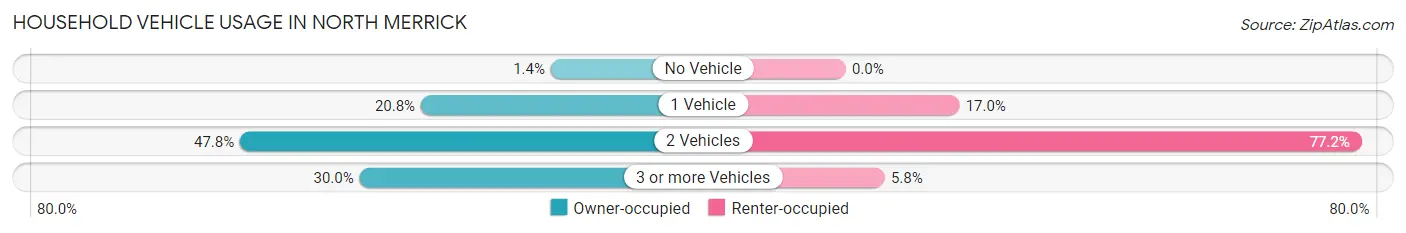
| Vehicles per Household | Owner-occupied | Renter-occupied |
| No Vehicle | 54 (1.4%) | 0 (0.0%) |
| 1 Vehicle | 798 (20.8%) | 35 (17.0%) |
| 2 Vehicles | 1,835 (47.8%) | 159 (77.2%) |
| 3 or more Vehicles | 1,150 (30.0%) | 12 (5.8%) |
| Total | 3,837 (100.0%) | 206 (100.0%) |
Real Estate & Mortgages in North Merrick
Real Estate and Mortgage Overview in North Merrick
| Characteristic | Without Mortgage | With Mortgage |
| Housing Units | 1,450 | 2,387 |
| Median Property Value | $608,900 | $630,000 |
| Median Household Income | $103,333 | $1,580 |
| Monthly Housing Costs | $1,478 | $1,766 |
| Real Estate Taxes | $10,001 | $0 |
Property Value by Mortgage Status in North Merrick
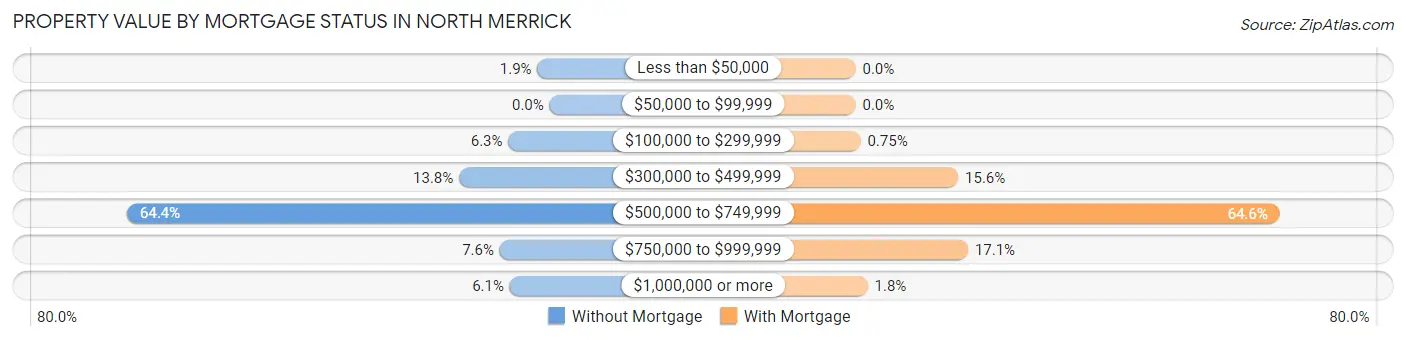
| Property Value | Without Mortgage | With Mortgage |
| Less than $50,000 | 27 (1.9%) | 0 (0.0%) |
| $50,000 to $99,999 | 0 (0.0%) | 0 (0.0%) |
| $100,000 to $299,999 | 91 (6.3%) | 18 (0.7%) |
| $300,000 to $499,999 | 200 (13.8%) | 373 (15.6%) |
| $500,000 to $749,999 | 934 (64.4%) | 1,543 (64.6%) |
| $750,000 to $999,999 | 110 (7.6%) | 409 (17.1%) |
| $1,000,000 or more | 88 (6.1%) | 44 (1.8%) |
| Total | 1,450 (100.0%) | 2,387 (100.0%) |
Household Income by Mortgage Status in North Merrick
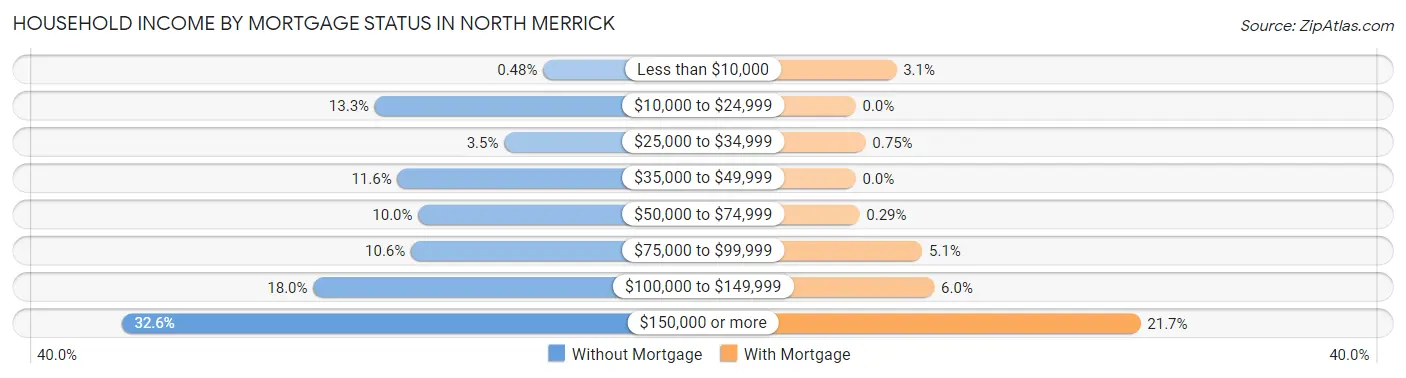
| Household Income | Without Mortgage | With Mortgage |
| Less than $10,000 | 7 (0.5%) | 74 (3.1%) |
| $10,000 to $24,999 | 193 (13.3%) | 0 (0.0%) |
| $25,000 to $34,999 | 50 (3.5%) | 18 (0.7%) |
| $35,000 to $49,999 | 168 (11.6%) | 0 (0.0%) |
| $50,000 to $74,999 | 145 (10.0%) | 7 (0.3%) |
| $75,000 to $99,999 | 153 (10.5%) | 121 (5.1%) |
| $100,000 to $149,999 | 261 (18.0%) | 143 (6.0%) |
| $150,000 or more | 473 (32.6%) | 518 (21.7%) |
| Total | 1,450 (100.0%) | 2,387 (100.0%) |
Property Value to Household Income Ratio in North Merrick
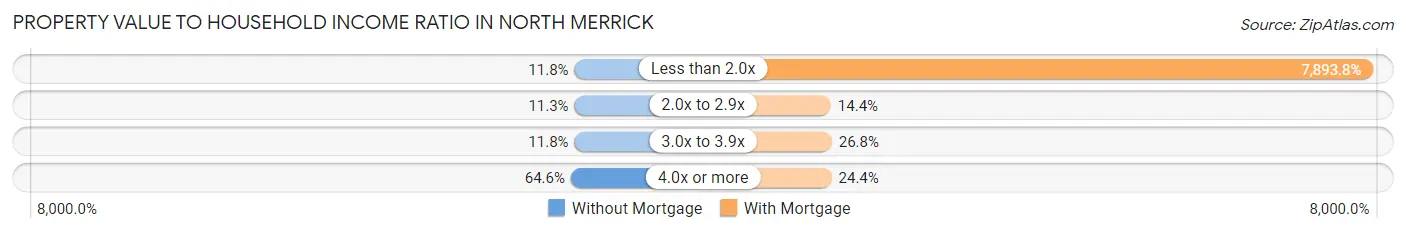
| Value-to-Income Ratio | Without Mortgage | With Mortgage |
| Less than 2.0x | 171 (11.8%) | 188,424 (7,893.8%) |
| 2.0x to 2.9x | 164 (11.3%) | 344 (14.4%) |
| 3.0x to 3.9x | 171 (11.8%) | 640 (26.8%) |
| 4.0x or more | 937 (64.6%) | 582 (24.4%) |
| Total | 1,450 (100.0%) | 2,387 (100.0%) |
Real Estate Taxes by Mortgage Status in North Merrick
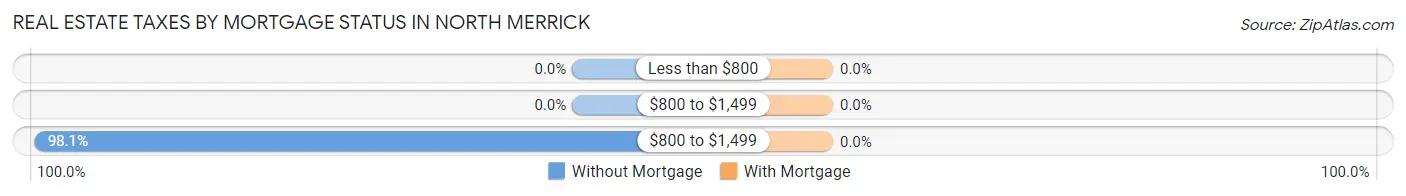
| Property Taxes | Without Mortgage | With Mortgage |
| Less than $800 | 0 (0.0%) | 0 (0.0%) |
| $800 to $1,499 | 0 (0.0%) | 0 (0.0%) |
| $800 to $1,499 | 1,423 (98.1%) | 0 (0.0%) |
| Total | 1,450 (100.0%) | 2,387 (100.0%) |
Health & Disability in North Merrick
Health Insurance Coverage by Age in North Merrick
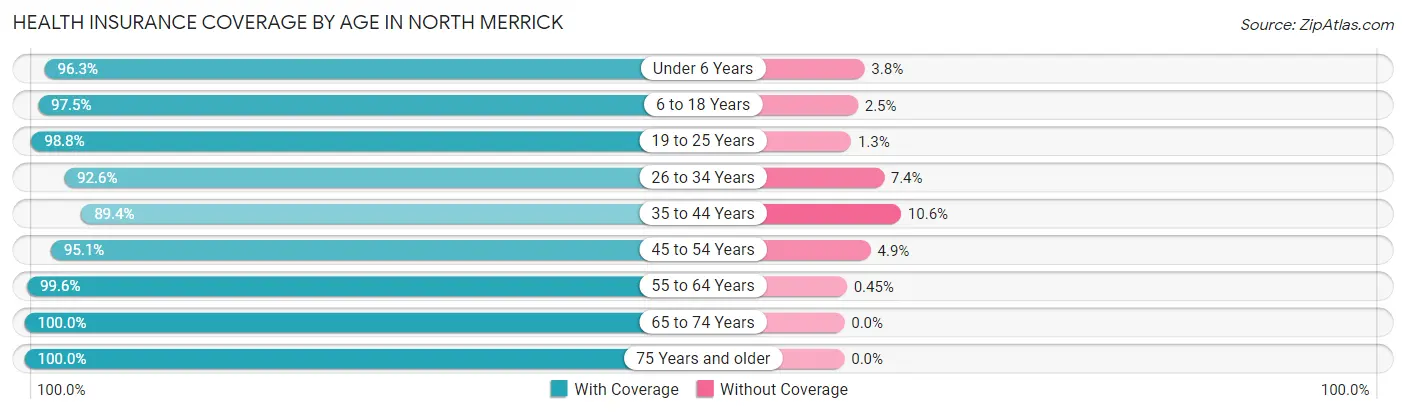
| Age Bracket | With Coverage | Without Coverage |
| Under 6 Years | 924 (96.3%) | 36 (3.7%) |
| 6 to 18 Years | 1,816 (97.5%) | 47 (2.5%) |
| 19 to 25 Years | 868 (98.8%) | 11 (1.3%) |
| 26 to 34 Years | 1,258 (92.6%) | 100 (7.4%) |
| 35 to 44 Years | 1,346 (89.4%) | 159 (10.6%) |
| 45 to 54 Years | 1,684 (95.1%) | 87 (4.9%) |
| 55 to 64 Years | 1,559 (99.6%) | 7 (0.4%) |
| 65 to 74 Years | 1,473 (100.0%) | 0 (0.0%) |
| 75 Years and older | 817 (100.0%) | 0 (0.0%) |
| Total | 11,745 (96.3%) | 447 (3.7%) |
Health Insurance Coverage by Citizenship Status in North Merrick
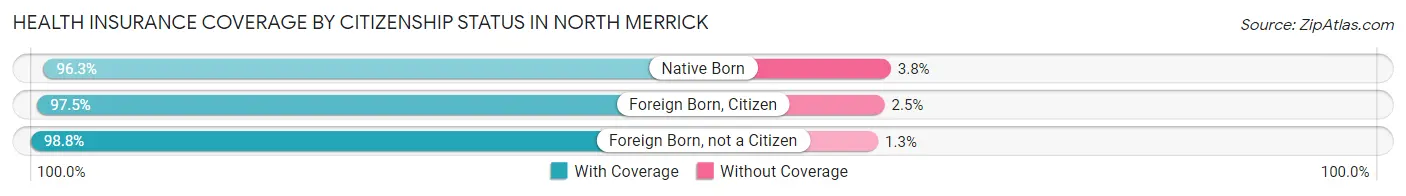
| Citizenship Status | With Coverage | Without Coverage |
| Native Born | 924 (96.3%) | 36 (3.7%) |
| Foreign Born, Citizen | 1,816 (97.5%) | 47 (2.5%) |
| Foreign Born, not a Citizen | 868 (98.8%) | 11 (1.3%) |
Health Insurance Coverage by Household Income in North Merrick
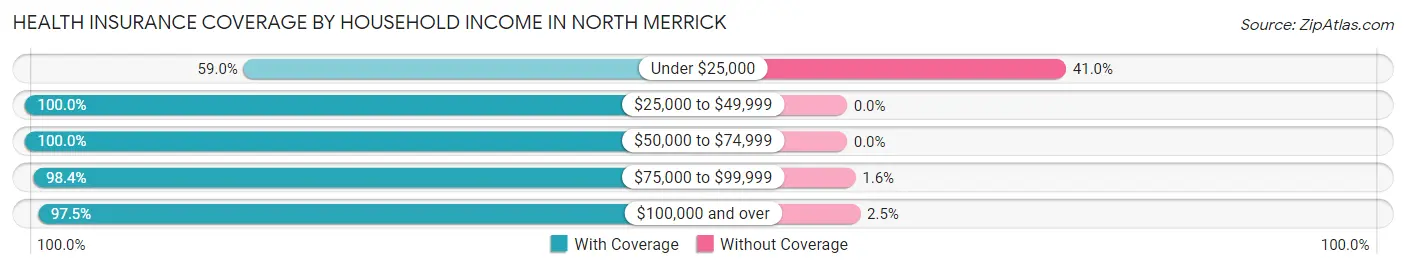
| Household Income | With Coverage | Without Coverage |
| Under $25,000 | 273 (59.0%) | 190 (41.0%) |
| $25,000 to $49,999 | 387 (100.0%) | 0 (0.0%) |
| $50,000 to $74,999 | 748 (100.0%) | 0 (0.0%) |
| $75,000 to $99,999 | 732 (98.4%) | 12 (1.6%) |
| $100,000 and over | 9,582 (97.5%) | 245 (2.5%) |
Public vs Private Health Insurance Coverage by Age in North Merrick
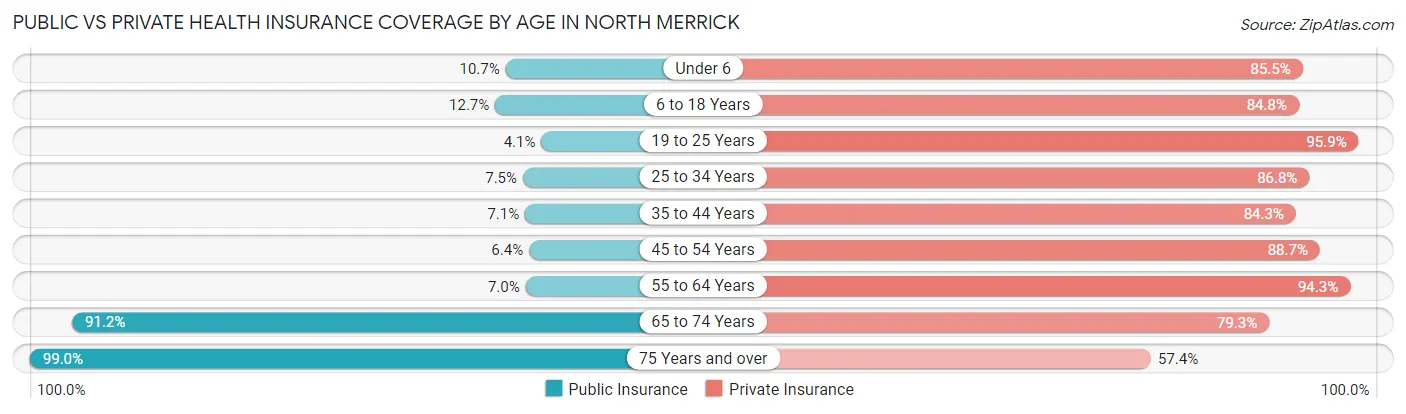
| Age Bracket | Public Insurance | Private Insurance |
| Under 6 | 103 (10.7%) | 821 (85.5%) |
| 6 to 18 Years | 236 (12.7%) | 1,580 (84.8%) |
| 19 to 25 Years | 36 (4.1%) | 843 (95.9%) |
| 25 to 34 Years | 102 (7.5%) | 1,178 (86.8%) |
| 35 to 44 Years | 107 (7.1%) | 1,268 (84.3%) |
| 45 to 54 Years | 113 (6.4%) | 1,571 (88.7%) |
| 55 to 64 Years | 110 (7.0%) | 1,477 (94.3%) |
| 65 to 74 Years | 1,343 (91.2%) | 1,168 (79.3%) |
| 75 Years and over | 809 (99.0%) | 469 (57.4%) |
| Total | 2,959 (24.3%) | 10,375 (85.1%) |
Disability Status by Sex by Age in North Merrick
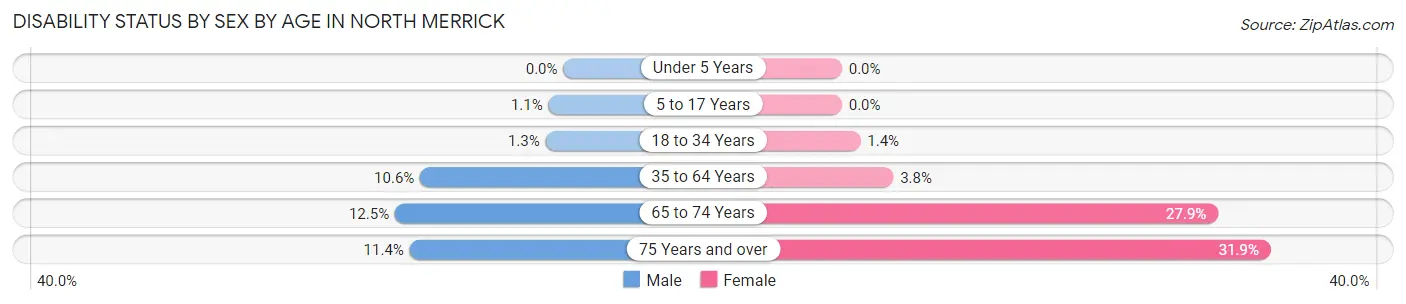
| Age Bracket | Male | Female |
| Under 5 Years | 0 (0.0%) | 0 (0.0%) |
| 5 to 17 Years | 10 (1.1%) | 0 (0.0%) |
| 18 to 34 Years | 17 (1.3%) | 14 (1.4%) |
| 35 to 64 Years | 270 (10.6%) | 88 (3.8%) |
| 65 to 74 Years | 83 (12.5%) | 226 (27.9%) |
| 75 Years and over | 42 (11.4%) | 143 (31.9%) |
Disability Class by Sex by Age in North Merrick
Disability Class: Hearing Difficulty
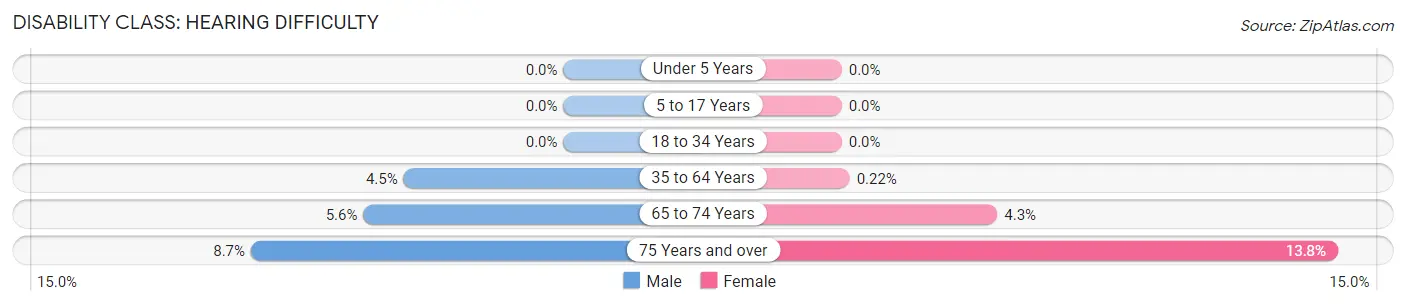
| Age Bracket | Male | Female |
| Under 5 Years | 0 (0.0%) | 0 (0.0%) |
| 5 to 17 Years | 0 (0.0%) | 0 (0.0%) |
| 18 to 34 Years | 0 (0.0%) | 0 (0.0%) |
| 35 to 64 Years | 113 (4.4%) | 5 (0.2%) |
| 65 to 74 Years | 37 (5.6%) | 35 (4.3%) |
| 75 Years and over | 32 (8.7%) | 62 (13.8%) |
Disability Class: Vision Difficulty
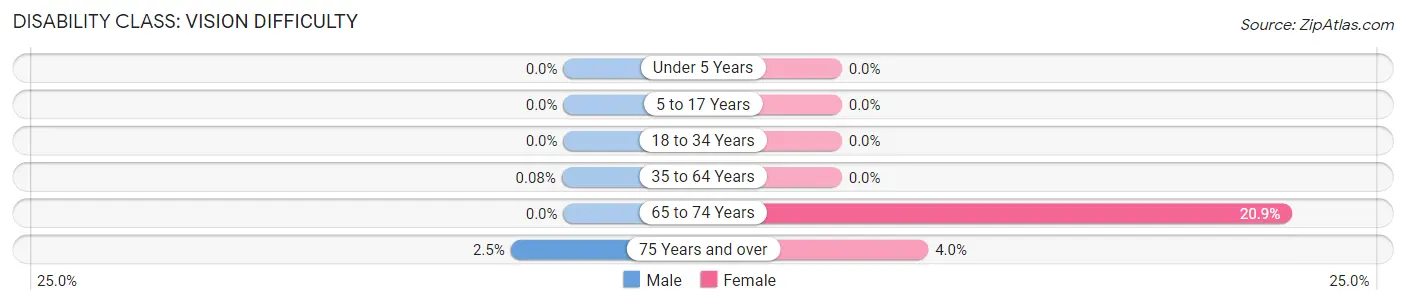
| Age Bracket | Male | Female |
| Under 5 Years | 0 (0.0%) | 0 (0.0%) |
| 5 to 17 Years | 0 (0.0%) | 0 (0.0%) |
| 18 to 34 Years | 0 (0.0%) | 0 (0.0%) |
| 35 to 64 Years | 2 (0.1%) | 0 (0.0%) |
| 65 to 74 Years | 0 (0.0%) | 169 (20.9%) |
| 75 Years and over | 9 (2.5%) | 18 (4.0%) |
Disability Class: Cognitive Difficulty
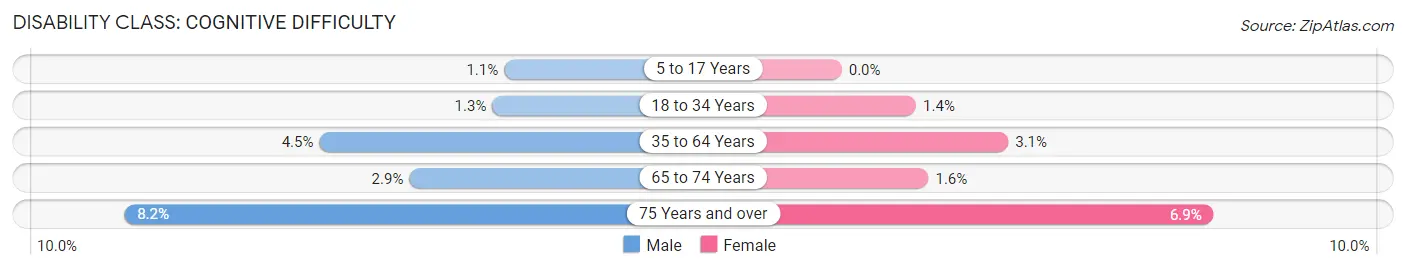
| Age Bracket | Male | Female |
| 5 to 17 Years | 10 (1.1%) | 0 (0.0%) |
| 18 to 34 Years | 17 (1.3%) | 14 (1.4%) |
| 35 to 64 Years | 115 (4.5%) | 71 (3.1%) |
| 65 to 74 Years | 19 (2.9%) | 13 (1.6%) |
| 75 Years and over | 30 (8.2%) | 31 (6.9%) |
Disability Class: Ambulatory Difficulty
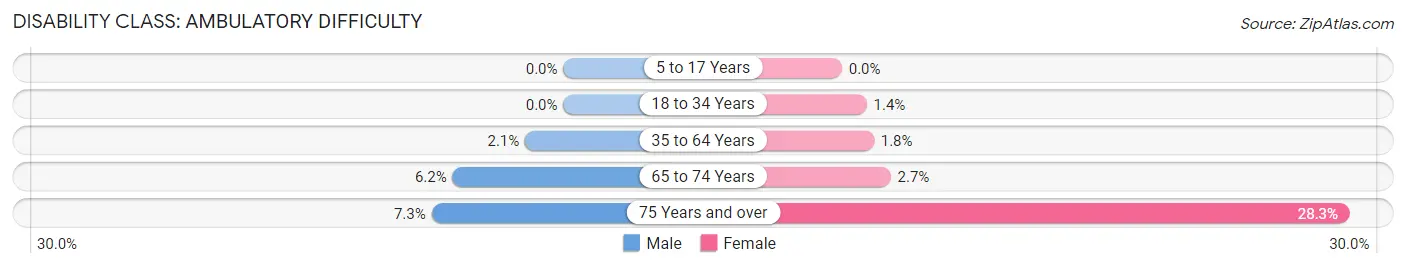
| Age Bracket | Male | Female |
| 5 to 17 Years | 0 (0.0%) | 0 (0.0%) |
| 18 to 34 Years | 0 (0.0%) | 14 (1.4%) |
| 35 to 64 Years | 54 (2.1%) | 41 (1.8%) |
| 65 to 74 Years | 41 (6.2%) | 22 (2.7%) |
| 75 Years and over | 27 (7.3%) | 127 (28.3%) |
Disability Class: Self-Care Difficulty
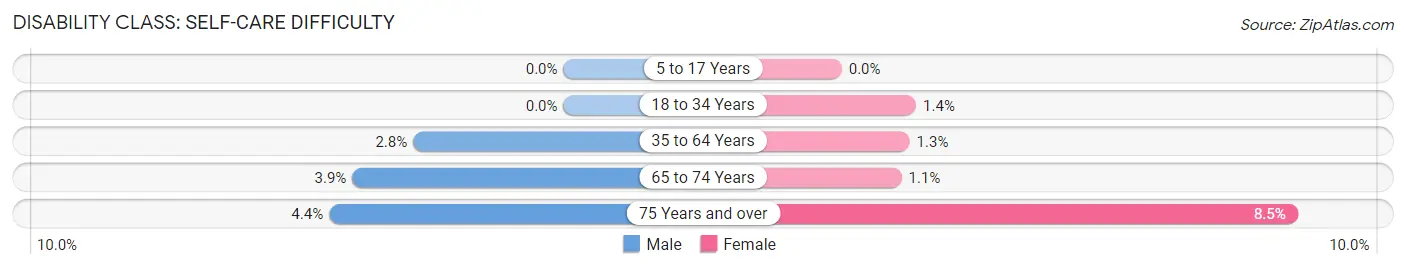
| Age Bracket | Male | Female |
| 5 to 17 Years | 0 (0.0%) | 0 (0.0%) |
| 18 to 34 Years | 0 (0.0%) | 14 (1.4%) |
| 35 to 64 Years | 71 (2.8%) | 29 (1.3%) |
| 65 to 74 Years | 26 (3.9%) | 9 (1.1%) |
| 75 Years and over | 16 (4.3%) | 38 (8.5%) |
Technology Access in North Merrick
Computing Device Access in North Merrick
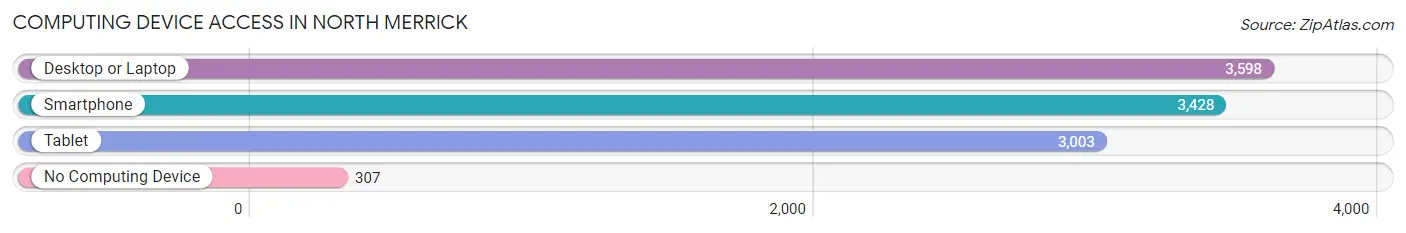
| Device Type | # Households | % Households |
| Desktop or Laptop | 3,598 | 89.0% |
| Smartphone | 3,428 | 84.8% |
| Tablet | 3,003 | 74.3% |
| No Computing Device | 307 | 7.6% |
| Total | 4,043 | 100.0% |
Internet Access in North Merrick
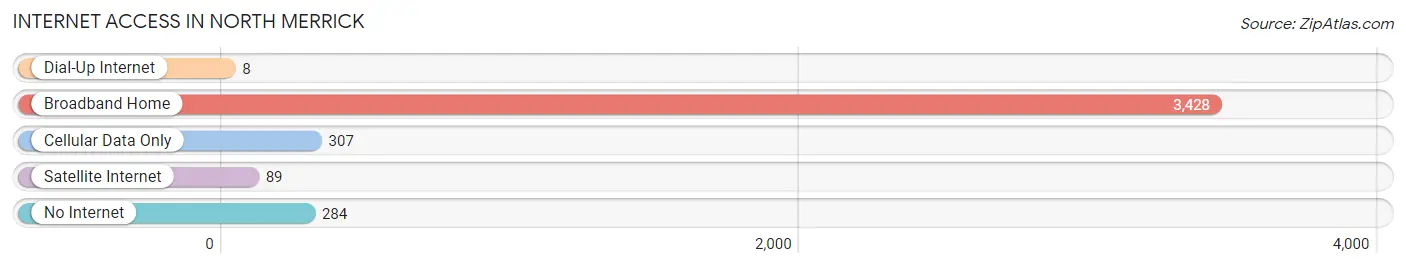
| Internet Type | # Households | % Households |
| Dial-Up Internet | 8 | 0.2% |
| Broadband Home | 3,428 | 84.8% |
| Cellular Data Only | 307 | 7.6% |
| Satellite Internet | 89 | 2.2% |
| No Internet | 284 | 7.0% |
| Total | 4,043 | 100.0% |
North Merrick Summary
Merrick is a hamlet and census-designated place (CDP) located in the Town of Hempstead in Nassau County, New York, United States. The population was 22,097 at the 2010 census.
History
Merrick was originally known as Meroke, which was derived from the Native American term Meroke, meaning "peaceful land". The area was first settled by Europeans in 1643, when a group of English Puritans from Lynn, Massachusetts, led by Richard Holbrook, purchased land from the Meroke Indians. The area was known as Holbrook's Neck until 1843, when it was renamed Merrick after Meroke.
In 1855, the South Side Railroad was extended to Merrick, and the area began to grow rapidly. The railroad brought with it an influx of new residents, businesses, and industries. By the late 19th century, Merrick had become a popular summer resort for wealthy New Yorkers.
In the early 20th century, Merrick continued to grow, and by the 1950s, it had become a thriving suburban community. In the 1970s, Merrick was incorporated into the Town of Hempstead, and in the 1980s, it was designated as a census-designated place (CDP).
Geography
Merrick is located at 40°39'25" North, 73°35'17" West (40.656944, -73.588333). According to the United States Census Bureau, the CDP has a total area of 5.2 square miles (13.4 km2), all land.
Economy
Merrick is a primarily residential community, with a few small businesses located in the area. The largest employers in Merrick are the local school district, the Town of Hempstead, and the Nassau County government.
Demographics
As of the census of 2000, there were 22,097 people, 7,845 households, and 6,072 families residing in the CDP. The population density was 4,241.3 people per square mile (1,633.2/km2). There were 8,039 housing units at an average density of 1,547.3/sq mi (597.3/km2). The racial makeup of the CDP was 94.2% White, 1.2% African American, 0.1% Native American, 2.3% Asian, 0.0% Pacific Islander, 1.2% from other races, and 1.0% from two or more races. Hispanic or Latino of any race were 4.7% of the population.
There were 7,845 households, out of which 35.2% had children under the age of 18 living with them, 63.2% were married couples living together, 8.7% had a female householder with no husband present, and 24.7% were non-families. 20.2% of all households were made up of individuals, and 9.3% had someone living alone who was 65 years of age or older. The average household size was 2.81 and the average family size was 3.27.
In the CDP, the population was spread out, with 25.2% under the age of 18, 5.7% from 18 to 24, 30.2% from 25 to 44, 24.2% from 45 to 64, and 14.7% who were 65 years of age or older. The median age was 39 years. For every 100 females, there were 93.2 males. For every 100 females age 18 and over, there were 89.7 males.
The median income for a household in the CDP was $81,845, and the median income for a family was $93,945. Males had a median income of $62,917 versus $41,945 for females. The per capita income for the CDP was $35,945. About 1.7% of families and 2.7% of the population were below the poverty line, including 2.3% of those under age 18 and 3.2% of those age 65 or over.
Common Questions
What is Per Capita Income in North Merrick?
Per Capita income in North Merrick is $62,130.
What is the Median Family Income in North Merrick?
Median Family Income in North Merrick is $168,750.
What is the Median Household income in North Merrick?
Median Household Income in North Merrick is $154,179.
What is Income or Wage Gap in North Merrick?
Income or Wage Gap in North Merrick is 31.5%.
Women in North Merrick earn 68.5 cents for every dollar earned by a man.
What is Inequality or Gini Index in North Merrick?
Inequality or Gini Index in North Merrick is 0.40.
What is the Total Population of North Merrick?
Total Population of North Merrick is 12,192.
What is the Total Male Population of North Merrick?
Total Male Population of North Merrick is 6,230.
What is the Total Female Population of North Merrick?
Total Female Population of North Merrick is 5,962.
What is the Ratio of Males per 100 Females in North Merrick?
There are 104.50 Males per 100 Females in North Merrick.
What is the Ratio of Females per 100 Males in North Merrick?
There are 95.70 Females per 100 Males in North Merrick.
What is the Median Population Age in North Merrick?
Median Population Age in North Merrick is 42.2 Years.
What is the Average Family Size in North Merrick
Average Family Size in North Merrick is 3.3 People.
What is the Average Household Size in North Merrick
Average Household Size in North Merrick is 3.0 People.
How Large is the Labor Force in North Merrick?
There are 6,645 People in the Labor Forcein in North Merrick.
What is the Percentage of People in the Labor Force in North Merrick?
67.7% of People are in the Labor Force in North Merrick.
What is the Unemployment Rate in North Merrick?
Unemployment Rate in North Merrick is 2.6%.