Caroga Lake, NY Map & Demographics
Caroga Lake Map
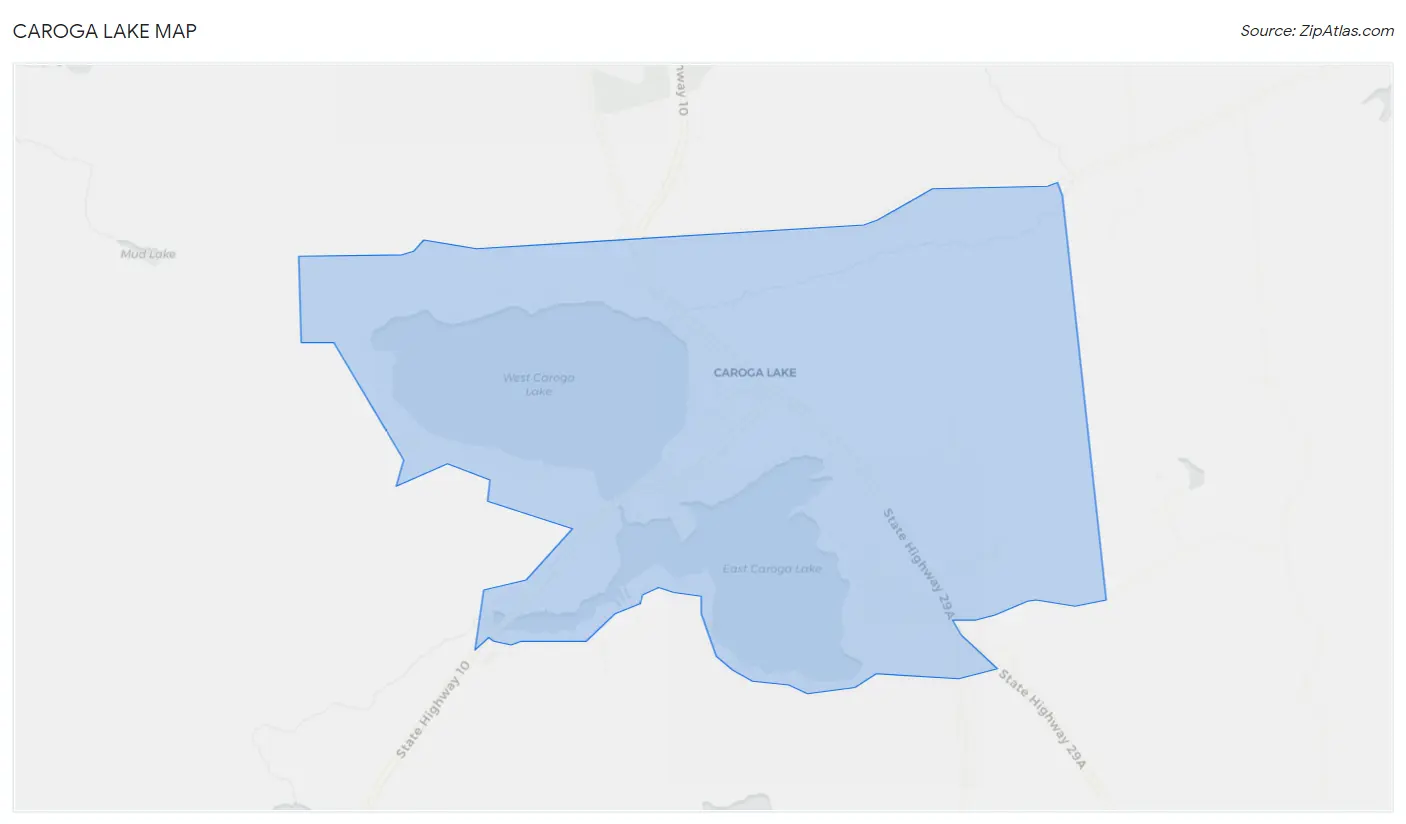
Caroga Lake Overview
$31,153
PER CAPITA INCOME
$51,210
AVG FAMILY INCOME
$50,565
AVG HOUSEHOLD INCOME
30.6%
WAGE / INCOME GAP [ % ]
69.4¢/ $1
WAGE / INCOME GAP [ $ ]
0.46
INEQUALITY / GINI INDEX
577
TOTAL POPULATION
218
MALE POPULATION
359
FEMALE POPULATION
60.72
MALES / 100 FEMALES
164.68
FEMALES / 100 MALES
58.7
MEDIAN AGE
2.7
AVG FAMILY SIZE
2.4
AVG HOUSEHOLD SIZE
276
LABOR FORCE [ PEOPLE ]
51.6%
PERCENT IN LABOR FORCE
Caroga Lake Zip Codes
Caroga Lake Area Codes
Income in Caroga Lake
Income Overview in Caroga Lake
Per Capita Income in Caroga Lake is $31,153, while median incomes of families and households are $51,210 and $50,565 respectively.
| Characteristic | Number | Measure |
| Per Capita Income | 577 | $31,153 |
| Median Family Income | 176 | $51,210 |
| Mean Family Income | 176 | $76,980 |
| Median Household Income | 240 | $50,565 |
| Mean Household Income | 240 | $73,274 |
| Income Deficit | 176 | $0 |
| Wage / Income Gap (%) | 577 | 30.65% |
| Wage / Income Gap ($) | 577 | 69.35¢ per $1 |
| Gini / Inequality Index | 577 | 0.46 |
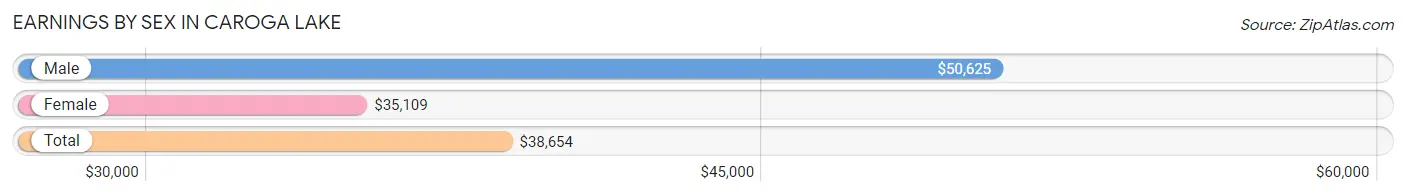
Earnings by Sex in Caroga Lake
Average Earnings in Caroga Lake are $38,654, $50,625 for men and $35,109 for women, a difference of 30.6%.
| Sex | Number | Average Earnings |
| Male | 110 (38.7%) | $50,625 |
| Female | 174 (61.3%) | $35,109 |
| Total | 284 (100.0%) | $38,654 |
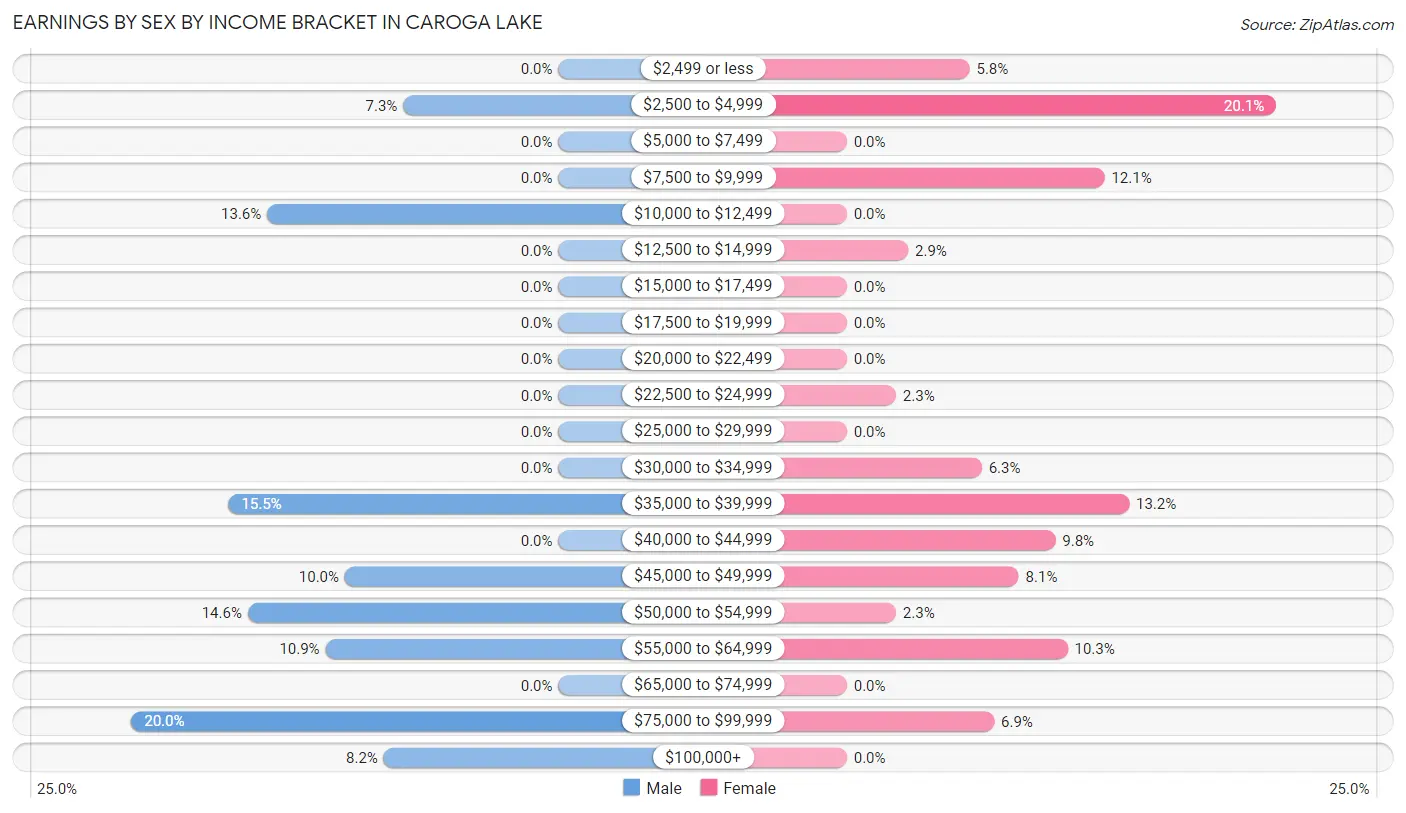
Earnings by Sex by Income Bracket in Caroga Lake
The most common earnings brackets in Caroga Lake are $75,000 to $99,999 for men (22 | 20.0%) and $2,500 to $4,999 for women (35 | 20.1%).
| Income | Male | Female |
| $2,499 or less | 0 (0.0%) | 10 (5.8%) |
| $2,500 to $4,999 | 8 (7.3%) | 35 (20.1%) |
| $5,000 to $7,499 | 0 (0.0%) | 0 (0.0%) |
| $7,500 to $9,999 | 0 (0.0%) | 21 (12.1%) |
| $10,000 to $12,499 | 15 (13.6%) | 0 (0.0%) |
| $12,500 to $14,999 | 0 (0.0%) | 5 (2.9%) |
| $15,000 to $17,499 | 0 (0.0%) | 0 (0.0%) |
| $17,500 to $19,999 | 0 (0.0%) | 0 (0.0%) |
| $20,000 to $22,499 | 0 (0.0%) | 0 (0.0%) |
| $22,500 to $24,999 | 0 (0.0%) | 4 (2.3%) |
| $25,000 to $29,999 | 0 (0.0%) | 0 (0.0%) |
| $30,000 to $34,999 | 0 (0.0%) | 11 (6.3%) |
| $35,000 to $39,999 | 17 (15.4%) | 23 (13.2%) |
| $40,000 to $44,999 | 0 (0.0%) | 17 (9.8%) |
| $45,000 to $49,999 | 11 (10.0%) | 14 (8.1%) |
| $50,000 to $54,999 | 16 (14.5%) | 4 (2.3%) |
| $55,000 to $64,999 | 12 (10.9%) | 18 (10.3%) |
| $65,000 to $74,999 | 0 (0.0%) | 0 (0.0%) |
| $75,000 to $99,999 | 22 (20.0%) | 12 (6.9%) |
| $100,000+ | 9 (8.2%) | 0 (0.0%) |
| Total | 110 (100.0%) | 174 (100.0%) |
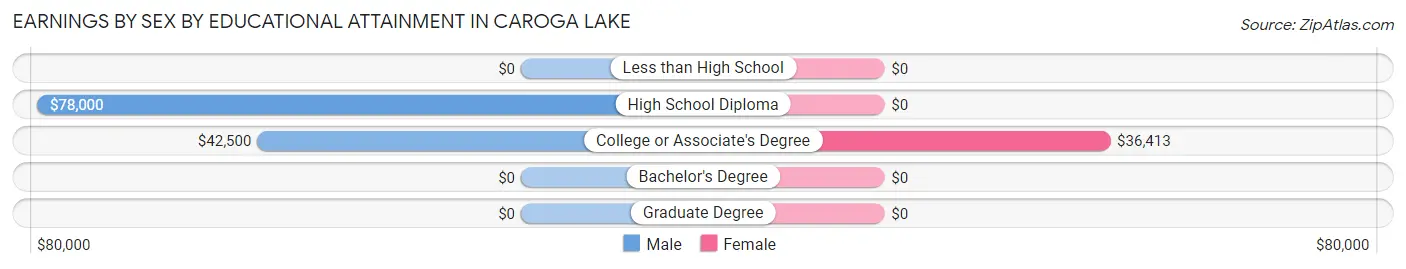
Earnings by Sex by Educational Attainment in Caroga Lake
Average earnings in Caroga Lake are $50,625 for men and $37,283 for women, a difference of 26.4%. Men with an educational attainment of high school diploma enjoy the highest average annual earnings of $78,000, while those with college or associate's degree education earn the least with $42,500. Women with an educational attainment of college or associate's degree earn the most with the average annual earnings of $36,413, while those with college or associate's degree education have the smallest earnings of $36,413.
| Educational Attainment | Male Income | Female Income |
| Less than High School | - | - |
| High School Diploma | $78,000 | $0 |
| College or Associate's Degree | $42,500 | $36,413 |
| Bachelor's Degree | - | - |
| Graduate Degree | - | - |
| Total | $50,625 | $37,283 |
Family Income in Caroga Lake
Family Income Brackets in Caroga Lake
According to the Caroga Lake family income data, there are 67 families falling into the $50,000 to $74,999 income range, which is the most common income bracket and makes up 38.1% of all families.
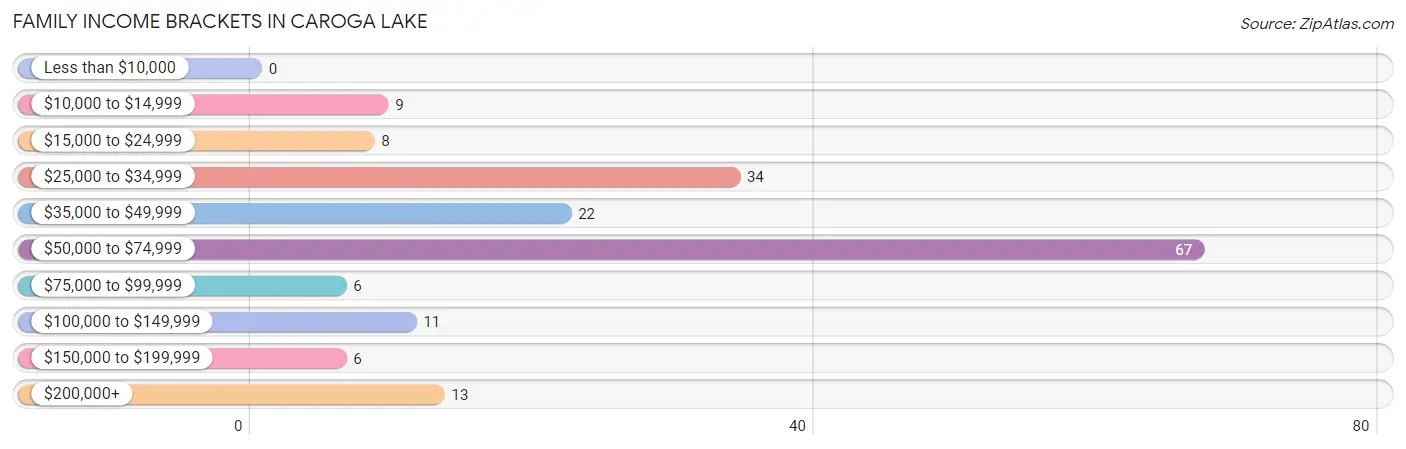
| Income Bracket | # Families | % Families |
| Less than $10,000 | 0 | 0.0% |
| $10,000 to $14,999 | 9 | 5.1% |
| $15,000 to $24,999 | 8 | 4.5% |
| $25,000 to $34,999 | 34 | 19.3% |
| $35,000 to $49,999 | 22 | 12.5% |
| $50,000 to $74,999 | 67 | 38.1% |
| $75,000 to $99,999 | 6 | 3.4% |
| $100,000 to $149,999 | 11 | 6.3% |
| $150,000 to $199,999 | 6 | 3.4% |
| $200,000+ | 13 | 7.4% |
Family Income by Famaliy Size in Caroga Lake
3-person families (33 | 18.8%) account for the highest median family income in Caroga Lake with $57,734 per family, while 2-person families (119 | 67.6%) have the highest median income of $25,060 per family member.
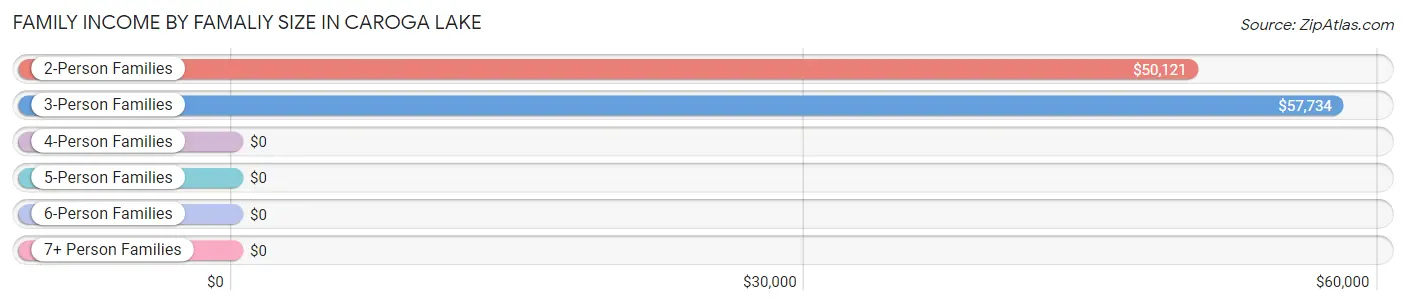
| Income Bracket | # Families | Median Income |
| 2-Person Families | 119 (67.6%) | $50,121 |
| 3-Person Families | 33 (18.8%) | $57,734 |
| 4-Person Families | 18 (10.2%) | $0 |
| 5-Person Families | 6 (3.4%) | $0 |
| 6-Person Families | 0 (0.0%) | $0 |
| 7+ Person Families | 0 (0.0%) | $0 |
| Total | 176 (100.0%) | $51,210 |
Family Income by Number of Earners in Caroga Lake
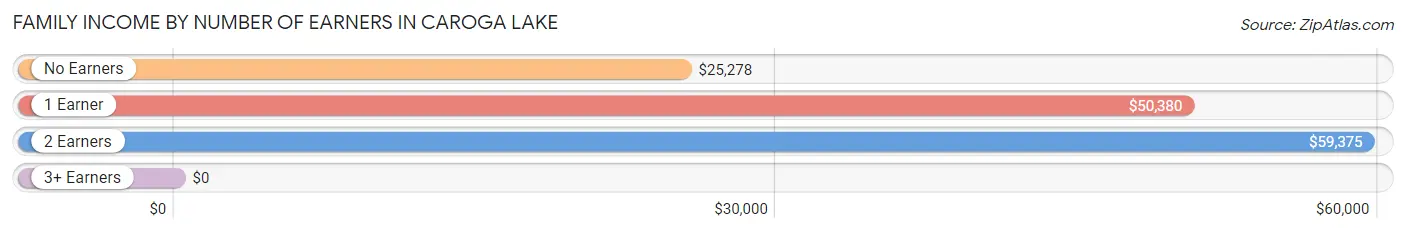
| Number of Earners | # Families | Median Income |
| No Earners | 36 (20.4%) | $25,278 |
| 1 Earner | 81 (46.0%) | $50,380 |
| 2 Earners | 40 (22.7%) | $59,375 |
| 3+ Earners | 19 (10.8%) | $0 |
| Total | 176 (100.0%) | $51,210 |
Household Income in Caroga Lake
Household Income Brackets in Caroga Lake
With 62 households falling in the category, the $50,000 to $74,999 income range is the most frequent in Caroga Lake, accounting for 25.8% of all households.
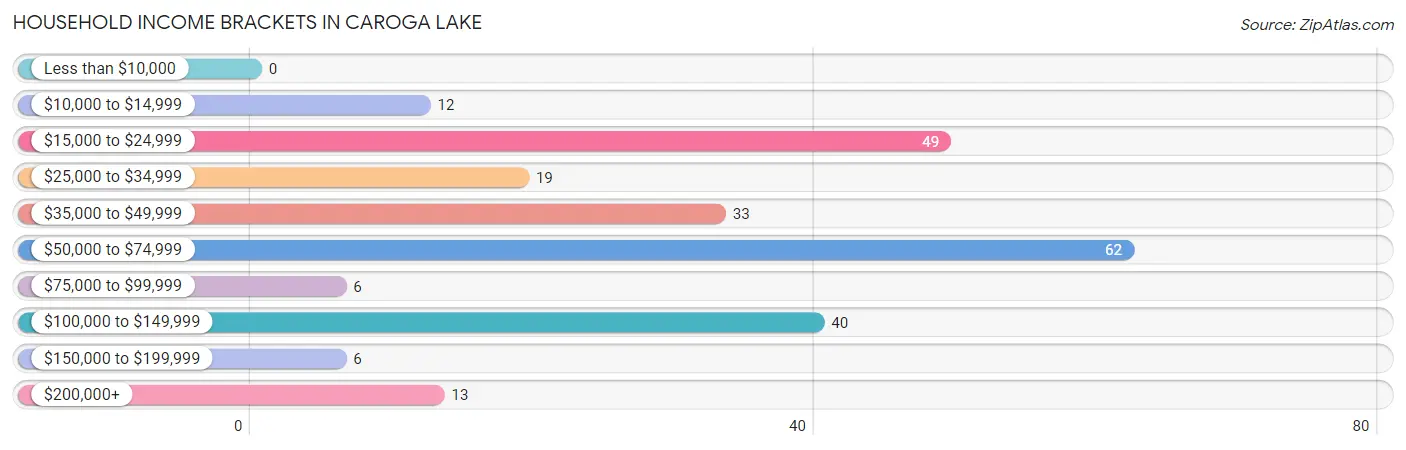
| Income Bracket | # Households | % Households |
| Less than $10,000 | 0 | 0.0% |
| $10,000 to $14,999 | 12 | 5.0% |
| $15,000 to $24,999 | 49 | 20.4% |
| $25,000 to $34,999 | 19 | 7.9% |
| $35,000 to $49,999 | 33 | 13.8% |
| $50,000 to $74,999 | 62 | 25.8% |
| $75,000 to $99,999 | 6 | 2.5% |
| $100,000 to $149,999 | 40 | 16.7% |
| $150,000 to $199,999 | 6 | 2.5% |
| $200,000+ | 13 | 5.4% |
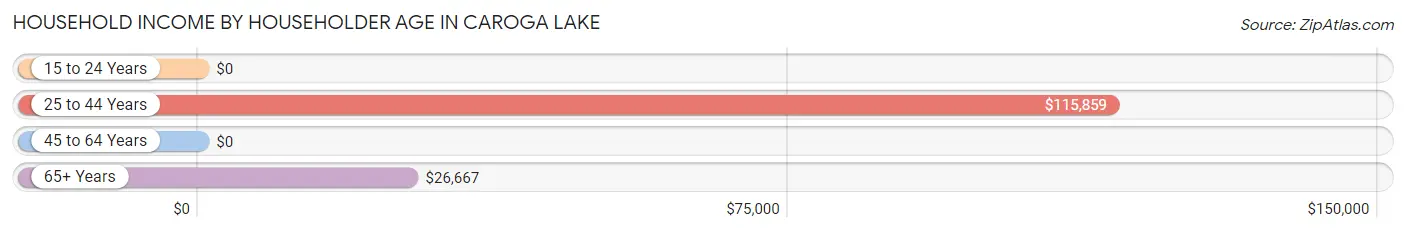
Household Income by Householder Age in Caroga Lake
The median household income in Caroga Lake is $50,565, with the highest median household income of $115,859 found in the 25 to 44 years age bracket for the primary householder. A total of 33 households (13.8%) fall into this category.
| Income Bracket | # Households | Median Income |
| 15 to 24 Years | 0 (0.0%) | $0 |
| 25 to 44 Years | 33 (13.8%) | $115,859 |
| 45 to 64 Years | 89 (37.1%) | $0 |
| 65+ Years | 118 (49.2%) | $26,667 |
| Total | 240 (100.0%) | $50,565 |
Poverty in Caroga Lake
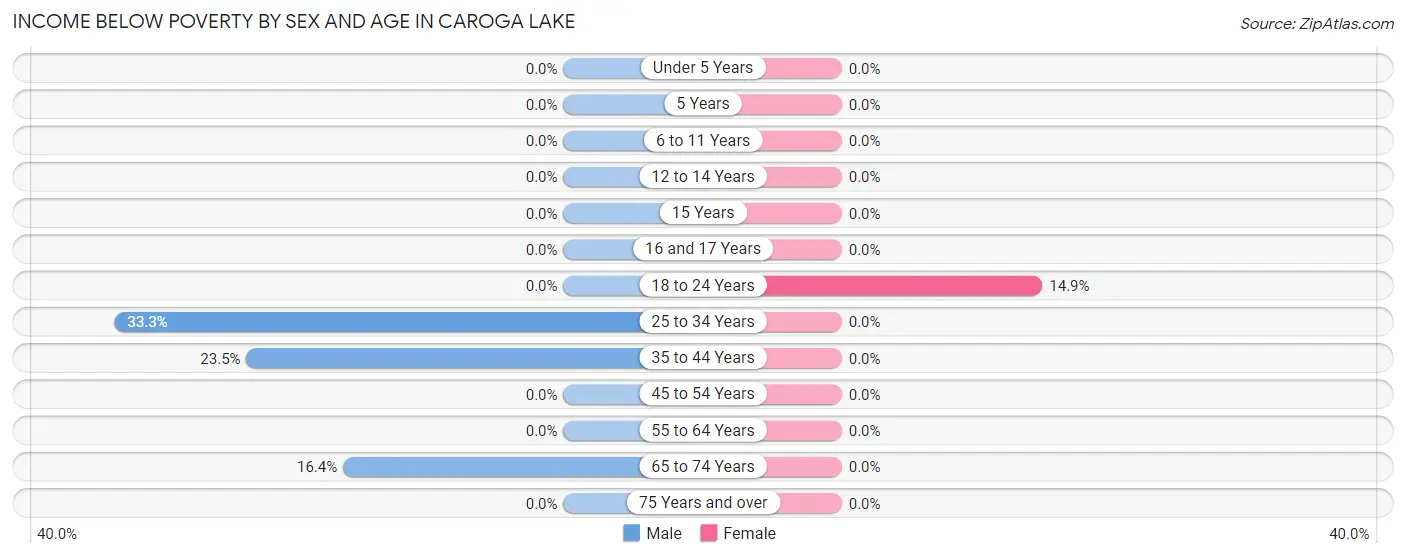
Income Below Poverty by Sex and Age in Caroga Lake
With 13.3% poverty level for males and 1.9% for females among the residents of Caroga Lake, 25 to 34 year old males and 18 to 24 year old females are the most vulnerable to poverty, with 12 males (33.3%) and 7 females (14.9%) in their respective age groups living below the poverty level.
| Age Bracket | Male | Female |
| Under 5 Years | 0 (0.0%) | 0 (0.0%) |
| 5 Years | 0 (0.0%) | 0 (0.0%) |
| 6 to 11 Years | 0 (0.0%) | 0 (0.0%) |
| 12 to 14 Years | 0 (0.0%) | 0 (0.0%) |
| 15 Years | 0 (0.0%) | 0 (0.0%) |
| 16 and 17 Years | 0 (0.0%) | 0 (0.0%) |
| 18 to 24 Years | 0 (0.0%) | 7 (14.9%) |
| 25 to 34 Years | 12 (33.3%) | 0 (0.0%) |
| 35 to 44 Years | 8 (23.5%) | 0 (0.0%) |
| 45 to 54 Years | 0 (0.0%) | 0 (0.0%) |
| 55 to 64 Years | 0 (0.0%) | 0 (0.0%) |
| 65 to 74 Years | 9 (16.4%) | 0 (0.0%) |
| 75 Years and over | 0 (0.0%) | 0 (0.0%) |
| Total | 29 (13.3%) | 7 (1.9%) |
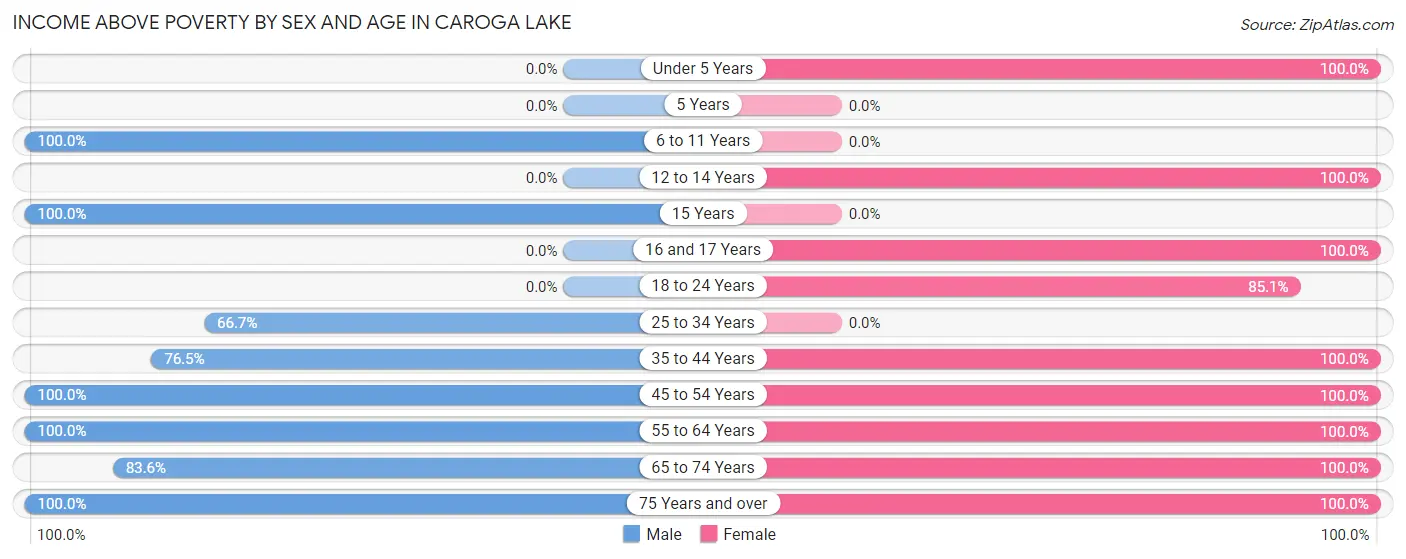
Income Above Poverty by Sex and Age in Caroga Lake
According to the poverty statistics in Caroga Lake, males aged 6 to 11 years and females aged under 5 years are the age groups that are most secure financially, with 100.0% of males and 100.0% of females in these age groups living above the poverty line.
| Age Bracket | Male | Female |
| Under 5 Years | 0 (0.0%) | 12 (100.0%) |
| 5 Years | 0 (0.0%) | 0 (0.0%) |
| 6 to 11 Years | 4 (100.0%) | 0 (0.0%) |
| 12 to 14 Years | 0 (0.0%) | 17 (100.0%) |
| 15 Years | 9 (100.0%) | 0 (0.0%) |
| 16 and 17 Years | 0 (0.0%) | 14 (100.0%) |
| 18 to 24 Years | 0 (0.0%) | 40 (85.1%) |
| 25 to 34 Years | 24 (66.7%) | 0 (0.0%) |
| 35 to 44 Years | 26 (76.5%) | 24 (100.0%) |
| 45 to 54 Years | 20 (100.0%) | 48 (100.0%) |
| 55 to 64 Years | 50 (100.0%) | 41 (100.0%) |
| 65 to 74 Years | 46 (83.6%) | 65 (100.0%) |
| 75 Years and over | 10 (100.0%) | 91 (100.0%) |
| Total | 189 (86.7%) | 352 (98.1%) |
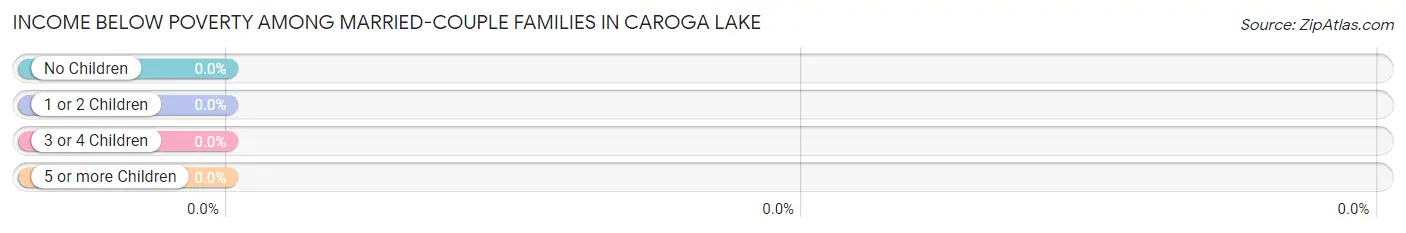
Income Below Poverty Among Married-Couple Families in Caroga Lake
| Children | Above Poverty | Below Poverty |
| No Children | 93 (100.0%) | 0 (0.0%) |
| 1 or 2 Children | 5 (100.0%) | 0 (0.0%) |
| 3 or 4 Children | 0 (0.0%) | 0 (0.0%) |
| 5 or more Children | 0 (0.0%) | 0 (0.0%) |
| Total | 98 (100.0%) | 0 (0.0%) |
Income Below Poverty Among Single-Parent Households in Caroga Lake
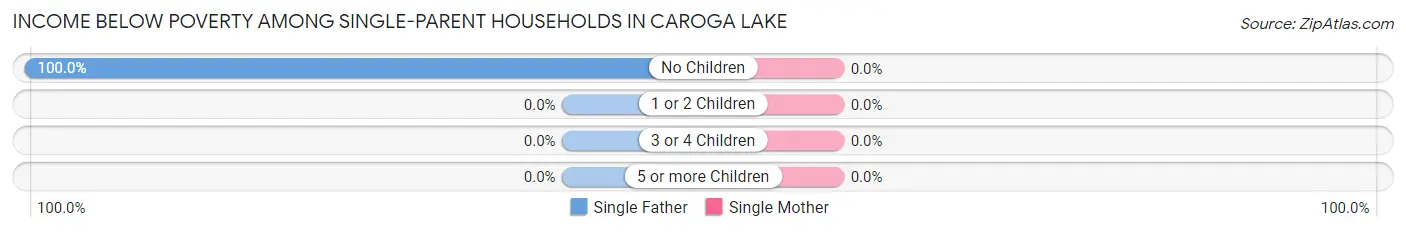
| Children | Single Father | Single Mother |
| No Children | 9 (100.0%) | 0 (0.0%) |
| 1 or 2 Children | 0 (0.0%) | 0 (0.0%) |
| 3 or 4 Children | 0 (0.0%) | 0 (0.0%) |
| 5 or more Children | 0 (0.0%) | 0 (0.0%) |
| Total | 9 (25.0%) | 0 (0.0%) |
Income Below Poverty Among Married-Couple vs Single-Parent Households in Caroga Lake
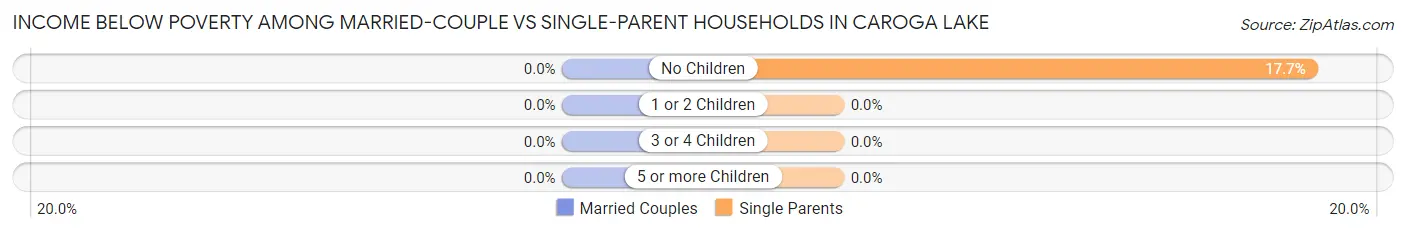
| Children | Married-Couple Families | Single-Parent Households |
| No Children | 0 (0.0%) | 9 (17.6%) |
| 1 or 2 Children | 0 (0.0%) | 0 (0.0%) |
| 3 or 4 Children | 0 (0.0%) | 0 (0.0%) |
| 5 or more Children | 0 (0.0%) | 0 (0.0%) |
| Total | 0 (0.0%) | 9 (11.5%) |
Race in Caroga Lake
The most populous races in Caroga Lake are White / Caucasian (566 | 98.1%), Two or more Races (11 | 1.9%), and Hispanic or Latino (4 | 0.7%).
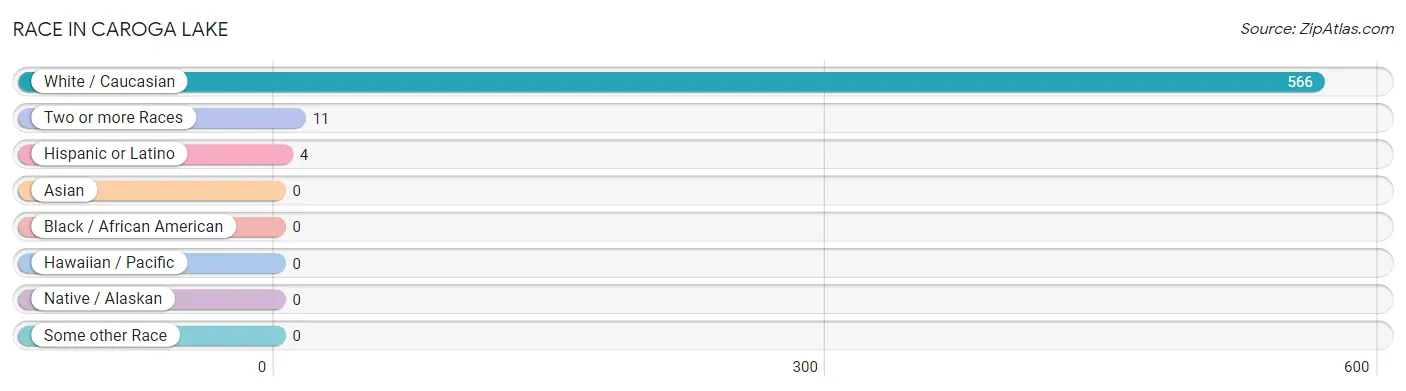
| Race | # Population | % Population |
| Asian | 0 | 0.0% |
| Black / African American | 0 | 0.0% |
| Hawaiian / Pacific | 0 | 0.0% |
| Hispanic or Latino | 4 | 0.7% |
| Native / Alaskan | 0 | 0.0% |
| White / Caucasian | 566 | 98.1% |
| Two or more Races | 11 | 1.9% |
| Some other Race | 0 | 0.0% |
| Total | 577 | 100.0% |
Ancestry in Caroga Lake
The most populous ancestries reported in Caroga Lake are American (173 | 30.0%), German (135 | 23.4%), Italian (112 | 19.4%), Dutch (63 | 10.9%), and Irish (46 | 8.0%), together accounting for 91.7% of all Caroga Lake residents.
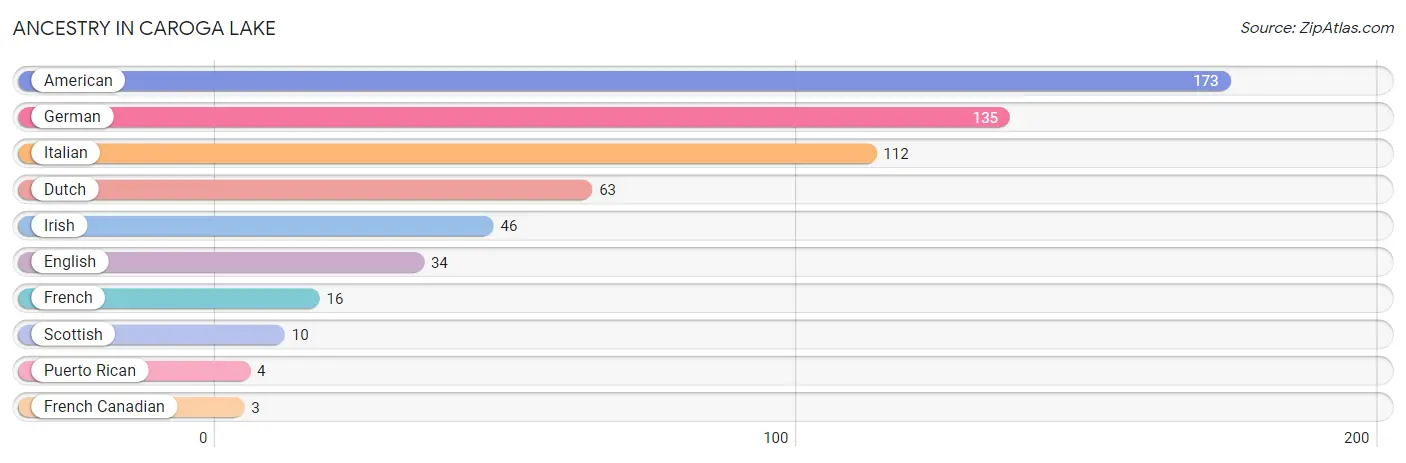
| Ancestry | # Population | % Population |
| American | 173 | 30.0% |
| Dutch | 63 | 10.9% |
| English | 34 | 5.9% |
| French | 16 | 2.8% |
| French Canadian | 3 | 0.5% |
| German | 135 | 23.4% |
| Irish | 46 | 8.0% |
| Italian | 112 | 19.4% |
| Puerto Rican | 4 | 0.7% |
| Scottish | 10 | 1.7% | View All 10 Rows |
Immigrants in Caroga Lake

| Immigration Origin | # Population | % Population | View All 0 Rows |
Sex and Age in Caroga Lake
Sex and Age in Caroga Lake
The most populous age groups in Caroga Lake are 70 to 74 Years (33 | 15.1%) for men and 75 to 79 Years (51 | 14.2%) for women.
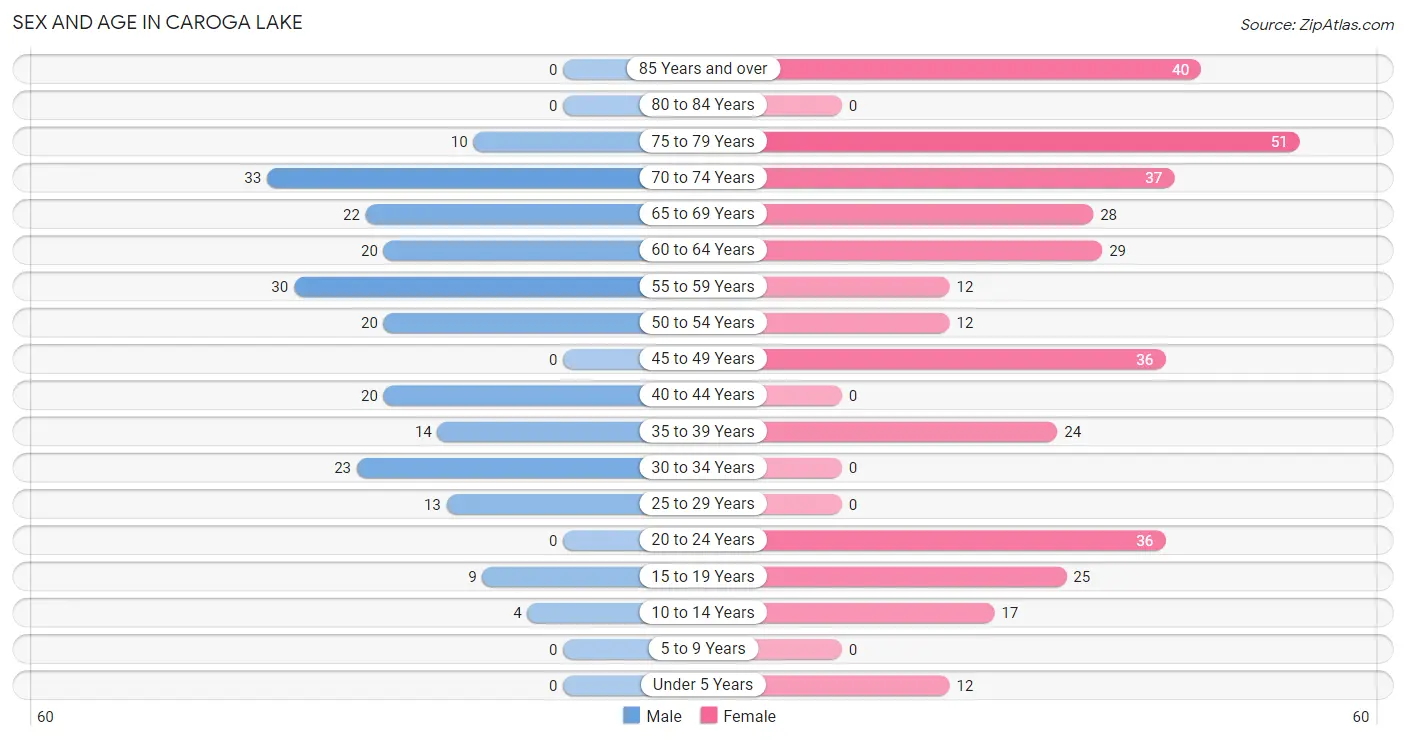
| Age Bracket | Male | Female |
| Under 5 Years | 0 (0.0%) | 12 (3.3%) |
| 5 to 9 Years | 0 (0.0%) | 0 (0.0%) |
| 10 to 14 Years | 4 (1.8%) | 17 (4.7%) |
| 15 to 19 Years | 9 (4.1%) | 25 (7.0%) |
| 20 to 24 Years | 0 (0.0%) | 36 (10.0%) |
| 25 to 29 Years | 13 (6.0%) | 0 (0.0%) |
| 30 to 34 Years | 23 (10.5%) | 0 (0.0%) |
| 35 to 39 Years | 14 (6.4%) | 24 (6.7%) |
| 40 to 44 Years | 20 (9.2%) | 0 (0.0%) |
| 45 to 49 Years | 0 (0.0%) | 36 (10.0%) |
| 50 to 54 Years | 20 (9.2%) | 12 (3.3%) |
| 55 to 59 Years | 30 (13.8%) | 12 (3.3%) |
| 60 to 64 Years | 20 (9.2%) | 29 (8.1%) |
| 65 to 69 Years | 22 (10.1%) | 28 (7.8%) |
| 70 to 74 Years | 33 (15.1%) | 37 (10.3%) |
| 75 to 79 Years | 10 (4.6%) | 51 (14.2%) |
| 80 to 84 Years | 0 (0.0%) | 0 (0.0%) |
| 85 Years and over | 0 (0.0%) | 40 (11.1%) |
| Total | 218 (100.0%) | 359 (100.0%) |
Families and Households in Caroga Lake
Median Family Size in Caroga Lake
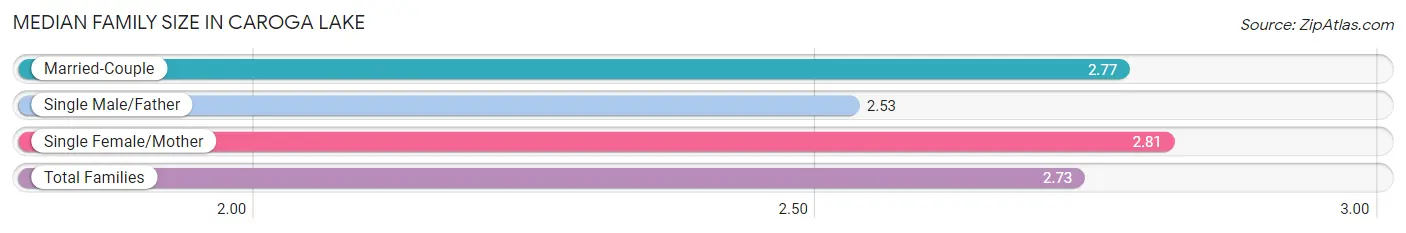
The median family size in Caroga Lake is 2.73 persons per family, with single female/mother families (42 | 23.9%) accounting for the largest median family size of 2.81 persons per family. On the other hand, single male/father families (36 | 20.4%) represent the smallest median family size with 2.53 persons per family.
| Family Type | # Families | Family Size |
| Married-Couple | 98 (55.7%) | 2.77 |
| Single Male/Father | 36 (20.4%) | 2.53 |
| Single Female/Mother | 42 (23.9%) | 2.81 |
| Total Families | 176 (100.0%) | 2.73 |
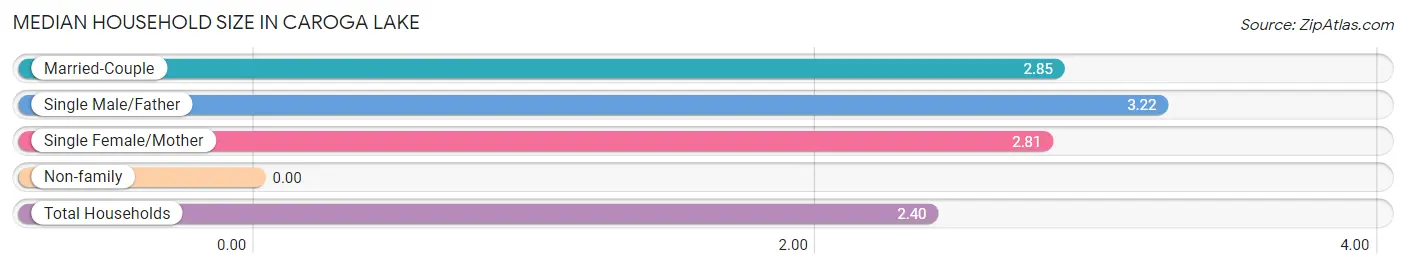
Median Household Size in Caroga Lake
| Household Type | # Households | Household Size |
| Married-Couple | 98 (40.8%) | 2.85 |
| Single Male/Father | 36 (15.0%) | 3.22 |
| Single Female/Mother | 42 (17.5%) | 2.81 |
| Non-family | 64 (26.7%) | - |
| Total Households | 240 (100.0%) | 2.40 |
Household Size by Marriage Status in Caroga Lake
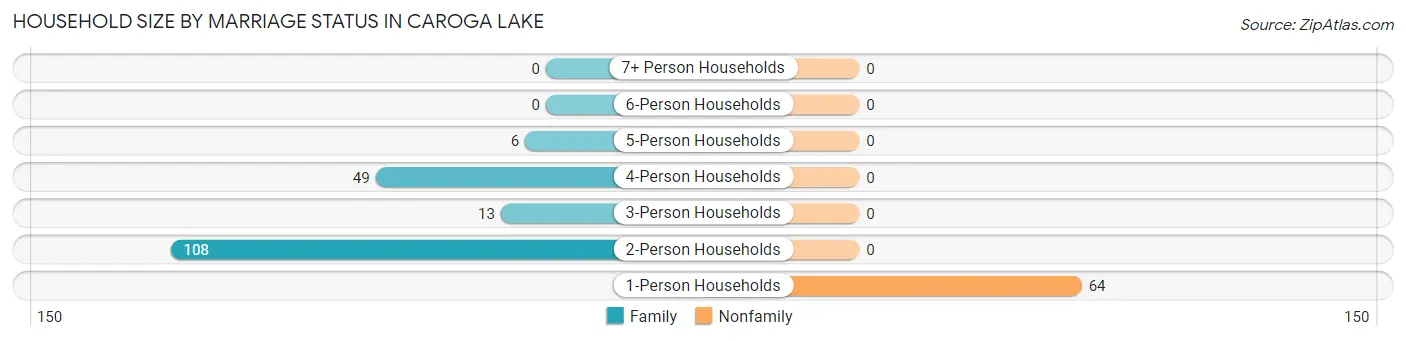
Out of a total of 240 households in Caroga Lake, 176 (73.3%) are family households, while 64 (26.7%) are nonfamily households. The most numerous type of family households are 2-person households, comprising 108, and the most common type of nonfamily households are 1-person households, comprising 64.
| Household Size | Family Households | Nonfamily Households |
| 1-Person Households | - | 64 (26.7%) |
| 2-Person Households | 108 (45.0%) | 0 (0.0%) |
| 3-Person Households | 13 (5.4%) | 0 (0.0%) |
| 4-Person Households | 49 (20.4%) | 0 (0.0%) |
| 5-Person Households | 6 (2.5%) | 0 (0.0%) |
| 6-Person Households | 0 (0.0%) | 0 (0.0%) |
| 7+ Person Households | 0 (0.0%) | 0 (0.0%) |
| Total | 176 (73.3%) | 64 (26.7%) |
Female Fertility in Caroga Lake
Fertility by Age in Caroga Lake
Average fertility rate in Caroga Lake is 56.0 births per 1,000 women. Women in the age bracket of 15 to 19 years have the highest fertility rate with 280.0 births per 1,000 women. Women in the age bracket of 15 to 19 years acount for 100.0% of all women with births.
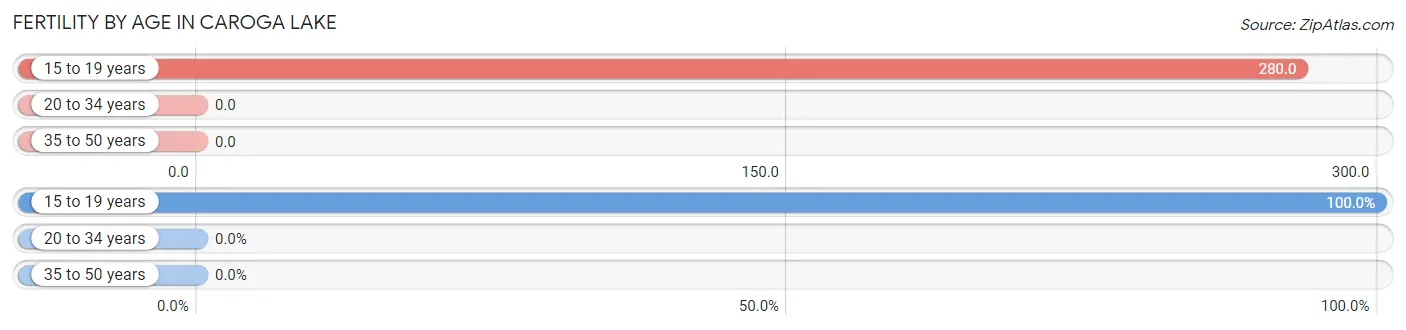
| Age Bracket | Women with Births | Births / 1,000 Women |
| 15 to 19 years | 7 (100.0%) | 280.0 |
| 20 to 34 years | 0 (0.0%) | 0.0 |
| 35 to 50 years | 0 (0.0%) | 0.0 |
| Total | 7 (100.0%) | 56.0 |
Fertility by Age by Marriage Status in Caroga Lake
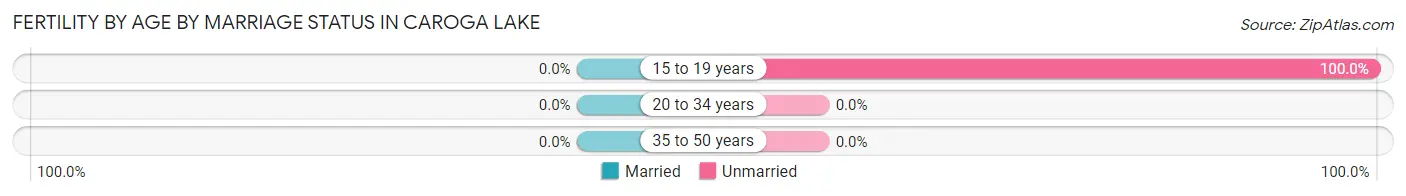
| Age Bracket | Married | Unmarried |
| 15 to 19 years | 0 (0.0%) | 7 (100.0%) |
| 20 to 34 years | 0 (0.0%) | 0 (0.0%) |
| 35 to 50 years | 0 (0.0%) | 0 (0.0%) |
| Total | 0 (0.0%) | 7 (100.0%) |
Fertility by Education in Caroga Lake
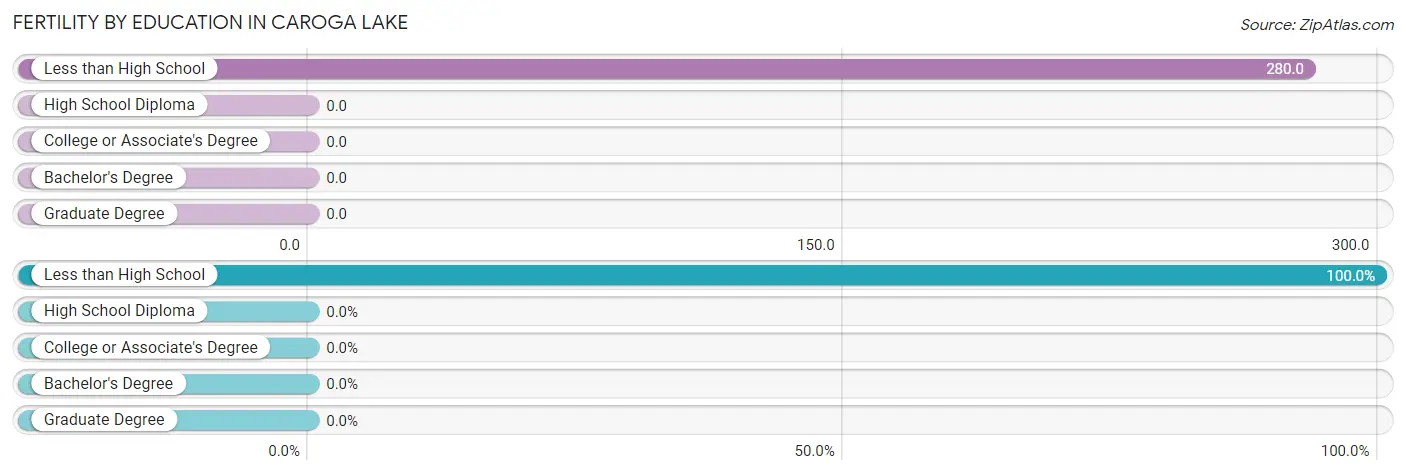
| Educational Attainment | Women with Births | Births / 1,000 Women |
| Less than High School | 7 (100.0%) | 280.0 |
| High School Diploma | 0 (0.0%) | 0.0 |
| College or Associate's Degree | 0 (0.0%) | 0.0 |
| Bachelor's Degree | 0 (0.0%) | 0.0 |
| Graduate Degree | 0 (0.0%) | 0.0 |
| Total | 7 (100.0%) | 56.0 |
Fertility by Education by Marriage Status in Caroga Lake
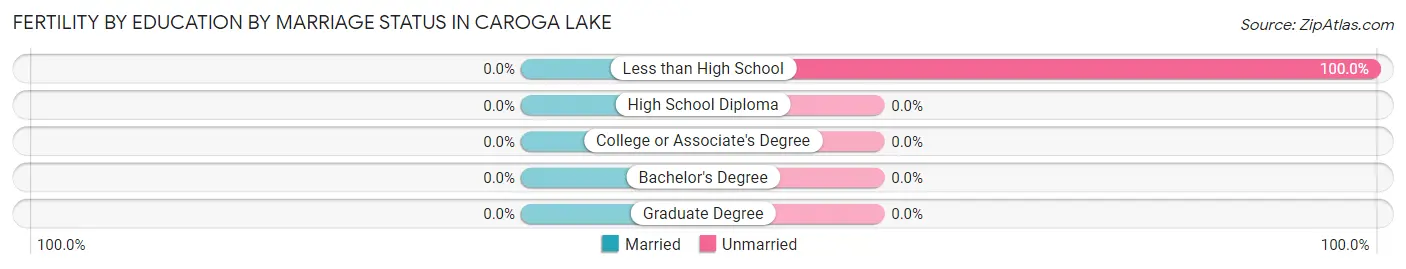
| Educational Attainment | Married | Unmarried |
| Less than High School | 0 (0.0%) | 7 (100.0%) |
| High School Diploma | 0 (0.0%) | 0 (0.0%) |
| College or Associate's Degree | 0 (0.0%) | 0 (0.0%) |
| Bachelor's Degree | 0 (0.0%) | 0 (0.0%) |
| Graduate Degree | 0 (0.0%) | 0 (0.0%) |
| Total | 0 (0.0%) | 7 (100.0%) |
Employment Characteristics in Caroga Lake
Employment by Class of Employer in Caroga Lake
Among the 276 employed individuals in Caroga Lake, private company employees (145 | 52.5%), local government employees (50 | 18.1%), and not-for-profit organizations (41 | 14.9%) make up the most common classes of employment.
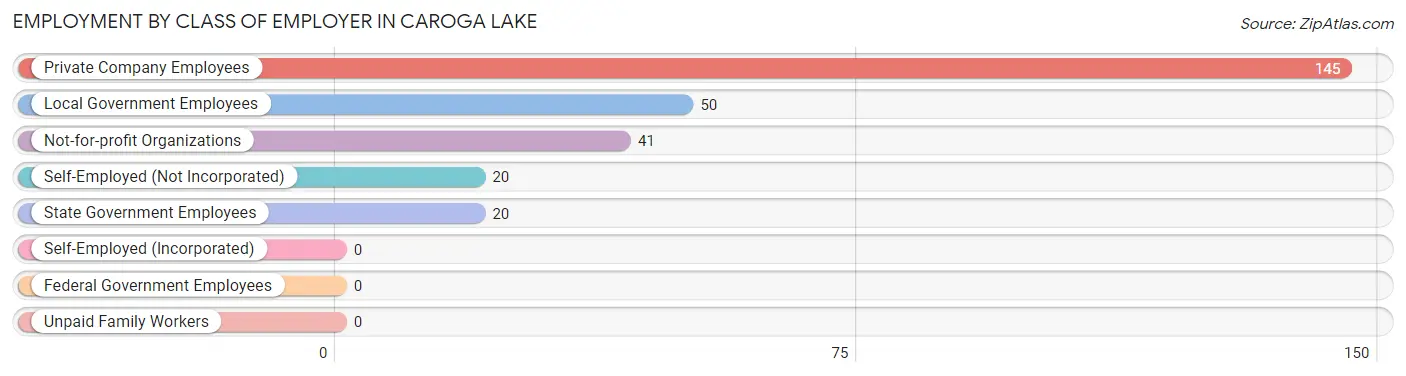
| Employer Class | # Employees | % Employees |
| Private Company Employees | 145 | 52.5% |
| Self-Employed (Incorporated) | 0 | 0.0% |
| Self-Employed (Not Incorporated) | 20 | 7.2% |
| Not-for-profit Organizations | 41 | 14.9% |
| Local Government Employees | 50 | 18.1% |
| State Government Employees | 20 | 7.2% |
| Federal Government Employees | 0 | 0.0% |
| Unpaid Family Workers | 0 | 0.0% |
| Total | 276 | 100.0% |
Employment Status by Age in Caroga Lake
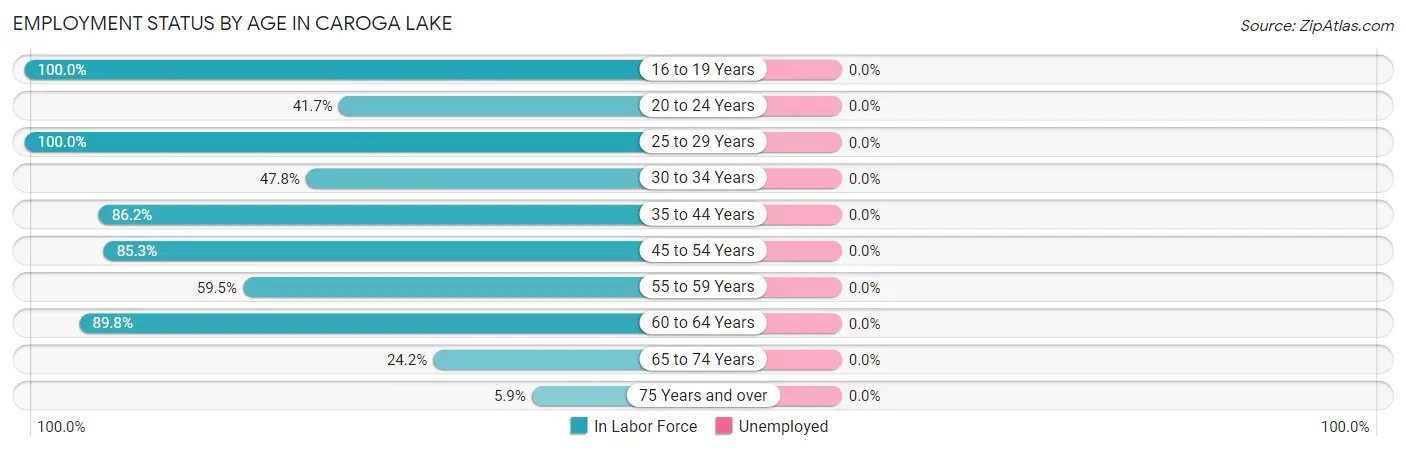
| Age Bracket | In Labor Force | Unemployed |
| 16 to 19 Years | 25 (100.0%) | 0 (0.0%) |
| 20 to 24 Years | 15 (41.7%) | 0 (0.0%) |
| 25 to 29 Years | 13 (100.0%) | 0 (0.0%) |
| 30 to 34 Years | 11 (47.8%) | 0 (0.0%) |
| 35 to 44 Years | 50 (86.2%) | 0 (0.0%) |
| 45 to 54 Years | 58 (85.3%) | 0 (0.0%) |
| 55 to 59 Years | 25 (59.5%) | 0 (0.0%) |
| 60 to 64 Years | 44 (89.8%) | 0 (0.0%) |
| 65 to 74 Years | 29 (24.2%) | 0 (0.0%) |
| 75 Years and over | 6 (5.9%) | 0 (0.0%) |
| Total | 276 (51.6%) | 0 (0.0%) |
Employment Status by Educational Attainment in Caroga Lake
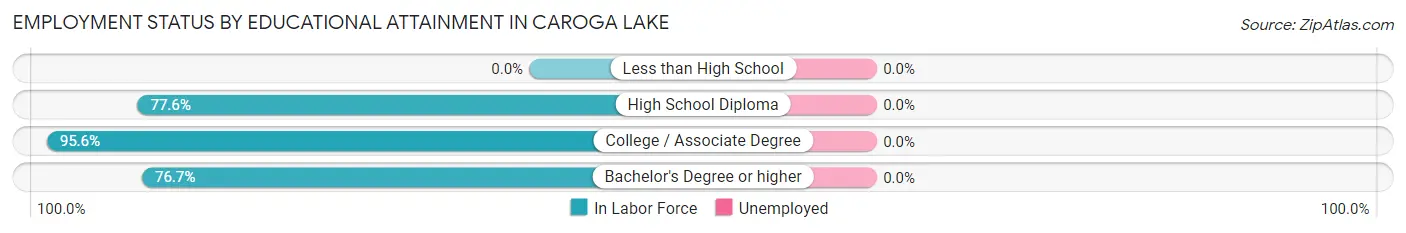
| Educational Attainment | In Labor Force | Unemployed |
| Less than High School | 0 (0.0%) | 0 (0.0%) |
| High School Diploma | 59 (77.6%) | 0 (0.0%) |
| College / Associate Degree | 109 (95.6%) | 0 (0.0%) |
| Bachelor's Degree or higher | 33 (76.7%) | 0 (0.0%) |
| Total | 201 (79.4%) | 0 (0.0%) |
Employment Occupations by Sex in Caroga Lake
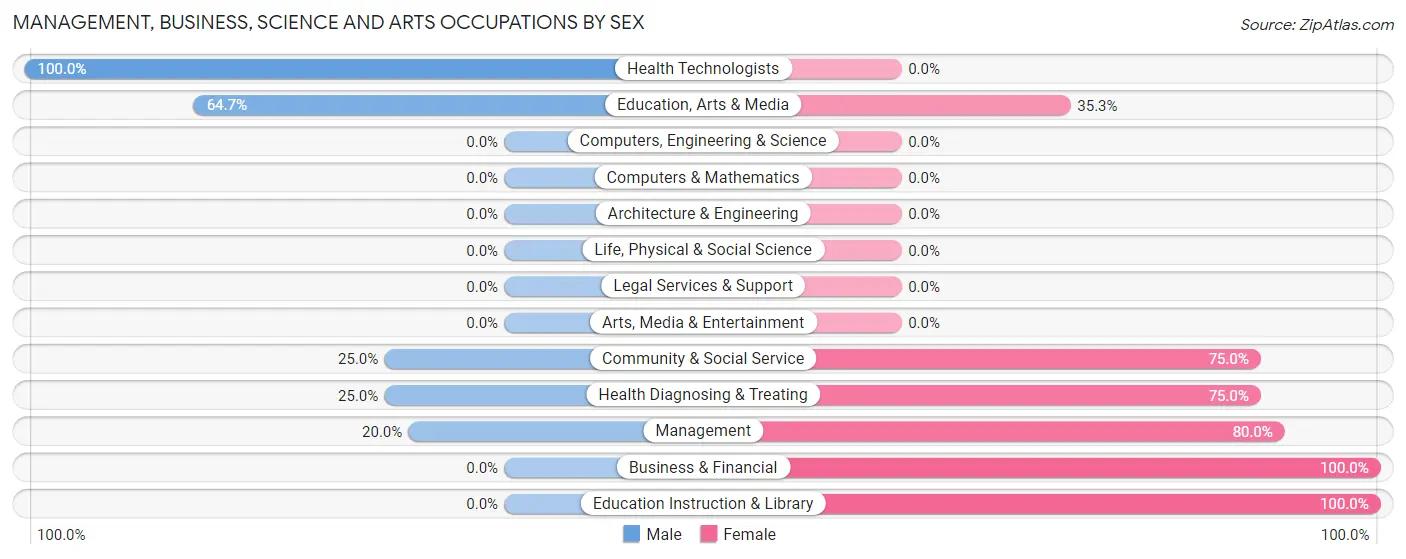
Management, Business, Science and Arts Occupations
The most common Management, Business, Science and Arts occupations in Caroga Lake are Community & Social Service (44 | 15.9%), Education Instruction & Library (27 | 9.8%), Health Diagnosing & Treating (24 | 8.7%), Education, Arts & Media (17 | 6.2%), and Management (15 | 5.4%).
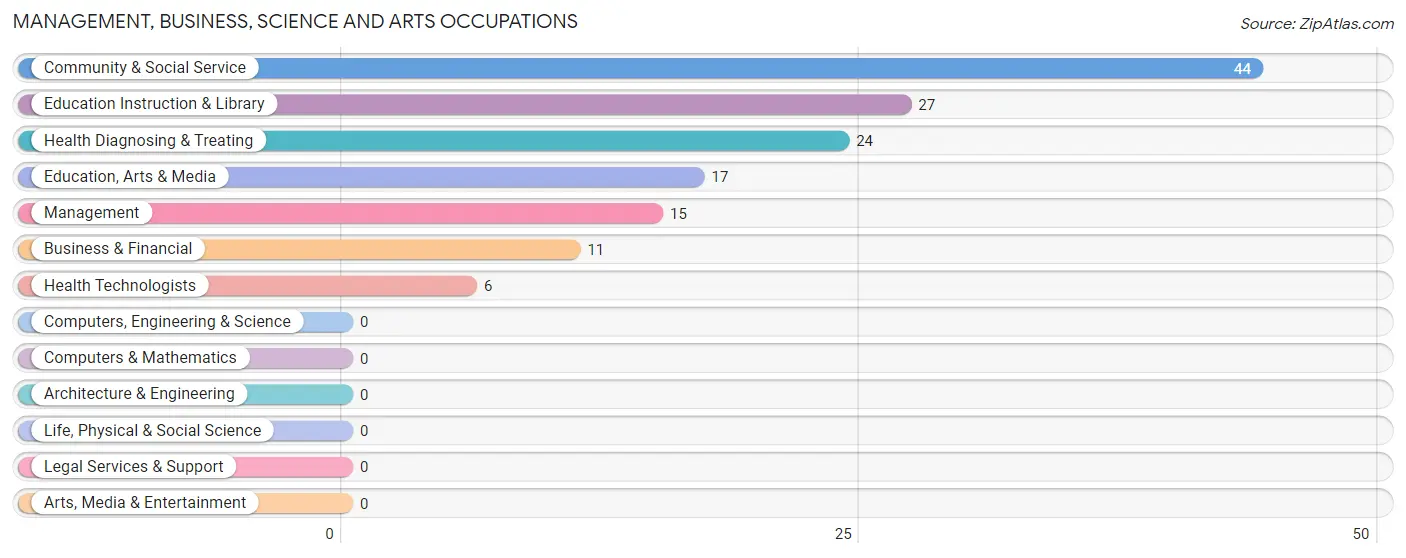
Management, Business, Science and Arts Occupations by Sex
Within the Management, Business, Science and Arts occupations in Caroga Lake, the most male-oriented occupations are Health Technologists (100.0%), Education, Arts & Media (64.7%), and Community & Social Service (25.0%), while the most female-oriented occupations are Business & Financial (100.0%), Education Instruction & Library (100.0%), and Management (80.0%).
| Occupation | Male | Female |
| Management | 3 (20.0%) | 12 (80.0%) |
| Business & Financial | 0 (0.0%) | 11 (100.0%) |
| Computers, Engineering & Science | 0 (0.0%) | 0 (0.0%) |
| Computers & Mathematics | 0 (0.0%) | 0 (0.0%) |
| Architecture & Engineering | 0 (0.0%) | 0 (0.0%) |
| Life, Physical & Social Science | 0 (0.0%) | 0 (0.0%) |
| Community & Social Service | 11 (25.0%) | 33 (75.0%) |
| Education, Arts & Media | 11 (64.7%) | 6 (35.3%) |
| Legal Services & Support | 0 (0.0%) | 0 (0.0%) |
| Education Instruction & Library | 0 (0.0%) | 27 (100.0%) |
| Arts, Media & Entertainment | 0 (0.0%) | 0 (0.0%) |
| Health Diagnosing & Treating | 6 (25.0%) | 18 (75.0%) |
| Health Technologists | 6 (100.0%) | 0 (0.0%) |
| Total (Category) | 20 (21.3%) | 74 (78.7%) |
| Total (Overall) | 102 (37.0%) | 174 (63.0%) |
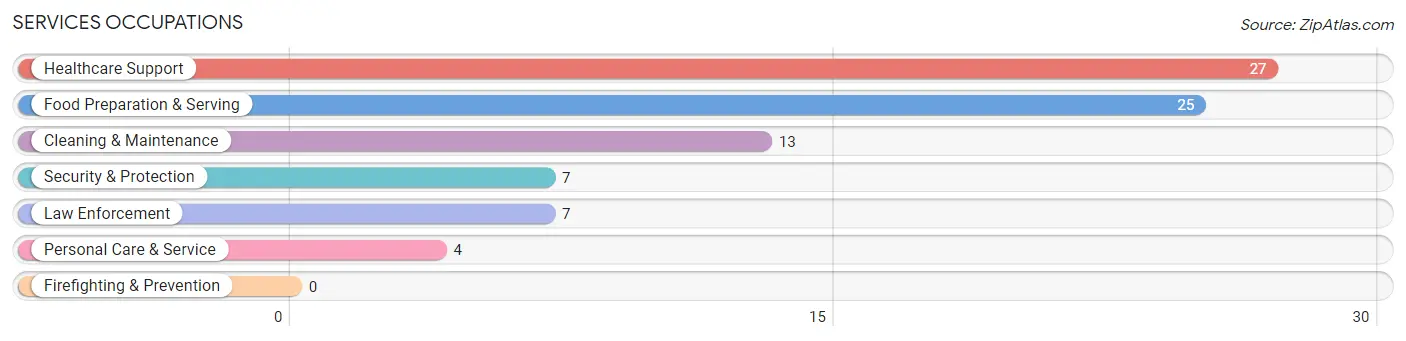
Services Occupations
The most common Services occupations in Caroga Lake are Healthcare Support (27 | 9.8%), Food Preparation & Serving (25 | 9.1%), Cleaning & Maintenance (13 | 4.7%), Security & Protection (7 | 2.5%), and Law Enforcement (7 | 2.5%).
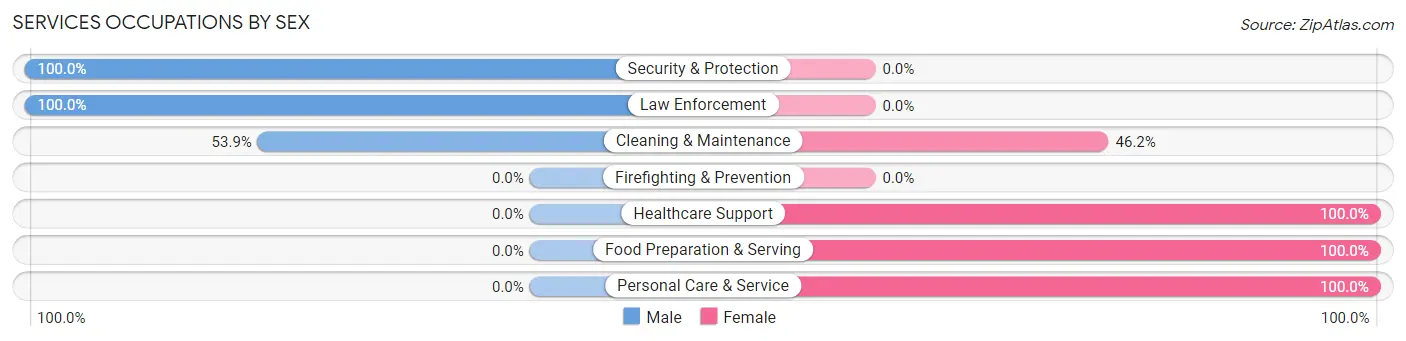
Services Occupations by Sex
Within the Services occupations in Caroga Lake, the most male-oriented occupations are Security & Protection (100.0%), Law Enforcement (100.0%), and Cleaning & Maintenance (53.8%), while the most female-oriented occupations are Healthcare Support (100.0%), Food Preparation & Serving (100.0%), and Personal Care & Service (100.0%).
| Occupation | Male | Female |
| Healthcare Support | 0 (0.0%) | 27 (100.0%) |
| Security & Protection | 7 (100.0%) | 0 (0.0%) |
| Firefighting & Prevention | 0 (0.0%) | 0 (0.0%) |
| Law Enforcement | 7 (100.0%) | 0 (0.0%) |
| Food Preparation & Serving | 0 (0.0%) | 25 (100.0%) |
| Cleaning & Maintenance | 7 (53.8%) | 6 (46.2%) |
| Personal Care & Service | 0 (0.0%) | 4 (100.0%) |
| Total (Category) | 14 (18.4%) | 62 (81.6%) |
| Total (Overall) | 102 (37.0%) | 174 (63.0%) |
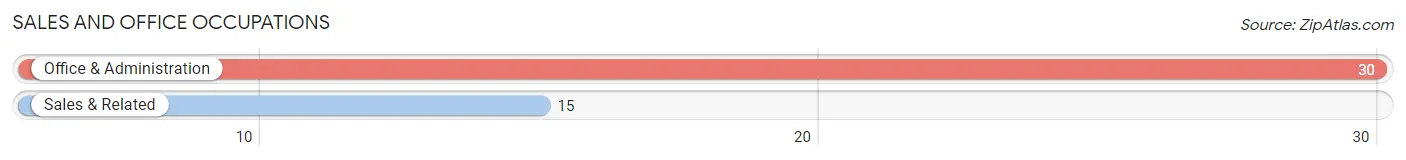
Sales and Office Occupations
The most common Sales and Office occupations in Caroga Lake are Office & Administration (30 | 10.9%), and Sales & Related (15 | 5.4%).
Sales and Office Occupations by Sex
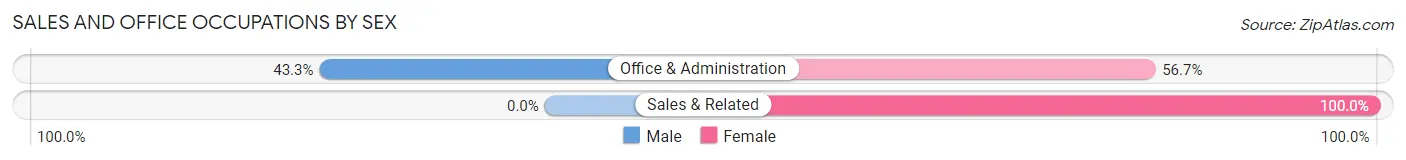
| Occupation | Male | Female |
| Sales & Related | 0 (0.0%) | 15 (100.0%) |
| Office & Administration | 13 (43.3%) | 17 (56.7%) |
| Total (Category) | 13 (28.9%) | 32 (71.1%) |
| Total (Overall) | 102 (37.0%) | 174 (63.0%) |
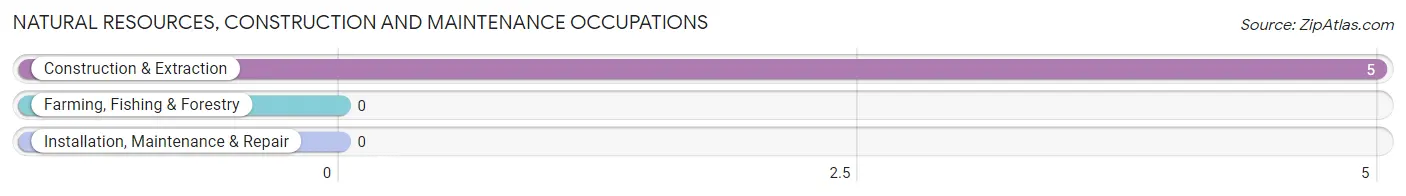
Natural Resources, Construction and Maintenance Occupations
The most common Natural Resources, Construction and Maintenance occupations in Caroga Lake are , and Construction & Extraction (5 | 1.8%).
Natural Resources, Construction and Maintenance Occupations by Sex
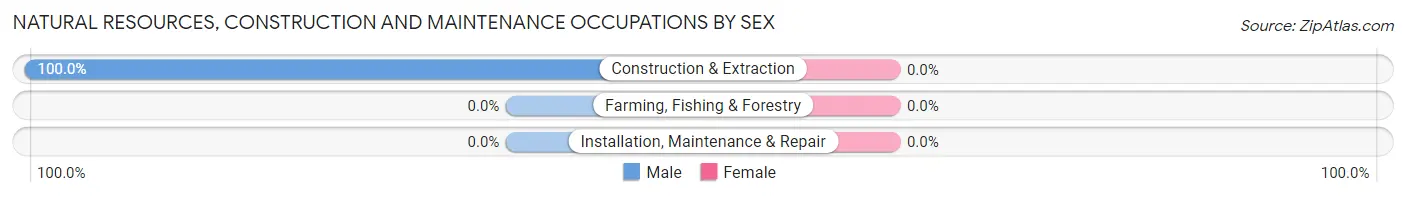
| Occupation | Male | Female |
| Farming, Fishing & Forestry | 0 (0.0%) | 0 (0.0%) |
| Construction & Extraction | 5 (100.0%) | 0 (0.0%) |
| Installation, Maintenance & Repair | 0 (0.0%) | 0 (0.0%) |
| Total (Category) | 5 (100.0%) | 0 (0.0%) |
| Total (Overall) | 102 (37.0%) | 174 (63.0%) |
Production, Transportation and Moving Occupations
The most common Production, Transportation and Moving occupations in Caroga Lake are Production (27 | 9.8%), Material Moving (21 | 7.6%), and Transportation (8 | 2.9%).
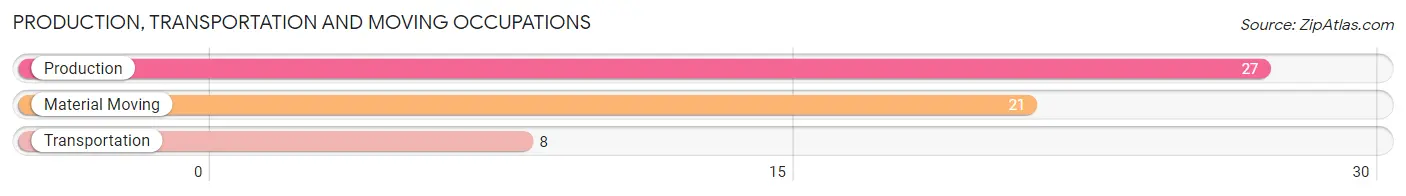
Production, Transportation and Moving Occupations by Sex
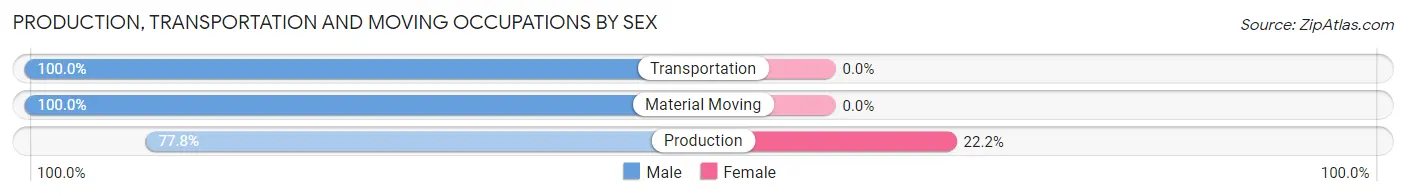
| Occupation | Male | Female |
| Production | 21 (77.8%) | 6 (22.2%) |
| Transportation | 8 (100.0%) | 0 (0.0%) |
| Material Moving | 21 (100.0%) | 0 (0.0%) |
| Total (Category) | 50 (89.3%) | 6 (10.7%) |
| Total (Overall) | 102 (37.0%) | 174 (63.0%) |
Employment Industries by Sex in Caroga Lake
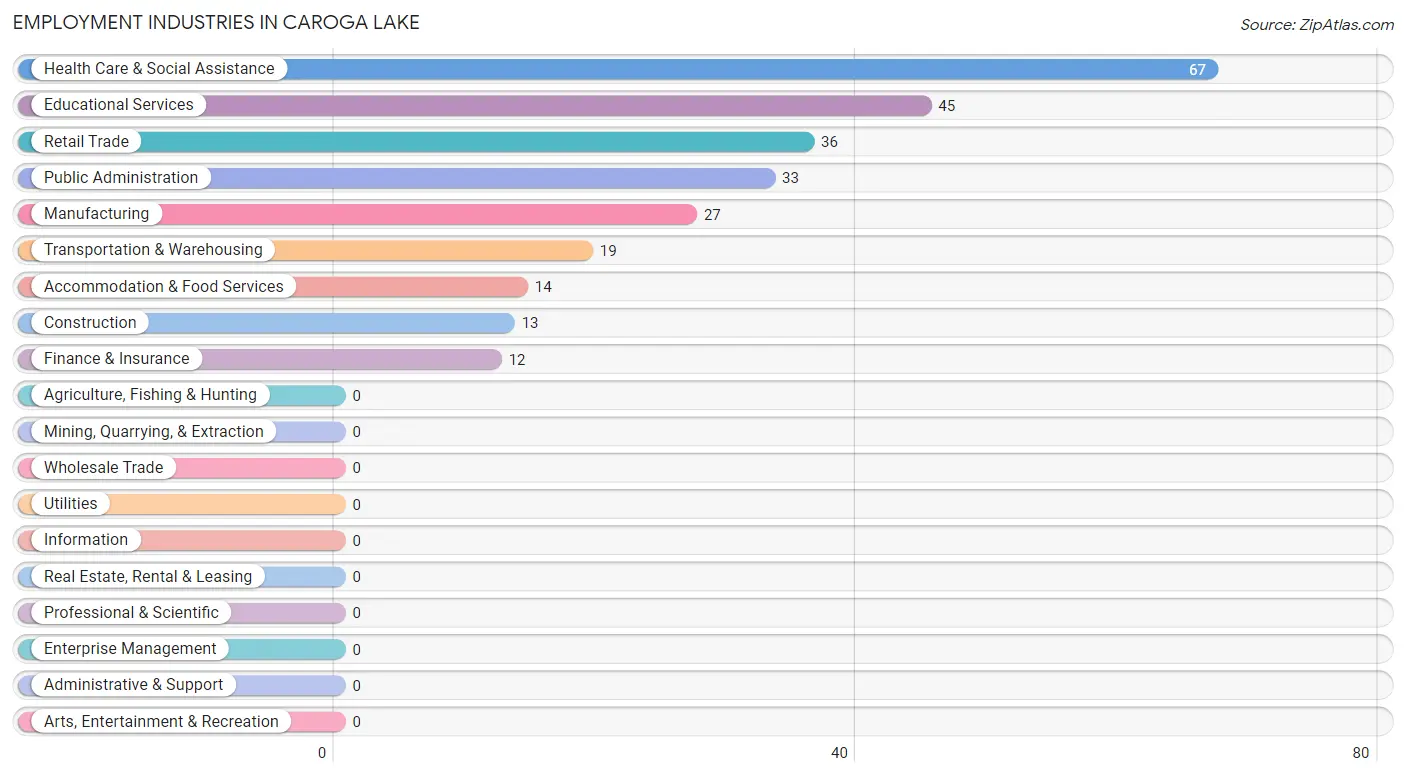
Employment Industries in Caroga Lake
The major employment industries in Caroga Lake include Health Care & Social Assistance (67 | 24.3%), Educational Services (45 | 16.3%), Retail Trade (36 | 13.0%), Public Administration (33 | 12.0%), and Manufacturing (27 | 9.8%).
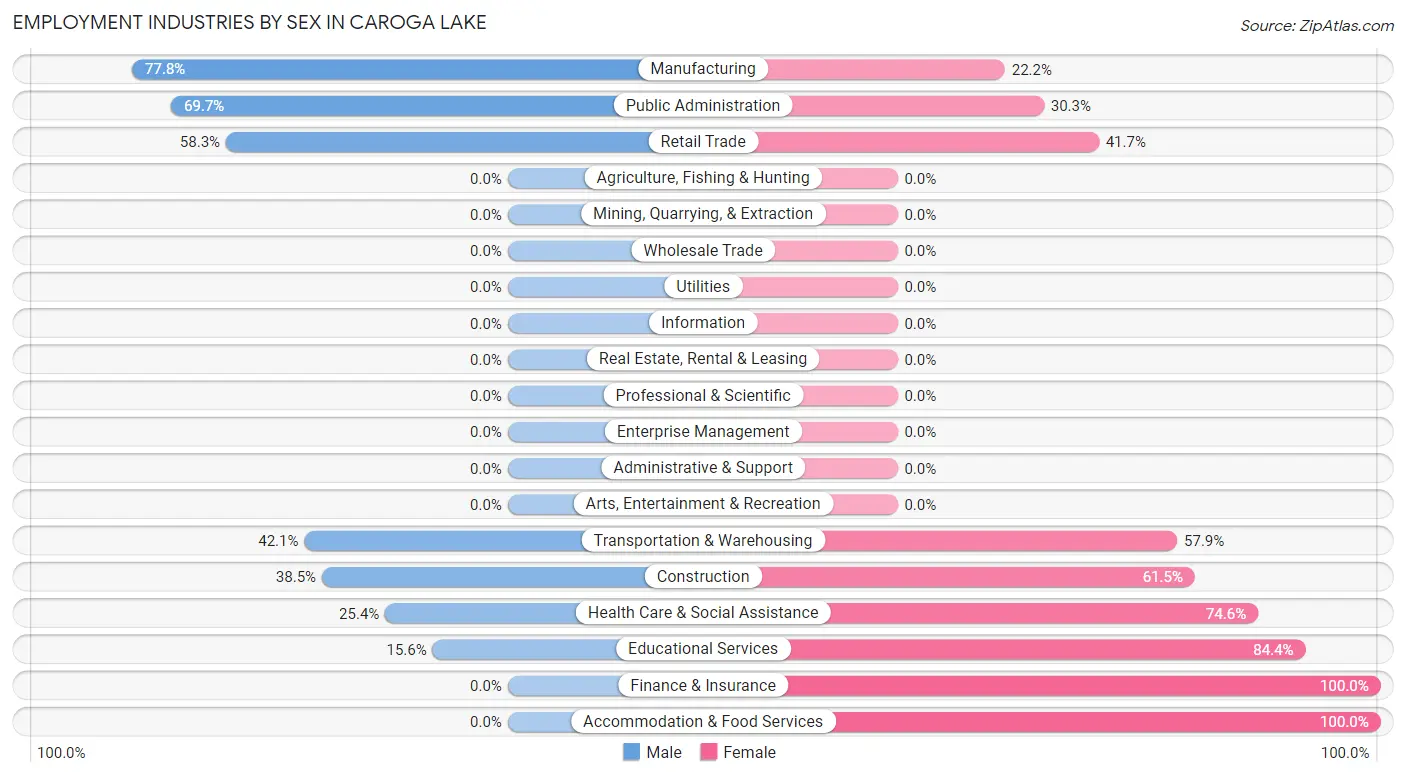
Employment Industries by Sex in Caroga Lake
The Caroga Lake industries that see more men than women are Manufacturing (77.8%), Public Administration (69.7%), and Retail Trade (58.3%), whereas the industries that tend to have a higher number of women are Finance & Insurance (100.0%), Accommodation & Food Services (100.0%), and Educational Services (84.4%).
| Industry | Male | Female |
| Agriculture, Fishing & Hunting | 0 (0.0%) | 0 (0.0%) |
| Mining, Quarrying, & Extraction | 0 (0.0%) | 0 (0.0%) |
| Construction | 5 (38.5%) | 8 (61.5%) |
| Manufacturing | 21 (77.8%) | 6 (22.2%) |
| Wholesale Trade | 0 (0.0%) | 0 (0.0%) |
| Retail Trade | 21 (58.3%) | 15 (41.7%) |
| Transportation & Warehousing | 8 (42.1%) | 11 (57.9%) |
| Utilities | 0 (0.0%) | 0 (0.0%) |
| Information | 0 (0.0%) | 0 (0.0%) |
| Finance & Insurance | 0 (0.0%) | 12 (100.0%) |
| Real Estate, Rental & Leasing | 0 (0.0%) | 0 (0.0%) |
| Professional & Scientific | 0 (0.0%) | 0 (0.0%) |
| Enterprise Management | 0 (0.0%) | 0 (0.0%) |
| Administrative & Support | 0 (0.0%) | 0 (0.0%) |
| Educational Services | 7 (15.6%) | 38 (84.4%) |
| Health Care & Social Assistance | 17 (25.4%) | 50 (74.6%) |
| Arts, Entertainment & Recreation | 0 (0.0%) | 0 (0.0%) |
| Accommodation & Food Services | 0 (0.0%) | 14 (100.0%) |
| Public Administration | 23 (69.7%) | 10 (30.3%) |
| Total | 102 (37.0%) | 174 (63.0%) |
Education in Caroga Lake
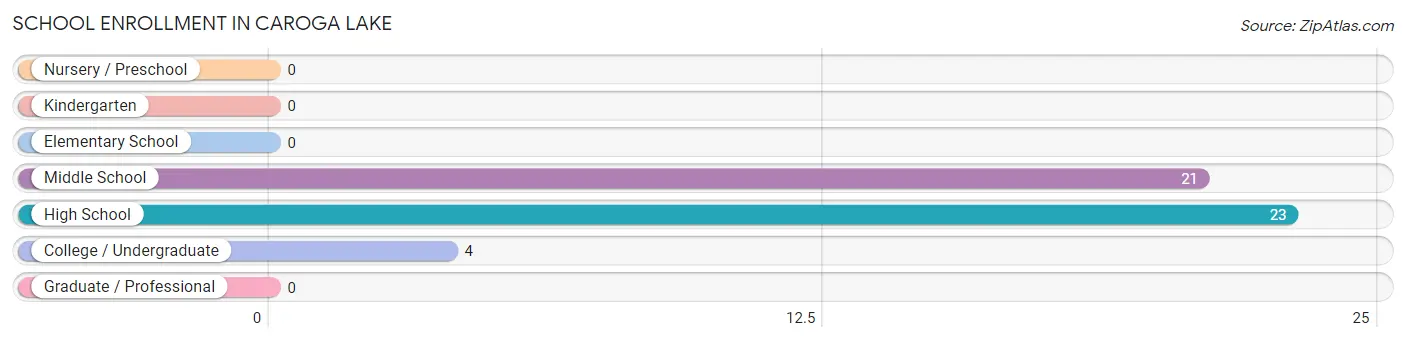
School Enrollment in Caroga Lake
The most common levels of schooling among the 48 students in Caroga Lake are high school (23 | 47.9%), middle school (21 | 43.8%), and college / undergraduate (4 | 8.3%).
| School Level | # Students | % Students |
| Nursery / Preschool | 0 | 0.0% |
| Kindergarten | 0 | 0.0% |
| Elementary School | 0 | 0.0% |
| Middle School | 21 | 43.8% |
| High School | 23 | 47.9% |
| College / Undergraduate | 4 | 8.3% |
| Graduate / Professional | 0 | 0.0% |
| Total | 48 | 100.0% |
School Enrollment by Age by Funding Source in Caroga Lake
Out of a total of 48 students who are enrolled in schools in Caroga Lake, 4 (8.3%) attend a private institution, while the remaining 44 (91.7%) are enrolled in public schools. The age group of 35 years and over has the highest likelihood of being enrolled in private schools, with 4 (100.0% in the age bracket) enrolled. Conversely, the age group of 10 to 14 year olds has the lowest likelihood of being enrolled in a private school, with 21 (100.0% in the age bracket) attending a public institution.
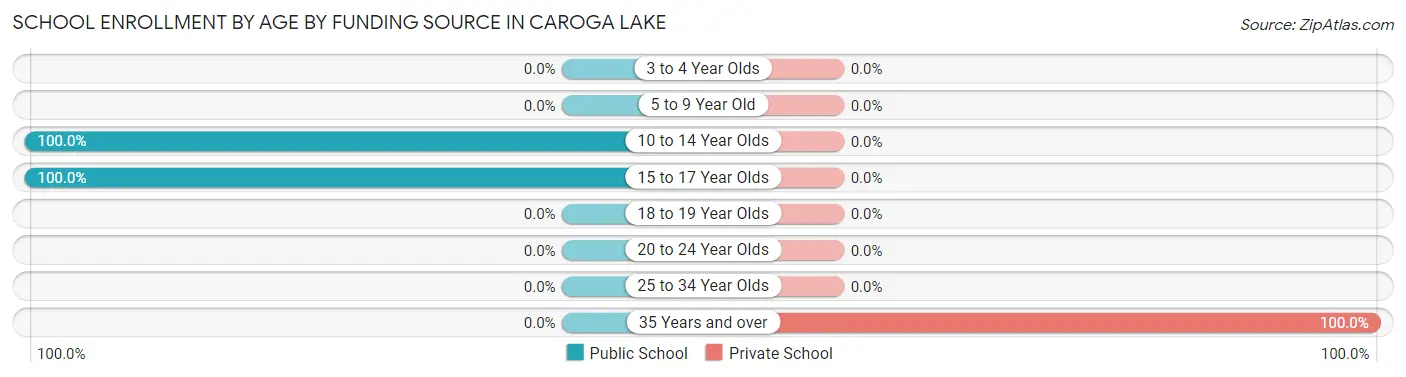
| Age Bracket | Public School | Private School |
| 3 to 4 Year Olds | 0 (0.0%) | 0 (0.0%) |
| 5 to 9 Year Old | 0 (0.0%) | 0 (0.0%) |
| 10 to 14 Year Olds | 21 (100.0%) | 0 (0.0%) |
| 15 to 17 Year Olds | 23 (100.0%) | 0 (0.0%) |
| 18 to 19 Year Olds | 0 (0.0%) | 0 (0.0%) |
| 20 to 24 Year Olds | 0 (0.0%) | 0 (0.0%) |
| 25 to 34 Year Olds | 0 (0.0%) | 0 (0.0%) |
| 35 Years and over | 0 (0.0%) | 4 (100.0%) |
| Total | 44 (91.7%) | 4 (8.3%) |
Educational Attainment by Field of Study in Caroga Lake
Social sciences (16 | 25.8%), business (10 | 16.1%), education (9 | 14.5%), communications (8 | 12.9%), and engineering (6 | 9.7%) are the most common fields of study among 62 individuals in Caroga Lake who have obtained a bachelor's degree or higher.
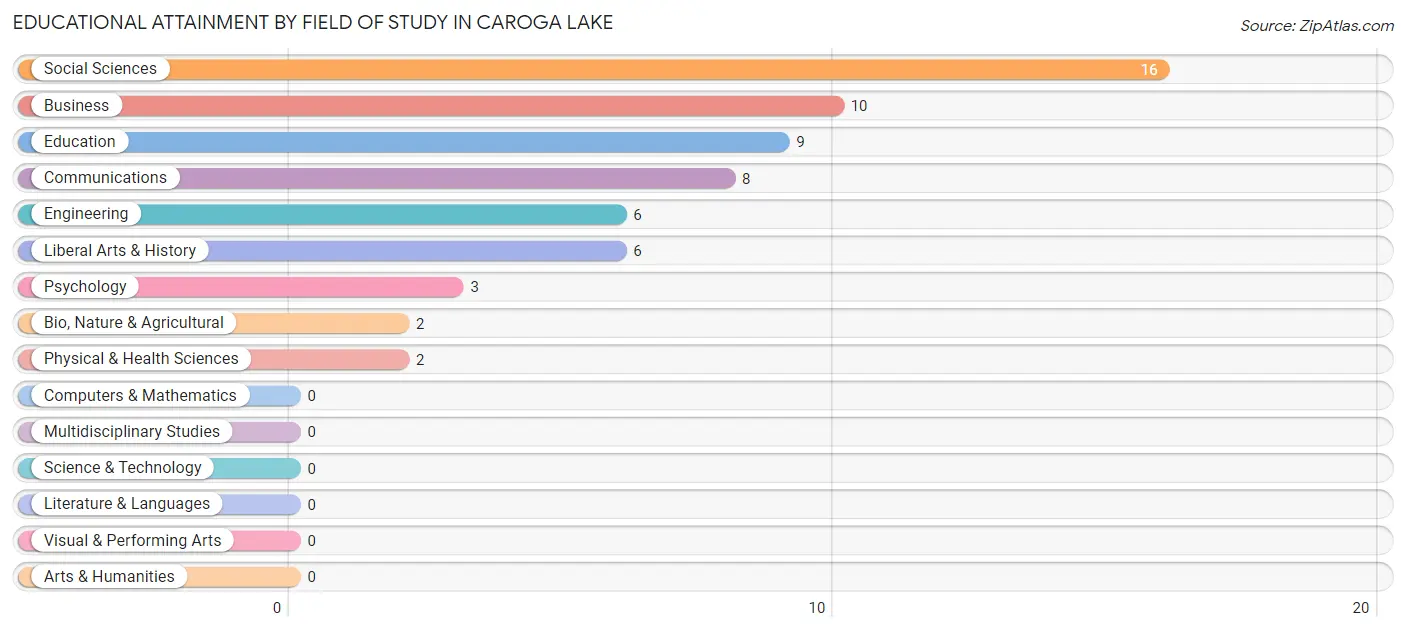
| Field of Study | # Graduates | % Graduates |
| Computers & Mathematics | 0 | 0.0% |
| Bio, Nature & Agricultural | 2 | 3.2% |
| Physical & Health Sciences | 2 | 3.2% |
| Psychology | 3 | 4.8% |
| Social Sciences | 16 | 25.8% |
| Engineering | 6 | 9.7% |
| Multidisciplinary Studies | 0 | 0.0% |
| Science & Technology | 0 | 0.0% |
| Business | 10 | 16.1% |
| Education | 9 | 14.5% |
| Literature & Languages | 0 | 0.0% |
| Liberal Arts & History | 6 | 9.7% |
| Visual & Performing Arts | 0 | 0.0% |
| Communications | 8 | 12.9% |
| Arts & Humanities | 0 | 0.0% |
| Total | 62 | 100.0% |
Transportation & Commute in Caroga Lake
Vehicle Availability by Sex in Caroga Lake
The most prevalent vehicle ownership categories in Caroga Lake are males with 1 vehicle (32, accounting for 31.4%) and females with 1 vehicle (33, making up 18.4%).
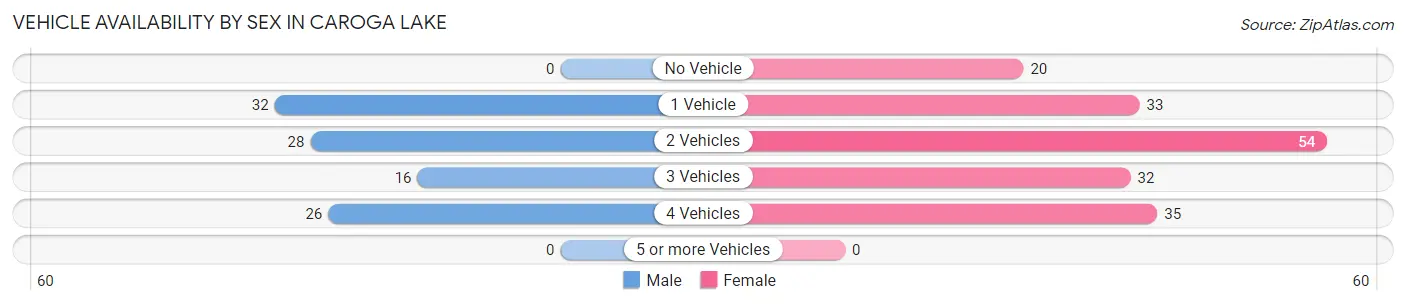
| Vehicles Available | Male | Female |
| No Vehicle | 0 (0.0%) | 20 (11.5%) |
| 1 Vehicle | 32 (31.4%) | 33 (19.0%) |
| 2 Vehicles | 28 (27.5%) | 54 (31.0%) |
| 3 Vehicles | 16 (15.7%) | 32 (18.4%) |
| 4 Vehicles | 26 (25.5%) | 35 (20.1%) |
| 5 or more Vehicles | 0 (0.0%) | 0 (0.0%) |
| Total | 102 (100.0%) | 174 (100.0%) |
Commute Time in Caroga Lake
The most frequently occuring commute durations in Caroga Lake are 15 to 19 minutes (79 commuters, 33.1%), 20 to 24 minutes (66 commuters, 27.6%), and 45 to 59 minutes (35 commuters, 14.6%).
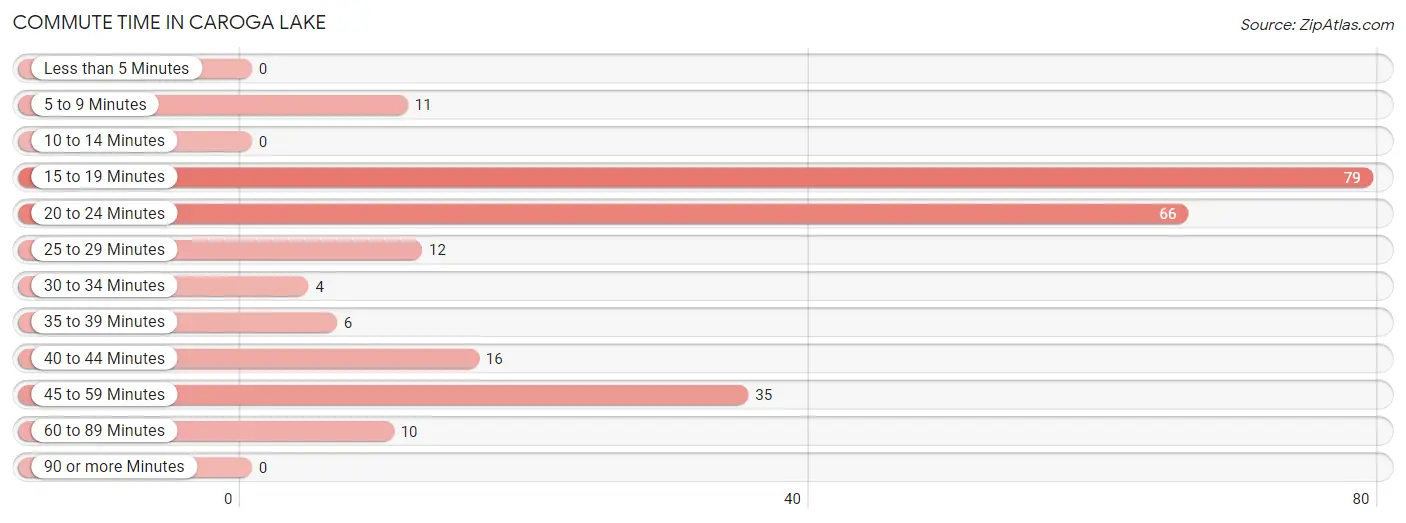
| Commute Time | # Commuters | % Commuters |
| Less than 5 Minutes | 0 | 0.0% |
| 5 to 9 Minutes | 11 | 4.6% |
| 10 to 14 Minutes | 0 | 0.0% |
| 15 to 19 Minutes | 79 | 33.1% |
| 20 to 24 Minutes | 66 | 27.6% |
| 25 to 29 Minutes | 12 | 5.0% |
| 30 to 34 Minutes | 4 | 1.7% |
| 35 to 39 Minutes | 6 | 2.5% |
| 40 to 44 Minutes | 16 | 6.7% |
| 45 to 59 Minutes | 35 | 14.6% |
| 60 to 89 Minutes | 10 | 4.2% |
| 90 or more Minutes | 0 | 0.0% |
Commute Time by Sex in Caroga Lake
The most common commute times in Caroga Lake are 20 to 24 minutes (29 commuters, 28.4%) for males and 15 to 19 minutes (66 commuters, 48.2%) for females.
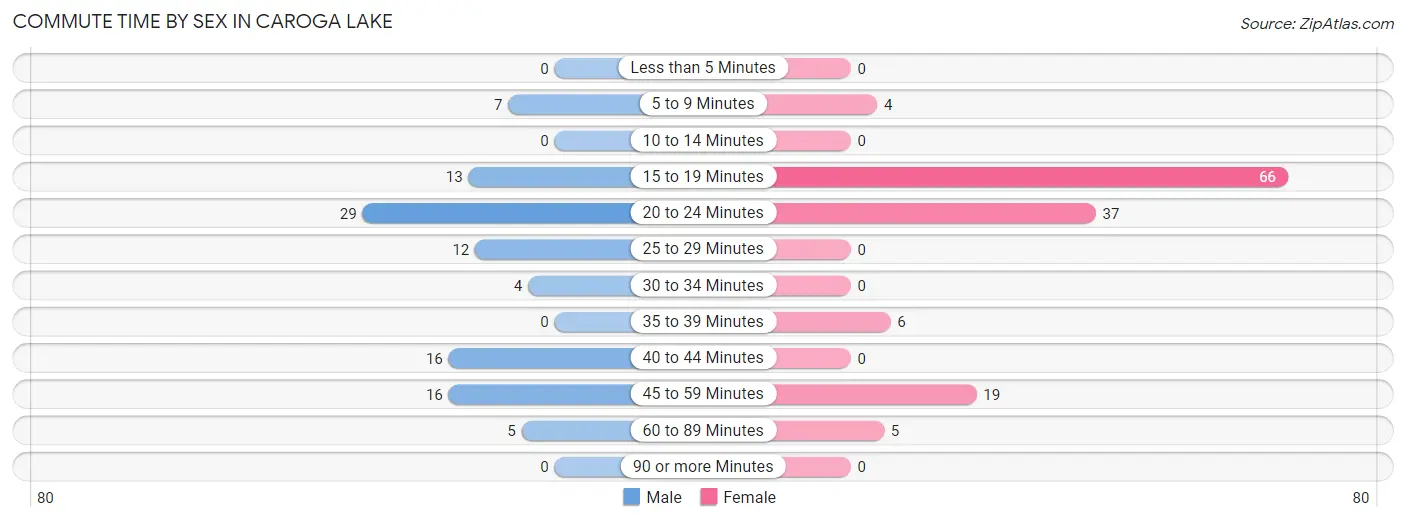
| Commute Time | Male | Female |
| Less than 5 Minutes | 0 (0.0%) | 0 (0.0%) |
| 5 to 9 Minutes | 7 (6.9%) | 4 (2.9%) |
| 10 to 14 Minutes | 0 (0.0%) | 0 (0.0%) |
| 15 to 19 Minutes | 13 (12.8%) | 66 (48.2%) |
| 20 to 24 Minutes | 29 (28.4%) | 37 (27.0%) |
| 25 to 29 Minutes | 12 (11.8%) | 0 (0.0%) |
| 30 to 34 Minutes | 4 (3.9%) | 0 (0.0%) |
| 35 to 39 Minutes | 0 (0.0%) | 6 (4.4%) |
| 40 to 44 Minutes | 16 (15.7%) | 0 (0.0%) |
| 45 to 59 Minutes | 16 (15.7%) | 19 (13.9%) |
| 60 to 89 Minutes | 5 (4.9%) | 5 (3.6%) |
| 90 or more Minutes | 0 (0.0%) | 0 (0.0%) |
Time of Departure to Work by Sex in Caroga Lake
The most frequent times of departure to work in Caroga Lake are 12:00 AM to 4:59 AM (29, 28.4%) for males and 7:00 AM to 7:29 AM (40, 29.2%) for females.
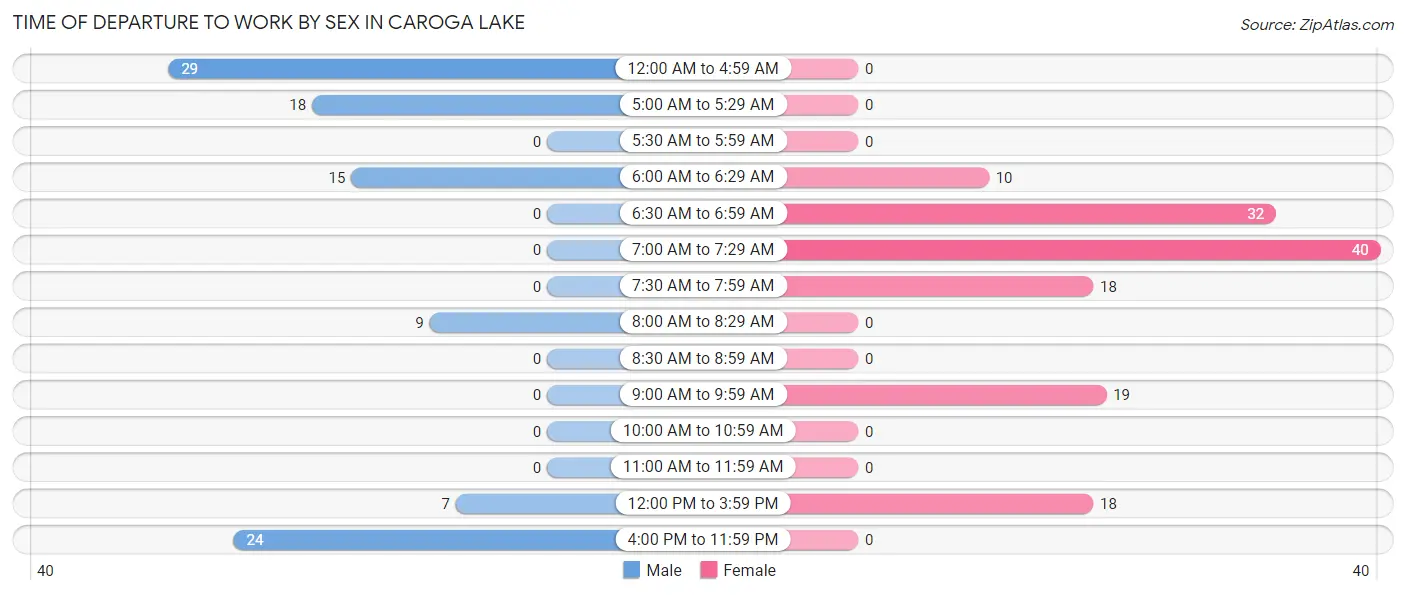
| Time of Departure | Male | Female |
| 12:00 AM to 4:59 AM | 29 (28.4%) | 0 (0.0%) |
| 5:00 AM to 5:29 AM | 18 (17.6%) | 0 (0.0%) |
| 5:30 AM to 5:59 AM | 0 (0.0%) | 0 (0.0%) |
| 6:00 AM to 6:29 AM | 15 (14.7%) | 10 (7.3%) |
| 6:30 AM to 6:59 AM | 0 (0.0%) | 32 (23.4%) |
| 7:00 AM to 7:29 AM | 0 (0.0%) | 40 (29.2%) |
| 7:30 AM to 7:59 AM | 0 (0.0%) | 18 (13.1%) |
| 8:00 AM to 8:29 AM | 9 (8.8%) | 0 (0.0%) |
| 8:30 AM to 8:59 AM | 0 (0.0%) | 0 (0.0%) |
| 9:00 AM to 9:59 AM | 0 (0.0%) | 19 (13.9%) |
| 10:00 AM to 10:59 AM | 0 (0.0%) | 0 (0.0%) |
| 11:00 AM to 11:59 AM | 0 (0.0%) | 0 (0.0%) |
| 12:00 PM to 3:59 PM | 7 (6.9%) | 18 (13.1%) |
| 4:00 PM to 11:59 PM | 24 (23.5%) | 0 (0.0%) |
| Total | 102 (100.0%) | 137 (100.0%) |
Housing Occupancy in Caroga Lake
Occupancy by Ownership in Caroga Lake
Of the total 240 dwellings in Caroga Lake, owner-occupied units account for 229 (95.4%), while renter-occupied units make up 11 (4.6%).
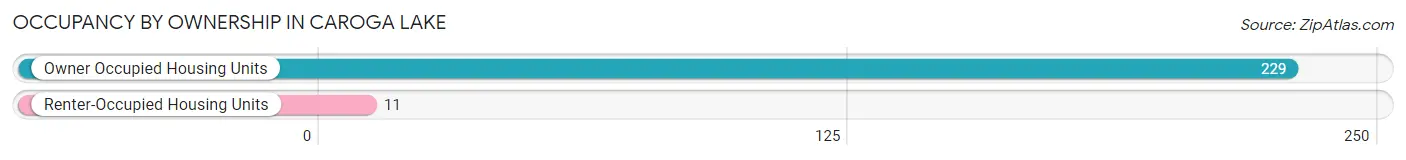
| Occupancy | # Housing Units | % Housing Units |
| Owner Occupied Housing Units | 229 | 95.4% |
| Renter-Occupied Housing Units | 11 | 4.6% |
| Total Occupied Housing Units | 240 | 100.0% |
Occupancy by Household Size in Caroga Lake
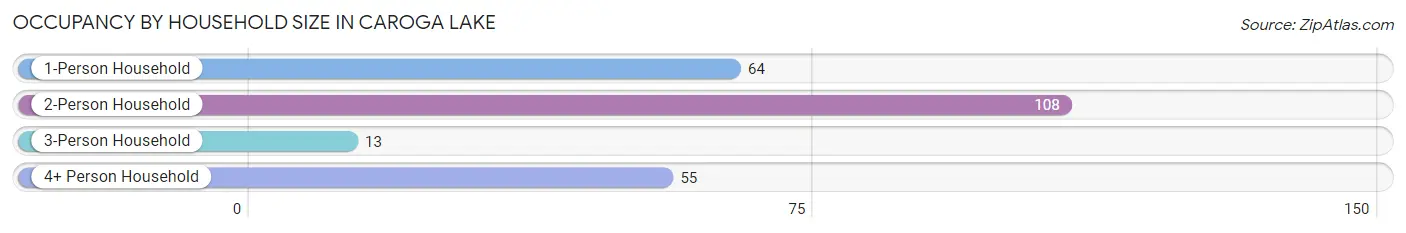
| Household Size | # Housing Units | % Housing Units |
| 1-Person Household | 64 | 26.7% |
| 2-Person Household | 108 | 45.0% |
| 3-Person Household | 13 | 5.4% |
| 4+ Person Household | 55 | 22.9% |
| Total Housing Units | 240 | 100.0% |
Occupancy by Ownership by Household Size in Caroga Lake
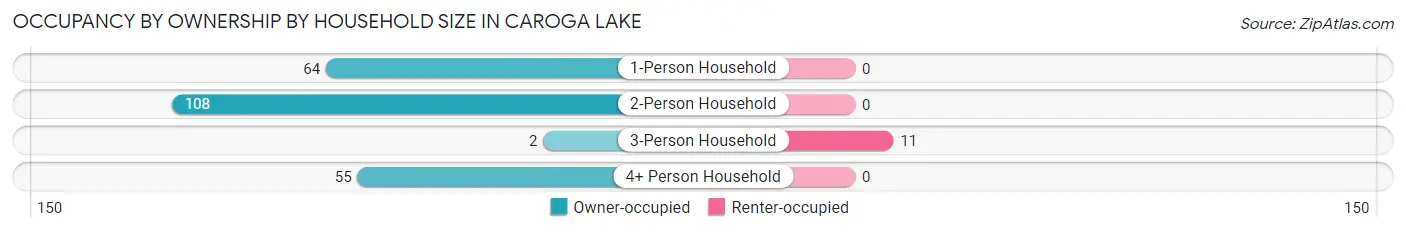
| Household Size | Owner-occupied | Renter-occupied |
| 1-Person Household | 64 (100.0%) | 0 (0.0%) |
| 2-Person Household | 108 (100.0%) | 0 (0.0%) |
| 3-Person Household | 2 (15.4%) | 11 (84.6%) |
| 4+ Person Household | 55 (100.0%) | 0 (0.0%) |
| Total Housing Units | 229 (95.4%) | 11 (4.6%) |
Occupancy by Educational Attainment in Caroga Lake
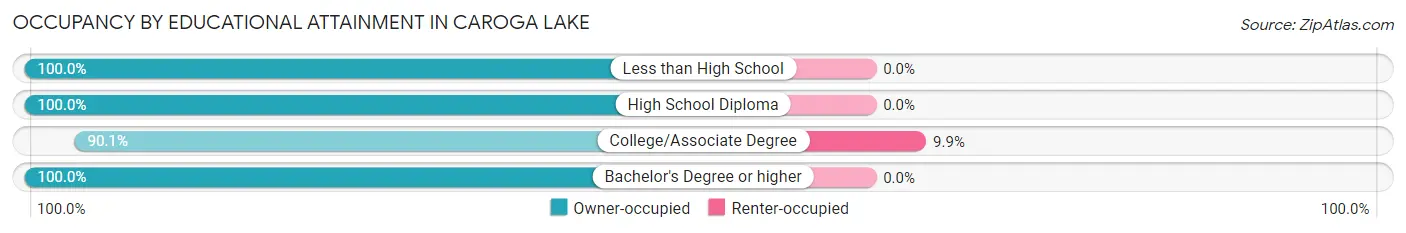
| Household Size | Owner-occupied | Renter-occupied |
| Less than High School | 29 (100.0%) | 0 (0.0%) |
| High School Diploma | 71 (100.0%) | 0 (0.0%) |
| College/Associate Degree | 100 (90.1%) | 11 (9.9%) |
| Bachelor's Degree or higher | 29 (100.0%) | 0 (0.0%) |
Occupancy by Age of Householder in Caroga Lake
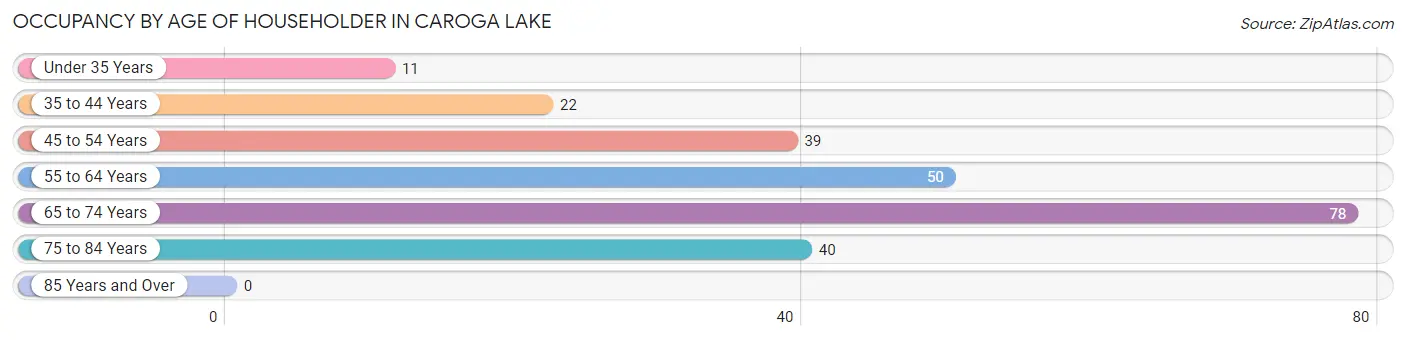
| Age Bracket | # Households | % Households |
| Under 35 Years | 11 | 4.6% |
| 35 to 44 Years | 22 | 9.2% |
| 45 to 54 Years | 39 | 16.3% |
| 55 to 64 Years | 50 | 20.8% |
| 65 to 74 Years | 78 | 32.5% |
| 75 to 84 Years | 40 | 16.7% |
| 85 Years and Over | 0 | 0.0% |
| Total | 240 | 100.0% |
Housing Finances in Caroga Lake
Median Income by Occupancy in Caroga Lake
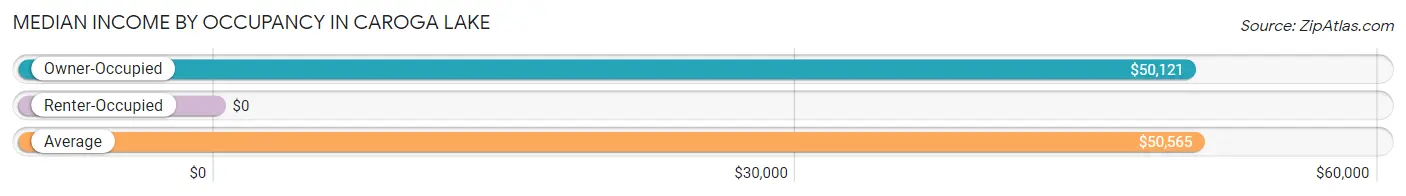
| Occupancy Type | # Households | Median Income |
| Owner-Occupied | 229 (95.4%) | $50,121 |
| Renter-Occupied | 11 (4.6%) | $0 |
| Average | 240 (100.0%) | $50,565 |
Occupancy by Householder Income Bracket in Caroga Lake
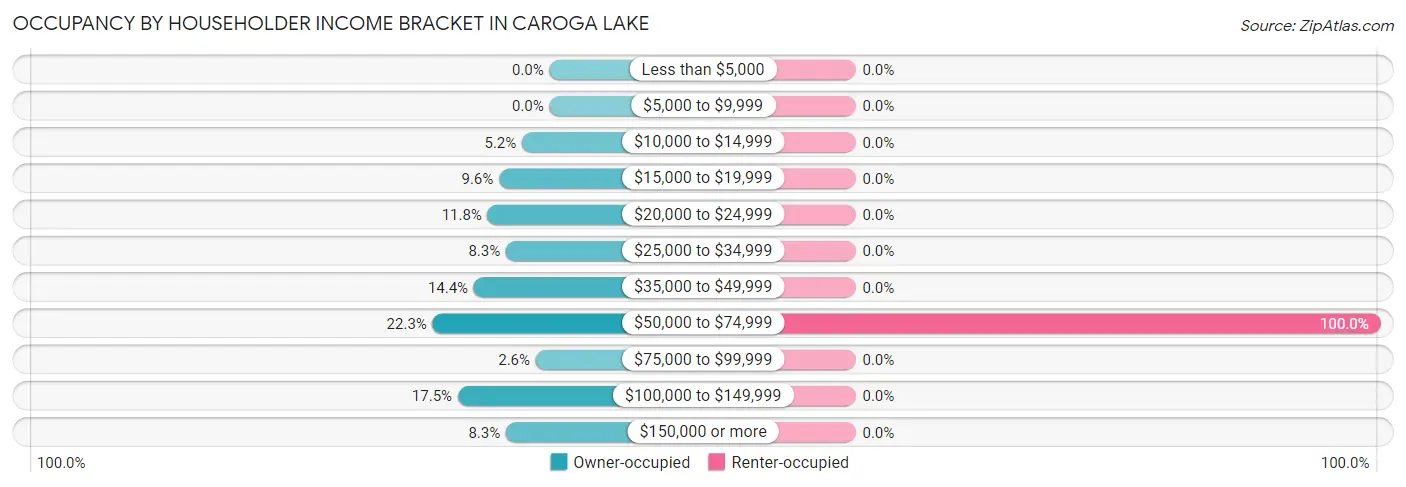
| Income Bracket | Owner-occupied | Renter-occupied |
| Less than $5,000 | 0 (0.0%) | 0 (0.0%) |
| $5,000 to $9,999 | 0 (0.0%) | 0 (0.0%) |
| $10,000 to $14,999 | 12 (5.2%) | 0 (0.0%) |
| $15,000 to $19,999 | 22 (9.6%) | 0 (0.0%) |
| $20,000 to $24,999 | 27 (11.8%) | 0 (0.0%) |
| $25,000 to $34,999 | 19 (8.3%) | 0 (0.0%) |
| $35,000 to $49,999 | 33 (14.4%) | 0 (0.0%) |
| $50,000 to $74,999 | 51 (22.3%) | 11 (100.0%) |
| $75,000 to $99,999 | 6 (2.6%) | 0 (0.0%) |
| $100,000 to $149,999 | 40 (17.5%) | 0 (0.0%) |
| $150,000 or more | 19 (8.3%) | 0 (0.0%) |
| Total | 229 (100.0%) | 11 (100.0%) |
Monthly Housing Cost Tiers in Caroga Lake
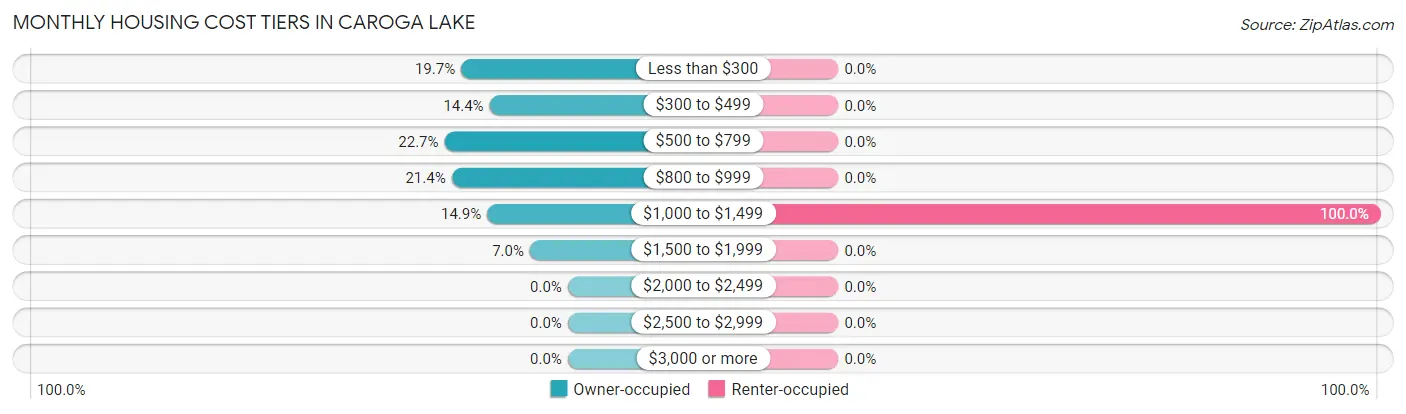
| Monthly Cost | Owner-occupied | Renter-occupied |
| Less than $300 | 45 (19.7%) | 0 (0.0%) |
| $300 to $499 | 33 (14.4%) | 0 (0.0%) |
| $500 to $799 | 52 (22.7%) | 0 (0.0%) |
| $800 to $999 | 49 (21.4%) | 0 (0.0%) |
| $1,000 to $1,499 | 34 (14.8%) | 11 (100.0%) |
| $1,500 to $1,999 | 16 (7.0%) | 0 (0.0%) |
| $2,000 to $2,499 | 0 (0.0%) | 0 (0.0%) |
| $2,500 to $2,999 | 0 (0.0%) | 0 (0.0%) |
| $3,000 or more | 0 (0.0%) | 0 (0.0%) |
| Total | 229 (100.0%) | 11 (100.0%) |
Physical Housing Characteristics in Caroga Lake
Housing Structures in Caroga Lake
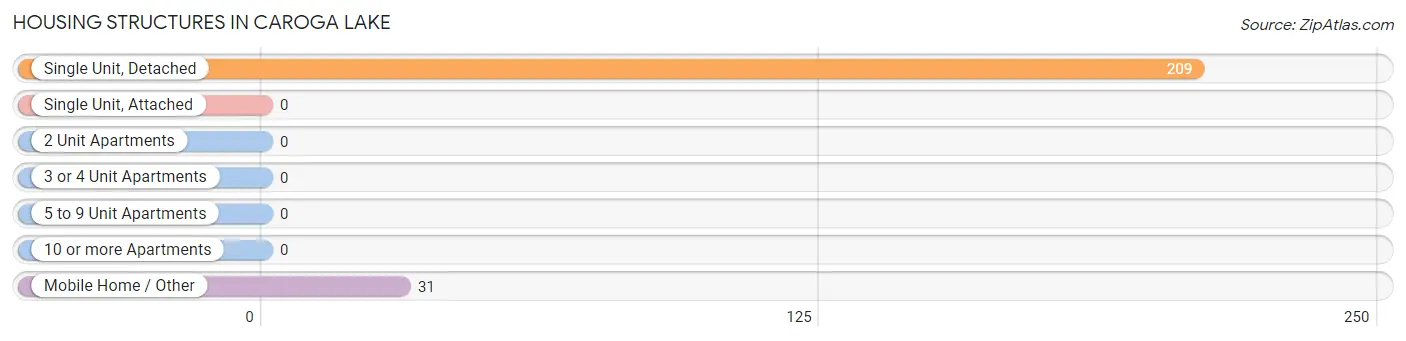
| Structure Type | # Housing Units | % Housing Units |
| Single Unit, Detached | 209 | 87.1% |
| Single Unit, Attached | 0 | 0.0% |
| 2 Unit Apartments | 0 | 0.0% |
| 3 or 4 Unit Apartments | 0 | 0.0% |
| 5 to 9 Unit Apartments | 0 | 0.0% |
| 10 or more Apartments | 0 | 0.0% |
| Mobile Home / Other | 31 | 12.9% |
| Total | 240 | 100.0% |
Housing Structures by Occupancy in Caroga Lake
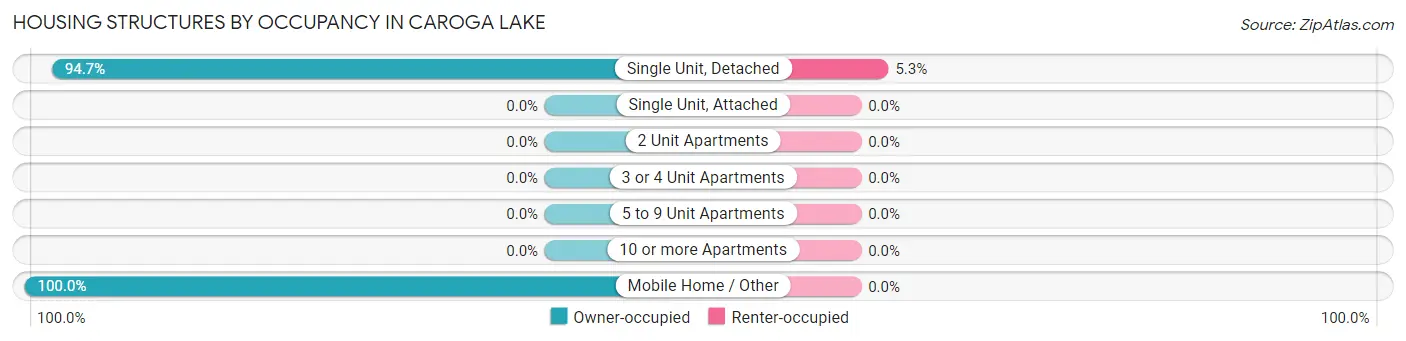
| Structure Type | Owner-occupied | Renter-occupied |
| Single Unit, Detached | 198 (94.7%) | 11 (5.3%) |
| Single Unit, Attached | 0 (0.0%) | 0 (0.0%) |
| 2 Unit Apartments | 0 (0.0%) | 0 (0.0%) |
| 3 or 4 Unit Apartments | 0 (0.0%) | 0 (0.0%) |
| 5 to 9 Unit Apartments | 0 (0.0%) | 0 (0.0%) |
| 10 or more Apartments | 0 (0.0%) | 0 (0.0%) |
| Mobile Home / Other | 31 (100.0%) | 0 (0.0%) |
| Total | 229 (95.4%) | 11 (4.6%) |
Housing Structures by Number of Rooms in Caroga Lake
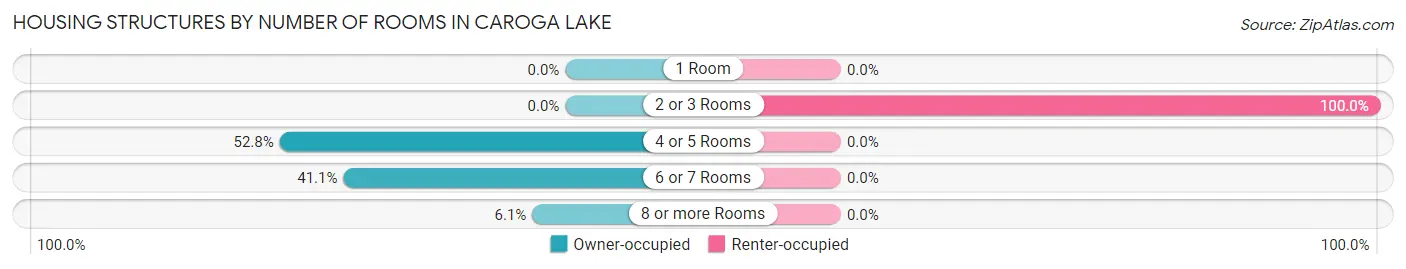
| Number of Rooms | Owner-occupied | Renter-occupied |
| 1 Room | 0 (0.0%) | 0 (0.0%) |
| 2 or 3 Rooms | 0 (0.0%) | 11 (100.0%) |
| 4 or 5 Rooms | 121 (52.8%) | 0 (0.0%) |
| 6 or 7 Rooms | 94 (41.0%) | 0 (0.0%) |
| 8 or more Rooms | 14 (6.1%) | 0 (0.0%) |
| Total | 229 (100.0%) | 11 (100.0%) |
Housing Structure by Heating Type in Caroga Lake
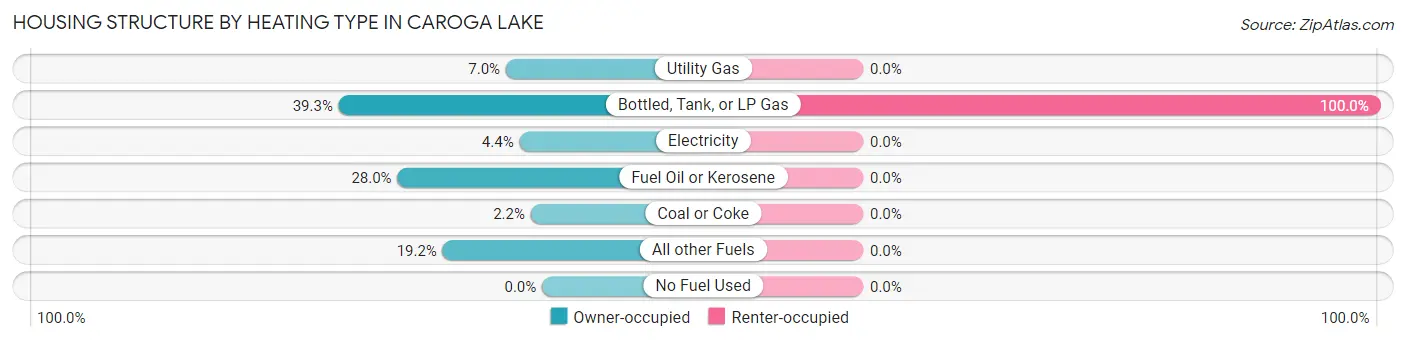
| Heating Type | Owner-occupied | Renter-occupied |
| Utility Gas | 16 (7.0%) | 0 (0.0%) |
| Bottled, Tank, or LP Gas | 90 (39.3%) | 11 (100.0%) |
| Electricity | 10 (4.4%) | 0 (0.0%) |
| Fuel Oil or Kerosene | 64 (28.0%) | 0 (0.0%) |
| Coal or Coke | 5 (2.2%) | 0 (0.0%) |
| All other Fuels | 44 (19.2%) | 0 (0.0%) |
| No Fuel Used | 0 (0.0%) | 0 (0.0%) |
| Total | 229 (100.0%) | 11 (100.0%) |
Household Vehicle Usage in Caroga Lake
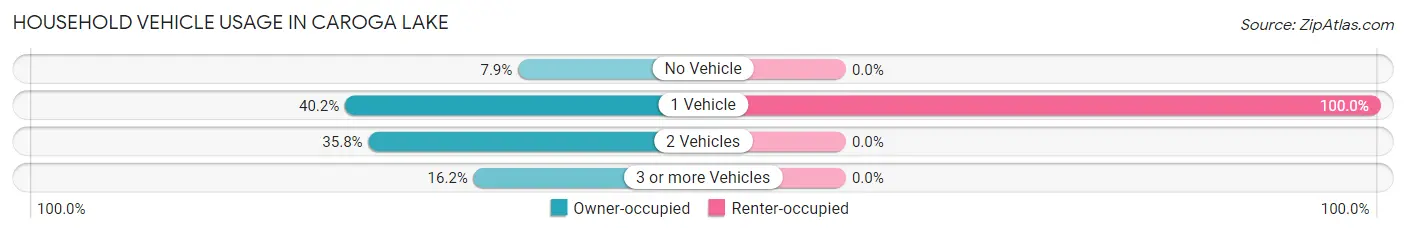
| Vehicles per Household | Owner-occupied | Renter-occupied |
| No Vehicle | 18 (7.9%) | 0 (0.0%) |
| 1 Vehicle | 92 (40.2%) | 11 (100.0%) |
| 2 Vehicles | 82 (35.8%) | 0 (0.0%) |
| 3 or more Vehicles | 37 (16.2%) | 0 (0.0%) |
| Total | 229 (100.0%) | 11 (100.0%) |
Real Estate & Mortgages in Caroga Lake
Real Estate and Mortgage Overview in Caroga Lake
| Characteristic | Without Mortgage | With Mortgage |
| Housing Units | 116 | 113 |
| Median Property Value | $156,300 | $108,600 |
| Median Household Income | $25,000 | $6 |
| Monthly Housing Costs | $346 | $0 |
| Real Estate Taxes | $1,400 | $0 |
Property Value by Mortgage Status in Caroga Lake
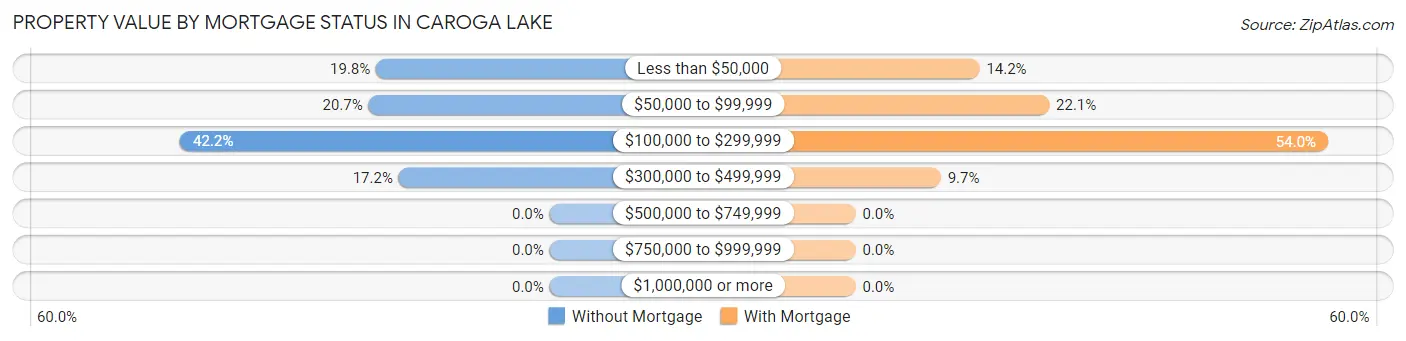
| Property Value | Without Mortgage | With Mortgage |
| Less than $50,000 | 23 (19.8%) | 16 (14.2%) |
| $50,000 to $99,999 | 24 (20.7%) | 25 (22.1%) |
| $100,000 to $299,999 | 49 (42.2%) | 61 (54.0%) |
| $300,000 to $499,999 | 20 (17.2%) | 11 (9.7%) |
| $500,000 to $749,999 | 0 (0.0%) | 0 (0.0%) |
| $750,000 to $999,999 | 0 (0.0%) | 0 (0.0%) |
| $1,000,000 or more | 0 (0.0%) | 0 (0.0%) |
| Total | 116 (100.0%) | 113 (100.0%) |
Household Income by Mortgage Status in Caroga Lake
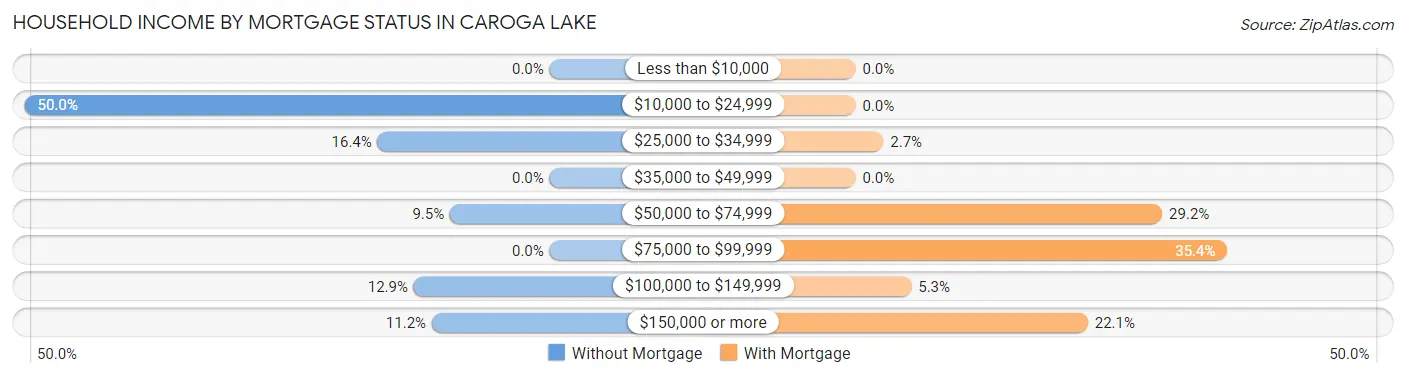
| Household Income | Without Mortgage | With Mortgage |
| Less than $10,000 | 0 (0.0%) | 0 (0.0%) |
| $10,000 to $24,999 | 58 (50.0%) | 0 (0.0%) |
| $25,000 to $34,999 | 19 (16.4%) | 3 (2.6%) |
| $35,000 to $49,999 | 0 (0.0%) | 0 (0.0%) |
| $50,000 to $74,999 | 11 (9.5%) | 33 (29.2%) |
| $75,000 to $99,999 | 0 (0.0%) | 40 (35.4%) |
| $100,000 to $149,999 | 15 (12.9%) | 6 (5.3%) |
| $150,000 or more | 13 (11.2%) | 25 (22.1%) |
| Total | 116 (100.0%) | 113 (100.0%) |
Property Value to Household Income Ratio in Caroga Lake
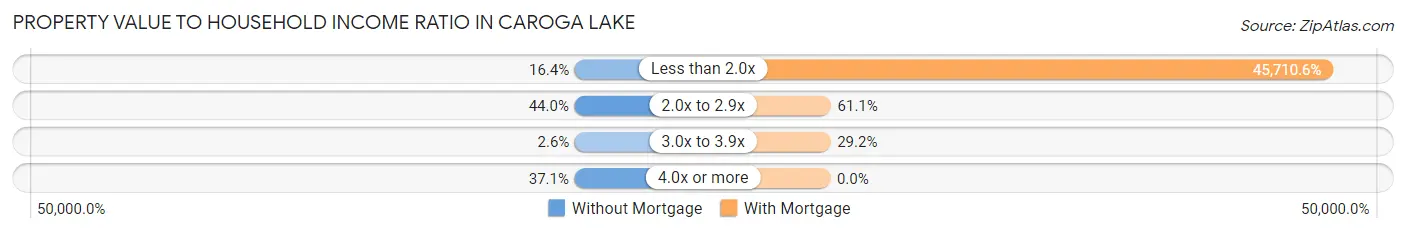
| Value-to-Income Ratio | Without Mortgage | With Mortgage |
| Less than 2.0x | 19 (16.4%) | 51,653 (45,710.6%) |
| 2.0x to 2.9x | 51 (44.0%) | 69 (61.1%) |
| 3.0x to 3.9x | 3 (2.6%) | 33 (29.2%) |
| 4.0x or more | 43 (37.1%) | 0 (0.0%) |
| Total | 116 (100.0%) | 113 (100.0%) |
Real Estate Taxes by Mortgage Status in Caroga Lake
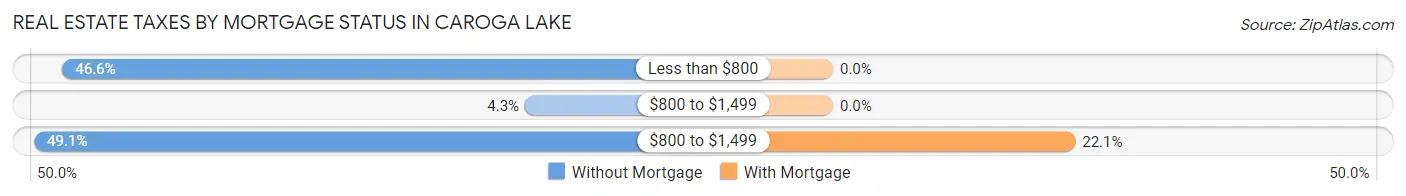
| Property Taxes | Without Mortgage | With Mortgage |
| Less than $800 | 54 (46.6%) | 0 (0.0%) |
| $800 to $1,499 | 5 (4.3%) | 0 (0.0%) |
| $800 to $1,499 | 57 (49.1%) | 25 (22.1%) |
| Total | 116 (100.0%) | 113 (100.0%) |
Health & Disability in Caroga Lake
Health Insurance Coverage by Age in Caroga Lake
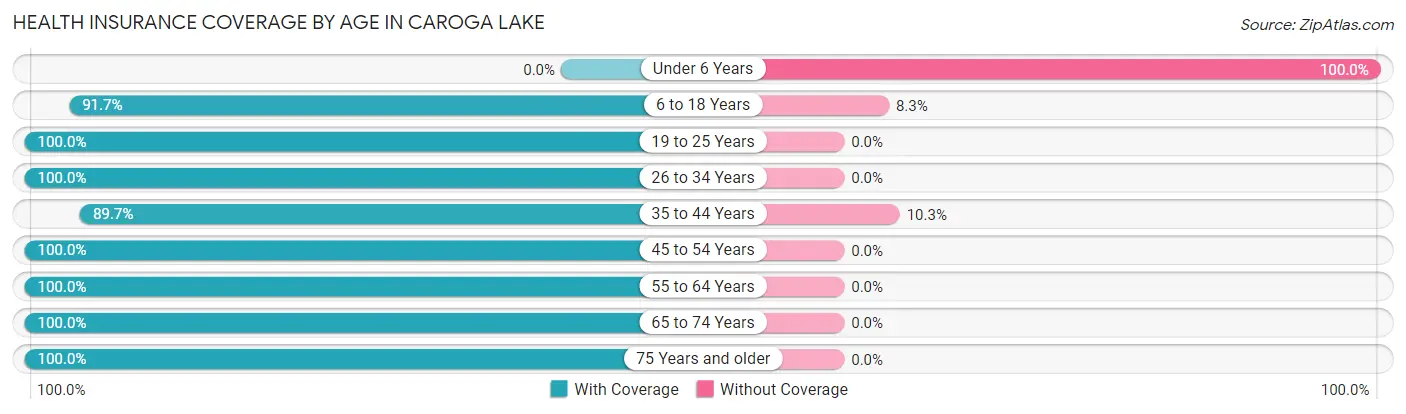
| Age Bracket | With Coverage | Without Coverage |
| Under 6 Years | 0 (0.0%) | 12 (100.0%) |
| 6 to 18 Years | 44 (91.7%) | 4 (8.3%) |
| 19 to 25 Years | 43 (100.0%) | 0 (0.0%) |
| 26 to 34 Years | 36 (100.0%) | 0 (0.0%) |
| 35 to 44 Years | 52 (89.7%) | 6 (10.3%) |
| 45 to 54 Years | 68 (100.0%) | 0 (0.0%) |
| 55 to 64 Years | 91 (100.0%) | 0 (0.0%) |
| 65 to 74 Years | 120 (100.0%) | 0 (0.0%) |
| 75 Years and older | 101 (100.0%) | 0 (0.0%) |
| Total | 555 (96.2%) | 22 (3.8%) |
Health Insurance Coverage by Citizenship Status in Caroga Lake
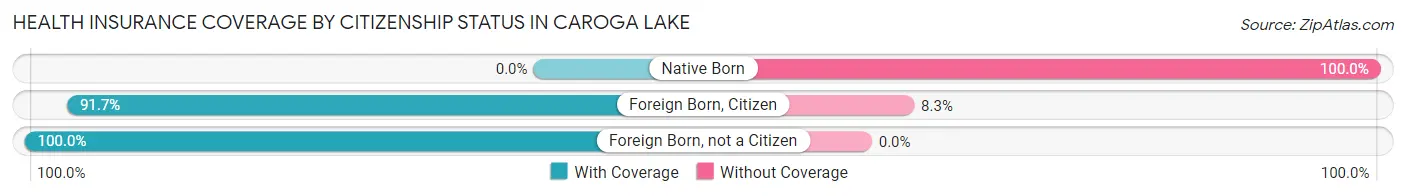
| Citizenship Status | With Coverage | Without Coverage |
| Native Born | 0 (0.0%) | 12 (100.0%) |
| Foreign Born, Citizen | 44 (91.7%) | 4 (8.3%) |
| Foreign Born, not a Citizen | 43 (100.0%) | 0 (0.0%) |
Health Insurance Coverage by Household Income in Caroga Lake
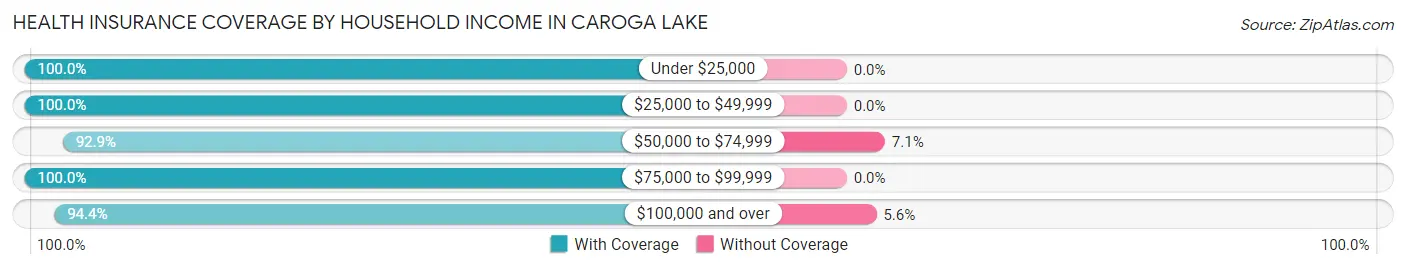
| Household Income | With Coverage | Without Coverage |
| Under $25,000 | 81 (100.0%) | 0 (0.0%) |
| $25,000 to $49,999 | 135 (100.0%) | 0 (0.0%) |
| $50,000 to $74,999 | 156 (92.9%) | 12 (7.1%) |
| $75,000 to $99,999 | 13 (100.0%) | 0 (0.0%) |
| $100,000 and over | 170 (94.4%) | 10 (5.6%) |
Public vs Private Health Insurance Coverage by Age in Caroga Lake
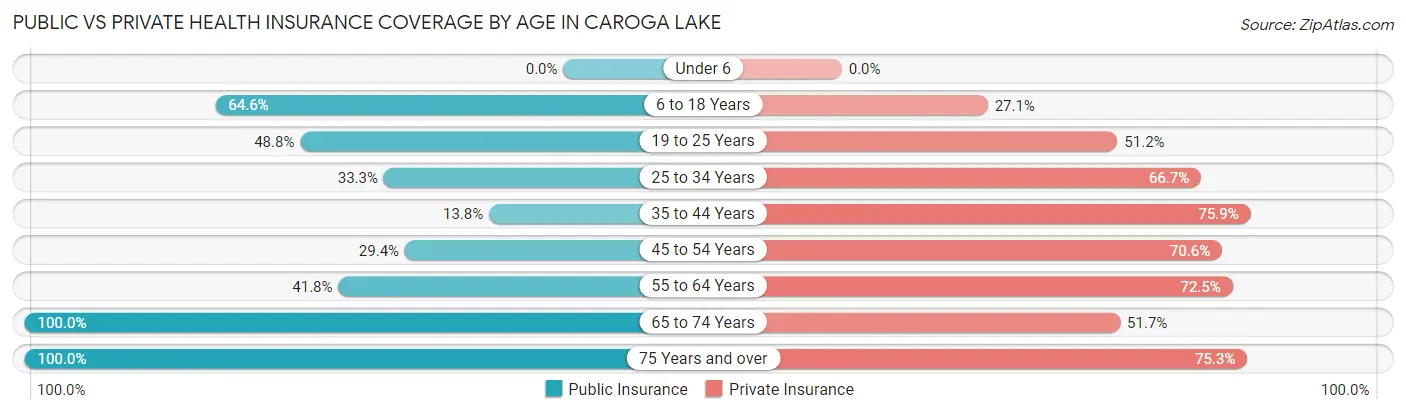
| Age Bracket | Public Insurance | Private Insurance |
| Under 6 | 0 (0.0%) | 0 (0.0%) |
| 6 to 18 Years | 31 (64.6%) | 13 (27.1%) |
| 19 to 25 Years | 21 (48.8%) | 22 (51.2%) |
| 25 to 34 Years | 12 (33.3%) | 24 (66.7%) |
| 35 to 44 Years | 8 (13.8%) | 44 (75.9%) |
| 45 to 54 Years | 20 (29.4%) | 48 (70.6%) |
| 55 to 64 Years | 38 (41.8%) | 66 (72.5%) |
| 65 to 74 Years | 120 (100.0%) | 62 (51.7%) |
| 75 Years and over | 101 (100.0%) | 76 (75.2%) |
| Total | 351 (60.8%) | 355 (61.5%) |
Disability Status by Sex by Age in Caroga Lake
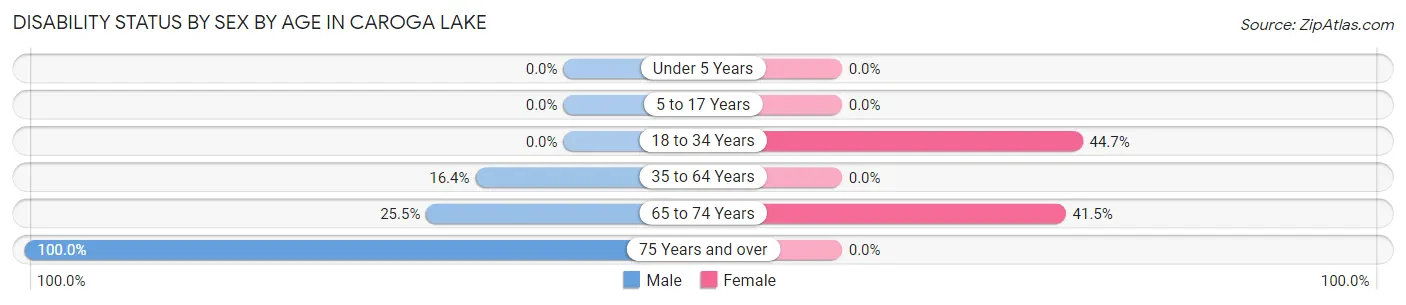
| Age Bracket | Male | Female |
| Under 5 Years | 0 (0.0%) | 0 (0.0%) |
| 5 to 17 Years | 0 (0.0%) | 0 (0.0%) |
| 18 to 34 Years | 0 (0.0%) | 21 (44.7%) |
| 35 to 64 Years | 17 (16.4%) | 0 (0.0%) |
| 65 to 74 Years | 14 (25.5%) | 27 (41.5%) |
| 75 Years and over | 10 (100.0%) | 0 (0.0%) |
Disability Class by Sex by Age in Caroga Lake
Disability Class: Hearing Difficulty
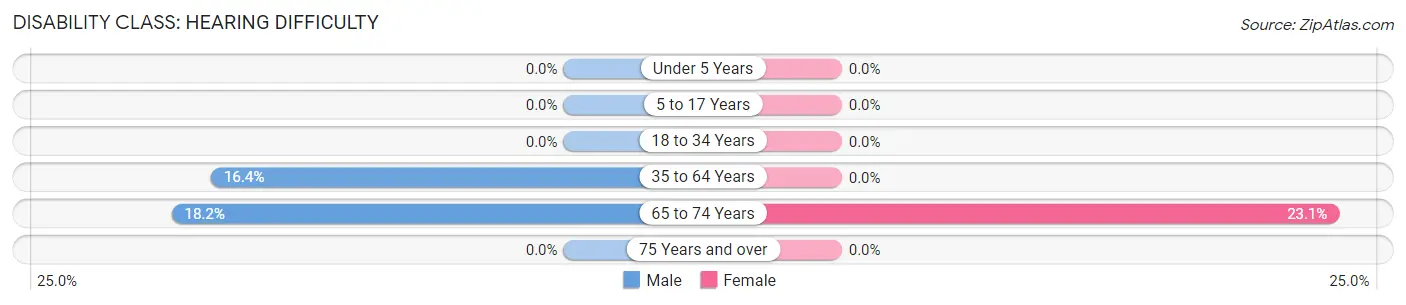
| Age Bracket | Male | Female |
| Under 5 Years | 0 (0.0%) | 0 (0.0%) |
| 5 to 17 Years | 0 (0.0%) | 0 (0.0%) |
| 18 to 34 Years | 0 (0.0%) | 0 (0.0%) |
| 35 to 64 Years | 17 (16.4%) | 0 (0.0%) |
| 65 to 74 Years | 10 (18.2%) | 15 (23.1%) |
| 75 Years and over | 0 (0.0%) | 0 (0.0%) |
Disability Class: Vision Difficulty
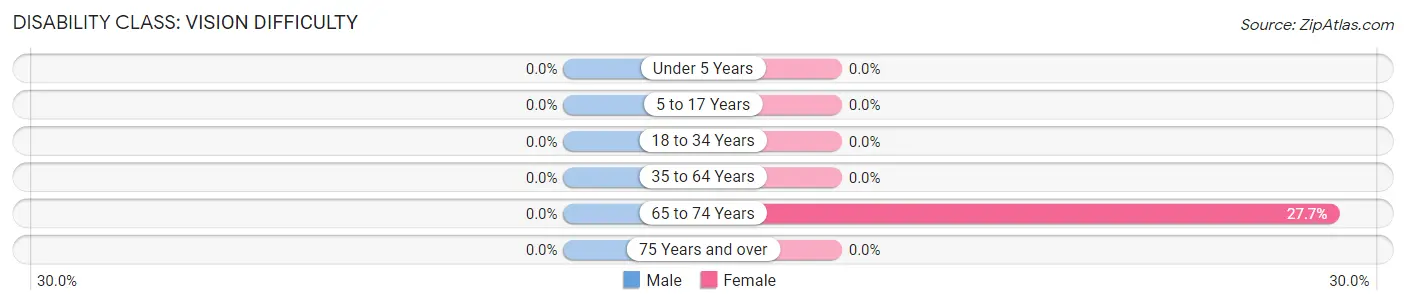
| Age Bracket | Male | Female |
| Under 5 Years | 0 (0.0%) | 0 (0.0%) |
| 5 to 17 Years | 0 (0.0%) | 0 (0.0%) |
| 18 to 34 Years | 0 (0.0%) | 0 (0.0%) |
| 35 to 64 Years | 0 (0.0%) | 0 (0.0%) |
| 65 to 74 Years | 0 (0.0%) | 18 (27.7%) |
| 75 Years and over | 0 (0.0%) | 0 (0.0%) |
Disability Class: Cognitive Difficulty
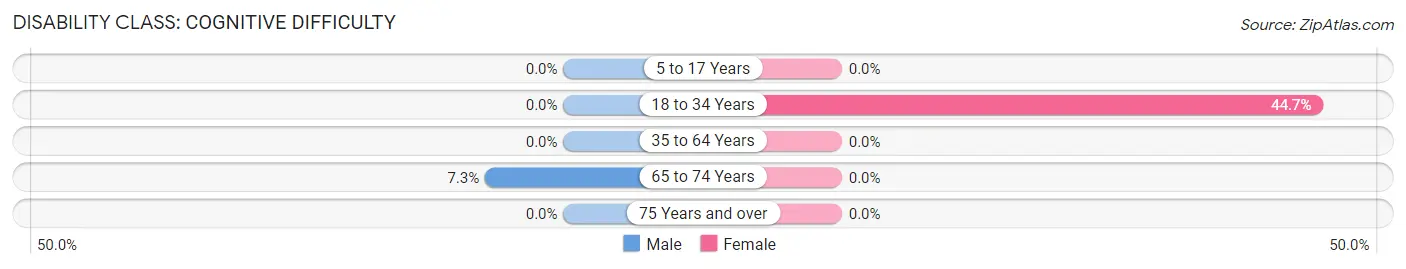
| Age Bracket | Male | Female |
| 5 to 17 Years | 0 (0.0%) | 0 (0.0%) |
| 18 to 34 Years | 0 (0.0%) | 21 (44.7%) |
| 35 to 64 Years | 0 (0.0%) | 0 (0.0%) |
| 65 to 74 Years | 4 (7.3%) | 0 (0.0%) |
| 75 Years and over | 0 (0.0%) | 0 (0.0%) |
Disability Class: Ambulatory Difficulty
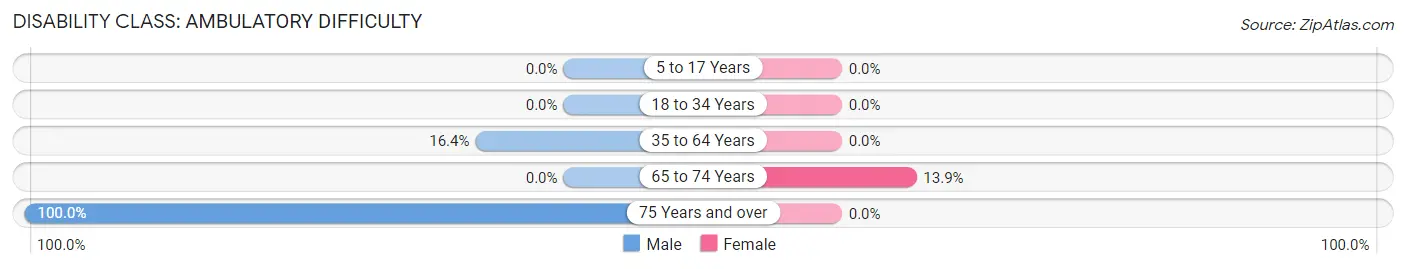
| Age Bracket | Male | Female |
| 5 to 17 Years | 0 (0.0%) | 0 (0.0%) |
| 18 to 34 Years | 0 (0.0%) | 0 (0.0%) |
| 35 to 64 Years | 17 (16.4%) | 0 (0.0%) |
| 65 to 74 Years | 0 (0.0%) | 9 (13.9%) |
| 75 Years and over | 10 (100.0%) | 0 (0.0%) |
Disability Class: Self-Care Difficulty
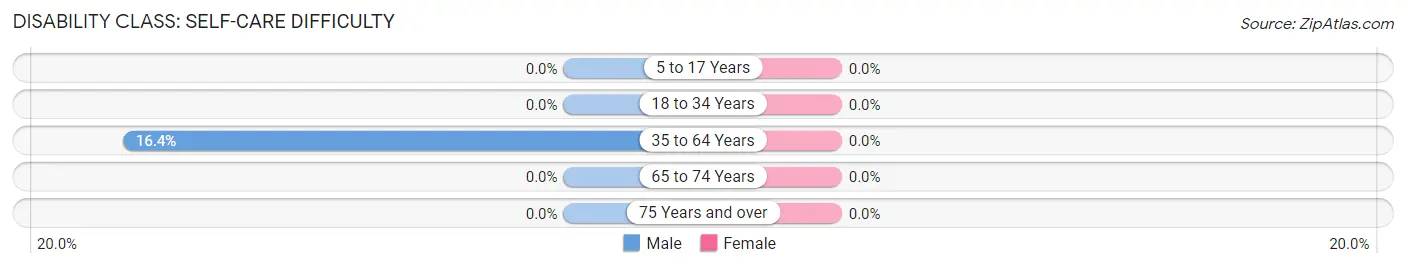
| Age Bracket | Male | Female |
| 5 to 17 Years | 0 (0.0%) | 0 (0.0%) |
| 18 to 34 Years | 0 (0.0%) | 0 (0.0%) |
| 35 to 64 Years | 17 (16.4%) | 0 (0.0%) |
| 65 to 74 Years | 0 (0.0%) | 0 (0.0%) |
| 75 Years and over | 0 (0.0%) | 0 (0.0%) |
Technology Access in Caroga Lake
Computing Device Access in Caroga Lake
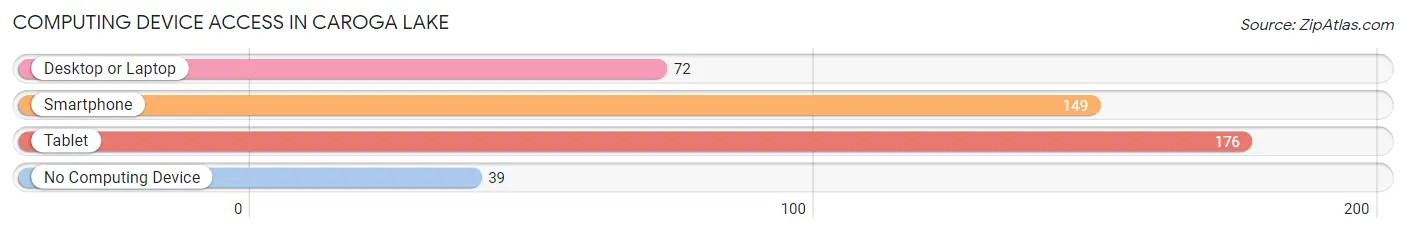
| Device Type | # Households | % Households |
| Desktop or Laptop | 72 | 30.0% |
| Smartphone | 149 | 62.1% |
| Tablet | 176 | 73.3% |
| No Computing Device | 39 | 16.3% |
| Total | 240 | 100.0% |
Internet Access in Caroga Lake
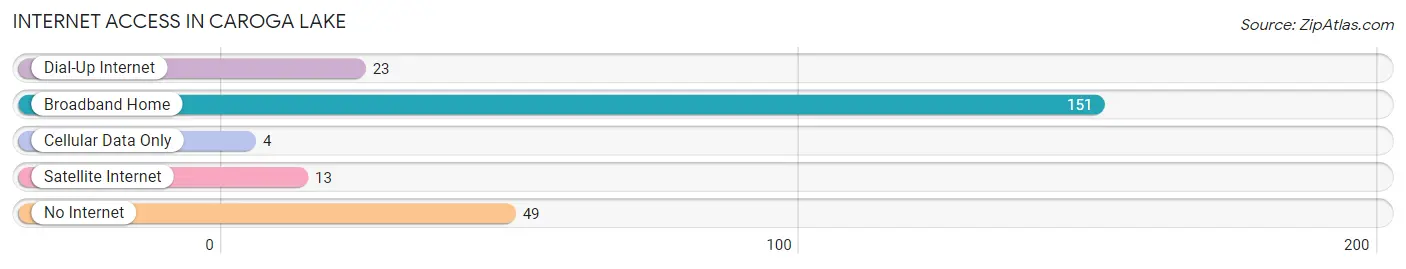
| Internet Type | # Households | % Households |
| Dial-Up Internet | 23 | 9.6% |
| Broadband Home | 151 | 62.9% |
| Cellular Data Only | 4 | 1.7% |
| Satellite Internet | 13 | 5.4% |
| No Internet | 49 | 20.4% |
| Total | 240 | 100.0% |
Caroga Lake Summary
Caroga Lake is a hamlet located in the town of Caroga in Fulton County, New York. It is situated in the foothills of the Adirondack Mountains, and is a popular destination for outdoor recreation. The hamlet is home to a variety of businesses, including a marina, campground, and several restaurants.
Geography
Caroga Lake is located in the foothills of the Adirondack Mountains, in the town of Caroga in Fulton County, New York. The hamlet is situated on the western shore of Caroga Lake, a small, shallow lake that is part of the Sacandaga River watershed. The lake is approximately two miles long and one mile wide, and is a popular destination for fishing, swimming, and boating. The hamlet is surrounded by forests and rolling hills, and is home to a variety of wildlife, including deer, bear, and a variety of birds.
History
The area around Caroga Lake has been inhabited by Native Americans for centuries. The first European settlers arrived in the area in the late 1700s, and the hamlet was officially established in 1820. The hamlet was originally known as “Caroga Lake Station”, and was a stop on the Adirondack Railroad. The railroad was eventually abandoned, and the hamlet was renamed “Caroga Lake” in 1887.
In the late 1800s, the hamlet became a popular destination for outdoor recreation. The first hotel was built in 1891, and the first marina was established in 1895. The hamlet continued to grow throughout the 20th century, and today it is a popular destination for fishing, swimming, boating, and other outdoor activities.
Economy
The economy of Caroga Lake is largely based on tourism. The hamlet is home to a variety of businesses, including a marina, campground, and several restaurants. The hamlet is also home to a variety of shops and galleries, as well as a number of bed and breakfasts. The hamlet is also home to a number of seasonal businesses, such as ice cream stands and boat rentals.
Demographics
As of the 2010 census, the population of Caroga Lake was 1,072. The median age of the population was 44.7 years, and the median household income was $45,938. The majority of the population (90.2%) was white, and the remainder was made up of African Americans (2.2%), Native Americans (1.2%), Asians (1.1%), and other races (5.3%). The majority of the population (86.2%) was over the age of 18, and the remainder was under the age of 18 (13.8%).
Conclusion
Caroga Lake is a hamlet located in the town of Caroga in Fulton County, New York. It is situated in the foothills of the Adirondack Mountains, and is a popular destination for outdoor recreation. The hamlet is home to a variety of businesses, including a marina, campground, and several restaurants. The economy of Caroga Lake is largely based on tourism, and the population of the hamlet is 1,072, with a median age of 44.7 years and a median household income of $45,938.
Common Questions
What is Per Capita Income in Caroga Lake?
Per Capita income in Caroga Lake is $31,153.
What is the Median Family Income in Caroga Lake?
Median Family Income in Caroga Lake is $51,210.
What is the Median Household income in Caroga Lake?
Median Household Income in Caroga Lake is $50,565.
What is Income or Wage Gap in Caroga Lake?
Income or Wage Gap in Caroga Lake is 30.6%.
Women in Caroga Lake earn 69.4 cents for every dollar earned by a man.
What is Inequality or Gini Index in Caroga Lake?
Inequality or Gini Index in Caroga Lake is 0.46.
What is the Total Population of Caroga Lake?
Total Population of Caroga Lake is 577.
What is the Total Male Population of Caroga Lake?
Total Male Population of Caroga Lake is 218.
What is the Total Female Population of Caroga Lake?
Total Female Population of Caroga Lake is 359.
What is the Ratio of Males per 100 Females in Caroga Lake?
There are 60.72 Males per 100 Females in Caroga Lake.
What is the Ratio of Females per 100 Males in Caroga Lake?
There are 164.68 Females per 100 Males in Caroga Lake.
What is the Median Population Age in Caroga Lake?
Median Population Age in Caroga Lake is 58.7 Years.
What is the Average Family Size in Caroga Lake
Average Family Size in Caroga Lake is 2.7 People.
What is the Average Household Size in Caroga Lake
Average Household Size in Caroga Lake is 2.4 People.
How Large is the Labor Force in Caroga Lake?
There are 276 People in the Labor Forcein in Caroga Lake.
What is the Percentage of People in the Labor Force in Caroga Lake?
51.6% of People are in the Labor Force in Caroga Lake.