West Hills, NY Map & Demographics
West Hills Map
West Hills Overview
$78,839
PER CAPITA INCOME
$174,975
AVG FAMILY INCOME
$173,419
AVG HOUSEHOLD INCOME
40.0%
WAGE / INCOME GAP [ % ]
60.0¢/ $1
WAGE / INCOME GAP [ $ ]
0.40
INEQUALITY / GINI INDEX
5,140
TOTAL POPULATION
2,565
MALE POPULATION
2,575
FEMALE POPULATION
99.61
MALES / 100 FEMALES
100.39
FEMALES / 100 MALES
48.2
MEDIAN AGE
3.1
AVG FAMILY SIZE
2.8
AVG HOUSEHOLD SIZE
2,910
LABOR FORCE [ PEOPLE ]
65.4%
PERCENT IN LABOR FORCE
3.2%
UNEMPLOYMENT RATE
Income in West Hills
Income Overview in West Hills
Per Capita Income in West Hills is $78,839, while median incomes of families and households are $174,975 and $173,419 respectively.
| Characteristic | Number | Measure |
| Per Capita Income | 5,140 | $78,839 |
| Median Family Income | 1,449 | $174,975 |
| Mean Family Income | 1,449 | $233,557 |
| Median Household Income | 1,852 | $173,419 |
| Mean Household Income | 1,852 | $214,188 |
| Income Deficit | 1,449 | $0 |
| Wage / Income Gap (%) | 5,140 | 40.04% |
| Wage / Income Gap ($) | 5,140 | 59.96¢ per $1 |
| Gini / Inequality Index | 5,140 | 0.40 |
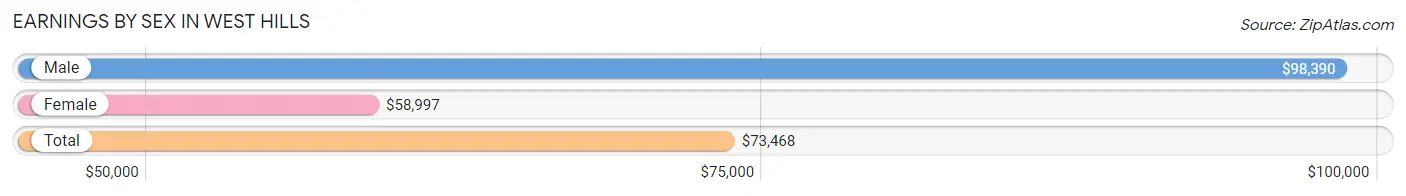
Earnings by Sex in West Hills
Average Earnings in West Hills are $73,468, $98,390 for men and $58,997 for women, a difference of 40.0%.
| Sex | Number | Average Earnings |
| Male | 1,673 (55.0%) | $98,390 |
| Female | 1,369 (45.0%) | $58,997 |
| Total | 3,042 (100.0%) | $73,468 |
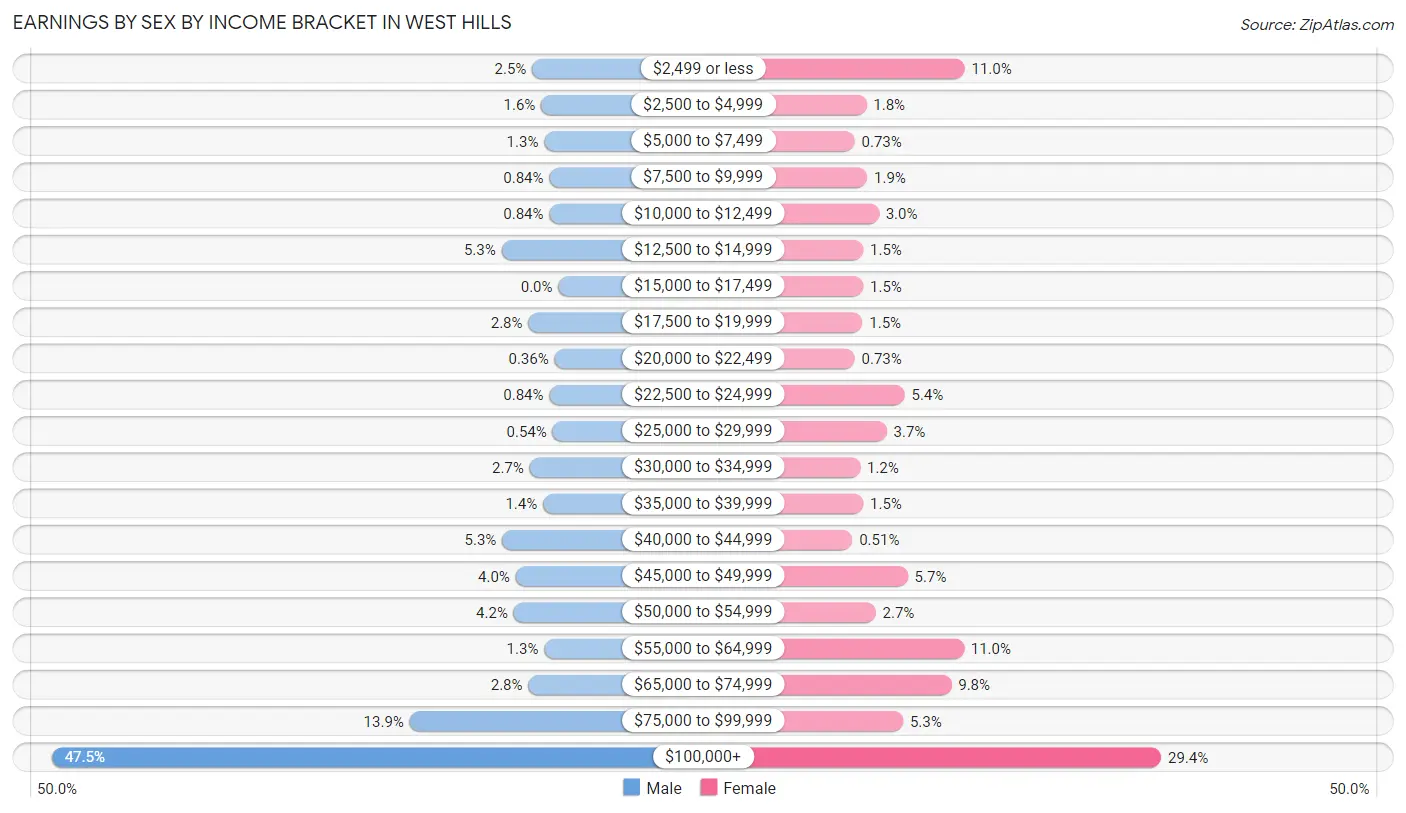
Earnings by Sex by Income Bracket in West Hills
The most common earnings brackets in West Hills are $100,000+ for men (794 | 47.5%) and $100,000+ for women (403 | 29.4%).
| Income | Male | Female |
| $2,499 or less | 41 (2.5%) | 151 (11.0%) |
| $2,500 to $4,999 | 27 (1.6%) | 25 (1.8%) |
| $5,000 to $7,499 | 22 (1.3%) | 10 (0.7%) |
| $7,500 to $9,999 | 14 (0.8%) | 26 (1.9%) |
| $10,000 to $12,499 | 14 (0.8%) | 41 (3.0%) |
| $12,500 to $14,999 | 89 (5.3%) | 21 (1.5%) |
| $15,000 to $17,499 | 0 (0.0%) | 21 (1.5%) |
| $17,500 to $19,999 | 47 (2.8%) | 20 (1.5%) |
| $20,000 to $22,499 | 6 (0.4%) | 10 (0.7%) |
| $22,500 to $24,999 | 14 (0.8%) | 74 (5.4%) |
| $25,000 to $29,999 | 9 (0.5%) | 51 (3.7%) |
| $30,000 to $34,999 | 45 (2.7%) | 17 (1.2%) |
| $35,000 to $39,999 | 24 (1.4%) | 21 (1.5%) |
| $40,000 to $44,999 | 88 (5.3%) | 7 (0.5%) |
| $45,000 to $49,999 | 67 (4.0%) | 78 (5.7%) |
| $50,000 to $54,999 | 70 (4.2%) | 37 (2.7%) |
| $55,000 to $64,999 | 22 (1.3%) | 150 (11.0%) |
| $65,000 to $74,999 | 47 (2.8%) | 134 (9.8%) |
| $75,000 to $99,999 | 233 (13.9%) | 72 (5.3%) |
| $100,000+ | 794 (47.5%) | 403 (29.4%) |
| Total | 1,673 (100.0%) | 1,369 (100.0%) |
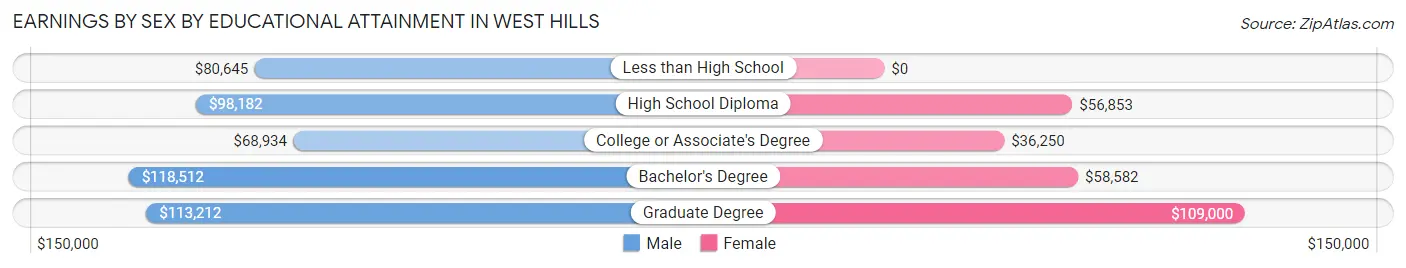
Earnings by Sex by Educational Attainment in West Hills
Average earnings in West Hills are $105,337 for men and $60,272 for women, a difference of 42.8%. Men with an educational attainment of bachelor's degree enjoy the highest average annual earnings of $118,512, while those with college or associate's degree education earn the least with $68,934. Women with an educational attainment of graduate degree earn the most with the average annual earnings of $109,000, while those with college or associate's degree education have the smallest earnings of $36,250.
| Educational Attainment | Male Income | Female Income |
| Less than High School | $80,645 | $0 |
| High School Diploma | $98,182 | $56,853 |
| College or Associate's Degree | $68,934 | $36,250 |
| Bachelor's Degree | $118,512 | $58,582 |
| Graduate Degree | $113,212 | $109,000 |
| Total | $105,337 | $60,272 |
Family Income in West Hills
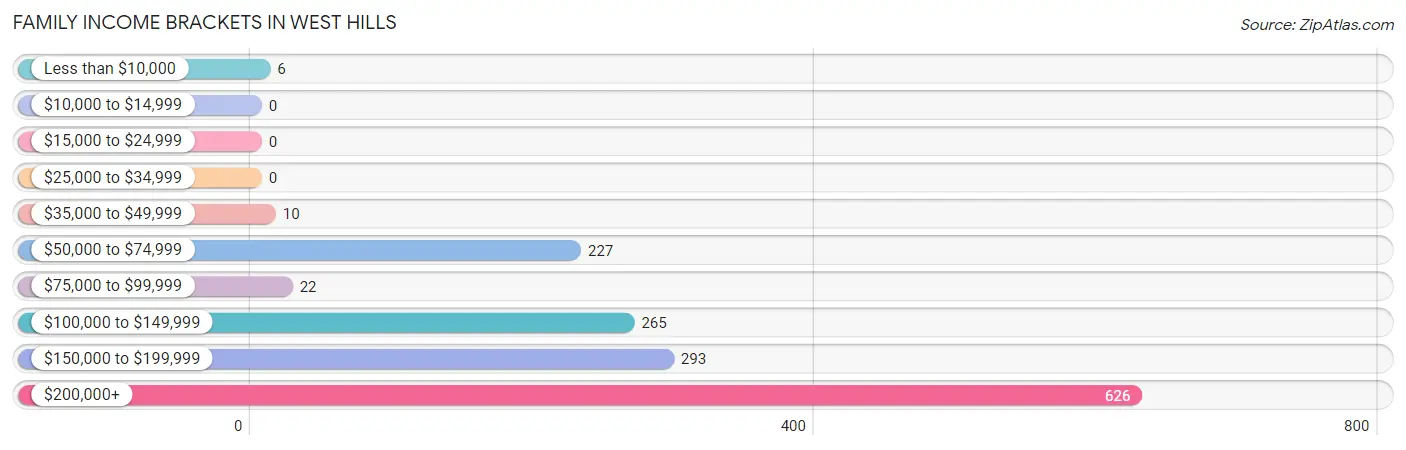
Family Income Brackets in West Hills
According to the West Hills family income data, there are 626 families falling into the $200,000+ income range, which is the most common income bracket and makes up 43.2% of all families.
| Income Bracket | # Families | % Families |
| Less than $10,000 | 6 | 0.4% |
| $10,000 to $14,999 | 0 | 0.0% |
| $15,000 to $24,999 | 0 | 0.0% |
| $25,000 to $34,999 | 0 | 0.0% |
| $35,000 to $49,999 | 10 | 0.7% |
| $50,000 to $74,999 | 227 | 15.7% |
| $75,000 to $99,999 | 22 | 1.5% |
| $100,000 to $149,999 | 265 | 18.3% |
| $150,000 to $199,999 | 293 | 20.2% |
| $200,000+ | 626 | 43.2% |
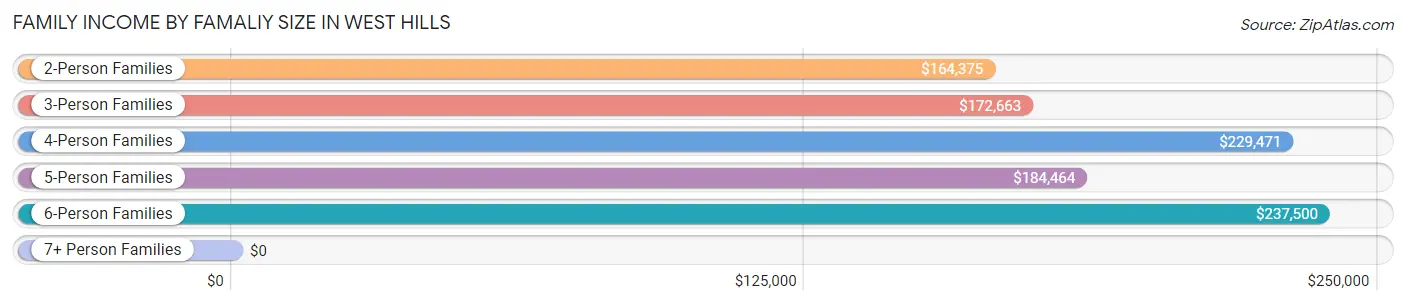
Family Income by Famaliy Size in West Hills
6-person families (42 | 2.9%) account for the highest median family income in West Hills with $237,500 per family, while 2-person families (717 | 49.5%) have the highest median income of $82,188 per family member.
| Income Bracket | # Families | Median Income |
| 2-Person Families | 717 (49.5%) | $164,375 |
| 3-Person Families | 291 (20.1%) | $172,663 |
| 4-Person Families | 293 (20.2%) | $229,471 |
| 5-Person Families | 106 (7.3%) | $184,464 |
| 6-Person Families | 42 (2.9%) | $237,500 |
| 7+ Person Families | 0 (0.0%) | $0 |
| Total | 1,449 (100.0%) | $174,975 |
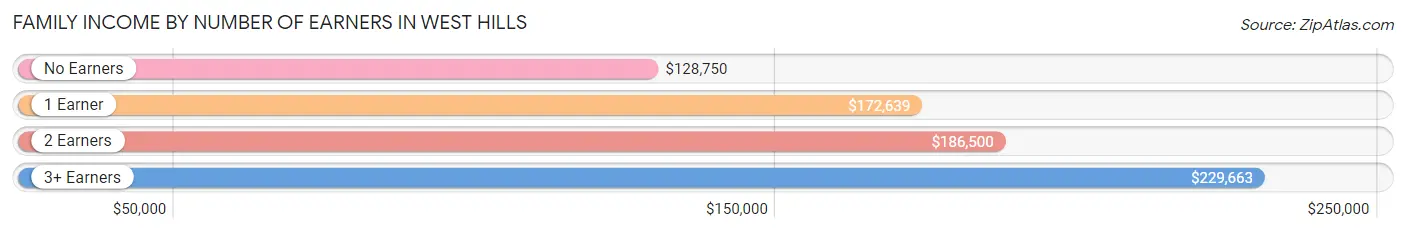
Family Income by Number of Earners in West Hills
The median family income in West Hills is $174,975, with families comprising 3+ earners (223) having the highest median family income of $229,663, while families with no earners (93) have the lowest median family income of $128,750, accounting for 15.4% and 6.4% of families, respectively.
| Number of Earners | # Families | Median Income |
| No Earners | 93 (6.4%) | $128,750 |
| 1 Earner | 471 (32.5%) | $172,639 |
| 2 Earners | 662 (45.7%) | $186,500 |
| 3+ Earners | 223 (15.4%) | $229,663 |
| Total | 1,449 (100.0%) | $174,975 |
Household Income in West Hills
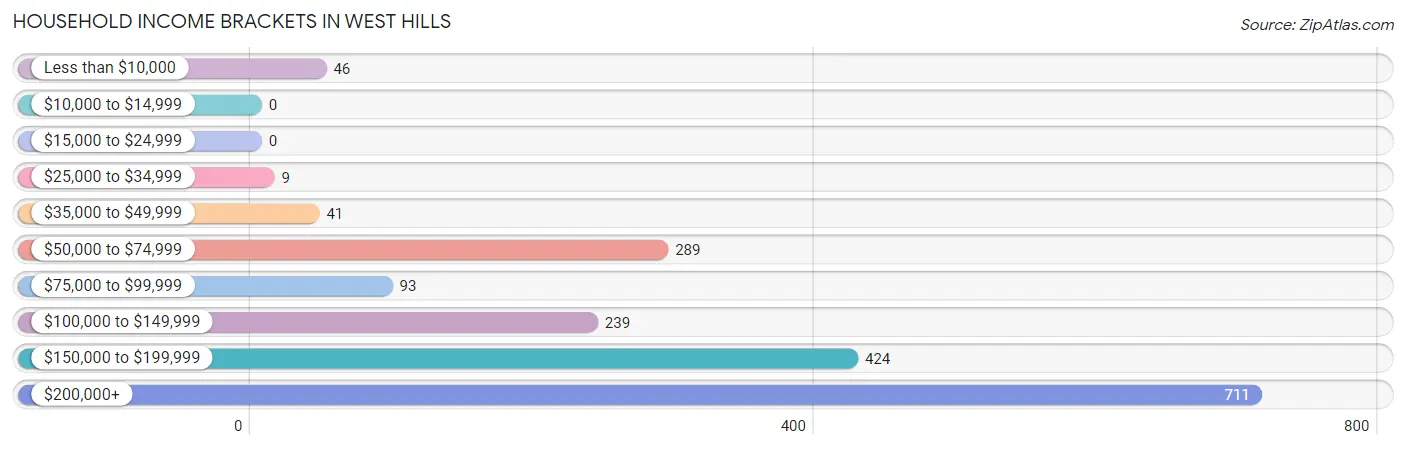
Household Income Brackets in West Hills
With 711 households falling in the category, the $200,000+ income range is the most frequent in West Hills, accounting for 38.4% of all households.
| Income Bracket | # Households | % Households |
| Less than $10,000 | 46 | 2.5% |
| $10,000 to $14,999 | 0 | 0.0% |
| $15,000 to $24,999 | 0 | 0.0% |
| $25,000 to $34,999 | 9 | 0.5% |
| $35,000 to $49,999 | 41 | 2.2% |
| $50,000 to $74,999 | 289 | 15.6% |
| $75,000 to $99,999 | 93 | 5.0% |
| $100,000 to $149,999 | 239 | 12.9% |
| $150,000 to $199,999 | 424 | 22.9% |
| $200,000+ | 711 | 38.4% |
Household Income by Householder Age in West Hills
The median household income in West Hills is $173,419, with the highest median household income of $213,906 found in the 25 to 44 years age bracket for the primary householder. A total of 337 households (18.2%) fall into this category.
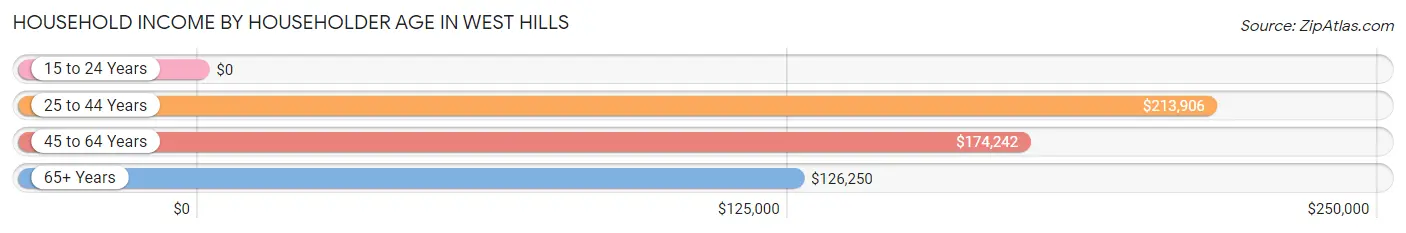
| Income Bracket | # Households | Median Income |
| 15 to 24 Years | 0 (0.0%) | $0 |
| 25 to 44 Years | 337 (18.2%) | $213,906 |
| 45 to 64 Years | 843 (45.5%) | $174,242 |
| 65+ Years | 672 (36.3%) | $126,250 |
| Total | 1,852 (100.0%) | $173,419 |
Poverty in West Hills
Income Below Poverty by Sex and Age in West Hills
With 3.3% poverty level for males and 3.1% for females among the residents of West Hills, 35 to 44 year old males and 55 to 64 year old females are the most vulnerable to poverty, with 27 males (11.6%) and 40 females (8.2%) in their respective age groups living below the poverty level.
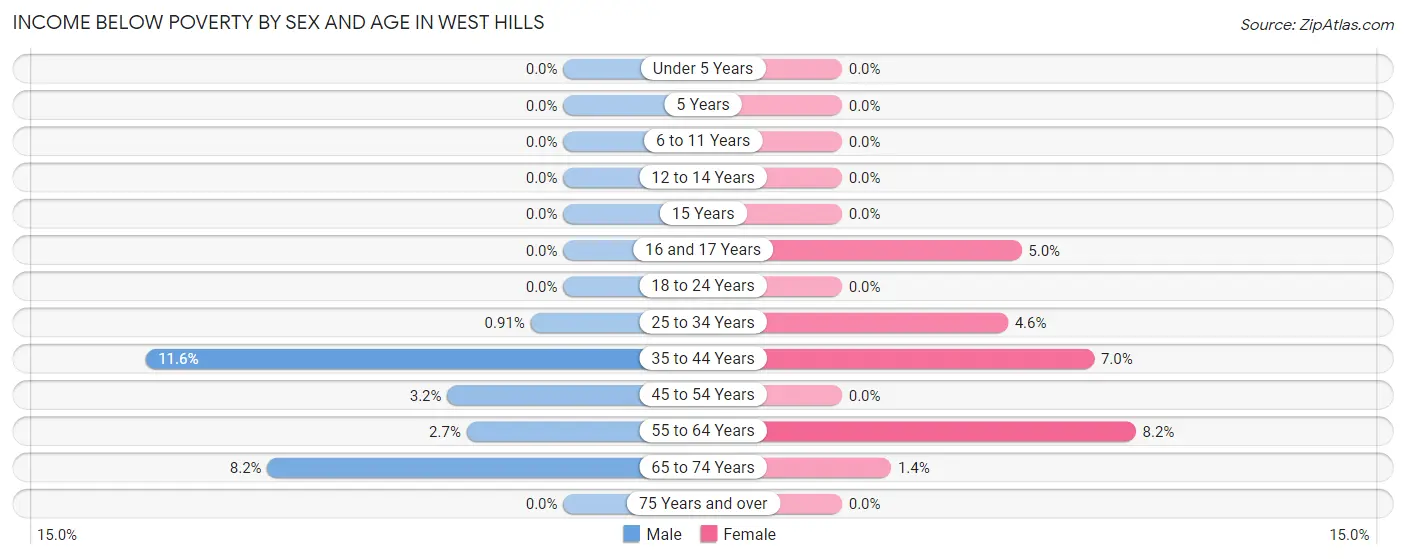
| Age Bracket | Male | Female |
| Under 5 Years | 0 (0.0%) | 0 (0.0%) |
| 5 Years | 0 (0.0%) | 0 (0.0%) |
| 6 to 11 Years | 0 (0.0%) | 0 (0.0%) |
| 12 to 14 Years | 0 (0.0%) | 0 (0.0%) |
| 15 Years | 0 (0.0%) | 0 (0.0%) |
| 16 and 17 Years | 0 (0.0%) | 3 (5.0%) |
| 18 to 24 Years | 0 (0.0%) | 0 (0.0%) |
| 25 to 34 Years | 3 (0.9%) | 14 (4.6%) |
| 35 to 44 Years | 27 (11.6%) | 16 (7.0%) |
| 45 to 54 Years | 11 (3.2%) | 0 (0.0%) |
| 55 to 64 Years | 14 (2.7%) | 40 (8.2%) |
| 65 to 74 Years | 29 (8.2%) | 6 (1.4%) |
| 75 Years and over | 0 (0.0%) | 0 (0.0%) |
| Total | 84 (3.3%) | 79 (3.1%) |
Income Above Poverty by Sex and Age in West Hills
According to the poverty statistics in West Hills, males aged under 5 years and females aged under 5 years are the age groups that are most secure financially, with 100.0% of males and 100.0% of females in these age groups living above the poverty line.
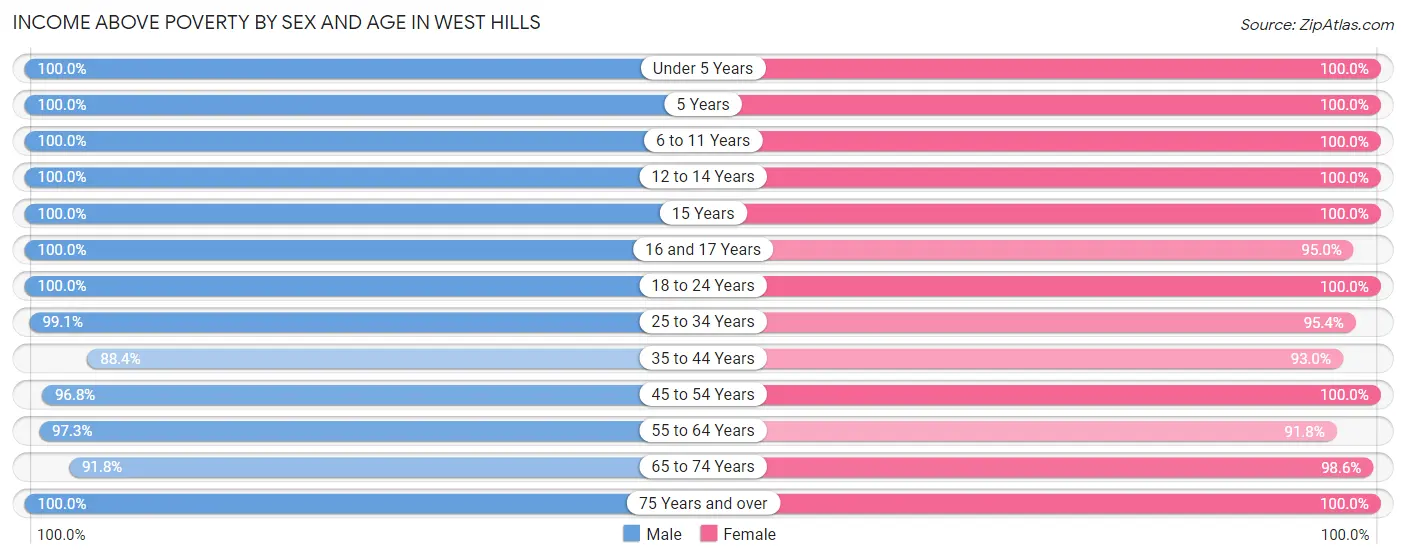
| Age Bracket | Male | Female |
| Under 5 Years | 54 (100.0%) | 129 (100.0%) |
| 5 Years | 36 (100.0%) | 24 (100.0%) |
| 6 to 11 Years | 172 (100.0%) | 164 (100.0%) |
| 12 to 14 Years | 55 (100.0%) | 25 (100.0%) |
| 15 Years | 10 (100.0%) | 10 (100.0%) |
| 16 and 17 Years | 120 (100.0%) | 57 (95.0%) |
| 18 to 24 Years | 223 (100.0%) | 183 (100.0%) |
| 25 to 34 Years | 325 (99.1%) | 289 (95.4%) |
| 35 to 44 Years | 205 (88.4%) | 212 (93.0%) |
| 45 to 54 Years | 330 (96.8%) | 378 (100.0%) |
| 55 to 64 Years | 506 (97.3%) | 449 (91.8%) |
| 65 to 74 Years | 323 (91.8%) | 432 (98.6%) |
| 75 Years and over | 110 (100.0%) | 144 (100.0%) |
| Total | 2,469 (96.7%) | 2,496 (96.9%) |
Income Below Poverty Among Married-Couple Families in West Hills
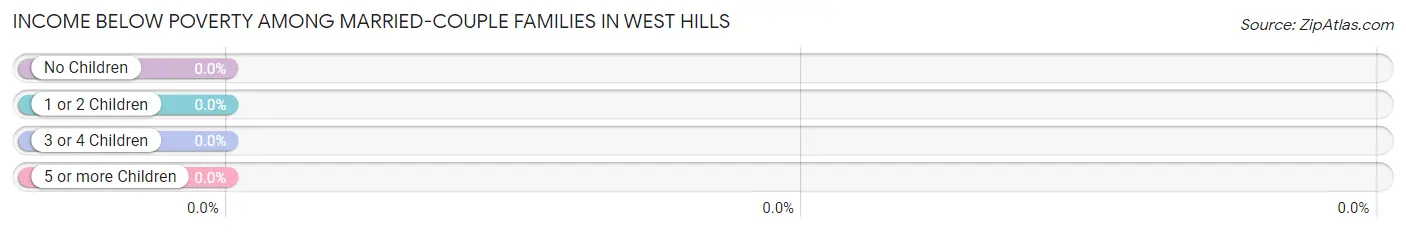
| Children | Above Poverty | Below Poverty |
| No Children | 796 (100.0%) | 0 (0.0%) |
| 1 or 2 Children | 320 (100.0%) | 0 (0.0%) |
| 3 or 4 Children | 58 (100.0%) | 0 (0.0%) |
| 5 or more Children | 0 (0.0%) | 0 (0.0%) |
| Total | 1,174 (100.0%) | 0 (0.0%) |
Income Below Poverty Among Single-Parent Households in West Hills
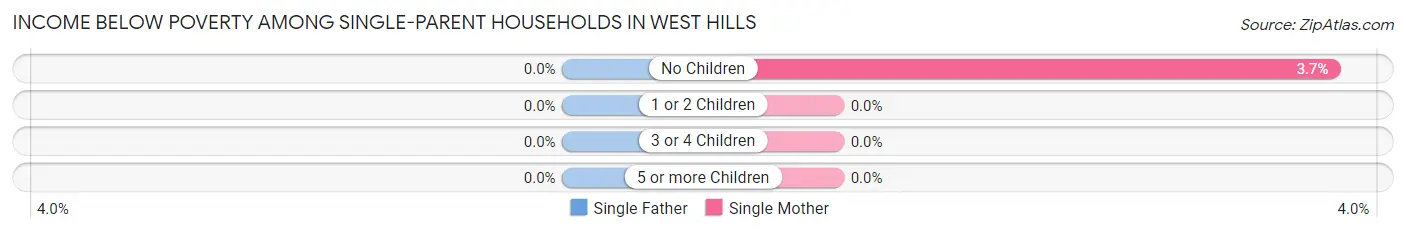
| Children | Single Father | Single Mother |
| No Children | 0 (0.0%) | 6 (3.7%) |
| 1 or 2 Children | 0 (0.0%) | 0 (0.0%) |
| 3 or 4 Children | 0 (0.0%) | 0 (0.0%) |
| 5 or more Children | 0 (0.0%) | 0 (0.0%) |
| Total | 0 (0.0%) | 6 (2.9%) |
Income Below Poverty Among Married-Couple vs Single-Parent Households in West Hills
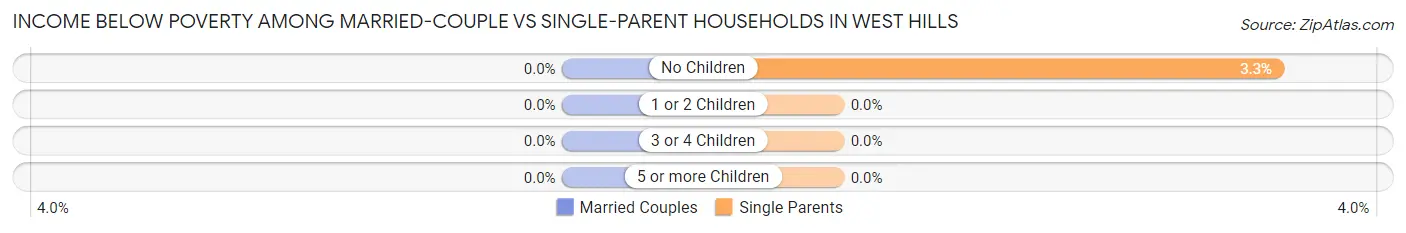
| Children | Married-Couple Families | Single-Parent Households |
| No Children | 0 (0.0%) | 6 (3.3%) |
| 1 or 2 Children | 0 (0.0%) | 0 (0.0%) |
| 3 or 4 Children | 0 (0.0%) | 0 (0.0%) |
| 5 or more Children | 0 (0.0%) | 0 (0.0%) |
| Total | 0 (0.0%) | 6 (2.2%) |
Race in West Hills
The most populous races in West Hills are White / Caucasian (4,339 | 84.4%), Asian (591 | 11.5%), and Hispanic or Latino (376 | 7.3%).
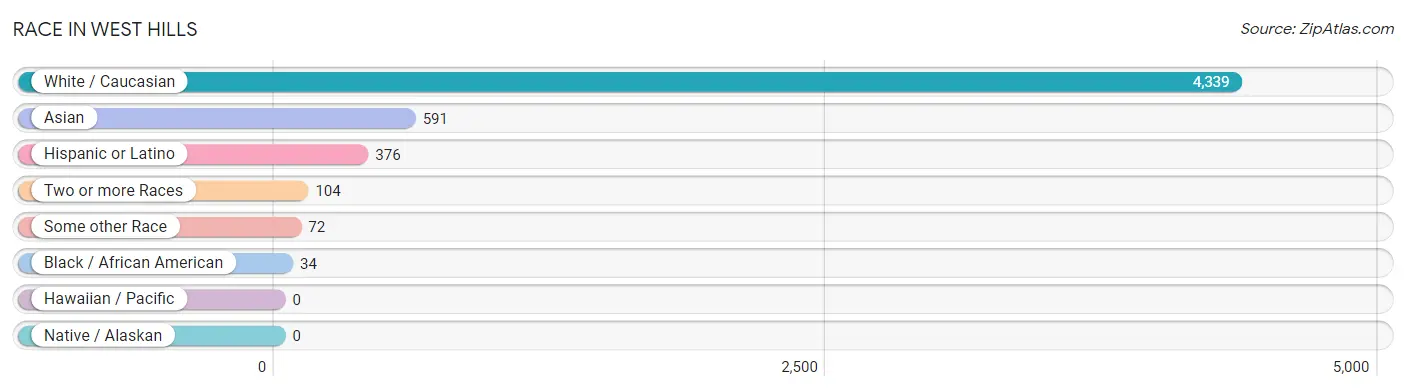
| Race | # Population | % Population |
| Asian | 591 | 11.5% |
| Black / African American | 34 | 0.7% |
| Hawaiian / Pacific | 0 | 0.0% |
| Hispanic or Latino | 376 | 7.3% |
| Native / Alaskan | 0 | 0.0% |
| White / Caucasian | 4,339 | 84.4% |
| Two or more Races | 104 | 2.0% |
| Some other Race | 72 | 1.4% |
| Total | 5,140 | 100.0% |
Ancestry in West Hills
The most populous ancestries reported in West Hills are Italian (1,410 | 27.4%), Irish (811 | 15.8%), German (640 | 12.4%), English (387 | 7.5%), and American (317 | 6.2%), together accounting for 69.4% of all West Hills residents.
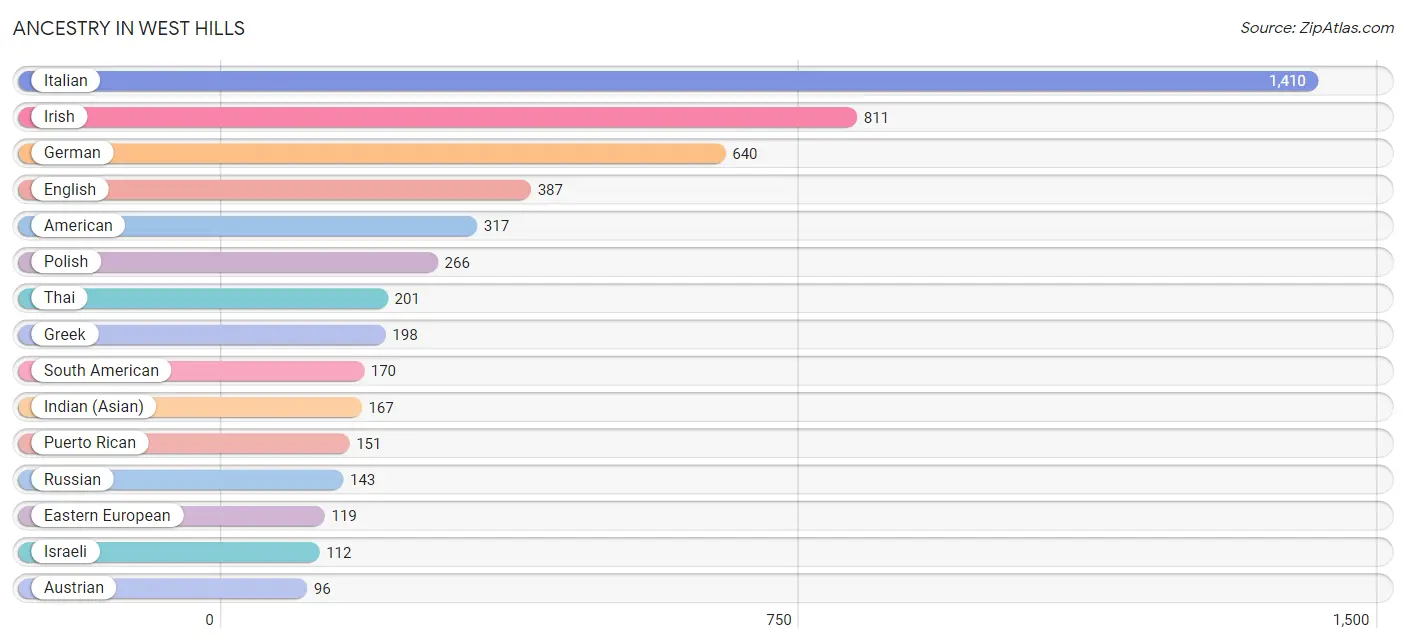
| Ancestry | # Population | % Population |
| American | 317 | 6.2% |
| Arab | 10 | 0.2% |
| Austrian | 96 | 1.9% |
| Burmese | 58 | 1.1% |
| Central American | 2 | 0.0% |
| Chilean | 55 | 1.1% |
| Colombian | 54 | 1.1% |
| Cypriot | 37 | 0.7% |
| Czech | 74 | 1.4% |
| Danish | 12 | 0.2% |
| Dominican | 45 | 0.9% |
| Dutch | 57 | 1.1% |
| Eastern European | 119 | 2.3% |
| Ecuadorian | 61 | 1.2% |
| Egyptian | 10 | 0.2% |
| English | 387 | 7.5% |
| European | 17 | 0.3% |
| Finnish | 10 | 0.2% |
| German | 640 | 12.4% |
| Greek | 198 | 3.8% |
| Hungarian | 10 | 0.2% |
| Indian (Asian) | 167 | 3.3% |
| Iranian | 17 | 0.3% |
| Irish | 811 | 15.8% |
| Israeli | 112 | 2.2% |
| Italian | 1,410 | 27.4% |
| Lithuanian | 32 | 0.6% |
| Mexican | 2 | 0.0% |
| Norwegian | 55 | 1.1% |
| Polish | 266 | 5.2% |
| Puerto Rican | 151 | 2.9% |
| Romanian | 25 | 0.5% |
| Russian | 143 | 2.8% |
| Salvadoran | 2 | 0.0% |
| Scottish | 28 | 0.5% |
| Slovak | 9 | 0.2% |
| South African | 5 | 0.1% |
| South American | 170 | 3.3% |
| Subsaharan African | 5 | 0.1% |
| Swedish | 34 | 0.7% |
| Swiss | 10 | 0.2% |
| Thai | 201 | 3.9% |
| Turkish | 61 | 1.2% |
| Ukrainian | 19 | 0.4% | View All 44 Rows |
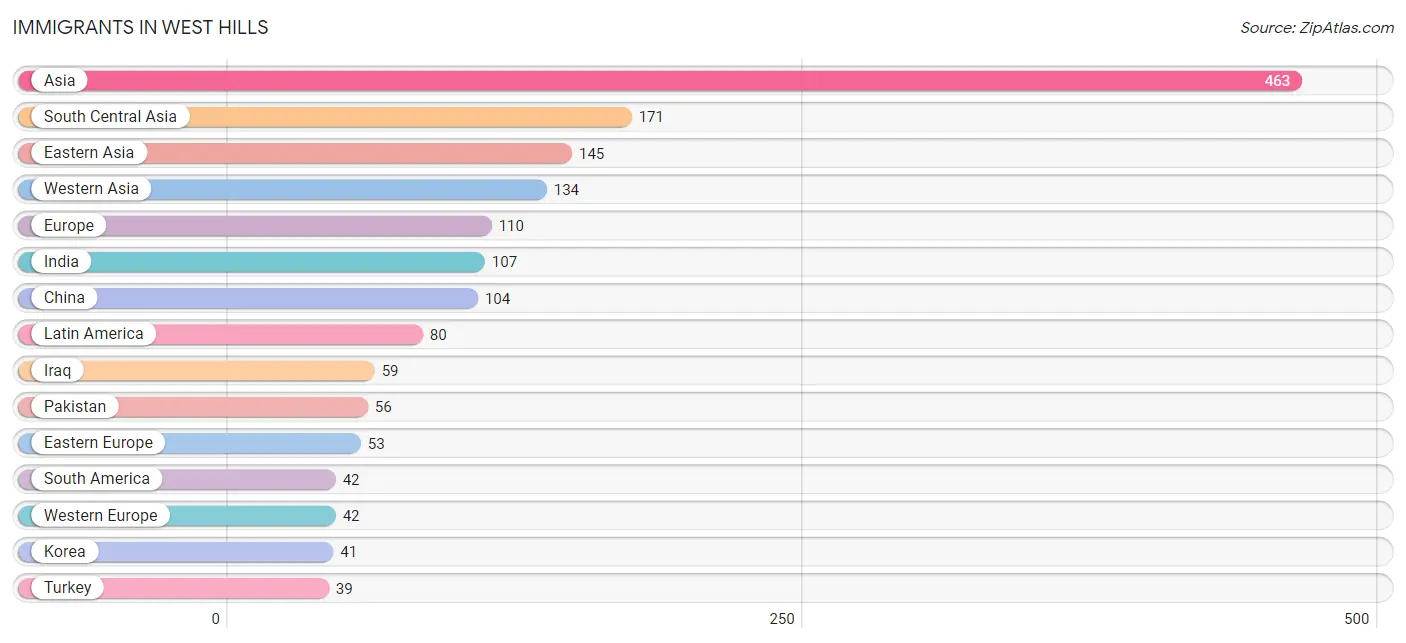
Immigrants in West Hills
The most numerous immigrant groups reported in West Hills came from Asia (463 | 9.0%), South Central Asia (171 | 3.3%), Eastern Asia (145 | 2.8%), Western Asia (134 | 2.6%), and Europe (110 | 2.1%), together accounting for 19.9% of all West Hills residents.
| Immigration Origin | # Population | % Population |
| Africa | 18 | 0.4% |
| Asia | 463 | 9.0% |
| Australia | 26 | 0.5% |
| Austria | 10 | 0.2% |
| Canada | 9 | 0.2% |
| Caribbean | 28 | 0.5% |
| Central America | 10 | 0.2% |
| Chile | 23 | 0.4% |
| China | 104 | 2.0% |
| Dominican Republic | 28 | 0.5% |
| Eastern Asia | 145 | 2.8% |
| Eastern Europe | 53 | 1.0% |
| Ecuador | 19 | 0.4% |
| Egypt | 10 | 0.2% |
| El Salvador | 2 | 0.0% |
| Europe | 110 | 2.1% |
| Germany | 12 | 0.2% |
| Hong Kong | 13 | 0.3% |
| Hungary | 2 | 0.0% |
| India | 107 | 2.1% |
| Iran | 8 | 0.2% |
| Iraq | 59 | 1.1% |
| Ireland | 3 | 0.1% |
| Israel | 17 | 0.3% |
| Korea | 41 | 0.8% |
| Latin America | 80 | 1.6% |
| Mexico | 8 | 0.2% |
| Netherlands | 20 | 0.4% |
| Northern Africa | 10 | 0.2% |
| Northern Europe | 15 | 0.3% |
| Oceania | 26 | 0.5% |
| Pakistan | 56 | 1.1% |
| Philippines | 13 | 0.3% |
| Poland | 26 | 0.5% |
| Romania | 25 | 0.5% |
| South Africa | 8 | 0.2% |
| South America | 42 | 0.8% |
| South Central Asia | 171 | 3.3% |
| South Eastern Asia | 13 | 0.3% |
| Turkey | 39 | 0.8% |
| Western Asia | 134 | 2.6% |
| Western Europe | 42 | 0.8% | View All 42 Rows |
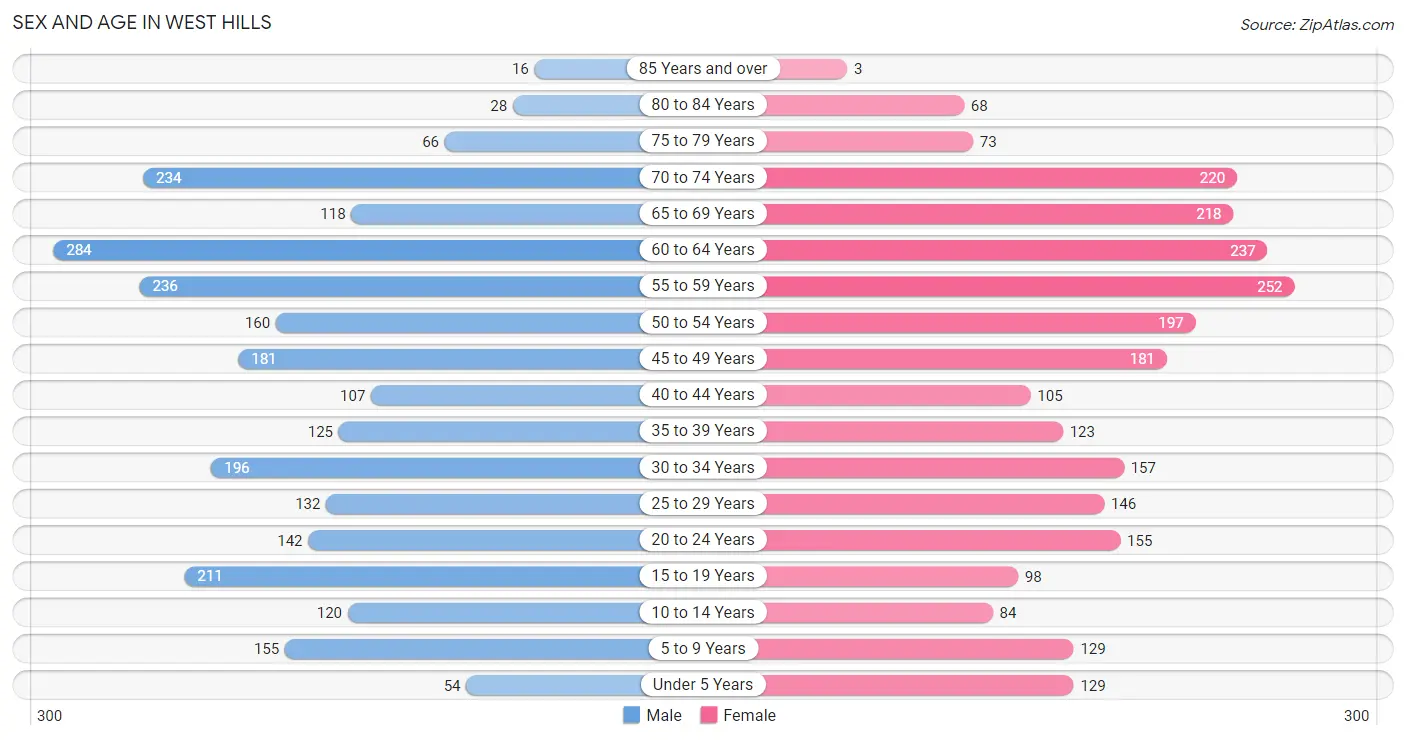
Sex and Age in West Hills
Sex and Age in West Hills
The most populous age groups in West Hills are 60 to 64 Years (284 | 11.1%) for men and 55 to 59 Years (252 | 9.8%) for women.
| Age Bracket | Male | Female |
| Under 5 Years | 54 (2.1%) | 129 (5.0%) |
| 5 to 9 Years | 155 (6.0%) | 129 (5.0%) |
| 10 to 14 Years | 120 (4.7%) | 84 (3.3%) |
| 15 to 19 Years | 211 (8.2%) | 98 (3.8%) |
| 20 to 24 Years | 142 (5.5%) | 155 (6.0%) |
| 25 to 29 Years | 132 (5.1%) | 146 (5.7%) |
| 30 to 34 Years | 196 (7.6%) | 157 (6.1%) |
| 35 to 39 Years | 125 (4.9%) | 123 (4.8%) |
| 40 to 44 Years | 107 (4.2%) | 105 (4.1%) |
| 45 to 49 Years | 181 (7.1%) | 181 (7.0%) |
| 50 to 54 Years | 160 (6.2%) | 197 (7.6%) |
| 55 to 59 Years | 236 (9.2%) | 252 (9.8%) |
| 60 to 64 Years | 284 (11.1%) | 237 (9.2%) |
| 65 to 69 Years | 118 (4.6%) | 218 (8.5%) |
| 70 to 74 Years | 234 (9.1%) | 220 (8.5%) |
| 75 to 79 Years | 66 (2.6%) | 73 (2.8%) |
| 80 to 84 Years | 28 (1.1%) | 68 (2.6%) |
| 85 Years and over | 16 (0.6%) | 3 (0.1%) |
| Total | 2,565 (100.0%) | 2,575 (100.0%) |
Families and Households in West Hills
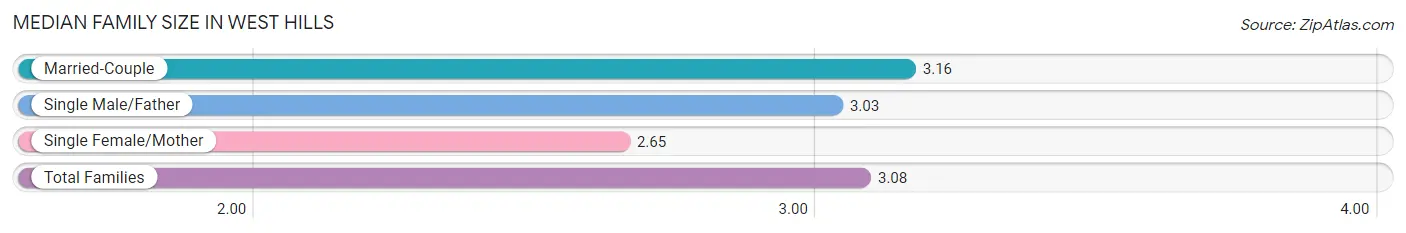
Median Family Size in West Hills
The median family size in West Hills is 3.08 persons per family, with married-couple families (1,174 | 81.0%) accounting for the largest median family size of 3.16 persons per family. On the other hand, single female/mother families (209 | 14.4%) represent the smallest median family size with 2.65 persons per family.
| Family Type | # Families | Family Size |
| Married-Couple | 1,174 (81.0%) | 3.16 |
| Single Male/Father | 66 (4.5%) | 3.03 |
| Single Female/Mother | 209 (14.4%) | 2.65 |
| Total Families | 1,449 (100.0%) | 3.08 |
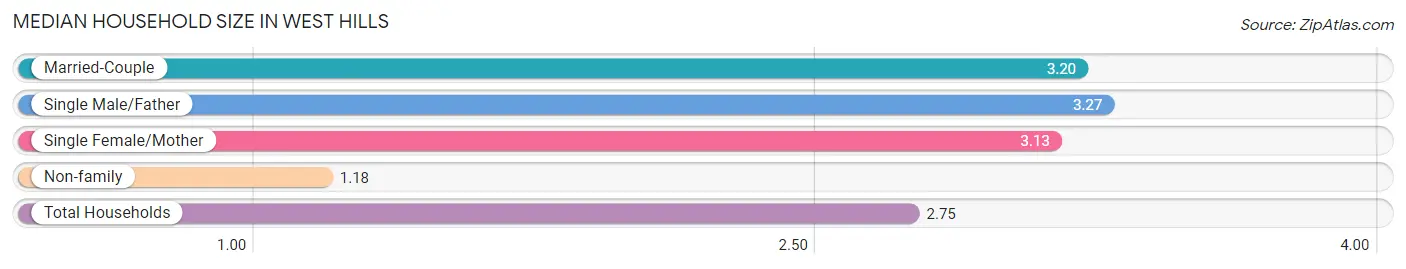
Median Household Size in West Hills
The median household size in West Hills is 2.75 persons per household, with single male/father households (66 | 3.6%) accounting for the largest median household size of 3.27 persons per household. non-family households (403 | 21.8%) represent the smallest median household size with 1.18 persons per household.
| Household Type | # Households | Household Size |
| Married-Couple | 1,174 (63.4%) | 3.20 |
| Single Male/Father | 66 (3.6%) | 3.27 |
| Single Female/Mother | 209 (11.3%) | 3.13 |
| Non-family | 403 (21.8%) | 1.18 |
| Total Households | 1,852 (100.0%) | 2.75 |
Household Size by Marriage Status in West Hills
Out of a total of 1,852 households in West Hills, 1,449 (78.2%) are family households, while 403 (21.8%) are nonfamily households. The most numerous type of family households are 2-person households, comprising 630, and the most common type of nonfamily households are 1-person households, comprising 348.
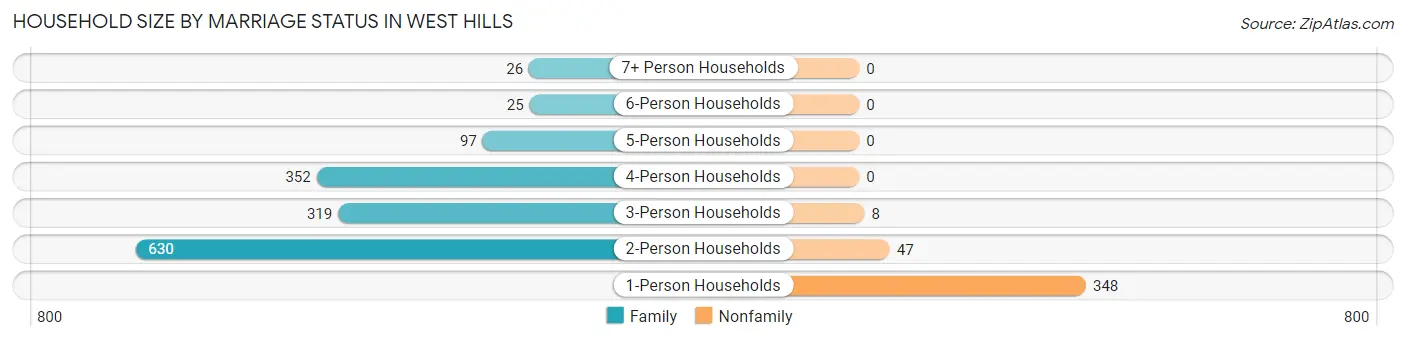
| Household Size | Family Households | Nonfamily Households |
| 1-Person Households | - | 348 (18.8%) |
| 2-Person Households | 630 (34.0%) | 47 (2.5%) |
| 3-Person Households | 319 (17.2%) | 8 (0.4%) |
| 4-Person Households | 352 (19.0%) | 0 (0.0%) |
| 5-Person Households | 97 (5.2%) | 0 (0.0%) |
| 6-Person Households | 25 (1.3%) | 0 (0.0%) |
| 7+ Person Households | 26 (1.4%) | 0 (0.0%) |
| Total | 1,449 (78.2%) | 403 (21.8%) |
Female Fertility in West Hills
Fertility by Age in West Hills
Average fertility rate in West Hills is 18.0 births per 1,000 women. Women in the age bracket of 35 to 50 years have the highest fertility rate with 39.0 births per 1,000 women. Women in the age bracket of 35 to 50 years acount for 100.0% of all women with births.
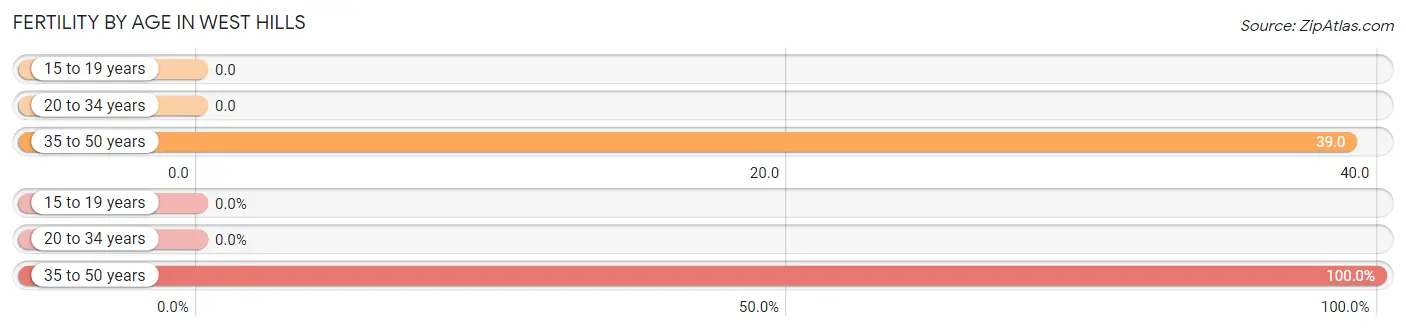
| Age Bracket | Women with Births | Births / 1,000 Women |
| 15 to 19 years | 0 (0.0%) | 0.0 |
| 20 to 34 years | 0 (0.0%) | 0.0 |
| 35 to 50 years | 19 (100.0%) | 39.0 |
| Total | 19 (100.0%) | 18.0 |
Fertility by Age by Marriage Status in West Hills
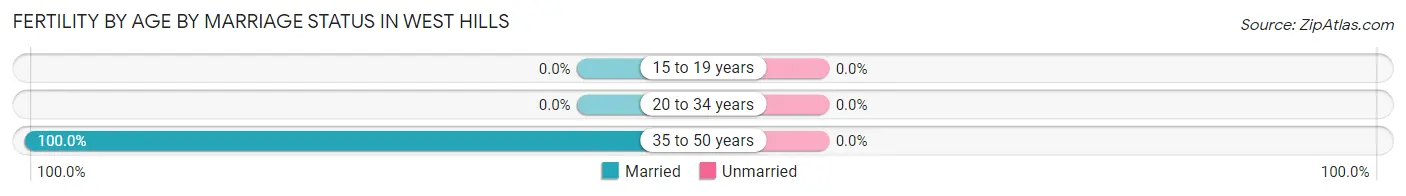
| Age Bracket | Married | Unmarried |
| 15 to 19 years | 0 (0.0%) | 0 (0.0%) |
| 20 to 34 years | 0 (0.0%) | 0 (0.0%) |
| 35 to 50 years | 19 (100.0%) | 0 (0.0%) |
| Total | 19 (100.0%) | 0 (0.0%) |
Fertility by Education in West Hills
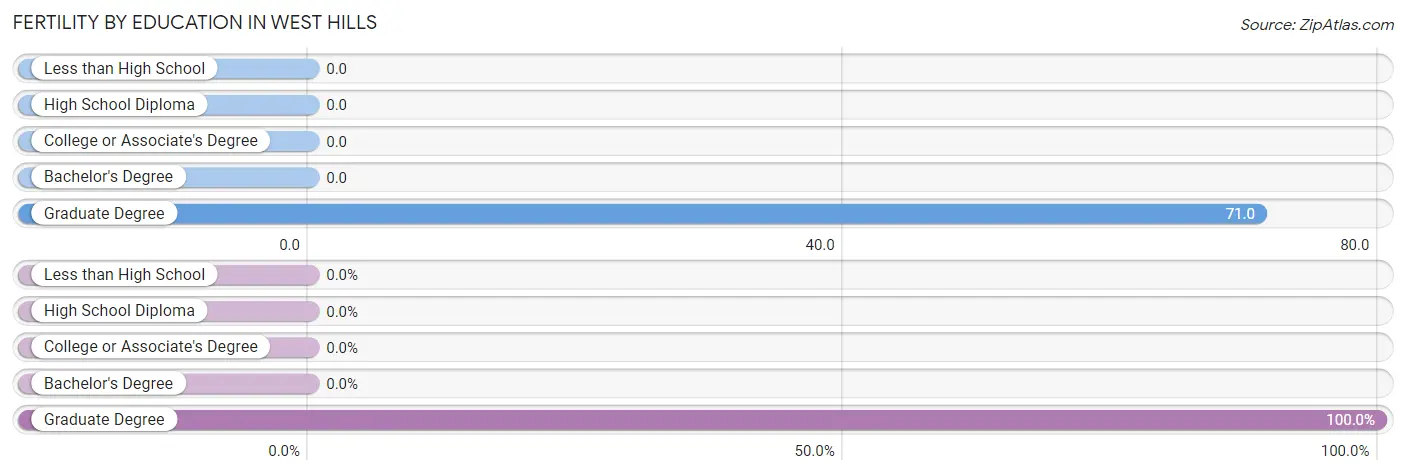
| Educational Attainment | Women with Births | Births / 1,000 Women |
| Less than High School | 0 (0.0%) | 0.0 |
| High School Diploma | 0 (0.0%) | 0.0 |
| College or Associate's Degree | 0 (0.0%) | 0.0 |
| Bachelor's Degree | 0 (0.0%) | 0.0 |
| Graduate Degree | 19 (100.0%) | 71.0 |
| Total | 19 (100.0%) | 18.0 |
Fertility by Education by Marriage Status in West Hills
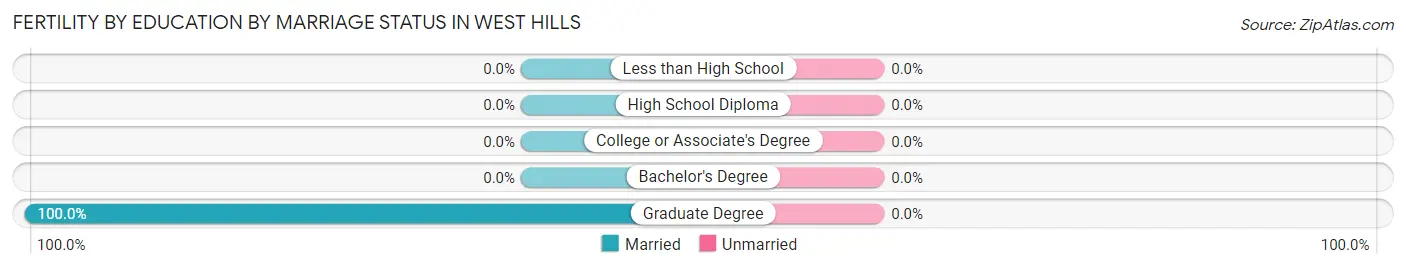
| Educational Attainment | Married | Unmarried |
| Less than High School | 0 (0.0%) | 0 (0.0%) |
| High School Diploma | 0 (0.0%) | 0 (0.0%) |
| College or Associate's Degree | 0 (0.0%) | 0 (0.0%) |
| Bachelor's Degree | 0 (0.0%) | 0 (0.0%) |
| Graduate Degree | 19 (100.0%) | 0 (0.0%) |
| Total | 19 (100.0%) | 0 (0.0%) |
Employment Characteristics in West Hills
Employment by Class of Employer in West Hills
Among the 2,752 employed individuals in West Hills, private company employees (1,722 | 62.6%), self-employed (incorporated) (321 | 11.7%), and local government employees (283 | 10.3%) make up the most common classes of employment.
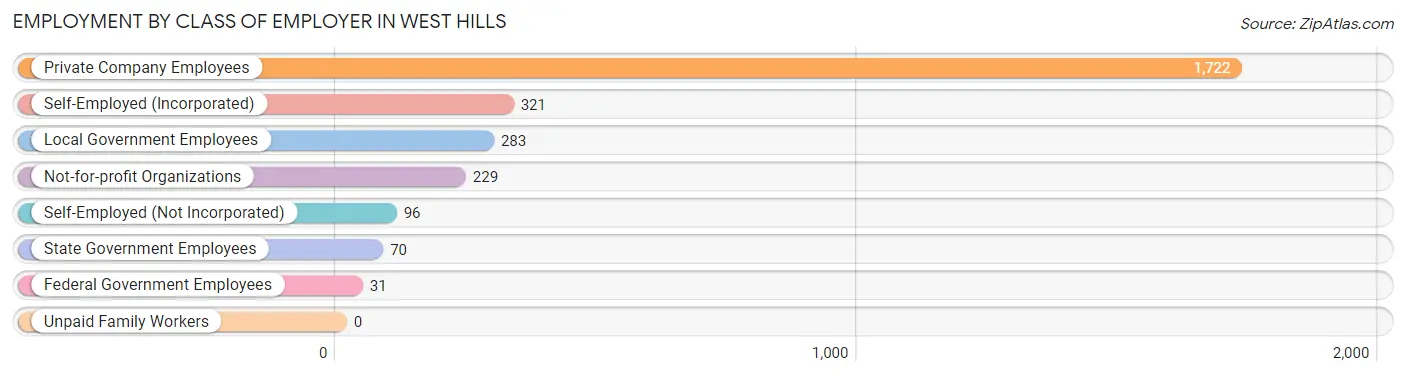
| Employer Class | # Employees | % Employees |
| Private Company Employees | 1,722 | 62.6% |
| Self-Employed (Incorporated) | 321 | 11.7% |
| Self-Employed (Not Incorporated) | 96 | 3.5% |
| Not-for-profit Organizations | 229 | 8.3% |
| Local Government Employees | 283 | 10.3% |
| State Government Employees | 70 | 2.5% |
| Federal Government Employees | 31 | 1.1% |
| Unpaid Family Workers | 0 | 0.0% |
| Total | 2,752 | 100.0% |
Employment Status by Age in West Hills
According to the labor force statistics for West Hills, out of the total population over 16 years of age (4,449), 65.4% or 2,910 individuals are in the labor force, with 3.2% or 93 of them unemployed. The age group with the highest labor force participation rate is 25 to 29 years, with 94.6% or 263 individuals in the labor force. Within the labor force, the 20 to 24 years age range has the highest percentage of unemployed individuals, with 7.6% or 10 of them being unemployed.
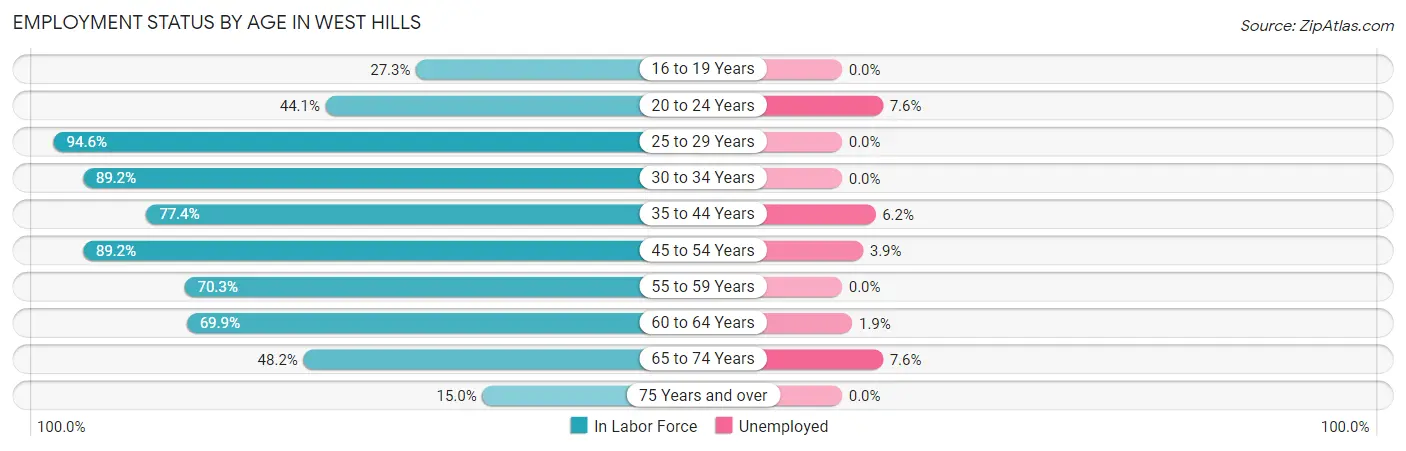
| Age Bracket | In Labor Force | Unemployed |
| 16 to 19 Years | 79 (27.3%) | 0 (0.0%) |
| 20 to 24 Years | 131 (44.1%) | 10 (7.6%) |
| 25 to 29 Years | 263 (94.6%) | 0 (0.0%) |
| 30 to 34 Years | 315 (89.2%) | 0 (0.0%) |
| 35 to 44 Years | 356 (77.4%) | 22 (6.2%) |
| 45 to 54 Years | 641 (89.2%) | 25 (3.9%) |
| 55 to 59 Years | 343 (70.3%) | 0 (0.0%) |
| 60 to 64 Years | 364 (69.9%) | 7 (1.9%) |
| 65 to 74 Years | 381 (48.2%) | 29 (7.6%) |
| 75 Years and over | 38 (15.0%) | 0 (0.0%) |
| Total | 2,910 (65.4%) | 93 (3.2%) |
Employment Status by Educational Attainment in West Hills
According to labor force statistics for West Hills, 81.0% of individuals (2,283) out of the total population between 25 and 64 years of age (2,819) are in the labor force, with 2.4% or 55 of them being unemployed. The group with the highest labor force participation rate are those with the educational attainment of college / associate degree, with 89.3% or 343 individuals in the labor force. Within the labor force, individuals with college / associate degree education have the highest percentage of unemployment, with 6.4% or 22 of them being unemployed.
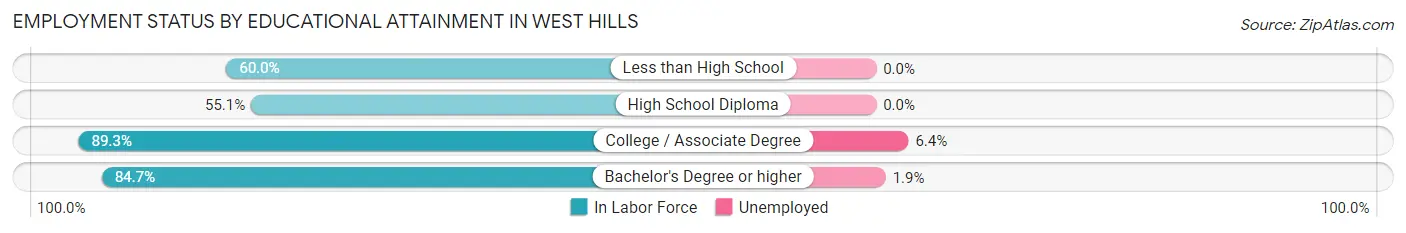
| Educational Attainment | In Labor Force | Unemployed |
| Less than High School | 87 (60.0%) | 0 (0.0%) |
| High School Diploma | 163 (55.1%) | 0 (0.0%) |
| College / Associate Degree | 343 (89.3%) | 25 (6.4%) |
| Bachelor's Degree or higher | 1,689 (84.7%) | 38 (1.9%) |
| Total | 2,283 (81.0%) | 68 (2.4%) |
Employment Occupations by Sex in West Hills
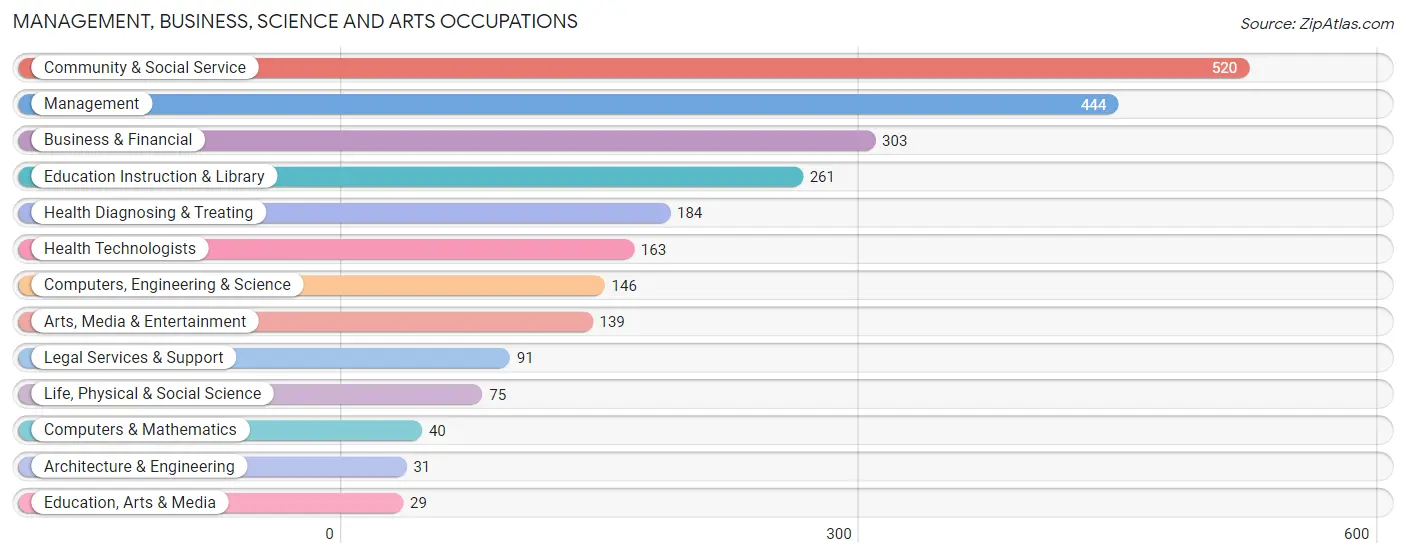
Management, Business, Science and Arts Occupations
The most common Management, Business, Science and Arts occupations in West Hills are Community & Social Service (520 | 18.4%), Management (444 | 15.8%), Business & Financial (303 | 10.7%), Education Instruction & Library (261 | 9.3%), and Health Diagnosing & Treating (184 | 6.5%).
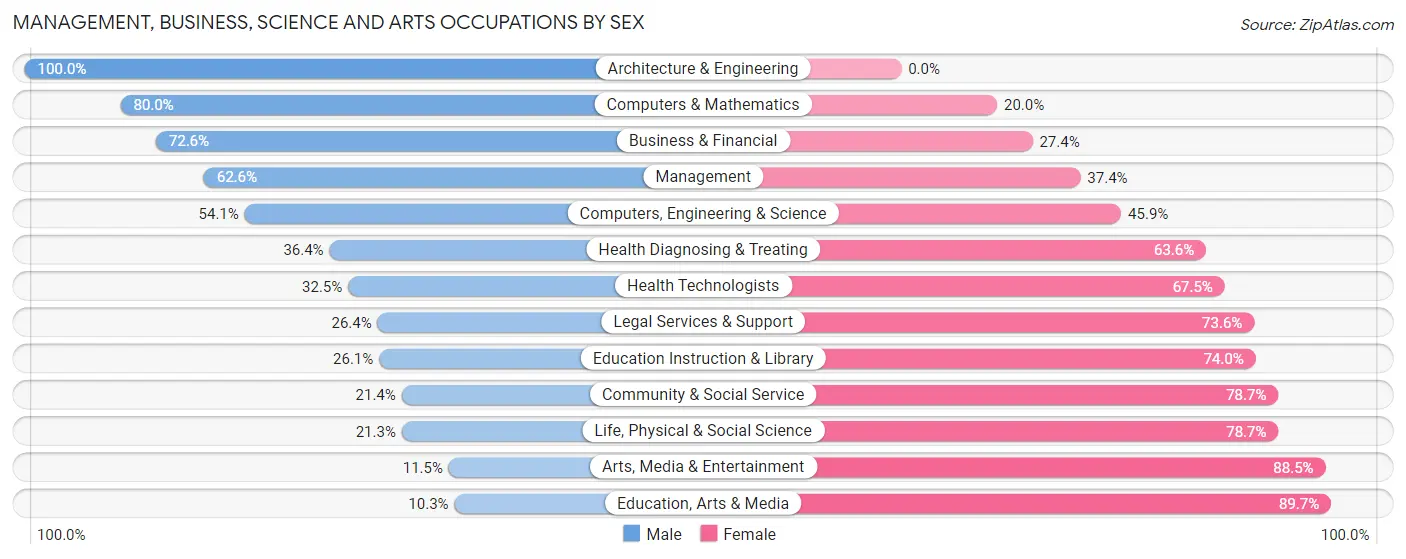
Management, Business, Science and Arts Occupations by Sex
Within the Management, Business, Science and Arts occupations in West Hills, the most male-oriented occupations are Architecture & Engineering (100.0%), Computers & Mathematics (80.0%), and Business & Financial (72.6%), while the most female-oriented occupations are Education, Arts & Media (89.7%), Arts, Media & Entertainment (88.5%), and Life, Physical & Social Science (78.7%).
| Occupation | Male | Female |
| Management | 278 (62.6%) | 166 (37.4%) |
| Business & Financial | 220 (72.6%) | 83 (27.4%) |
| Computers, Engineering & Science | 79 (54.1%) | 67 (45.9%) |
| Computers & Mathematics | 32 (80.0%) | 8 (20.0%) |
| Architecture & Engineering | 31 (100.0%) | 0 (0.0%) |
| Life, Physical & Social Science | 16 (21.3%) | 59 (78.7%) |
| Community & Social Service | 111 (21.3%) | 409 (78.6%) |
| Education, Arts & Media | 3 (10.3%) | 26 (89.7%) |
| Legal Services & Support | 24 (26.4%) | 67 (73.6%) |
| Education Instruction & Library | 68 (26.1%) | 193 (74.0%) |
| Arts, Media & Entertainment | 16 (11.5%) | 123 (88.5%) |
| Health Diagnosing & Treating | 67 (36.4%) | 117 (63.6%) |
| Health Technologists | 53 (32.5%) | 110 (67.5%) |
| Total (Category) | 755 (47.3%) | 842 (52.7%) |
| Total (Overall) | 1,527 (54.2%) | 1,291 (45.8%) |
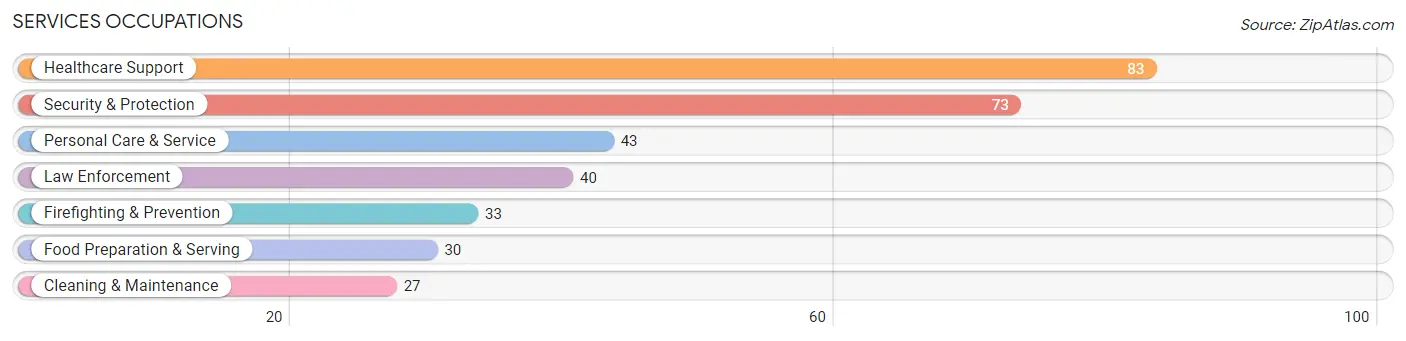
Services Occupations
The most common Services occupations in West Hills are Healthcare Support (83 | 2.9%), Security & Protection (73 | 2.6%), Personal Care & Service (43 | 1.5%), Law Enforcement (40 | 1.4%), and Firefighting & Prevention (33 | 1.2%).
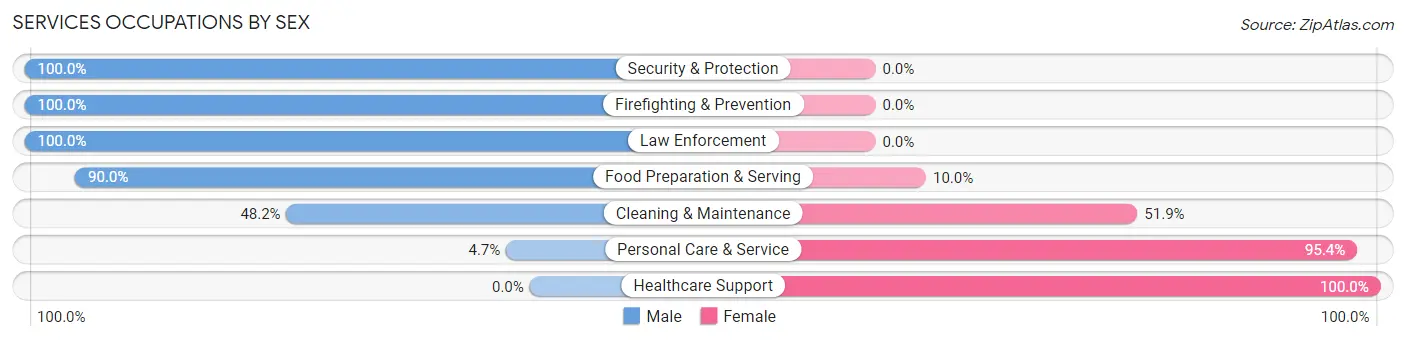
Services Occupations by Sex
Within the Services occupations in West Hills, the most male-oriented occupations are Security & Protection (100.0%), Firefighting & Prevention (100.0%), and Law Enforcement (100.0%), while the most female-oriented occupations are Healthcare Support (100.0%), Personal Care & Service (95.4%), and Cleaning & Maintenance (51.8%).
| Occupation | Male | Female |
| Healthcare Support | 0 (0.0%) | 83 (100.0%) |
| Security & Protection | 73 (100.0%) | 0 (0.0%) |
| Firefighting & Prevention | 33 (100.0%) | 0 (0.0%) |
| Law Enforcement | 40 (100.0%) | 0 (0.0%) |
| Food Preparation & Serving | 27 (90.0%) | 3 (10.0%) |
| Cleaning & Maintenance | 13 (48.1%) | 14 (51.8%) |
| Personal Care & Service | 2 (4.6%) | 41 (95.4%) |
| Total (Category) | 115 (44.9%) | 141 (55.1%) |
| Total (Overall) | 1,527 (54.2%) | 1,291 (45.8%) |
Sales and Office Occupations
The most common Sales and Office occupations in West Hills are Sales & Related (356 | 12.6%), and Office & Administration (286 | 10.2%).
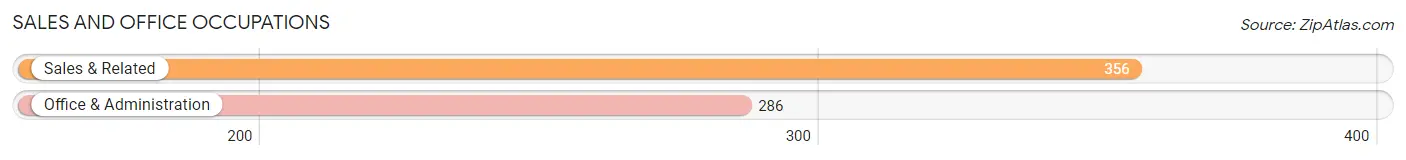
Sales and Office Occupations by Sex
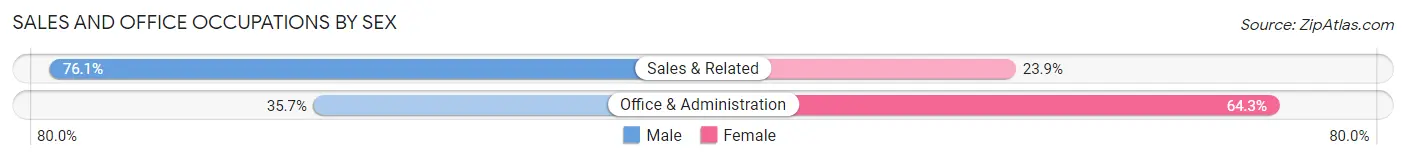
| Occupation | Male | Female |
| Sales & Related | 271 (76.1%) | 85 (23.9%) |
| Office & Administration | 102 (35.7%) | 184 (64.3%) |
| Total (Category) | 373 (58.1%) | 269 (41.9%) |
| Total (Overall) | 1,527 (54.2%) | 1,291 (45.8%) |
Natural Resources, Construction and Maintenance Occupations
The most common Natural Resources, Construction and Maintenance occupations in West Hills are Construction & Extraction (121 | 4.3%), Installation, Maintenance & Repair (73 | 2.6%), and Farming, Fishing & Forestry (1 | 0.0%).
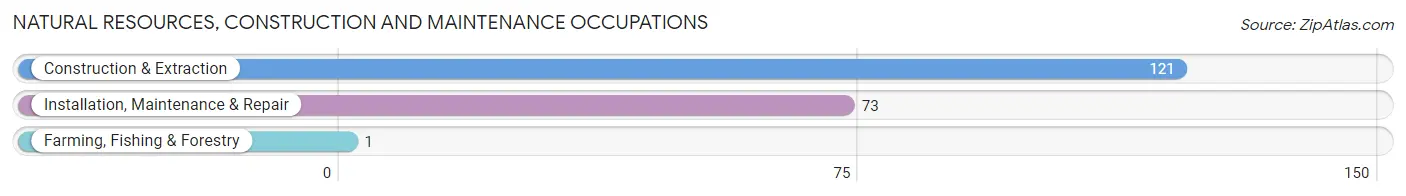
Natural Resources, Construction and Maintenance Occupations by Sex
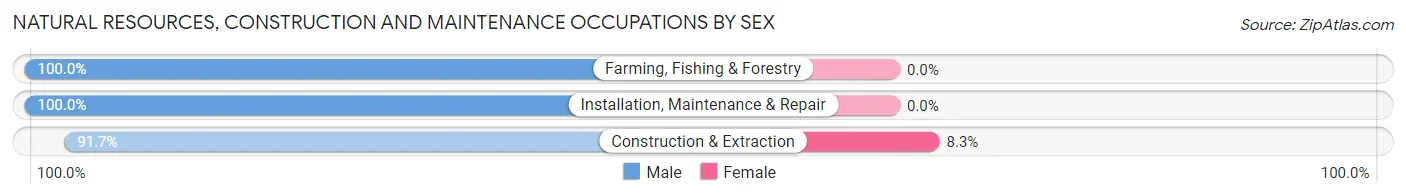
| Occupation | Male | Female |
| Farming, Fishing & Forestry | 1 (100.0%) | 0 (0.0%) |
| Construction & Extraction | 111 (91.7%) | 10 (8.3%) |
| Installation, Maintenance & Repair | 73 (100.0%) | 0 (0.0%) |
| Total (Category) | 185 (94.9%) | 10 (5.1%) |
| Total (Overall) | 1,527 (54.2%) | 1,291 (45.8%) |
Production, Transportation and Moving Occupations
The most common Production, Transportation and Moving occupations in West Hills are Transportation (62 | 2.2%), Material Moving (45 | 1.6%), and Production (21 | 0.7%).
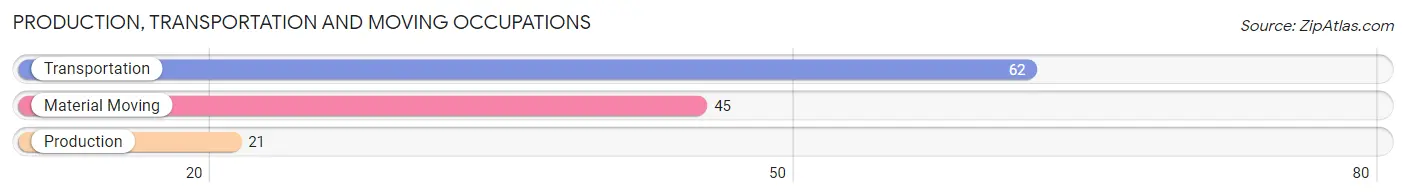
Production, Transportation and Moving Occupations by Sex
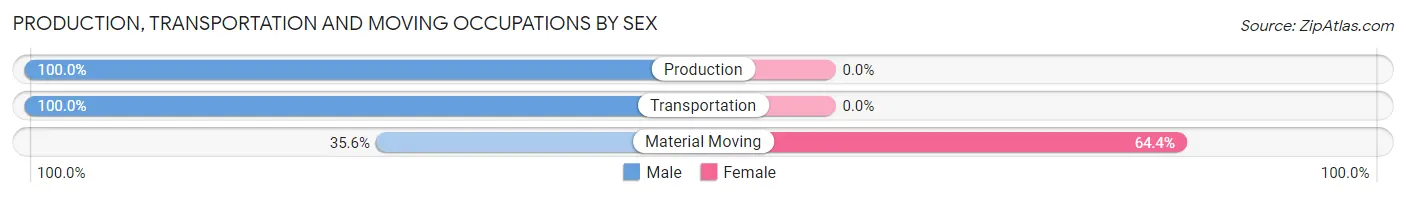
| Occupation | Male | Female |
| Production | 21 (100.0%) | 0 (0.0%) |
| Transportation | 62 (100.0%) | 0 (0.0%) |
| Material Moving | 16 (35.6%) | 29 (64.4%) |
| Total (Category) | 99 (77.3%) | 29 (22.7%) |
| Total (Overall) | 1,527 (54.2%) | 1,291 (45.8%) |
Employment Industries by Sex in West Hills
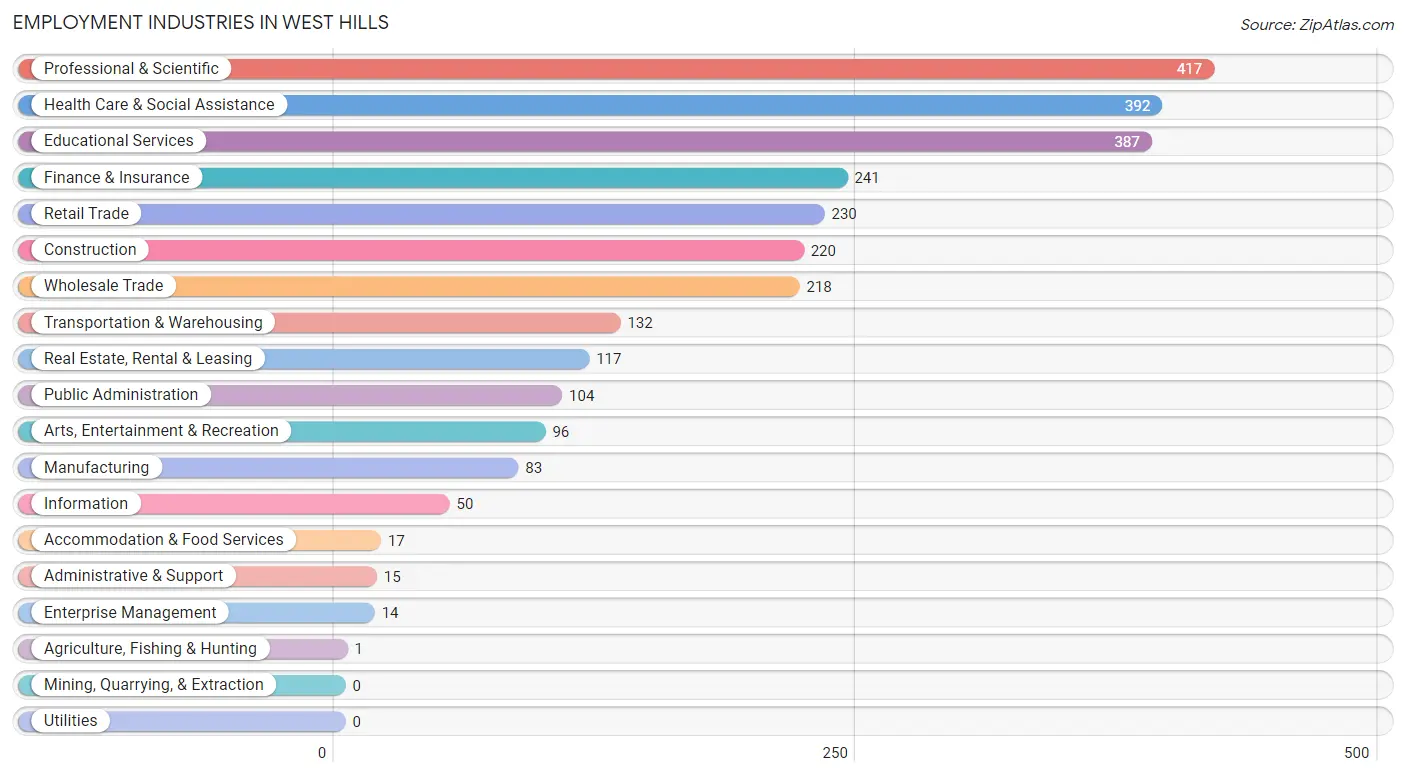
Employment Industries in West Hills
The major employment industries in West Hills include Professional & Scientific (417 | 14.8%), Health Care & Social Assistance (392 | 13.9%), Educational Services (387 | 13.7%), Finance & Insurance (241 | 8.6%), and Retail Trade (230 | 8.2%).
Employment Industries by Sex in West Hills
The West Hills industries that see more men than women are Agriculture, Fishing & Hunting (100.0%), Enterprise Management (100.0%), and Administrative & Support (100.0%), whereas the industries that tend to have a higher number of women are Information (78.0%), Health Care & Social Assistance (73.2%), and Educational Services (64.1%).
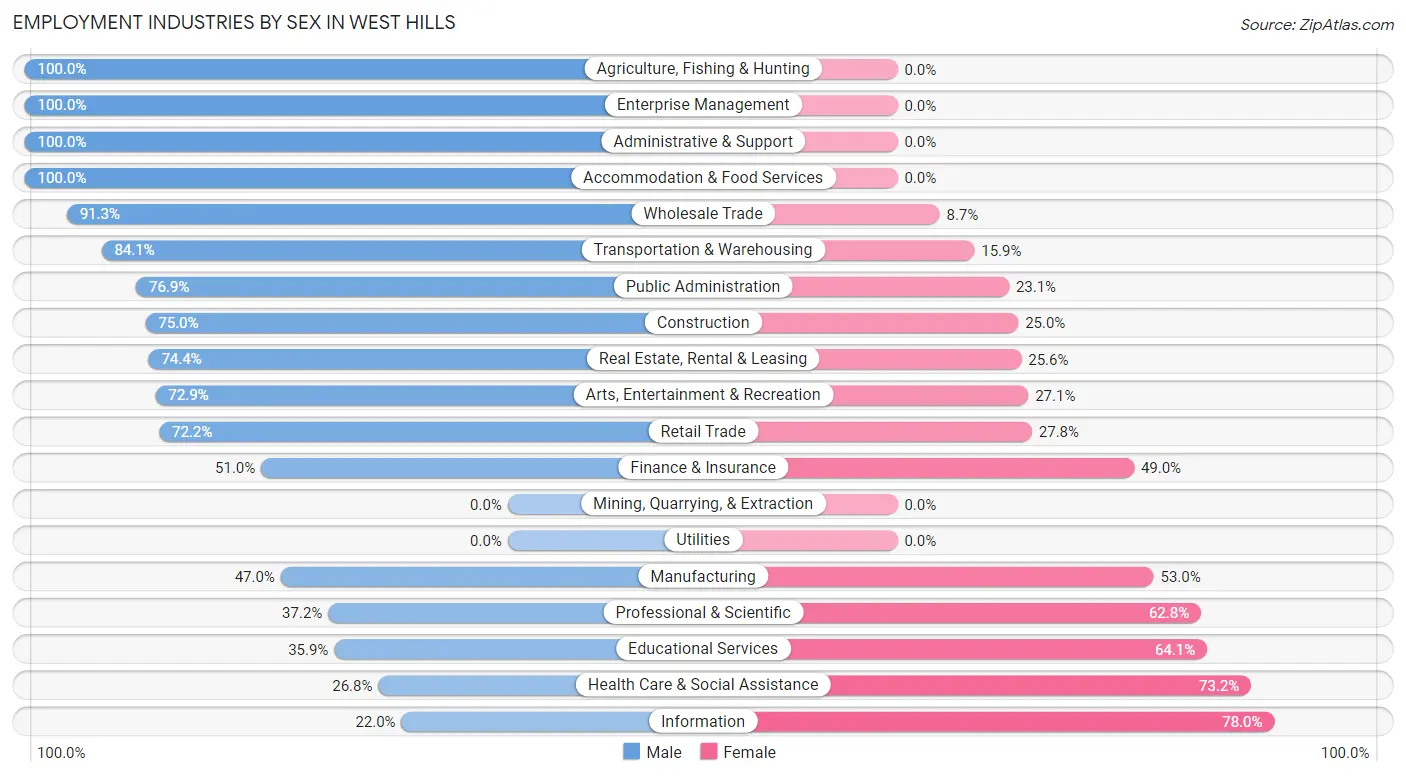
| Industry | Male | Female |
| Agriculture, Fishing & Hunting | 1 (100.0%) | 0 (0.0%) |
| Mining, Quarrying, & Extraction | 0 (0.0%) | 0 (0.0%) |
| Construction | 165 (75.0%) | 55 (25.0%) |
| Manufacturing | 39 (47.0%) | 44 (53.0%) |
| Wholesale Trade | 199 (91.3%) | 19 (8.7%) |
| Retail Trade | 166 (72.2%) | 64 (27.8%) |
| Transportation & Warehousing | 111 (84.1%) | 21 (15.9%) |
| Utilities | 0 (0.0%) | 0 (0.0%) |
| Information | 11 (22.0%) | 39 (78.0%) |
| Finance & Insurance | 123 (51.0%) | 118 (49.0%) |
| Real Estate, Rental & Leasing | 87 (74.4%) | 30 (25.6%) |
| Professional & Scientific | 155 (37.2%) | 262 (62.8%) |
| Enterprise Management | 14 (100.0%) | 0 (0.0%) |
| Administrative & Support | 15 (100.0%) | 0 (0.0%) |
| Educational Services | 139 (35.9%) | 248 (64.1%) |
| Health Care & Social Assistance | 105 (26.8%) | 287 (73.2%) |
| Arts, Entertainment & Recreation | 70 (72.9%) | 26 (27.1%) |
| Accommodation & Food Services | 17 (100.0%) | 0 (0.0%) |
| Public Administration | 80 (76.9%) | 24 (23.1%) |
| Total | 1,527 (54.2%) | 1,291 (45.8%) |
Education in West Hills
School Enrollment in West Hills
The most common levels of schooling among the 1,002 students in West Hills are high school (253 | 25.3%), elementary school (221 | 22.1%), and college / undergraduate (190 | 19.0%).
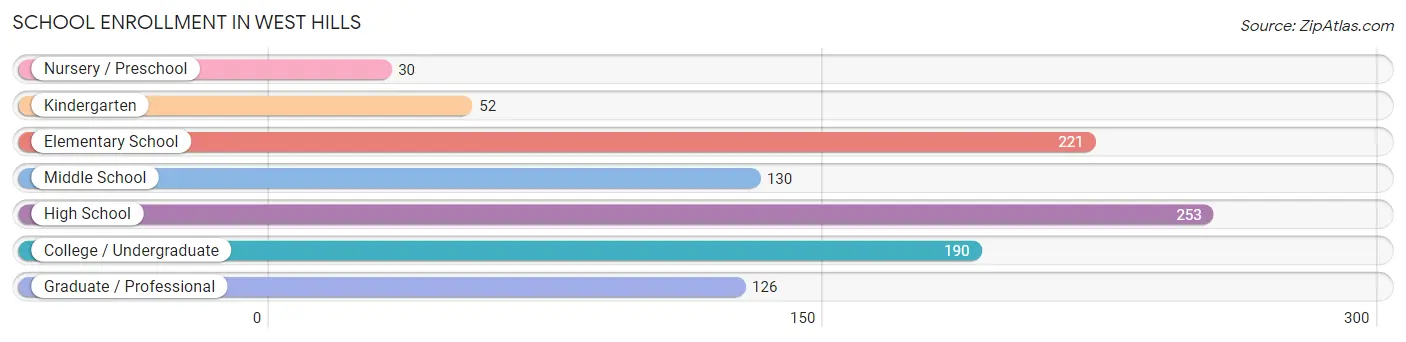
| School Level | # Students | % Students |
| Nursery / Preschool | 30 | 3.0% |
| Kindergarten | 52 | 5.2% |
| Elementary School | 221 | 22.1% |
| Middle School | 130 | 13.0% |
| High School | 253 | 25.3% |
| College / Undergraduate | 190 | 19.0% |
| Graduate / Professional | 126 | 12.6% |
| Total | 1,002 | 100.0% |
School Enrollment by Age by Funding Source in West Hills
Out of a total of 1,002 students who are enrolled in schools in West Hills, 279 (27.8%) attend a private institution, while the remaining 723 (72.2%) are enrolled in public schools. The age group of 3 to 4 year olds has the highest likelihood of being enrolled in private schools, with 10 (100.0% in the age bracket) enrolled. Conversely, the age group of 25 to 34 year olds has the lowest likelihood of being enrolled in a private school, with 39 (100.0% in the age bracket) attending a public institution.
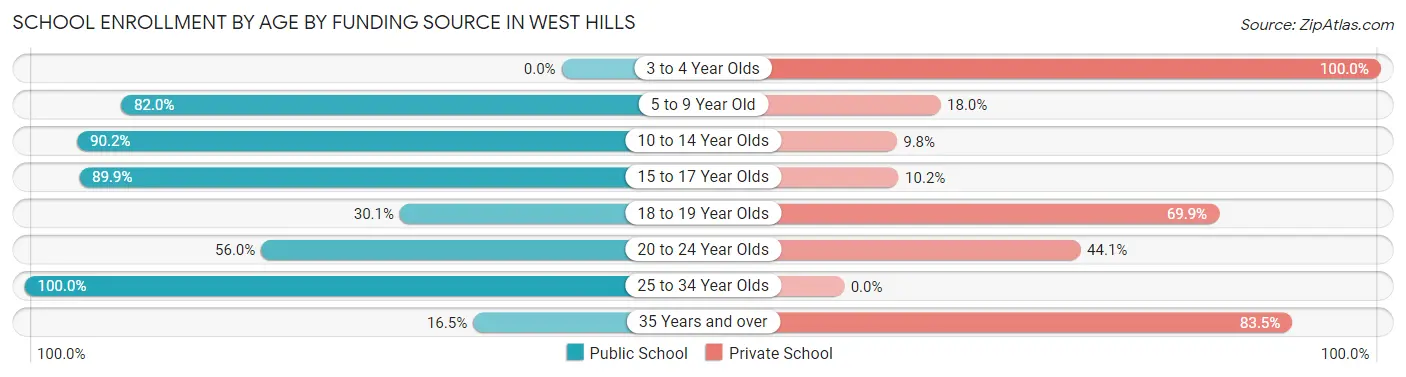
| Age Bracket | Public School | Private School |
| 3 to 4 Year Olds | 0 (0.0%) | 10 (100.0%) |
| 5 to 9 Year Old | 233 (82.0%) | 51 (18.0%) |
| 10 to 14 Year Olds | 184 (90.2%) | 20 (9.8%) |
| 15 to 17 Year Olds | 177 (89.8%) | 20 (10.2%) |
| 18 to 19 Year Olds | 28 (30.1%) | 65 (69.9%) |
| 20 to 24 Year Olds | 47 (55.9%) | 37 (44.1%) |
| 25 to 34 Year Olds | 39 (100.0%) | 0 (0.0%) |
| 35 Years and over | 15 (16.5%) | 76 (83.5%) |
| Total | 723 (72.2%) | 279 (27.8%) |
Educational Attainment by Field of Study in West Hills
Business (641 | 22.0%), social sciences (367 | 12.6%), engineering (277 | 9.5%), psychology (261 | 9.0%), and visual & performing arts (229 | 7.9%) are the most common fields of study among 2,911 individuals in West Hills who have obtained a bachelor's degree or higher.
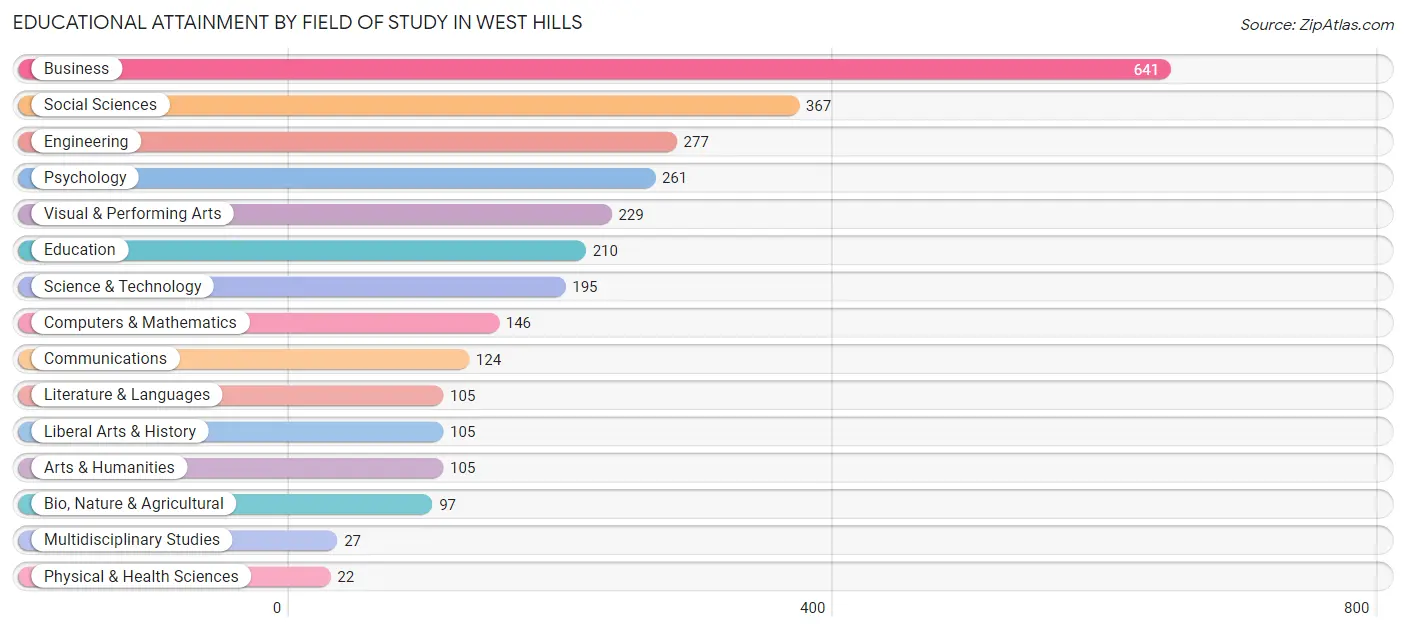
| Field of Study | # Graduates | % Graduates |
| Computers & Mathematics | 146 | 5.0% |
| Bio, Nature & Agricultural | 97 | 3.3% |
| Physical & Health Sciences | 22 | 0.8% |
| Psychology | 261 | 9.0% |
| Social Sciences | 367 | 12.6% |
| Engineering | 277 | 9.5% |
| Multidisciplinary Studies | 27 | 0.9% |
| Science & Technology | 195 | 6.7% |
| Business | 641 | 22.0% |
| Education | 210 | 7.2% |
| Literature & Languages | 105 | 3.6% |
| Liberal Arts & History | 105 | 3.6% |
| Visual & Performing Arts | 229 | 7.9% |
| Communications | 124 | 4.3% |
| Arts & Humanities | 105 | 3.6% |
| Total | 2,911 | 100.0% |
Transportation & Commute in West Hills
Vehicle Availability by Sex in West Hills
The most prevalent vehicle ownership categories in West Hills are males with 2 vehicles (603, accounting for 40.4%) and females with 2 vehicles (494, making up 49.1%).
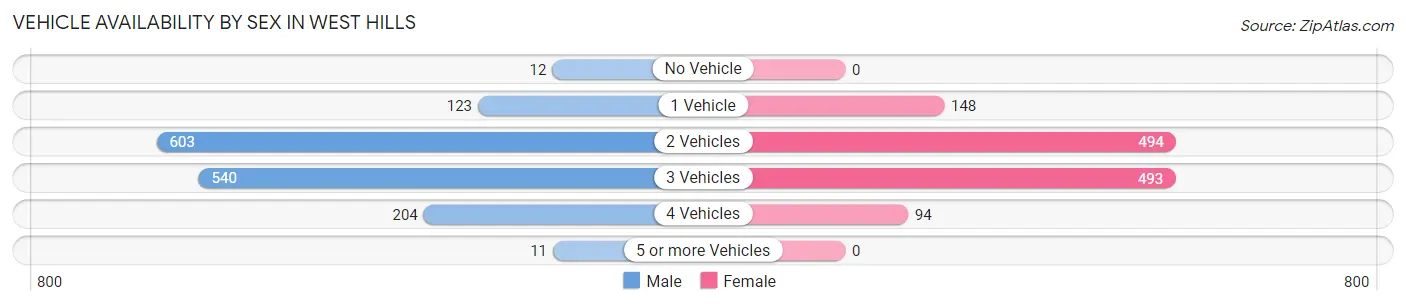
| Vehicles Available | Male | Female |
| No Vehicle | 12 (0.8%) | 0 (0.0%) |
| 1 Vehicle | 123 (8.2%) | 148 (12.0%) |
| 2 Vehicles | 603 (40.4%) | 494 (40.2%) |
| 3 Vehicles | 540 (36.2%) | 493 (40.1%) |
| 4 Vehicles | 204 (13.7%) | 94 (7.6%) |
| 5 or more Vehicles | 11 (0.7%) | 0 (0.0%) |
| Total | 1,493 (100.0%) | 1,229 (100.0%) |
Commute Time in West Hills
The most frequently occuring commute durations in West Hills are 30 to 34 minutes (341 commuters, 14.9%), 90 or more minutes (299 commuters, 13.1%), and 45 to 59 minutes (280 commuters, 12.3%).
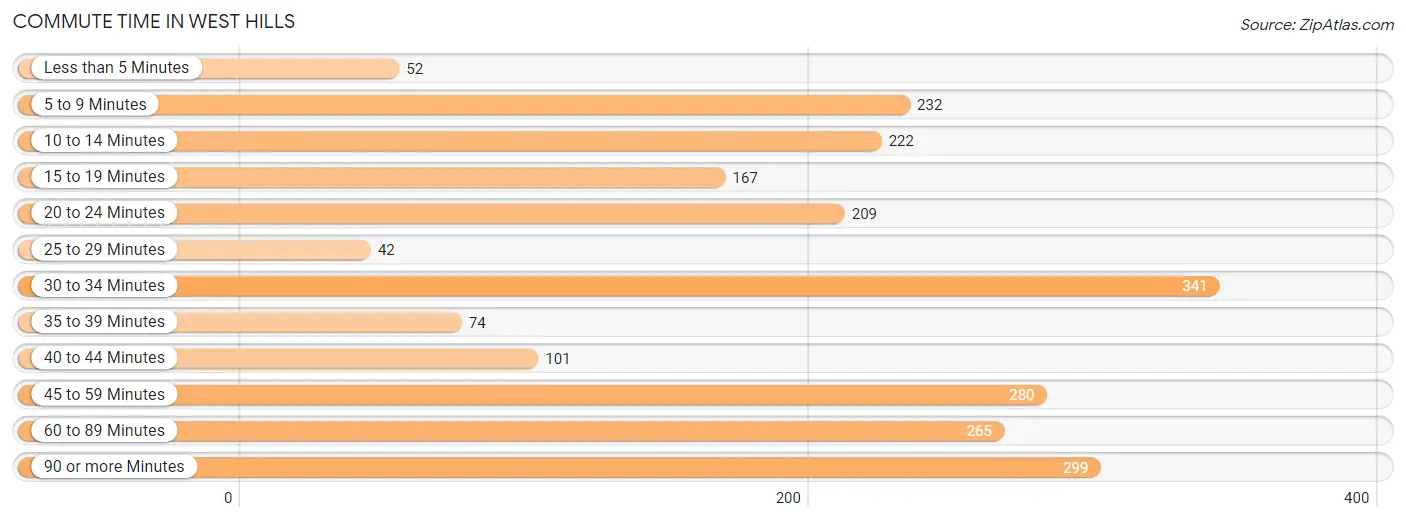
| Commute Time | # Commuters | % Commuters |
| Less than 5 Minutes | 52 | 2.3% |
| 5 to 9 Minutes | 232 | 10.2% |
| 10 to 14 Minutes | 222 | 9.7% |
| 15 to 19 Minutes | 167 | 7.3% |
| 20 to 24 Minutes | 209 | 9.1% |
| 25 to 29 Minutes | 42 | 1.8% |
| 30 to 34 Minutes | 341 | 14.9% |
| 35 to 39 Minutes | 74 | 3.2% |
| 40 to 44 Minutes | 101 | 4.4% |
| 45 to 59 Minutes | 280 | 12.3% |
| 60 to 89 Minutes | 265 | 11.6% |
| 90 or more Minutes | 299 | 13.1% |
Commute Time by Sex in West Hills
The most common commute times in West Hills are 60 to 89 minutes (220 commuters, 17.6%) for males and 30 to 34 minutes (237 commuters, 23.0%) for females.
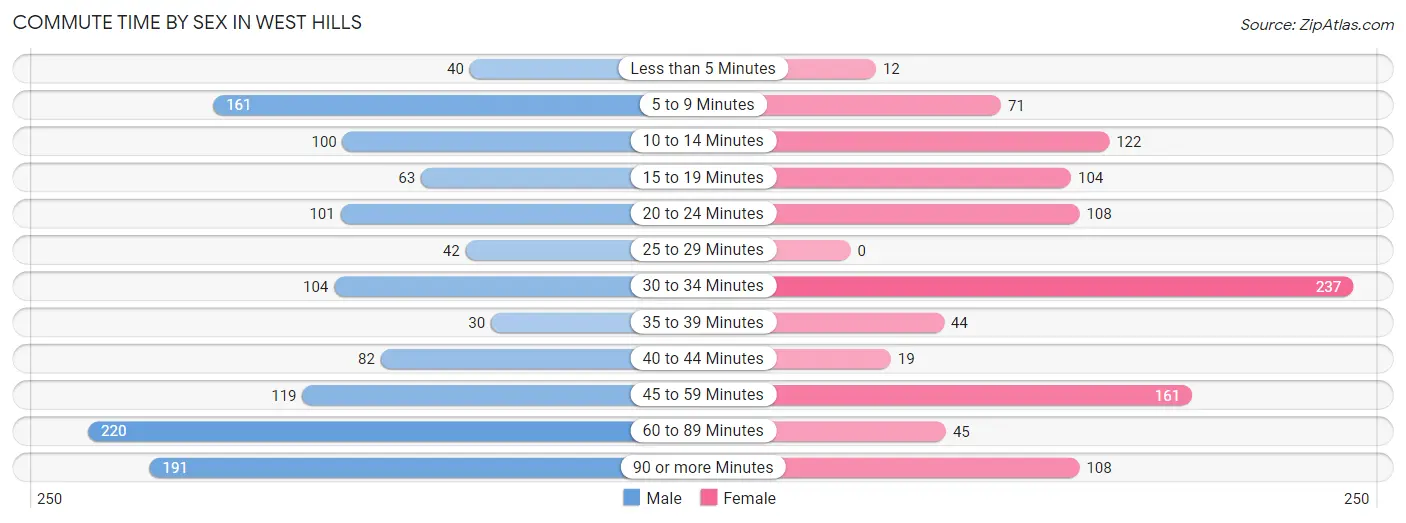
| Commute Time | Male | Female |
| Less than 5 Minutes | 40 (3.2%) | 12 (1.2%) |
| 5 to 9 Minutes | 161 (12.9%) | 71 (6.9%) |
| 10 to 14 Minutes | 100 (8.0%) | 122 (11.8%) |
| 15 to 19 Minutes | 63 (5.0%) | 104 (10.1%) |
| 20 to 24 Minutes | 101 (8.1%) | 108 (10.5%) |
| 25 to 29 Minutes | 42 (3.4%) | 0 (0.0%) |
| 30 to 34 Minutes | 104 (8.3%) | 237 (23.0%) |
| 35 to 39 Minutes | 30 (2.4%) | 44 (4.3%) |
| 40 to 44 Minutes | 82 (6.5%) | 19 (1.8%) |
| 45 to 59 Minutes | 119 (9.5%) | 161 (15.6%) |
| 60 to 89 Minutes | 220 (17.6%) | 45 (4.4%) |
| 90 or more Minutes | 191 (15.2%) | 108 (10.5%) |
Time of Departure to Work by Sex in West Hills
The most frequent times of departure to work in West Hills are 8:00 AM to 8:29 AM (186, 14.8%) for males and 8:30 AM to 8:59 AM (254, 24.6%) for females.
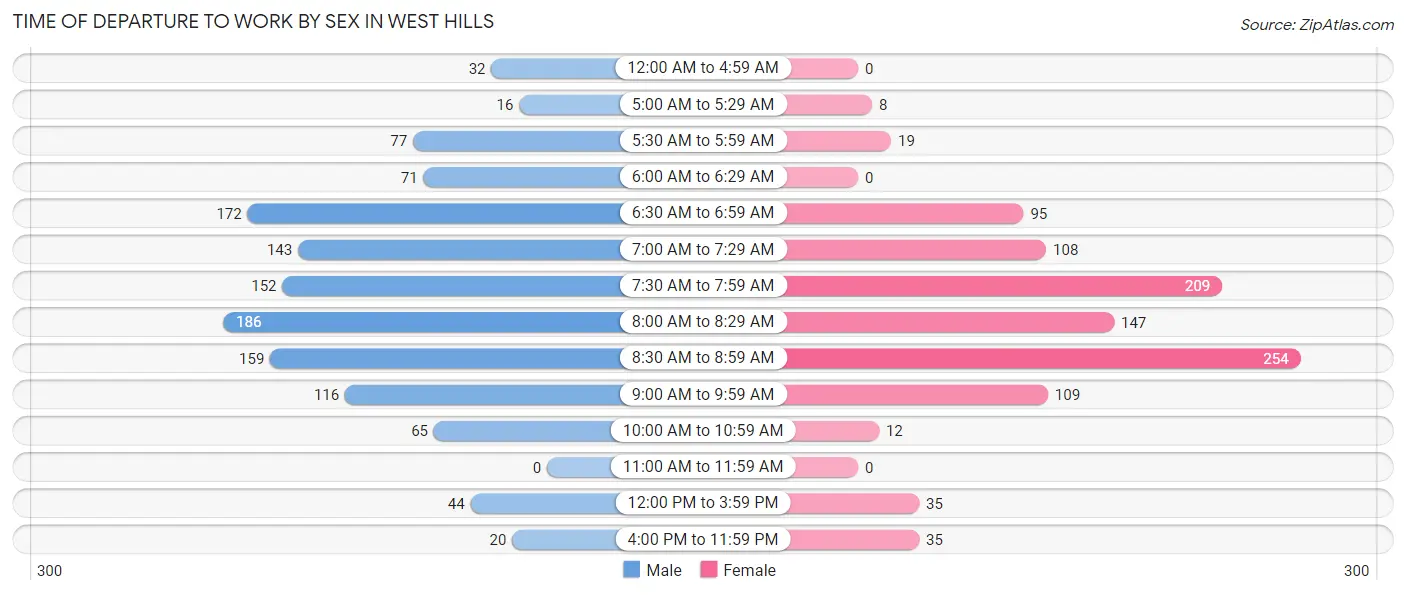
| Time of Departure | Male | Female |
| 12:00 AM to 4:59 AM | 32 (2.5%) | 0 (0.0%) |
| 5:00 AM to 5:29 AM | 16 (1.3%) | 8 (0.8%) |
| 5:30 AM to 5:59 AM | 77 (6.1%) | 19 (1.8%) |
| 6:00 AM to 6:29 AM | 71 (5.7%) | 0 (0.0%) |
| 6:30 AM to 6:59 AM | 172 (13.7%) | 95 (9.2%) |
| 7:00 AM to 7:29 AM | 143 (11.4%) | 108 (10.5%) |
| 7:30 AM to 7:59 AM | 152 (12.1%) | 209 (20.3%) |
| 8:00 AM to 8:29 AM | 186 (14.8%) | 147 (14.3%) |
| 8:30 AM to 8:59 AM | 159 (12.7%) | 254 (24.6%) |
| 9:00 AM to 9:59 AM | 116 (9.3%) | 109 (10.6%) |
| 10:00 AM to 10:59 AM | 65 (5.2%) | 12 (1.2%) |
| 11:00 AM to 11:59 AM | 0 (0.0%) | 0 (0.0%) |
| 12:00 PM to 3:59 PM | 44 (3.5%) | 35 (3.4%) |
| 4:00 PM to 11:59 PM | 20 (1.6%) | 35 (3.4%) |
| Total | 1,253 (100.0%) | 1,031 (100.0%) |
Housing Occupancy in West Hills
Occupancy by Ownership in West Hills
Of the total 1,852 dwellings in West Hills, owner-occupied units account for 1,765 (95.3%), while renter-occupied units make up 87 (4.7%).
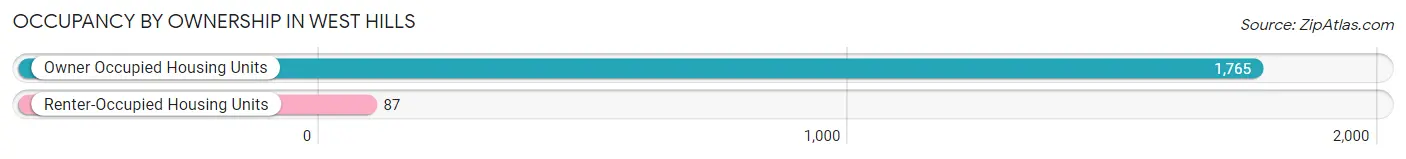
| Occupancy | # Housing Units | % Housing Units |
| Owner Occupied Housing Units | 1,765 | 95.3% |
| Renter-Occupied Housing Units | 87 | 4.7% |
| Total Occupied Housing Units | 1,852 | 100.0% |
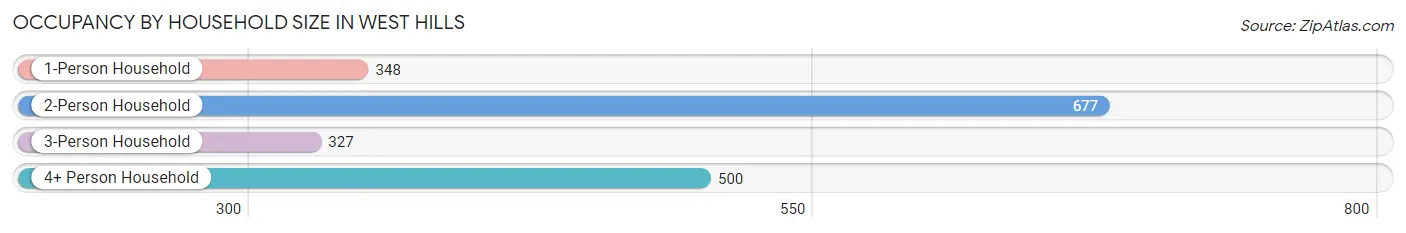
Occupancy by Household Size in West Hills
| Household Size | # Housing Units | % Housing Units |
| 1-Person Household | 348 | 18.8% |
| 2-Person Household | 677 | 36.6% |
| 3-Person Household | 327 | 17.7% |
| 4+ Person Household | 500 | 27.0% |
| Total Housing Units | 1,852 | 100.0% |
Occupancy by Ownership by Household Size in West Hills
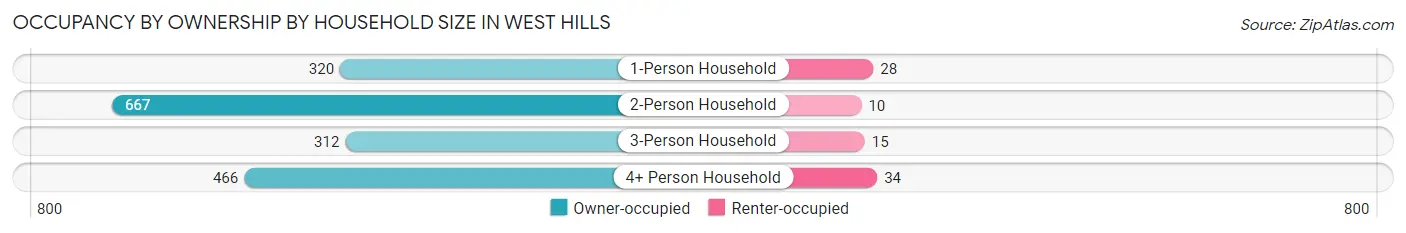
| Household Size | Owner-occupied | Renter-occupied |
| 1-Person Household | 320 (91.9%) | 28 (8.1%) |
| 2-Person Household | 667 (98.5%) | 10 (1.5%) |
| 3-Person Household | 312 (95.4%) | 15 (4.6%) |
| 4+ Person Household | 466 (93.2%) | 34 (6.8%) |
| Total Housing Units | 1,765 (95.3%) | 87 (4.7%) |
Occupancy by Educational Attainment in West Hills
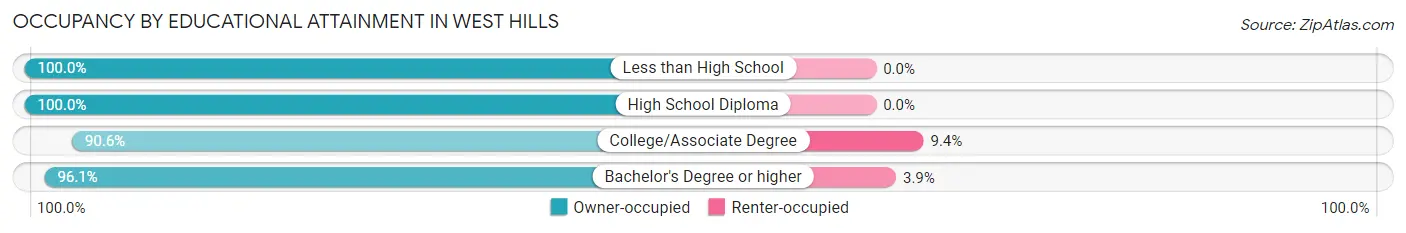
| Household Size | Owner-occupied | Renter-occupied |
| Less than High School | 68 (100.0%) | 0 (0.0%) |
| High School Diploma | 76 (100.0%) | 0 (0.0%) |
| College/Associate Degree | 328 (90.6%) | 34 (9.4%) |
| Bachelor's Degree or higher | 1,293 (96.1%) | 53 (3.9%) |
Occupancy by Age of Householder in West Hills
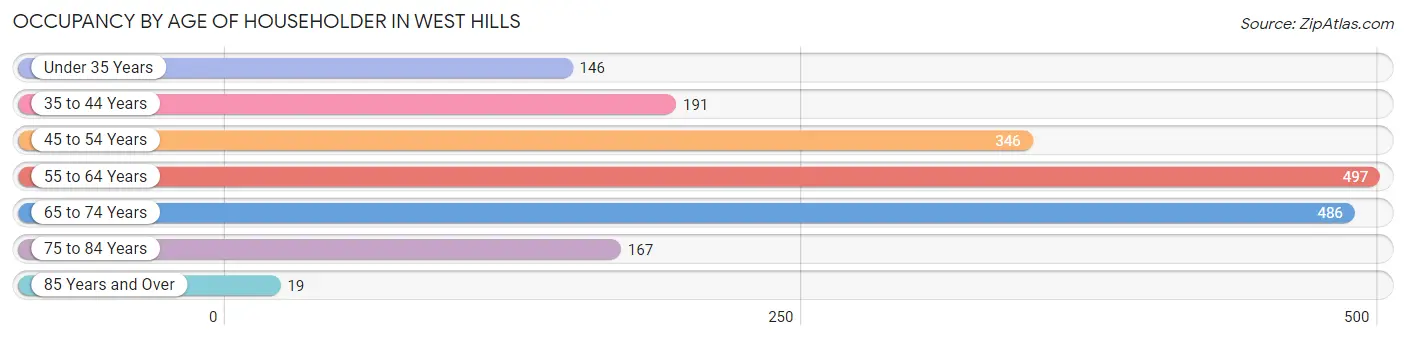
| Age Bracket | # Households | % Households |
| Under 35 Years | 146 | 7.9% |
| 35 to 44 Years | 191 | 10.3% |
| 45 to 54 Years | 346 | 18.7% |
| 55 to 64 Years | 497 | 26.8% |
| 65 to 74 Years | 486 | 26.2% |
| 75 to 84 Years | 167 | 9.0% |
| 85 Years and Over | 19 | 1.0% |
| Total | 1,852 | 100.0% |
Housing Finances in West Hills
Median Income by Occupancy in West Hills
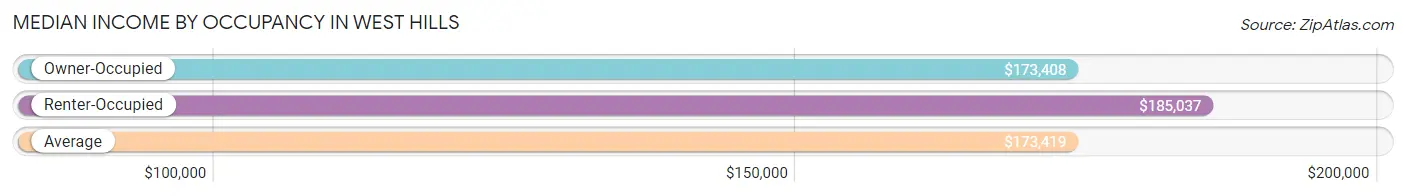
| Occupancy Type | # Households | Median Income |
| Owner-Occupied | 1,765 (95.3%) | $173,408 |
| Renter-Occupied | 87 (4.7%) | $185,037 |
| Average | 1,852 (100.0%) | $173,419 |
Occupancy by Householder Income Bracket in West Hills
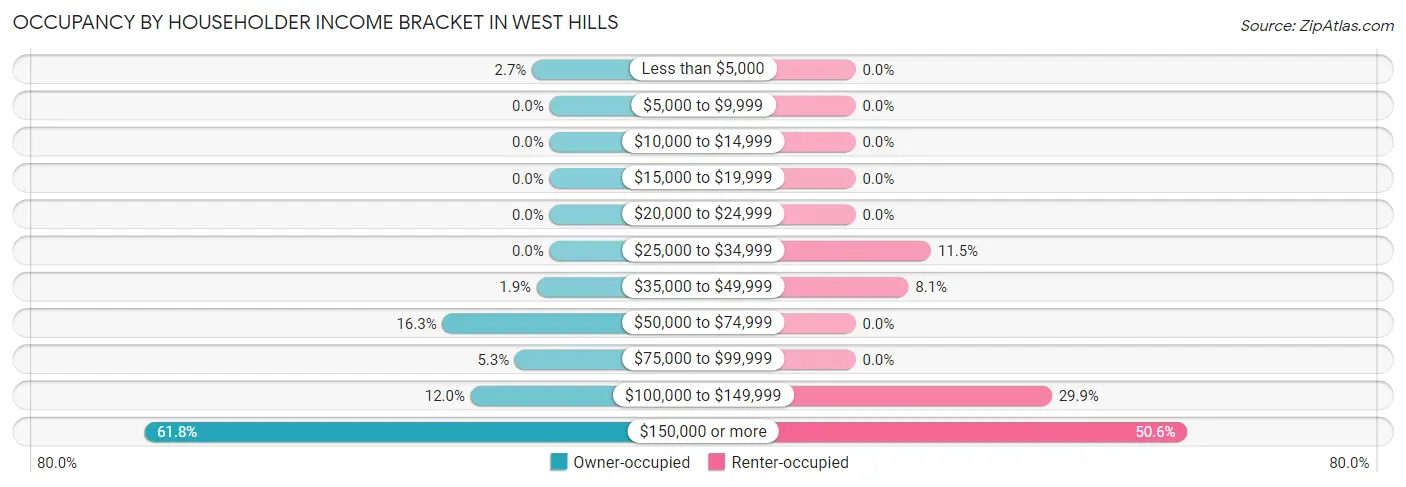
| Income Bracket | Owner-occupied | Renter-occupied |
| Less than $5,000 | 47 (2.7%) | 0 (0.0%) |
| $5,000 to $9,999 | 0 (0.0%) | 0 (0.0%) |
| $10,000 to $14,999 | 0 (0.0%) | 0 (0.0%) |
| $15,000 to $19,999 | 0 (0.0%) | 0 (0.0%) |
| $20,000 to $24,999 | 0 (0.0%) | 0 (0.0%) |
| $25,000 to $34,999 | 0 (0.0%) | 10 (11.5%) |
| $35,000 to $49,999 | 34 (1.9%) | 7 (8.1%) |
| $50,000 to $74,999 | 288 (16.3%) | 0 (0.0%) |
| $75,000 to $99,999 | 93 (5.3%) | 0 (0.0%) |
| $100,000 to $149,999 | 212 (12.0%) | 26 (29.9%) |
| $150,000 or more | 1,091 (61.8%) | 44 (50.6%) |
| Total | 1,765 (100.0%) | 87 (100.0%) |
Monthly Housing Cost Tiers in West Hills
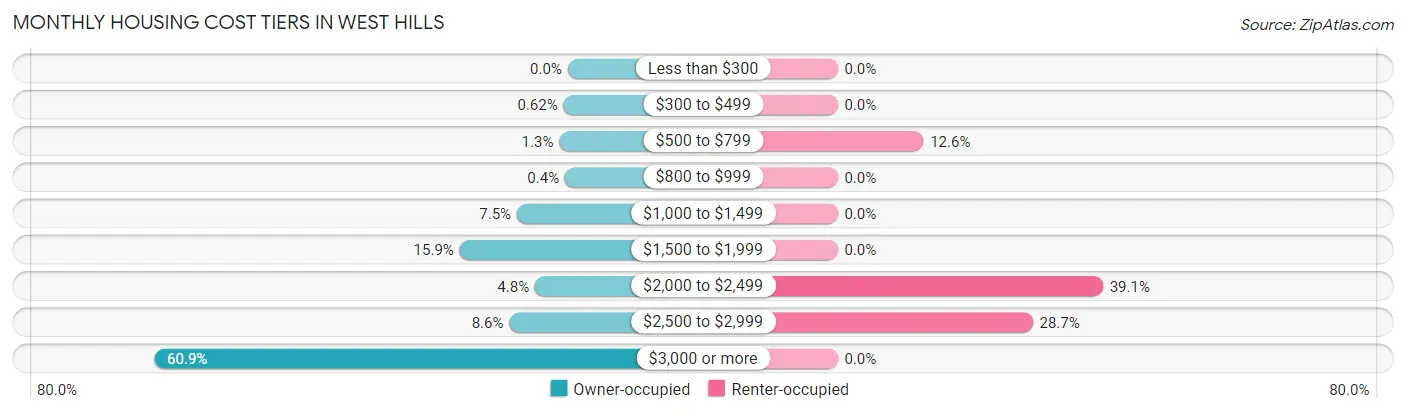
| Monthly Cost | Owner-occupied | Renter-occupied |
| Less than $300 | 0 (0.0%) | 0 (0.0%) |
| $300 to $499 | 11 (0.6%) | 0 (0.0%) |
| $500 to $799 | 22 (1.3%) | 11 (12.6%) |
| $800 to $999 | 7 (0.4%) | 0 (0.0%) |
| $1,000 to $1,499 | 132 (7.5%) | 0 (0.0%) |
| $1,500 to $1,999 | 281 (15.9%) | 0 (0.0%) |
| $2,000 to $2,499 | 85 (4.8%) | 34 (39.1%) |
| $2,500 to $2,999 | 152 (8.6%) | 25 (28.7%) |
| $3,000 or more | 1,075 (60.9%) | 0 (0.0%) |
| Total | 1,765 (100.0%) | 87 (100.0%) |
Physical Housing Characteristics in West Hills
Housing Structures in West Hills
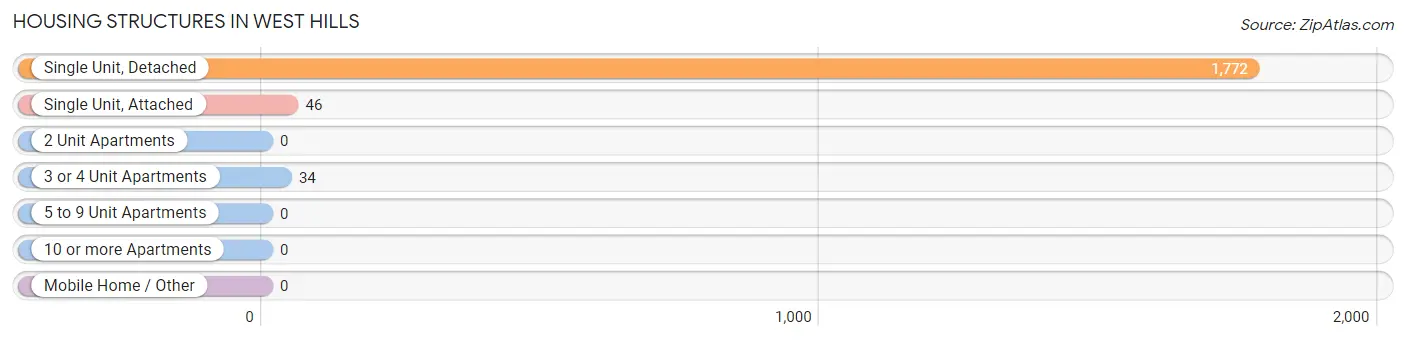
| Structure Type | # Housing Units | % Housing Units |
| Single Unit, Detached | 1,772 | 95.7% |
| Single Unit, Attached | 46 | 2.5% |
| 2 Unit Apartments | 0 | 0.0% |
| 3 or 4 Unit Apartments | 34 | 1.8% |
| 5 to 9 Unit Apartments | 0 | 0.0% |
| 10 or more Apartments | 0 | 0.0% |
| Mobile Home / Other | 0 | 0.0% |
| Total | 1,852 | 100.0% |
Housing Structures by Occupancy in West Hills
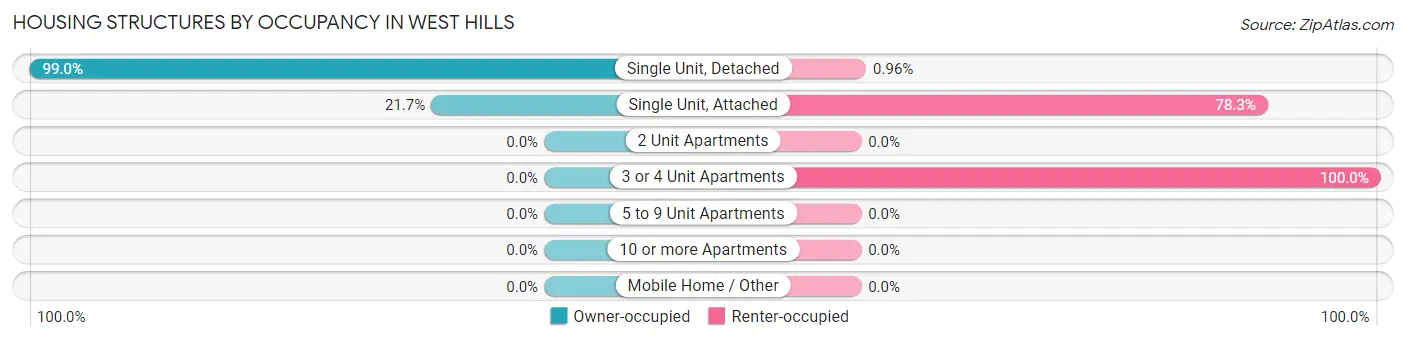
| Structure Type | Owner-occupied | Renter-occupied |
| Single Unit, Detached | 1,755 (99.0%) | 17 (1.0%) |
| Single Unit, Attached | 10 (21.7%) | 36 (78.3%) |
| 2 Unit Apartments | 0 (0.0%) | 0 (0.0%) |
| 3 or 4 Unit Apartments | 0 (0.0%) | 34 (100.0%) |
| 5 to 9 Unit Apartments | 0 (0.0%) | 0 (0.0%) |
| 10 or more Apartments | 0 (0.0%) | 0 (0.0%) |
| Mobile Home / Other | 0 (0.0%) | 0 (0.0%) |
| Total | 1,765 (95.3%) | 87 (4.7%) |
Housing Structures by Number of Rooms in West Hills
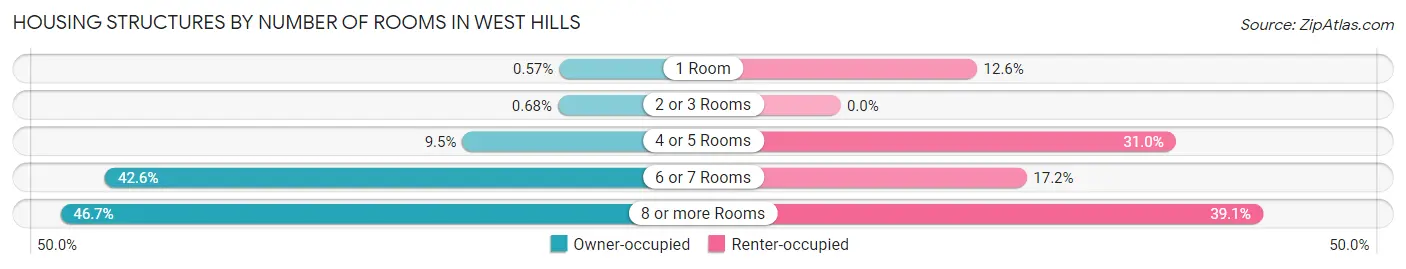
| Number of Rooms | Owner-occupied | Renter-occupied |
| 1 Room | 10 (0.6%) | 11 (12.6%) |
| 2 or 3 Rooms | 12 (0.7%) | 0 (0.0%) |
| 4 or 5 Rooms | 168 (9.5%) | 27 (31.0%) |
| 6 or 7 Rooms | 751 (42.5%) | 15 (17.2%) |
| 8 or more Rooms | 824 (46.7%) | 34 (39.1%) |
| Total | 1,765 (100.0%) | 87 (100.0%) |
Housing Structure by Heating Type in West Hills
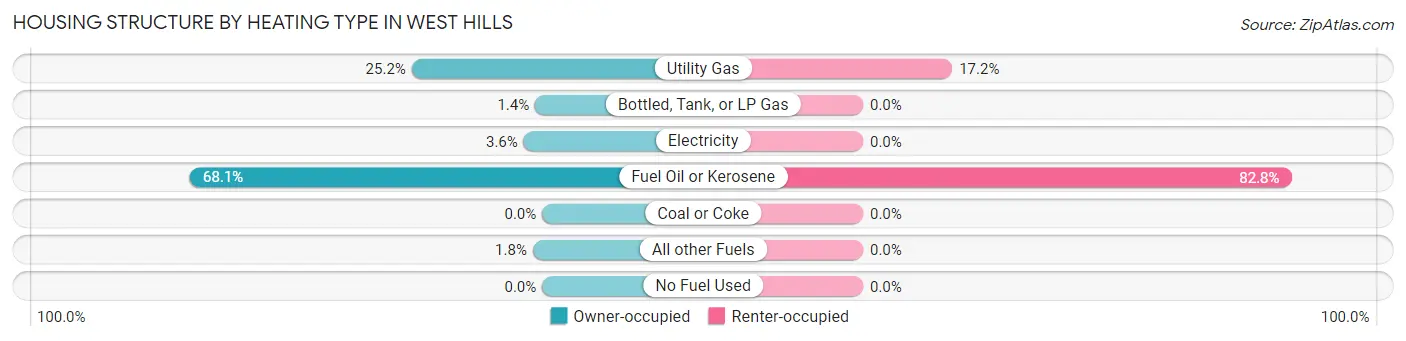
| Heating Type | Owner-occupied | Renter-occupied |
| Utility Gas | 445 (25.2%) | 15 (17.2%) |
| Bottled, Tank, or LP Gas | 24 (1.4%) | 0 (0.0%) |
| Electricity | 63 (3.6%) | 0 (0.0%) |
| Fuel Oil or Kerosene | 1,201 (68.0%) | 72 (82.8%) |
| Coal or Coke | 0 (0.0%) | 0 (0.0%) |
| All other Fuels | 32 (1.8%) | 0 (0.0%) |
| No Fuel Used | 0 (0.0%) | 0 (0.0%) |
| Total | 1,765 (100.0%) | 87 (100.0%) |
Household Vehicle Usage in West Hills
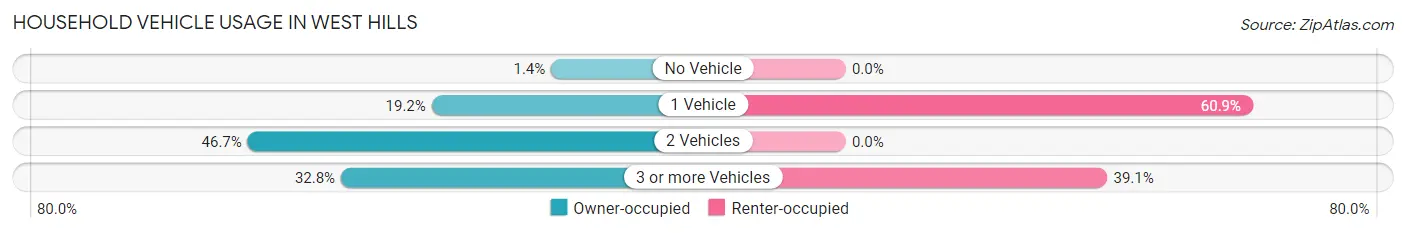
| Vehicles per Household | Owner-occupied | Renter-occupied |
| No Vehicle | 24 (1.4%) | 0 (0.0%) |
| 1 Vehicle | 339 (19.2%) | 53 (60.9%) |
| 2 Vehicles | 824 (46.7%) | 0 (0.0%) |
| 3 or more Vehicles | 578 (32.8%) | 34 (39.1%) |
| Total | 1,765 (100.0%) | 87 (100.0%) |
Real Estate & Mortgages in West Hills
Real Estate and Mortgage Overview in West Hills
| Characteristic | Without Mortgage | With Mortgage |
| Housing Units | 642 | 1,123 |
| Median Property Value | $666,400 | $729,100 |
| Median Household Income | $147,679 | $783 |
| Monthly Housing Costs | $1,501 | $945 |
| Real Estate Taxes | $10,001 | $0 |
Property Value by Mortgage Status in West Hills
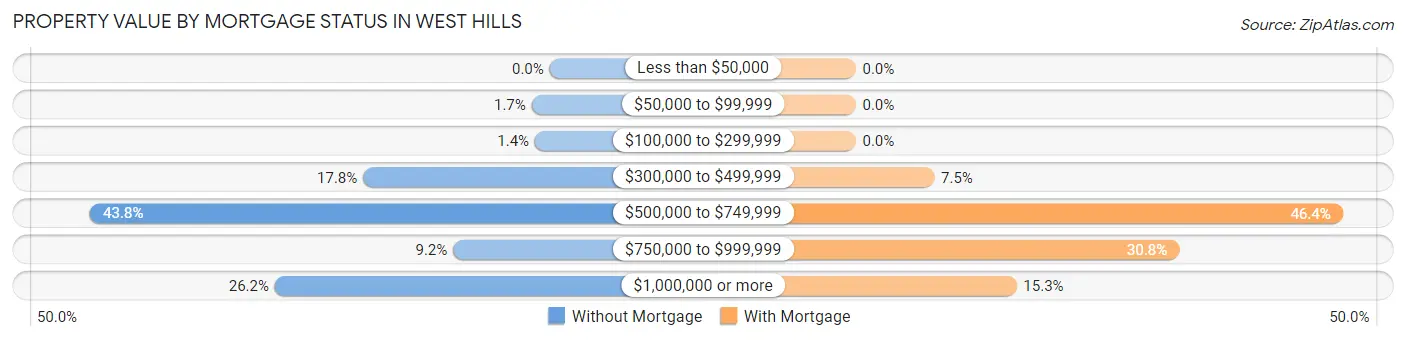
| Property Value | Without Mortgage | With Mortgage |
| Less than $50,000 | 0 (0.0%) | 0 (0.0%) |
| $50,000 to $99,999 | 11 (1.7%) | 0 (0.0%) |
| $100,000 to $299,999 | 9 (1.4%) | 0 (0.0%) |
| $300,000 to $499,999 | 114 (17.8%) | 84 (7.5%) |
| $500,000 to $749,999 | 281 (43.8%) | 521 (46.4%) |
| $750,000 to $999,999 | 59 (9.2%) | 346 (30.8%) |
| $1,000,000 or more | 168 (26.2%) | 172 (15.3%) |
| Total | 642 (100.0%) | 1,123 (100.0%) |
Household Income by Mortgage Status in West Hills
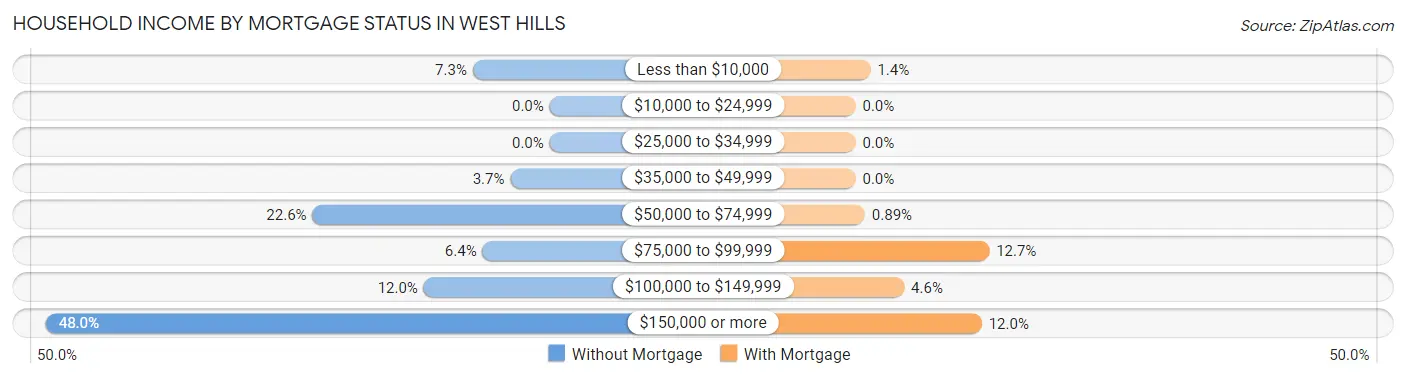
| Household Income | Without Mortgage | With Mortgage |
| Less than $10,000 | 47 (7.3%) | 16 (1.4%) |
| $10,000 to $24,999 | 0 (0.0%) | 0 (0.0%) |
| $25,000 to $34,999 | 0 (0.0%) | 0 (0.0%) |
| $35,000 to $49,999 | 24 (3.7%) | 0 (0.0%) |
| $50,000 to $74,999 | 145 (22.6%) | 10 (0.9%) |
| $75,000 to $99,999 | 41 (6.4%) | 143 (12.7%) |
| $100,000 to $149,999 | 77 (12.0%) | 52 (4.6%) |
| $150,000 or more | 308 (48.0%) | 135 (12.0%) |
| Total | 642 (100.0%) | 1,123 (100.0%) |
Property Value to Household Income Ratio in West Hills
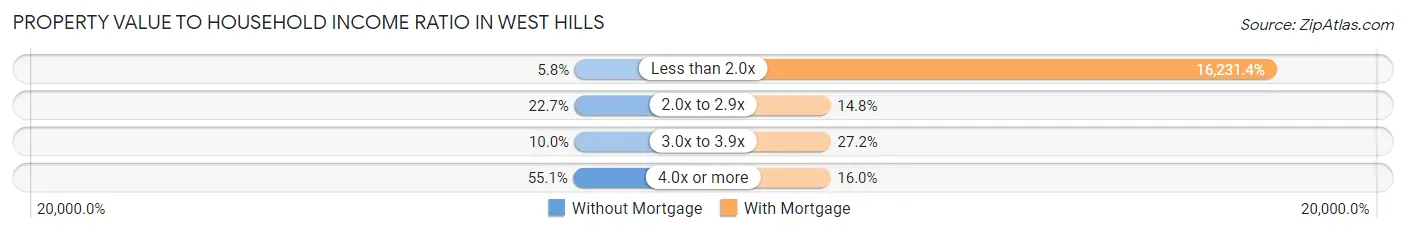
| Value-to-Income Ratio | Without Mortgage | With Mortgage |
| Less than 2.0x | 37 (5.8%) | 182,279 (16,231.4%) |
| 2.0x to 2.9x | 146 (22.7%) | 166 (14.8%) |
| 3.0x to 3.9x | 64 (10.0%) | 305 (27.2%) |
| 4.0x or more | 354 (55.1%) | 180 (16.0%) |
| Total | 642 (100.0%) | 1,123 (100.0%) |
Real Estate Taxes by Mortgage Status in West Hills
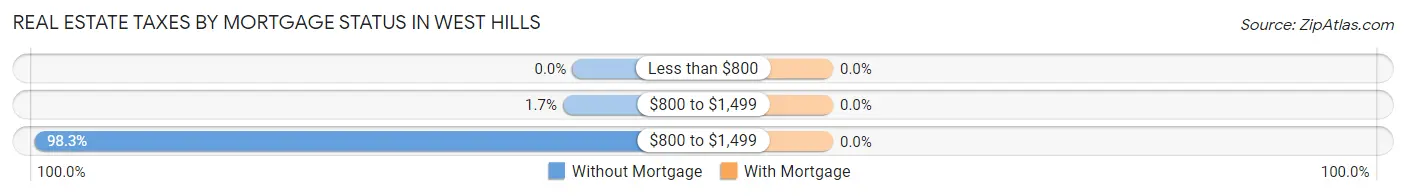
| Property Taxes | Without Mortgage | With Mortgage |
| Less than $800 | 0 (0.0%) | 0 (0.0%) |
| $800 to $1,499 | 11 (1.7%) | 0 (0.0%) |
| $800 to $1,499 | 631 (98.3%) | 0 (0.0%) |
| Total | 642 (100.0%) | 1,123 (100.0%) |
Health & Disability in West Hills
Health Insurance Coverage by Age in West Hills
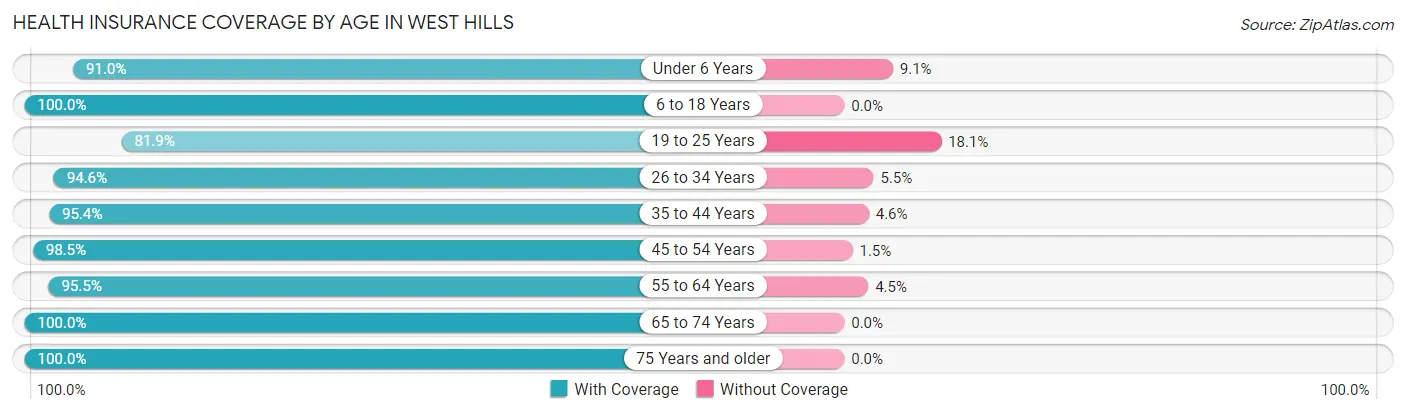
| Age Bracket | With Coverage | Without Coverage |
| Under 6 Years | 221 (90.9%) | 22 (9.0%) |
| 6 to 18 Years | 666 (100.0%) | 0 (0.0%) |
| 19 to 25 Years | 322 (81.9%) | 71 (18.1%) |
| 26 to 34 Years | 573 (94.6%) | 33 (5.4%) |
| 35 to 44 Years | 439 (95.4%) | 21 (4.6%) |
| 45 to 54 Years | 708 (98.5%) | 11 (1.5%) |
| 55 to 64 Years | 964 (95.5%) | 45 (4.5%) |
| 65 to 74 Years | 790 (100.0%) | 0 (0.0%) |
| 75 Years and older | 254 (100.0%) | 0 (0.0%) |
| Total | 4,937 (96.1%) | 203 (4.0%) |
Health Insurance Coverage by Citizenship Status in West Hills
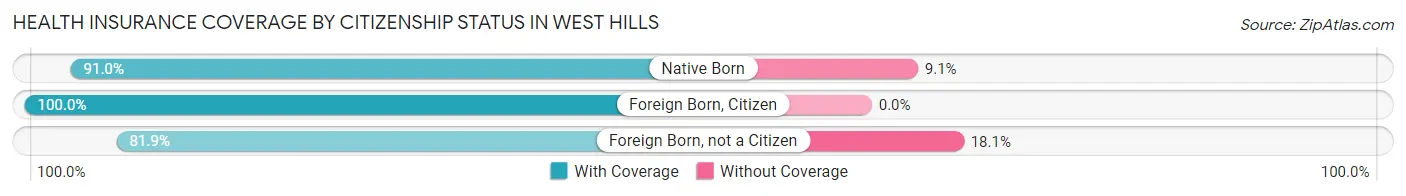
| Citizenship Status | With Coverage | Without Coverage |
| Native Born | 221 (90.9%) | 22 (9.0%) |
| Foreign Born, Citizen | 666 (100.0%) | 0 (0.0%) |
| Foreign Born, not a Citizen | 322 (81.9%) | 71 (18.1%) |
Health Insurance Coverage by Household Income in West Hills
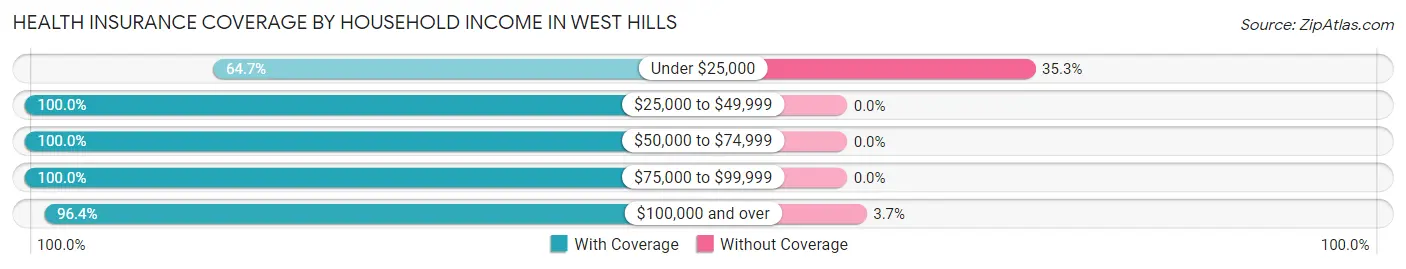
| Household Income | With Coverage | Without Coverage |
| Under $25,000 | 55 (64.7%) | 30 (35.3%) |
| $25,000 to $49,999 | 80 (100.0%) | 0 (0.0%) |
| $50,000 to $74,999 | 616 (100.0%) | 0 (0.0%) |
| $75,000 to $99,999 | 104 (100.0%) | 0 (0.0%) |
| $100,000 and over | 4,062 (96.4%) | 154 (3.6%) |
Public vs Private Health Insurance Coverage by Age in West Hills
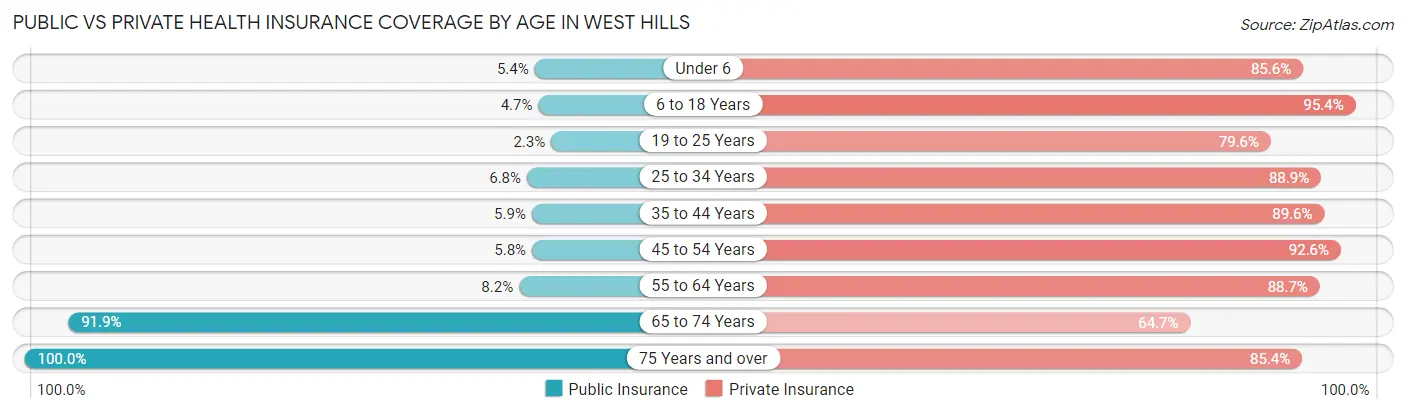
| Age Bracket | Public Insurance | Private Insurance |
| Under 6 | 13 (5.3%) | 208 (85.6%) |
| 6 to 18 Years | 31 (4.6%) | 635 (95.4%) |
| 19 to 25 Years | 9 (2.3%) | 313 (79.6%) |
| 25 to 34 Years | 41 (6.8%) | 539 (88.9%) |
| 35 to 44 Years | 27 (5.9%) | 412 (89.6%) |
| 45 to 54 Years | 42 (5.8%) | 666 (92.6%) |
| 55 to 64 Years | 83 (8.2%) | 895 (88.7%) |
| 65 to 74 Years | 726 (91.9%) | 511 (64.7%) |
| 75 Years and over | 254 (100.0%) | 217 (85.4%) |
| Total | 1,226 (23.8%) | 4,396 (85.5%) |
Disability Status by Sex by Age in West Hills
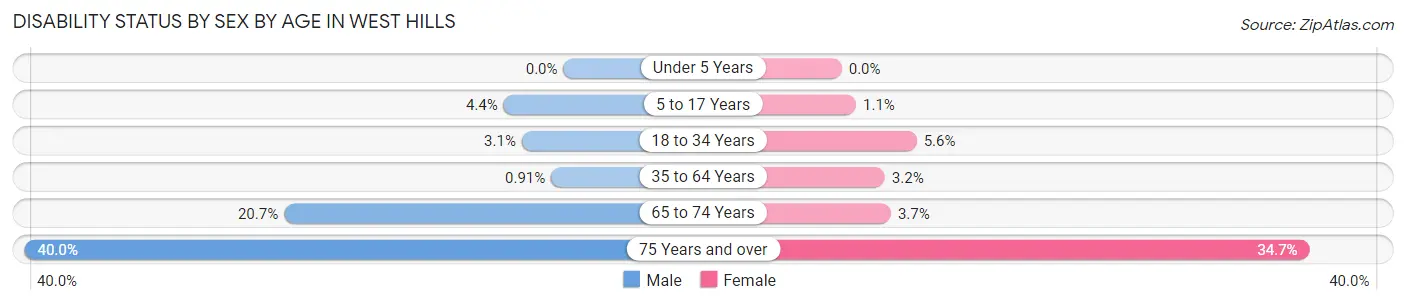
| Age Bracket | Male | Female |
| Under 5 Years | 0 (0.0%) | 0 (0.0%) |
| 5 to 17 Years | 18 (4.4%) | 3 (1.1%) |
| 18 to 34 Years | 17 (3.1%) | 27 (5.6%) |
| 35 to 64 Years | 10 (0.9%) | 35 (3.2%) |
| 65 to 74 Years | 73 (20.7%) | 16 (3.6%) |
| 75 Years and over | 44 (40.0%) | 50 (34.7%) |
Disability Class by Sex by Age in West Hills
Disability Class: Hearing Difficulty
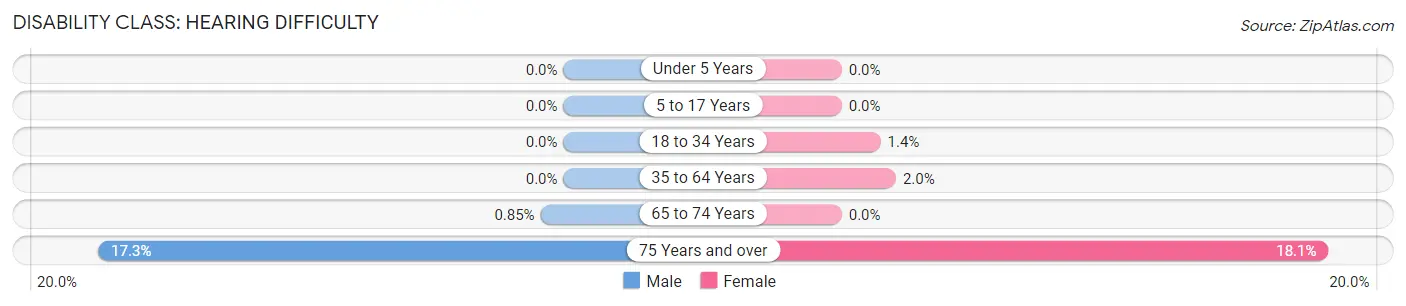
| Age Bracket | Male | Female |
| Under 5 Years | 0 (0.0%) | 0 (0.0%) |
| 5 to 17 Years | 0 (0.0%) | 0 (0.0%) |
| 18 to 34 Years | 0 (0.0%) | 7 (1.4%) |
| 35 to 64 Years | 0 (0.0%) | 22 (2.0%) |
| 65 to 74 Years | 3 (0.9%) | 0 (0.0%) |
| 75 Years and over | 19 (17.3%) | 26 (18.1%) |
Disability Class: Vision Difficulty
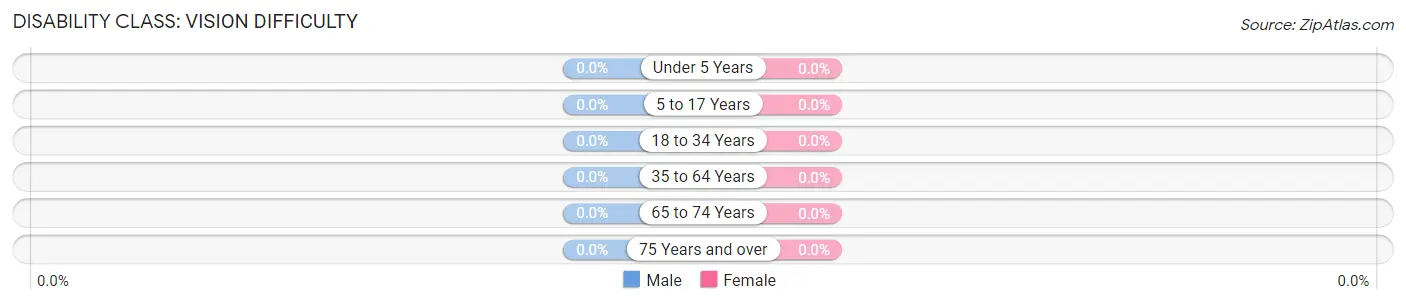
| Age Bracket | Male | Female |
| Under 5 Years | 0 (0.0%) | 0 (0.0%) |
| 5 to 17 Years | 0 (0.0%) | 0 (0.0%) |
| 18 to 34 Years | 0 (0.0%) | 0 (0.0%) |
| 35 to 64 Years | 0 (0.0%) | 0 (0.0%) |
| 65 to 74 Years | 0 (0.0%) | 0 (0.0%) |
| 75 Years and over | 0 (0.0%) | 0 (0.0%) |
Disability Class: Cognitive Difficulty
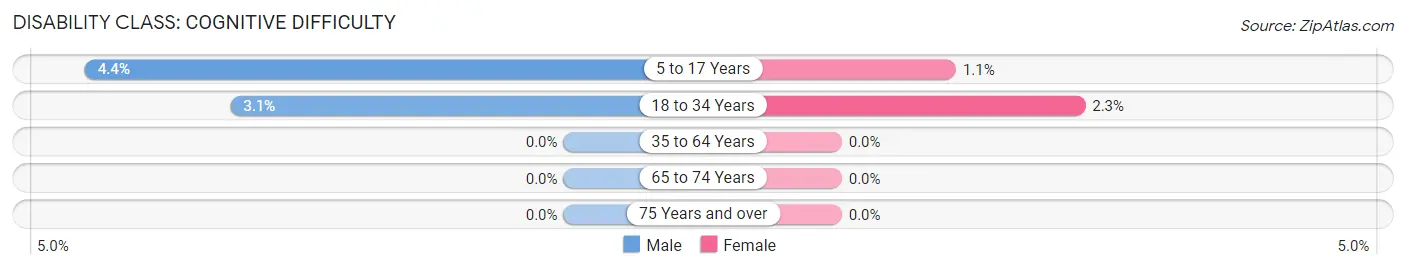
| Age Bracket | Male | Female |
| 5 to 17 Years | 18 (4.4%) | 3 (1.1%) |
| 18 to 34 Years | 17 (3.1%) | 11 (2.3%) |
| 35 to 64 Years | 0 (0.0%) | 0 (0.0%) |
| 65 to 74 Years | 0 (0.0%) | 0 (0.0%) |
| 75 Years and over | 0 (0.0%) | 0 (0.0%) |
Disability Class: Ambulatory Difficulty
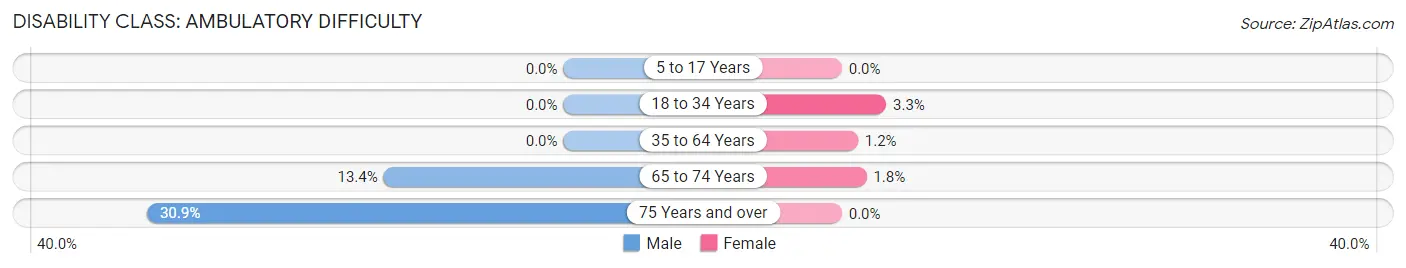
| Age Bracket | Male | Female |
| 5 to 17 Years | 0 (0.0%) | 0 (0.0%) |
| 18 to 34 Years | 0 (0.0%) | 16 (3.3%) |
| 35 to 64 Years | 0 (0.0%) | 13 (1.2%) |
| 65 to 74 Years | 47 (13.4%) | 8 (1.8%) |
| 75 Years and over | 34 (30.9%) | 0 (0.0%) |
Disability Class: Self-Care Difficulty
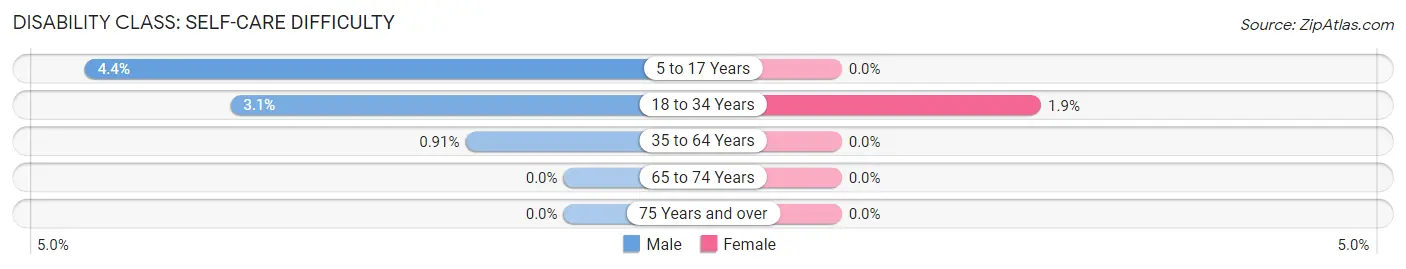
| Age Bracket | Male | Female |
| 5 to 17 Years | 18 (4.4%) | 0 (0.0%) |
| 18 to 34 Years | 17 (3.1%) | 9 (1.8%) |
| 35 to 64 Years | 10 (0.9%) | 0 (0.0%) |
| 65 to 74 Years | 0 (0.0%) | 0 (0.0%) |
| 75 Years and over | 0 (0.0%) | 0 (0.0%) |
Technology Access in West Hills
Computing Device Access in West Hills
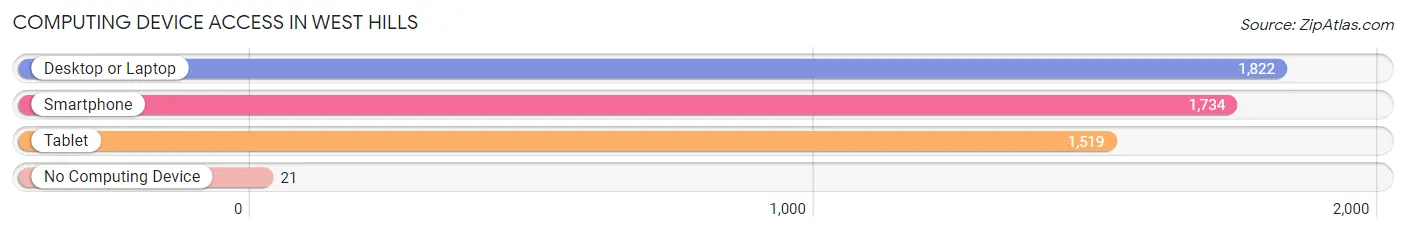
| Device Type | # Households | % Households |
| Desktop or Laptop | 1,822 | 98.4% |
| Smartphone | 1,734 | 93.6% |
| Tablet | 1,519 | 82.0% |
| No Computing Device | 21 | 1.1% |
| Total | 1,852 | 100.0% |
Internet Access in West Hills
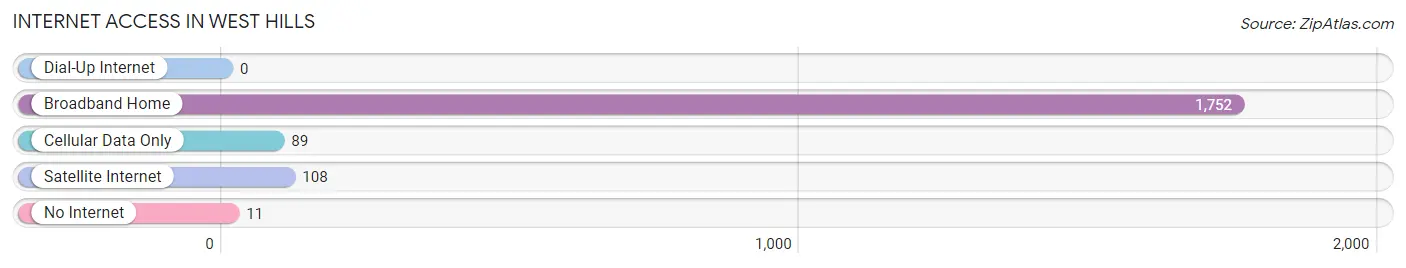
| Internet Type | # Households | % Households |
| Dial-Up Internet | 0 | 0.0% |
| Broadband Home | 1,752 | 94.6% |
| Cellular Data Only | 89 | 4.8% |
| Satellite Internet | 108 | 5.8% |
| No Internet | 11 | 0.6% |
| Total | 1,852 | 100.0% |
West Hills Summary
History
West Hills is a hamlet located in the Town of Huntington in Suffolk County, New York. It is situated on the north shore of Long Island, approximately 50 miles east of New York City. The hamlet was originally part of the Town of Oyster Bay, but was annexed to the Town of Huntington in 1873.
The area was first settled by Europeans in the late 1600s, when a group of English settlers established a small farming community. The hamlet was originally known as “West Hills” due to its location on the western side of Huntington. The area was primarily agricultural until the late 19th century, when it began to develop into a residential community.
In the early 20th century, West Hills experienced a period of rapid growth. The hamlet was home to a number of prominent families, including the Vanderbilts, who built a large estate in the area. The hamlet also became a popular summer destination for wealthy New Yorkers, who built large estates and mansions in the area.
The hamlet continued to grow throughout the 20th century, and by the late 1990s, it had become a popular residential community. Today, West Hills is a vibrant and diverse community, with a population of approximately 10,000 people.
Geography
West Hills is located in the Town of Huntington in Suffolk County, New York. It is situated on the north shore of Long Island, approximately 50 miles east of New York City. The hamlet is bordered by the hamlets of Huntington Station to the east, Melville to the south, and Dix Hills to the west.
The hamlet is located in a hilly area, with elevations ranging from sea level to approximately 200 feet. The area is mostly wooded, with a few open fields and meadows. The hamlet is home to several parks, including West Hills County Park, which offers a variety of recreational activities.
Economy
West Hills is primarily a residential community, with a few small businesses located in the area. The hamlet is home to a number of retail stores, restaurants, and other services. The hamlet is also home to a number of corporate offices, including those of the North Shore-LIJ Health System and the North Shore-LIJ Medical Group.
The hamlet is served by the Long Island Rail Road, which provides access to New York City and other parts of Long Island. The hamlet is also served by several bus routes, which provide access to nearby towns and villages.
Demographics
As of the 2010 census, West Hills had a population of 10,072 people. The population is primarily white (86.3%), with a small percentage of African Americans (4.2%), Asians (3.7%), and Hispanics (2.7%). The median household income is $107,945, and the median home value is $541,000.
The hamlet is home to a number of religious institutions, including several churches, a synagogue, and a mosque. The hamlet is also home to a number of schools, including West Hills Elementary School, West Hills Middle School, and West Hills High School.
Common Questions
What is Per Capita Income in West Hills?
Per Capita income in West Hills is $78,839.
What is the Median Family Income in West Hills?
Median Family Income in West Hills is $174,975.
What is the Median Household income in West Hills?
Median Household Income in West Hills is $173,419.
What is Income or Wage Gap in West Hills?
Income or Wage Gap in West Hills is 40.0%.
Women in West Hills earn 60.0 cents for every dollar earned by a man.
What is Inequality or Gini Index in West Hills?
Inequality or Gini Index in West Hills is 0.40.
What is the Total Population of West Hills?
Total Population of West Hills is 5,140.
What is the Total Male Population of West Hills?
Total Male Population of West Hills is 2,565.
What is the Total Female Population of West Hills?
Total Female Population of West Hills is 2,575.
What is the Ratio of Males per 100 Females in West Hills?
There are 99.61 Males per 100 Females in West Hills.
What is the Ratio of Females per 100 Males in West Hills?
There are 100.39 Females per 100 Males in West Hills.
What is the Median Population Age in West Hills?
Median Population Age in West Hills is 48.2 Years.
What is the Average Family Size in West Hills
Average Family Size in West Hills is 3.1 People.
What is the Average Household Size in West Hills
Average Household Size in West Hills is 2.8 People.
How Large is the Labor Force in West Hills?
There are 2,910 People in the Labor Forcein in West Hills.
What is the Percentage of People in the Labor Force in West Hills?
65.4% of People are in the Labor Force in West Hills.
What is the Unemployment Rate in West Hills?
Unemployment Rate in West Hills is 3.2%.