Zip Codes with the Lowest Percentage of Renter-Occupied Units in Long Island City, NY
RELATED REPORTS & OPTIONS
Lowest Renter-Occupied
Long Island City
Compare Zip Codes
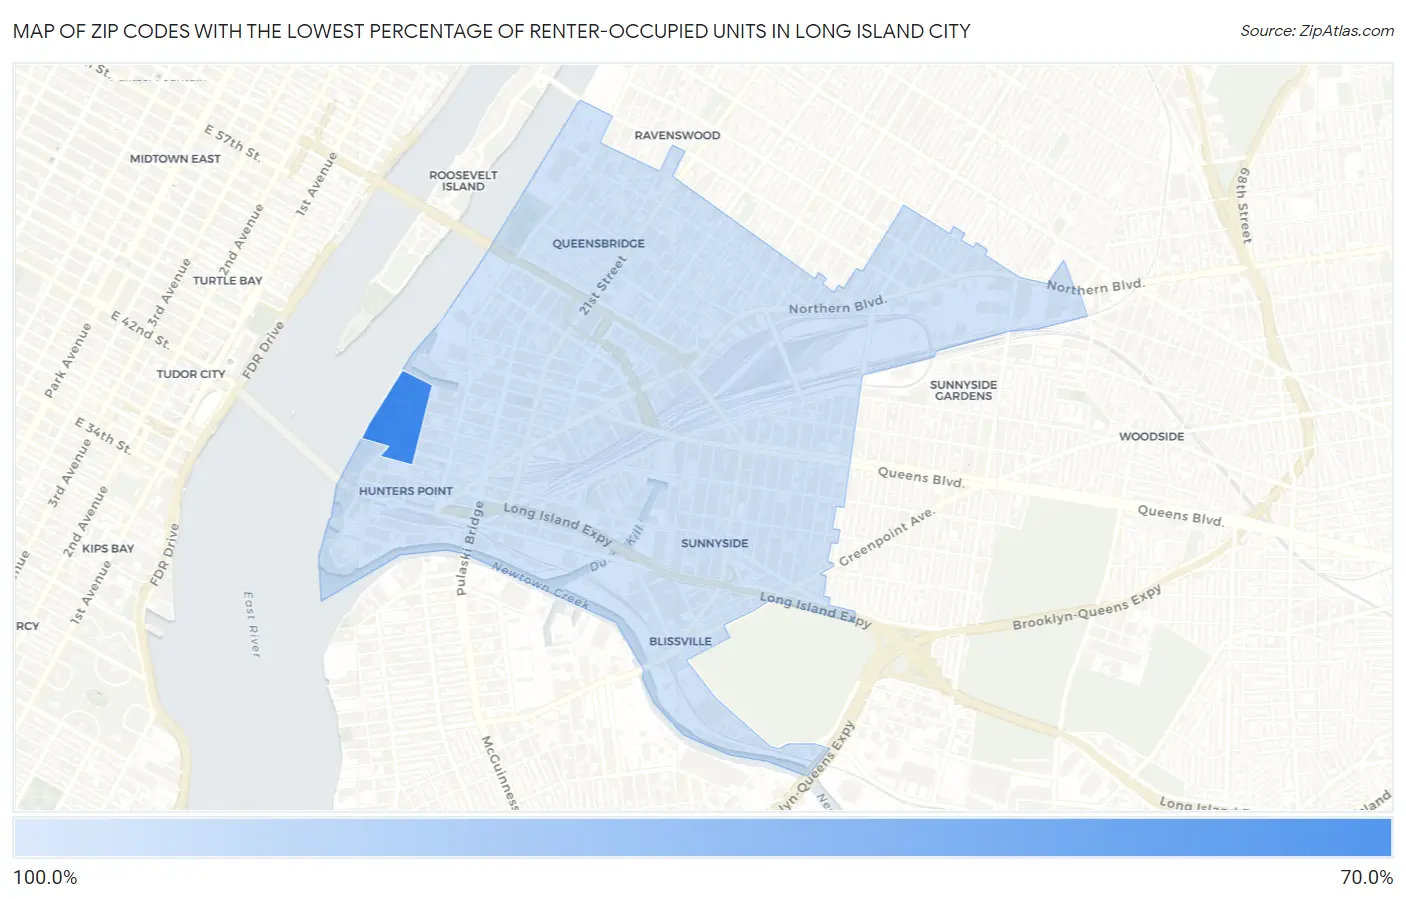
Map of Zip Codes with the Lowest Percentage of Renter-Occupied Units in Long Island City
85.7%
74.7%
Zip Codes with the Lowest Percentage of Renter-Occupied Units in Long Island City, NY
| Zip Code | % Renter-Occupied | vs State | vs National | |
| 1. | 11109 | 74.7% | 45.7%(+29.0)#1,554 | 35.2%(+39.5)#30,257 |
| 2. | 11101 | 85.7% | 45.7%(+40.0)#1,591 | 35.2%(+50.6)#30,562 |
1
Common Questions
What are the Top Zip Codes with the Lowest Percentage of Renter-Occupied Units in Long Island City, NY?
Top Zip Codes with the Lowest Percentage of Renter-Occupied Units in Long Island City, NY are:
What zip code has the Lowest Percentage of Renter-Occupied Units in Long Island City, NY?
11109 has the Lowest Percentage of Renter-Occupied Units in Long Island City, NY with 74.7%.
What is the Percentage of Renter-Occupied Units in New York?
Percentage of Renter-Occupied Units in New York is 45.7%.
What is the Percentage of Renter-Occupied Units in the United States?
Percentage of Renter-Occupied Units in the United States is 35.2%.