Zip Codes with the Lowest Poverty Level Among Children Under the Age of 5 in New York
RELATED REPORTS & OPTIONS
Lowest Poverty | Child 0-5
New York
Compare Zip Codes
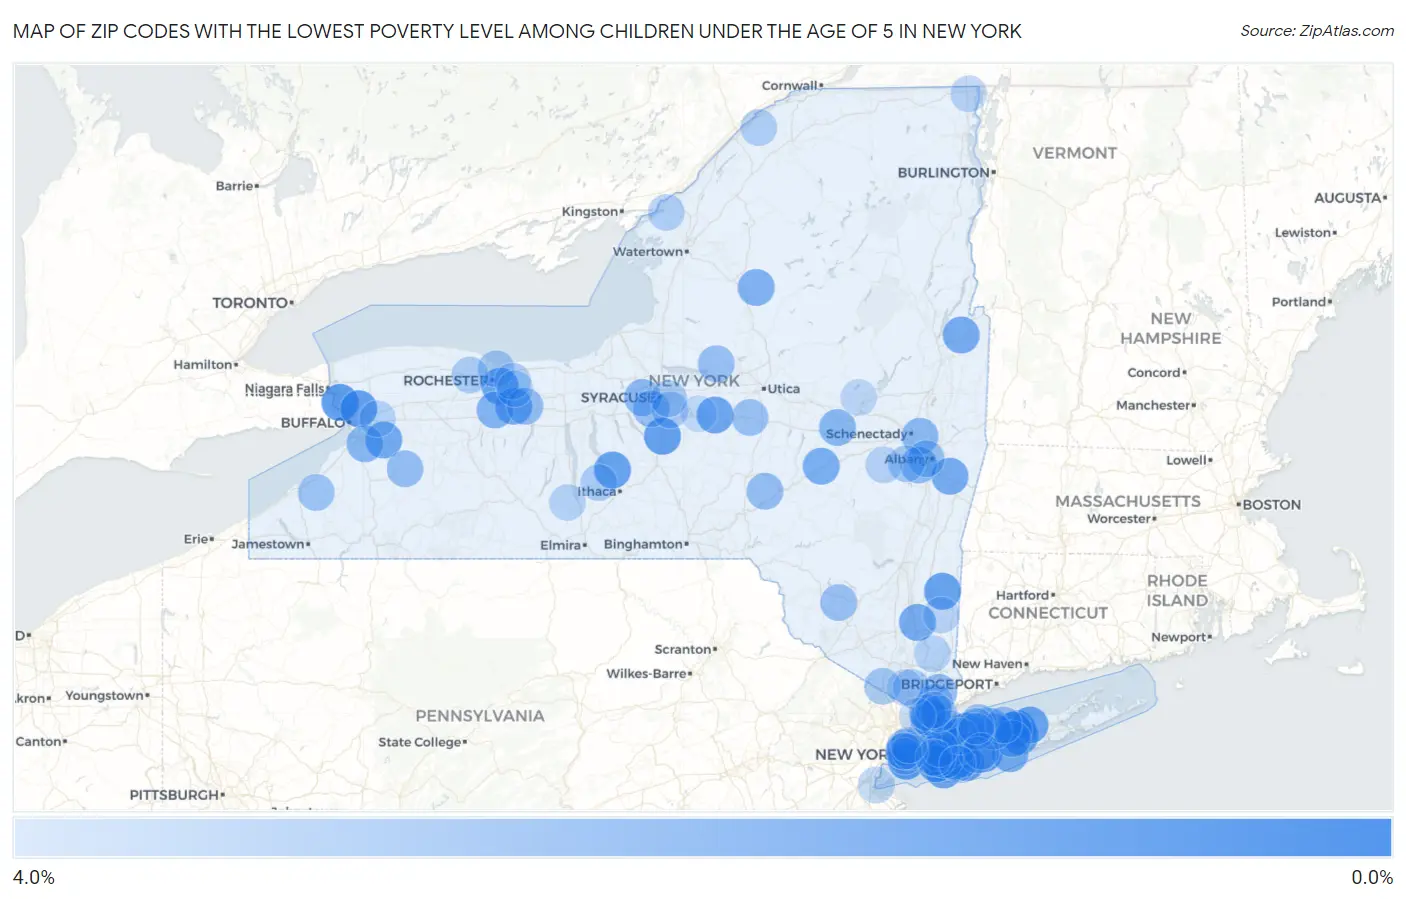
Map of Zip Codes with the Lowest Poverty Level Among Children Under the Age of 5 in New York
4.0%
0.0%
Zip Codes with the Lowest Poverty Level Among Children Under the Age of 5 in New York
| Zip Code | Child Poverty | vs State | vs National | |
| 1. | 11724 | 0.41% | 18.7%(-18.3)#1 | 18.1%(-17.6)#37 |
| 2. | 14072 | 0.59% | 18.7%(-18.2)#2 | 18.1%(-17.5)#89 |
| 3. | 11756 | 0.61% | 18.7%(-18.1)#3 | 18.1%(-17.5)#95 |
| 4. | 11727 | 0.62% | 18.7%(-18.1)#4 | 18.1%(-17.4)#99 |
| 5. | 11795 | 0.66% | 18.7%(-18.1)#5 | 18.1%(-17.4)#114 |
| 6. | 11215 | 0.71% | 18.7%(-18.0)#6 | 18.1%(-17.4)#133 |
| 7. | 14226 | 0.74% | 18.7%(-18.0)#7 | 18.1%(-17.3)#145 |
| 8. | 13159 | 0.80% | 18.7%(-17.9)#8 | 18.1%(-17.3)#173 |
| 9. | 11758 | 0.83% | 18.7%(-17.9)#9 | 18.1%(-17.2)#188 |
| 10. | 14882 | 0.83% | 18.7%(-17.9)#10 | 18.1%(-17.2)#192 |
| 11. | 11763 | 0.84% | 18.7%(-17.9)#11 | 18.1%(-17.2)#196 |
| 12. | 12545 | 0.85% | 18.7%(-17.9)#12 | 18.1%(-17.2)#207 |
| 13. | 14618 | 0.96% | 18.7%(-17.8)#13 | 18.1%(-17.1)#261 |
| 14. | 10538 | 0.99% | 18.7%(-17.8)#14 | 18.1%(-17.1)#268 |
| 15. | 11961 | 0.99% | 18.7%(-17.8)#15 | 18.1%(-17.1)#269 |
| 16. | 11558 | 1.0% | 18.7%(-17.7)#16 | 18.1%(-17.0)#303 |
| 17. | 13408 | 1.0% | 18.7%(-17.7)#17 | 18.1%(-17.0)#304 |
| 18. | 11050 | 1.1% | 18.7%(-17.7)#18 | 18.1%(-17.0)#321 |
| 19. | 11563 | 1.1% | 18.7%(-17.6)#19 | 18.1%(-16.9)#332 |
| 20. | 11581 | 1.1% | 18.7%(-17.6)#20 | 18.1%(-16.9)#338 |
| 21. | 10003 | 1.1% | 18.7%(-17.6)#21 | 18.1%(-16.9)#349 |
| 22. | 14052 | 1.2% | 18.7%(-17.6)#22 | 18.1%(-16.9)#359 |
| 23. | 11783 | 1.2% | 18.7%(-17.6)#23 | 18.1%(-16.9)#364 |
| 24. | 14564 | 1.2% | 18.7%(-17.6)#24 | 18.1%(-16.9)#374 |
| 25. | 12827 | 1.2% | 18.7%(-17.5)#25 | 18.1%(-16.8)#386 |
| 26. | 12123 | 1.2% | 18.7%(-17.5)#26 | 18.1%(-16.8)#396 |
| 27. | 12590 | 1.2% | 18.7%(-17.5)#27 | 18.1%(-16.8)#399 |
| 28. | 12197 | 1.4% | 18.7%(-17.4)#28 | 18.1%(-16.7)#449 |
| 29. | 11784 | 1.4% | 18.7%(-17.4)#29 | 18.1%(-16.7)#451 |
| 30. | 10804 | 1.4% | 18.7%(-17.4)#30 | 18.1%(-16.7)#452 |
| 31. | 11782 | 1.4% | 18.7%(-17.4)#31 | 18.1%(-16.7)#471 |
| 32. | 13343 | 1.5% | 18.7%(-17.3)#32 | 18.1%(-16.6)#528 |
| 33. | 14472 | 1.6% | 18.7%(-17.1)#33 | 18.1%(-16.5)#598 |
| 34. | 11754 | 1.7% | 18.7%(-17.1)#34 | 18.1%(-16.4)#624 |
| 35. | 11742 | 1.7% | 18.7%(-17.1)#35 | 18.1%(-16.4)#638 |
| 36. | 13317 | 1.7% | 18.7%(-17.0)#36 | 18.1%(-16.4)#645 |
| 37. | 11566 | 1.7% | 18.7%(-17.0)#37 | 18.1%(-16.3)#664 |
| 38. | 14127 | 1.8% | 18.7%(-17.0)#38 | 18.1%(-16.3)#677 |
| 39. | 12309 | 1.8% | 18.7%(-16.9)#39 | 18.1%(-16.3)#715 |
| 40. | 12054 | 1.8% | 18.7%(-16.9)#40 | 18.1%(-16.2)#717 |
| 41. | 13031 | 1.8% | 18.7%(-16.9)#41 | 18.1%(-16.2)#730 |
| 42. | 11787 | 1.8% | 18.7%(-16.9)#42 | 18.1%(-16.2)#738 |
| 43. | 10001 | 1.9% | 18.7%(-16.9)#43 | 18.1%(-16.2)#758 |
| 44. | 11801 | 1.9% | 18.7%(-16.8)#44 | 18.1%(-16.1)#779 |
| 45. | 10504 | 1.9% | 18.7%(-16.8)#45 | 18.1%(-16.1)#780 |
| 46. | 14425 | 2.0% | 18.7%(-16.8)#46 | 18.1%(-16.1)#823 |
| 47. | 11530 | 2.0% | 18.7%(-16.7)#47 | 18.1%(-16.1)#836 |
| 48. | 11570 | 2.0% | 18.7%(-16.7)#48 | 18.1%(-16.0)#856 |
| 49. | 14009 | 2.1% | 18.7%(-16.7)#49 | 18.1%(-16.0)#873 |
| 50. | 13825 | 2.1% | 18.7%(-16.7)#50 | 18.1%(-16.0)#877 |
| 51. | 11001 | 2.1% | 18.7%(-16.7)#51 | 18.1%(-16.0)#878 |
| 52. | 13215 | 2.1% | 18.7%(-16.6)#52 | 18.1%(-16.0)#902 |
| 53. | 12789 | 2.1% | 18.7%(-16.6)#53 | 18.1%(-16.0)#910 |
| 54. | 13308 | 2.1% | 18.7%(-16.6)#54 | 18.1%(-15.9)#932 |
| 55. | 11768 | 2.1% | 18.7%(-16.6)#55 | 18.1%(-15.9)#935 |
| 56. | 13480 | 2.2% | 18.7%(-16.6)#56 | 18.1%(-15.9)#943 |
| 57. | 12208 | 2.2% | 18.7%(-16.5)#57 | 18.1%(-15.9)#968 |
| 58. | 11580 | 2.2% | 18.7%(-16.5)#58 | 18.1%(-15.9)#969 |
| 59. | 14062 | 2.2% | 18.7%(-16.5)#59 | 18.1%(-15.9)#972 |
| 60. | 10604 | 2.3% | 18.7%(-16.5)#60 | 18.1%(-15.8)#1,011 |
| 61. | 11790 | 2.3% | 18.7%(-16.5)#61 | 18.1%(-15.8)#1,032 |
| 62. | 11560 | 2.4% | 18.7%(-16.4)#62 | 18.1%(-15.7)#1,063 |
| 63. | 10583 | 2.4% | 18.7%(-16.4)#63 | 18.1%(-15.7)#1,091 |
| 64. | 10974 | 2.4% | 18.7%(-16.3)#64 | 18.1%(-15.7)#1,098 |
| 65. | 11791 | 2.4% | 18.7%(-16.3)#65 | 18.1%(-15.6)#1,106 |
| 66. | 11040 | 2.5% | 18.7%(-16.3)#66 | 18.1%(-15.6)#1,153 |
| 67. | 10580 | 2.5% | 18.7%(-16.3)#67 | 18.1%(-15.6)#1,158 |
| 68. | 14617 | 2.5% | 18.7%(-16.2)#68 | 18.1%(-15.6)#1,167 |
| 69. | 12186 | 2.5% | 18.7%(-16.2)#69 | 18.1%(-15.6)#1,169 |
| 70. | 11740 | 2.5% | 18.7%(-16.2)#70 | 18.1%(-15.6)#1,178 |
| 71. | 13078 | 2.5% | 18.7%(-16.2)#71 | 18.1%(-15.5)#1,192 |
| 72. | 10920 | 2.6% | 18.7%(-16.2)#72 | 18.1%(-15.5)#1,204 |
| 73. | 14886 | 2.6% | 18.7%(-16.2)#73 | 18.1%(-15.5)#1,226 |
| 74. | 14559 | 2.6% | 18.7%(-16.1)#74 | 18.1%(-15.5)#1,231 |
| 75. | 13214 | 2.6% | 18.7%(-16.1)#75 | 18.1%(-15.4)#1,242 |
| 76. | 11201 | 2.7% | 18.7%(-16.1)#76 | 18.1%(-15.4)#1,273 |
| 77. | 14526 | 2.7% | 18.7%(-16.1)#77 | 18.1%(-15.4)#1,278 |
| 78. | 13624 | 2.7% | 18.7%(-16.0)#78 | 18.1%(-15.4)#1,293 |
| 79. | 13658 | 2.7% | 18.7%(-16.0)#79 | 18.1%(-15.4)#1,296 |
| 80. | 10605 | 2.8% | 18.7%(-16.0)#80 | 18.1%(-15.3)#1,336 |
| 81. | 11704 | 2.8% | 18.7%(-16.0)#81 | 18.1%(-15.3)#1,338 |
| 82. | 14891 | 2.8% | 18.7%(-15.9)#82 | 18.1%(-15.2)#1,385 |
| 83. | 14086 | 2.8% | 18.7%(-15.9)#83 | 18.1%(-15.2)#1,392 |
| 84. | 10541 | 2.8% | 18.7%(-15.9)#84 | 18.1%(-15.2)#1,400 |
| 85. | 12919 | 2.9% | 18.7%(-15.9)#85 | 18.1%(-15.2)#1,426 |
| 86. | 12023 | 2.9% | 18.7%(-15.9)#86 | 18.1%(-15.2)#1,428 |
| 87. | 11222 | 2.9% | 18.7%(-15.9)#87 | 18.1%(-15.2)#1,440 |
| 88. | 14450 | 2.9% | 18.7%(-15.9)#88 | 18.1%(-15.2)#1,441 |
| 89. | 10307 | 2.9% | 18.7%(-15.8)#89 | 18.1%(-15.1)#1,449 |
| 90. | 11703 | 2.9% | 18.7%(-15.8)#90 | 18.1%(-15.1)#1,462 |
| 91. | 12570 | 2.9% | 18.7%(-15.8)#91 | 18.1%(-15.1)#1,472 |
| 92. | 10014 | 3.0% | 18.7%(-15.8)#92 | 18.1%(-15.1)#1,479 |
| 93. | 10703 | 3.0% | 18.7%(-15.7)#93 | 18.1%(-15.1)#1,501 |
| 94. | 11721 | 3.0% | 18.7%(-15.7)#94 | 18.1%(-15.0)#1,514 |
| 95. | 12095 | 3.0% | 18.7%(-15.7)#95 | 18.1%(-15.0)#1,532 |
| 96. | 10956 | 3.1% | 18.7%(-15.7)#96 | 18.1%(-15.0)#1,569 |
| 97. | 11411 | 3.1% | 18.7%(-15.6)#97 | 18.1%(-15.0)#1,575 |
| 98. | 10021 | 3.1% | 18.7%(-15.6)#98 | 18.1%(-14.9)#1,605 |
| 99. | 11793 | 3.1% | 18.7%(-15.6)#99 | 18.1%(-14.9)#1,607 |
| 100. | 13035 | 3.2% | 18.7%(-15.6)#100 | 18.1%(-14.9)#1,614 |
Common Questions
What are the Top 10 Zip Codes with the Lowest Poverty Level Among Children Under the Age of 5 in New York?
Top 10 Zip Codes with the Lowest Poverty Level Among Children Under the Age of 5 in New York are:
What zip code has the Lowest Poverty Level Among Children Under the Age of 5 in New York?
11724 has the Lowest Poverty Level Among Children Under the Age of 5 in New York with 0.41%.
What is the Poverty Level Among Children Under the Age of 5 in the State of New York?
Poverty Level Among Children Under the Age of 5 in New York is 18.7%.
What is the Poverty Level Among Children Under the Age of 5 in the United States?
Poverty Level Among Children Under the Age of 5 in the United States is 18.1%.