West Glens Falls, NY Map & Demographics
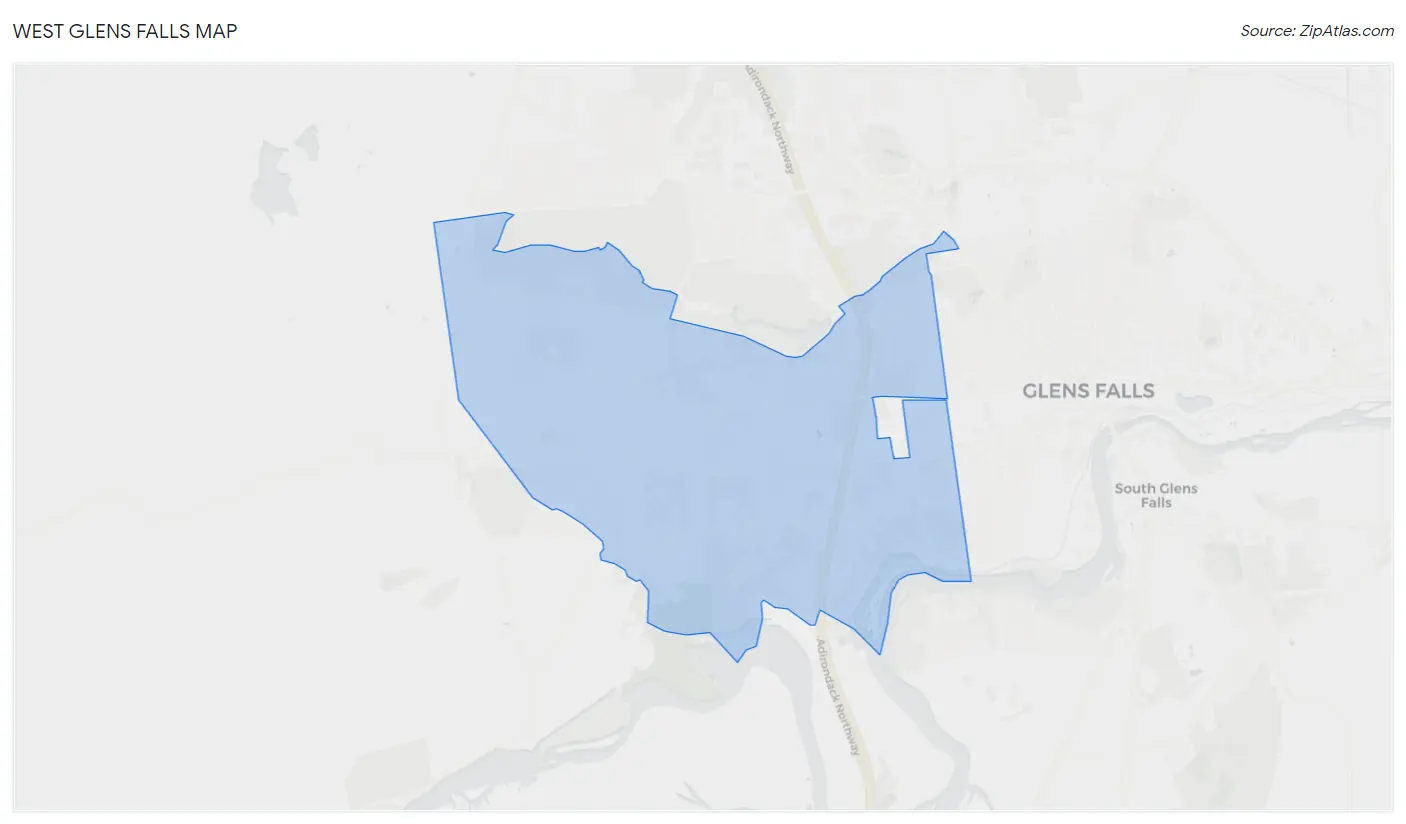
West Glens Falls Map
West Glens Falls Overview
$43,546
PER CAPITA INCOME
$126,766
AVG FAMILY INCOME
$96,384
AVG HOUSEHOLD INCOME
16.7%
WAGE / INCOME GAP [ % ]
83.3¢/ $1
WAGE / INCOME GAP [ $ ]
0.37
INEQUALITY / GINI INDEX
9,565
TOTAL POPULATION
4,788
MALE POPULATION
4,777
FEMALE POPULATION
100.23
MALES / 100 FEMALES
99.77
FEMALES / 100 MALES
42.9
MEDIAN AGE
2.9
AVG FAMILY SIZE
2.5
AVG HOUSEHOLD SIZE
5,368
LABOR FORCE [ PEOPLE ]
67.8%
PERCENT IN LABOR FORCE
2.5%
UNEMPLOYMENT RATE
Income in West Glens Falls
Income Overview in West Glens Falls
Per Capita Income in West Glens Falls is $43,546, while median incomes of families and households are $126,766 and $96,384 respectively.
| Characteristic | Number | Measure |
| Per Capita Income | 9,565 | $43,546 |
| Median Family Income | 2,689 | $126,766 |
| Mean Family Income | 2,689 | $129,239 |
| Median Household Income | 3,734 | $96,384 |
| Mean Household Income | 3,734 | $110,853 |
| Income Deficit | 2,689 | $0 |
| Wage / Income Gap (%) | 9,565 | 16.65% |
| Wage / Income Gap ($) | 9,565 | 83.35¢ per $1 |
| Gini / Inequality Index | 9,565 | 0.37 |
Earnings by Sex in West Glens Falls
Average Earnings in West Glens Falls are $50,932, $58,500 for men and $48,759 for women, a difference of 16.7%.
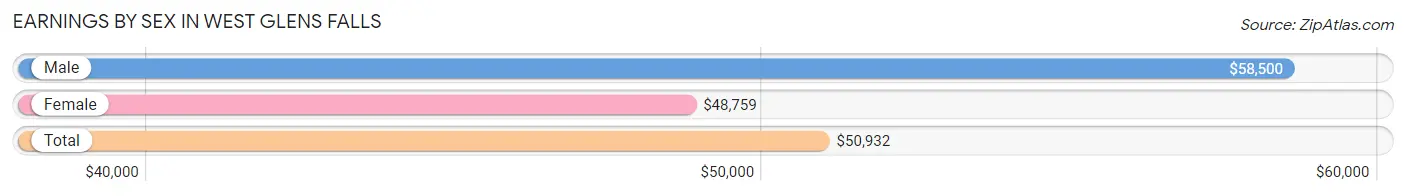
| Sex | Number | Average Earnings |
| Male | 2,934 (51.9%) | $58,500 |
| Female | 2,722 (48.1%) | $48,759 |
| Total | 5,656 (100.0%) | $50,932 |
Earnings by Sex by Income Bracket in West Glens Falls
The most common earnings brackets in West Glens Falls are $100,000+ for men (572 | 19.5%) and $75,000 to $99,999 for women (357 | 13.1%).
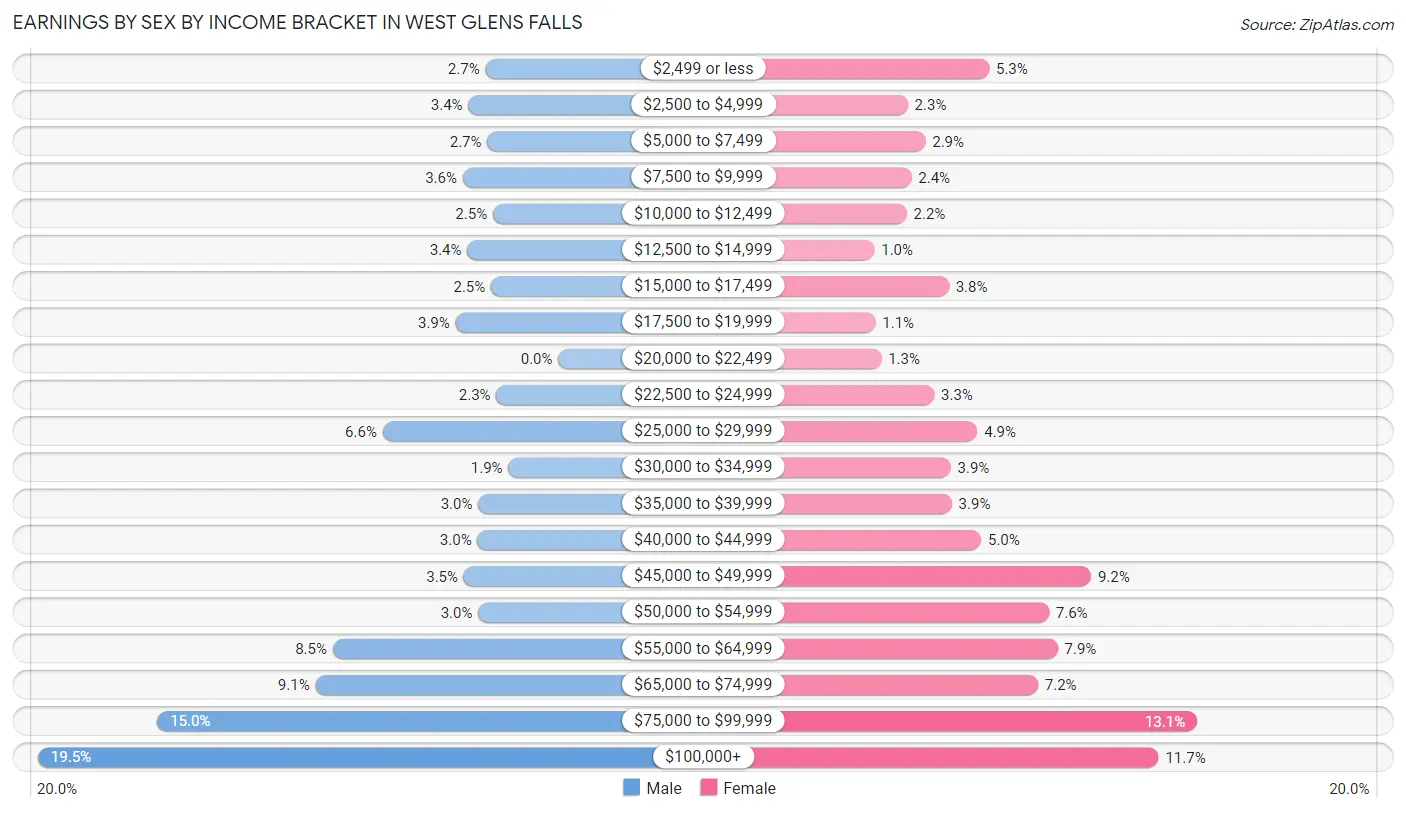
| Income | Male | Female |
| $2,499 or less | 80 (2.7%) | 145 (5.3%) |
| $2,500 to $4,999 | 99 (3.4%) | 62 (2.3%) |
| $5,000 to $7,499 | 78 (2.7%) | 80 (2.9%) |
| $7,500 to $9,999 | 105 (3.6%) | 66 (2.4%) |
| $10,000 to $12,499 | 72 (2.5%) | 61 (2.2%) |
| $12,500 to $14,999 | 100 (3.4%) | 28 (1.0%) |
| $15,000 to $17,499 | 74 (2.5%) | 104 (3.8%) |
| $17,500 to $19,999 | 113 (3.8%) | 29 (1.1%) |
| $20,000 to $22,499 | 0 (0.0%) | 35 (1.3%) |
| $22,500 to $24,999 | 68 (2.3%) | 89 (3.3%) |
| $25,000 to $29,999 | 193 (6.6%) | 133 (4.9%) |
| $30,000 to $34,999 | 55 (1.9%) | 106 (3.9%) |
| $35,000 to $39,999 | 88 (3.0%) | 107 (3.9%) |
| $40,000 to $44,999 | 89 (3.0%) | 137 (5.0%) |
| $45,000 to $49,999 | 104 (3.5%) | 249 (9.1%) |
| $50,000 to $54,999 | 88 (3.0%) | 206 (7.6%) |
| $55,000 to $64,999 | 248 (8.5%) | 215 (7.9%) |
| $65,000 to $74,999 | 267 (9.1%) | 195 (7.2%) |
| $75,000 to $99,999 | 441 (15.0%) | 357 (13.1%) |
| $100,000+ | 572 (19.5%) | 318 (11.7%) |
| Total | 2,934 (100.0%) | 2,722 (100.0%) |
Earnings by Sex by Educational Attainment in West Glens Falls
Average earnings in West Glens Falls are $63,125 for men and $52,428 for women, a difference of 17.0%. Men with an educational attainment of graduate degree enjoy the highest average annual earnings of $99,722, while those with less than high school education earn the least with $28,943. Women with an educational attainment of graduate degree earn the most with the average annual earnings of $75,170, while those with less than high school education have the smallest earnings of $35,274.
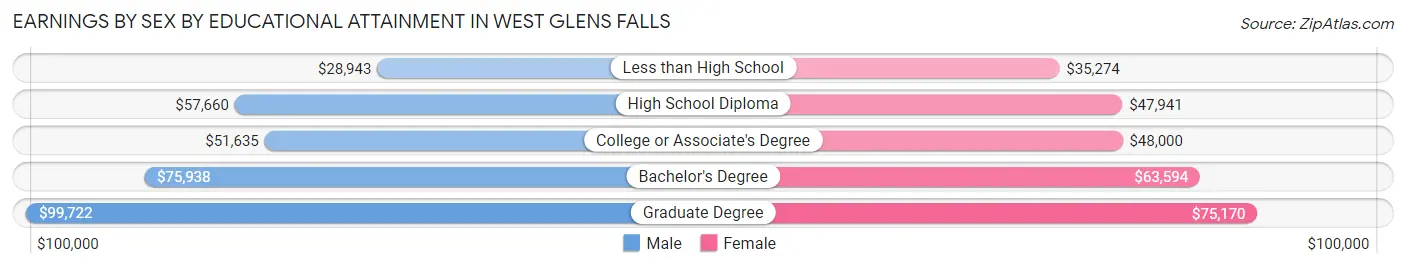
| Educational Attainment | Male Income | Female Income |
| Less than High School | $28,943 | $35,274 |
| High School Diploma | $57,660 | $47,941 |
| College or Associate's Degree | $51,635 | $48,000 |
| Bachelor's Degree | $75,938 | $63,594 |
| Graduate Degree | $99,722 | $75,170 |
| Total | $63,125 | $52,428 |
Family Income in West Glens Falls
Family Income Brackets in West Glens Falls
According to the West Glens Falls family income data, there are 815 families falling into the $100,000 to $149,999 income range, which is the most common income bracket and makes up 30.3% of all families. Conversely, the $10,000 to $14,999 income bracket is the least frequent group with only 16 families (0.6%) belonging to this category.
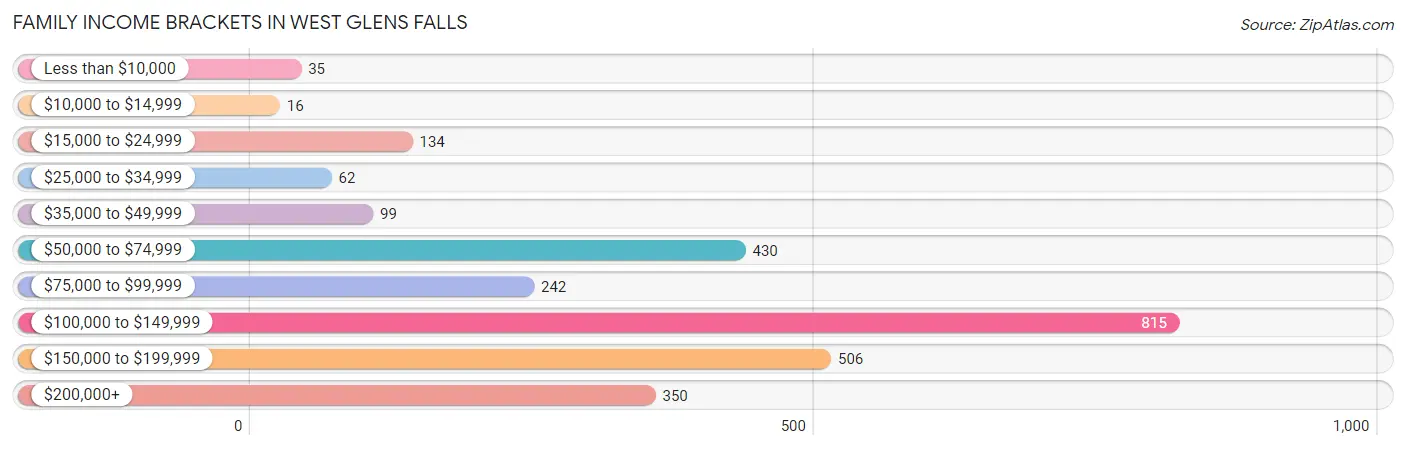
| Income Bracket | # Families | % Families |
| Less than $10,000 | 35 | 1.3% |
| $10,000 to $14,999 | 16 | 0.6% |
| $15,000 to $24,999 | 134 | 5.0% |
| $25,000 to $34,999 | 62 | 2.3% |
| $35,000 to $49,999 | 99 | 3.7% |
| $50,000 to $74,999 | 430 | 16.0% |
| $75,000 to $99,999 | 242 | 9.0% |
| $100,000 to $149,999 | 815 | 30.3% |
| $150,000 to $199,999 | 506 | 18.8% |
| $200,000+ | 350 | 13.0% |
Family Income by Famaliy Size in West Glens Falls
5-person families (135 | 5.0%) account for the highest median family income in West Glens Falls with $170,350 per family, while 2-person families (1,269 | 47.2%) have the highest median income of $46,270 per family member.
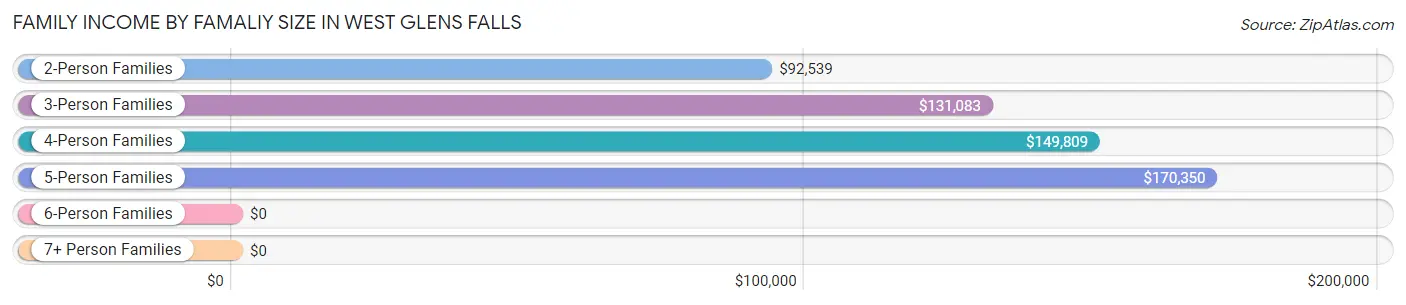
| Income Bracket | # Families | Median Income |
| 2-Person Families | 1,269 (47.2%) | $92,539 |
| 3-Person Families | 736 (27.4%) | $131,083 |
| 4-Person Families | 513 (19.1%) | $149,809 |
| 5-Person Families | 135 (5.0%) | $170,350 |
| 6-Person Families | 36 (1.3%) | $0 |
| 7+ Person Families | 0 (0.0%) | $0 |
| Total | 2,689 (100.0%) | $126,766 |
Family Income by Number of Earners in West Glens Falls
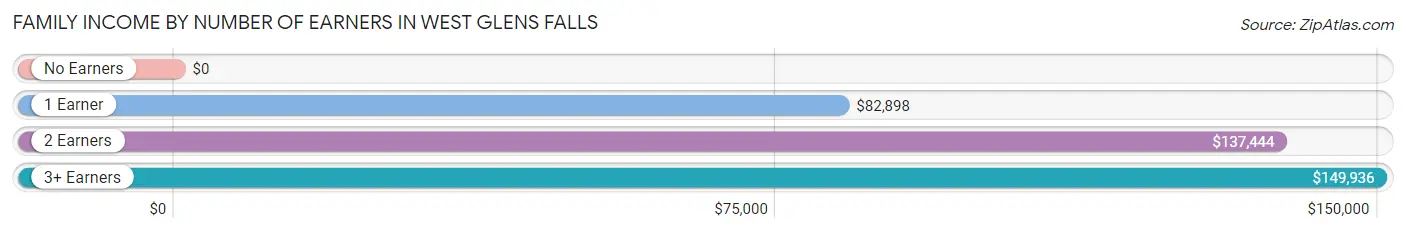
| Number of Earners | # Families | Median Income |
| No Earners | 323 (12.0%) | $0 |
| 1 Earner | 615 (22.9%) | $82,898 |
| 2 Earners | 1,364 (50.7%) | $137,444 |
| 3+ Earners | 387 (14.4%) | $149,936 |
| Total | 2,689 (100.0%) | $126,766 |
Household Income in West Glens Falls
Household Income Brackets in West Glens Falls
With 851 households falling in the category, the $100,000 to $149,999 income range is the most frequent in West Glens Falls, accounting for 22.8% of all households.
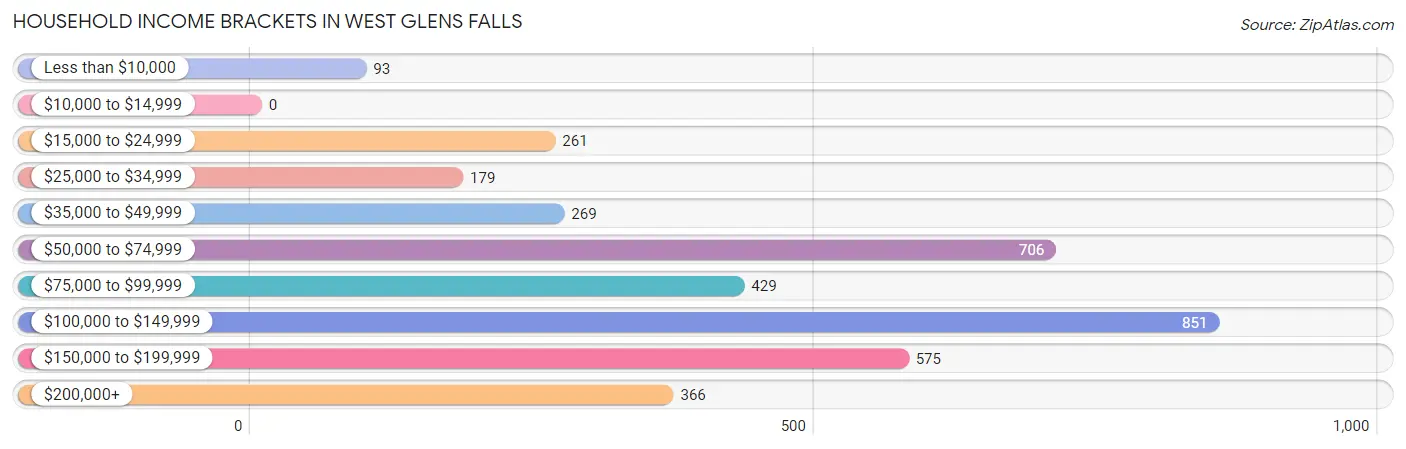
| Income Bracket | # Households | % Households |
| Less than $10,000 | 93 | 2.5% |
| $10,000 to $14,999 | 0 | 0.0% |
| $15,000 to $24,999 | 261 | 7.0% |
| $25,000 to $34,999 | 179 | 4.8% |
| $35,000 to $49,999 | 269 | 7.2% |
| $50,000 to $74,999 | 706 | 18.9% |
| $75,000 to $99,999 | 429 | 11.5% |
| $100,000 to $149,999 | 851 | 22.8% |
| $150,000 to $199,999 | 575 | 15.4% |
| $200,000+ | 366 | 9.8% |
Household Income by Householder Age in West Glens Falls
The median household income in West Glens Falls is $96,384, with the highest median household income of $127,411 found in the 25 to 44 years age bracket for the primary householder. A total of 907 households (24.3%) fall into this category. Meanwhile, the 65+ years age bracket for the primary householder has the lowest median household income of $53,379, with 1,013 households (27.1%) in this group.
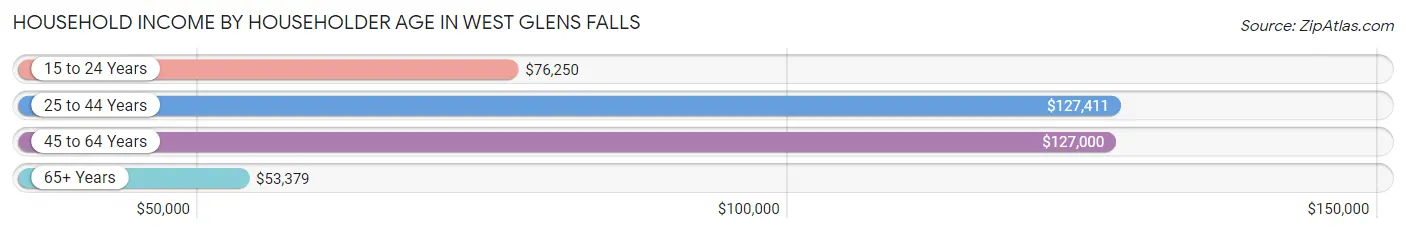
| Income Bracket | # Households | Median Income |
| 15 to 24 Years | 96 (2.6%) | $76,250 |
| 25 to 44 Years | 907 (24.3%) | $127,411 |
| 45 to 64 Years | 1,718 (46.0%) | $127,000 |
| 65+ Years | 1,013 (27.1%) | $53,379 |
| Total | 3,734 (100.0%) | $96,384 |
Poverty in West Glens Falls
Income Below Poverty by Sex and Age in West Glens Falls
With 8.2% poverty level for males and 7.3% for females among the residents of West Glens Falls, 65 to 74 year old males and 6 to 11 year old females are the most vulnerable to poverty, with 70 males (17.5%) and 72 females (23.0%) in their respective age groups living below the poverty level.
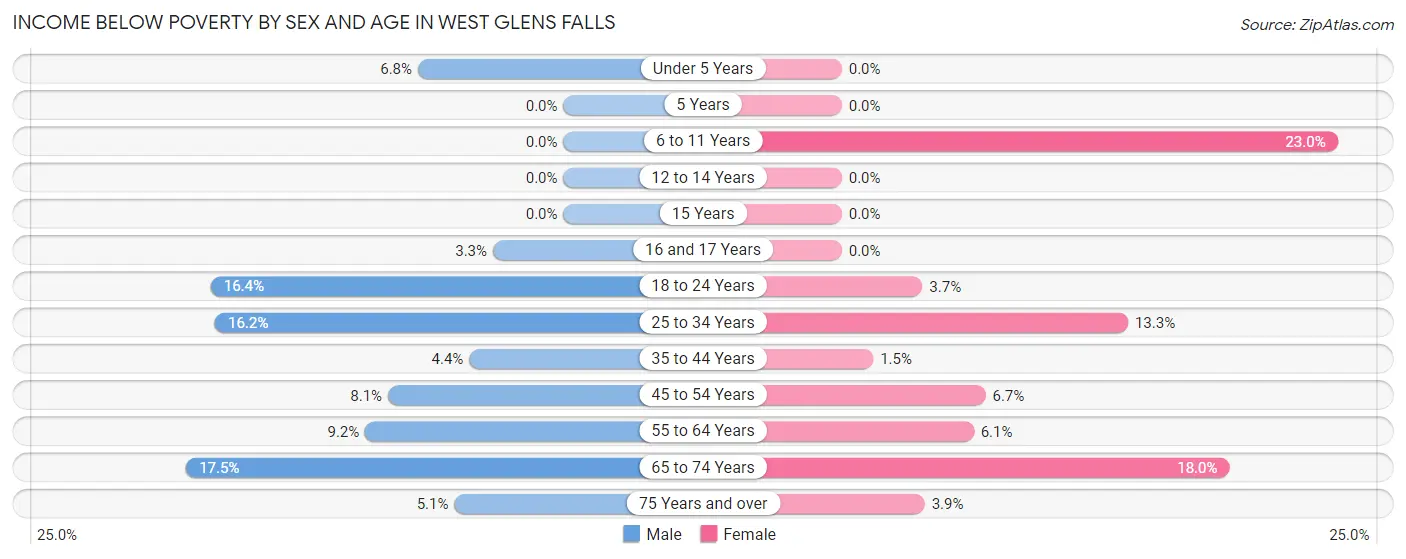
| Age Bracket | Male | Female |
| Under 5 Years | 11 (6.8%) | 0 (0.0%) |
| 5 Years | 0 (0.0%) | 0 (0.0%) |
| 6 to 11 Years | 0 (0.0%) | 72 (23.0%) |
| 12 to 14 Years | 0 (0.0%) | 0 (0.0%) |
| 15 Years | 0 (0.0%) | 0 (0.0%) |
| 16 and 17 Years | 8 (3.3%) | 0 (0.0%) |
| 18 to 24 Years | 54 (16.4%) | 11 (3.7%) |
| 25 to 34 Years | 58 (16.2%) | 53 (13.3%) |
| 35 to 44 Years | 34 (4.4%) | 9 (1.5%) |
| 45 to 54 Years | 65 (8.1%) | 59 (6.7%) |
| 55 to 64 Years | 76 (9.2%) | 40 (6.1%) |
| 65 to 74 Years | 70 (17.5%) | 87 (18.0%) |
| 75 Years and over | 8 (5.1%) | 14 (3.8%) |
| Total | 384 (8.2%) | 345 (7.3%) |
Income Above Poverty by Sex and Age in West Glens Falls
According to the poverty statistics in West Glens Falls, males aged 5 years and females aged under 5 years are the age groups that are most secure financially, with 100.0% of males and 100.0% of females in these age groups living above the poverty line.
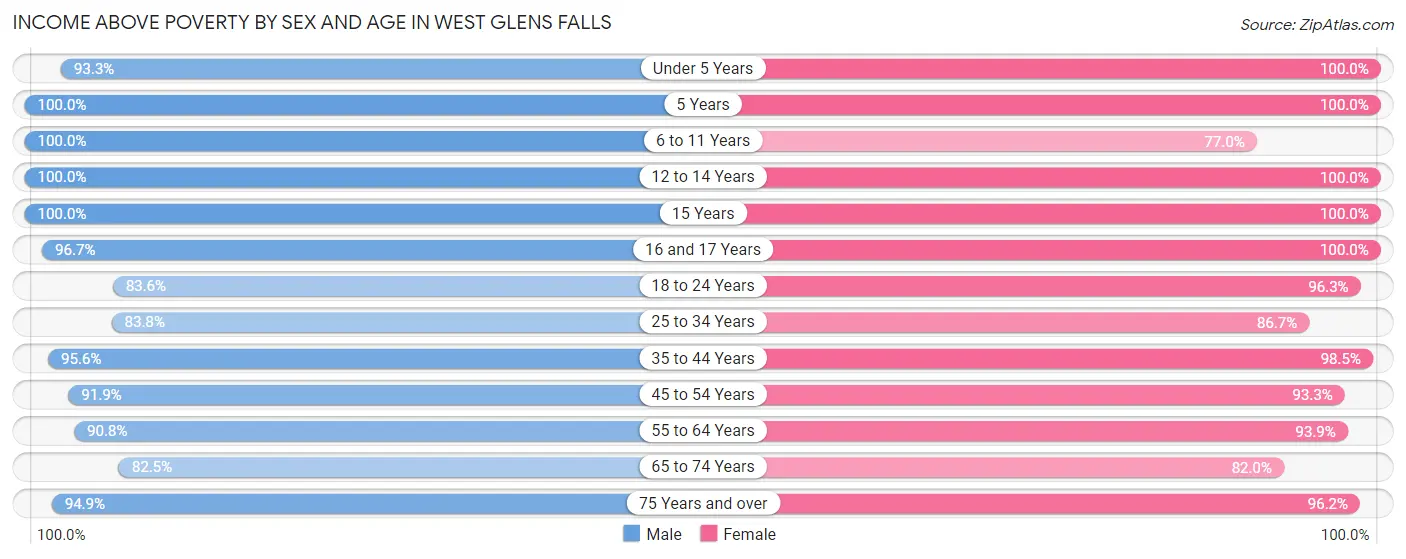
| Age Bracket | Male | Female |
| Under 5 Years | 152 (93.2%) | 189 (100.0%) |
| 5 Years | 10 (100.0%) | 42 (100.0%) |
| 6 to 11 Years | 407 (100.0%) | 241 (77.0%) |
| 12 to 14 Years | 204 (100.0%) | 218 (100.0%) |
| 15 Years | 28 (100.0%) | 45 (100.0%) |
| 16 and 17 Years | 237 (96.7%) | 227 (100.0%) |
| 18 to 24 Years | 276 (83.6%) | 283 (96.3%) |
| 25 to 34 Years | 301 (83.8%) | 346 (86.7%) |
| 35 to 44 Years | 744 (95.6%) | 608 (98.5%) |
| 45 to 54 Years | 734 (91.9%) | 825 (93.3%) |
| 55 to 64 Years | 750 (90.8%) | 614 (93.9%) |
| 65 to 74 Years | 330 (82.5%) | 397 (82.0%) |
| 75 Years and over | 150 (94.9%) | 350 (96.2%) |
| Total | 4,323 (91.8%) | 4,385 (92.7%) |
Income Below Poverty Among Married-Couple Families in West Glens Falls
The poverty statistics for married-couple families in West Glens Falls show that 3.3% or 66 of the total 2,016 families live below the poverty line. Families with no children have the highest poverty rate of 5.3%, comprising of 54 families. On the other hand, families with 3 or 4 children have the lowest poverty rate of 0.0%, which includes 0 families.
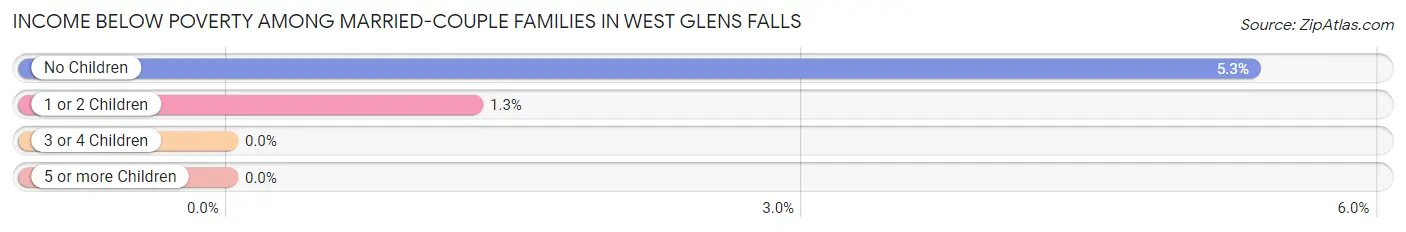
| Children | Above Poverty | Below Poverty |
| No Children | 957 (94.7%) | 54 (5.3%) |
| 1 or 2 Children | 929 (98.7%) | 12 (1.3%) |
| 3 or 4 Children | 64 (100.0%) | 0 (0.0%) |
| 5 or more Children | 0 (0.0%) | 0 (0.0%) |
| Total | 1,950 (96.7%) | 66 (3.3%) |
Income Below Poverty Among Single-Parent Households in West Glens Falls
According to the poverty data in West Glens Falls, 30.4% or 79 single-father households and 6.8% or 28 single-mother households are living below the poverty line. Among single-father households, those with 1 or 2 children have the highest poverty rate, with 58 households (45.3%) experiencing poverty. Likewise, among single-mother households, those with no children have the highest poverty rate, with 21 households (8.1%) falling below the poverty line.
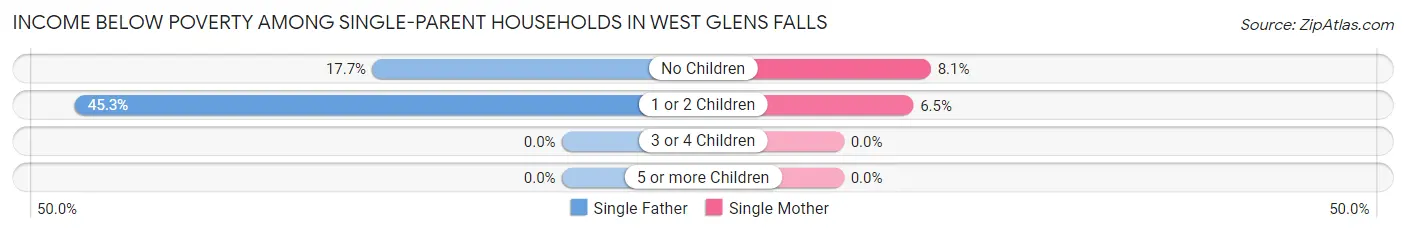
| Children | Single Father | Single Mother |
| No Children | 21 (17.6%) | 21 (8.1%) |
| 1 or 2 Children | 58 (45.3%) | 7 (6.5%) |
| 3 or 4 Children | 0 (0.0%) | 0 (0.0%) |
| 5 or more Children | 0 (0.0%) | 0 (0.0%) |
| Total | 79 (30.4%) | 28 (6.8%) |
Income Below Poverty Among Married-Couple vs Single-Parent Households in West Glens Falls
The poverty data for West Glens Falls shows that 66 of the married-couple family households (3.3%) and 107 of the single-parent households (15.9%) are living below the poverty level. Within the married-couple family households, those with no children have the highest poverty rate, with 54 households (5.3%) falling below the poverty line. Among the single-parent households, those with 1 or 2 children have the highest poverty rate, with 65 household (27.5%) living below poverty.
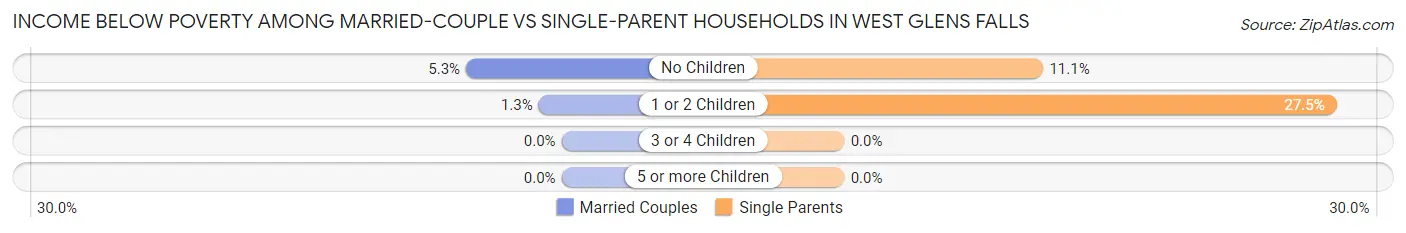
| Children | Married-Couple Families | Single-Parent Households |
| No Children | 54 (5.3%) | 42 (11.1%) |
| 1 or 2 Children | 12 (1.3%) | 65 (27.5%) |
| 3 or 4 Children | 0 (0.0%) | 0 (0.0%) |
| 5 or more Children | 0 (0.0%) | 0 (0.0%) |
| Total | 66 (3.3%) | 107 (15.9%) |
Race in West Glens Falls
The most populous races in West Glens Falls are White / Caucasian (8,694 | 90.9%), Two or more Races (697 | 7.3%), and Hispanic or Latino (304 | 3.2%).
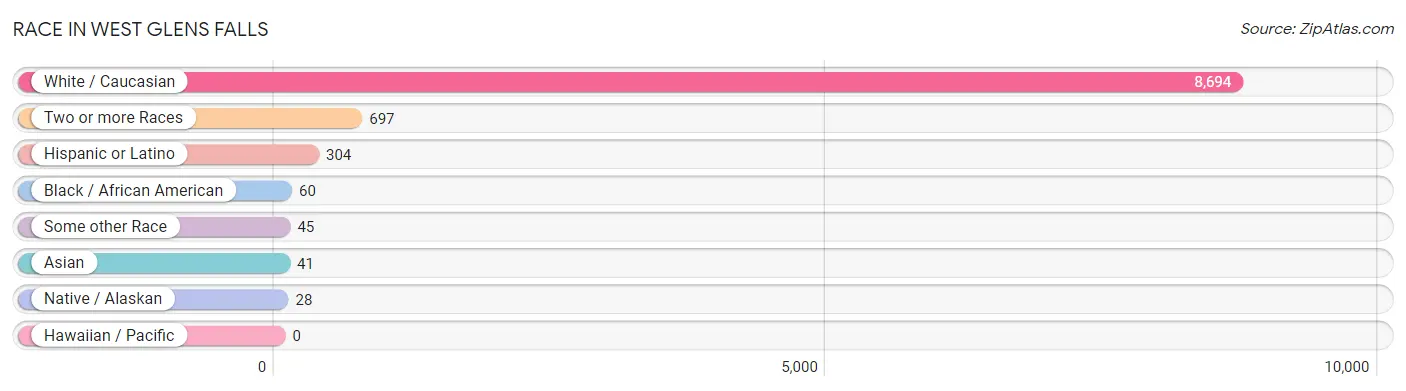
| Race | # Population | % Population |
| Asian | 41 | 0.4% |
| Black / African American | 60 | 0.6% |
| Hawaiian / Pacific | 0 | 0.0% |
| Hispanic or Latino | 304 | 3.2% |
| Native / Alaskan | 28 | 0.3% |
| White / Caucasian | 8,694 | 90.9% |
| Two or more Races | 697 | 7.3% |
| Some other Race | 45 | 0.5% |
| Total | 9,565 | 100.0% |
Ancestry in West Glens Falls
The most populous ancestries reported in West Glens Falls are Irish (2,054 | 21.5%), English (1,442 | 15.1%), German (977 | 10.2%), Italian (952 | 10.0%), and French (780 | 8.2%), together accounting for 64.9% of all West Glens Falls residents.
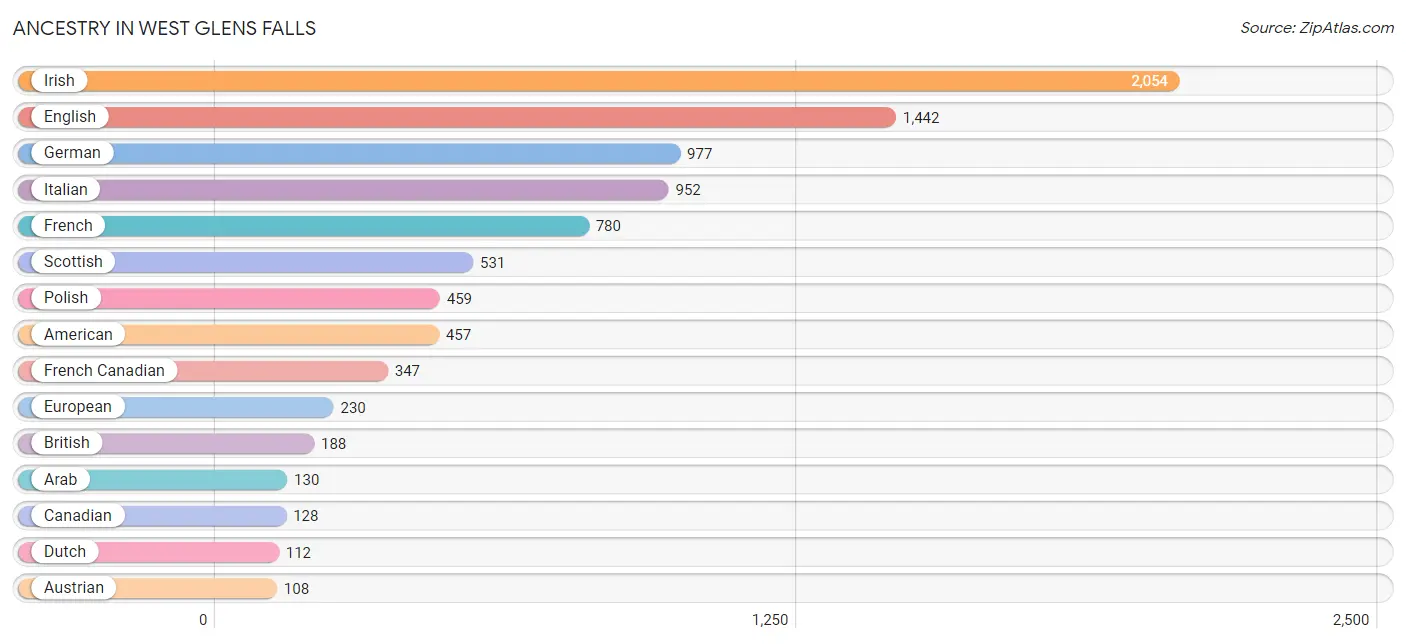
| Ancestry | # Population | % Population |
| American | 457 | 4.8% |
| Arab | 130 | 1.4% |
| Austrian | 108 | 1.1% |
| Blackfeet | 16 | 0.2% |
| British | 188 | 2.0% |
| Canadian | 128 | 1.3% |
| Central American | 22 | 0.2% |
| Chilean | 69 | 0.7% |
| Croatian | 17 | 0.2% |
| Czech | 21 | 0.2% |
| Czechoslovakian | 43 | 0.4% |
| Dutch | 112 | 1.2% |
| Eastern European | 14 | 0.2% |
| English | 1,442 | 15.1% |
| European | 230 | 2.4% |
| French | 780 | 8.2% |
| French Canadian | 347 | 3.6% |
| German | 977 | 10.2% |
| Honduran | 14 | 0.2% |
| Hungarian | 8 | 0.1% |
| Indian (Asian) | 41 | 0.4% |
| Irish | 2,054 | 21.5% |
| Iroquois | 36 | 0.4% |
| Israeli | 42 | 0.4% |
| Italian | 952 | 10.0% |
| Jamaican | 10 | 0.1% |
| Laotian | 66 | 0.7% |
| Lithuanian | 8 | 0.1% |
| Mexican | 79 | 0.8% |
| Navajo | 8 | 0.1% |
| Nicaraguan | 8 | 0.1% |
| Northern European | 30 | 0.3% |
| Norwegian | 90 | 0.9% |
| Polish | 459 | 4.8% |
| Portuguese | 19 | 0.2% |
| Puerto Rican | 21 | 0.2% |
| Russian | 70 | 0.7% |
| Scandinavian | 20 | 0.2% |
| Scotch-Irish | 65 | 0.7% |
| Scottish | 531 | 5.6% |
| Slovak | 8 | 0.1% |
| South American | 69 | 0.7% |
| Spaniard | 19 | 0.2% |
| Spanish | 53 | 0.5% |
| Swedish | 65 | 0.7% |
| Swiss | 21 | 0.2% |
| Syrian | 100 | 1.1% |
| Thai | 12 | 0.1% |
| Ukrainian | 43 | 0.4% |
| Welsh | 25 | 0.3% | View All 50 Rows |
Immigrants in West Glens Falls
The most numerous immigrant groups reported in West Glens Falls came from Europe (100 | 1.1%), Latin America (78 | 0.8%), Asia (70 | 0.7%), Central America (68 | 0.7%), and Mexico (54 | 0.6%), together accounting for 3.9% of all West Glens Falls residents.
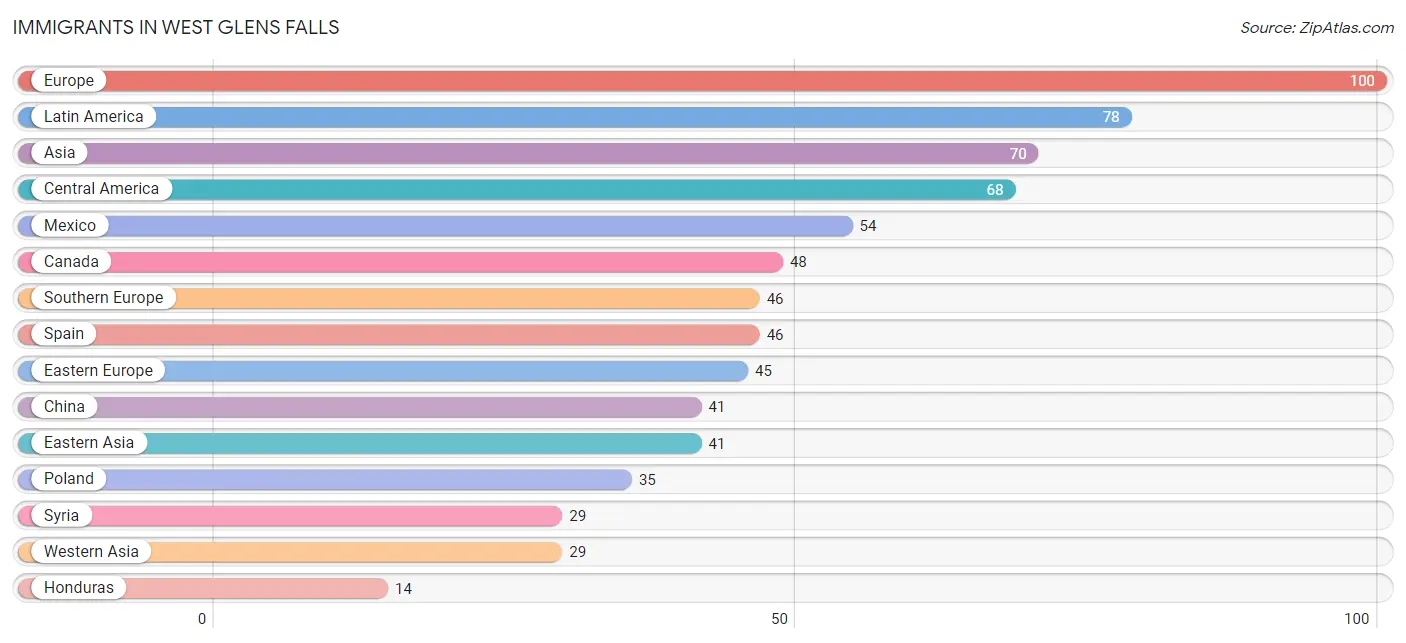
| Immigration Origin | # Population | % Population |
| Asia | 70 | 0.7% |
| Austria | 9 | 0.1% |
| Canada | 48 | 0.5% |
| Caribbean | 10 | 0.1% |
| Central America | 68 | 0.7% |
| China | 41 | 0.4% |
| Czechoslovakia | 10 | 0.1% |
| Eastern Asia | 41 | 0.4% |
| Eastern Europe | 45 | 0.5% |
| Europe | 100 | 1.1% |
| Honduras | 14 | 0.2% |
| Jamaica | 10 | 0.1% |
| Latin America | 78 | 0.8% |
| Mexico | 54 | 0.6% |
| Poland | 35 | 0.4% |
| Southern Europe | 46 | 0.5% |
| Spain | 46 | 0.5% |
| Syria | 29 | 0.3% |
| Western Asia | 29 | 0.3% |
| Western Europe | 9 | 0.1% | View All 20 Rows |
Sex and Age in West Glens Falls
Sex and Age in West Glens Falls
The most populous age groups in West Glens Falls are 35 to 39 Years (533 | 11.1%) for men and 50 to 54 Years (445 | 9.3%) for women.
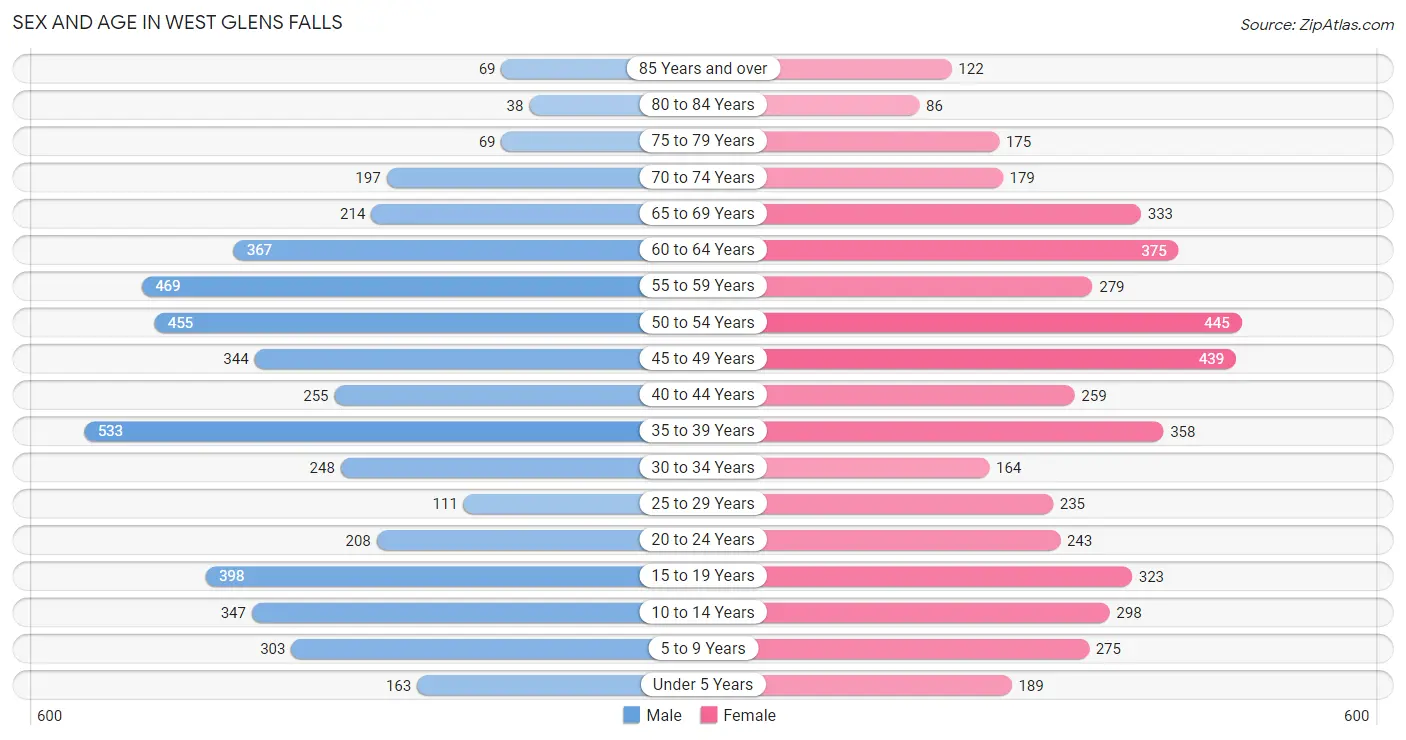
| Age Bracket | Male | Female |
| Under 5 Years | 163 (3.4%) | 189 (4.0%) |
| 5 to 9 Years | 303 (6.3%) | 275 (5.8%) |
| 10 to 14 Years | 347 (7.2%) | 298 (6.2%) |
| 15 to 19 Years | 398 (8.3%) | 323 (6.8%) |
| 20 to 24 Years | 208 (4.3%) | 243 (5.1%) |
| 25 to 29 Years | 111 (2.3%) | 235 (4.9%) |
| 30 to 34 Years | 248 (5.2%) | 164 (3.4%) |
| 35 to 39 Years | 533 (11.1%) | 358 (7.5%) |
| 40 to 44 Years | 255 (5.3%) | 259 (5.4%) |
| 45 to 49 Years | 344 (7.2%) | 439 (9.2%) |
| 50 to 54 Years | 455 (9.5%) | 445 (9.3%) |
| 55 to 59 Years | 469 (9.8%) | 279 (5.8%) |
| 60 to 64 Years | 367 (7.7%) | 375 (7.9%) |
| 65 to 69 Years | 214 (4.5%) | 333 (7.0%) |
| 70 to 74 Years | 197 (4.1%) | 179 (3.7%) |
| 75 to 79 Years | 69 (1.4%) | 175 (3.7%) |
| 80 to 84 Years | 38 (0.8%) | 86 (1.8%) |
| 85 Years and over | 69 (1.4%) | 122 (2.5%) |
| Total | 4,788 (100.0%) | 4,777 (100.0%) |
Families and Households in West Glens Falls
Median Family Size in West Glens Falls
The median family size in West Glens Falls is 2.93 persons per family, with married-couple families (2,016 | 75.0%) accounting for the largest median family size of 3.15 persons per family. On the other hand, single male/father families (260 | 9.7%) represent the smallest median family size with 2.23 persons per family.
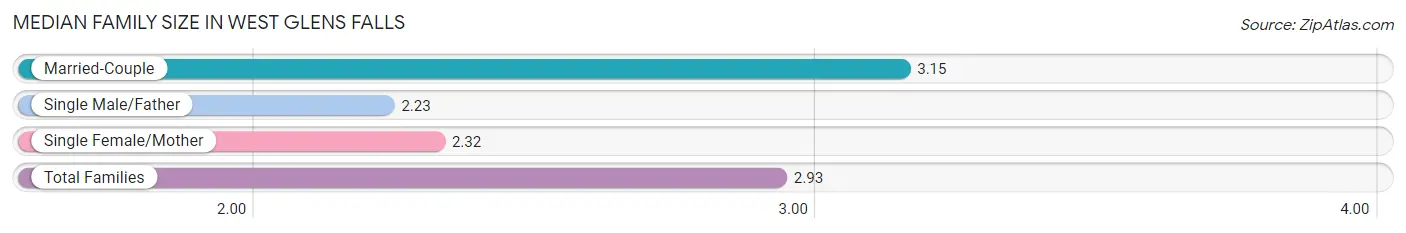
| Family Type | # Families | Family Size |
| Married-Couple | 2,016 (75.0%) | 3.15 |
| Single Male/Father | 260 (9.7%) | 2.23 |
| Single Female/Mother | 413 (15.4%) | 2.32 |
| Total Families | 2,689 (100.0%) | 2.93 |
Median Household Size in West Glens Falls
The median household size in West Glens Falls is 2.53 persons per household, with married-couple households (2,016 | 54.0%) accounting for the largest median household size of 3.17 persons per household. non-family households (1,045 | 28.0%) represent the smallest median household size with 1.31 persons per household.
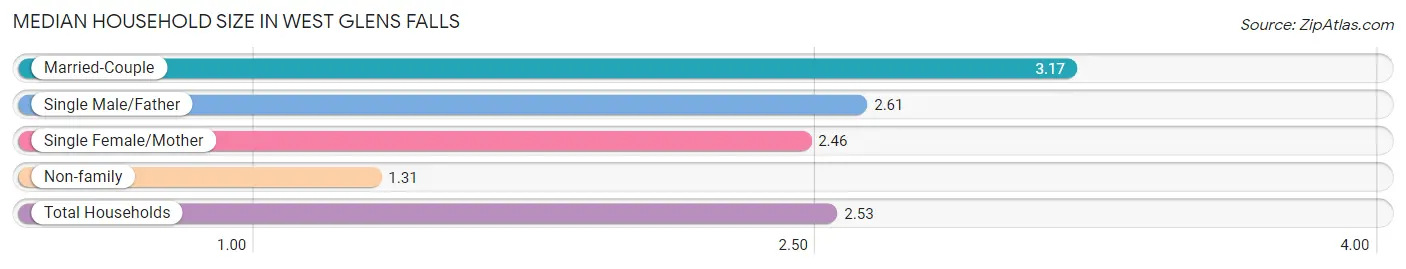
| Household Type | # Households | Household Size |
| Married-Couple | 2,016 (54.0%) | 3.17 |
| Single Male/Father | 260 (7.0%) | 2.61 |
| Single Female/Mother | 413 (11.1%) | 2.46 |
| Non-family | 1,045 (28.0%) | 1.31 |
| Total Households | 3,734 (100.0%) | 2.53 |
Household Size by Marriage Status in West Glens Falls
Out of a total of 3,734 households in West Glens Falls, 2,689 (72.0%) are family households, while 1,045 (28.0%) are nonfamily households. The most numerous type of family households are 2-person households, comprising 1,122, and the most common type of nonfamily households are 1-person households, comprising 854.
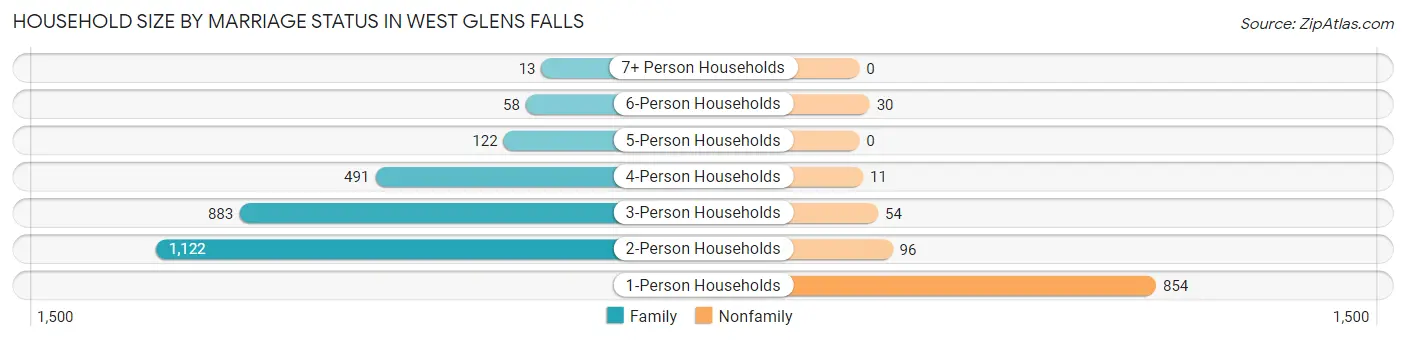
| Household Size | Family Households | Nonfamily Households |
| 1-Person Households | - | 854 (22.9%) |
| 2-Person Households | 1,122 (30.0%) | 96 (2.6%) |
| 3-Person Households | 883 (23.6%) | 54 (1.5%) |
| 4-Person Households | 491 (13.2%) | 11 (0.3%) |
| 5-Person Households | 122 (3.3%) | 0 (0.0%) |
| 6-Person Households | 58 (1.5%) | 30 (0.8%) |
| 7+ Person Households | 13 (0.4%) | 0 (0.0%) |
| Total | 2,689 (72.0%) | 1,045 (28.0%) |
Female Fertility in West Glens Falls
Fertility by Age in West Glens Falls
Average fertility rate in West Glens Falls is 37.0 births per 1,000 women. Women in the age bracket of 20 to 34 years have the highest fertility rate with 101.0 births per 1,000 women. Women in the age bracket of 20 to 34 years acount for 85.5% of all women with births.
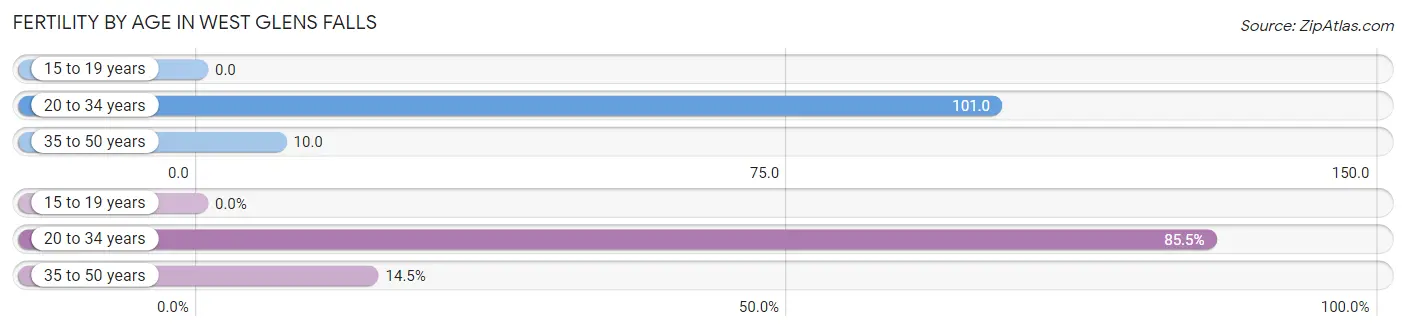
| Age Bracket | Women with Births | Births / 1,000 Women |
| 15 to 19 years | 0 (0.0%) | 0.0 |
| 20 to 34 years | 65 (85.5%) | 101.0 |
| 35 to 50 years | 11 (14.5%) | 10.0 |
| Total | 76 (100.0%) | 37.0 |
Fertility by Age by Marriage Status in West Glens Falls
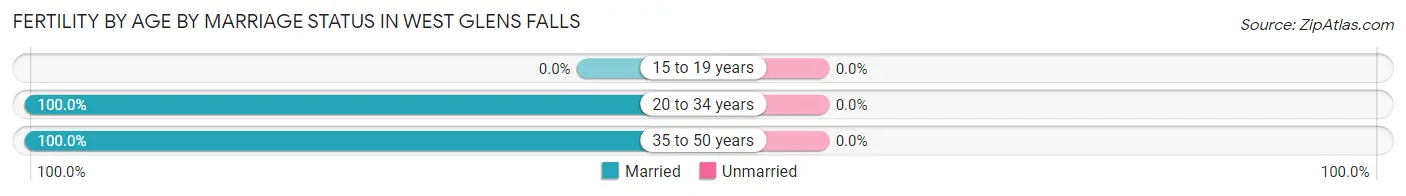
| Age Bracket | Married | Unmarried |
| 15 to 19 years | 0 (0.0%) | 0 (0.0%) |
| 20 to 34 years | 65 (100.0%) | 0 (0.0%) |
| 35 to 50 years | 11 (100.0%) | 0 (0.0%) |
| Total | 76 (100.0%) | 0 (0.0%) |
Fertility by Education in West Glens Falls
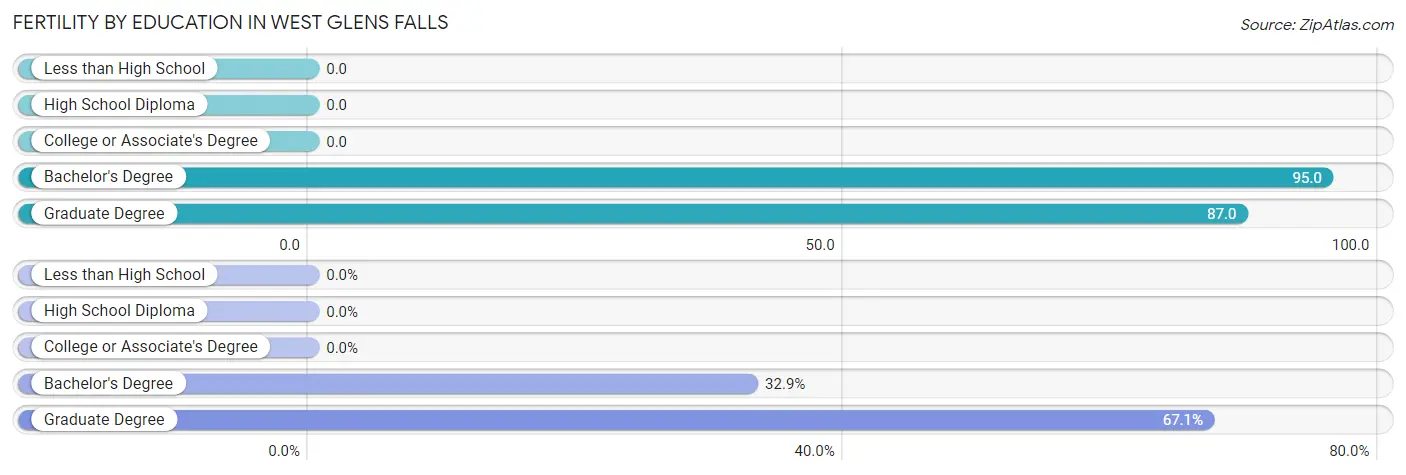
| Educational Attainment | Women with Births | Births / 1,000 Women |
| Less than High School | 0 (0.0%) | 0.0 |
| High School Diploma | 0 (0.0%) | 0.0 |
| College or Associate's Degree | 0 (0.0%) | 0.0 |
| Bachelor's Degree | 25 (32.9%) | 95.0 |
| Graduate Degree | 51 (67.1%) | 87.0 |
| Total | 76 (100.0%) | 37.0 |
Fertility by Education by Marriage Status in West Glens Falls
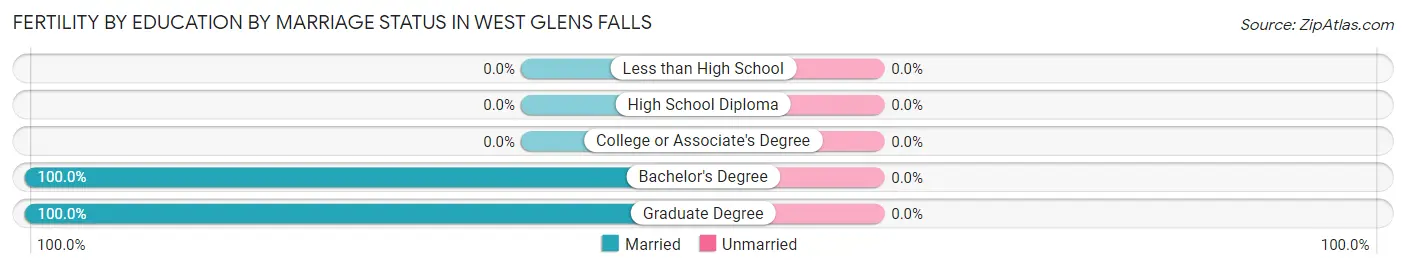
| Educational Attainment | Married | Unmarried |
| Less than High School | 0 (0.0%) | 0 (0.0%) |
| High School Diploma | 0 (0.0%) | 0 (0.0%) |
| College or Associate's Degree | 0 (0.0%) | 0 (0.0%) |
| Bachelor's Degree | 25 (100.0%) | 0 (0.0%) |
| Graduate Degree | 51 (100.0%) | 0 (0.0%) |
| Total | 76 (100.0%) | 0 (0.0%) |
Employment Characteristics in West Glens Falls
Employment by Class of Employer in West Glens Falls
Among the 5,144 employed individuals in West Glens Falls, private company employees (2,890 | 56.2%), not-for-profit organizations (732 | 14.2%), and local government employees (649 | 12.6%) make up the most common classes of employment.
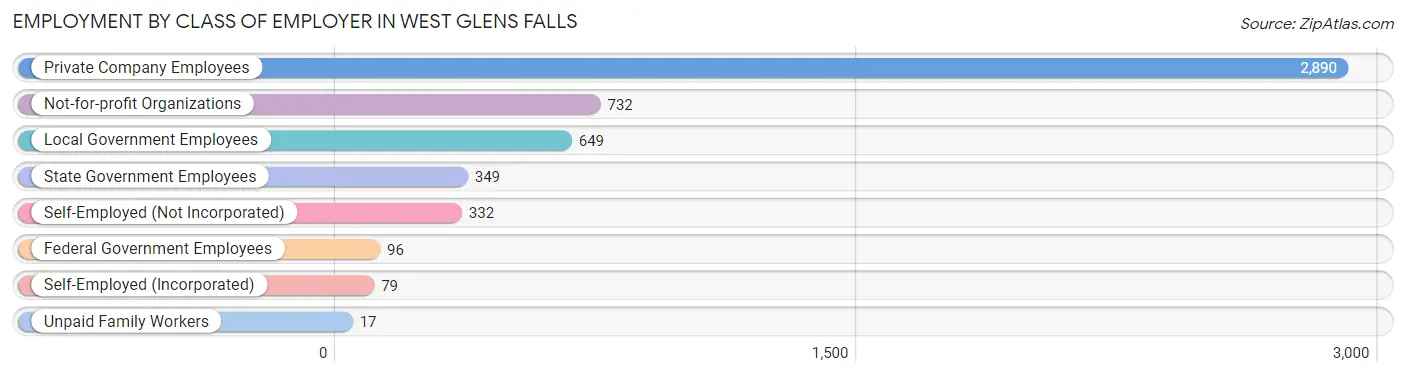
| Employer Class | # Employees | % Employees |
| Private Company Employees | 2,890 | 56.2% |
| Self-Employed (Incorporated) | 79 | 1.5% |
| Self-Employed (Not Incorporated) | 332 | 6.5% |
| Not-for-profit Organizations | 732 | 14.2% |
| Local Government Employees | 649 | 12.6% |
| State Government Employees | 349 | 6.8% |
| Federal Government Employees | 96 | 1.9% |
| Unpaid Family Workers | 17 | 0.3% |
| Total | 5,144 | 100.0% |
Employment Status by Age in West Glens Falls
According to the labor force statistics for West Glens Falls, out of the total population over 16 years of age (7,917), 67.8% or 5,368 individuals are in the labor force, with 2.5% or 134 of them unemployed. The age group with the highest labor force participation rate is 30 to 34 years, with 93.9% or 387 individuals in the labor force. Within the labor force, the 16 to 19 years age range has the highest percentage of unemployed individuals, with 15.7% or 49 of them being unemployed.
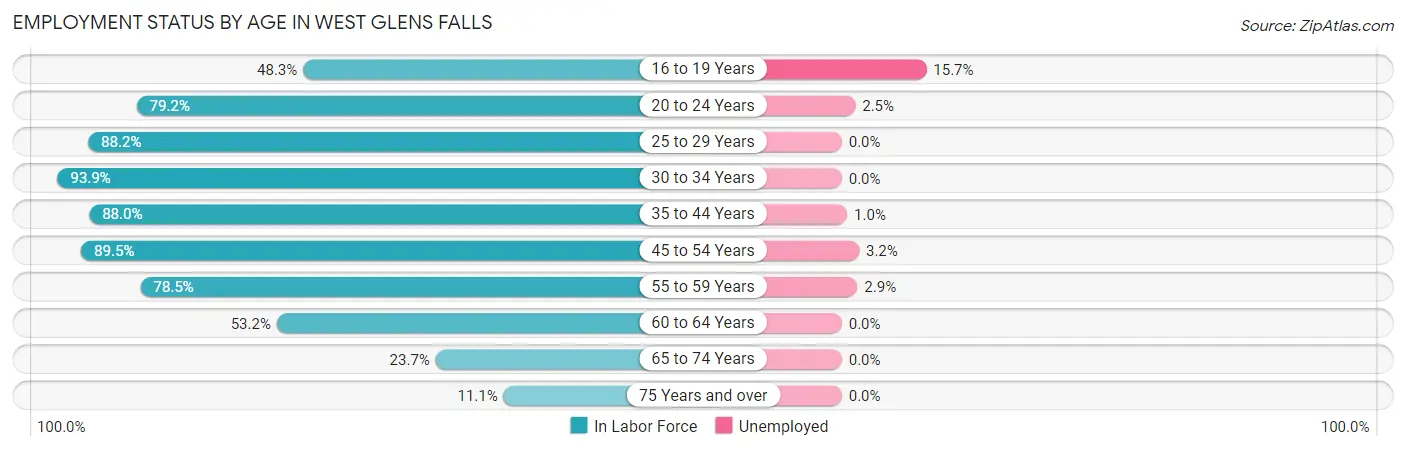
| Age Bracket | In Labor Force | Unemployed |
| 16 to 19 Years | 313 (48.3%) | 49 (15.7%) |
| 20 to 24 Years | 357 (79.2%) | 9 (2.5%) |
| 25 to 29 Years | 305 (88.2%) | 0 (0.0%) |
| 30 to 34 Years | 387 (93.9%) | 0 (0.0%) |
| 35 to 44 Years | 1,236 (88.0%) | 12 (1.0%) |
| 45 to 54 Years | 1,506 (89.5%) | 48 (3.2%) |
| 55 to 59 Years | 587 (78.5%) | 17 (2.9%) |
| 60 to 64 Years | 395 (53.2%) | 0 (0.0%) |
| 65 to 74 Years | 219 (23.7%) | 0 (0.0%) |
| 75 Years and over | 62 (11.1%) | 0 (0.0%) |
| Total | 5,368 (67.8%) | 134 (2.5%) |
Employment Status by Educational Attainment in West Glens Falls
According to labor force statistics for West Glens Falls, 82.8% of individuals (4,418) out of the total population between 25 and 64 years of age (5,336) are in the labor force, with 1.7% or 75 of them being unemployed. The group with the highest labor force participation rate are those with the educational attainment of bachelor's degree or higher, with 92.7% or 1,974 individuals in the labor force. Within the labor force, individuals with bachelor's degree or higher education have the highest percentage of unemployment, with 3.0% or 59 of them being unemployed.
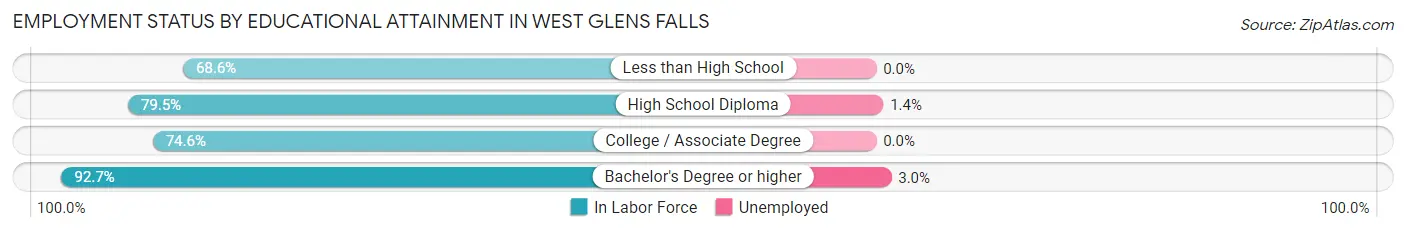
| Educational Attainment | In Labor Force | Unemployed |
| Less than High School | 273 (68.6%) | 0 (0.0%) |
| High School Diploma | 1,239 (79.5%) | 22 (1.4%) |
| College / Associate Degree | 932 (74.6%) | 0 (0.0%) |
| Bachelor's Degree or higher | 1,974 (92.7%) | 64 (3.0%) |
| Total | 4,418 (82.8%) | 91 (1.7%) |
Employment Occupations by Sex in West Glens Falls
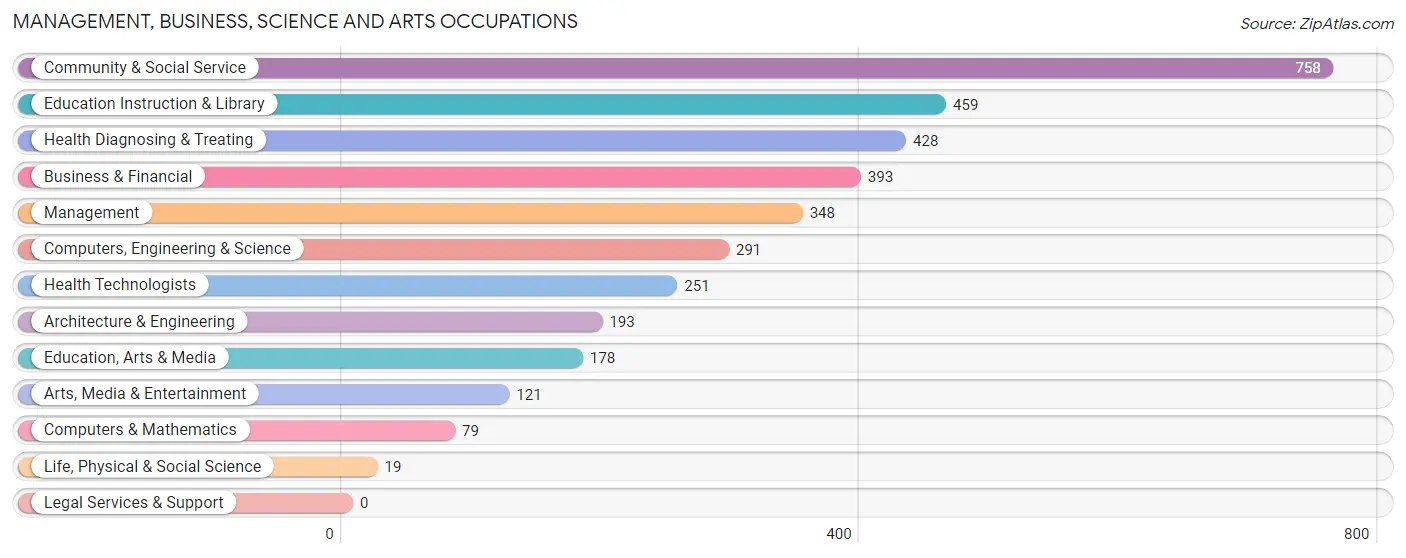
Management, Business, Science and Arts Occupations
The most common Management, Business, Science and Arts occupations in West Glens Falls are Community & Social Service (758 | 14.5%), Education Instruction & Library (459 | 8.8%), Health Diagnosing & Treating (428 | 8.2%), Business & Financial (393 | 7.5%), and Management (348 | 6.7%).
Management, Business, Science and Arts Occupations by Sex
Within the Management, Business, Science and Arts occupations in West Glens Falls, the most male-oriented occupations are Computers & Mathematics (88.6%), Management (83.9%), and Computers, Engineering & Science (67.7%), while the most female-oriented occupations are Education, Arts & Media (87.6%), Health Technologists (70.1%), and Community & Social Service (68.1%).
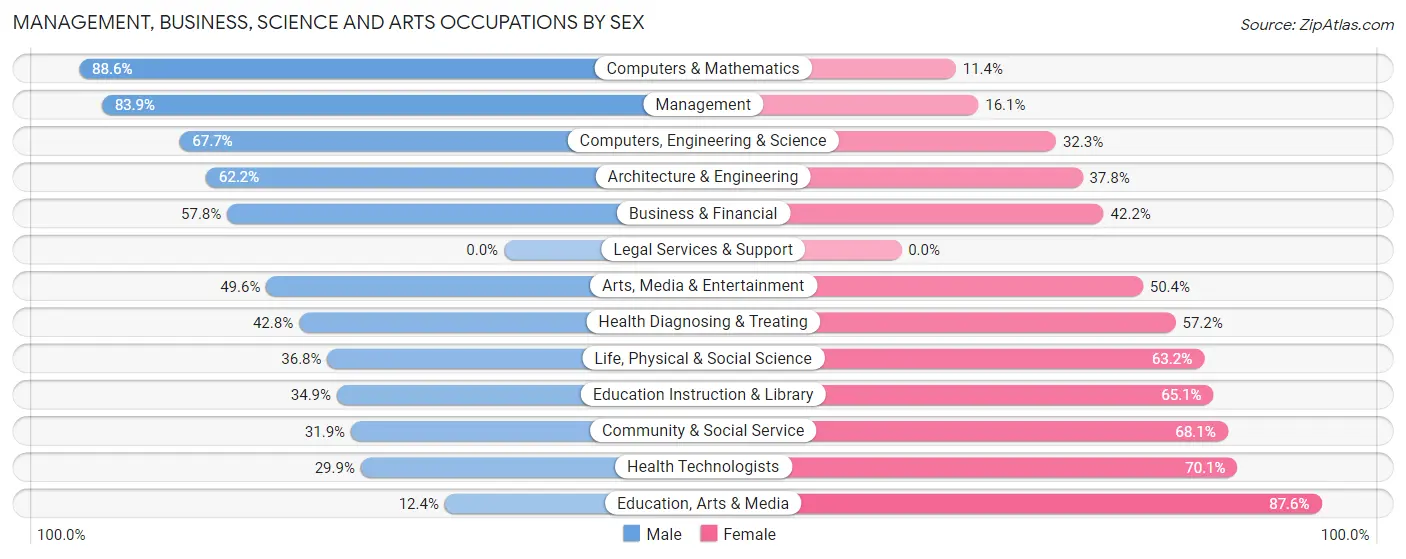
| Occupation | Male | Female |
| Management | 292 (83.9%) | 56 (16.1%) |
| Business & Financial | 227 (57.8%) | 166 (42.2%) |
| Computers, Engineering & Science | 197 (67.7%) | 94 (32.3%) |
| Computers & Mathematics | 70 (88.6%) | 9 (11.4%) |
| Architecture & Engineering | 120 (62.2%) | 73 (37.8%) |
| Life, Physical & Social Science | 7 (36.8%) | 12 (63.2%) |
| Community & Social Service | 242 (31.9%) | 516 (68.1%) |
| Education, Arts & Media | 22 (12.4%) | 156 (87.6%) |
| Legal Services & Support | 0 (0.0%) | 0 (0.0%) |
| Education Instruction & Library | 160 (34.9%) | 299 (65.1%) |
| Arts, Media & Entertainment | 60 (49.6%) | 61 (50.4%) |
| Health Diagnosing & Treating | 183 (42.8%) | 245 (57.2%) |
| Health Technologists | 75 (29.9%) | 176 (70.1%) |
| Total (Category) | 1,141 (51.4%) | 1,077 (48.6%) |
| Total (Overall) | 2,649 (50.7%) | 2,574 (49.3%) |
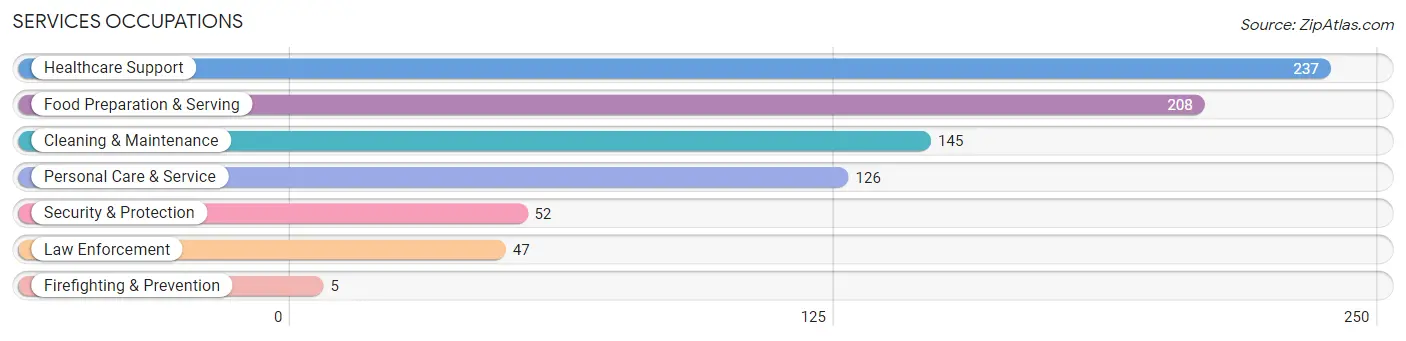
Services Occupations
The most common Services occupations in West Glens Falls are Healthcare Support (237 | 4.5%), Food Preparation & Serving (208 | 4.0%), Cleaning & Maintenance (145 | 2.8%), Personal Care & Service (126 | 2.4%), and Security & Protection (52 | 1.0%).
Services Occupations by Sex
Within the Services occupations in West Glens Falls, the most male-oriented occupations are Firefighting & Prevention (100.0%), Security & Protection (84.6%), and Law Enforcement (83.0%), while the most female-oriented occupations are Personal Care & Service (85.7%), Healthcare Support (57.4%), and Cleaning & Maintenance (46.9%).
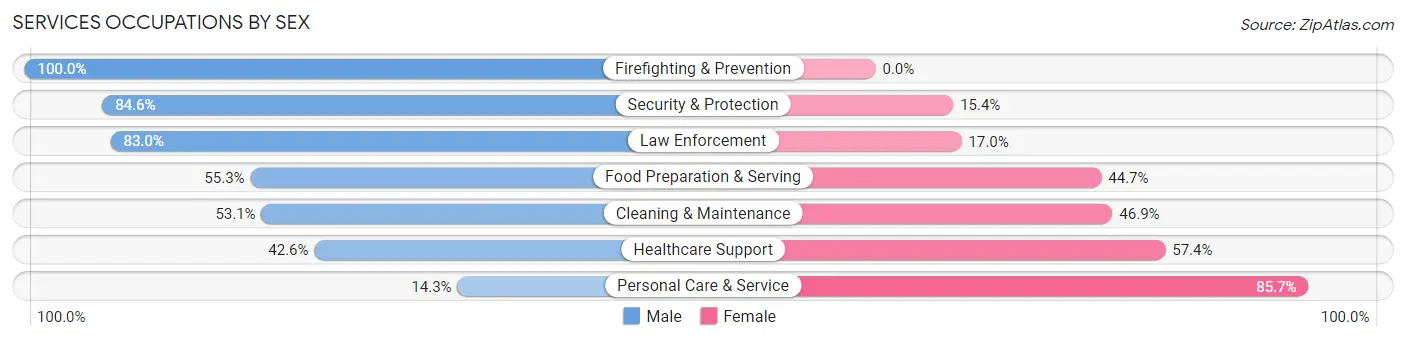
| Occupation | Male | Female |
| Healthcare Support | 101 (42.6%) | 136 (57.4%) |
| Security & Protection | 44 (84.6%) | 8 (15.4%) |
| Firefighting & Prevention | 5 (100.0%) | 0 (0.0%) |
| Law Enforcement | 39 (83.0%) | 8 (17.0%) |
| Food Preparation & Serving | 115 (55.3%) | 93 (44.7%) |
| Cleaning & Maintenance | 77 (53.1%) | 68 (46.9%) |
| Personal Care & Service | 18 (14.3%) | 108 (85.7%) |
| Total (Category) | 355 (46.2%) | 413 (53.8%) |
| Total (Overall) | 2,649 (50.7%) | 2,574 (49.3%) |
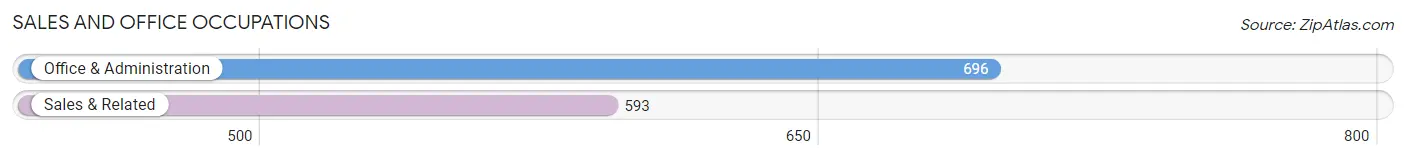
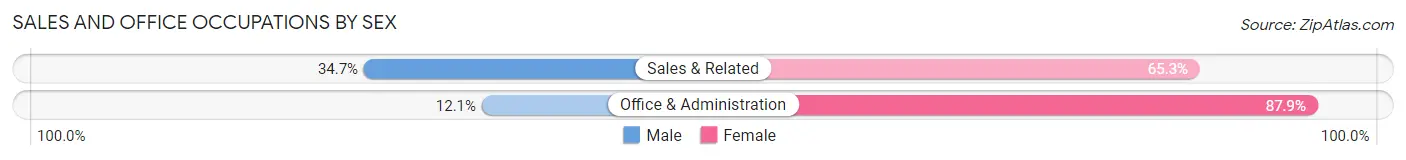
Sales and Office Occupations
The most common Sales and Office occupations in West Glens Falls are Office & Administration (696 | 13.3%), and Sales & Related (593 | 11.4%).
Sales and Office Occupations by Sex
| Occupation | Male | Female |
| Sales & Related | 206 (34.7%) | 387 (65.3%) |
| Office & Administration | 84 (12.1%) | 612 (87.9%) |
| Total (Category) | 290 (22.5%) | 999 (77.5%) |
| Total (Overall) | 2,649 (50.7%) | 2,574 (49.3%) |
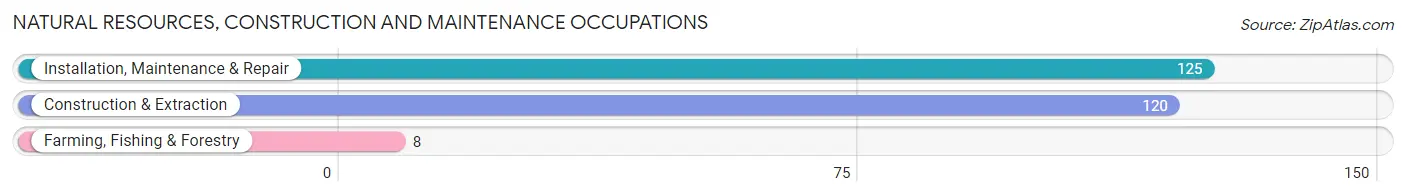
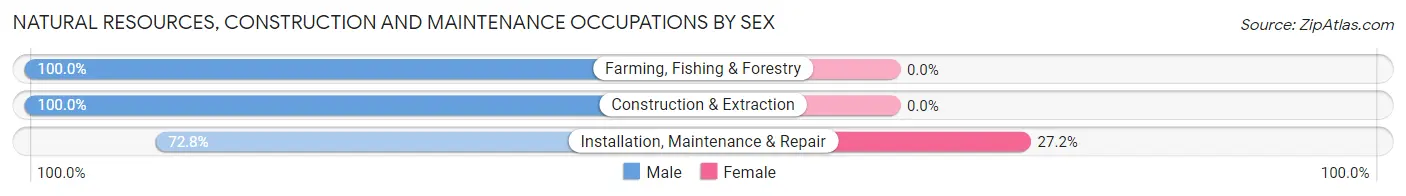
Natural Resources, Construction and Maintenance Occupations
The most common Natural Resources, Construction and Maintenance occupations in West Glens Falls are Installation, Maintenance & Repair (125 | 2.4%), Construction & Extraction (120 | 2.3%), and Farming, Fishing & Forestry (8 | 0.2%).
Natural Resources, Construction and Maintenance Occupations by Sex
| Occupation | Male | Female |
| Farming, Fishing & Forestry | 8 (100.0%) | 0 (0.0%) |
| Construction & Extraction | 120 (100.0%) | 0 (0.0%) |
| Installation, Maintenance & Repair | 91 (72.8%) | 34 (27.2%) |
| Total (Category) | 219 (86.6%) | 34 (13.4%) |
| Total (Overall) | 2,649 (50.7%) | 2,574 (49.3%) |
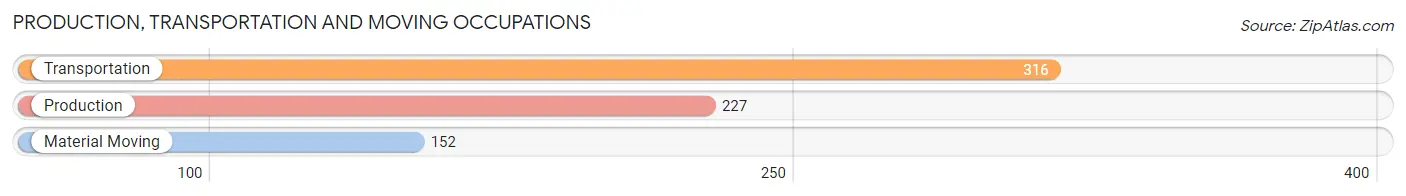
Production, Transportation and Moving Occupations
The most common Production, Transportation and Moving occupations in West Glens Falls are Transportation (316 | 6.0%), Production (227 | 4.3%), and Material Moving (152 | 2.9%).
Production, Transportation and Moving Occupations by Sex
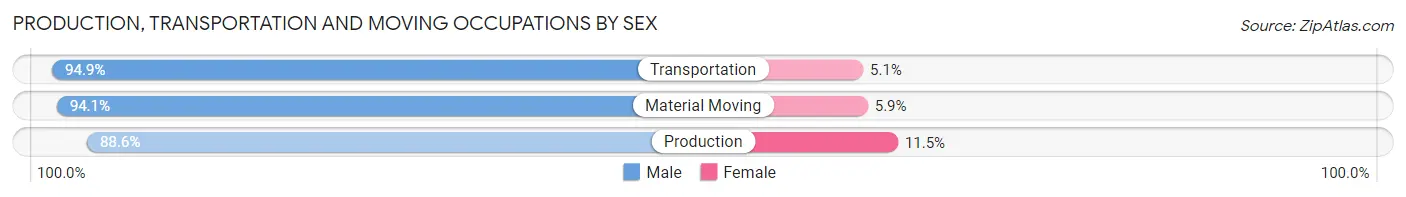
| Occupation | Male | Female |
| Production | 201 (88.5%) | 26 (11.5%) |
| Transportation | 300 (94.9%) | 16 (5.1%) |
| Material Moving | 143 (94.1%) | 9 (5.9%) |
| Total (Category) | 644 (92.7%) | 51 (7.3%) |
| Total (Overall) | 2,649 (50.7%) | 2,574 (49.3%) |
Employment Industries by Sex in West Glens Falls
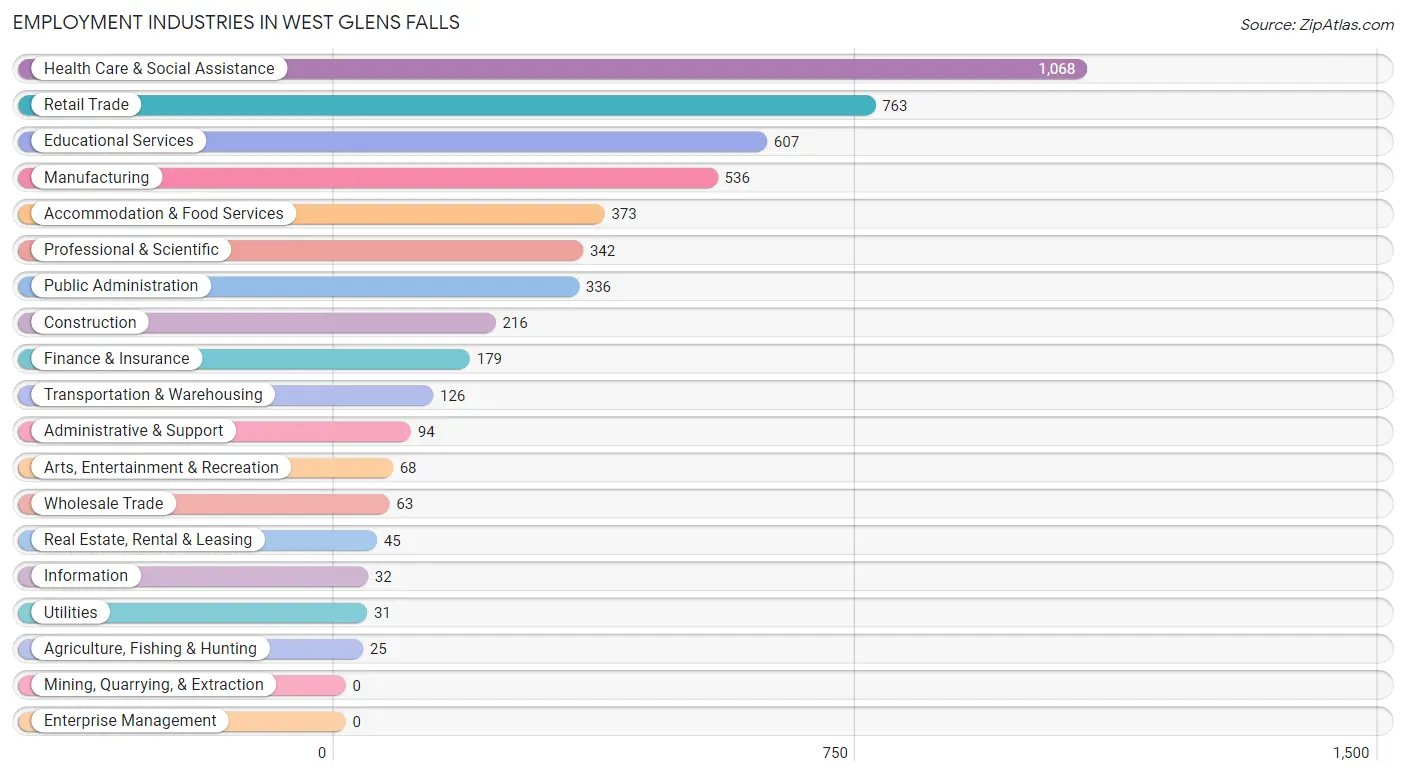
Employment Industries in West Glens Falls
The major employment industries in West Glens Falls include Health Care & Social Assistance (1,068 | 20.4%), Retail Trade (763 | 14.6%), Educational Services (607 | 11.6%), Manufacturing (536 | 10.3%), and Accommodation & Food Services (373 | 7.1%).
Employment Industries by Sex in West Glens Falls
The West Glens Falls industries that see more men than women are Wholesale Trade (100.0%), Transportation & Warehousing (100.0%), and Utilities (100.0%), whereas the industries that tend to have a higher number of women are Educational Services (73.6%), Finance & Insurance (71.0%), and Public Administration (70.2%).
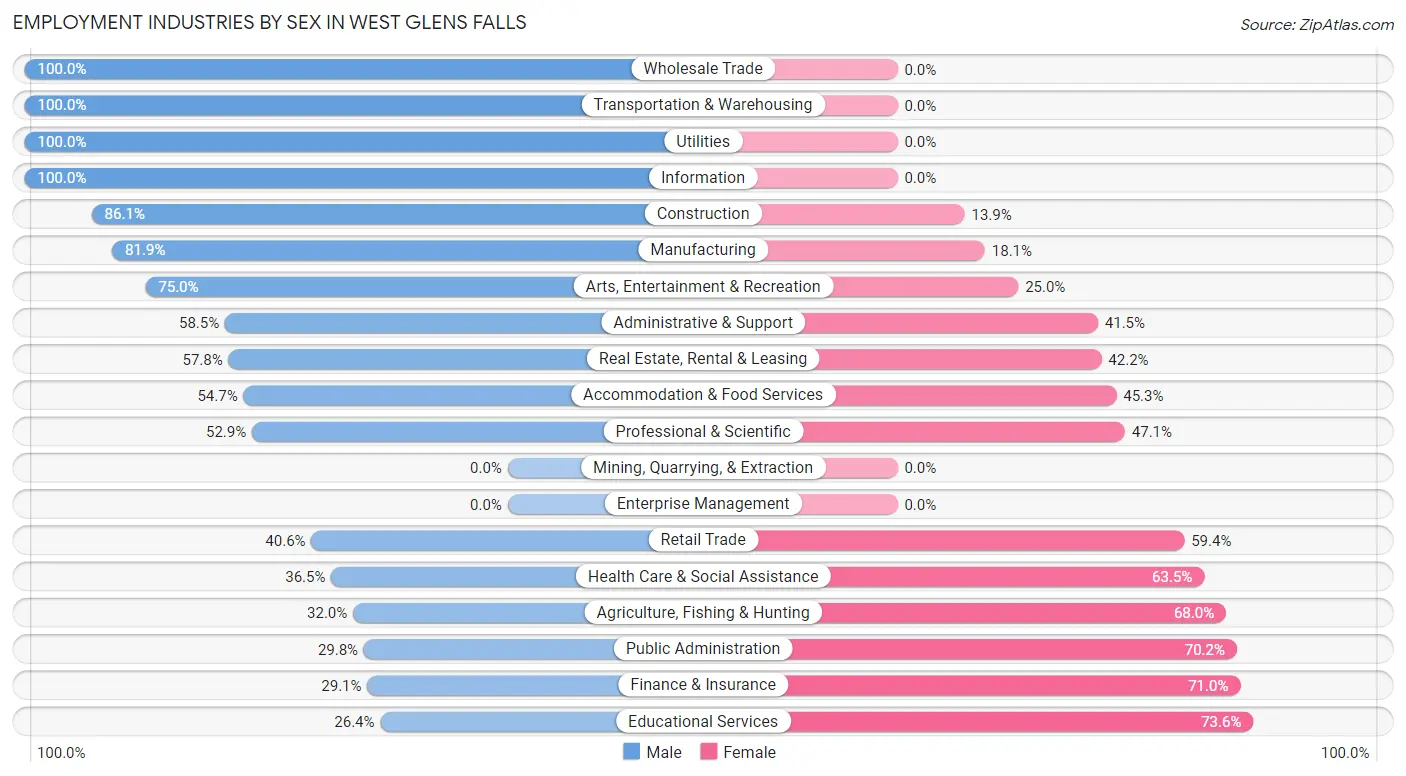
| Industry | Male | Female |
| Agriculture, Fishing & Hunting | 8 (32.0%) | 17 (68.0%) |
| Mining, Quarrying, & Extraction | 0 (0.0%) | 0 (0.0%) |
| Construction | 186 (86.1%) | 30 (13.9%) |
| Manufacturing | 439 (81.9%) | 97 (18.1%) |
| Wholesale Trade | 63 (100.0%) | 0 (0.0%) |
| Retail Trade | 310 (40.6%) | 453 (59.4%) |
| Transportation & Warehousing | 126 (100.0%) | 0 (0.0%) |
| Utilities | 31 (100.0%) | 0 (0.0%) |
| Information | 32 (100.0%) | 0 (0.0%) |
| Finance & Insurance | 52 (29.0%) | 127 (71.0%) |
| Real Estate, Rental & Leasing | 26 (57.8%) | 19 (42.2%) |
| Professional & Scientific | 181 (52.9%) | 161 (47.1%) |
| Enterprise Management | 0 (0.0%) | 0 (0.0%) |
| Administrative & Support | 55 (58.5%) | 39 (41.5%) |
| Educational Services | 160 (26.4%) | 447 (73.6%) |
| Health Care & Social Assistance | 390 (36.5%) | 678 (63.5%) |
| Arts, Entertainment & Recreation | 51 (75.0%) | 17 (25.0%) |
| Accommodation & Food Services | 204 (54.7%) | 169 (45.3%) |
| Public Administration | 100 (29.8%) | 236 (70.2%) |
| Total | 2,649 (50.7%) | 2,574 (49.3%) |
Education in West Glens Falls
School Enrollment in West Glens Falls
The most common levels of schooling among the 2,244 students in West Glens Falls are high school (651 | 29.0%), middle school (616 | 27.5%), and elementary school (494 | 22.0%).
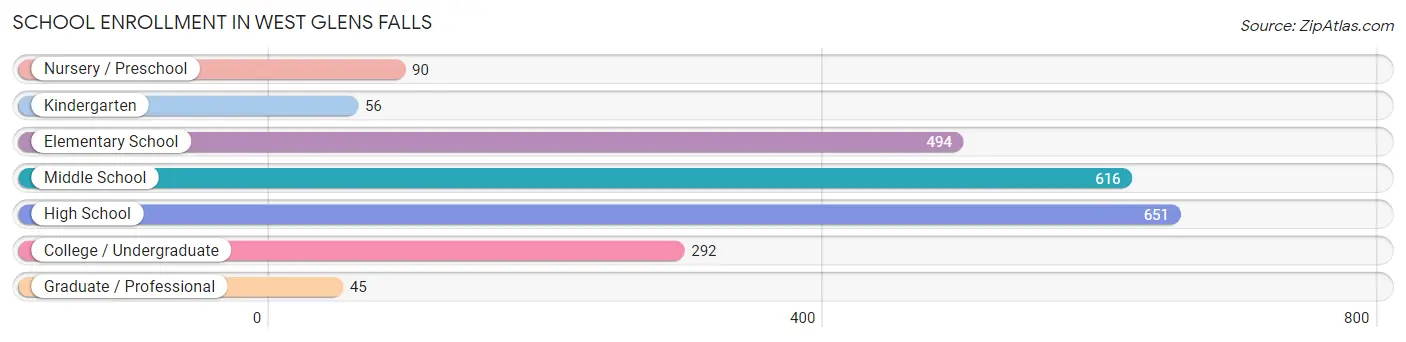
| School Level | # Students | % Students |
| Nursery / Preschool | 90 | 4.0% |
| Kindergarten | 56 | 2.5% |
| Elementary School | 494 | 22.0% |
| Middle School | 616 | 27.5% |
| High School | 651 | 29.0% |
| College / Undergraduate | 292 | 13.0% |
| Graduate / Professional | 45 | 2.0% |
| Total | 2,244 | 100.0% |
School Enrollment by Age by Funding Source in West Glens Falls
Out of a total of 2,244 students who are enrolled in schools in West Glens Falls, 130 (5.8%) attend a private institution, while the remaining 2,114 (94.2%) are enrolled in public schools. The age group of 3 to 4 year olds has the highest likelihood of being enrolled in private schools, with 47 (52.2% in the age bracket) enrolled. Conversely, the age group of 5 to 9 year old has the lowest likelihood of being enrolled in a private school, with 550 (100.0% in the age bracket) attending a public institution.
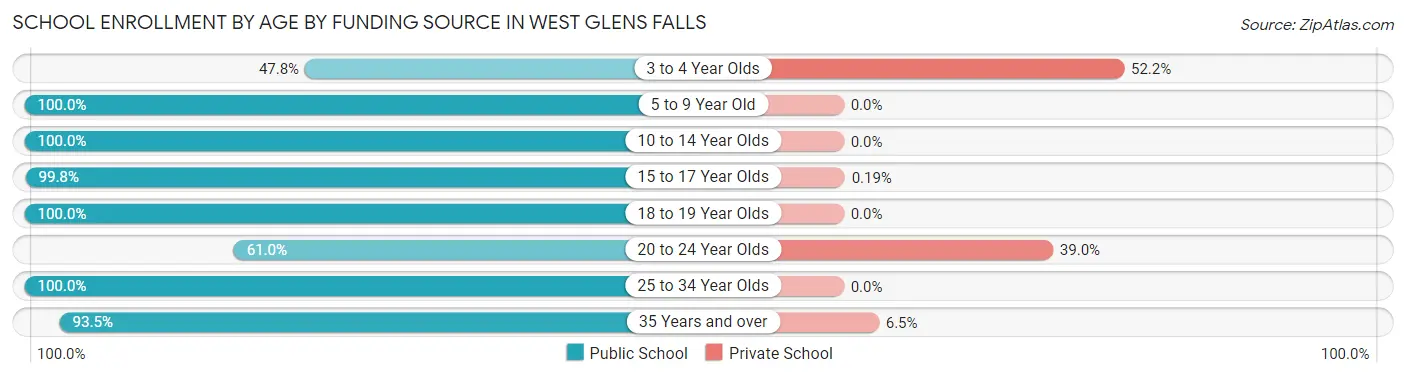
| Age Bracket | Public School | Private School |
| 3 to 4 Year Olds | 43 (47.8%) | 47 (52.2%) |
| 5 to 9 Year Old | 550 (100.0%) | 0 (0.0%) |
| 10 to 14 Year Olds | 645 (100.0%) | 0 (0.0%) |
| 15 to 17 Year Olds | 515 (99.8%) | 1 (0.2%) |
| 18 to 19 Year Olds | 133 (100.0%) | 0 (0.0%) |
| 20 to 24 Year Olds | 119 (61.0%) | 76 (39.0%) |
| 25 to 34 Year Olds | 8 (100.0%) | 0 (0.0%) |
| 35 Years and over | 100 (93.5%) | 7 (6.5%) |
| Total | 2,114 (94.2%) | 130 (5.8%) |
Educational Attainment by Field of Study in West Glens Falls
Education (448 | 16.4%), business (389 | 14.3%), psychology (323 | 11.8%), science & technology (281 | 10.3%), and social sciences (270 | 9.9%) are the most common fields of study among 2,727 individuals in West Glens Falls who have obtained a bachelor's degree or higher.
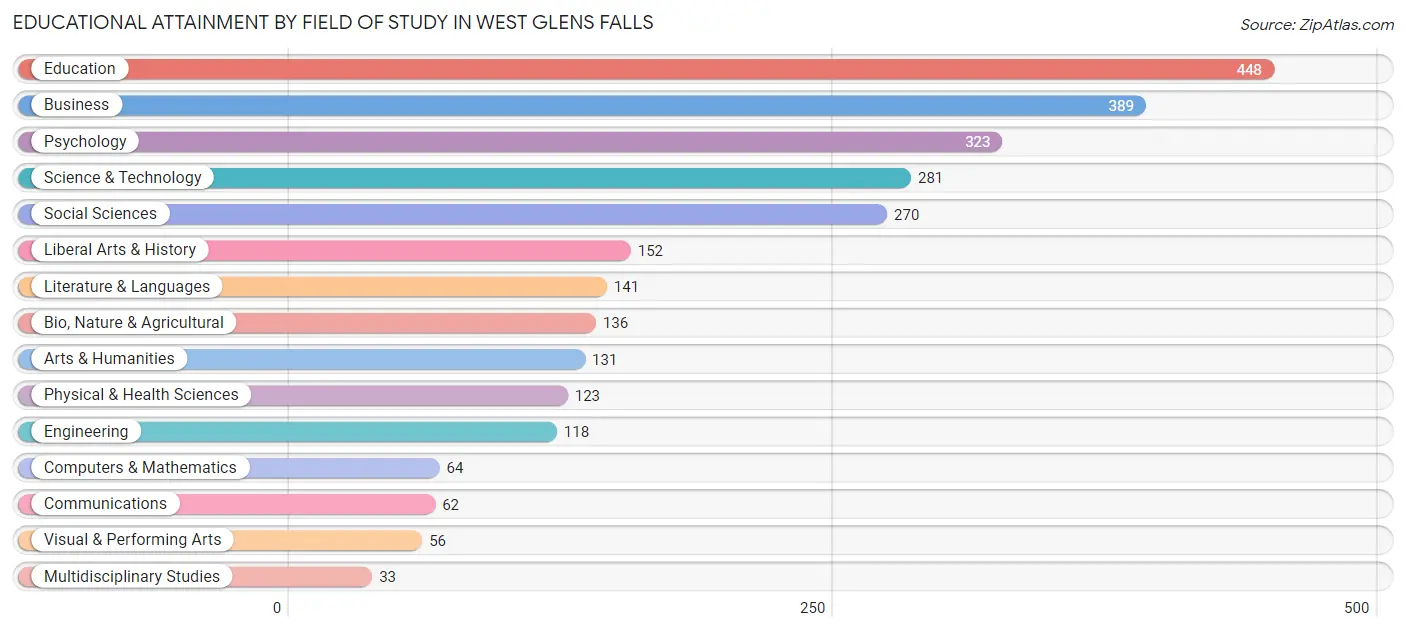
| Field of Study | # Graduates | % Graduates |
| Computers & Mathematics | 64 | 2.4% |
| Bio, Nature & Agricultural | 136 | 5.0% |
| Physical & Health Sciences | 123 | 4.5% |
| Psychology | 323 | 11.8% |
| Social Sciences | 270 | 9.9% |
| Engineering | 118 | 4.3% |
| Multidisciplinary Studies | 33 | 1.2% |
| Science & Technology | 281 | 10.3% |
| Business | 389 | 14.3% |
| Education | 448 | 16.4% |
| Literature & Languages | 141 | 5.2% |
| Liberal Arts & History | 152 | 5.6% |
| Visual & Performing Arts | 56 | 2.1% |
| Communications | 62 | 2.3% |
| Arts & Humanities | 131 | 4.8% |
| Total | 2,727 | 100.0% |
Transportation & Commute in West Glens Falls
Vehicle Availability by Sex in West Glens Falls
The most prevalent vehicle ownership categories in West Glens Falls are males with 2 vehicles (1,273, accounting for 48.4%) and females with 2 vehicles (1,228, making up 50.6%).
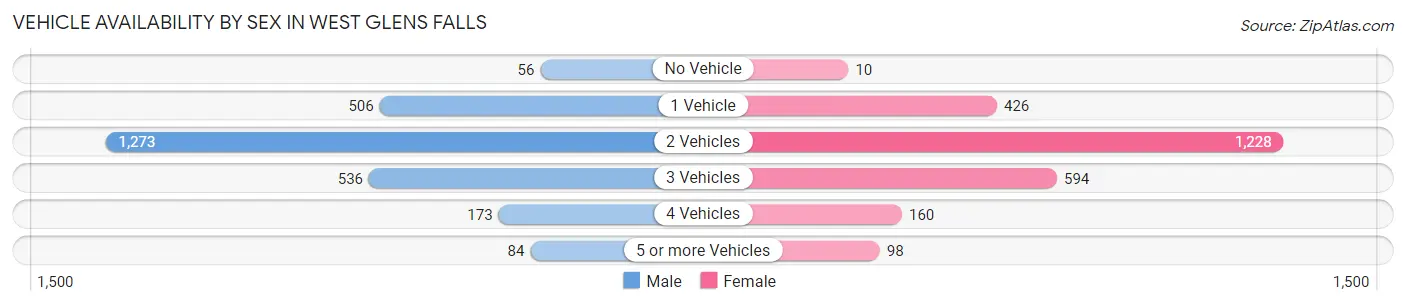
| Vehicles Available | Male | Female |
| No Vehicle | 56 (2.1%) | 10 (0.4%) |
| 1 Vehicle | 506 (19.3%) | 426 (16.9%) |
| 2 Vehicles | 1,273 (48.4%) | 1,228 (48.8%) |
| 3 Vehicles | 536 (20.4%) | 594 (23.6%) |
| 4 Vehicles | 173 (6.6%) | 160 (6.4%) |
| 5 or more Vehicles | 84 (3.2%) | 98 (3.9%) |
| Total | 2,628 (100.0%) | 2,516 (100.0%) |
Commute Time in West Glens Falls
The most frequently occuring commute durations in West Glens Falls are 15 to 19 minutes (1,049 commuters, 22.3%), 10 to 14 minutes (980 commuters, 20.8%), and 5 to 9 minutes (579 commuters, 12.3%).
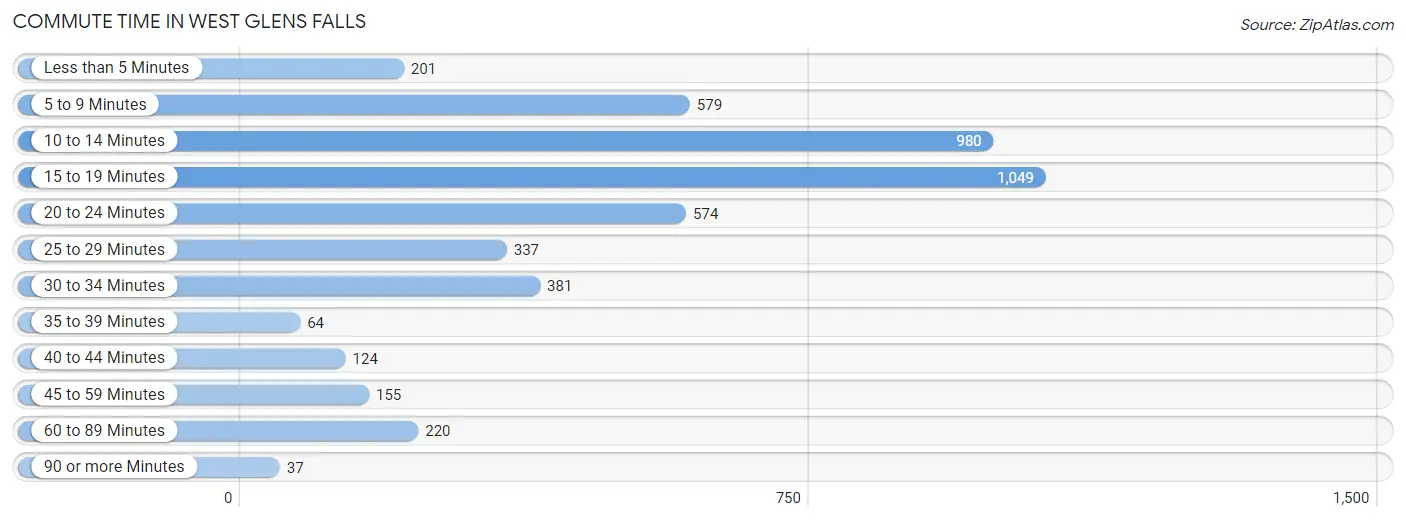
| Commute Time | # Commuters | % Commuters |
| Less than 5 Minutes | 201 | 4.3% |
| 5 to 9 Minutes | 579 | 12.3% |
| 10 to 14 Minutes | 980 | 20.8% |
| 15 to 19 Minutes | 1,049 | 22.3% |
| 20 to 24 Minutes | 574 | 12.2% |
| 25 to 29 Minutes | 337 | 7.2% |
| 30 to 34 Minutes | 381 | 8.1% |
| 35 to 39 Minutes | 64 | 1.4% |
| 40 to 44 Minutes | 124 | 2.6% |
| 45 to 59 Minutes | 155 | 3.3% |
| 60 to 89 Minutes | 220 | 4.7% |
| 90 or more Minutes | 37 | 0.8% |
Commute Time by Sex in West Glens Falls
The most common commute times in West Glens Falls are 15 to 19 minutes (536 commuters, 22.5%) for males and 10 to 14 minutes (572 commuters, 24.7%) for females.
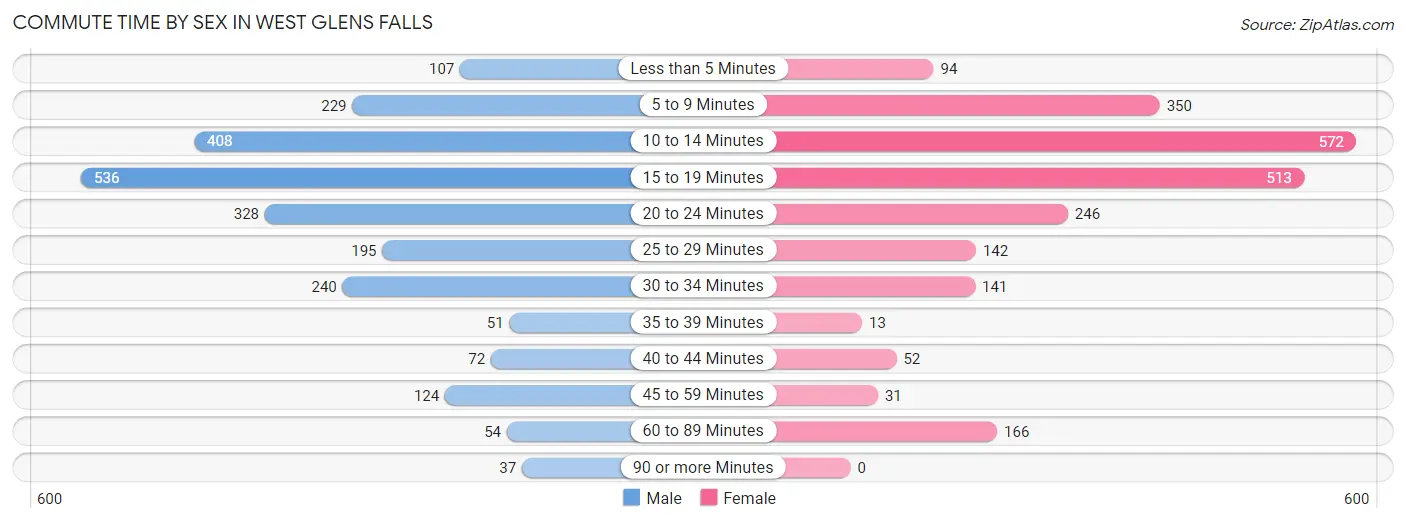
| Commute Time | Male | Female |
| Less than 5 Minutes | 107 (4.5%) | 94 (4.1%) |
| 5 to 9 Minutes | 229 (9.6%) | 350 (15.1%) |
| 10 to 14 Minutes | 408 (17.1%) | 572 (24.7%) |
| 15 to 19 Minutes | 536 (22.5%) | 513 (22.1%) |
| 20 to 24 Minutes | 328 (13.8%) | 246 (10.6%) |
| 25 to 29 Minutes | 195 (8.2%) | 142 (6.1%) |
| 30 to 34 Minutes | 240 (10.1%) | 141 (6.1%) |
| 35 to 39 Minutes | 51 (2.1%) | 13 (0.6%) |
| 40 to 44 Minutes | 72 (3.0%) | 52 (2.2%) |
| 45 to 59 Minutes | 124 (5.2%) | 31 (1.3%) |
| 60 to 89 Minutes | 54 (2.3%) | 166 (7.2%) |
| 90 or more Minutes | 37 (1.5%) | 0 (0.0%) |
Time of Departure to Work by Sex in West Glens Falls
The most frequent times of departure to work in West Glens Falls are 7:30 AM to 7:59 AM (336, 14.1%) for males and 7:30 AM to 7:59 AM (764, 32.9%) for females.
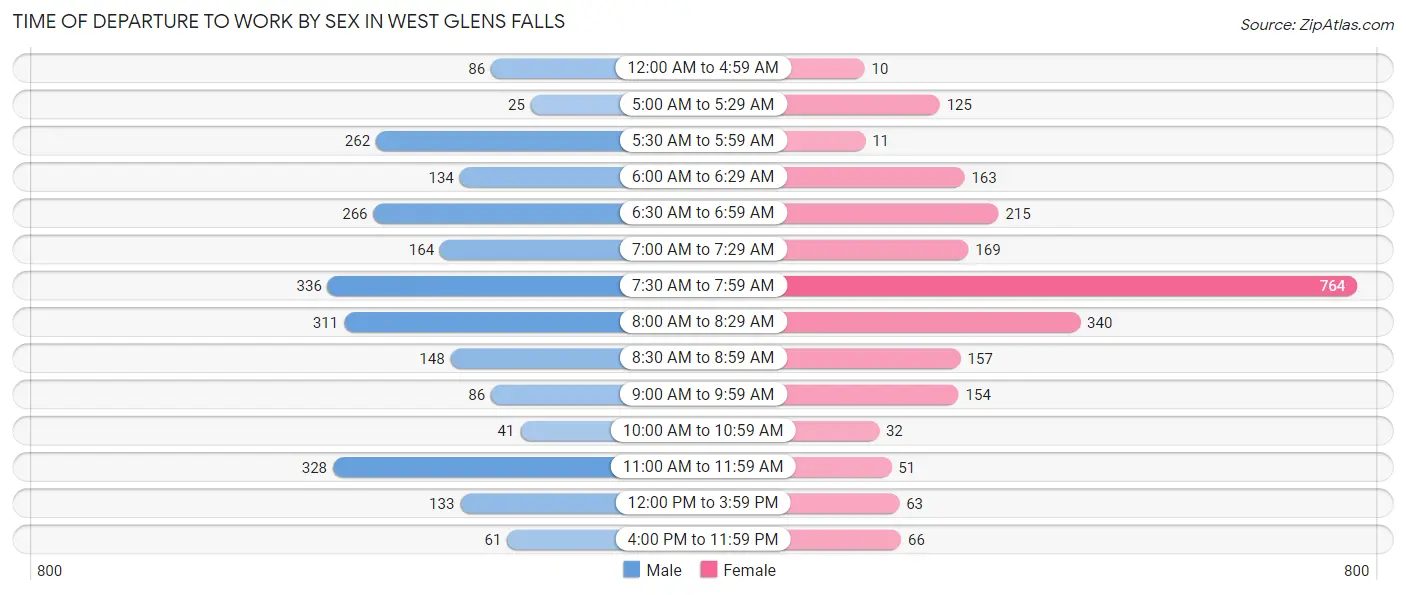
| Time of Departure | Male | Female |
| 12:00 AM to 4:59 AM | 86 (3.6%) | 10 (0.4%) |
| 5:00 AM to 5:29 AM | 25 (1.1%) | 125 (5.4%) |
| 5:30 AM to 5:59 AM | 262 (11.0%) | 11 (0.5%) |
| 6:00 AM to 6:29 AM | 134 (5.6%) | 163 (7.0%) |
| 6:30 AM to 6:59 AM | 266 (11.2%) | 215 (9.3%) |
| 7:00 AM to 7:29 AM | 164 (6.9%) | 169 (7.3%) |
| 7:30 AM to 7:59 AM | 336 (14.1%) | 764 (32.9%) |
| 8:00 AM to 8:29 AM | 311 (13.1%) | 340 (14.7%) |
| 8:30 AM to 8:59 AM | 148 (6.2%) | 157 (6.8%) |
| 9:00 AM to 9:59 AM | 86 (3.6%) | 154 (6.6%) |
| 10:00 AM to 10:59 AM | 41 (1.7%) | 32 (1.4%) |
| 11:00 AM to 11:59 AM | 328 (13.8%) | 51 (2.2%) |
| 12:00 PM to 3:59 PM | 133 (5.6%) | 63 (2.7%) |
| 4:00 PM to 11:59 PM | 61 (2.6%) | 66 (2.8%) |
| Total | 2,381 (100.0%) | 2,320 (100.0%) |
Housing Occupancy in West Glens Falls
Occupancy by Ownership in West Glens Falls
Of the total 3,734 dwellings in West Glens Falls, owner-occupied units account for 3,211 (86.0%), while renter-occupied units make up 523 (14.0%).
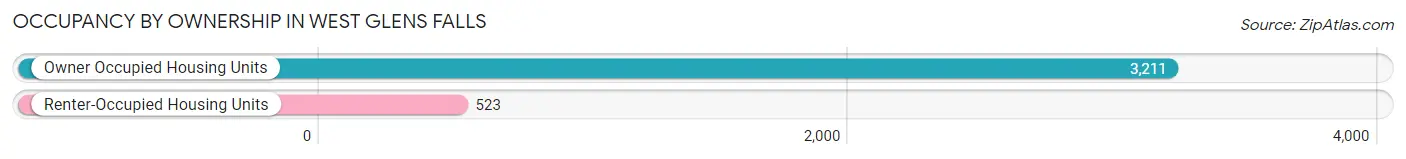
| Occupancy | # Housing Units | % Housing Units |
| Owner Occupied Housing Units | 3,211 | 86.0% |
| Renter-Occupied Housing Units | 523 | 14.0% |
| Total Occupied Housing Units | 3,734 | 100.0% |
Occupancy by Household Size in West Glens Falls
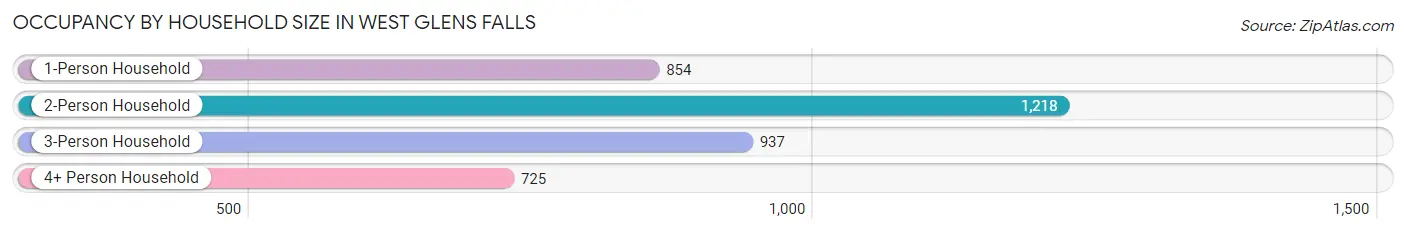
| Household Size | # Housing Units | % Housing Units |
| 1-Person Household | 854 | 22.9% |
| 2-Person Household | 1,218 | 32.6% |
| 3-Person Household | 937 | 25.1% |
| 4+ Person Household | 725 | 19.4% |
| Total Housing Units | 3,734 | 100.0% |
Occupancy by Ownership by Household Size in West Glens Falls
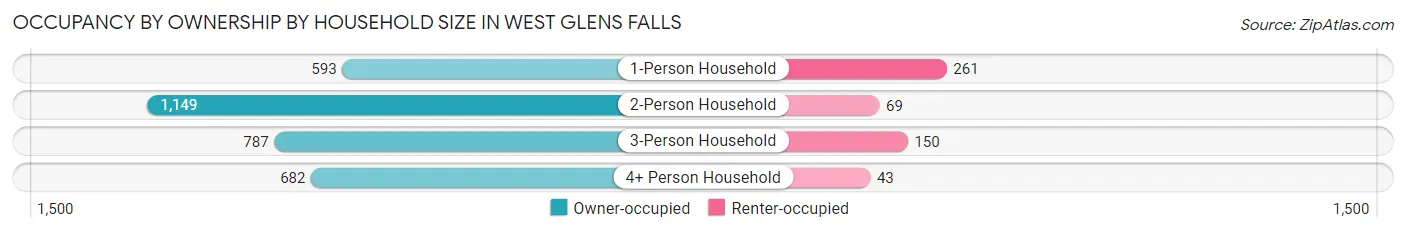
| Household Size | Owner-occupied | Renter-occupied |
| 1-Person Household | 593 (69.4%) | 261 (30.6%) |
| 2-Person Household | 1,149 (94.3%) | 69 (5.7%) |
| 3-Person Household | 787 (84.0%) | 150 (16.0%) |
| 4+ Person Household | 682 (94.1%) | 43 (5.9%) |
| Total Housing Units | 3,211 (86.0%) | 523 (14.0%) |
Occupancy by Educational Attainment in West Glens Falls
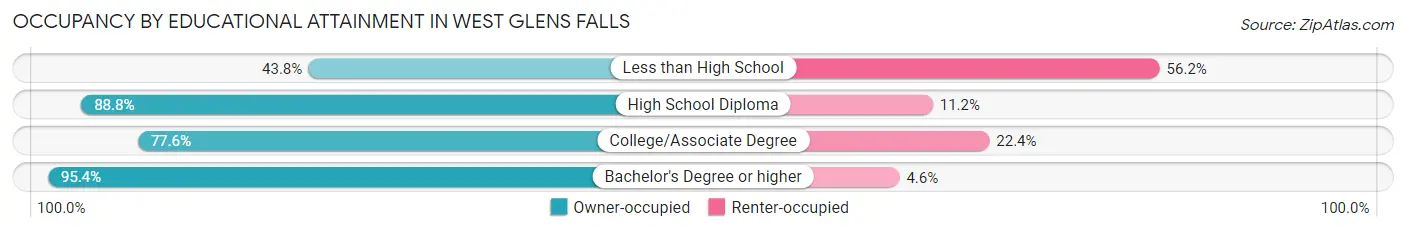
| Household Size | Owner-occupied | Renter-occupied |
| Less than High School | 67 (43.8%) | 86 (56.2%) |
| High School Diploma | 767 (88.8%) | 97 (11.2%) |
| College/Associate Degree | 933 (77.6%) | 270 (22.4%) |
| Bachelor's Degree or higher | 1,444 (95.4%) | 70 (4.6%) |
Occupancy by Age of Householder in West Glens Falls
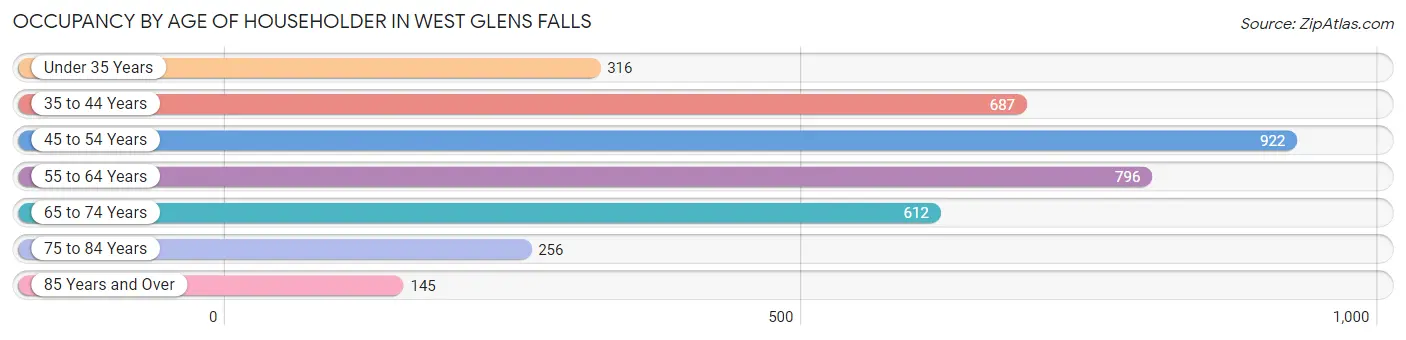
| Age Bracket | # Households | % Households |
| Under 35 Years | 316 | 8.5% |
| 35 to 44 Years | 687 | 18.4% |
| 45 to 54 Years | 922 | 24.7% |
| 55 to 64 Years | 796 | 21.3% |
| 65 to 74 Years | 612 | 16.4% |
| 75 to 84 Years | 256 | 6.9% |
| 85 Years and Over | 145 | 3.9% |
| Total | 3,734 | 100.0% |
Housing Finances in West Glens Falls
Median Income by Occupancy in West Glens Falls
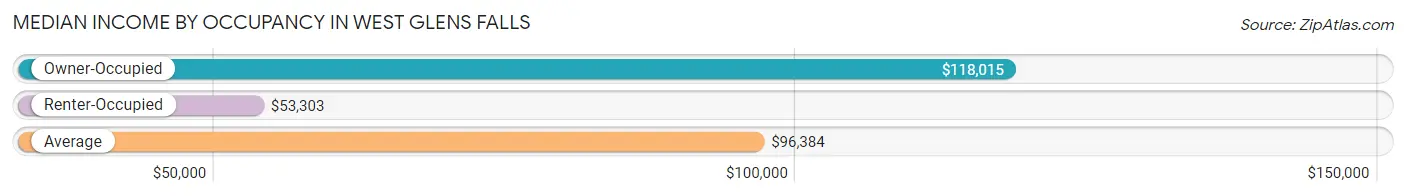
| Occupancy Type | # Households | Median Income |
| Owner-Occupied | 3,211 (86.0%) | $118,015 |
| Renter-Occupied | 523 (14.0%) | $53,303 |
| Average | 3,734 (100.0%) | $96,384 |
Occupancy by Householder Income Bracket in West Glens Falls
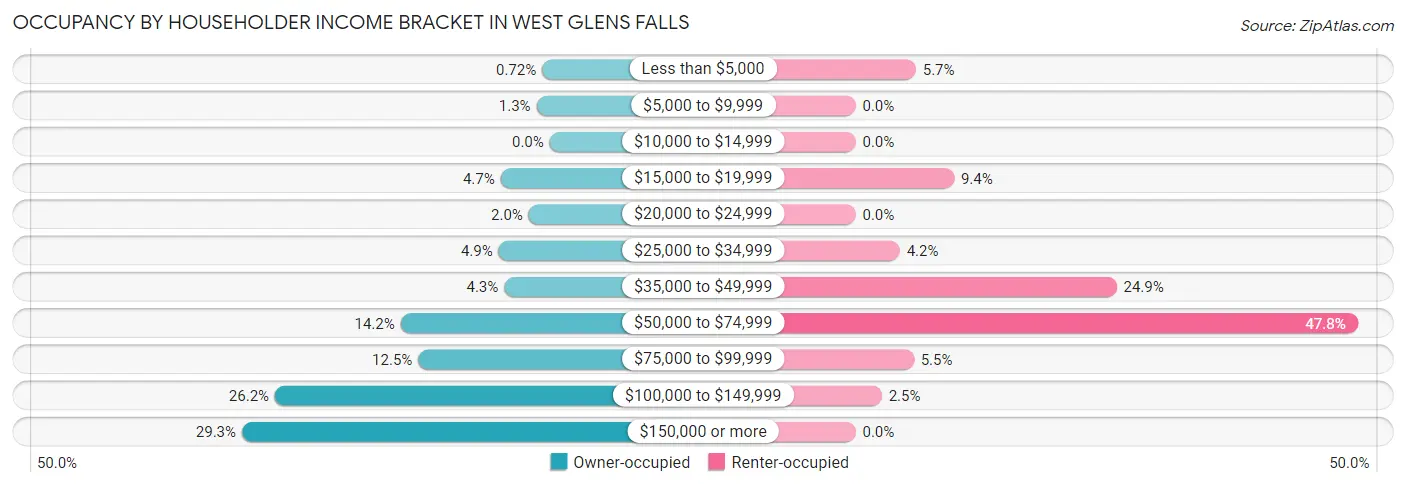
| Income Bracket | Owner-occupied | Renter-occupied |
| Less than $5,000 | 23 (0.7%) | 30 (5.7%) |
| $5,000 to $9,999 | 40 (1.3%) | 0 (0.0%) |
| $10,000 to $14,999 | 0 (0.0%) | 0 (0.0%) |
| $15,000 to $19,999 | 150 (4.7%) | 49 (9.4%) |
| $20,000 to $24,999 | 64 (2.0%) | 0 (0.0%) |
| $25,000 to $34,999 | 156 (4.9%) | 22 (4.2%) |
| $35,000 to $49,999 | 139 (4.3%) | 130 (24.9%) |
| $50,000 to $74,999 | 456 (14.2%) | 250 (47.8%) |
| $75,000 to $99,999 | 402 (12.5%) | 29 (5.5%) |
| $100,000 to $149,999 | 840 (26.2%) | 13 (2.5%) |
| $150,000 or more | 941 (29.3%) | 0 (0.0%) |
| Total | 3,211 (100.0%) | 523 (100.0%) |
Monthly Housing Cost Tiers in West Glens Falls
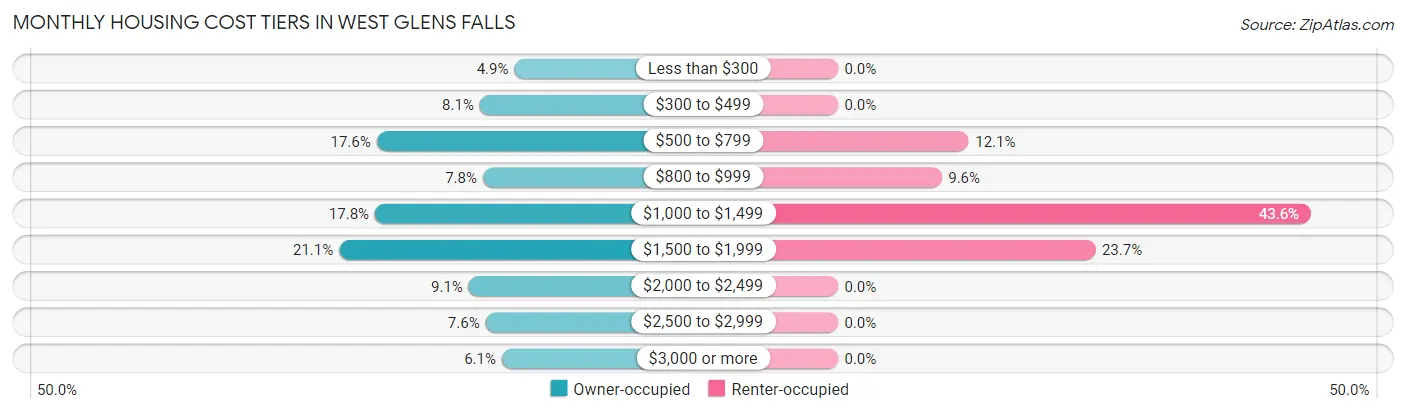
| Monthly Cost | Owner-occupied | Renter-occupied |
| Less than $300 | 158 (4.9%) | 0 (0.0%) |
| $300 to $499 | 260 (8.1%) | 0 (0.0%) |
| $500 to $799 | 565 (17.6%) | 63 (12.0%) |
| $800 to $999 | 251 (7.8%) | 50 (9.6%) |
| $1,000 to $1,499 | 570 (17.7%) | 228 (43.6%) |
| $1,500 to $1,999 | 676 (21.0%) | 124 (23.7%) |
| $2,000 to $2,499 | 293 (9.1%) | 0 (0.0%) |
| $2,500 to $2,999 | 243 (7.6%) | 0 (0.0%) |
| $3,000 or more | 195 (6.1%) | 0 (0.0%) |
| Total | 3,211 (100.0%) | 523 (100.0%) |
Physical Housing Characteristics in West Glens Falls
Housing Structures in West Glens Falls
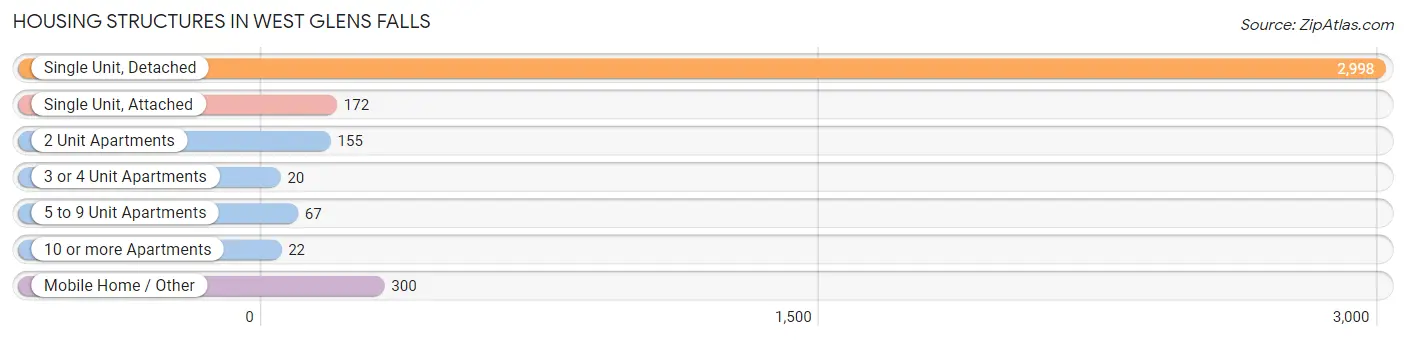
| Structure Type | # Housing Units | % Housing Units |
| Single Unit, Detached | 2,998 | 80.3% |
| Single Unit, Attached | 172 | 4.6% |
| 2 Unit Apartments | 155 | 4.2% |
| 3 or 4 Unit Apartments | 20 | 0.5% |
| 5 to 9 Unit Apartments | 67 | 1.8% |
| 10 or more Apartments | 22 | 0.6% |
| Mobile Home / Other | 300 | 8.0% |
| Total | 3,734 | 100.0% |
Housing Structures by Occupancy in West Glens Falls
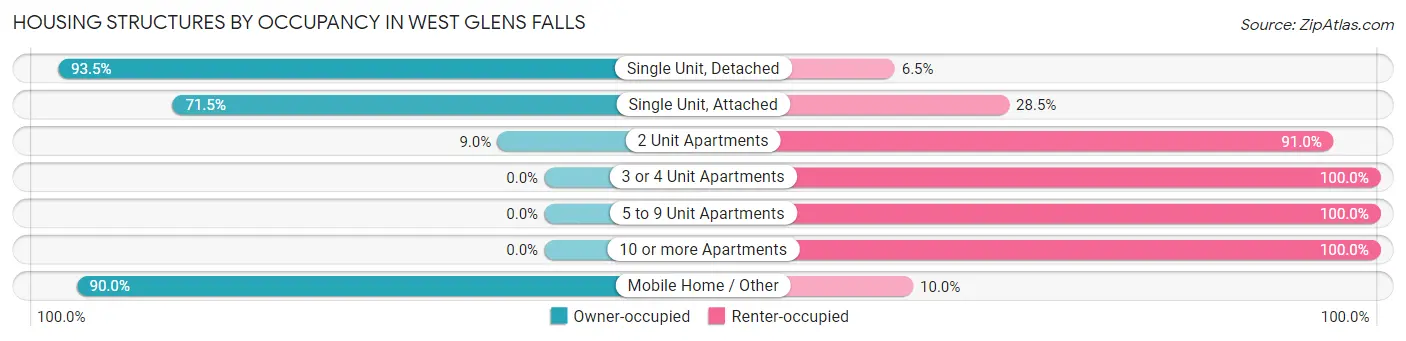
| Structure Type | Owner-occupied | Renter-occupied |
| Single Unit, Detached | 2,804 (93.5%) | 194 (6.5%) |
| Single Unit, Attached | 123 (71.5%) | 49 (28.5%) |
| 2 Unit Apartments | 14 (9.0%) | 141 (91.0%) |
| 3 or 4 Unit Apartments | 0 (0.0%) | 20 (100.0%) |
| 5 to 9 Unit Apartments | 0 (0.0%) | 67 (100.0%) |
| 10 or more Apartments | 0 (0.0%) | 22 (100.0%) |
| Mobile Home / Other | 270 (90.0%) | 30 (10.0%) |
| Total | 3,211 (86.0%) | 523 (14.0%) |
Housing Structures by Number of Rooms in West Glens Falls
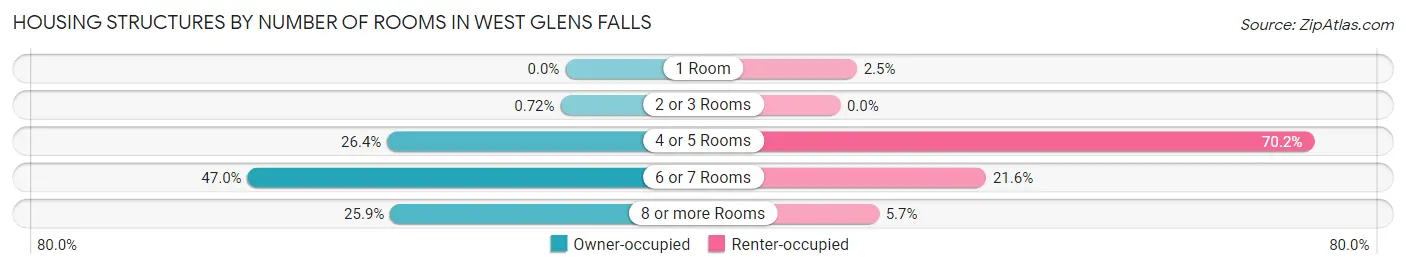
| Number of Rooms | Owner-occupied | Renter-occupied |
| 1 Room | 0 (0.0%) | 13 (2.5%) |
| 2 or 3 Rooms | 23 (0.7%) | 0 (0.0%) |
| 4 or 5 Rooms | 846 (26.4%) | 367 (70.2%) |
| 6 or 7 Rooms | 1,510 (47.0%) | 113 (21.6%) |
| 8 or more Rooms | 832 (25.9%) | 30 (5.7%) |
| Total | 3,211 (100.0%) | 523 (100.0%) |
Housing Structure by Heating Type in West Glens Falls
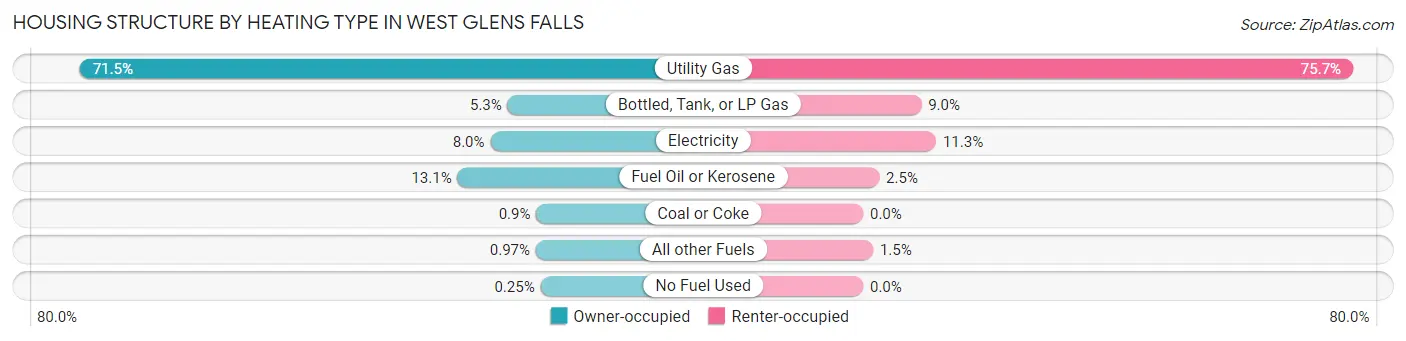
| Heating Type | Owner-occupied | Renter-occupied |
| Utility Gas | 2,295 (71.5%) | 396 (75.7%) |
| Bottled, Tank, or LP Gas | 171 (5.3%) | 47 (9.0%) |
| Electricity | 257 (8.0%) | 59 (11.3%) |
| Fuel Oil or Kerosene | 420 (13.1%) | 13 (2.5%) |
| Coal or Coke | 29 (0.9%) | 0 (0.0%) |
| All other Fuels | 31 (1.0%) | 8 (1.5%) |
| No Fuel Used | 8 (0.3%) | 0 (0.0%) |
| Total | 3,211 (100.0%) | 523 (100.0%) |
Household Vehicle Usage in West Glens Falls
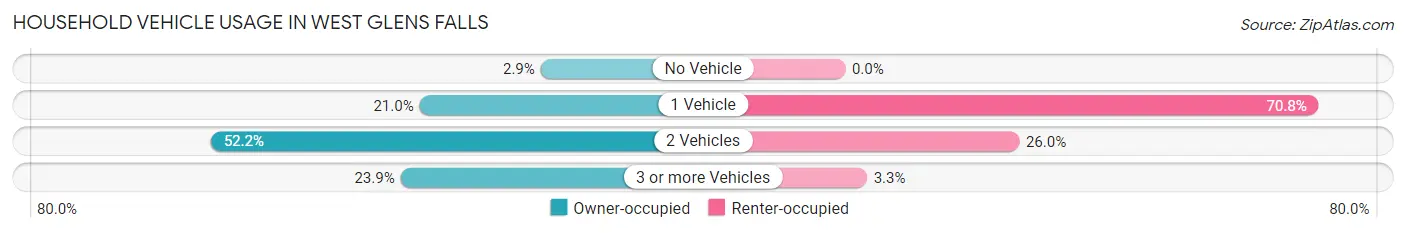
| Vehicles per Household | Owner-occupied | Renter-occupied |
| No Vehicle | 94 (2.9%) | 0 (0.0%) |
| 1 Vehicle | 675 (21.0%) | 370 (70.8%) |
| 2 Vehicles | 1,676 (52.2%) | 136 (26.0%) |
| 3 or more Vehicles | 766 (23.9%) | 17 (3.3%) |
| Total | 3,211 (100.0%) | 523 (100.0%) |
Real Estate & Mortgages in West Glens Falls
Real Estate and Mortgage Overview in West Glens Falls
| Characteristic | Without Mortgage | With Mortgage |
| Housing Units | 1,119 | 2,092 |
| Median Property Value | $216,900 | $275,100 |
| Median Household Income | $65,689 | $754 |
| Monthly Housing Costs | $607 | $195 |
| Real Estate Taxes | $3,700 | $179 |
Property Value by Mortgage Status in West Glens Falls
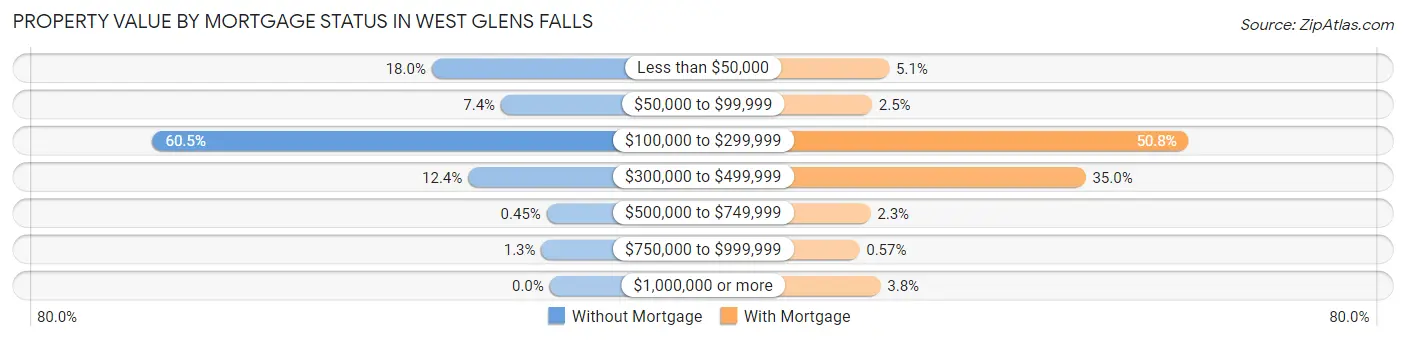
| Property Value | Without Mortgage | With Mortgage |
| Less than $50,000 | 201 (18.0%) | 107 (5.1%) |
| $50,000 to $99,999 | 83 (7.4%) | 52 (2.5%) |
| $100,000 to $299,999 | 677 (60.5%) | 1,062 (50.8%) |
| $300,000 to $499,999 | 139 (12.4%) | 733 (35.0%) |
| $500,000 to $749,999 | 5 (0.4%) | 47 (2.2%) |
| $750,000 to $999,999 | 14 (1.3%) | 12 (0.6%) |
| $1,000,000 or more | 0 (0.0%) | 79 (3.8%) |
| Total | 1,119 (100.0%) | 2,092 (100.0%) |
Household Income by Mortgage Status in West Glens Falls
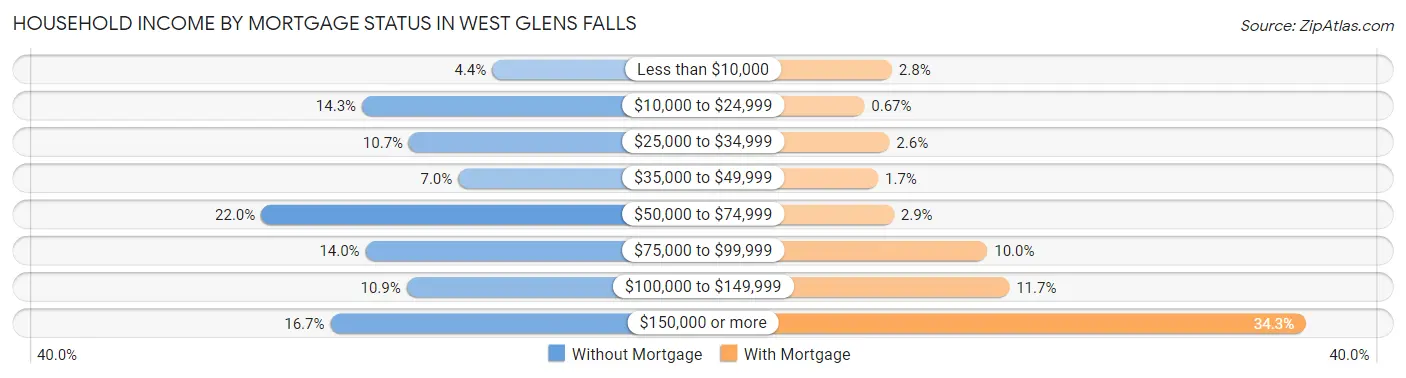
| Household Income | Without Mortgage | With Mortgage |
| Less than $10,000 | 49 (4.4%) | 58 (2.8%) |
| $10,000 to $24,999 | 160 (14.3%) | 14 (0.7%) |
| $25,000 to $34,999 | 120 (10.7%) | 54 (2.6%) |
| $35,000 to $49,999 | 78 (7.0%) | 36 (1.7%) |
| $50,000 to $74,999 | 246 (22.0%) | 61 (2.9%) |
| $75,000 to $99,999 | 157 (14.0%) | 210 (10.0%) |
| $100,000 to $149,999 | 122 (10.9%) | 245 (11.7%) |
| $150,000 or more | 187 (16.7%) | 718 (34.3%) |
| Total | 1,119 (100.0%) | 2,092 (100.0%) |
Property Value to Household Income Ratio in West Glens Falls
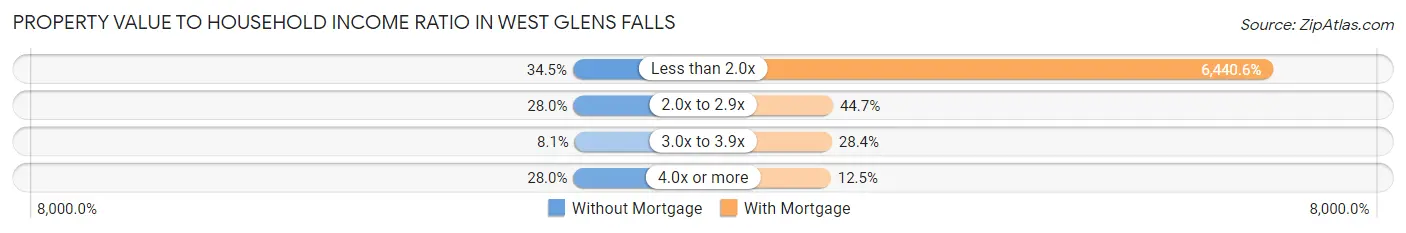
| Value-to-Income Ratio | Without Mortgage | With Mortgage |
| Less than 2.0x | 386 (34.5%) | 134,737 (6,440.6%) |
| 2.0x to 2.9x | 313 (28.0%) | 935 (44.7%) |
| 3.0x to 3.9x | 91 (8.1%) | 595 (28.4%) |
| 4.0x or more | 313 (28.0%) | 262 (12.5%) |
| Total | 1,119 (100.0%) | 2,092 (100.0%) |
Real Estate Taxes by Mortgage Status in West Glens Falls
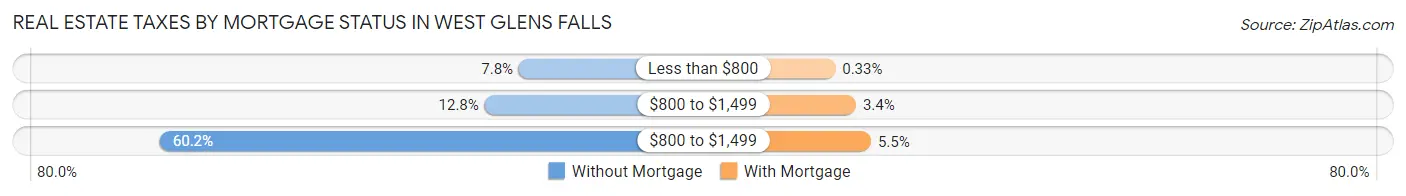
| Property Taxes | Without Mortgage | With Mortgage |
| Less than $800 | 87 (7.8%) | 7 (0.3%) |
| $800 to $1,499 | 143 (12.8%) | 70 (3.4%) |
| $800 to $1,499 | 674 (60.2%) | 116 (5.5%) |
| Total | 1,119 (100.0%) | 2,092 (100.0%) |
Health & Disability in West Glens Falls
Health Insurance Coverage by Age in West Glens Falls
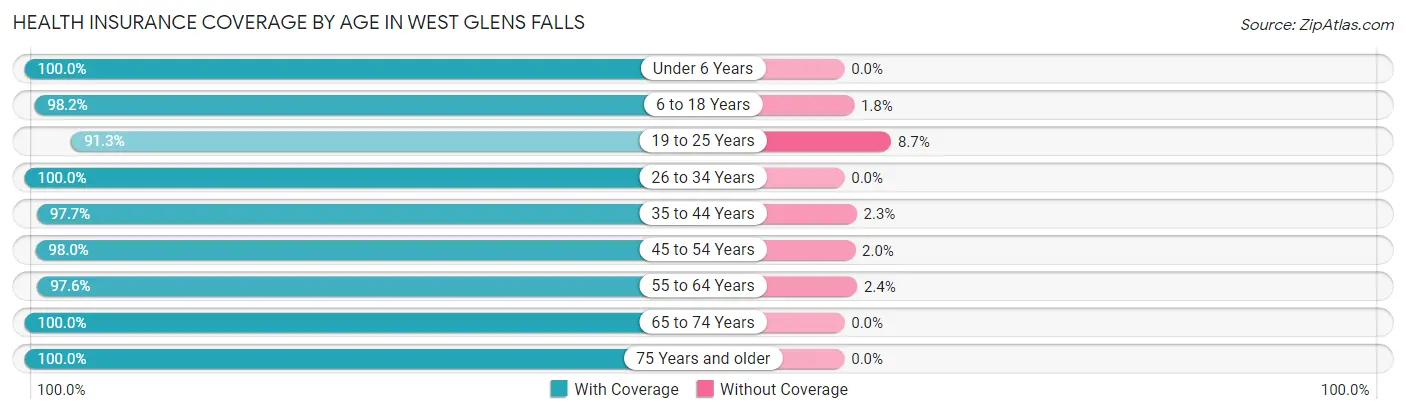
| Age Bracket | With Coverage | Without Coverage |
| Under 6 Years | 404 (100.0%) | 0 (0.0%) |
| 6 to 18 Years | 1,788 (98.2%) | 33 (1.8%) |
| 19 to 25 Years | 514 (91.3%) | 49 (8.7%) |
| 26 to 34 Years | 701 (100.0%) | 0 (0.0%) |
| 35 to 44 Years | 1,363 (97.7%) | 32 (2.3%) |
| 45 to 54 Years | 1,649 (98.0%) | 34 (2.0%) |
| 55 to 64 Years | 1,445 (97.6%) | 35 (2.4%) |
| 65 to 74 Years | 884 (100.0%) | 0 (0.0%) |
| 75 Years and older | 522 (100.0%) | 0 (0.0%) |
| Total | 9,270 (98.1%) | 183 (1.9%) |
Health Insurance Coverage by Citizenship Status in West Glens Falls
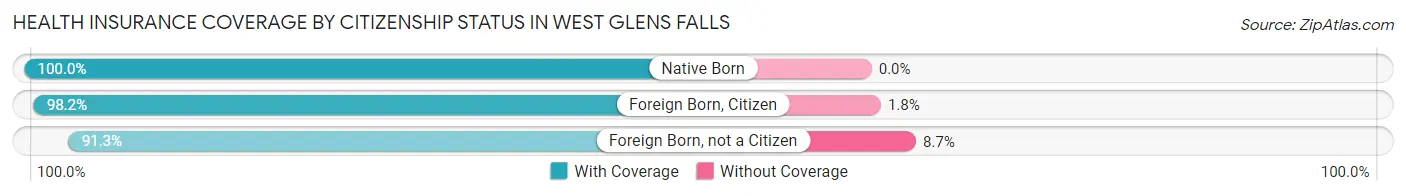
| Citizenship Status | With Coverage | Without Coverage |
| Native Born | 404 (100.0%) | 0 (0.0%) |
| Foreign Born, Citizen | 1,788 (98.2%) | 33 (1.8%) |
| Foreign Born, not a Citizen | 514 (91.3%) | 49 (8.7%) |
Health Insurance Coverage by Household Income in West Glens Falls
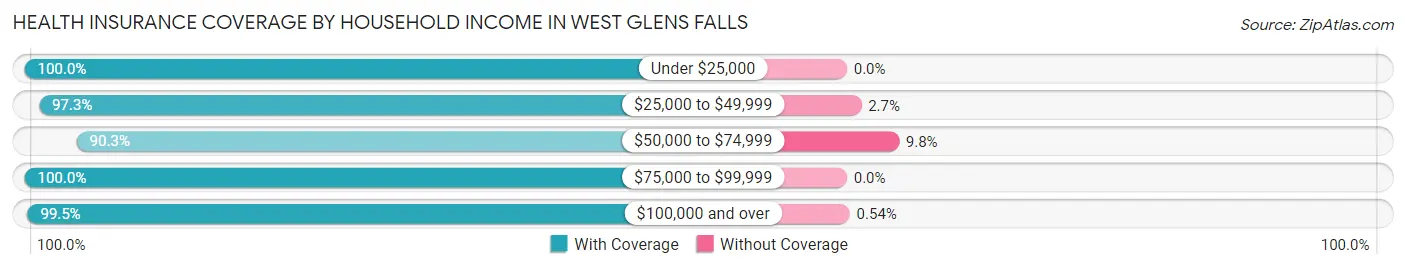
| Household Income | With Coverage | Without Coverage |
| Under $25,000 | 697 (100.0%) | 0 (0.0%) |
| $25,000 to $49,999 | 721 (97.3%) | 20 (2.7%) |
| $50,000 to $74,999 | 1,231 (90.2%) | 133 (9.8%) |
| $75,000 to $99,999 | 1,071 (100.0%) | 0 (0.0%) |
| $100,000 and over | 5,545 (99.5%) | 30 (0.5%) |
Public vs Private Health Insurance Coverage by Age in West Glens Falls
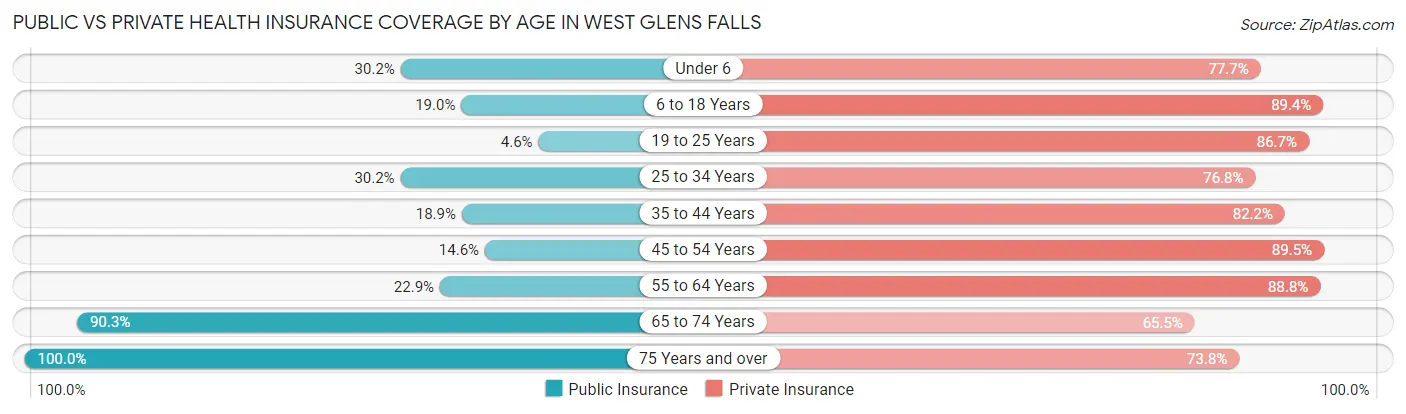
| Age Bracket | Public Insurance | Private Insurance |
| Under 6 | 122 (30.2%) | 314 (77.7%) |
| 6 to 18 Years | 345 (19.0%) | 1,627 (89.3%) |
| 19 to 25 Years | 26 (4.6%) | 488 (86.7%) |
| 25 to 34 Years | 212 (30.2%) | 538 (76.7%) |
| 35 to 44 Years | 263 (18.9%) | 1,147 (82.2%) |
| 45 to 54 Years | 245 (14.6%) | 1,506 (89.5%) |
| 55 to 64 Years | 339 (22.9%) | 1,314 (88.8%) |
| 65 to 74 Years | 798 (90.3%) | 579 (65.5%) |
| 75 Years and over | 522 (100.0%) | 385 (73.8%) |
| Total | 2,872 (30.4%) | 7,898 (83.6%) |
Disability Status by Sex by Age in West Glens Falls
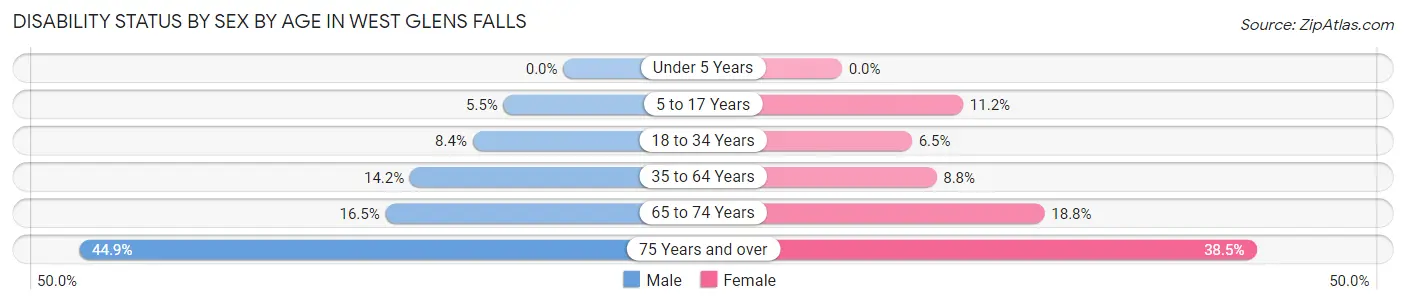
| Age Bracket | Male | Female |
| Under 5 Years | 0 (0.0%) | 0 (0.0%) |
| 5 to 17 Years | 51 (5.5%) | 95 (11.2%) |
| 18 to 34 Years | 57 (8.4%) | 45 (6.5%) |
| 35 to 64 Years | 342 (14.2%) | 189 (8.8%) |
| 65 to 74 Years | 66 (16.5%) | 91 (18.8%) |
| 75 Years and over | 71 (44.9%) | 140 (38.5%) |
Disability Class by Sex by Age in West Glens Falls
Disability Class: Hearing Difficulty
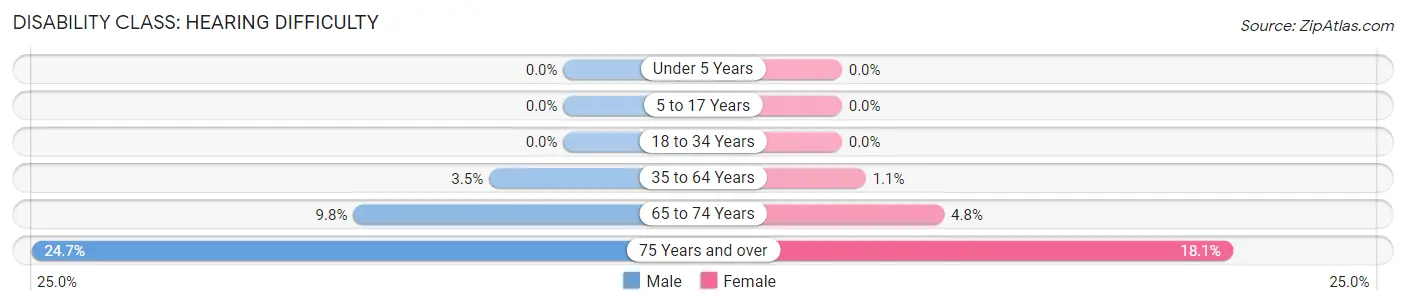
| Age Bracket | Male | Female |
| Under 5 Years | 0 (0.0%) | 0 (0.0%) |
| 5 to 17 Years | 0 (0.0%) | 0 (0.0%) |
| 18 to 34 Years | 0 (0.0%) | 0 (0.0%) |
| 35 to 64 Years | 83 (3.5%) | 24 (1.1%) |
| 65 to 74 Years | 39 (9.8%) | 23 (4.8%) |
| 75 Years and over | 39 (24.7%) | 66 (18.1%) |
Disability Class: Vision Difficulty
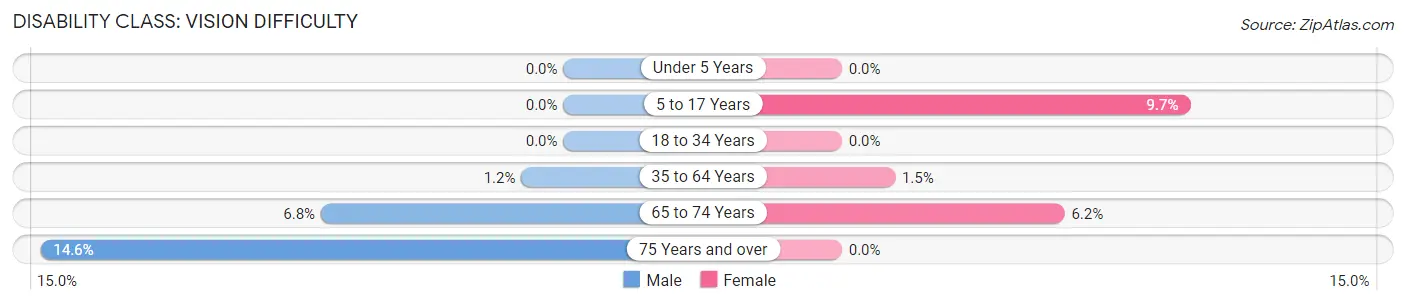
| Age Bracket | Male | Female |
| Under 5 Years | 0 (0.0%) | 0 (0.0%) |
| 5 to 17 Years | 0 (0.0%) | 82 (9.7%) |
| 18 to 34 Years | 0 (0.0%) | 0 (0.0%) |
| 35 to 64 Years | 28 (1.2%) | 32 (1.5%) |
| 65 to 74 Years | 27 (6.8%) | 30 (6.2%) |
| 75 Years and over | 23 (14.6%) | 0 (0.0%) |
Disability Class: Cognitive Difficulty
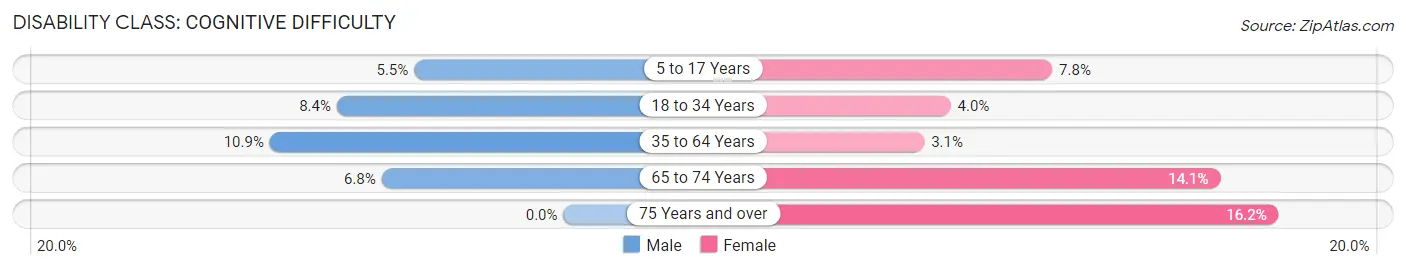
| Age Bracket | Male | Female |
| 5 to 17 Years | 51 (5.5%) | 66 (7.8%) |
| 18 to 34 Years | 57 (8.4%) | 28 (4.0%) |
| 35 to 64 Years | 262 (10.9%) | 66 (3.1%) |
| 65 to 74 Years | 27 (6.8%) | 68 (14.1%) |
| 75 Years and over | 0 (0.0%) | 59 (16.2%) |
Disability Class: Ambulatory Difficulty
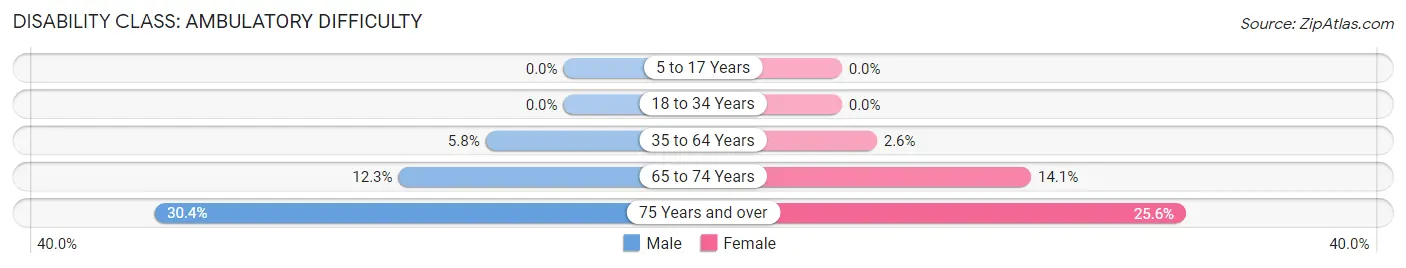
| Age Bracket | Male | Female |
| 5 to 17 Years | 0 (0.0%) | 0 (0.0%) |
| 18 to 34 Years | 0 (0.0%) | 0 (0.0%) |
| 35 to 64 Years | 139 (5.8%) | 56 (2.6%) |
| 65 to 74 Years | 49 (12.2%) | 68 (14.1%) |
| 75 Years and over | 48 (30.4%) | 93 (25.6%) |
Disability Class: Self-Care Difficulty
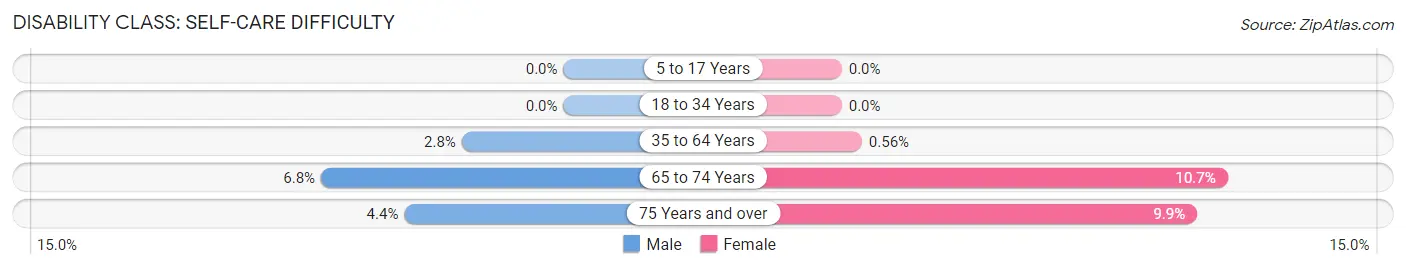
| Age Bracket | Male | Female |
| 5 to 17 Years | 0 (0.0%) | 0 (0.0%) |
| 18 to 34 Years | 0 (0.0%) | 0 (0.0%) |
| 35 to 64 Years | 68 (2.8%) | 12 (0.6%) |
| 65 to 74 Years | 27 (6.8%) | 52 (10.7%) |
| 75 Years and over | 7 (4.4%) | 36 (9.9%) |
Technology Access in West Glens Falls
Computing Device Access in West Glens Falls
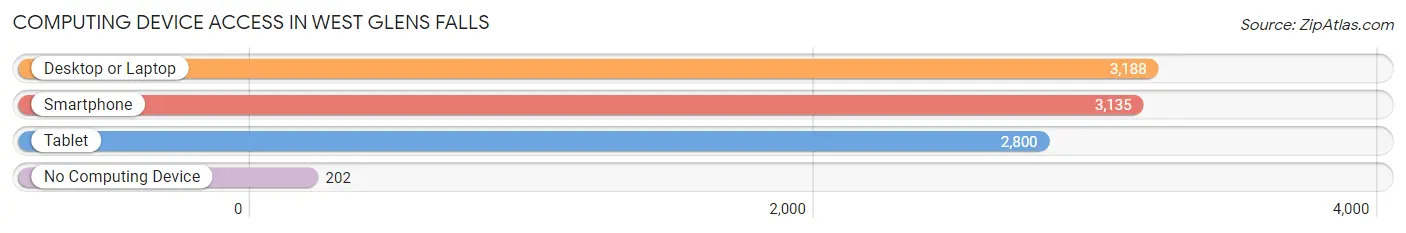
| Device Type | # Households | % Households |
| Desktop or Laptop | 3,188 | 85.4% |
| Smartphone | 3,135 | 84.0% |
| Tablet | 2,800 | 75.0% |
| No Computing Device | 202 | 5.4% |
| Total | 3,734 | 100.0% |
Internet Access in West Glens Falls
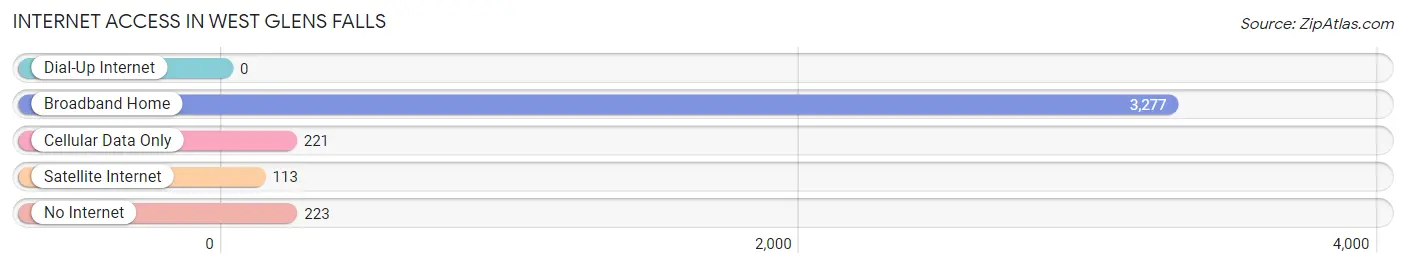
| Internet Type | # Households | % Households |
| Dial-Up Internet | 0 | 0.0% |
| Broadband Home | 3,277 | 87.8% |
| Cellular Data Only | 221 | 5.9% |
| Satellite Internet | 113 | 3.0% |
| No Internet | 223 | 6.0% |
| Total | 3,734 | 100.0% |
West Glens Falls Summary
West Glens Falls is a village located in the town of Queensbury in Warren County, New York. It is situated on the west side of the Hudson River, just north of the city of Glens Falls. The village has a population of approximately 2,000 people and is part of the Glens Falls Metropolitan Statistical Area.
History
The area that is now West Glens Falls was originally inhabited by the Mohawk and Iroquois Native American tribes. The first European settlers arrived in the area in the late 1700s, and the village was officially incorporated in 1838. The village was originally known as “West Glens Falls” due to its location on the west side of the Hudson River.
The village was an important stop on the Underground Railroad, and many escaped slaves found refuge in the area. In the late 1800s, the village was a popular tourist destination due to its proximity to the Hudson River and the Adirondack Mountains.
Geography
West Glens Falls is located in the Adirondack Mountains region of New York. The village is situated on the west side of the Hudson River, just north of the city of Glens Falls. The village is bordered by the towns of Queensbury and Fort Edward to the north, and the town of Moreau to the south.
The village is located at an elevation of approximately 500 feet above sea level. The terrain is mostly flat, with some rolling hills. The village is located in a temperate climate zone, with cold winters and warm summers.
Economy
West Glens Falls is a small village with a limited economy. The village is home to several small businesses, including restaurants, retail stores, and professional services. The village is also home to a number of manufacturing companies, including a paper mill and a plastics factory.
The village is also home to a number of tourist attractions, including the Adirondack Scenic Railroad, the Great Escape amusement park, and the West Glens Falls Historical Society. The village is also home to a number of parks and recreational areas, including the West Glens Falls Park and the West Glens Falls Nature Preserve.
Demographics
As of the 2010 census, the population of West Glens Falls was 2,039. The racial makeup of the village was 94.3% White, 1.7% African American, 0.3% Native American, 0.7% Asian, 0.1% Pacific Islander, 1.2% from other races, and 1.9% from two or more races. Hispanic or Latino of any race were 3.2% of the population.
The median household income in West Glens Falls was $45,938, and the median family income was $51,938. The per capita income for the village was $21,938. About 8.3% of families and 10.2% of the population were below the poverty line, including 14.2% of those under age 18 and 5.2% of those age 65 or over.
Common Questions
What is Per Capita Income in West Glens Falls?
Per Capita income in West Glens Falls is $43,546.
What is the Median Family Income in West Glens Falls?
Median Family Income in West Glens Falls is $126,766.
What is the Median Household income in West Glens Falls?
Median Household Income in West Glens Falls is $96,384.
What is Income or Wage Gap in West Glens Falls?
Income or Wage Gap in West Glens Falls is 16.7%.
Women in West Glens Falls earn 83.3 cents for every dollar earned by a man.
What is Inequality or Gini Index in West Glens Falls?
Inequality or Gini Index in West Glens Falls is 0.37.
What is the Total Population of West Glens Falls?
Total Population of West Glens Falls is 9,565.
What is the Total Male Population of West Glens Falls?
Total Male Population of West Glens Falls is 4,788.
What is the Total Female Population of West Glens Falls?
Total Female Population of West Glens Falls is 4,777.
What is the Ratio of Males per 100 Females in West Glens Falls?
There are 100.23 Males per 100 Females in West Glens Falls.
What is the Ratio of Females per 100 Males in West Glens Falls?
There are 99.77 Females per 100 Males in West Glens Falls.
What is the Median Population Age in West Glens Falls?
Median Population Age in West Glens Falls is 42.9 Years.
What is the Average Family Size in West Glens Falls
Average Family Size in West Glens Falls is 2.9 People.
What is the Average Household Size in West Glens Falls
Average Household Size in West Glens Falls is 2.5 People.
How Large is the Labor Force in West Glens Falls?
There are 5,368 People in the Labor Forcein in West Glens Falls.
What is the Percentage of People in the Labor Force in West Glens Falls?
67.8% of People are in the Labor Force in West Glens Falls.
What is the Unemployment Rate in West Glens Falls?
Unemployment Rate in West Glens Falls is 2.5%.