Johnstown, NY Map & Demographics
Johnstown Map
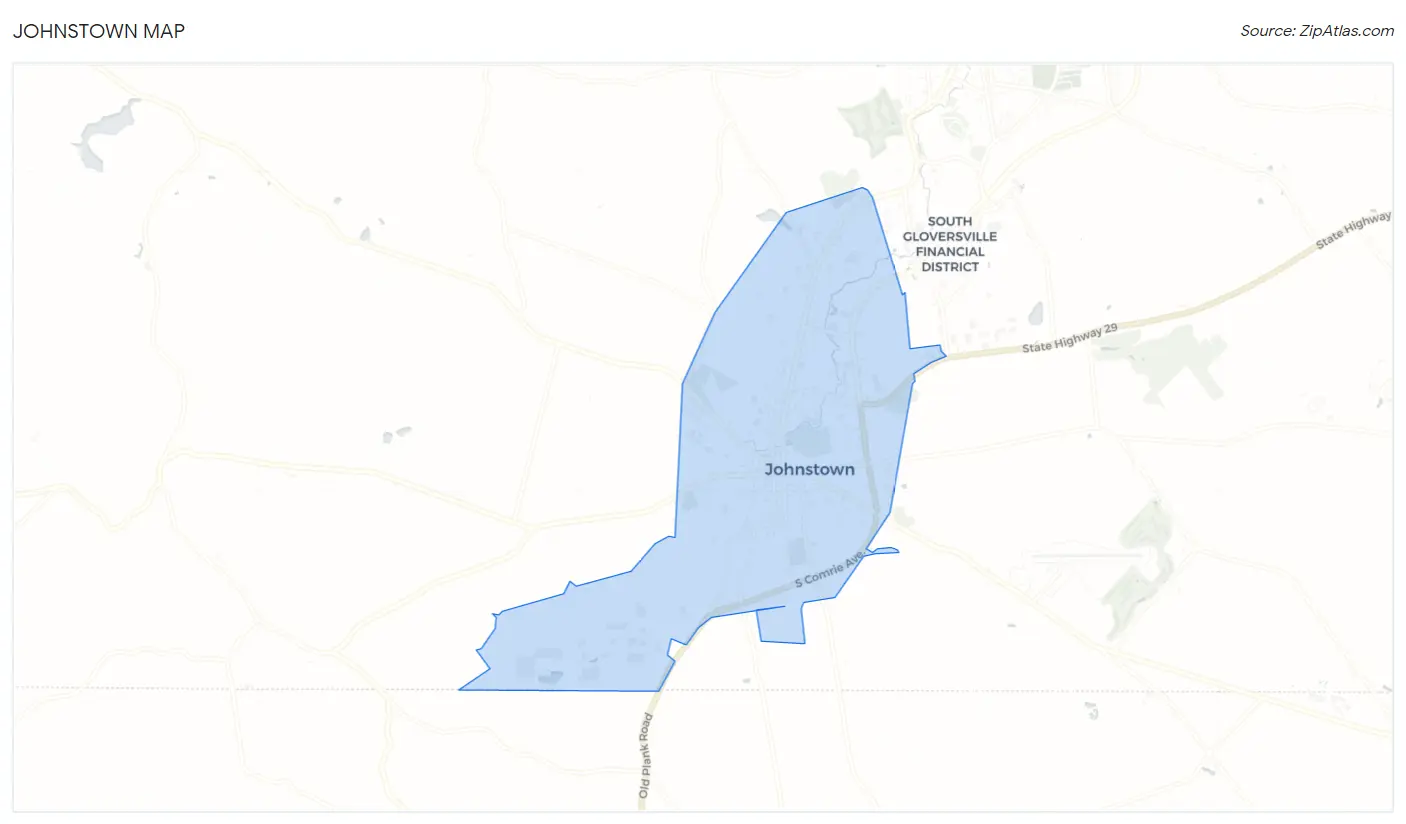
Johnstown Overview
$34,187
PER CAPITA INCOME
$81,134
AVG FAMILY INCOME
$59,809
AVG HOUSEHOLD INCOME
15.6%
WAGE / INCOME GAP [ % ]
84.4¢/ $1
WAGE / INCOME GAP [ $ ]
0.43
INEQUALITY / GINI INDEX
8,216
TOTAL POPULATION
3,945
MALE POPULATION
4,271
FEMALE POPULATION
92.37
MALES / 100 FEMALES
108.26
FEMALES / 100 MALES
45.1
MEDIAN AGE
2.8
AVG FAMILY SIZE
2.1
AVG HOUSEHOLD SIZE
4,145
LABOR FORCE [ PEOPLE ]
59.0%
PERCENT IN LABOR FORCE
3.4%
UNEMPLOYMENT RATE
Johnstown Zip Codes
Johnstown Area Codes
Income in Johnstown
Income Overview in Johnstown
Per Capita Income in Johnstown is $34,187, while median incomes of families and households are $81,134 and $59,809 respectively.
| Characteristic | Number | Measure |
| Per Capita Income | 8,216 | $34,187 |
| Median Family Income | 2,028 | $81,134 |
| Mean Family Income | 2,028 | $96,293 |
| Median Household Income | 3,896 | $59,809 |
| Mean Household Income | 3,896 | $71,949 |
| Income Deficit | 2,028 | $0 |
| Wage / Income Gap (%) | 8,216 | 15.63% |
| Wage / Income Gap ($) | 8,216 | 84.37¢ per $1 |
| Gini / Inequality Index | 8,216 | 0.43 |
Earnings by Sex in Johnstown
Average Earnings in Johnstown are $39,829, $45,176 for men and $38,115 for women, a difference of 15.6%.
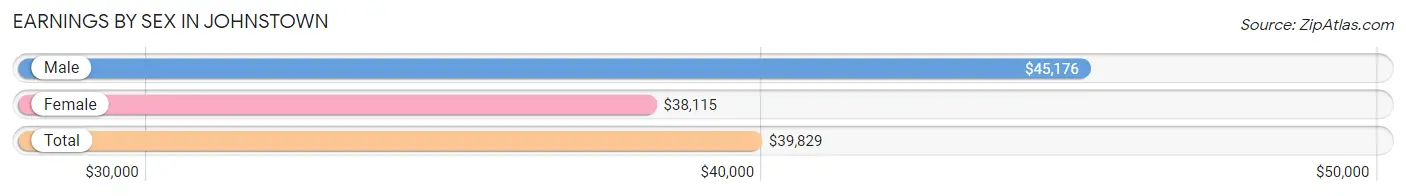
| Sex | Number | Average Earnings |
| Male | 2,300 (51.6%) | $45,176 |
| Female | 2,159 (48.4%) | $38,115 |
| Total | 4,459 (100.0%) | $39,829 |
Earnings by Sex by Income Bracket in Johnstown
The most common earnings brackets in Johnstown are $75,000 to $99,999 for men (274 | 11.9%) and $35,000 to $39,999 for women (266 | 12.3%).
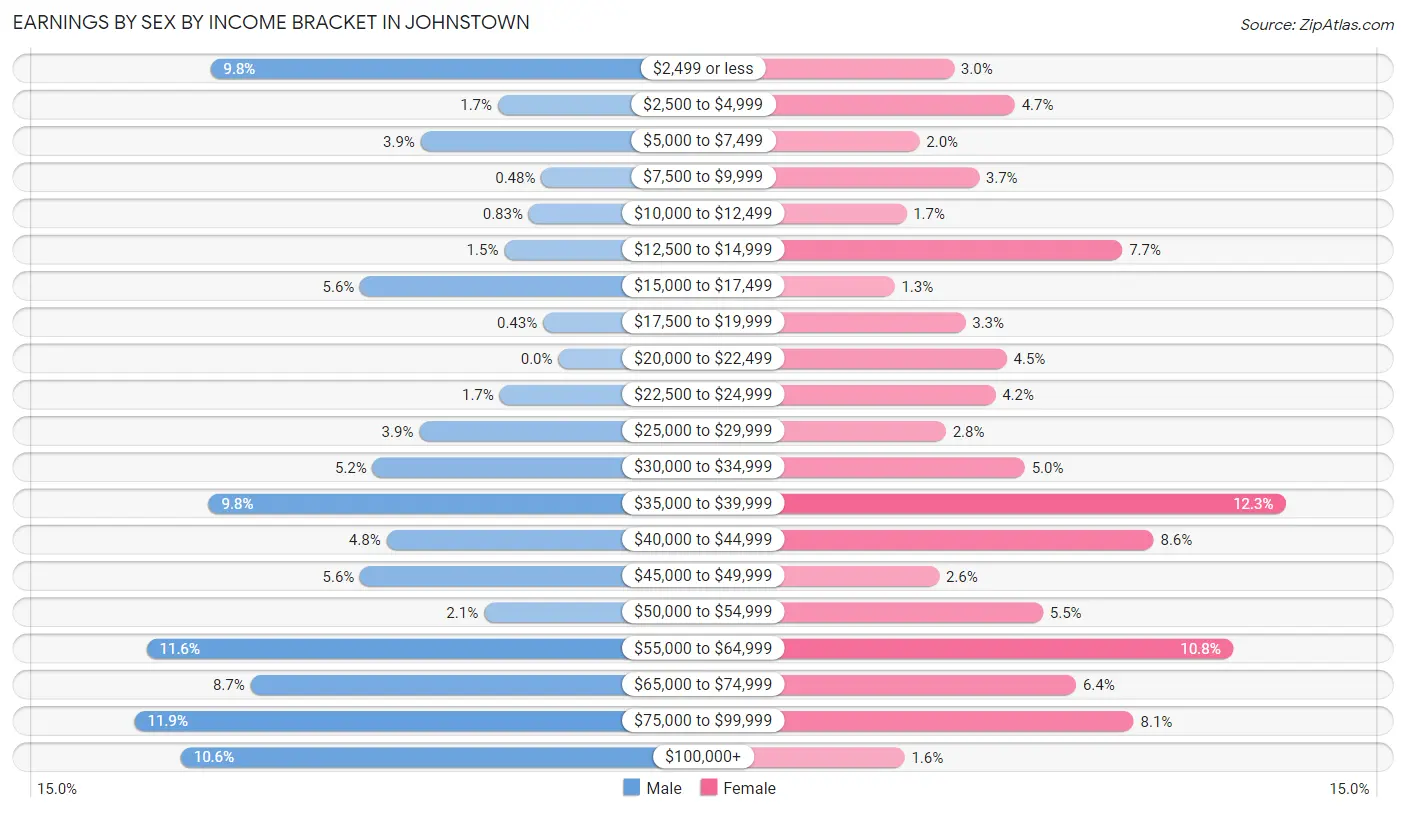
| Income | Male | Female |
| $2,499 or less | 225 (9.8%) | 65 (3.0%) |
| $2,500 to $4,999 | 39 (1.7%) | 102 (4.7%) |
| $5,000 to $7,499 | 89 (3.9%) | 44 (2.0%) |
| $7,500 to $9,999 | 11 (0.5%) | 80 (3.7%) |
| $10,000 to $12,499 | 19 (0.8%) | 36 (1.7%) |
| $12,500 to $14,999 | 35 (1.5%) | 167 (7.7%) |
| $15,000 to $17,499 | 128 (5.6%) | 29 (1.3%) |
| $17,500 to $19,999 | 10 (0.4%) | 72 (3.3%) |
| $20,000 to $22,499 | 0 (0.0%) | 97 (4.5%) |
| $22,500 to $24,999 | 38 (1.7%) | 90 (4.2%) |
| $25,000 to $29,999 | 90 (3.9%) | 60 (2.8%) |
| $30,000 to $34,999 | 120 (5.2%) | 108 (5.0%) |
| $35,000 to $39,999 | 226 (9.8%) | 266 (12.3%) |
| $40,000 to $44,999 | 111 (4.8%) | 186 (8.6%) |
| $45,000 to $49,999 | 128 (5.6%) | 56 (2.6%) |
| $50,000 to $54,999 | 48 (2.1%) | 119 (5.5%) |
| $55,000 to $64,999 | 266 (11.6%) | 234 (10.8%) |
| $65,000 to $74,999 | 199 (8.6%) | 139 (6.4%) |
| $75,000 to $99,999 | 274 (11.9%) | 174 (8.1%) |
| $100,000+ | 244 (10.6%) | 35 (1.6%) |
| Total | 2,300 (100.0%) | 2,159 (100.0%) |
Earnings by Sex by Educational Attainment in Johnstown
Average earnings in Johnstown are $54,107 for men and $39,254 for women, a difference of 27.5%. Men with an educational attainment of bachelor's degree enjoy the highest average annual earnings of $62,500, while those with less than high school education earn the least with $45,425. Women with an educational attainment of graduate degree earn the most with the average annual earnings of $58,088, while those with high school diploma education have the smallest earnings of $19,116.
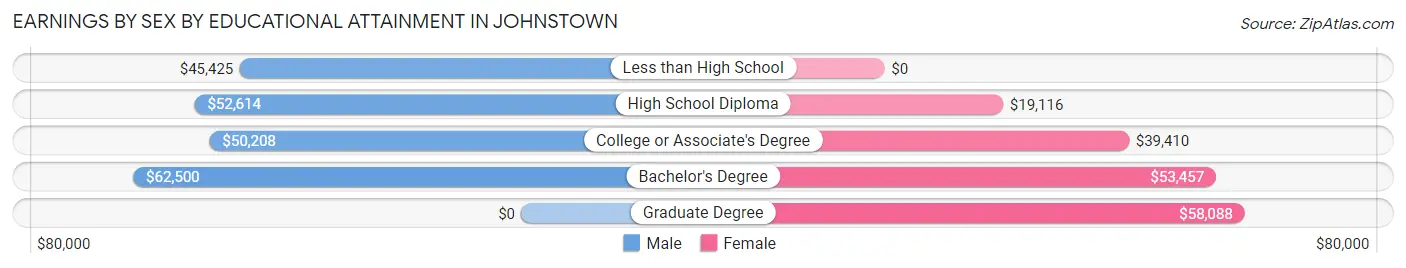
| Educational Attainment | Male Income | Female Income |
| Less than High School | $45,425 | $0 |
| High School Diploma | $52,614 | $19,116 |
| College or Associate's Degree | $50,208 | $39,410 |
| Bachelor's Degree | $62,500 | $53,457 |
| Graduate Degree | - | - |
| Total | $54,107 | $39,254 |
Family Income in Johnstown
Family Income Brackets in Johnstown
According to the Johnstown family income data, there are 562 families falling into the $50,000 to $74,999 income range, which is the most common income bracket and makes up 27.7% of all families. Conversely, the $10,000 to $14,999 income bracket is the least frequent group with only 10 families (0.5%) belonging to this category.
| Income Bracket | # Families | % Families |
| Less than $10,000 | 87 | 4.3% |
| $10,000 to $14,999 | 10 | 0.5% |
| $15,000 to $24,999 | 81 | 4.0% |
| $25,000 to $34,999 | 59 | 2.9% |
| $35,000 to $49,999 | 118 | 5.8% |
| $50,000 to $74,999 | 562 | 27.7% |
| $75,000 to $99,999 | 361 | 17.8% |
| $100,000 to $149,999 | 505 | 24.9% |
| $150,000 to $199,999 | 126 | 6.2% |
| $200,000+ | 120 | 5.9% |
Family Income by Famaliy Size in Johnstown
6-person families (106 | 5.2%) account for the highest median family income in Johnstown with $126,618 per family, while 2-person families (1,194 | 58.9%) have the highest median income of $34,500 per family member.
| Income Bracket | # Families | Median Income |
| 2-Person Families | 1,194 (58.9%) | $69,000 |
| 3-Person Families | 374 (18.4%) | $94,233 |
| 4-Person Families | 195 (9.6%) | $64,958 |
| 5-Person Families | 159 (7.8%) | $101,479 |
| 6-Person Families | 106 (5.2%) | $126,618 |
| 7+ Person Families | 0 (0.0%) | $0 |
| Total | 2,028 (100.0%) | $81,134 |
Family Income by Number of Earners in Johnstown
The median family income in Johnstown is $81,134, with families comprising 3+ earners (175) having the highest median family income of $130,492, while families with 1 earner (515) have the lowest median family income of $62,838, accounting for 8.6% and 25.4% of families, respectively.
| Number of Earners | # Families | Median Income |
| No Earners | 390 (19.2%) | $62,986 |
| 1 Earner | 515 (25.4%) | $62,838 |
| 2 Earners | 948 (46.8%) | $94,469 |
| 3+ Earners | 175 (8.6%) | $130,492 |
| Total | 2,028 (100.0%) | $81,134 |
Household Income in Johnstown
Household Income Brackets in Johnstown
With 799 households falling in the category, the $50,000 to $74,999 income range is the most frequent in Johnstown, accounting for 20.5% of all households. In contrast, only 121 households (3.1%) fall into the $200,000+ income bracket, making it the least populous group.
| Income Bracket | # Households | % Households |
| Less than $10,000 | 187 | 4.8% |
| $10,000 to $14,999 | 245 | 6.3% |
| $15,000 to $24,999 | 514 | 13.2% |
| $25,000 to $34,999 | 203 | 5.2% |
| $35,000 to $49,999 | 460 | 11.8% |
| $50,000 to $74,999 | 799 | 20.5% |
| $75,000 to $99,999 | 522 | 13.4% |
| $100,000 to $149,999 | 705 | 18.1% |
| $150,000 to $199,999 | 140 | 3.6% |
| $200,000+ | 121 | 3.1% |
Household Income by Householder Age in Johnstown
The median household income in Johnstown is $59,809, with the highest median household income of $74,120 found in the 25 to 44 years age bracket for the primary householder. A total of 1,162 households (29.8%) fall into this category. Meanwhile, the 15 to 24 years age bracket for the primary householder has the lowest median household income of $31,402, with 114 households (2.9%) in this group.
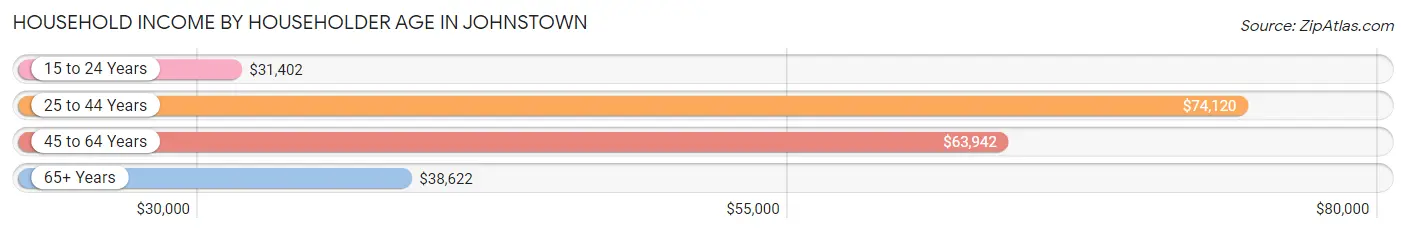
| Income Bracket | # Households | Median Income |
| 15 to 24 Years | 114 (2.9%) | $31,402 |
| 25 to 44 Years | 1,162 (29.8%) | $74,120 |
| 45 to 64 Years | 1,456 (37.4%) | $63,942 |
| 65+ Years | 1,164 (29.9%) | $38,622 |
| Total | 3,896 (100.0%) | $59,809 |
Poverty in Johnstown
Income Below Poverty by Sex and Age in Johnstown
With 9.3% poverty level for males and 8.3% for females among the residents of Johnstown, 35 to 44 year old males and 15 year old females are the most vulnerable to poverty, with 142 males (23.0%) and 49 females (71.0%) in their respective age groups living below the poverty level.
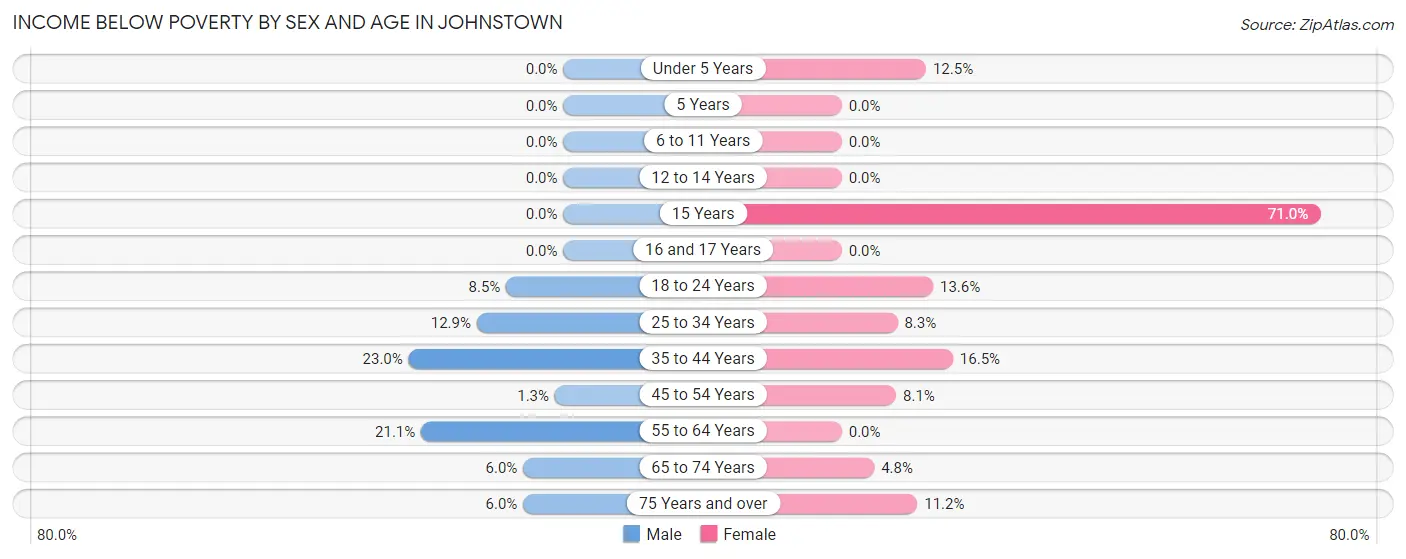
| Age Bracket | Male | Female |
| Under 5 Years | 0 (0.0%) | 19 (12.5%) |
| 5 Years | 0 (0.0%) | 0 (0.0%) |
| 6 to 11 Years | 0 (0.0%) | 0 (0.0%) |
| 12 to 14 Years | 0 (0.0%) | 0 (0.0%) |
| 15 Years | 0 (0.0%) | 49 (71.0%) |
| 16 and 17 Years | 0 (0.0%) | 0 (0.0%) |
| 18 to 24 Years | 18 (8.5%) | 34 (13.6%) |
| 25 to 34 Years | 68 (12.9%) | 42 (8.3%) |
| 35 to 44 Years | 142 (23.0%) | 81 (16.5%) |
| 45 to 54 Years | 9 (1.3%) | 46 (8.1%) |
| 55 to 64 Years | 83 (21.1%) | 0 (0.0%) |
| 65 to 74 Years | 30 (6.0%) | 30 (4.8%) |
| 75 Years and over | 8 (6.0%) | 50 (11.2%) |
| Total | 358 (9.3%) | 351 (8.3%) |
Income Above Poverty by Sex and Age in Johnstown
According to the poverty statistics in Johnstown, males aged under 5 years and females aged 5 years are the age groups that are most secure financially, with 100.0% of males and 100.0% of females in these age groups living above the poverty line.
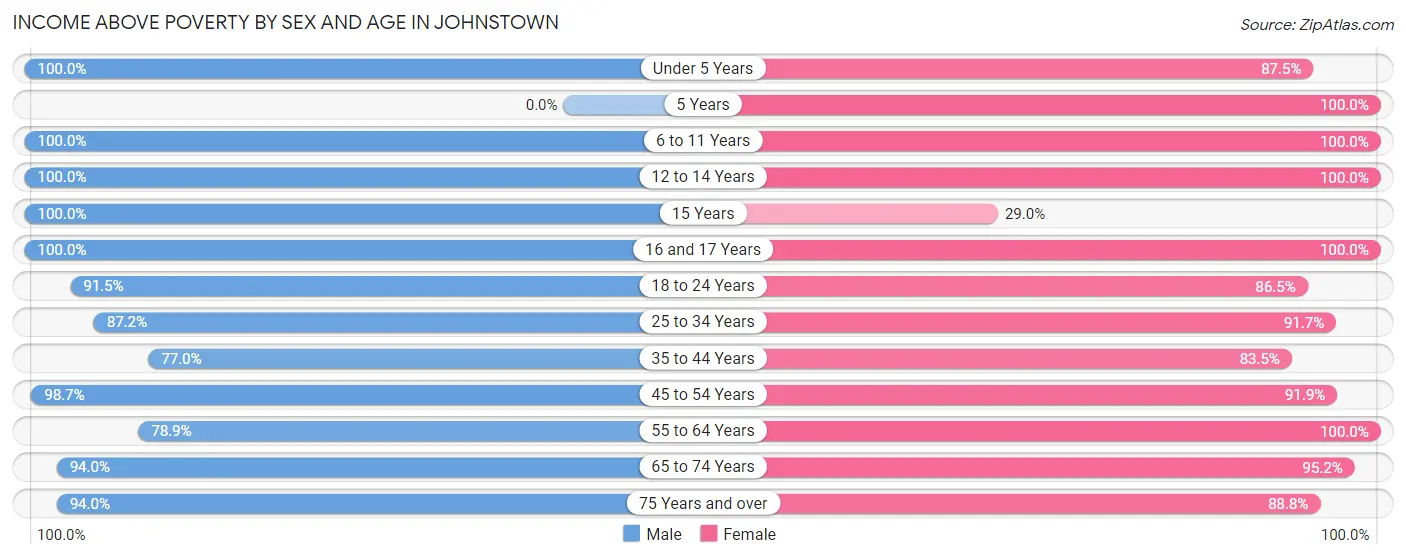
| Age Bracket | Male | Female |
| Under 5 Years | 239 (100.0%) | 133 (87.5%) |
| 5 Years | 0 (0.0%) | 14 (100.0%) |
| 6 to 11 Years | 285 (100.0%) | 192 (100.0%) |
| 12 to 14 Years | 43 (100.0%) | 143 (100.0%) |
| 15 Years | 13 (100.0%) | 20 (29.0%) |
| 16 and 17 Years | 181 (100.0%) | 121 (100.0%) |
| 18 to 24 Years | 194 (91.5%) | 217 (86.5%) |
| 25 to 34 Years | 461 (87.2%) | 466 (91.7%) |
| 35 to 44 Years | 476 (77.0%) | 410 (83.5%) |
| 45 to 54 Years | 703 (98.7%) | 525 (91.9%) |
| 55 to 64 Years | 310 (78.9%) | 635 (100.0%) |
| 65 to 74 Years | 473 (94.0%) | 594 (95.2%) |
| 75 Years and over | 126 (94.0%) | 396 (88.8%) |
| Total | 3,504 (90.7%) | 3,866 (91.7%) |
Income Below Poverty Among Married-Couple Families in Johnstown
The poverty statistics for married-couple families in Johnstown show that 0.7% or 10 of the total 1,386 families live below the poverty line. Families with no children have the highest poverty rate of 1.0%, comprising of 10 families. On the other hand, families with 1 or 2 children have the lowest poverty rate of 0.0%, which includes 0 families.
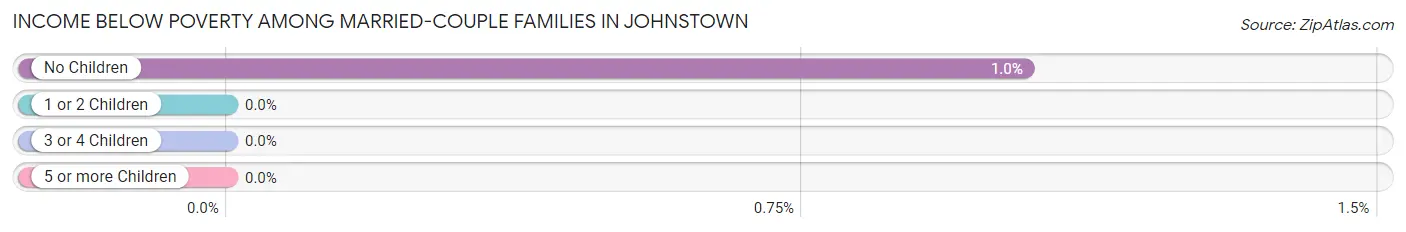
| Children | Above Poverty | Below Poverty |
| No Children | 953 (99.0%) | 10 (1.0%) |
| 1 or 2 Children | 362 (100.0%) | 0 (0.0%) |
| 3 or 4 Children | 61 (100.0%) | 0 (0.0%) |
| 5 or more Children | 0 (0.0%) | 0 (0.0%) |
| Total | 1,376 (99.3%) | 10 (0.7%) |
Income Below Poverty Among Single-Parent Households in Johnstown
According to the poverty data in Johnstown, 28.6% or 69 single-father households and 4.7% or 19 single-mother households are living below the poverty line. Among single-father households, those with 1 or 2 children have the highest poverty rate, with 69 households (53.5%) experiencing poverty. Likewise, among single-mother households, those with 1 or 2 children have the highest poverty rate, with 19 households (8.1%) falling below the poverty line.
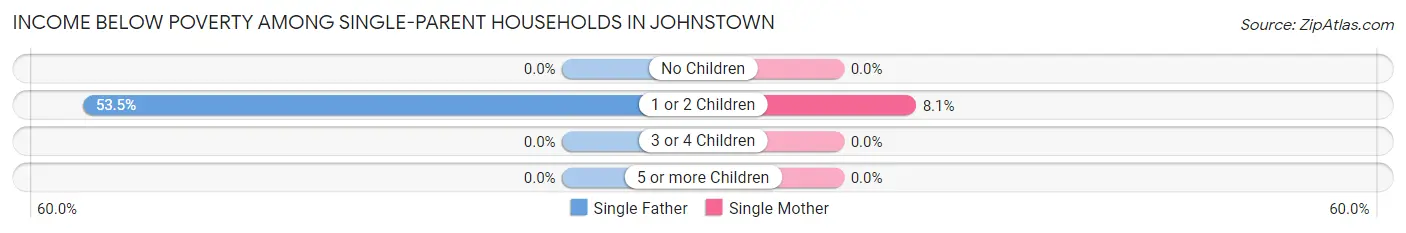
| Children | Single Father | Single Mother |
| No Children | 0 (0.0%) | 0 (0.0%) |
| 1 or 2 Children | 69 (53.5%) | 19 (8.1%) |
| 3 or 4 Children | 0 (0.0%) | 0 (0.0%) |
| 5 or more Children | 0 (0.0%) | 0 (0.0%) |
| Total | 69 (28.6%) | 19 (4.7%) |
Income Below Poverty Among Married-Couple vs Single-Parent Households in Johnstown
The poverty data for Johnstown shows that 10 of the married-couple family households (0.7%) and 88 of the single-parent households (13.7%) are living below the poverty level. Within the married-couple family households, those with no children have the highest poverty rate, with 10 households (1.0%) falling below the poverty line. Among the single-parent households, those with 1 or 2 children have the highest poverty rate, with 88 household (24.1%) living below poverty.
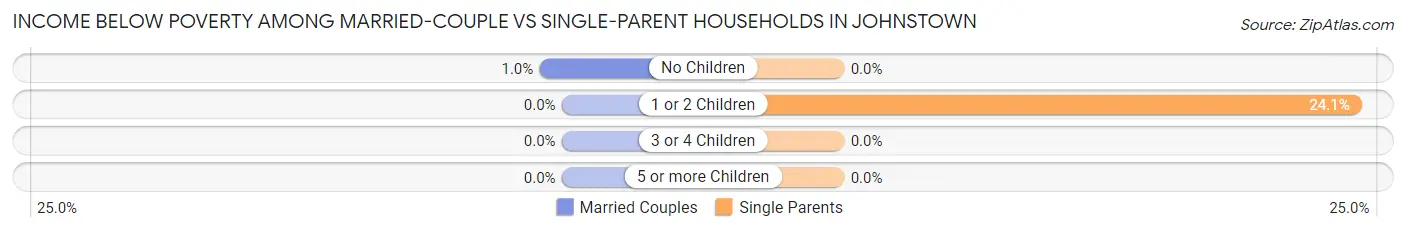
| Children | Married-Couple Families | Single-Parent Households |
| No Children | 10 (1.0%) | 0 (0.0%) |
| 1 or 2 Children | 0 (0.0%) | 88 (24.1%) |
| 3 or 4 Children | 0 (0.0%) | 0 (0.0%) |
| 5 or more Children | 0 (0.0%) | 0 (0.0%) |
| Total | 10 (0.7%) | 88 (13.7%) |
Race in Johnstown
The most populous races in Johnstown are White / Caucasian (7,742 | 94.2%), Two or more Races (407 | 5.0%), and Hispanic or Latino (321 | 3.9%).
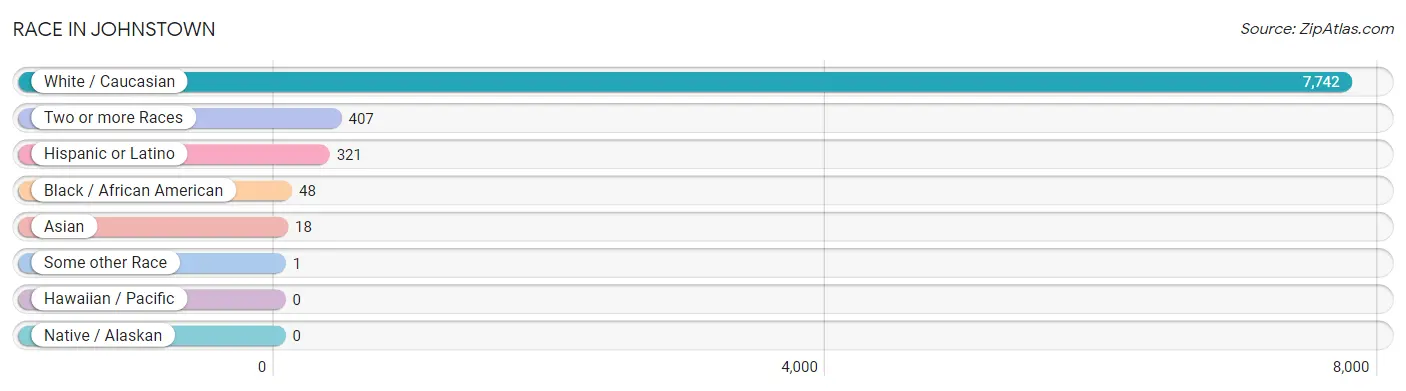
| Race | # Population | % Population |
| Asian | 18 | 0.2% |
| Black / African American | 48 | 0.6% |
| Hawaiian / Pacific | 0 | 0.0% |
| Hispanic or Latino | 321 | 3.9% |
| Native / Alaskan | 0 | 0.0% |
| White / Caucasian | 7,742 | 94.2% |
| Two or more Races | 407 | 5.0% |
| Some other Race | 1 | 0.0% |
| Total | 8,216 | 100.0% |
Ancestry in Johnstown
The most populous ancestries reported in Johnstown are Irish (1,636 | 19.9%), German (1,317 | 16.0%), Italian (880 | 10.7%), English (854 | 10.4%), and American (688 | 8.4%), together accounting for 65.4% of all Johnstown residents.
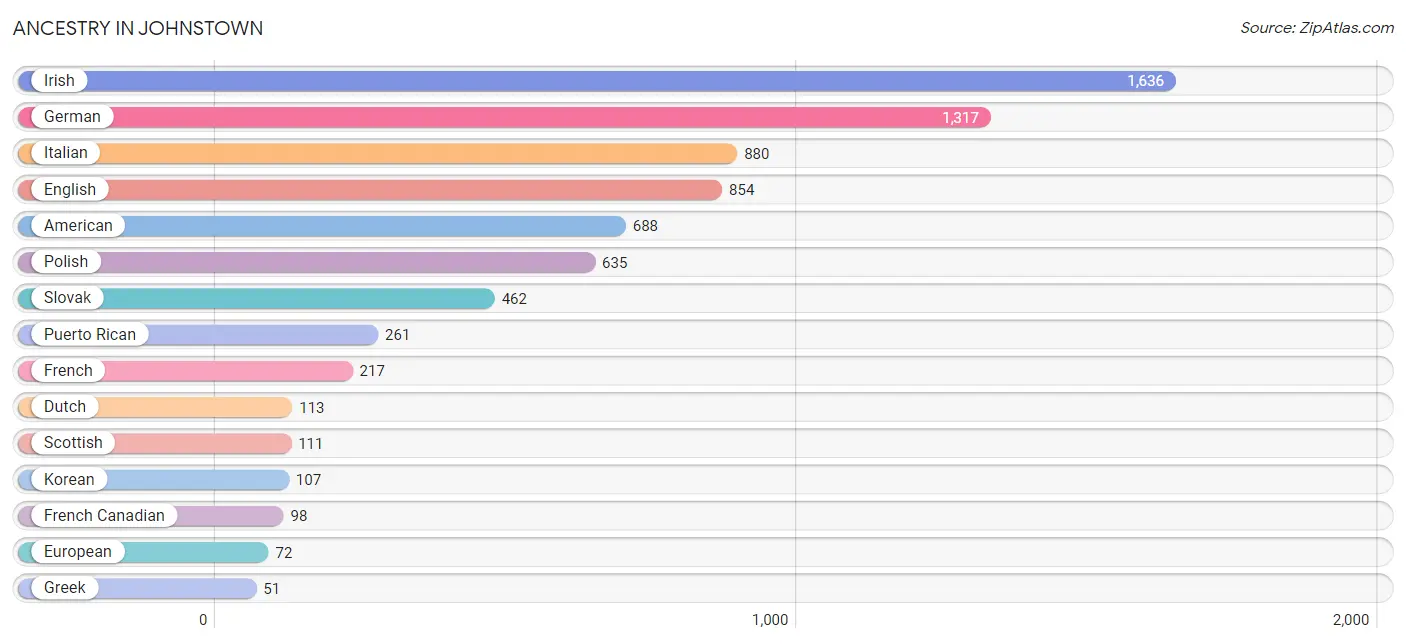
| Ancestry | # Population | % Population |
| American | 688 | 8.4% |
| Argentinean | 8 | 0.1% |
| British | 22 | 0.3% |
| Canadian | 8 | 0.1% |
| Central American | 2 | 0.0% |
| Cherokee | 10 | 0.1% |
| Danish | 16 | 0.2% |
| Dutch | 113 | 1.4% |
| Eastern European | 21 | 0.3% |
| English | 854 | 10.4% |
| European | 72 | 0.9% |
| Finnish | 15 | 0.2% |
| French | 217 | 2.6% |
| French American Indian | 20 | 0.2% |
| French Canadian | 98 | 1.2% |
| German | 1,317 | 16.0% |
| Greek | 51 | 0.6% |
| Guatemalan | 1 | 0.0% |
| Honduran | 1 | 0.0% |
| Irish | 1,636 | 19.9% |
| Italian | 880 | 10.7% |
| Korean | 107 | 1.3% |
| Lithuanian | 15 | 0.2% |
| Mexican | 31 | 0.4% |
| Polish | 635 | 7.7% |
| Puerto Rican | 261 | 3.2% |
| Russian | 14 | 0.2% |
| Scotch-Irish | 23 | 0.3% |
| Scottish | 111 | 1.3% |
| Slovak | 462 | 5.6% |
| South American | 8 | 0.1% |
| Ukrainian | 35 | 0.4% |
| Welsh | 14 | 0.2% | View All 33 Rows |
Immigrants in Johnstown
The most numerous immigrant groups reported in Johnstown came from Canada (138 | 1.7%), Latin America (44 | 0.5%), Europe (30 | 0.4%), Western Europe (30 | 0.4%), and Caribbean (24 | 0.3%), together accounting for 3.3% of all Johnstown residents.
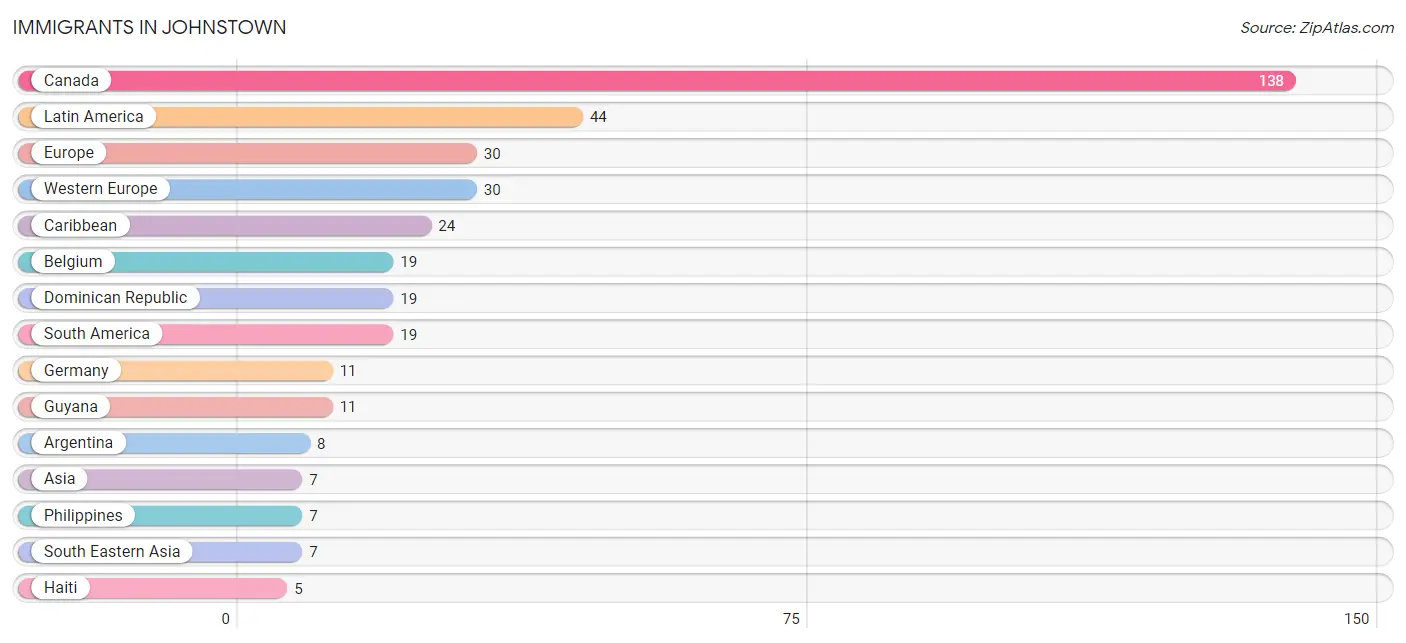
| Immigration Origin | # Population | % Population |
| Argentina | 8 | 0.1% |
| Asia | 7 | 0.1% |
| Belgium | 19 | 0.2% |
| Canada | 138 | 1.7% |
| Caribbean | 24 | 0.3% |
| Central America | 1 | 0.0% |
| Dominican Republic | 19 | 0.2% |
| Europe | 30 | 0.4% |
| Germany | 11 | 0.1% |
| Guyana | 11 | 0.1% |
| Haiti | 5 | 0.1% |
| Honduras | 1 | 0.0% |
| Latin America | 44 | 0.5% |
| Philippines | 7 | 0.1% |
| South America | 19 | 0.2% |
| South Eastern Asia | 7 | 0.1% |
| Western Europe | 30 | 0.4% | View All 17 Rows |
Sex and Age in Johnstown
Sex and Age in Johnstown
The most populous age groups in Johnstown are 50 to 54 Years (563 | 14.3%) for men and 50 to 54 Years (377 | 8.8%) for women.
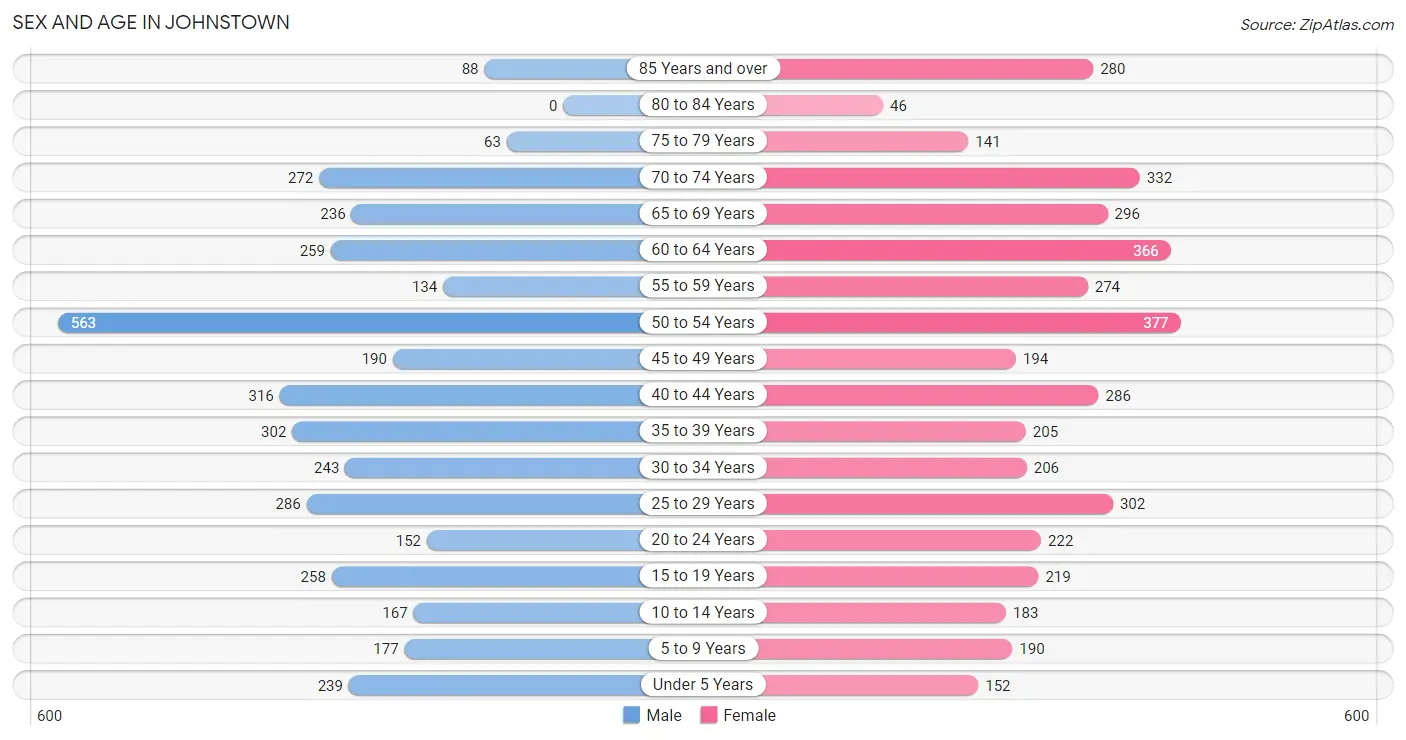
| Age Bracket | Male | Female |
| Under 5 Years | 239 (6.1%) | 152 (3.6%) |
| 5 to 9 Years | 177 (4.5%) | 190 (4.4%) |
| 10 to 14 Years | 167 (4.2%) | 183 (4.3%) |
| 15 to 19 Years | 258 (6.5%) | 219 (5.1%) |
| 20 to 24 Years | 152 (3.8%) | 222 (5.2%) |
| 25 to 29 Years | 286 (7.2%) | 302 (7.1%) |
| 30 to 34 Years | 243 (6.2%) | 206 (4.8%) |
| 35 to 39 Years | 302 (7.7%) | 205 (4.8%) |
| 40 to 44 Years | 316 (8.0%) | 286 (6.7%) |
| 45 to 49 Years | 190 (4.8%) | 194 (4.5%) |
| 50 to 54 Years | 563 (14.3%) | 377 (8.8%) |
| 55 to 59 Years | 134 (3.4%) | 274 (6.4%) |
| 60 to 64 Years | 259 (6.6%) | 366 (8.6%) |
| 65 to 69 Years | 236 (6.0%) | 296 (6.9%) |
| 70 to 74 Years | 272 (6.9%) | 332 (7.8%) |
| 75 to 79 Years | 63 (1.6%) | 141 (3.3%) |
| 80 to 84 Years | 0 (0.0%) | 46 (1.1%) |
| 85 Years and over | 88 (2.2%) | 280 (6.6%) |
| Total | 3,945 (100.0%) | 4,271 (100.0%) |
Families and Households in Johnstown
Median Family Size in Johnstown
The median family size in Johnstown is 2.81 persons per family, with single female/mother families (401 | 19.8%) accounting for the largest median family size of 3.32 persons per family. On the other hand, married-couple families (1,386 | 68.3%) represent the smallest median family size with 2.62 persons per family.
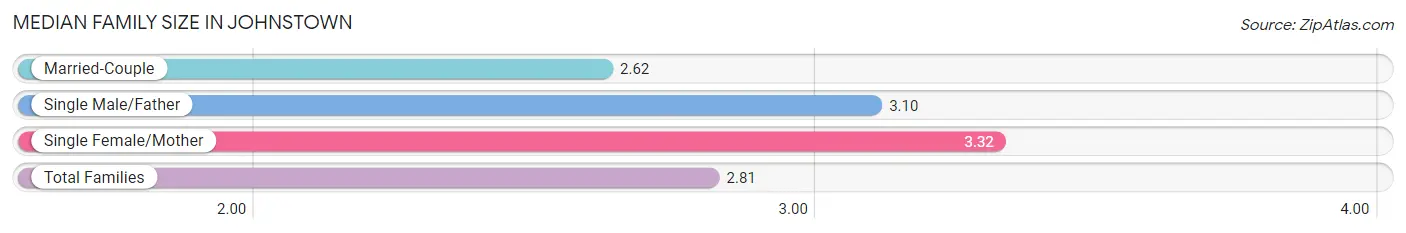
| Family Type | # Families | Family Size |
| Married-Couple | 1,386 (68.3%) | 2.62 |
| Single Male/Father | 241 (11.9%) | 3.10 |
| Single Female/Mother | 401 (19.8%) | 3.32 |
| Total Families | 2,028 (100.0%) | 2.81 |
Median Household Size in Johnstown
The median household size in Johnstown is 2.06 persons per household, with single female/mother households (401 | 10.3%) accounting for the largest median household size of 3.59 persons per household. non-family households (1,868 | 47.9%) represent the smallest median household size with 1.14 persons per household.
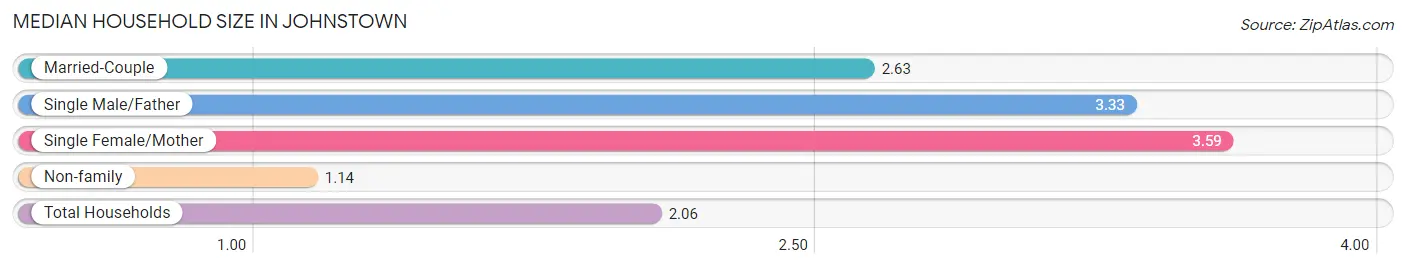
| Household Type | # Households | Household Size |
| Married-Couple | 1,386 (35.6%) | 2.63 |
| Single Male/Father | 241 (6.2%) | 3.33 |
| Single Female/Mother | 401 (10.3%) | 3.59 |
| Non-family | 1,868 (47.9%) | 1.14 |
| Total Households | 3,896 (100.0%) | 2.06 |
Household Size by Marriage Status in Johnstown
Out of a total of 3,896 households in Johnstown, 2,028 (52.0%) are family households, while 1,868 (47.9%) are nonfamily households. The most numerous type of family households are 2-person households, comprising 1,103, and the most common type of nonfamily households are 1-person households, comprising 1,642.
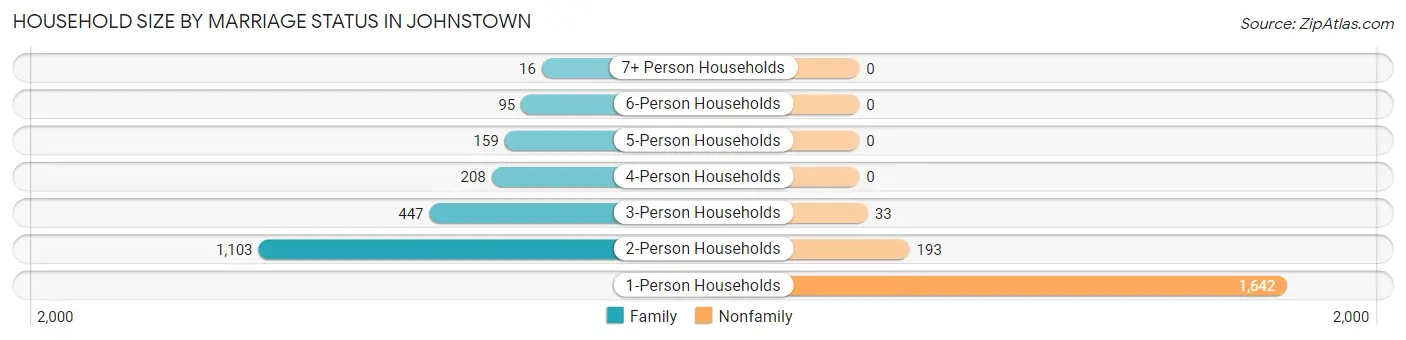
| Household Size | Family Households | Nonfamily Households |
| 1-Person Households | - | 1,642 (42.1%) |
| 2-Person Households | 1,103 (28.3%) | 193 (5.0%) |
| 3-Person Households | 447 (11.5%) | 33 (0.9%) |
| 4-Person Households | 208 (5.3%) | 0 (0.0%) |
| 5-Person Households | 159 (4.1%) | 0 (0.0%) |
| 6-Person Households | 95 (2.4%) | 0 (0.0%) |
| 7+ Person Households | 16 (0.4%) | 0 (0.0%) |
| Total | 2,028 (52.0%) | 1,868 (47.9%) |
Female Fertility in Johnstown
Fertility by Age in Johnstown
Average fertility rate in Johnstown is 22.0 births per 1,000 women. Women in the age bracket of 20 to 34 years have the highest fertility rate with 42.0 births per 1,000 women. Women in the age bracket of 20 to 34 years acount for 83.8% of all women with births.
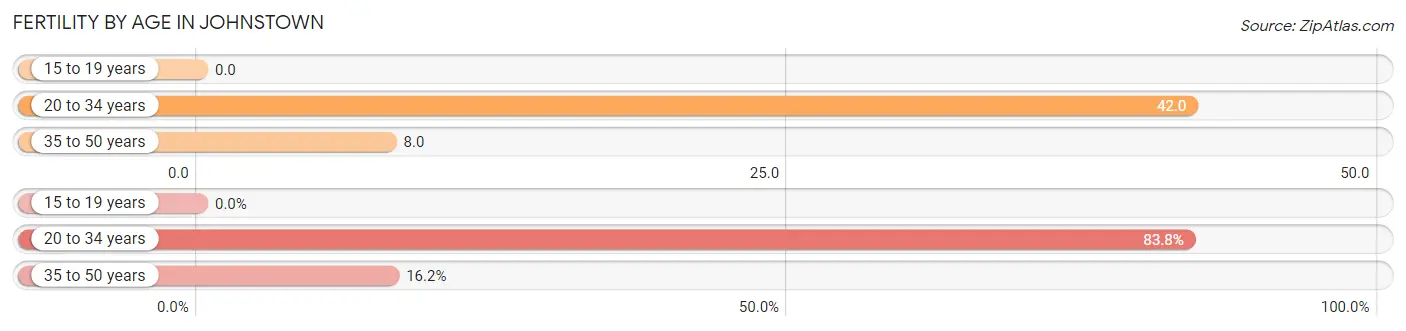
| Age Bracket | Women with Births | Births / 1,000 Women |
| 15 to 19 years | 0 (0.0%) | 0.0 |
| 20 to 34 years | 31 (83.8%) | 42.0 |
| 35 to 50 years | 6 (16.2%) | 8.0 |
| Total | 37 (100.0%) | 22.0 |
Fertility by Age by Marriage Status in Johnstown
16.2% of women with births (37) in Johnstown are married. The highest percentage of unmarried women with births falls into 20 to 34 years age bracket with 100.0% of them unmarried at the time of birth, while the lowest percentage of unmarried women with births belong to 35 to 50 years age bracket with 0.0% of them unmarried.
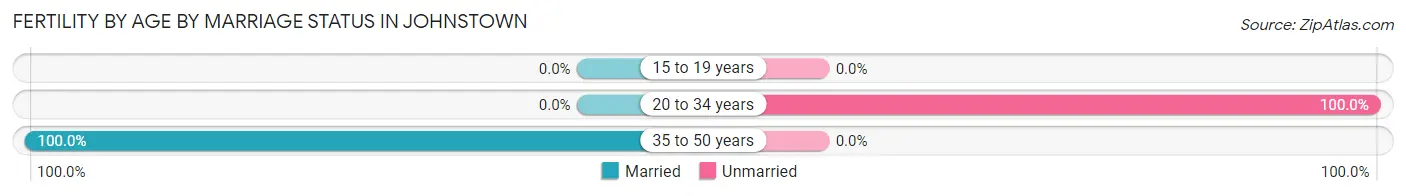
| Age Bracket | Married | Unmarried |
| 15 to 19 years | 0 (0.0%) | 0 (0.0%) |
| 20 to 34 years | 0 (0.0%) | 31 (100.0%) |
| 35 to 50 years | 6 (100.0%) | 0 (0.0%) |
| Total | 6 (16.2%) | 31 (83.8%) |
Fertility by Education in Johnstown
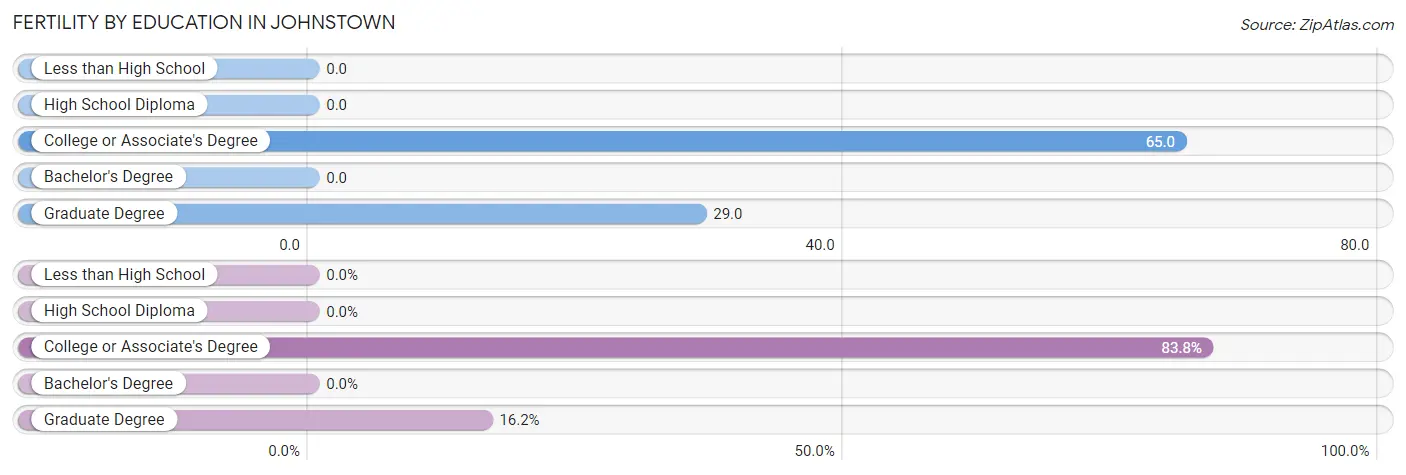
| Educational Attainment | Women with Births | Births / 1,000 Women |
| Less than High School | 0 (0.0%) | 0.0 |
| High School Diploma | 0 (0.0%) | 0.0 |
| College or Associate's Degree | 31 (83.8%) | 65.0 |
| Bachelor's Degree | 0 (0.0%) | 0.0 |
| Graduate Degree | 6 (16.2%) | 29.0 |
| Total | 37 (100.0%) | 22.0 |
Fertility by Education by Marriage Status in Johnstown
83.8% of women with births in Johnstown are unmarried. Women with the educational attainment of graduate degree are most likely to be married with 100.0% of them married at childbirth, while women with the educational attainment of college or associate's degree are least likely to be married with 100.0% of them unmarried at childbirth.
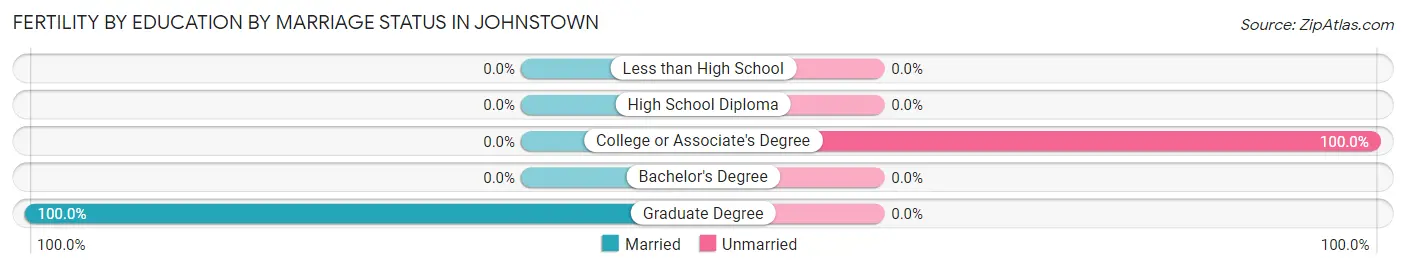
| Educational Attainment | Married | Unmarried |
| Less than High School | 0 (0.0%) | 0 (0.0%) |
| High School Diploma | 0 (0.0%) | 0 (0.0%) |
| College or Associate's Degree | 0 (0.0%) | 31 (100.0%) |
| Bachelor's Degree | 0 (0.0%) | 0 (0.0%) |
| Graduate Degree | 6 (100.0%) | 0 (0.0%) |
| Total | 6 (16.2%) | 31 (83.8%) |
Employment Characteristics in Johnstown
Employment by Class of Employer in Johnstown
Among the 3,987 employed individuals in Johnstown, private company employees (2,499 | 62.7%), not-for-profit organizations (737 | 18.5%), and local government employees (347 | 8.7%) make up the most common classes of employment.
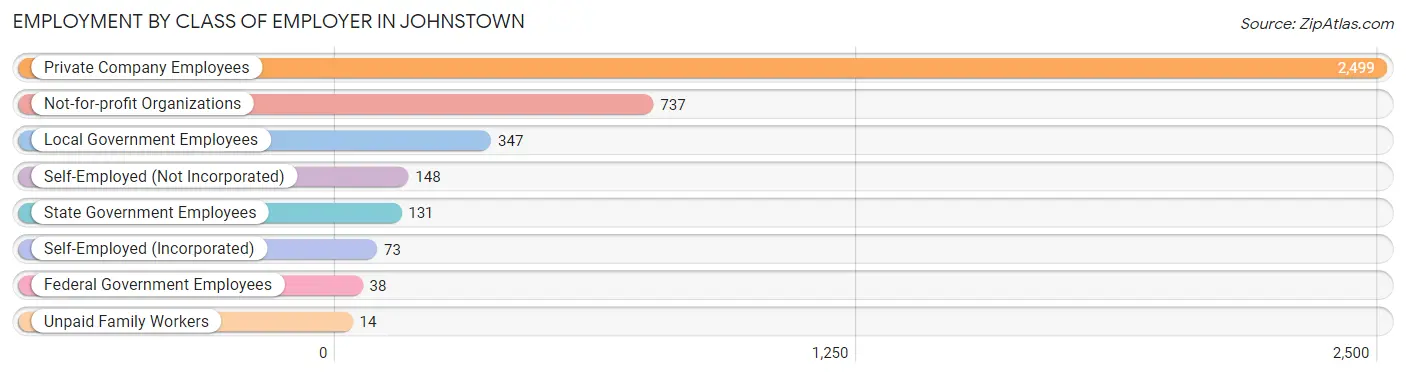
| Employer Class | # Employees | % Employees |
| Private Company Employees | 2,499 | 62.7% |
| Self-Employed (Incorporated) | 73 | 1.8% |
| Self-Employed (Not Incorporated) | 148 | 3.7% |
| Not-for-profit Organizations | 737 | 18.5% |
| Local Government Employees | 347 | 8.7% |
| State Government Employees | 131 | 3.3% |
| Federal Government Employees | 38 | 0.9% |
| Unpaid Family Workers | 14 | 0.4% |
| Total | 3,987 | 100.0% |
Employment Status by Age in Johnstown
According to the labor force statistics for Johnstown, out of the total population over 16 years of age (7,026), 59.0% or 4,145 individuals are in the labor force, with 3.4% or 141 of them unemployed. The age group with the highest labor force participation rate is 20 to 24 years, with 87.4% or 327 individuals in the labor force. Within the labor force, the 16 to 19 years age range has the highest percentage of unemployed individuals, with 33.8% or 27 of them being unemployed.
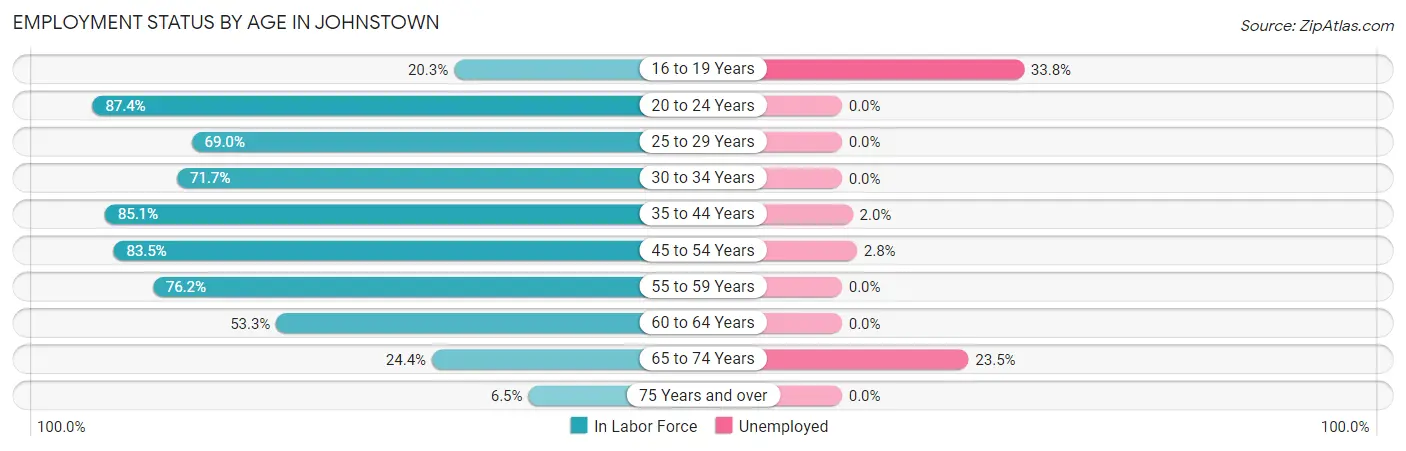
| Age Bracket | In Labor Force | Unemployed |
| 16 to 19 Years | 80 (20.3%) | 27 (33.8%) |
| 20 to 24 Years | 327 (87.4%) | 0 (0.0%) |
| 25 to 29 Years | 406 (69.0%) | 0 (0.0%) |
| 30 to 34 Years | 322 (71.7%) | 0 (0.0%) |
| 35 to 44 Years | 944 (85.1%) | 19 (2.0%) |
| 45 to 54 Years | 1,106 (83.5%) | 31 (2.8%) |
| 55 to 59 Years | 311 (76.2%) | 0 (0.0%) |
| 60 to 64 Years | 333 (53.3%) | 0 (0.0%) |
| 65 to 74 Years | 277 (24.4%) | 65 (23.5%) |
| 75 Years and over | 40 (6.5%) | 0 (0.0%) |
| Total | 4,145 (59.0%) | 141 (3.4%) |
Employment Status by Educational Attainment in Johnstown
According to labor force statistics for Johnstown, 76.0% of individuals (3,422) out of the total population between 25 and 64 years of age (4,503) are in the labor force, with 1.5% or 51 of them being unemployed. The group with the highest labor force participation rate are those with the educational attainment of bachelor's degree or higher, with 92.0% or 908 individuals in the labor force. Within the labor force, individuals with high school diploma education have the highest percentage of unemployment, with 1.9% or 19 of them being unemployed.
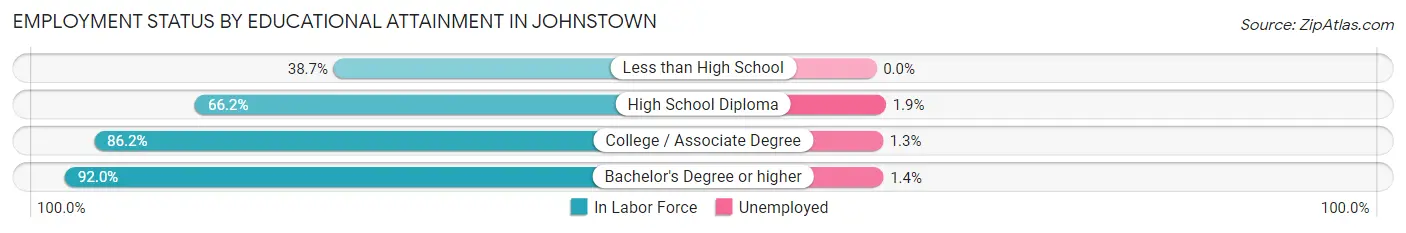
| Educational Attainment | In Labor Force | Unemployed |
| Less than High School | 174 (38.7%) | 0 (0.0%) |
| High School Diploma | 1,004 (66.2%) | 29 (1.9%) |
| College / Associate Degree | 1,335 (86.2%) | 20 (1.3%) |
| Bachelor's Degree or higher | 908 (92.0%) | 14 (1.4%) |
| Total | 3,422 (76.0%) | 68 (1.5%) |
Employment Occupations by Sex in Johnstown
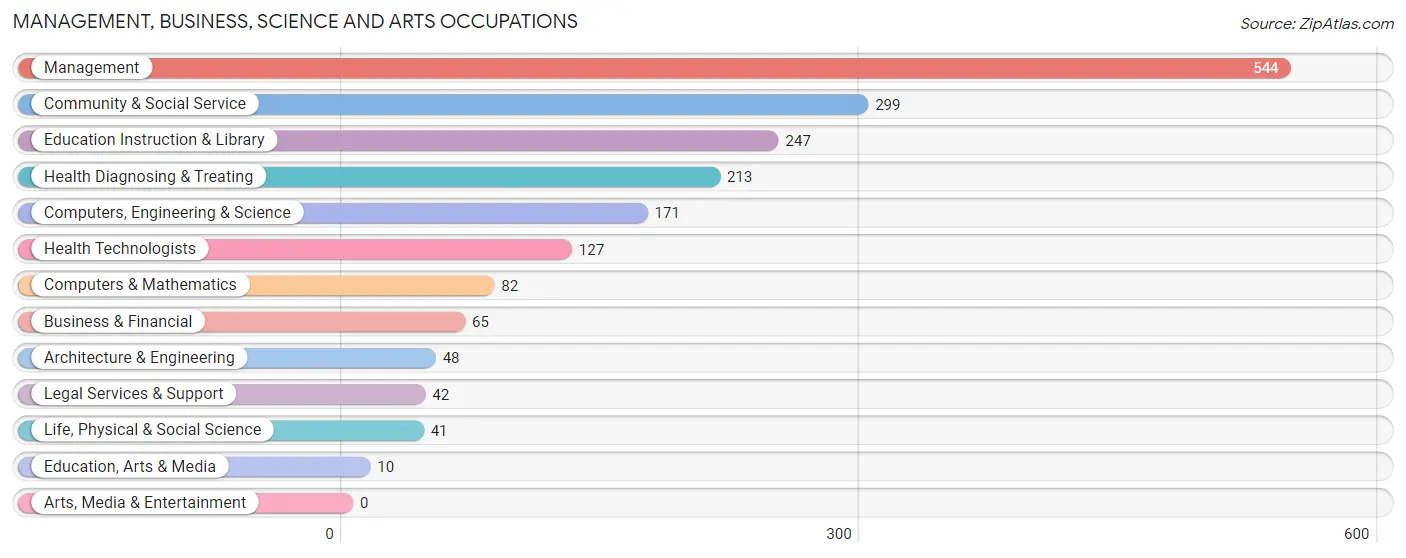
Management, Business, Science and Arts Occupations
The most common Management, Business, Science and Arts occupations in Johnstown are Management (544 | 13.6%), Community & Social Service (299 | 7.5%), Education Instruction & Library (247 | 6.2%), Health Diagnosing & Treating (213 | 5.3%), and Computers, Engineering & Science (171 | 4.3%).
Management, Business, Science and Arts Occupations by Sex
Within the Management, Business, Science and Arts occupations in Johnstown, the most male-oriented occupations are Computers & Mathematics (100.0%), Architecture & Engineering (100.0%), and Computers, Engineering & Science (89.5%), while the most female-oriented occupations are Education, Arts & Media (100.0%), Legal Services & Support (100.0%), and Community & Social Service (95.7%).
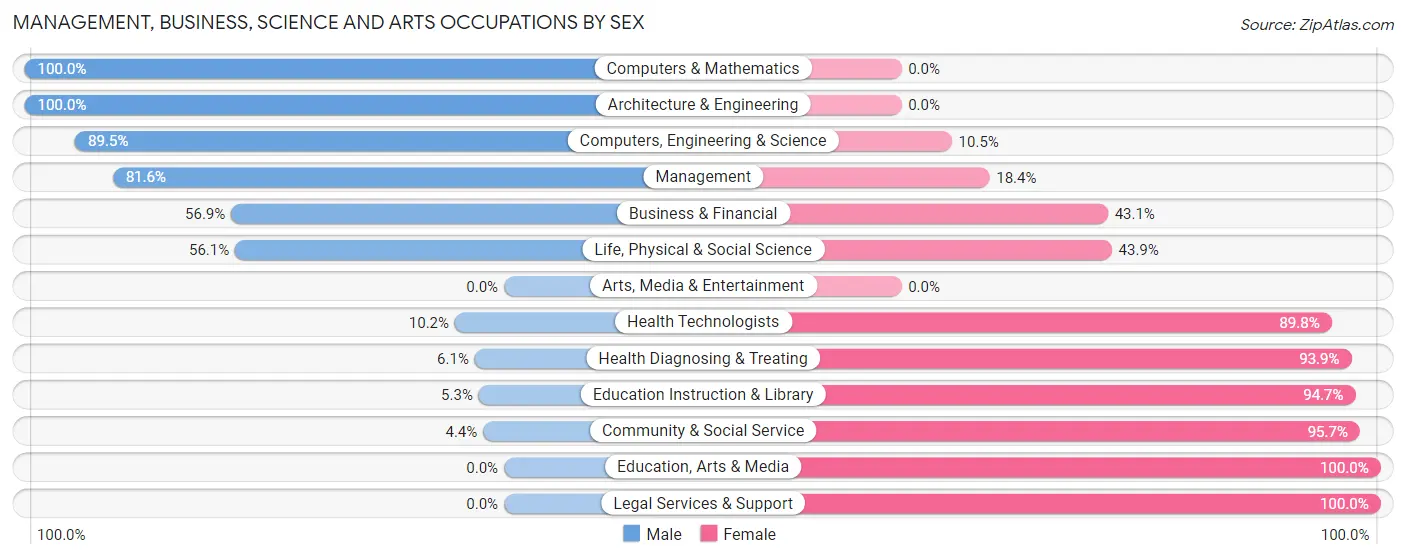
| Occupation | Male | Female |
| Management | 444 (81.6%) | 100 (18.4%) |
| Business & Financial | 37 (56.9%) | 28 (43.1%) |
| Computers, Engineering & Science | 153 (89.5%) | 18 (10.5%) |
| Computers & Mathematics | 82 (100.0%) | 0 (0.0%) |
| Architecture & Engineering | 48 (100.0%) | 0 (0.0%) |
| Life, Physical & Social Science | 23 (56.1%) | 18 (43.9%) |
| Community & Social Service | 13 (4.3%) | 286 (95.7%) |
| Education, Arts & Media | 0 (0.0%) | 10 (100.0%) |
| Legal Services & Support | 0 (0.0%) | 42 (100.0%) |
| Education Instruction & Library | 13 (5.3%) | 234 (94.7%) |
| Arts, Media & Entertainment | 0 (0.0%) | 0 (0.0%) |
| Health Diagnosing & Treating | 13 (6.1%) | 200 (93.9%) |
| Health Technologists | 13 (10.2%) | 114 (89.8%) |
| Total (Category) | 660 (51.1%) | 632 (48.9%) |
| Total (Overall) | 2,038 (50.9%) | 1,965 (49.1%) |
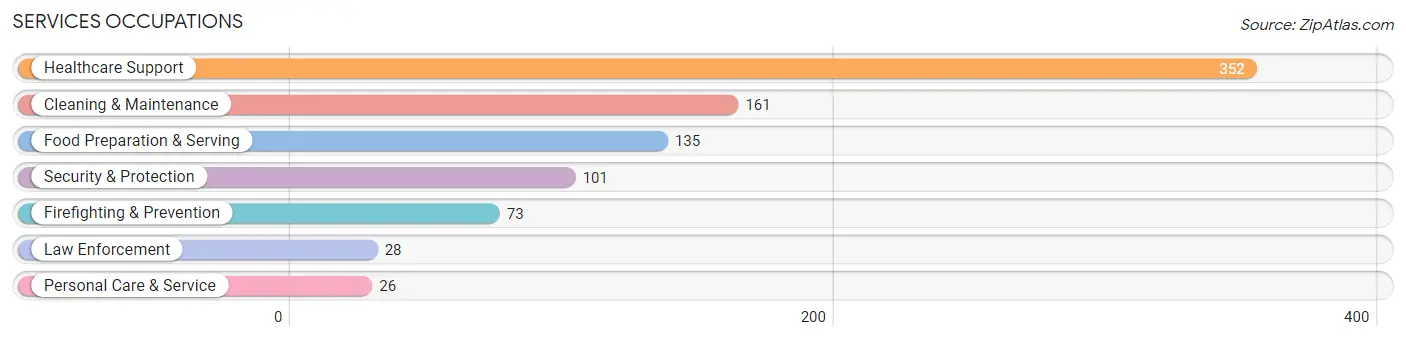
Services Occupations
The most common Services occupations in Johnstown are Healthcare Support (352 | 8.8%), Cleaning & Maintenance (161 | 4.0%), Food Preparation & Serving (135 | 3.4%), Security & Protection (101 | 2.5%), and Firefighting & Prevention (73 | 1.8%).
Services Occupations by Sex
Within the Services occupations in Johnstown, the most male-oriented occupations are Law Enforcement (100.0%), Cleaning & Maintenance (78.9%), and Food Preparation & Serving (68.1%), while the most female-oriented occupations are Healthcare Support (98.0%), Personal Care & Service (65.4%), and Firefighting & Prevention (49.3%).
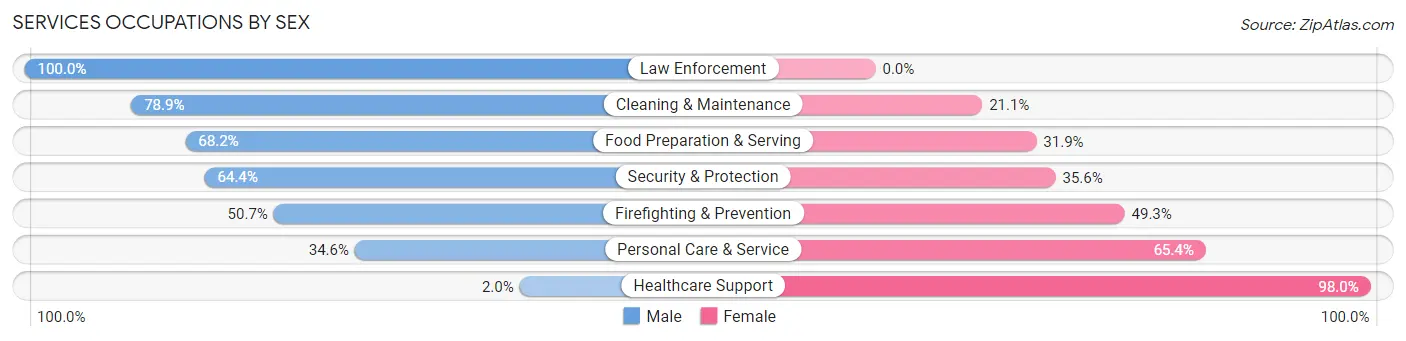
| Occupation | Male | Female |
| Healthcare Support | 7 (2.0%) | 345 (98.0%) |
| Security & Protection | 65 (64.4%) | 36 (35.6%) |
| Firefighting & Prevention | 37 (50.7%) | 36 (49.3%) |
| Law Enforcement | 28 (100.0%) | 0 (0.0%) |
| Food Preparation & Serving | 92 (68.1%) | 43 (31.9%) |
| Cleaning & Maintenance | 127 (78.9%) | 34 (21.1%) |
| Personal Care & Service | 9 (34.6%) | 17 (65.4%) |
| Total (Category) | 300 (38.7%) | 475 (61.3%) |
| Total (Overall) | 2,038 (50.9%) | 1,965 (49.1%) |
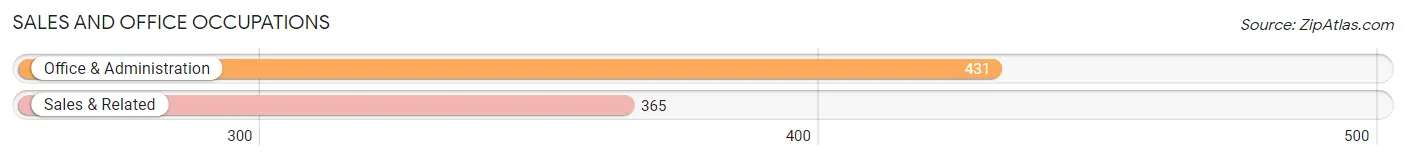
Sales and Office Occupations
The most common Sales and Office occupations in Johnstown are Office & Administration (431 | 10.8%), and Sales & Related (365 | 9.1%).
Sales and Office Occupations by Sex
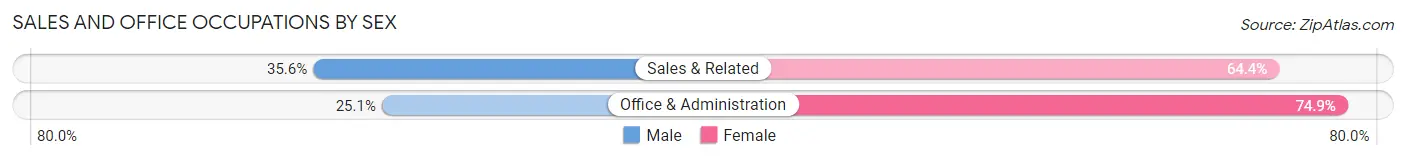
| Occupation | Male | Female |
| Sales & Related | 130 (35.6%) | 235 (64.4%) |
| Office & Administration | 108 (25.1%) | 323 (74.9%) |
| Total (Category) | 238 (29.9%) | 558 (70.1%) |
| Total (Overall) | 2,038 (50.9%) | 1,965 (49.1%) |
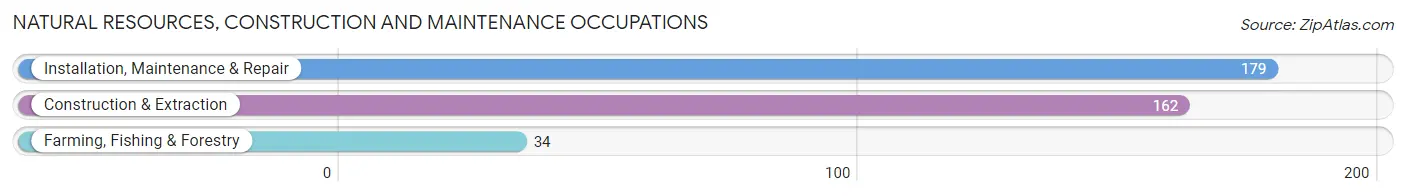
Natural Resources, Construction and Maintenance Occupations
The most common Natural Resources, Construction and Maintenance occupations in Johnstown are Installation, Maintenance & Repair (179 | 4.5%), Construction & Extraction (162 | 4.1%), and Farming, Fishing & Forestry (34 | 0.9%).
Natural Resources, Construction and Maintenance Occupations by Sex
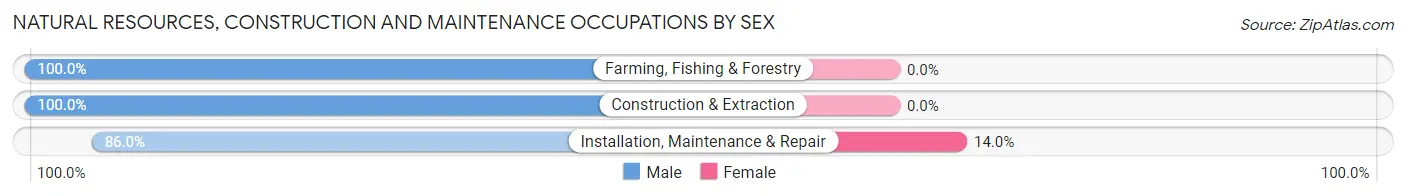
| Occupation | Male | Female |
| Farming, Fishing & Forestry | 34 (100.0%) | 0 (0.0%) |
| Construction & Extraction | 162 (100.0%) | 0 (0.0%) |
| Installation, Maintenance & Repair | 154 (86.0%) | 25 (14.0%) |
| Total (Category) | 350 (93.3%) | 25 (6.7%) |
| Total (Overall) | 2,038 (50.9%) | 1,965 (49.1%) |
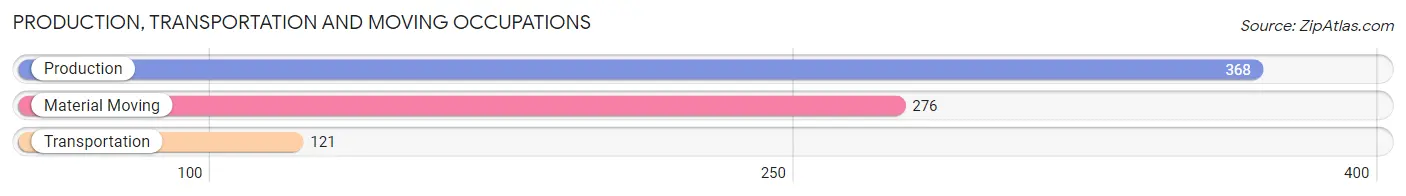
Production, Transportation and Moving Occupations
The most common Production, Transportation and Moving occupations in Johnstown are Production (368 | 9.2%), Material Moving (276 | 6.9%), and Transportation (121 | 3.0%).
Production, Transportation and Moving Occupations by Sex
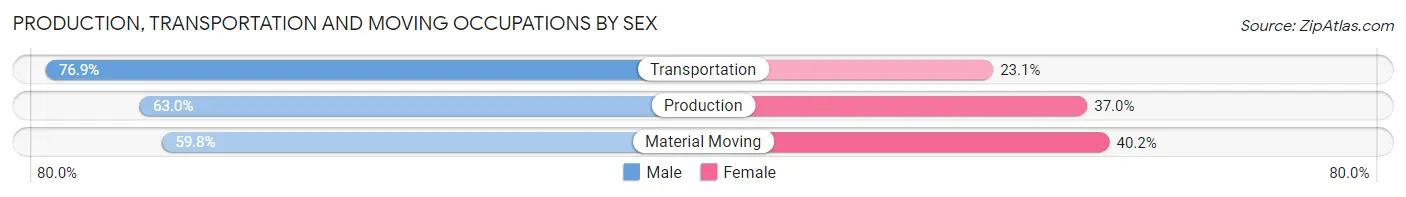
| Occupation | Male | Female |
| Production | 232 (63.0%) | 136 (37.0%) |
| Transportation | 93 (76.9%) | 28 (23.1%) |
| Material Moving | 165 (59.8%) | 111 (40.2%) |
| Total (Category) | 490 (64.0%) | 275 (35.9%) |
| Total (Overall) | 2,038 (50.9%) | 1,965 (49.1%) |
Employment Industries by Sex in Johnstown
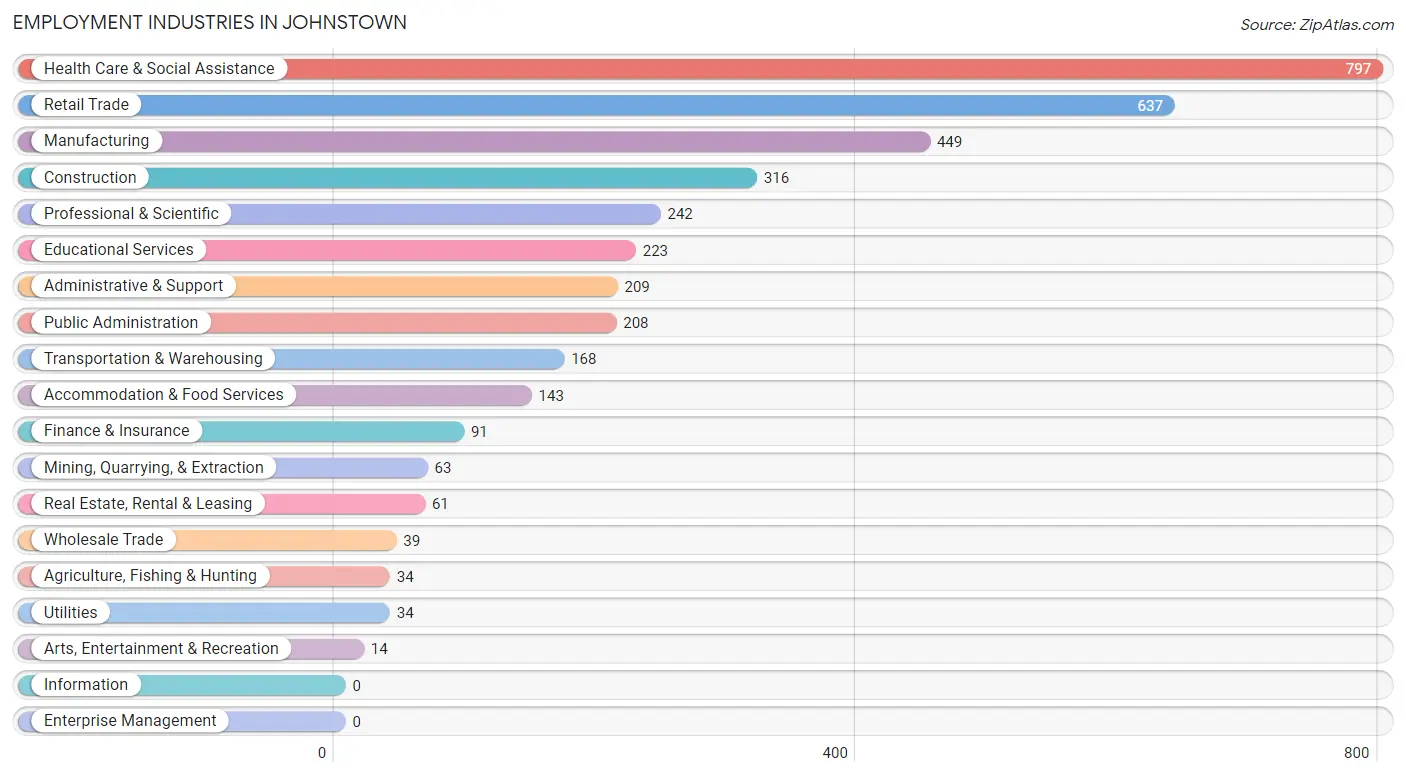
Employment Industries in Johnstown
The major employment industries in Johnstown include Health Care & Social Assistance (797 | 19.9%), Retail Trade (637 | 15.9%), Manufacturing (449 | 11.2%), Construction (316 | 7.9%), and Professional & Scientific (242 | 6.0%).
Employment Industries by Sex in Johnstown
The Johnstown industries that see more men than women are Agriculture, Fishing & Hunting (100.0%), Mining, Quarrying, & Extraction (100.0%), and Utilities (100.0%), whereas the industries that tend to have a higher number of women are Wholesale Trade (100.0%), Arts, Entertainment & Recreation (100.0%), and Educational Services (94.2%).
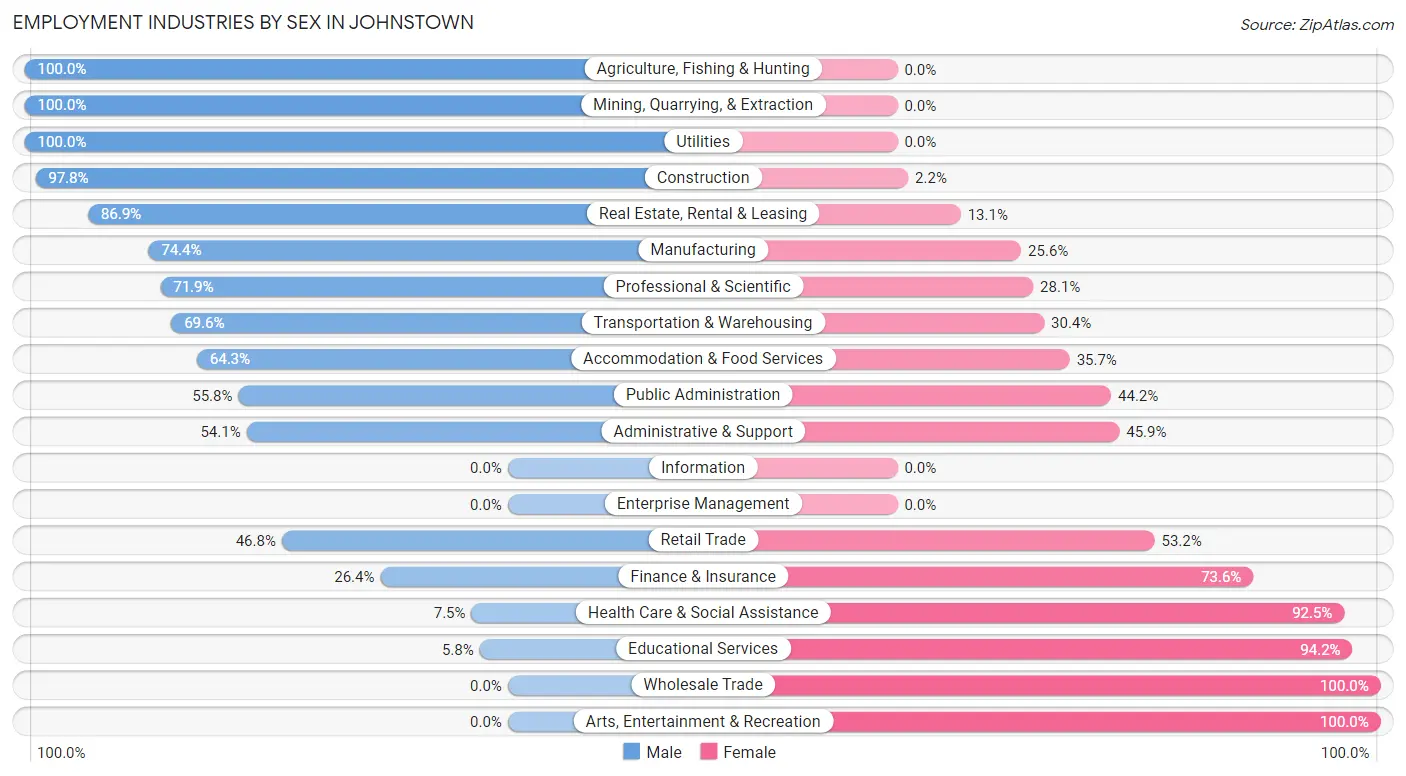
| Industry | Male | Female |
| Agriculture, Fishing & Hunting | 34 (100.0%) | 0 (0.0%) |
| Mining, Quarrying, & Extraction | 63 (100.0%) | 0 (0.0%) |
| Construction | 309 (97.8%) | 7 (2.2%) |
| Manufacturing | 334 (74.4%) | 115 (25.6%) |
| Wholesale Trade | 0 (0.0%) | 39 (100.0%) |
| Retail Trade | 298 (46.8%) | 339 (53.2%) |
| Transportation & Warehousing | 117 (69.6%) | 51 (30.4%) |
| Utilities | 34 (100.0%) | 0 (0.0%) |
| Information | 0 (0.0%) | 0 (0.0%) |
| Finance & Insurance | 24 (26.4%) | 67 (73.6%) |
| Real Estate, Rental & Leasing | 53 (86.9%) | 8 (13.1%) |
| Professional & Scientific | 174 (71.9%) | 68 (28.1%) |
| Enterprise Management | 0 (0.0%) | 0 (0.0%) |
| Administrative & Support | 113 (54.1%) | 96 (45.9%) |
| Educational Services | 13 (5.8%) | 210 (94.2%) |
| Health Care & Social Assistance | 60 (7.5%) | 737 (92.5%) |
| Arts, Entertainment & Recreation | 0 (0.0%) | 14 (100.0%) |
| Accommodation & Food Services | 92 (64.3%) | 51 (35.7%) |
| Public Administration | 116 (55.8%) | 92 (44.2%) |
| Total | 2,038 (50.9%) | 1,965 (49.1%) |
Education in Johnstown
School Enrollment in Johnstown
The most common levels of schooling among the 1,297 students in Johnstown are high school (395 | 30.4%), elementary school (290 | 22.4%), and middle school (269 | 20.7%).
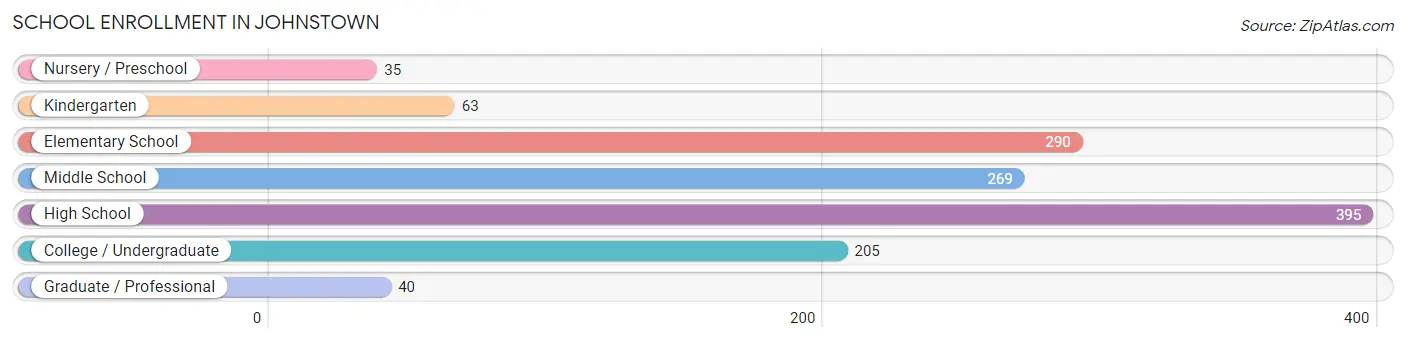
| School Level | # Students | % Students |
| Nursery / Preschool | 35 | 2.7% |
| Kindergarten | 63 | 4.9% |
| Elementary School | 290 | 22.4% |
| Middle School | 269 | 20.7% |
| High School | 395 | 30.4% |
| College / Undergraduate | 205 | 15.8% |
| Graduate / Professional | 40 | 3.1% |
| Total | 1,297 | 100.0% |
School Enrollment by Age by Funding Source in Johnstown
Out of a total of 1,297 students who are enrolled in schools in Johnstown, 93 (7.2%) attend a private institution, while the remaining 1,204 (92.8%) are enrolled in public schools. The age group of 20 to 24 year olds has the highest likelihood of being enrolled in private schools, with 30 (44.1% in the age bracket) enrolled. Conversely, the age group of 3 to 4 year olds has the lowest likelihood of being enrolled in a private school, with 21 (100.0% in the age bracket) attending a public institution.
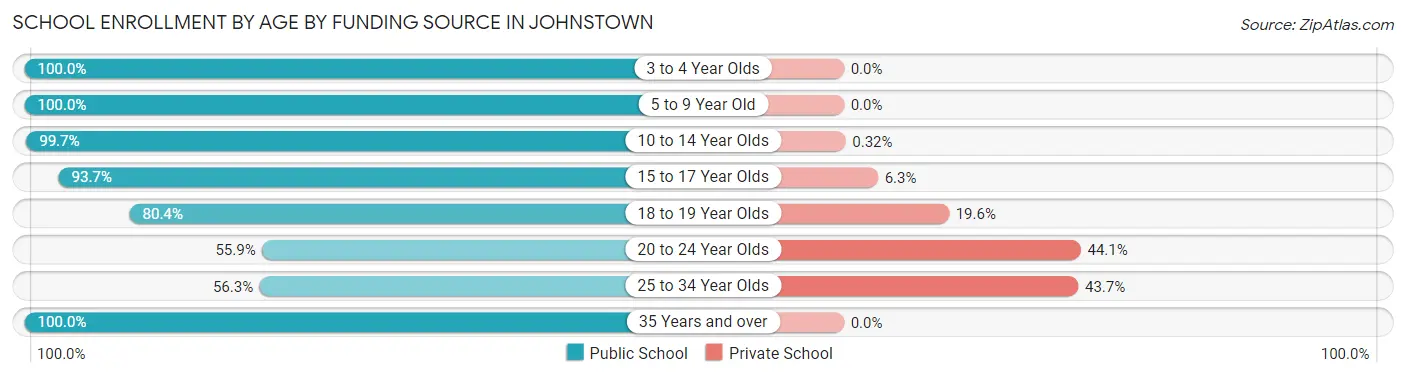
| Age Bracket | Public School | Private School |
| 3 to 4 Year Olds | 21 (100.0%) | 0 (0.0%) |
| 5 to 9 Year Old | 367 (100.0%) | 0 (0.0%) |
| 10 to 14 Year Olds | 310 (99.7%) | 1 (0.3%) |
| 15 to 17 Year Olds | 340 (93.7%) | 23 (6.3%) |
| 18 to 19 Year Olds | 37 (80.4%) | 9 (19.6%) |
| 20 to 24 Year Olds | 38 (55.9%) | 30 (44.1%) |
| 25 to 34 Year Olds | 40 (56.3%) | 31 (43.7%) |
| 35 Years and over | 50 (100.0%) | 0 (0.0%) |
| Total | 1,204 (92.8%) | 93 (7.2%) |
Educational Attainment by Field of Study in Johnstown
Education (525 | 30.4%), business (299 | 17.3%), social sciences (183 | 10.6%), communications (177 | 10.3%), and engineering (141 | 8.2%) are the most common fields of study among 1,724 individuals in Johnstown who have obtained a bachelor's degree or higher.
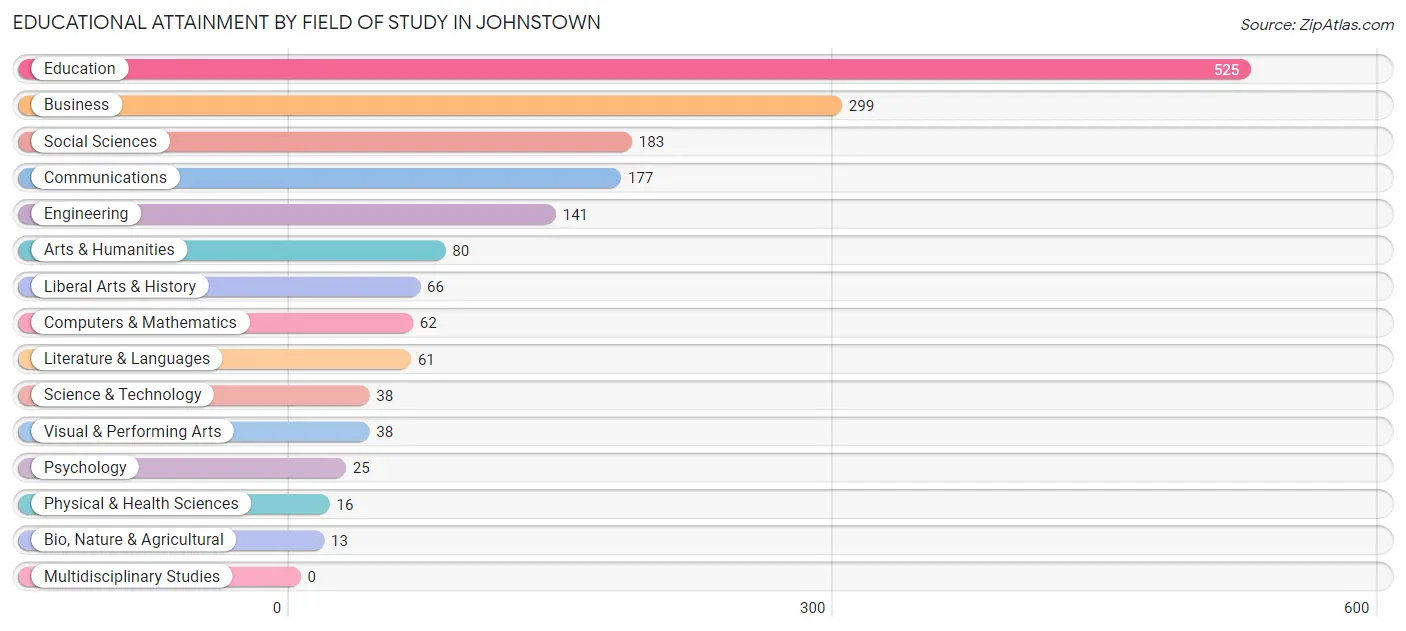
| Field of Study | # Graduates | % Graduates |
| Computers & Mathematics | 62 | 3.6% |
| Bio, Nature & Agricultural | 13 | 0.7% |
| Physical & Health Sciences | 16 | 0.9% |
| Psychology | 25 | 1.5% |
| Social Sciences | 183 | 10.6% |
| Engineering | 141 | 8.2% |
| Multidisciplinary Studies | 0 | 0.0% |
| Science & Technology | 38 | 2.2% |
| Business | 299 | 17.3% |
| Education | 525 | 30.4% |
| Literature & Languages | 61 | 3.5% |
| Liberal Arts & History | 66 | 3.8% |
| Visual & Performing Arts | 38 | 2.2% |
| Communications | 177 | 10.3% |
| Arts & Humanities | 80 | 4.6% |
| Total | 1,724 | 100.0% |
Transportation & Commute in Johnstown
Vehicle Availability by Sex in Johnstown
The most prevalent vehicle ownership categories in Johnstown are males with 2 vehicles (887, accounting for 43.5%) and females with 2 vehicles (697, making up 46.0%).
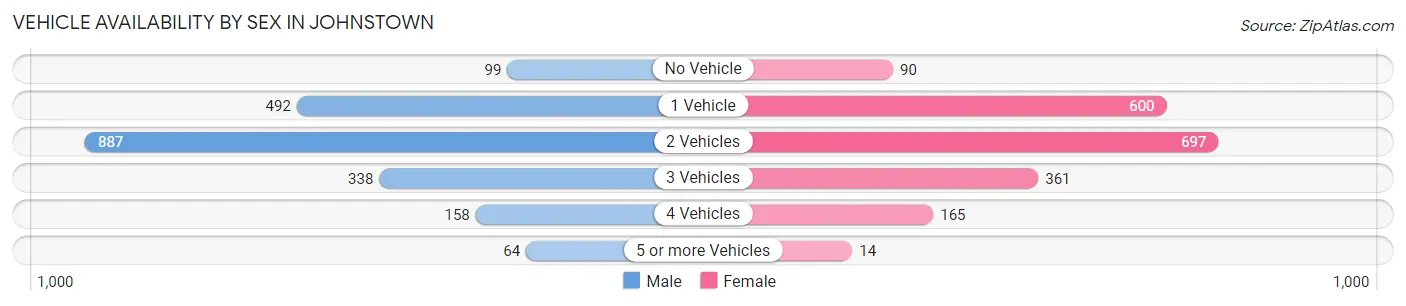
| Vehicles Available | Male | Female |
| No Vehicle | 99 (4.9%) | 90 (4.7%) |
| 1 Vehicle | 492 (24.1%) | 600 (31.1%) |
| 2 Vehicles | 887 (43.5%) | 697 (36.2%) |
| 3 Vehicles | 338 (16.6%) | 361 (18.7%) |
| 4 Vehicles | 158 (7.7%) | 165 (8.6%) |
| 5 or more Vehicles | 64 (3.1%) | 14 (0.7%) |
| Total | 2,038 (100.0%) | 1,927 (100.0%) |
Commute Time in Johnstown
The most frequently occuring commute durations in Johnstown are 5 to 9 minutes (820 commuters, 22.3%), 10 to 14 minutes (623 commuters, 17.0%), and 20 to 24 minutes (568 commuters, 15.5%).
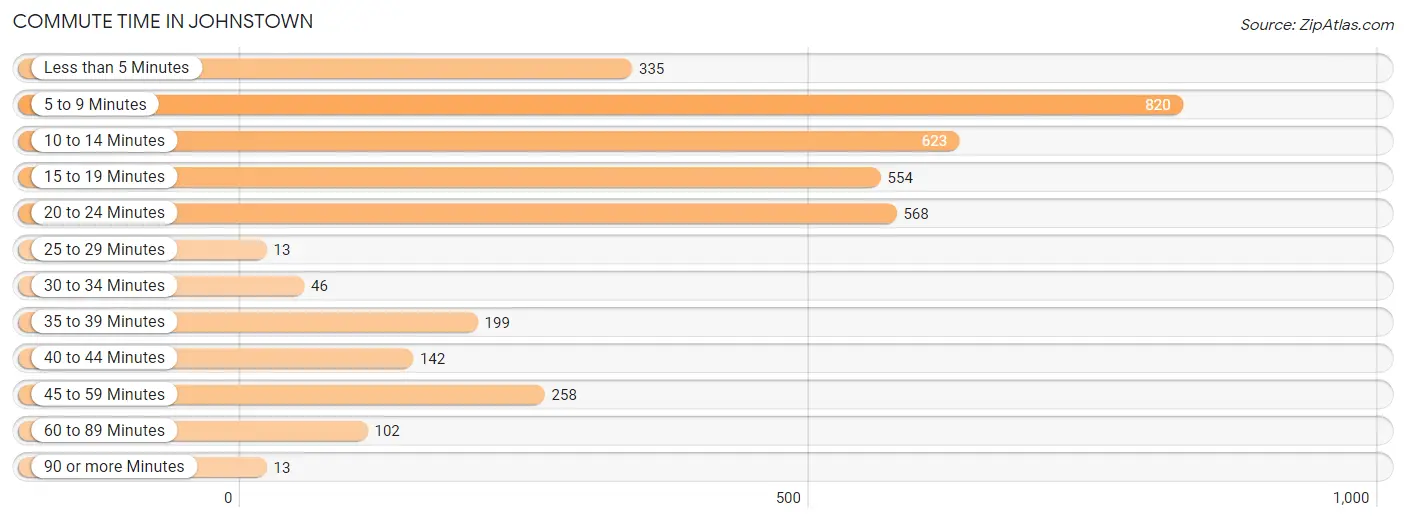
| Commute Time | # Commuters | % Commuters |
| Less than 5 Minutes | 335 | 9.1% |
| 5 to 9 Minutes | 820 | 22.3% |
| 10 to 14 Minutes | 623 | 17.0% |
| 15 to 19 Minutes | 554 | 15.1% |
| 20 to 24 Minutes | 568 | 15.5% |
| 25 to 29 Minutes | 13 | 0.4% |
| 30 to 34 Minutes | 46 | 1.3% |
| 35 to 39 Minutes | 199 | 5.4% |
| 40 to 44 Minutes | 142 | 3.9% |
| 45 to 59 Minutes | 258 | 7.0% |
| 60 to 89 Minutes | 102 | 2.8% |
| 90 or more Minutes | 13 | 0.4% |
Commute Time by Sex in Johnstown
The most common commute times in Johnstown are 5 to 9 minutes (339 commuters, 18.5%) for males and 5 to 9 minutes (481 commuters, 26.1%) for females.
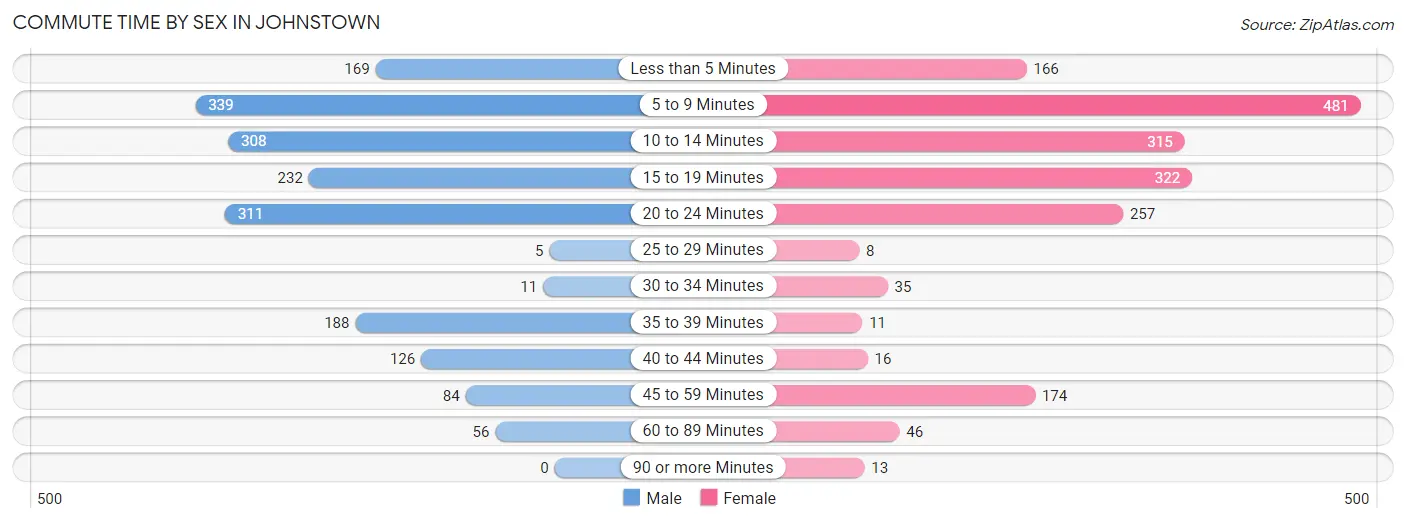
| Commute Time | Male | Female |
| Less than 5 Minutes | 169 (9.2%) | 166 (9.0%) |
| 5 to 9 Minutes | 339 (18.5%) | 481 (26.1%) |
| 10 to 14 Minutes | 308 (16.8%) | 315 (17.1%) |
| 15 to 19 Minutes | 232 (12.7%) | 322 (17.5%) |
| 20 to 24 Minutes | 311 (17.0%) | 257 (13.9%) |
| 25 to 29 Minutes | 5 (0.3%) | 8 (0.4%) |
| 30 to 34 Minutes | 11 (0.6%) | 35 (1.9%) |
| 35 to 39 Minutes | 188 (10.3%) | 11 (0.6%) |
| 40 to 44 Minutes | 126 (6.9%) | 16 (0.9%) |
| 45 to 59 Minutes | 84 (4.6%) | 174 (9.4%) |
| 60 to 89 Minutes | 56 (3.1%) | 46 (2.5%) |
| 90 or more Minutes | 0 (0.0%) | 13 (0.7%) |
Time of Departure to Work by Sex in Johnstown
The most frequent times of departure to work in Johnstown are 7:30 AM to 7:59 AM (314, 17.2%) for males and 7:30 AM to 7:59 AM (422, 22.9%) for females.
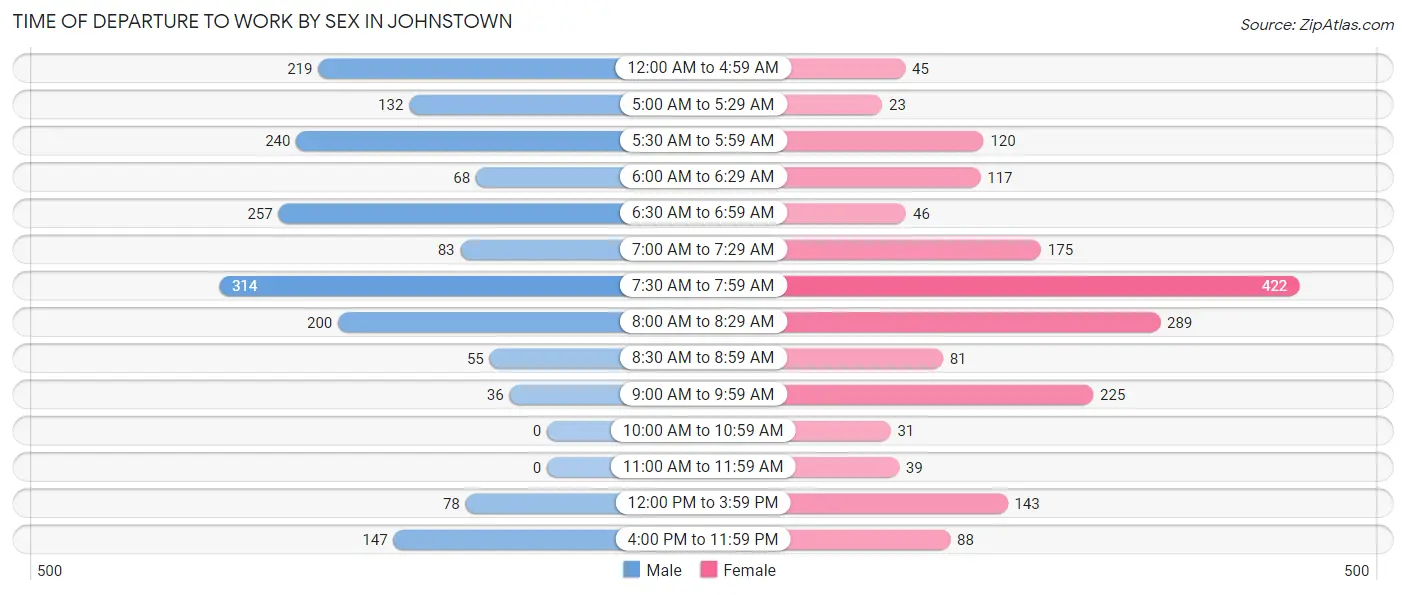
| Time of Departure | Male | Female |
| 12:00 AM to 4:59 AM | 219 (12.0%) | 45 (2.4%) |
| 5:00 AM to 5:29 AM | 132 (7.2%) | 23 (1.3%) |
| 5:30 AM to 5:59 AM | 240 (13.1%) | 120 (6.5%) |
| 6:00 AM to 6:29 AM | 68 (3.7%) | 117 (6.3%) |
| 6:30 AM to 6:59 AM | 257 (14.1%) | 46 (2.5%) |
| 7:00 AM to 7:29 AM | 83 (4.5%) | 175 (9.5%) |
| 7:30 AM to 7:59 AM | 314 (17.2%) | 422 (22.9%) |
| 8:00 AM to 8:29 AM | 200 (10.9%) | 289 (15.7%) |
| 8:30 AM to 8:59 AM | 55 (3.0%) | 81 (4.4%) |
| 9:00 AM to 9:59 AM | 36 (2.0%) | 225 (12.2%) |
| 10:00 AM to 10:59 AM | 0 (0.0%) | 31 (1.7%) |
| 11:00 AM to 11:59 AM | 0 (0.0%) | 39 (2.1%) |
| 12:00 PM to 3:59 PM | 78 (4.3%) | 143 (7.7%) |
| 4:00 PM to 11:59 PM | 147 (8.0%) | 88 (4.8%) |
| Total | 1,829 (100.0%) | 1,844 (100.0%) |
Housing Occupancy in Johnstown
Occupancy by Ownership in Johnstown
Of the total 3,896 dwellings in Johnstown, owner-occupied units account for 2,296 (58.9%), while renter-occupied units make up 1,600 (41.1%).
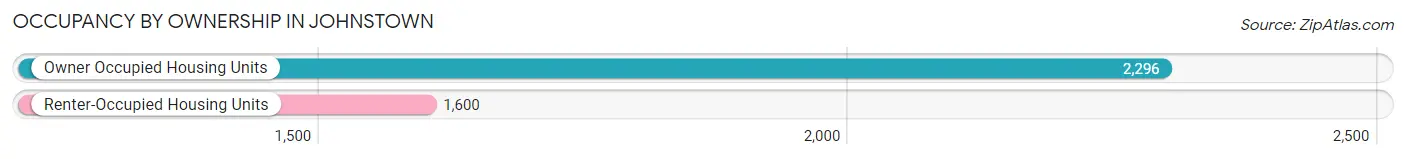
| Occupancy | # Housing Units | % Housing Units |
| Owner Occupied Housing Units | 2,296 | 58.9% |
| Renter-Occupied Housing Units | 1,600 | 41.1% |
| Total Occupied Housing Units | 3,896 | 100.0% |
Occupancy by Household Size in Johnstown
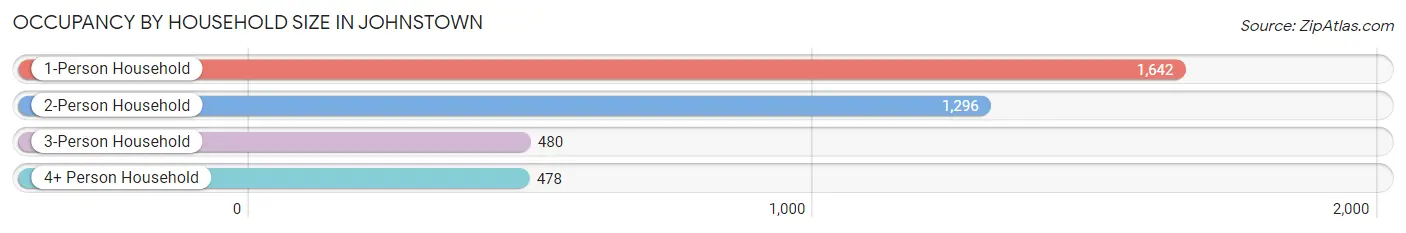
| Household Size | # Housing Units | % Housing Units |
| 1-Person Household | 1,642 | 42.1% |
| 2-Person Household | 1,296 | 33.3% |
| 3-Person Household | 480 | 12.3% |
| 4+ Person Household | 478 | 12.3% |
| Total Housing Units | 3,896 | 100.0% |
Occupancy by Ownership by Household Size in Johnstown
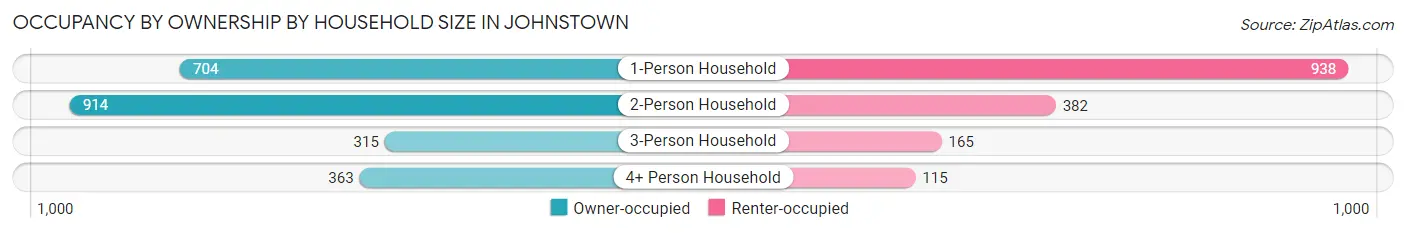
| Household Size | Owner-occupied | Renter-occupied |
| 1-Person Household | 704 (42.9%) | 938 (57.1%) |
| 2-Person Household | 914 (70.5%) | 382 (29.5%) |
| 3-Person Household | 315 (65.6%) | 165 (34.4%) |
| 4+ Person Household | 363 (75.9%) | 115 (24.1%) |
| Total Housing Units | 2,296 (58.9%) | 1,600 (41.1%) |
Occupancy by Educational Attainment in Johnstown
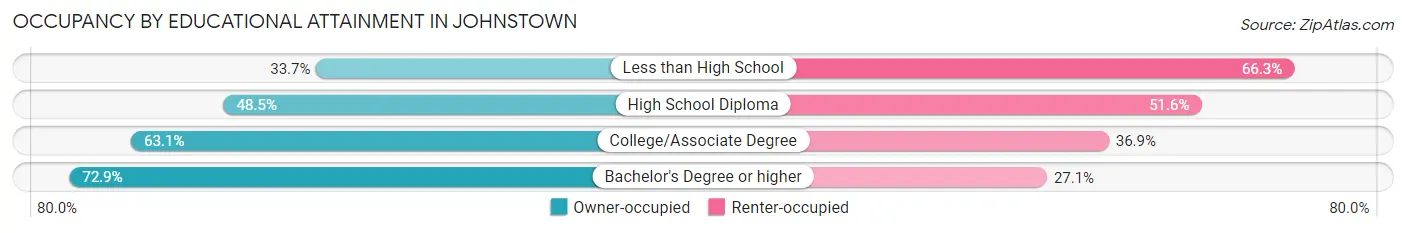
| Household Size | Owner-occupied | Renter-occupied |
| Less than High School | 86 (33.7%) | 169 (66.3%) |
| High School Diploma | 624 (48.4%) | 664 (51.5%) |
| College/Associate Degree | 835 (63.1%) | 488 (36.9%) |
| Bachelor's Degree or higher | 751 (72.9%) | 279 (27.1%) |
Occupancy by Age of Householder in Johnstown
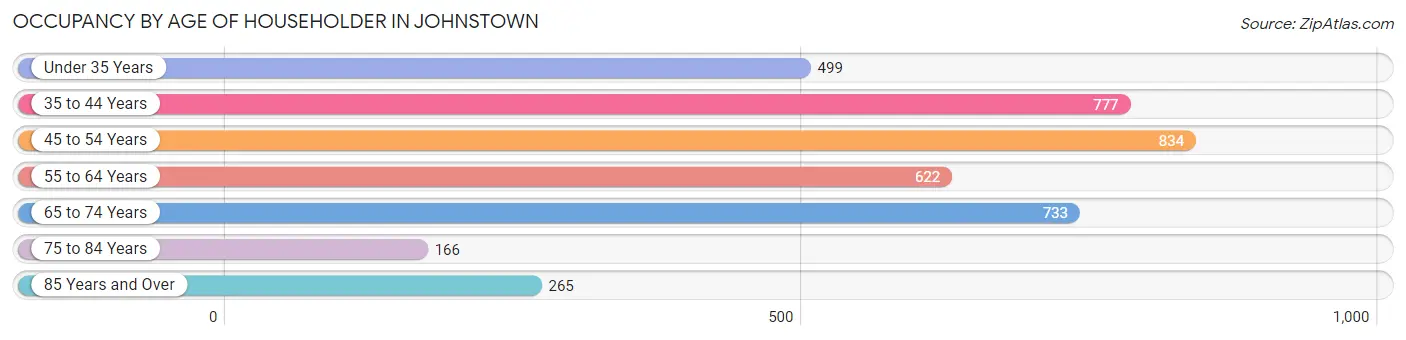
| Age Bracket | # Households | % Households |
| Under 35 Years | 499 | 12.8% |
| 35 to 44 Years | 777 | 19.9% |
| 45 to 54 Years | 834 | 21.4% |
| 55 to 64 Years | 622 | 16.0% |
| 65 to 74 Years | 733 | 18.8% |
| 75 to 84 Years | 166 | 4.3% |
| 85 Years and Over | 265 | 6.8% |
| Total | 3,896 | 100.0% |
Housing Finances in Johnstown
Median Income by Occupancy in Johnstown
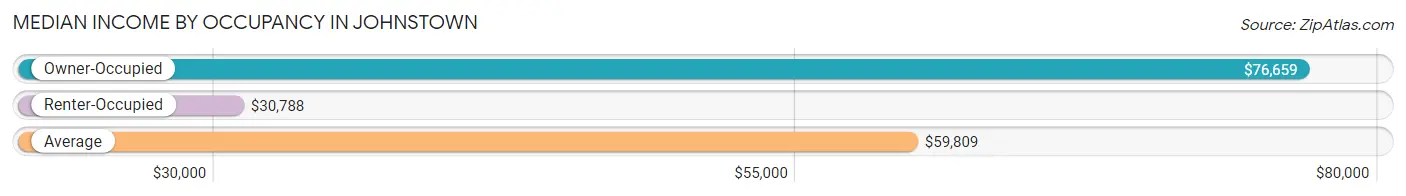
| Occupancy Type | # Households | Median Income |
| Owner-Occupied | 2,296 (58.9%) | $76,659 |
| Renter-Occupied | 1,600 (41.1%) | $30,788 |
| Average | 3,896 (100.0%) | $59,809 |
Occupancy by Householder Income Bracket in Johnstown
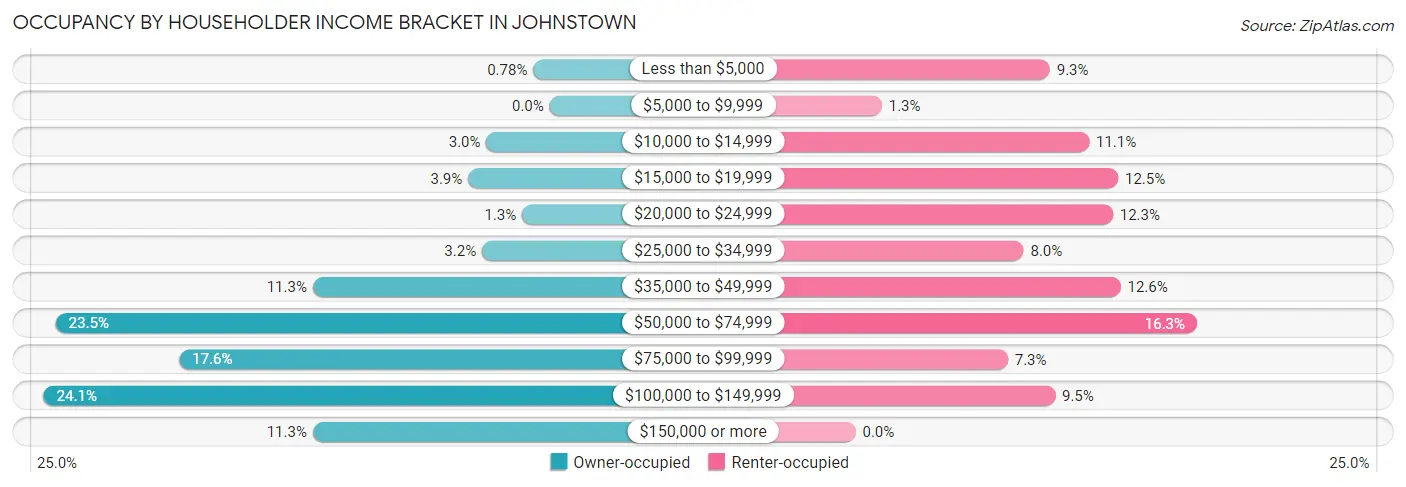
| Income Bracket | Owner-occupied | Renter-occupied |
| Less than $5,000 | 18 (0.8%) | 148 (9.2%) |
| $5,000 to $9,999 | 0 (0.0%) | 20 (1.3%) |
| $10,000 to $14,999 | 69 (3.0%) | 178 (11.1%) |
| $15,000 to $19,999 | 89 (3.9%) | 200 (12.5%) |
| $20,000 to $24,999 | 30 (1.3%) | 196 (12.2%) |
| $25,000 to $34,999 | 74 (3.2%) | 128 (8.0%) |
| $35,000 to $49,999 | 259 (11.3%) | 202 (12.6%) |
| $50,000 to $74,999 | 540 (23.5%) | 260 (16.3%) |
| $75,000 to $99,999 | 405 (17.6%) | 116 (7.2%) |
| $100,000 to $149,999 | 553 (24.1%) | 152 (9.5%) |
| $150,000 or more | 259 (11.3%) | 0 (0.0%) |
| Total | 2,296 (100.0%) | 1,600 (100.0%) |
Monthly Housing Cost Tiers in Johnstown
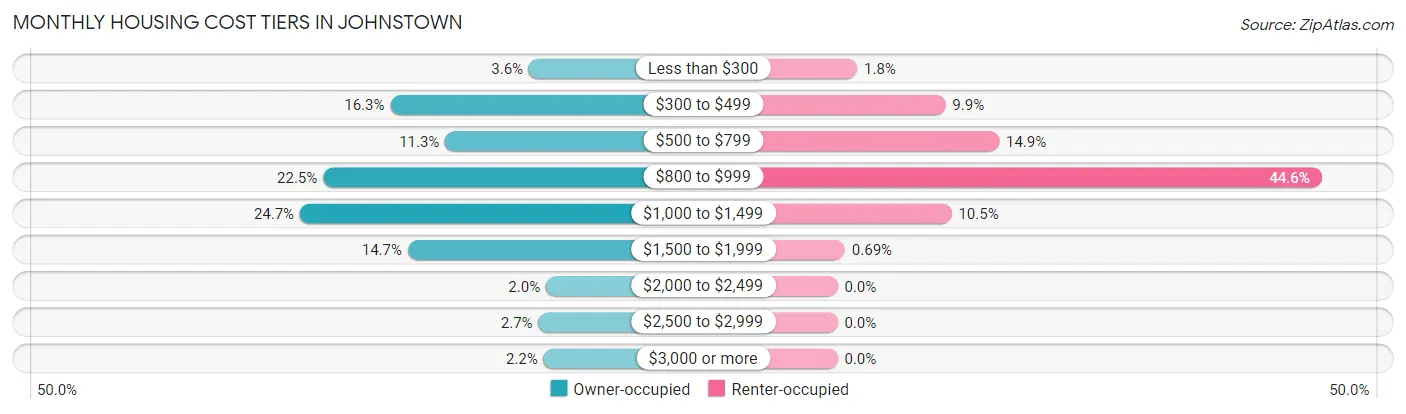
| Monthly Cost | Owner-occupied | Renter-occupied |
| Less than $300 | 82 (3.6%) | 29 (1.8%) |
| $300 to $499 | 375 (16.3%) | 159 (9.9%) |
| $500 to $799 | 259 (11.3%) | 238 (14.9%) |
| $800 to $999 | 517 (22.5%) | 713 (44.6%) |
| $1,000 to $1,499 | 566 (24.6%) | 168 (10.5%) |
| $1,500 to $1,999 | 338 (14.7%) | 11 (0.7%) |
| $2,000 to $2,499 | 46 (2.0%) | 0 (0.0%) |
| $2,500 to $2,999 | 62 (2.7%) | 0 (0.0%) |
| $3,000 or more | 51 (2.2%) | 0 (0.0%) |
| Total | 2,296 (100.0%) | 1,600 (100.0%) |
Physical Housing Characteristics in Johnstown
Housing Structures in Johnstown
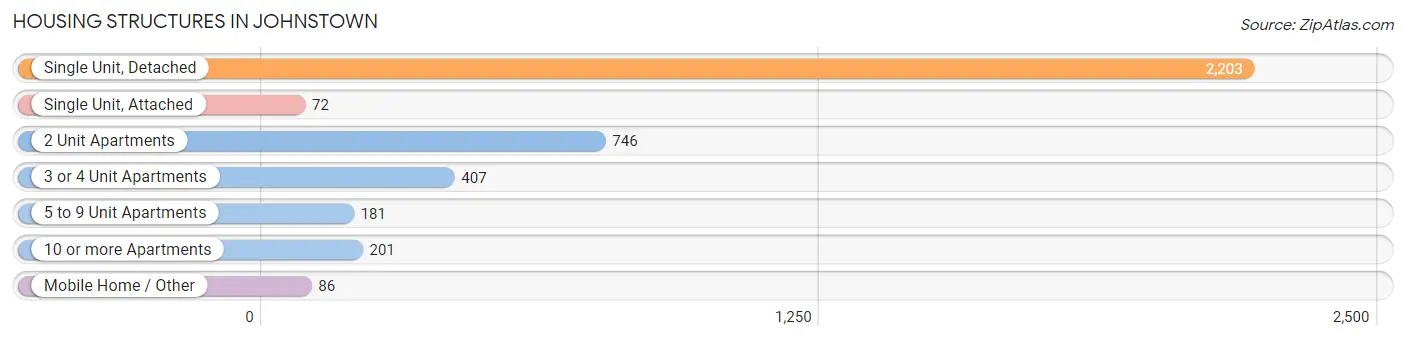
| Structure Type | # Housing Units | % Housing Units |
| Single Unit, Detached | 2,203 | 56.6% |
| Single Unit, Attached | 72 | 1.8% |
| 2 Unit Apartments | 746 | 19.2% |
| 3 or 4 Unit Apartments | 407 | 10.4% |
| 5 to 9 Unit Apartments | 181 | 4.6% |
| 10 or more Apartments | 201 | 5.2% |
| Mobile Home / Other | 86 | 2.2% |
| Total | 3,896 | 100.0% |
Housing Structures by Occupancy in Johnstown
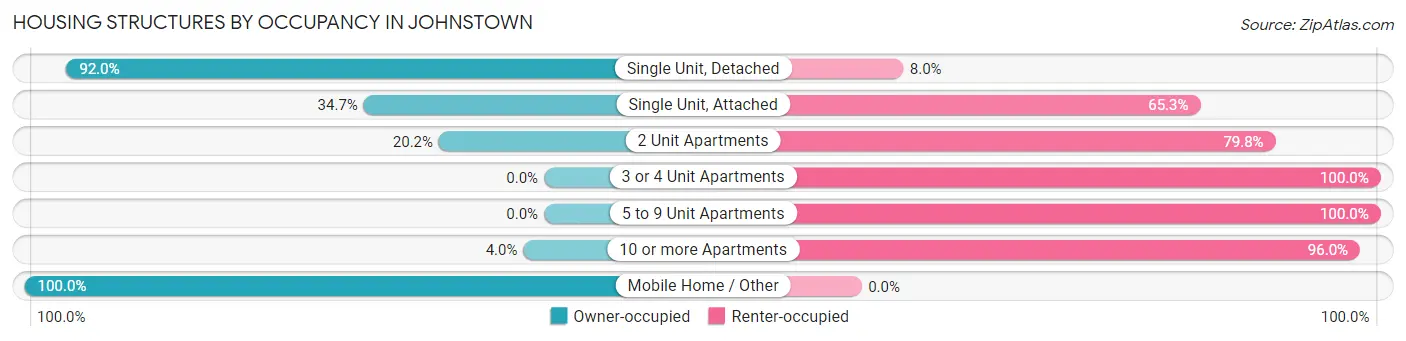
| Structure Type | Owner-occupied | Renter-occupied |
| Single Unit, Detached | 2,026 (92.0%) | 177 (8.0%) |
| Single Unit, Attached | 25 (34.7%) | 47 (65.3%) |
| 2 Unit Apartments | 151 (20.2%) | 595 (79.8%) |
| 3 or 4 Unit Apartments | 0 (0.0%) | 407 (100.0%) |
| 5 to 9 Unit Apartments | 0 (0.0%) | 181 (100.0%) |
| 10 or more Apartments | 8 (4.0%) | 193 (96.0%) |
| Mobile Home / Other | 86 (100.0%) | 0 (0.0%) |
| Total | 2,296 (58.9%) | 1,600 (41.1%) |
Housing Structures by Number of Rooms in Johnstown
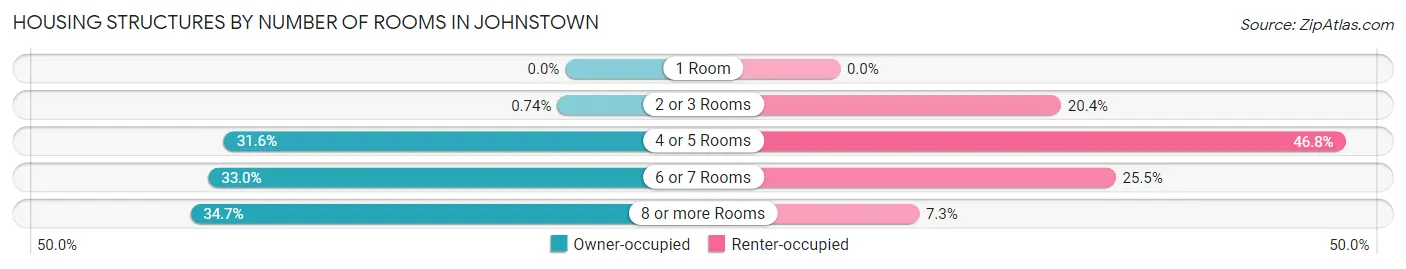
| Number of Rooms | Owner-occupied | Renter-occupied |
| 1 Room | 0 (0.0%) | 0 (0.0%) |
| 2 or 3 Rooms | 17 (0.7%) | 327 (20.4%) |
| 4 or 5 Rooms | 725 (31.6%) | 748 (46.8%) |
| 6 or 7 Rooms | 758 (33.0%) | 408 (25.5%) |
| 8 or more Rooms | 796 (34.7%) | 117 (7.3%) |
| Total | 2,296 (100.0%) | 1,600 (100.0%) |
Housing Structure by Heating Type in Johnstown
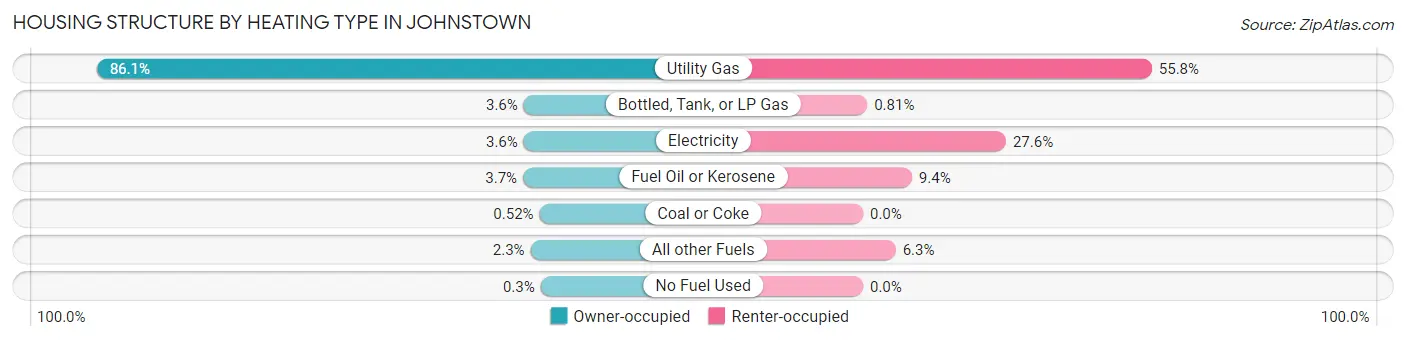
| Heating Type | Owner-occupied | Renter-occupied |
| Utility Gas | 1,976 (86.1%) | 893 (55.8%) |
| Bottled, Tank, or LP Gas | 82 (3.6%) | 13 (0.8%) |
| Electricity | 82 (3.6%) | 442 (27.6%) |
| Fuel Oil or Kerosene | 85 (3.7%) | 151 (9.4%) |
| Coal or Coke | 12 (0.5%) | 0 (0.0%) |
| All other Fuels | 52 (2.3%) | 101 (6.3%) |
| No Fuel Used | 7 (0.3%) | 0 (0.0%) |
| Total | 2,296 (100.0%) | 1,600 (100.0%) |
Household Vehicle Usage in Johnstown
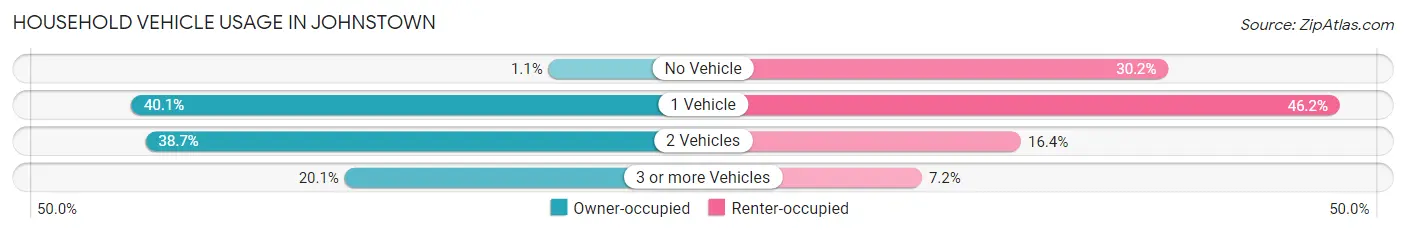
| Vehicles per Household | Owner-occupied | Renter-occupied |
| No Vehicle | 25 (1.1%) | 483 (30.2%) |
| 1 Vehicle | 920 (40.1%) | 739 (46.2%) |
| 2 Vehicles | 889 (38.7%) | 263 (16.4%) |
| 3 or more Vehicles | 462 (20.1%) | 115 (7.2%) |
| Total | 2,296 (100.0%) | 1,600 (100.0%) |
Real Estate & Mortgages in Johnstown
Real Estate and Mortgage Overview in Johnstown
| Characteristic | Without Mortgage | With Mortgage |
| Housing Units | 939 | 1,357 |
| Median Property Value | $111,100 | $140,300 |
| Median Household Income | $60,078 | $195 |
| Monthly Housing Costs | $586 | $30 |
| Real Estate Taxes | $2,581 | $30 |
Property Value by Mortgage Status in Johnstown
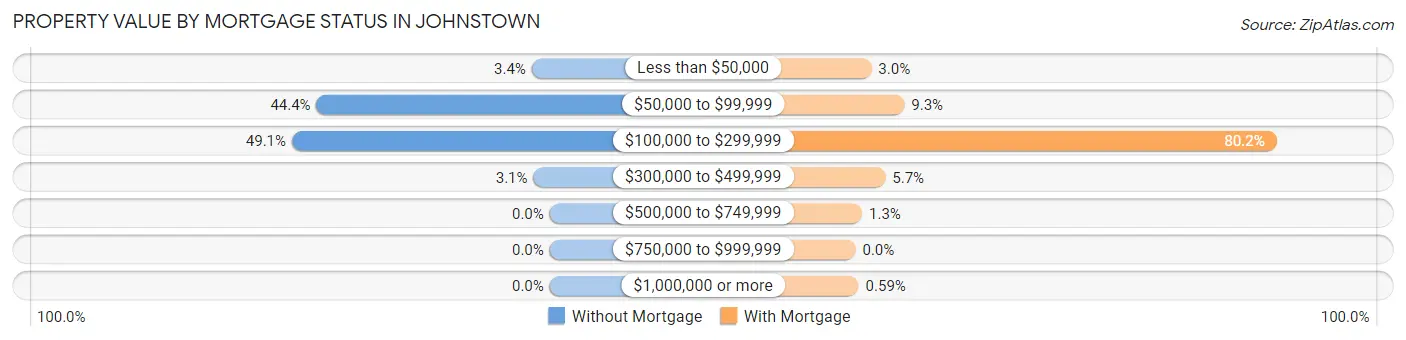
| Property Value | Without Mortgage | With Mortgage |
| Less than $50,000 | 32 (3.4%) | 41 (3.0%) |
| $50,000 to $99,999 | 417 (44.4%) | 126 (9.3%) |
| $100,000 to $299,999 | 461 (49.1%) | 1,088 (80.2%) |
| $300,000 to $499,999 | 29 (3.1%) | 77 (5.7%) |
| $500,000 to $749,999 | 0 (0.0%) | 17 (1.3%) |
| $750,000 to $999,999 | 0 (0.0%) | 0 (0.0%) |
| $1,000,000 or more | 0 (0.0%) | 8 (0.6%) |
| Total | 939 (100.0%) | 1,357 (100.0%) |
Household Income by Mortgage Status in Johnstown
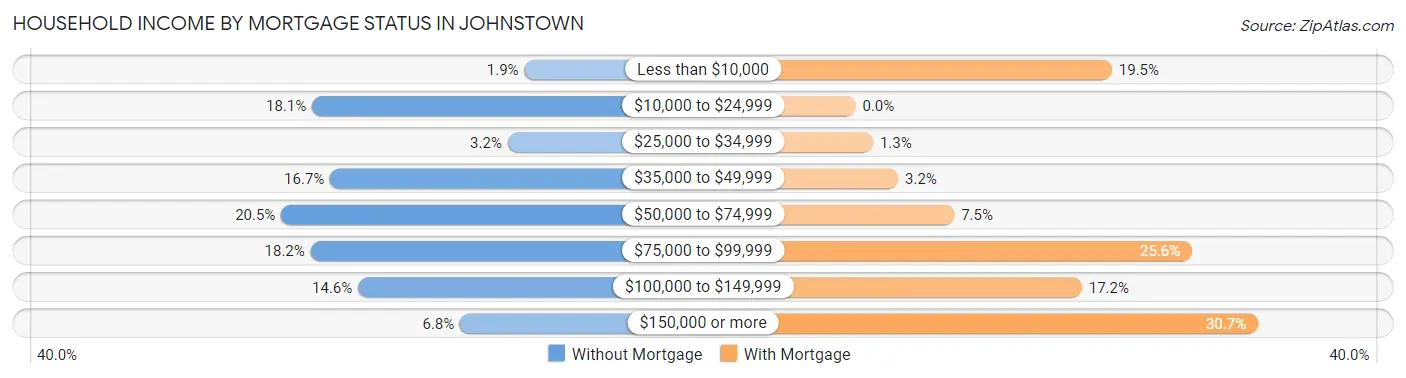
| Household Income | Without Mortgage | With Mortgage |
| Less than $10,000 | 18 (1.9%) | 265 (19.5%) |
| $10,000 to $24,999 | 170 (18.1%) | 0 (0.0%) |
| $25,000 to $34,999 | 30 (3.2%) | 18 (1.3%) |
| $35,000 to $49,999 | 157 (16.7%) | 44 (3.2%) |
| $50,000 to $74,999 | 192 (20.4%) | 102 (7.5%) |
| $75,000 to $99,999 | 171 (18.2%) | 348 (25.6%) |
| $100,000 to $149,999 | 137 (14.6%) | 234 (17.2%) |
| $150,000 or more | 64 (6.8%) | 416 (30.7%) |
| Total | 939 (100.0%) | 1,357 (100.0%) |
Property Value to Household Income Ratio in Johnstown
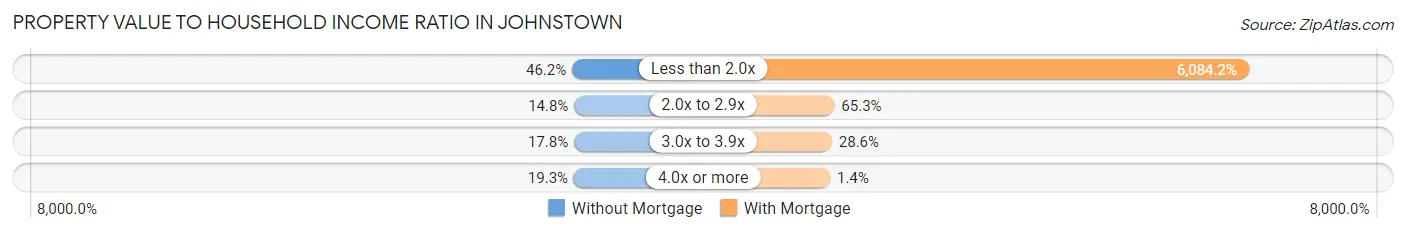
| Value-to-Income Ratio | Without Mortgage | With Mortgage |
| Less than 2.0x | 434 (46.2%) | 82,563 (6,084.2%) |
| 2.0x to 2.9x | 139 (14.8%) | 886 (65.3%) |
| 3.0x to 3.9x | 167 (17.8%) | 388 (28.6%) |
| 4.0x or more | 181 (19.3%) | 19 (1.4%) |
| Total | 939 (100.0%) | 1,357 (100.0%) |
Real Estate Taxes by Mortgage Status in Johnstown
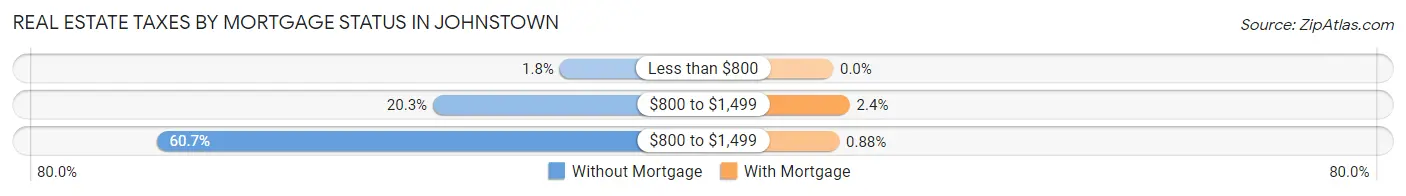
| Property Taxes | Without Mortgage | With Mortgage |
| Less than $800 | 17 (1.8%) | 0 (0.0%) |
| $800 to $1,499 | 191 (20.3%) | 33 (2.4%) |
| $800 to $1,499 | 570 (60.7%) | 12 (0.9%) |
| Total | 939 (100.0%) | 1,357 (100.0%) |
Health & Disability in Johnstown
Health Insurance Coverage by Age in Johnstown
| Age Bracket | With Coverage | Without Coverage |
| Under 6 Years | 405 (100.0%) | 0 (0.0%) |
| 6 to 18 Years | 1,090 (98.7%) | 14 (1.3%) |
| 19 to 25 Years | 494 (100.0%) | 0 (0.0%) |
| 26 to 34 Years | 960 (97.2%) | 28 (2.8%) |
| 35 to 44 Years | 1,048 (94.5%) | 61 (5.5%) |
| 45 to 54 Years | 1,234 (96.2%) | 49 (3.8%) |
| 55 to 64 Years | 1,028 (100.0%) | 0 (0.0%) |
| 65 to 74 Years | 1,127 (100.0%) | 0 (0.0%) |
| 75 Years and older | 580 (100.0%) | 0 (0.0%) |
| Total | 7,966 (98.1%) | 152 (1.9%) |
Health Insurance Coverage by Citizenship Status in Johnstown
| Citizenship Status | With Coverage | Without Coverage |
| Native Born | 405 (100.0%) | 0 (0.0%) |
| Foreign Born, Citizen | 1,090 (98.7%) | 14 (1.3%) |
| Foreign Born, not a Citizen | 494 (100.0%) | 0 (0.0%) |
Health Insurance Coverage by Household Income in Johnstown
| Household Income | With Coverage | Without Coverage |
| Under $25,000 | 1,057 (94.5%) | 61 (5.5%) |
| $25,000 to $49,999 | 884 (95.1%) | 46 (5.0%) |
| $50,000 to $74,999 | 1,759 (100.0%) | 0 (0.0%) |
| $75,000 to $99,999 | 1,307 (97.7%) | 31 (2.3%) |
| $100,000 and over | 2,859 (99.5%) | 14 (0.5%) |
Public vs Private Health Insurance Coverage by Age in Johnstown
| Age Bracket | Public Insurance | Private Insurance |
| Under 6 | 143 (35.3%) | 281 (69.4%) |
| 6 to 18 Years | 337 (30.5%) | 803 (72.7%) |
| 19 to 25 Years | 248 (50.2%) | 295 (59.7%) |
| 25 to 34 Years | 327 (33.1%) | 642 (65.0%) |
| 35 to 44 Years | 346 (31.2%) | 755 (68.1%) |
| 45 to 54 Years | 249 (19.4%) | 1,082 (84.3%) |
| 55 to 64 Years | 411 (40.0%) | 631 (61.4%) |
| 65 to 74 Years | 1,107 (98.2%) | 663 (58.8%) |
| 75 Years and over | 559 (96.4%) | 377 (65.0%) |
| Total | 3,727 (45.9%) | 5,529 (68.1%) |
Disability Status by Sex by Age in Johnstown
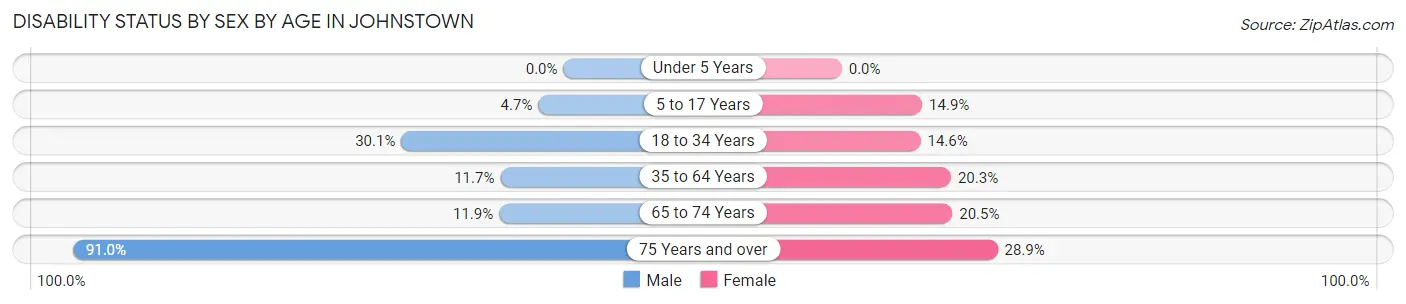
| Age Bracket | Male | Female |
| Under 5 Years | 0 (0.0%) | 0 (0.0%) |
| 5 to 17 Years | 25 (4.7%) | 84 (14.9%) |
| 18 to 34 Years | 223 (30.1%) | 111 (14.6%) |
| 35 to 64 Years | 202 (11.7%) | 344 (20.3%) |
| 65 to 74 Years | 60 (11.9%) | 128 (20.5%) |
| 75 Years and over | 122 (91.0%) | 129 (28.9%) |
Disability Class by Sex by Age in Johnstown
Disability Class: Hearing Difficulty
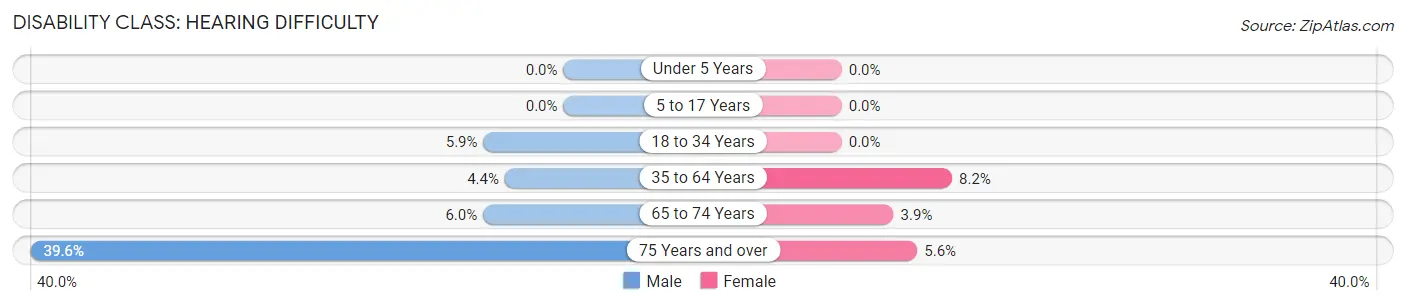
| Age Bracket | Male | Female |
| Under 5 Years | 0 (0.0%) | 0 (0.0%) |
| 5 to 17 Years | 0 (0.0%) | 0 (0.0%) |
| 18 to 34 Years | 44 (5.9%) | 0 (0.0%) |
| 35 to 64 Years | 75 (4.3%) | 139 (8.2%) |
| 65 to 74 Years | 30 (6.0%) | 24 (3.8%) |
| 75 Years and over | 53 (39.6%) | 25 (5.6%) |
Disability Class: Vision Difficulty
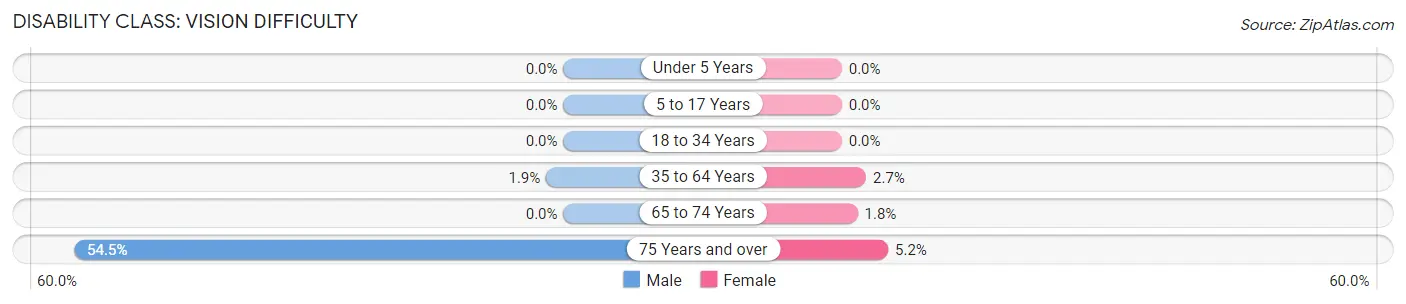
| Age Bracket | Male | Female |
| Under 5 Years | 0 (0.0%) | 0 (0.0%) |
| 5 to 17 Years | 0 (0.0%) | 0 (0.0%) |
| 18 to 34 Years | 0 (0.0%) | 0 (0.0%) |
| 35 to 64 Years | 33 (1.9%) | 46 (2.7%) |
| 65 to 74 Years | 0 (0.0%) | 11 (1.8%) |
| 75 Years and over | 73 (54.5%) | 23 (5.2%) |
Disability Class: Cognitive Difficulty
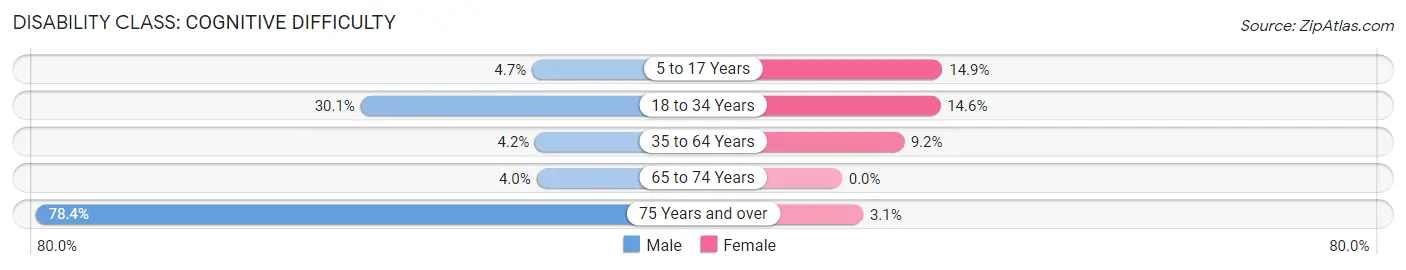
| Age Bracket | Male | Female |
| 5 to 17 Years | 25 (4.7%) | 84 (14.9%) |
| 18 to 34 Years | 223 (30.1%) | 111 (14.6%) |
| 35 to 64 Years | 72 (4.2%) | 156 (9.2%) |
| 65 to 74 Years | 20 (4.0%) | 0 (0.0%) |
| 75 Years and over | 105 (78.4%) | 14 (3.1%) |
Disability Class: Ambulatory Difficulty
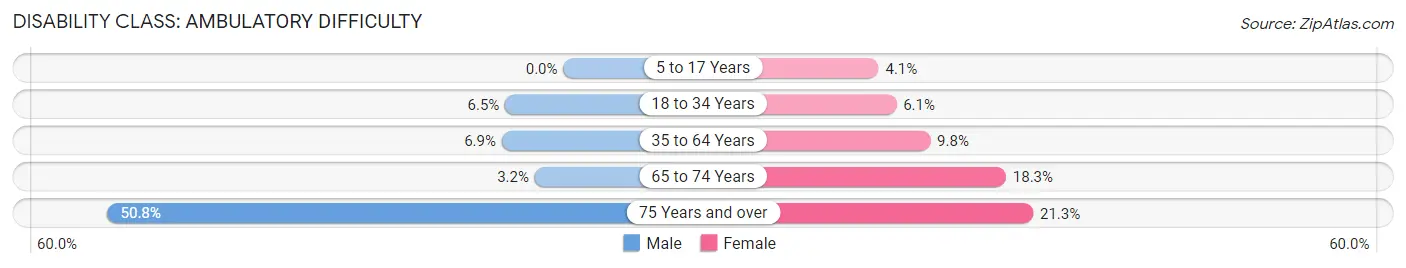
| Age Bracket | Male | Female |
| 5 to 17 Years | 0 (0.0%) | 23 (4.1%) |
| 18 to 34 Years | 48 (6.5%) | 46 (6.1%) |
| 35 to 64 Years | 118 (6.9%) | 167 (9.8%) |
| 65 to 74 Years | 16 (3.2%) | 114 (18.3%) |
| 75 Years and over | 68 (50.7%) | 95 (21.3%) |
Disability Class: Self-Care Difficulty
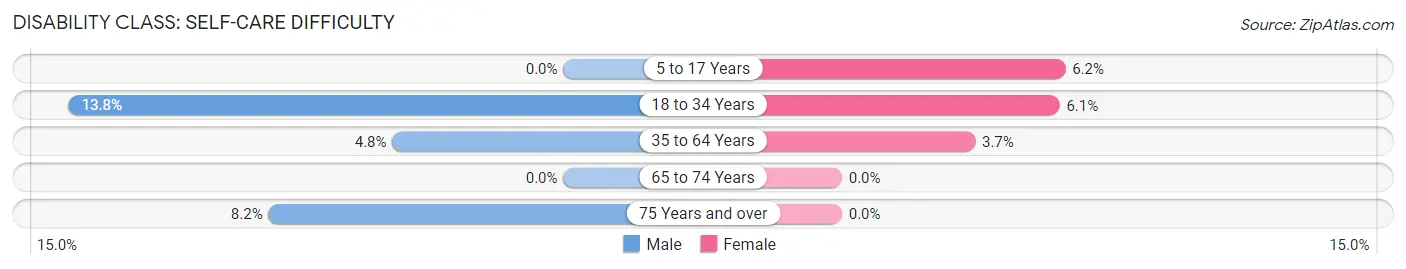
| Age Bracket | Male | Female |
| 5 to 17 Years | 0 (0.0%) | 35 (6.2%) |
| 18 to 34 Years | 102 (13.8%) | 46 (6.1%) |
| 35 to 64 Years | 82 (4.8%) | 63 (3.7%) |
| 65 to 74 Years | 0 (0.0%) | 0 (0.0%) |
| 75 Years and over | 11 (8.2%) | 0 (0.0%) |
Technology Access in Johnstown
Computing Device Access in Johnstown
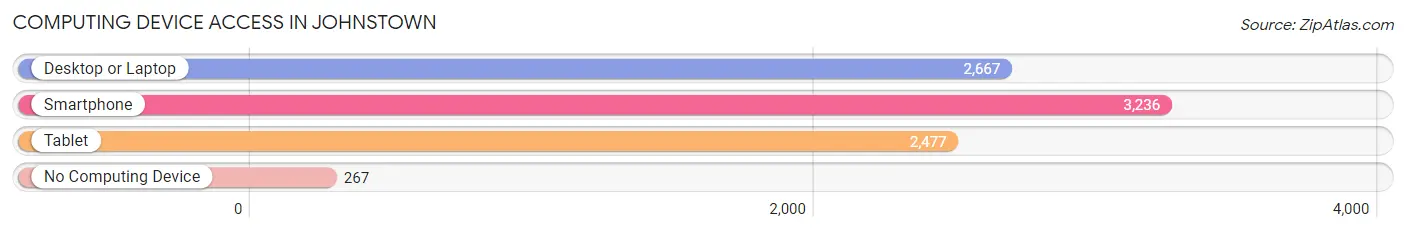
| Device Type | # Households | % Households |
| Desktop or Laptop | 2,667 | 68.4% |
| Smartphone | 3,236 | 83.1% |
| Tablet | 2,477 | 63.6% |
| No Computing Device | 267 | 6.9% |
| Total | 3,896 | 100.0% |
Internet Access in Johnstown
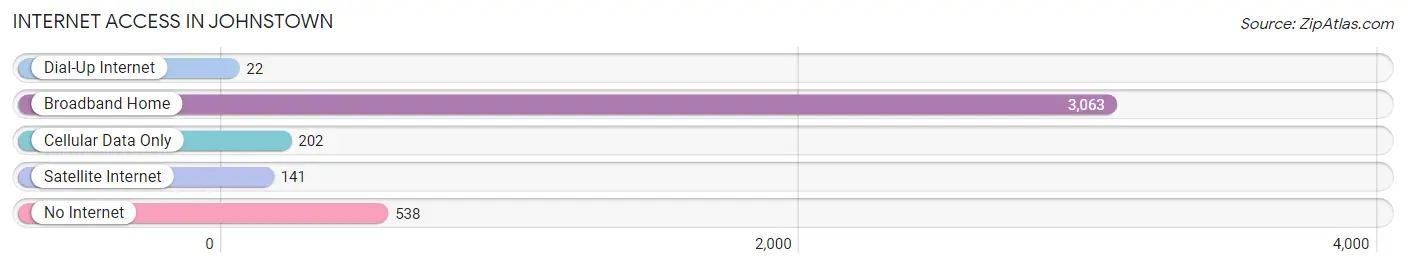
| Internet Type | # Households | % Households |
| Dial-Up Internet | 22 | 0.6% |
| Broadband Home | 3,063 | 78.6% |
| Cellular Data Only | 202 | 5.2% |
| Satellite Internet | 141 | 3.6% |
| No Internet | 538 | 13.8% |
| Total | 3,896 | 100.0% |
Johnstown Summary
Johnstown, NY is a city located in Fulton County, New York, United States. It is situated in the foothills of the Adirondack Mountains, approximately 45 miles northwest of Albany, the state capital. The city is situated on the banks of the Cayadutta Creek, a tributary of the Mohawk River. As of the 2010 census, the city had a population of 8,743.
History
Johnstown was founded in 1762 by Sir William Johnson, a British army officer and colonial administrator. He named the settlement after his son, John Johnson. The city was incorporated in 1808.
During the American Revolution, Johnstown was the site of several battles between the British and American forces. In 1777, the Battle of Johnstown was fought here, resulting in a British victory. In 1781, the Battle of Johnstown was fought here again, resulting in an American victory.
In the 19th century, Johnstown became an important industrial center. The city was home to several iron and steel mills, as well as a number of other manufacturing businesses. The city was also home to several large tanneries.
Geography
Johnstown is located at 42°59′N 74°36′W (42.983, -74.600). According to the United States Census Bureau, the city has a total area of 4.2 square miles (10.8 km2), all of it land.
Johnstown is located in the foothills of the Adirondack Mountains. The city is situated on the banks of the Cayadutta Creek, a tributary of the Mohawk River.
Economy
Johnstown is a small city with a diverse economy. The city is home to several manufacturing businesses, including a number of metalworking and plastics companies. The city is also home to several retail businesses, including a number of antique stores.
Johnstown is also home to several educational institutions, including Fulton-Montgomery Community College and the Johnstown campus of the State University of New York.
Demographics
As of the 2010 census, there were 8,743 people, 3,541 households, and 2,092 families residing in the city. The population density was 2,092.2 people per square mile (806.2/km2). There were 3,945 housing units at an average density of 945.2 per square mile (364.7/km2). The racial makeup of the city was 94.2% White, 2.2% African American, 0.3% Native American, 0.7% Asian, 0.1% Pacific Islander, 0.7% from other races, and 1.9% from two or more races. Hispanic or Latino of any race were 2.7% of the population.
There were 3,541 households, out of which 28.2% had children under the age of 18 living with them, 39.2% were married couples living together, 15.7% had a female householder with no husband present, and 39.7% were non-families. 33.2% of all households were made up of individuals, and 14.3% had someone living alone who was 65 years of age or older. The average household size was 2.37 and the average family size was 2.99.
In the city, the population was spread out, with 24.2% under the age of 18, 8.2% from 18 to 24, 27.2% from 25 to 44, 22.7% from 45 to 64, and 17.7% who were 65 years of age or older. The median age was 38 years. For every 100 females, there were 91.2 males. For every 100 females age 18 and over, there were 87.2 males.
The median income for a household in the city was $31,944, and the median income for a family was $40,945. Males had a median income of $31,944 versus $25,917 for females. The per capita income for the city was $17,845. About 11.2% of families and 14.2% of the population were below the poverty line, including 19.2% of those under age 18 and 8.7% of those age 65 or over.
Common Questions
What is Per Capita Income in Johnstown?
Per Capita income in Johnstown is $34,187.
What is the Median Family Income in Johnstown?
Median Family Income in Johnstown is $81,134.
What is the Median Household income in Johnstown?
Median Household Income in Johnstown is $59,809.
What is Income or Wage Gap in Johnstown?
Income or Wage Gap in Johnstown is 15.6%.
Women in Johnstown earn 84.4 cents for every dollar earned by a man.
What is Inequality or Gini Index in Johnstown?
Inequality or Gini Index in Johnstown is 0.43.
What is the Total Population of Johnstown?
Total Population of Johnstown is 8,216.
What is the Total Male Population of Johnstown?
Total Male Population of Johnstown is 3,945.
What is the Total Female Population of Johnstown?
Total Female Population of Johnstown is 4,271.
What is the Ratio of Males per 100 Females in Johnstown?
There are 92.37 Males per 100 Females in Johnstown.
What is the Ratio of Females per 100 Males in Johnstown?
There are 108.26 Females per 100 Males in Johnstown.
What is the Median Population Age in Johnstown?
Median Population Age in Johnstown is 45.1 Years.
What is the Average Family Size in Johnstown
Average Family Size in Johnstown is 2.8 People.
What is the Average Household Size in Johnstown
Average Household Size in Johnstown is 2.1 People.
How Large is the Labor Force in Johnstown?
There are 4,145 People in the Labor Forcein in Johnstown.
What is the Percentage of People in the Labor Force in Johnstown?
59.0% of People are in the Labor Force in Johnstown.
What is the Unemployment Rate in Johnstown?
Unemployment Rate in Johnstown is 3.4%.