Smithtown, NY Map & Demographics
Smithtown Map
Smithtown Overview
$65,031
PER CAPITA INCOME
$166,755
AVG FAMILY INCOME
$146,506
AVG HOUSEHOLD INCOME
32.9%
WAGE / INCOME GAP [ % ]
67.1¢/ $1
WAGE / INCOME GAP [ $ ]
0.44
INEQUALITY / GINI INDEX
25,588
TOTAL POPULATION
12,713
MALE POPULATION
12,875
FEMALE POPULATION
98.74
MALES / 100 FEMALES
101.27
FEMALES / 100 MALES
46.7
MEDIAN AGE
3.4
AVG FAMILY SIZE
3.0
AVG HOUSEHOLD SIZE
13,501
LABOR FORCE [ PEOPLE ]
64.6%
PERCENT IN LABOR FORCE
3.6%
UNEMPLOYMENT RATE
Smithtown Zip Codes
Income in Smithtown
Income Overview in Smithtown
Per Capita Income in Smithtown is $65,031, while median incomes of families and households are $166,755 and $146,506 respectively.
| Characteristic | Number | Measure |
| Per Capita Income | 25,588 | $65,031 |
| Median Family Income | 6,638 | $166,755 |
| Mean Family Income | 6,638 | $213,465 |
| Median Household Income | 8,421 | $146,506 |
| Mean Household Income | 8,421 | $187,618 |
| Income Deficit | 6,638 | $0 |
| Wage / Income Gap (%) | 25,588 | 32.92% |
| Wage / Income Gap ($) | 25,588 | 67.08¢ per $1 |
| Gini / Inequality Index | 25,588 | 0.44 |
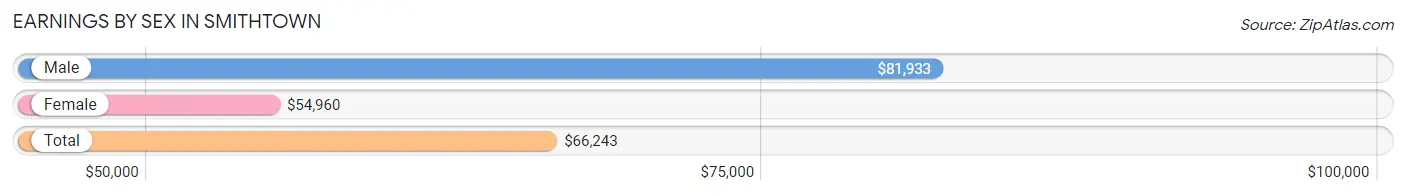
Earnings by Sex in Smithtown
Average Earnings in Smithtown are $66,243, $81,933 for men and $54,960 for women, a difference of 32.9%.
| Sex | Number | Average Earnings |
| Male | 7,488 (52.8%) | $81,933 |
| Female | 6,680 (47.1%) | $54,960 |
| Total | 14,168 (100.0%) | $66,243 |
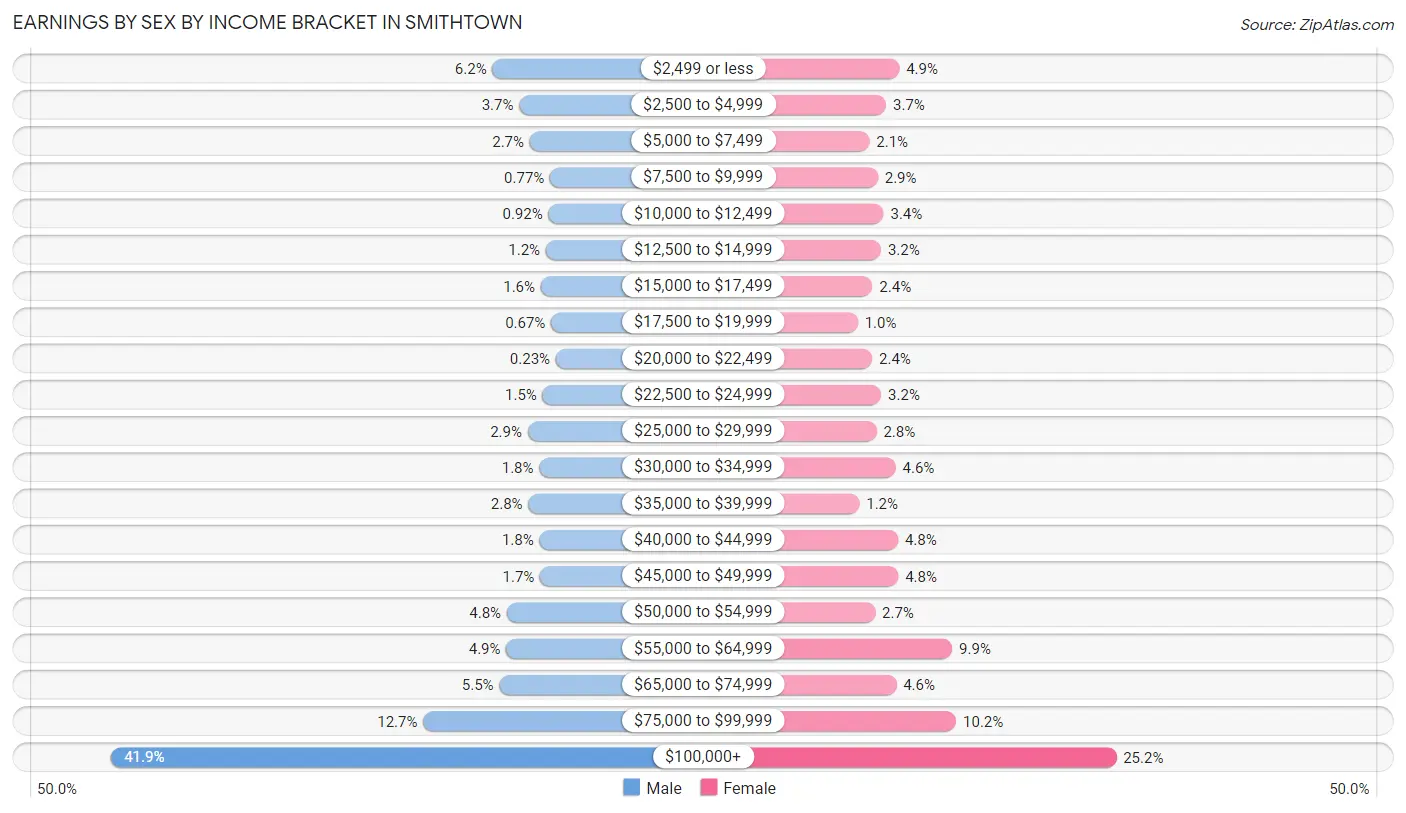
Earnings by Sex by Income Bracket in Smithtown
The most common earnings brackets in Smithtown are $100,000+ for men (3,136 | 41.9%) and $100,000+ for women (1,686 | 25.2%).
| Income | Male | Female |
| $2,499 or less | 462 (6.2%) | 328 (4.9%) |
| $2,500 to $4,999 | 274 (3.7%) | 246 (3.7%) |
| $5,000 to $7,499 | 200 (2.7%) | 141 (2.1%) |
| $7,500 to $9,999 | 58 (0.8%) | 194 (2.9%) |
| $10,000 to $12,499 | 69 (0.9%) | 230 (3.4%) |
| $12,500 to $14,999 | 87 (1.2%) | 214 (3.2%) |
| $15,000 to $17,499 | 123 (1.6%) | 160 (2.4%) |
| $17,500 to $19,999 | 50 (0.7%) | 68 (1.0%) |
| $20,000 to $22,499 | 17 (0.2%) | 158 (2.4%) |
| $22,500 to $24,999 | 110 (1.5%) | 215 (3.2%) |
| $25,000 to $29,999 | 214 (2.9%) | 186 (2.8%) |
| $30,000 to $34,999 | 133 (1.8%) | 305 (4.6%) |
| $35,000 to $39,999 | 210 (2.8%) | 78 (1.2%) |
| $40,000 to $44,999 | 132 (1.8%) | 320 (4.8%) |
| $45,000 to $49,999 | 127 (1.7%) | 322 (4.8%) |
| $50,000 to $54,999 | 361 (4.8%) | 177 (2.6%) |
| $55,000 to $64,999 | 365 (4.9%) | 659 (9.9%) |
| $65,000 to $74,999 | 413 (5.5%) | 309 (4.6%) |
| $75,000 to $99,999 | 947 (12.7%) | 684 (10.2%) |
| $100,000+ | 3,136 (41.9%) | 1,686 (25.2%) |
| Total | 7,488 (100.0%) | 6,680 (100.0%) |
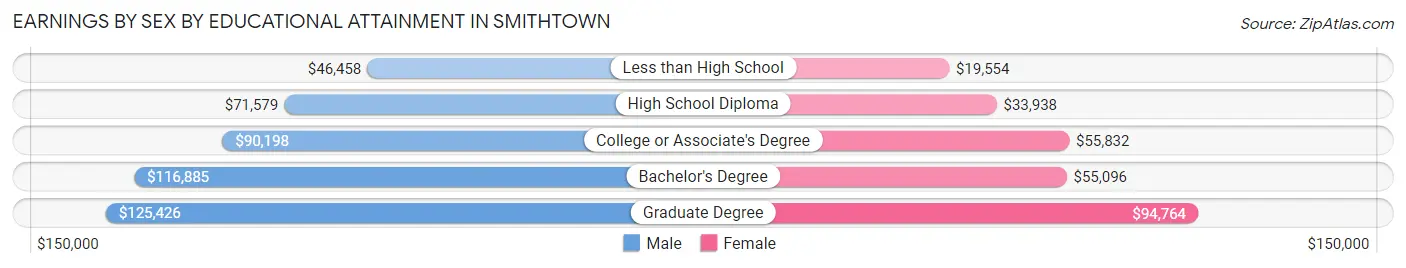
Earnings by Sex by Educational Attainment in Smithtown
Average earnings in Smithtown are $96,606 for men and $56,937 for women, a difference of 41.1%. Men with an educational attainment of graduate degree enjoy the highest average annual earnings of $125,426, while those with less than high school education earn the least with $46,458. Women with an educational attainment of graduate degree earn the most with the average annual earnings of $94,764, while those with less than high school education have the smallest earnings of $19,554.
| Educational Attainment | Male Income | Female Income |
| Less than High School | $46,458 | $19,554 |
| High School Diploma | $71,579 | $33,938 |
| College or Associate's Degree | $90,198 | $55,832 |
| Bachelor's Degree | $116,885 | $55,096 |
| Graduate Degree | $125,426 | $94,764 |
| Total | $96,606 | $56,937 |
Family Income in Smithtown
Family Income Brackets in Smithtown
According to the Smithtown family income data, there are 2,682 families falling into the $200,000+ income range, which is the most common income bracket and makes up 40.4% of all families. Conversely, the $10,000 to $14,999 income bracket is the least frequent group with only 40 families (0.6%) belonging to this category.
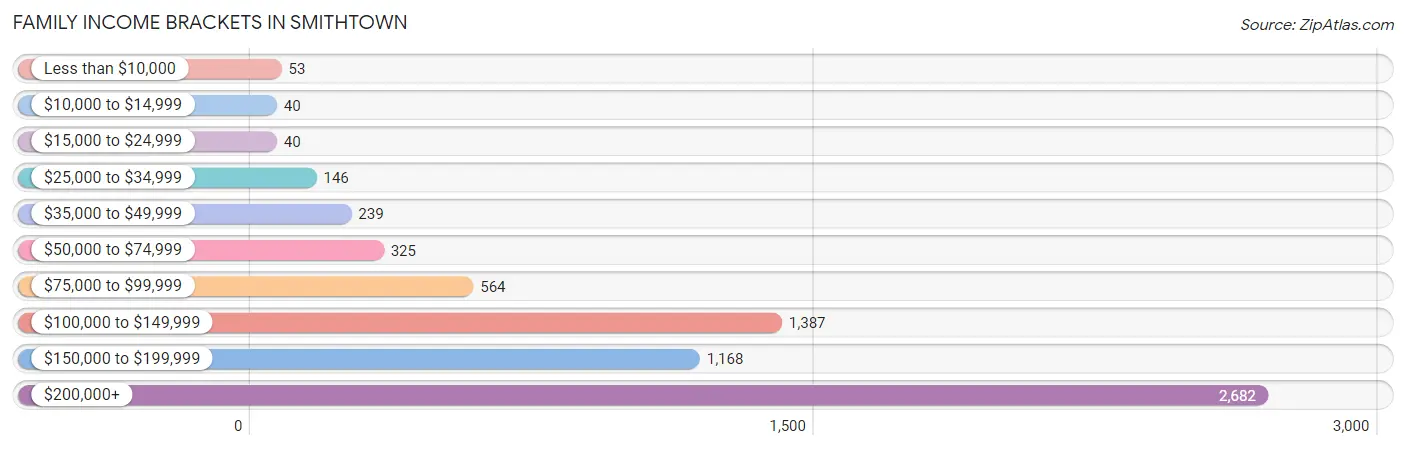
| Income Bracket | # Families | % Families |
| Less than $10,000 | 53 | 0.8% |
| $10,000 to $14,999 | 40 | 0.6% |
| $15,000 to $24,999 | 40 | 0.6% |
| $25,000 to $34,999 | 146 | 2.2% |
| $35,000 to $49,999 | 239 | 3.6% |
| $50,000 to $74,999 | 325 | 4.9% |
| $75,000 to $99,999 | 564 | 8.5% |
| $100,000 to $149,999 | 1,387 | 20.9% |
| $150,000 to $199,999 | 1,168 | 17.6% |
| $200,000+ | 2,682 | 40.4% |
Family Income by Famaliy Size in Smithtown
6-person families (103 | 1.5%) account for the highest median family income in Smithtown with $250,001 per family, while 2-person families (2,485 | 37.4%) have the highest median income of $65,656 per family member.
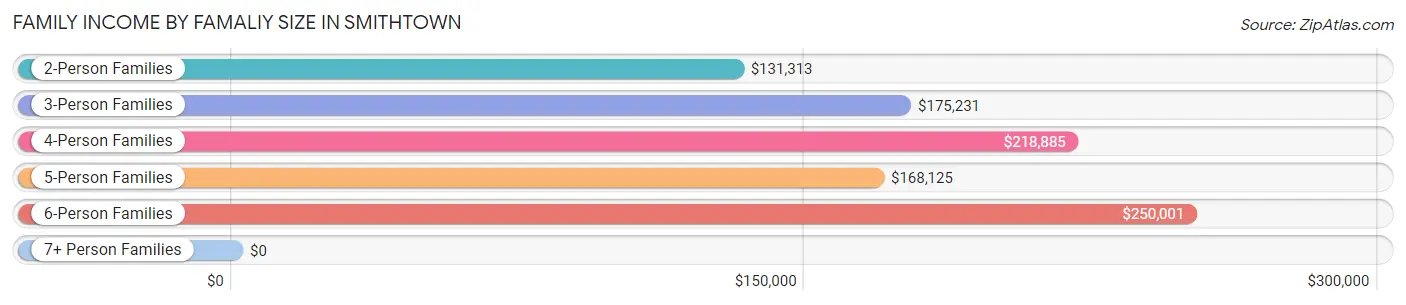
| Income Bracket | # Families | Median Income |
| 2-Person Families | 2,485 (37.4%) | $131,313 |
| 3-Person Families | 1,783 (26.9%) | $175,231 |
| 4-Person Families | 1,579 (23.8%) | $218,885 |
| 5-Person Families | 653 (9.8%) | $168,125 |
| 6-Person Families | 103 (1.5%) | $250,001 |
| 7+ Person Families | 35 (0.5%) | $0 |
| Total | 6,638 (100.0%) | $166,755 |
Family Income by Number of Earners in Smithtown
The median family income in Smithtown is $166,755, with families comprising 3+ earners (1,252) having the highest median family income of $222,596, while families with no earners (851) have the lowest median family income of $91,103, accounting for 18.9% and 12.8% of families, respectively.
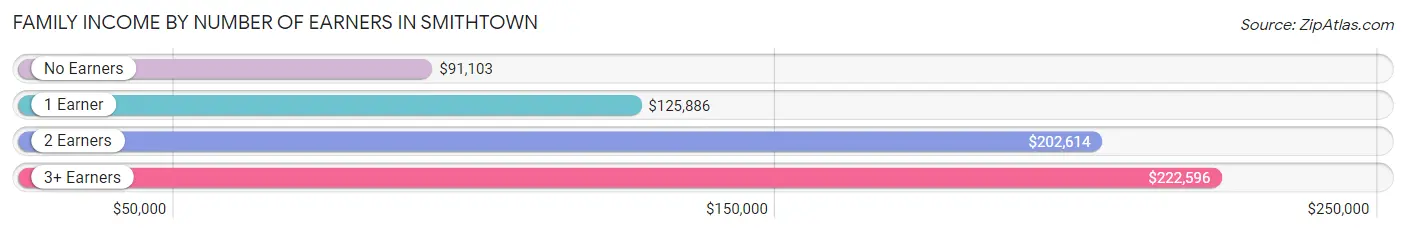
| Number of Earners | # Families | Median Income |
| No Earners | 851 (12.8%) | $91,103 |
| 1 Earner | 1,487 (22.4%) | $125,886 |
| 2 Earners | 3,048 (45.9%) | $202,614 |
| 3+ Earners | 1,252 (18.9%) | $222,596 |
| Total | 6,638 (100.0%) | $166,755 |
Household Income in Smithtown
Household Income Brackets in Smithtown
With 2,888 households falling in the category, the $200,000+ income range is the most frequent in Smithtown, accounting for 34.3% of all households. In contrast, only 168 households (2.0%) fall into the less than $10,000 income bracket, making it the least populous group.
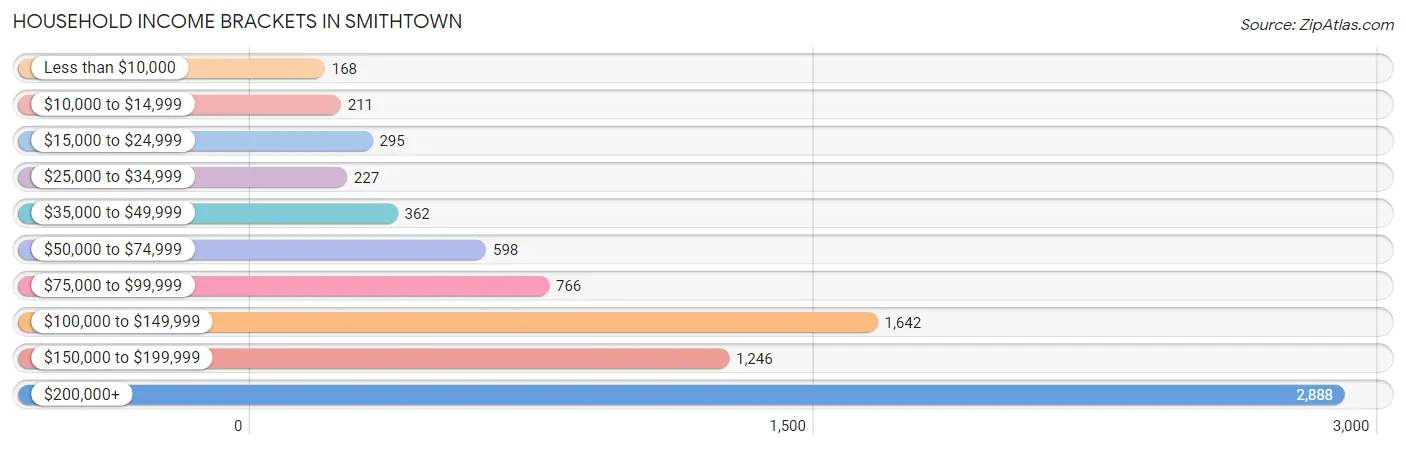
| Income Bracket | # Households | % Households |
| Less than $10,000 | 168 | 2.0% |
| $10,000 to $14,999 | 211 | 2.5% |
| $15,000 to $24,999 | 295 | 3.5% |
| $25,000 to $34,999 | 227 | 2.7% |
| $35,000 to $49,999 | 362 | 4.3% |
| $50,000 to $74,999 | 598 | 7.1% |
| $75,000 to $99,999 | 766 | 9.1% |
| $100,000 to $149,999 | 1,642 | 19.5% |
| $150,000 to $199,999 | 1,246 | 14.8% |
| $200,000+ | 2,888 | 34.3% |
Household Income by Householder Age in Smithtown
The median household income in Smithtown is $146,506, with the highest median household income of $191,850 found in the 45 to 64 years age bracket for the primary householder. A total of 3,960 households (47.0%) fall into this category. Meanwhile, the 15 to 24 years age bracket for the primary householder has the lowest median household income of $0, with 38 households (0.4%) in this group.
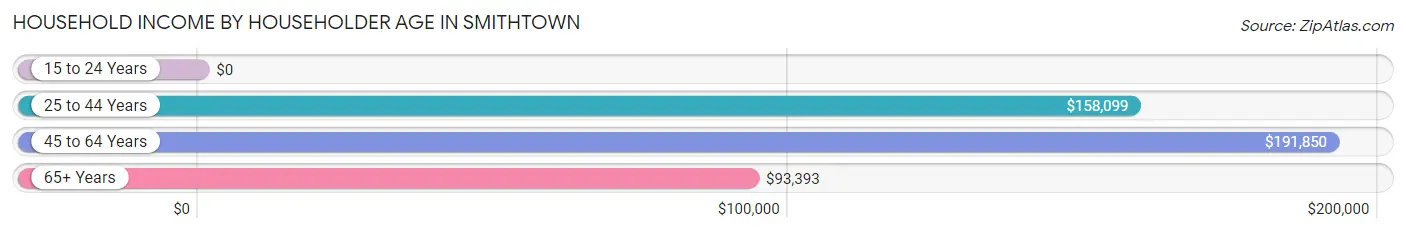
| Income Bracket | # Households | Median Income |
| 15 to 24 Years | 38 (0.4%) | $0 |
| 25 to 44 Years | 1,697 (20.2%) | $158,099 |
| 45 to 64 Years | 3,960 (47.0%) | $191,850 |
| 65+ Years | 2,726 (32.4%) | $93,393 |
| Total | 8,421 (100.0%) | $146,506 |
Poverty in Smithtown
Income Below Poverty by Sex and Age in Smithtown
With 2.9% poverty level for males and 3.5% for females among the residents of Smithtown, 55 to 64 year old males and 15 year old females are the most vulnerable to poverty, with 131 males (6.5%) and 18 females (7.1%) in their respective age groups living below the poverty level.
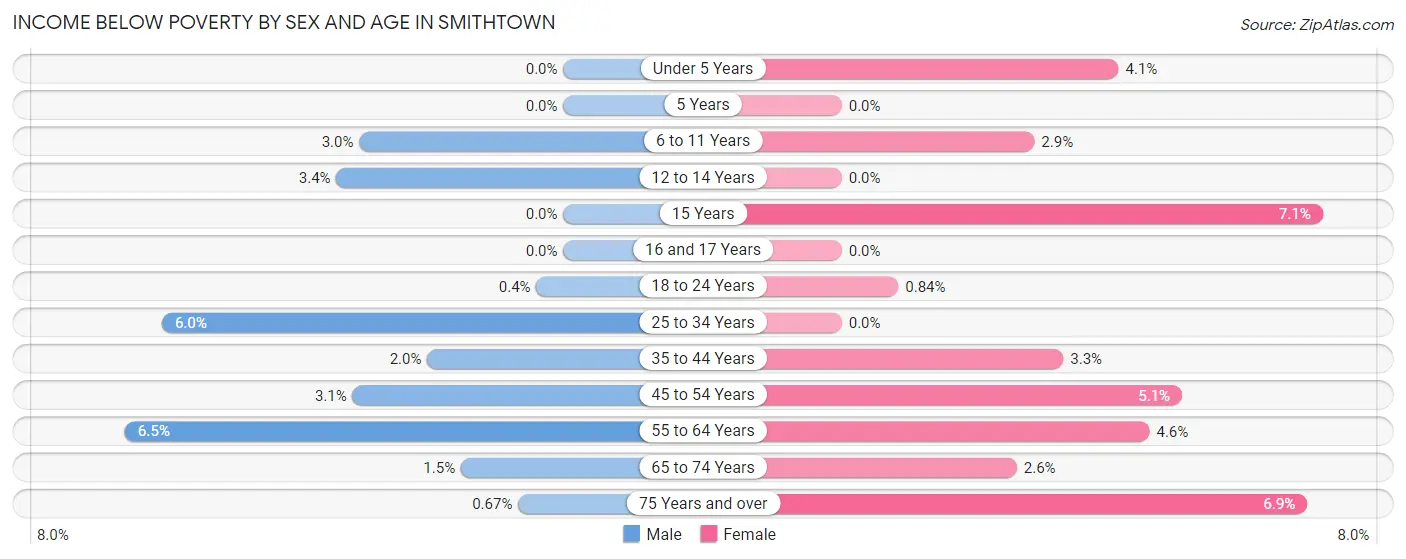
| Age Bracket | Male | Female |
| Under 5 Years | 0 (0.0%) | 26 (4.1%) |
| 5 Years | 0 (0.0%) | 0 (0.0%) |
| 6 to 11 Years | 28 (3.0%) | 18 (2.9%) |
| 12 to 14 Years | 17 (3.4%) | 0 (0.0%) |
| 15 Years | 0 (0.0%) | 18 (7.1%) |
| 16 and 17 Years | 0 (0.0%) | 0 (0.0%) |
| 18 to 24 Years | 4 (0.4%) | 9 (0.8%) |
| 25 to 34 Years | 65 (6.0%) | 0 (0.0%) |
| 35 to 44 Years | 27 (2.0%) | 40 (3.3%) |
| 45 to 54 Years | 67 (3.1%) | 110 (5.1%) |
| 55 to 64 Years | 131 (6.5%) | 98 (4.6%) |
| 65 to 74 Years | 16 (1.5%) | 27 (2.6%) |
| 75 Years and over | 6 (0.7%) | 91 (6.9%) |
| Total | 361 (2.9%) | 437 (3.5%) |
Income Above Poverty by Sex and Age in Smithtown
According to the poverty statistics in Smithtown, males aged under 5 years and females aged 5 years are the age groups that are most secure financially, with 100.0% of males and 100.0% of females in these age groups living above the poverty line.
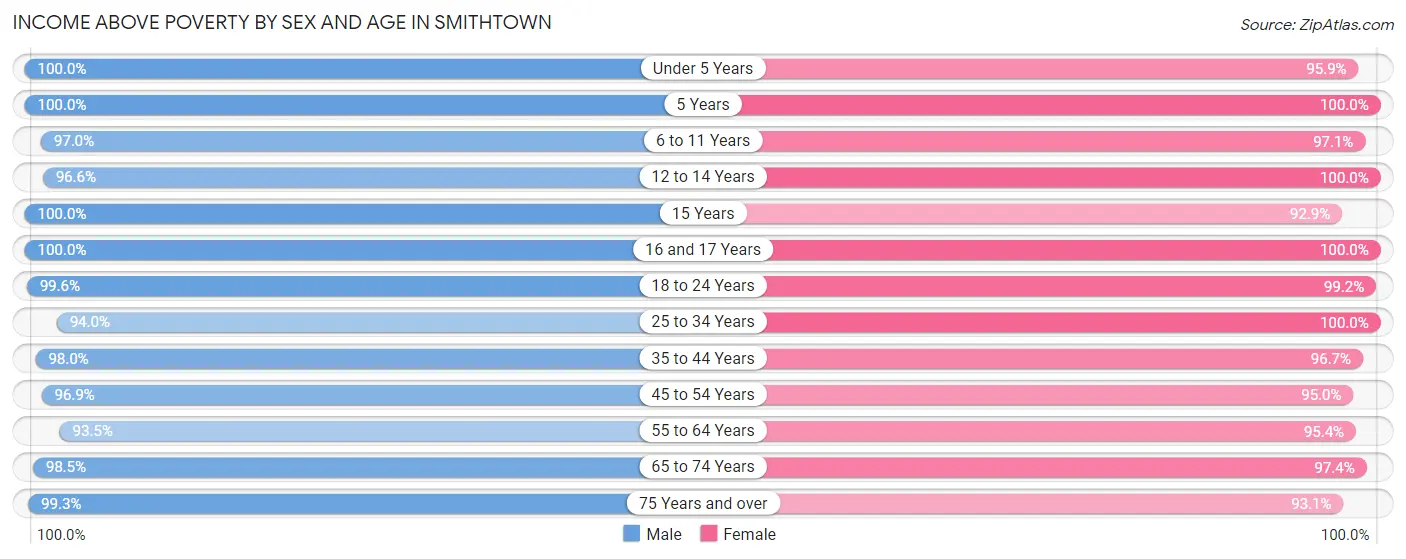
| Age Bracket | Male | Female |
| Under 5 Years | 543 (100.0%) | 607 (95.9%) |
| 5 Years | 201 (100.0%) | 127 (100.0%) |
| 6 to 11 Years | 895 (97.0%) | 612 (97.1%) |
| 12 to 14 Years | 488 (96.6%) | 477 (100.0%) |
| 15 Years | 331 (100.0%) | 234 (92.9%) |
| 16 and 17 Years | 440 (100.0%) | 228 (100.0%) |
| 18 to 24 Years | 996 (99.6%) | 1,060 (99.2%) |
| 25 to 34 Years | 1,026 (94.0%) | 1,193 (100.0%) |
| 35 to 44 Years | 1,309 (98.0%) | 1,176 (96.7%) |
| 45 to 54 Years | 2,072 (96.9%) | 2,069 (95.0%) |
| 55 to 64 Years | 1,880 (93.5%) | 2,047 (95.4%) |
| 65 to 74 Years | 1,037 (98.5%) | 1,010 (97.4%) |
| 75 Years and over | 892 (99.3%) | 1,226 (93.1%) |
| Total | 12,110 (97.1%) | 12,066 (96.5%) |
Income Below Poverty Among Married-Couple Families in Smithtown
The poverty statistics for married-couple families in Smithtown show that 1.7% or 97 of the total 5,749 families live below the poverty line. Families with 3 or 4 children have the highest poverty rate of 2.9%, comprising of 14 families. On the other hand, families with 1 or 2 children have the lowest poverty rate of 0.0%, which includes 0 families.
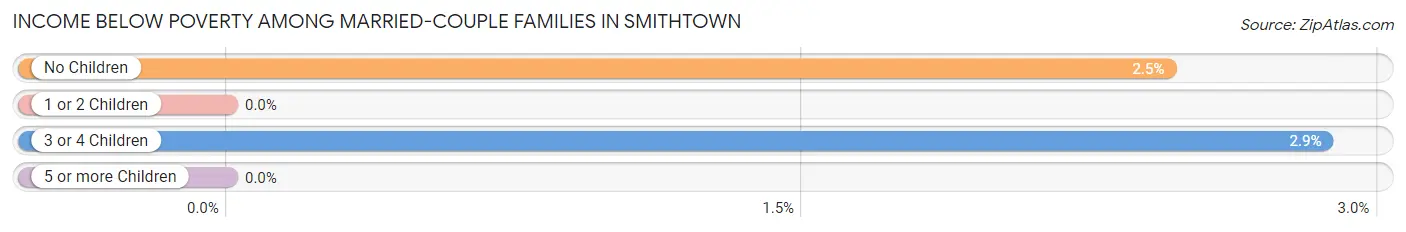
| Children | Above Poverty | Below Poverty |
| No Children | 3,303 (97.6%) | 83 (2.5%) |
| 1 or 2 Children | 1,873 (100.0%) | 0 (0.0%) |
| 3 or 4 Children | 476 (97.1%) | 14 (2.9%) |
| 5 or more Children | 0 (0.0%) | 0 (0.0%) |
| Total | 5,652 (98.3%) | 97 (1.7%) |
Income Below Poverty Among Single-Parent Households in Smithtown
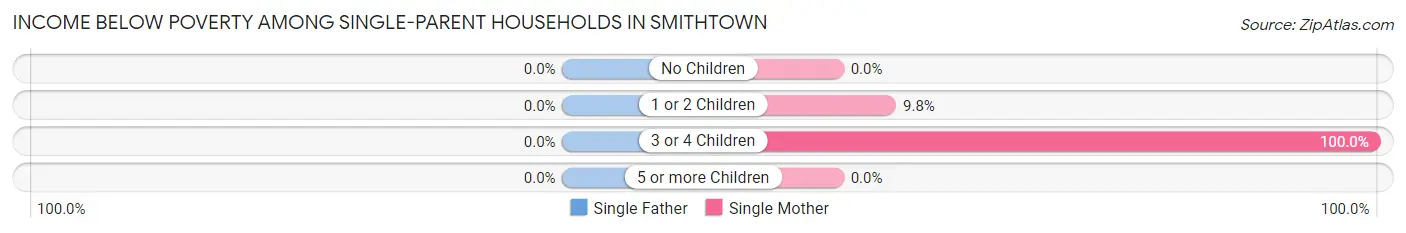
| Children | Single Father | Single Mother |
| No Children | 0 (0.0%) | 0 (0.0%) |
| 1 or 2 Children | 0 (0.0%) | 17 (9.8%) |
| 3 or 4 Children | 0 (0.0%) | 8 (100.0%) |
| 5 or more Children | 0 (0.0%) | 0 (0.0%) |
| Total | 0 (0.0%) | 25 (4.6%) |
Income Below Poverty Among Married-Couple vs Single-Parent Households in Smithtown
The poverty data for Smithtown shows that 97 of the married-couple family households (1.7%) and 25 of the single-parent households (2.8%) are living below the poverty level. Within the married-couple family households, those with 3 or 4 children have the highest poverty rate, with 14 households (2.9%) falling below the poverty line. Among the single-parent households, those with 3 or 4 children have the highest poverty rate, with 8 household (25.8%) living below poverty.
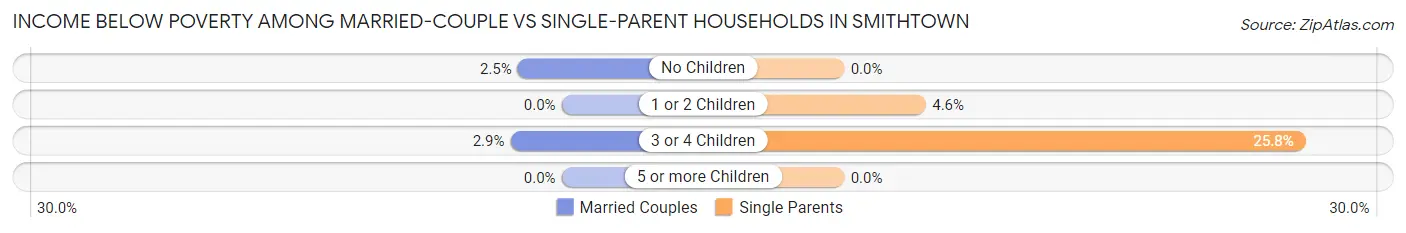
| Children | Married-Couple Families | Single-Parent Households |
| No Children | 83 (2.5%) | 0 (0.0%) |
| 1 or 2 Children | 0 (0.0%) | 17 (4.6%) |
| 3 or 4 Children | 14 (2.9%) | 8 (25.8%) |
| 5 or more Children | 0 (0.0%) | 0 (0.0%) |
| Total | 97 (1.7%) | 25 (2.8%) |
Race in Smithtown
The most populous races in Smithtown are White / Caucasian (22,209 | 86.8%), Hispanic or Latino (2,414 | 9.4%), and Two or more Races (1,555 | 6.1%).
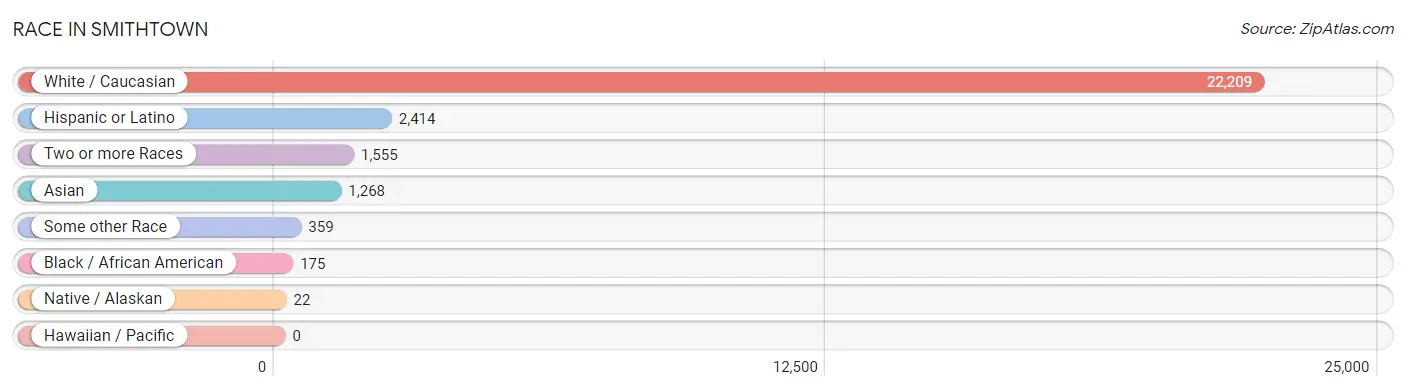
| Race | # Population | % Population |
| Asian | 1,268 | 5.0% |
| Black / African American | 175 | 0.7% |
| Hawaiian / Pacific | 0 | 0.0% |
| Hispanic or Latino | 2,414 | 9.4% |
| Native / Alaskan | 22 | 0.1% |
| White / Caucasian | 22,209 | 86.8% |
| Two or more Races | 1,555 | 6.1% |
| Some other Race | 359 | 1.4% |
| Total | 25,588 | 100.0% |
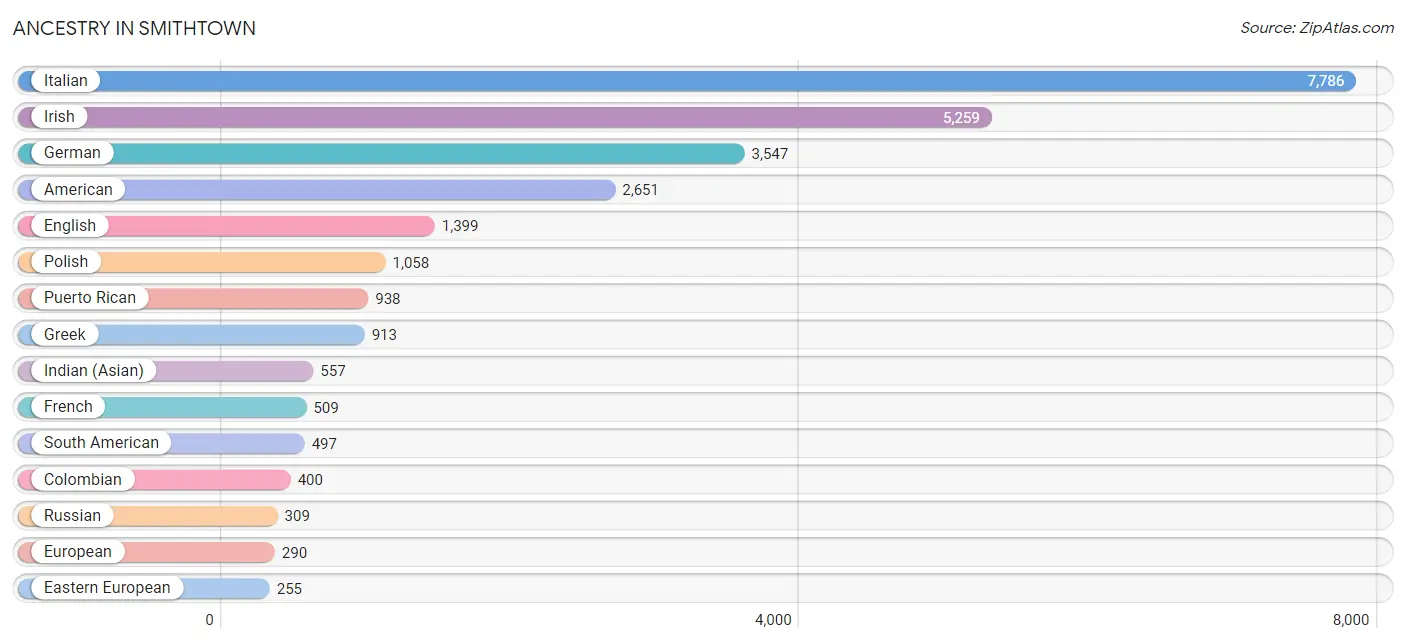
Ancestry in Smithtown
The most populous ancestries reported in Smithtown are Italian (7,786 | 30.4%), Irish (5,259 | 20.5%), German (3,547 | 13.9%), American (2,651 | 10.4%), and English (1,399 | 5.5%), together accounting for 80.7% of all Smithtown residents.
| Ancestry | # Population | % Population |
| Afghan | 1 | 0.0% |
| African | 12 | 0.1% |
| American | 2,651 | 10.4% |
| Arab | 106 | 0.4% |
| Argentinean | 14 | 0.1% |
| Armenian | 14 | 0.1% |
| Austrian | 83 | 0.3% |
| Belgian | 10 | 0.0% |
| Bhutanese | 18 | 0.1% |
| British | 27 | 0.1% |
| Burmese | 152 | 0.6% |
| Canadian | 14 | 0.1% |
| Central American | 212 | 0.8% |
| Central American Indian | 202 | 0.8% |
| Colombian | 400 | 1.6% |
| Cuban | 156 | 0.6% |
| Czech | 167 | 0.6% |
| Czechoslovakian | 9 | 0.0% |
| Danish | 19 | 0.1% |
| Dominican | 99 | 0.4% |
| Dutch | 65 | 0.3% |
| Eastern European | 255 | 1.0% |
| Egyptian | 11 | 0.0% |
| English | 1,399 | 5.5% |
| European | 290 | 1.1% |
| Filipino | 76 | 0.3% |
| Finnish | 19 | 0.1% |
| French | 509 | 2.0% |
| French Canadian | 25 | 0.1% |
| German | 3,547 | 13.9% |
| Greek | 913 | 3.6% |
| Guatemalan | 58 | 0.2% |
| Haitian | 172 | 0.7% |
| Hungarian | 139 | 0.5% |
| Indian (Asian) | 557 | 2.2% |
| Iranian | 10 | 0.0% |
| Irish | 5,259 | 20.5% |
| Iroquois | 72 | 0.3% |
| Italian | 7,786 | 30.4% |
| Jamaican | 13 | 0.1% |
| Korean | 180 | 0.7% |
| Latvian | 22 | 0.1% |
| Lebanese | 89 | 0.4% |
| Lithuanian | 141 | 0.5% |
| Maltese | 116 | 0.4% |
| Mexican | 156 | 0.6% |
| Norwegian | 254 | 1.0% |
| Pakistani | 111 | 0.4% |
| Palestinian | 6 | 0.0% |
| Peruvian | 66 | 0.3% |
| Polish | 1,058 | 4.1% |
| Portuguese | 107 | 0.4% |
| Puerto Rican | 938 | 3.7% |
| Russian | 309 | 1.2% |
| Salvadoran | 154 | 0.6% |
| Scandinavian | 30 | 0.1% |
| Scotch-Irish | 11 | 0.0% |
| Scottish | 152 | 0.6% |
| Serbian | 40 | 0.2% |
| Slovak | 5 | 0.0% |
| Slovene | 37 | 0.1% |
| South American | 497 | 1.9% |
| Spaniard | 163 | 0.6% |
| Spanish | 83 | 0.3% |
| Subsaharan African | 12 | 0.1% |
| Swedish | 118 | 0.5% |
| Swiss | 67 | 0.3% |
| Thai | 230 | 0.9% |
| Trinidadian and Tobagonian | 4 | 0.0% |
| Turkish | 5 | 0.0% |
| Ukrainian | 96 | 0.4% |
| Venezuelan | 17 | 0.1% |
| Welsh | 125 | 0.5% |
| West Indian | 8 | 0.0% |
| Yugoslavian | 46 | 0.2% | View All 75 Rows |
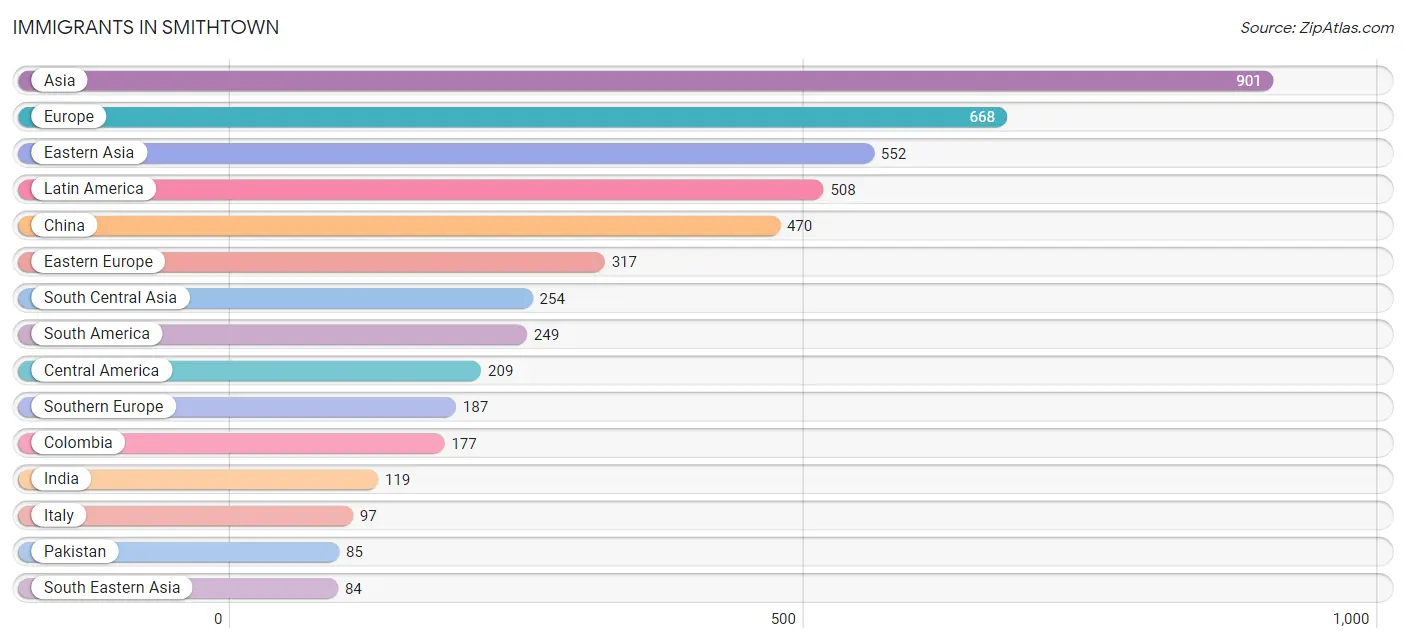
Immigrants in Smithtown
The most numerous immigrant groups reported in Smithtown came from Asia (901 | 3.5%), Europe (668 | 2.6%), Eastern Asia (552 | 2.2%), Latin America (508 | 2.0%), and China (470 | 1.8%), together accounting for 12.1% of all Smithtown residents.
| Immigration Origin | # Population | % Population |
| Afghanistan | 1 | 0.0% |
| Africa | 41 | 0.2% |
| Argentina | 14 | 0.1% |
| Asia | 901 | 3.5% |
| Bangladesh | 29 | 0.1% |
| Belarus | 48 | 0.2% |
| Belize | 2 | 0.0% |
| Bosnia and Herzegovina | 40 | 0.2% |
| Caribbean | 50 | 0.2% |
| Central America | 209 | 0.8% |
| China | 470 | 1.8% |
| Colombia | 177 | 0.7% |
| Cuba | 14 | 0.1% |
| Dominican Republic | 5 | 0.0% |
| Eastern Asia | 552 | 2.2% |
| Eastern Europe | 317 | 1.2% |
| Egypt | 18 | 0.1% |
| El Salvador | 70 | 0.3% |
| England | 4 | 0.0% |
| Europe | 668 | 2.6% |
| France | 6 | 0.0% |
| Germany | 44 | 0.2% |
| Greece | 14 | 0.1% |
| Guatemala | 58 | 0.2% |
| Guyana | 11 | 0.0% |
| Haiti | 23 | 0.1% |
| Hungary | 27 | 0.1% |
| India | 119 | 0.5% |
| Indonesia | 10 | 0.0% |
| Iran | 20 | 0.1% |
| Ireland | 44 | 0.2% |
| Italy | 97 | 0.4% |
| Korea | 82 | 0.3% |
| Latin America | 508 | 2.0% |
| Latvia | 6 | 0.0% |
| Lithuania | 16 | 0.1% |
| Mexico | 79 | 0.3% |
| Middle Africa | 7 | 0.0% |
| Northern Africa | 18 | 0.1% |
| Northern Europe | 75 | 0.3% |
| Pakistan | 85 | 0.3% |
| Peru | 30 | 0.1% |
| Philippines | 35 | 0.1% |
| Poland | 56 | 0.2% |
| Portugal | 39 | 0.2% |
| Russia | 13 | 0.1% |
| South Africa | 6 | 0.0% |
| South America | 249 | 1.0% |
| South Central Asia | 254 | 1.0% |
| South Eastern Asia | 84 | 0.3% |
| Southern Europe | 187 | 0.7% |
| Taiwan | 58 | 0.2% |
| Thailand | 39 | 0.2% |
| Trinidad and Tobago | 4 | 0.0% |
| Turkey | 11 | 0.0% |
| Ukraine | 71 | 0.3% |
| Venezuela | 17 | 0.1% |
| West Indies | 4 | 0.0% |
| Western Asia | 11 | 0.0% |
| Western Europe | 50 | 0.2% | View All 60 Rows |
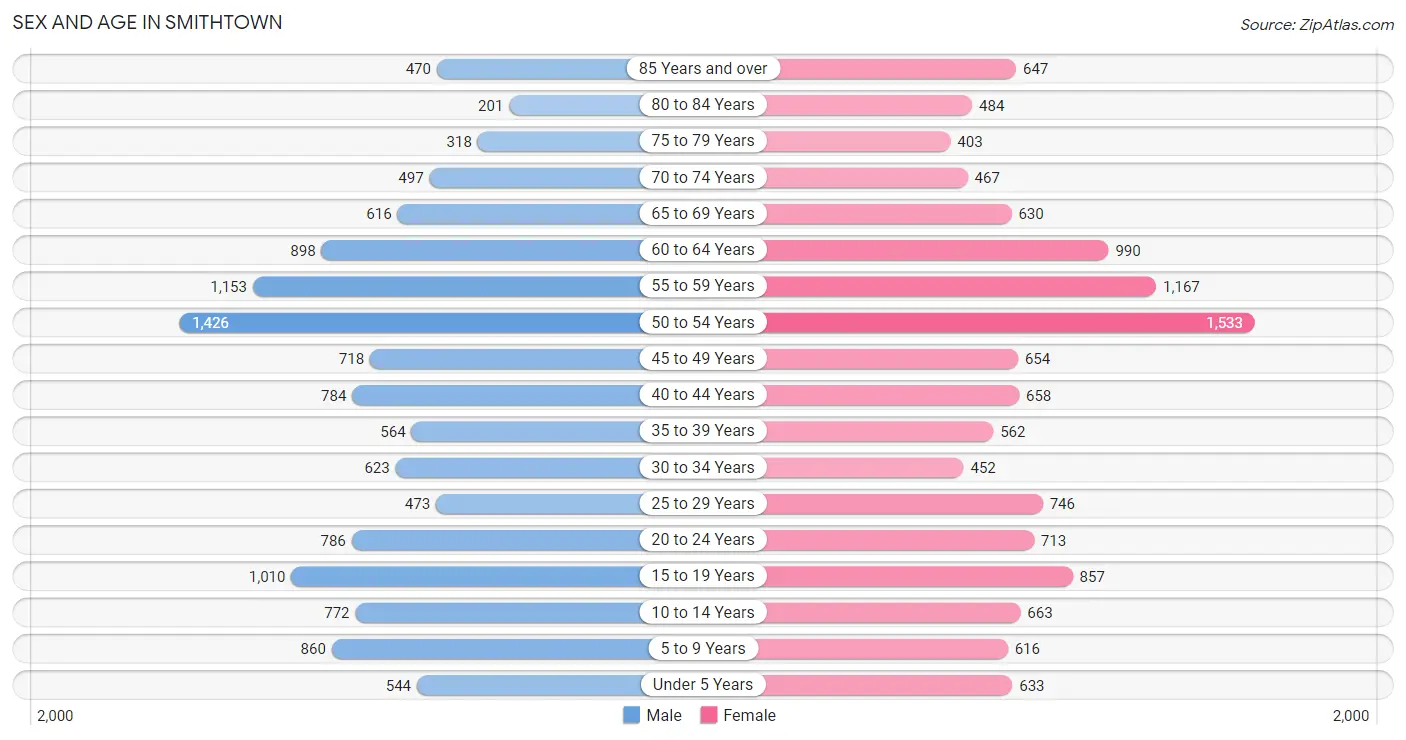
Sex and Age in Smithtown
Sex and Age in Smithtown
The most populous age groups in Smithtown are 50 to 54 Years (1,426 | 11.2%) for men and 50 to 54 Years (1,533 | 11.9%) for women.
| Age Bracket | Male | Female |
| Under 5 Years | 544 (4.3%) | 633 (4.9%) |
| 5 to 9 Years | 860 (6.8%) | 616 (4.8%) |
| 10 to 14 Years | 772 (6.1%) | 663 (5.1%) |
| 15 to 19 Years | 1,010 (7.9%) | 857 (6.7%) |
| 20 to 24 Years | 786 (6.2%) | 713 (5.5%) |
| 25 to 29 Years | 473 (3.7%) | 746 (5.8%) |
| 30 to 34 Years | 623 (4.9%) | 452 (3.5%) |
| 35 to 39 Years | 564 (4.4%) | 562 (4.4%) |
| 40 to 44 Years | 784 (6.2%) | 658 (5.1%) |
| 45 to 49 Years | 718 (5.7%) | 654 (5.1%) |
| 50 to 54 Years | 1,426 (11.2%) | 1,533 (11.9%) |
| 55 to 59 Years | 1,153 (9.1%) | 1,167 (9.1%) |
| 60 to 64 Years | 898 (7.1%) | 990 (7.7%) |
| 65 to 69 Years | 616 (4.9%) | 630 (4.9%) |
| 70 to 74 Years | 497 (3.9%) | 467 (3.6%) |
| 75 to 79 Years | 318 (2.5%) | 403 (3.1%) |
| 80 to 84 Years | 201 (1.6%) | 484 (3.8%) |
| 85 Years and over | 470 (3.7%) | 647 (5.0%) |
| Total | 12,713 (100.0%) | 12,875 (100.0%) |
Families and Households in Smithtown
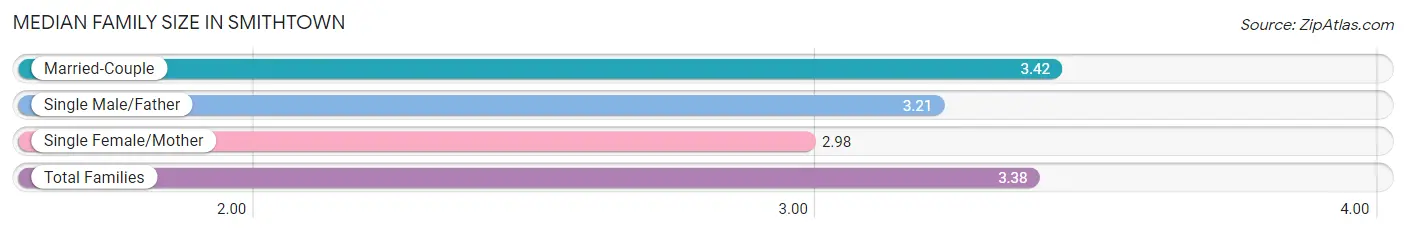
Median Family Size in Smithtown
The median family size in Smithtown is 3.38 persons per family, with married-couple families (5,749 | 86.6%) accounting for the largest median family size of 3.42 persons per family. On the other hand, single female/mother families (542 | 8.2%) represent the smallest median family size with 2.98 persons per family.
| Family Type | # Families | Family Size |
| Married-Couple | 5,749 (86.6%) | 3.42 |
| Single Male/Father | 347 (5.2%) | 3.21 |
| Single Female/Mother | 542 (8.2%) | 2.98 |
| Total Families | 6,638 (100.0%) | 3.38 |
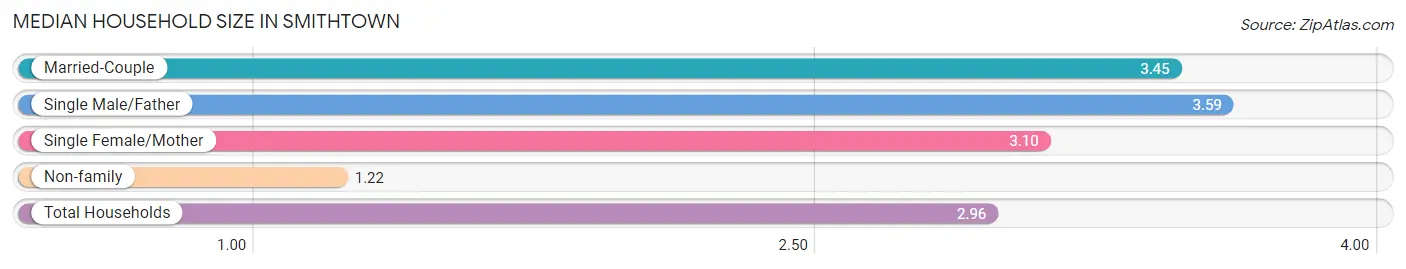
Median Household Size in Smithtown
The median household size in Smithtown is 2.96 persons per household, with single male/father households (347 | 4.1%) accounting for the largest median household size of 3.59 persons per household. non-family households (1,783 | 21.2%) represent the smallest median household size with 1.22 persons per household.
| Household Type | # Households | Household Size |
| Married-Couple | 5,749 (68.3%) | 3.45 |
| Single Male/Father | 347 (4.1%) | 3.59 |
| Single Female/Mother | 542 (6.4%) | 3.10 |
| Non-family | 1,783 (21.2%) | 1.22 |
| Total Households | 8,421 (100.0%) | 2.96 |
Household Size by Marriage Status in Smithtown
Out of a total of 8,421 households in Smithtown, 6,638 (78.8%) are family households, while 1,783 (21.2%) are nonfamily households. The most numerous type of family households are 2-person households, comprising 2,386, and the most common type of nonfamily households are 1-person households, comprising 1,482.
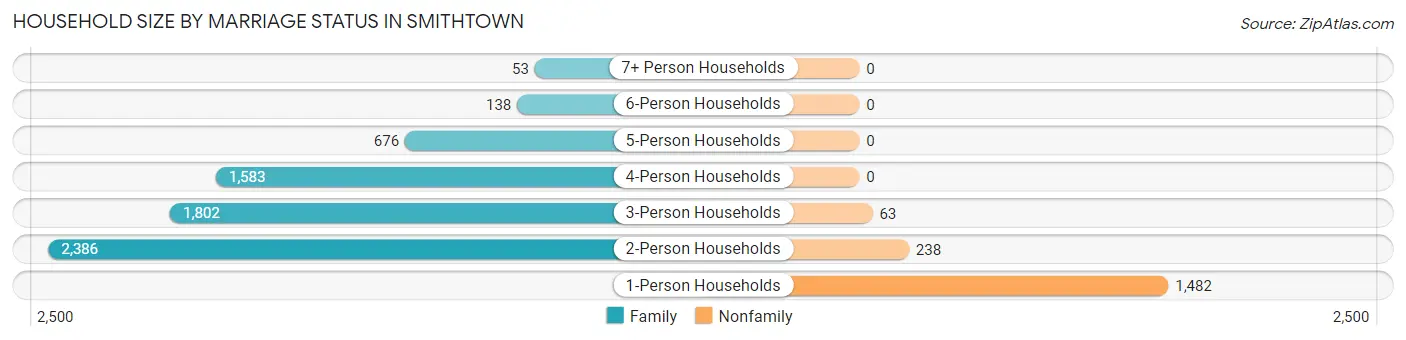
| Household Size | Family Households | Nonfamily Households |
| 1-Person Households | - | 1,482 (17.6%) |
| 2-Person Households | 2,386 (28.3%) | 238 (2.8%) |
| 3-Person Households | 1,802 (21.4%) | 63 (0.7%) |
| 4-Person Households | 1,583 (18.8%) | 0 (0.0%) |
| 5-Person Households | 676 (8.0%) | 0 (0.0%) |
| 6-Person Households | 138 (1.6%) | 0 (0.0%) |
| 7+ Person Households | 53 (0.6%) | 0 (0.0%) |
| Total | 6,638 (78.8%) | 1,783 (21.2%) |
Female Fertility in Smithtown
Fertility by Age in Smithtown
Average fertility rate in Smithtown is 32.0 births per 1,000 women. Women in the age bracket of 20 to 34 years have the highest fertility rate with 55.0 births per 1,000 women. Women in the age bracket of 20 to 34 years acount for 65.2% of all women with births.
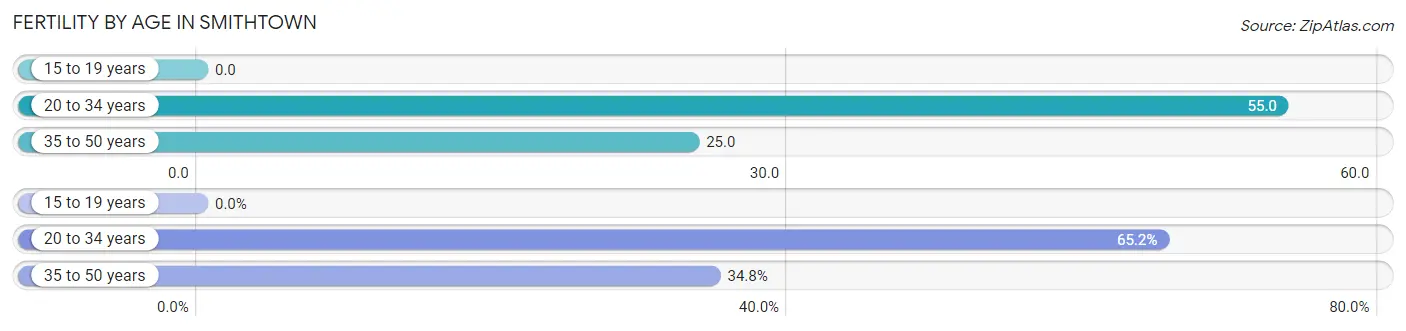
| Age Bracket | Women with Births | Births / 1,000 Women |
| 15 to 19 years | 0 (0.0%) | 0.0 |
| 20 to 34 years | 105 (65.2%) | 55.0 |
| 35 to 50 years | 56 (34.8%) | 25.0 |
| Total | 161 (100.0%) | 32.0 |
Fertility by Age by Marriage Status in Smithtown
90.1% of women with births (161) in Smithtown are married. The highest percentage of unmarried women with births falls into 20 to 34 years age bracket with 15.2% of them unmarried at the time of birth, while the lowest percentage of unmarried women with births belong to 35 to 50 years age bracket with 0.0% of them unmarried.
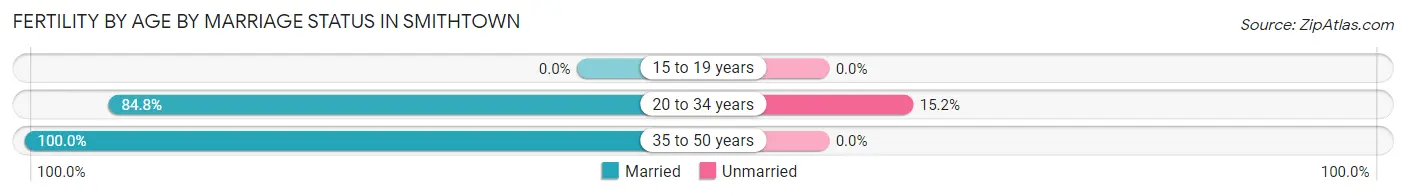
| Age Bracket | Married | Unmarried |
| 15 to 19 years | 0 (0.0%) | 0 (0.0%) |
| 20 to 34 years | 89 (84.8%) | 16 (15.2%) |
| 35 to 50 years | 56 (100.0%) | 0 (0.0%) |
| Total | 145 (90.1%) | 16 (9.9%) |
Fertility by Education in Smithtown
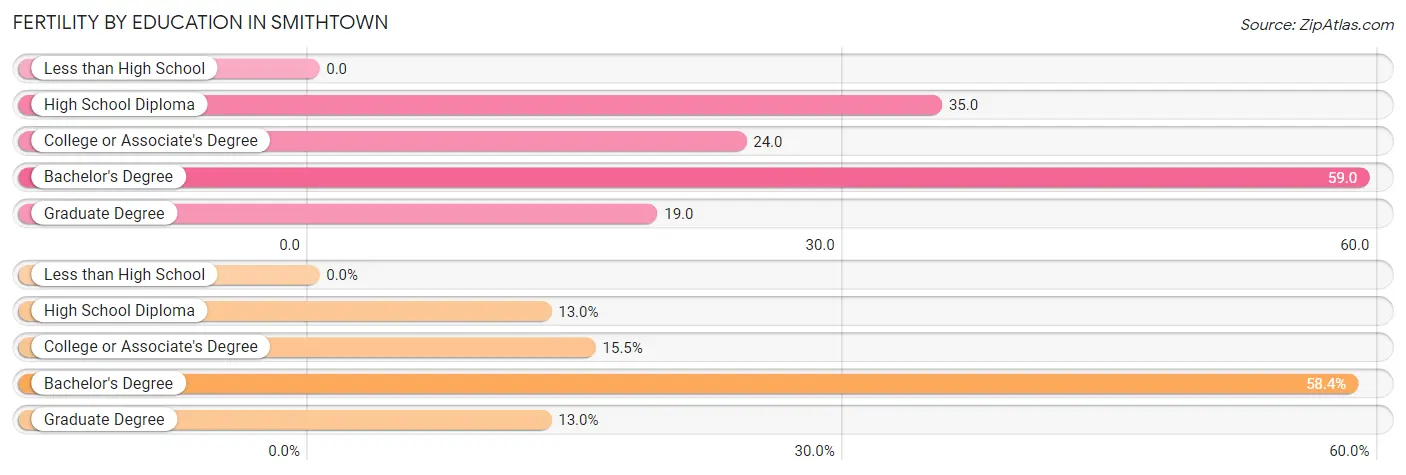
| Educational Attainment | Women with Births | Births / 1,000 Women |
| Less than High School | 0 (0.0%) | 0.0 |
| High School Diploma | 21 (13.0%) | 35.0 |
| College or Associate's Degree | 25 (15.5%) | 24.0 |
| Bachelor's Degree | 94 (58.4%) | 59.0 |
| Graduate Degree | 21 (13.0%) | 19.0 |
| Total | 161 (100.0%) | 32.0 |
Fertility by Education by Marriage Status in Smithtown
9.9% of women with births in Smithtown are unmarried. Women with the educational attainment of high school diploma are most likely to be married with 100.0% of them married at childbirth, while women with the educational attainment of bachelor's degree are least likely to be married with 17.0% of them unmarried at childbirth.
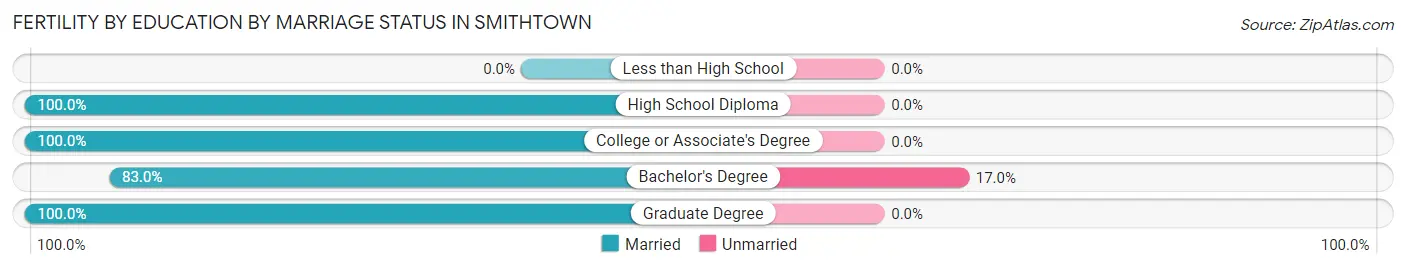
| Educational Attainment | Married | Unmarried |
| Less than High School | 0 (0.0%) | 0 (0.0%) |
| High School Diploma | 21 (100.0%) | 0 (0.0%) |
| College or Associate's Degree | 25 (100.0%) | 0 (0.0%) |
| Bachelor's Degree | 78 (83.0%) | 16 (17.0%) |
| Graduate Degree | 21 (100.0%) | 0 (0.0%) |
| Total | 145 (90.1%) | 16 (9.9%) |
Employment Characteristics in Smithtown
Employment by Class of Employer in Smithtown
Among the 12,909 employed individuals in Smithtown, private company employees (7,706 | 59.7%), local government employees (1,801 | 14.0%), and not-for-profit organizations (931 | 7.2%) make up the most common classes of employment.
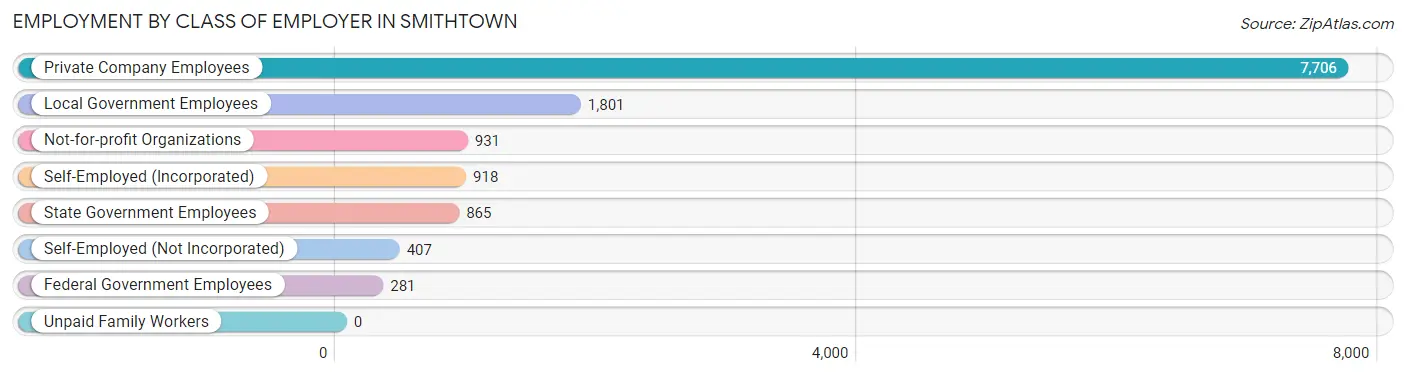
| Employer Class | # Employees | % Employees |
| Private Company Employees | 7,706 | 59.7% |
| Self-Employed (Incorporated) | 918 | 7.1% |
| Self-Employed (Not Incorporated) | 407 | 3.2% |
| Not-for-profit Organizations | 931 | 7.2% |
| Local Government Employees | 1,801 | 14.0% |
| State Government Employees | 865 | 6.7% |
| Federal Government Employees | 281 | 2.2% |
| Unpaid Family Workers | 0 | 0.0% |
| Total | 12,909 | 100.0% |
Employment Status by Age in Smithtown
According to the labor force statistics for Smithtown, out of the total population over 16 years of age (20,900), 64.6% or 13,501 individuals are in the labor force, with 3.6% or 486 of them unemployed. The age group with the highest labor force participation rate is 35 to 44 years, with 85.9% or 2,206 individuals in the labor force. Within the labor force, the 16 to 19 years age range has the highest percentage of unemployed individuals, with 12.0% or 64 of them being unemployed.
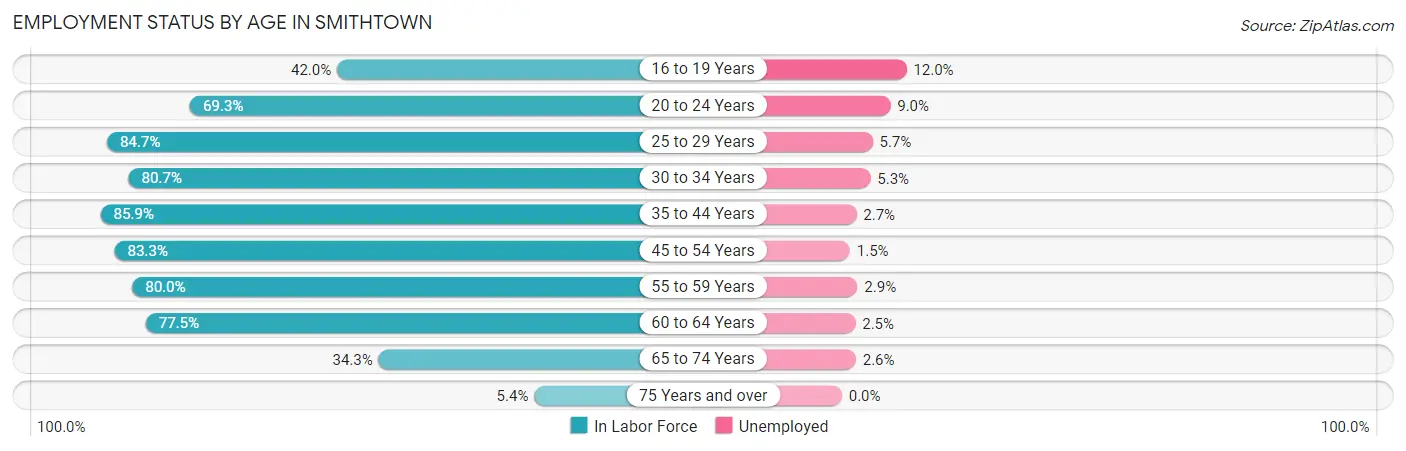
| Age Bracket | In Labor Force | Unemployed |
| 16 to 19 Years | 532 (42.0%) | 64 (12.0%) |
| 20 to 24 Years | 1,039 (69.3%) | 94 (9.0%) |
| 25 to 29 Years | 1,032 (84.7%) | 59 (5.7%) |
| 30 to 34 Years | 868 (80.7%) | 46 (5.3%) |
| 35 to 44 Years | 2,206 (85.9%) | 60 (2.7%) |
| 45 to 54 Years | 3,608 (83.3%) | 54 (1.5%) |
| 55 to 59 Years | 1,856 (80.0%) | 54 (2.9%) |
| 60 to 64 Years | 1,463 (77.5%) | 37 (2.5%) |
| 65 to 74 Years | 758 (34.3%) | 20 (2.6%) |
| 75 Years and over | 136 (5.4%) | 0 (0.0%) |
| Total | 13,501 (64.6%) | 486 (3.6%) |
Employment Status by Educational Attainment in Smithtown
According to labor force statistics for Smithtown, 82.3% of individuals (11,029) out of the total population between 25 and 64 years of age (13,401) are in the labor force, with 2.8% or 309 of them being unemployed. The group with the highest labor force participation rate are those with the educational attainment of bachelor's degree or higher, with 89.0% or 6,820 individuals in the labor force. Within the labor force, individuals with less than high school education have the highest percentage of unemployment, with 12.9% or 12 of them being unemployed.
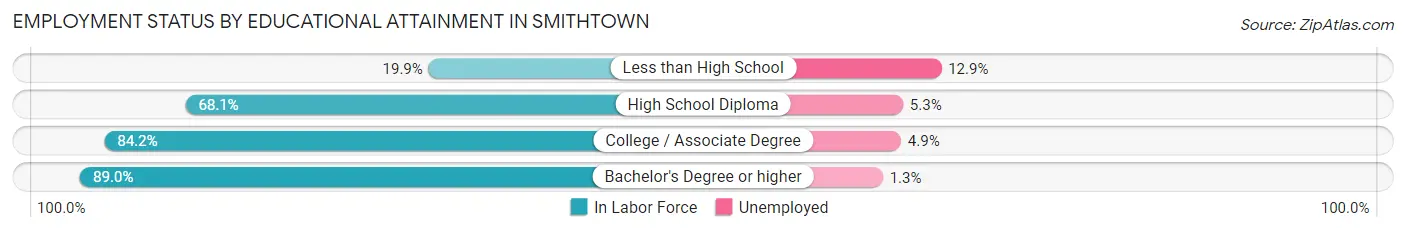
| Educational Attainment | In Labor Force | Unemployed |
| Less than High School | 93 (19.9%) | 60 (12.9%) |
| High School Diploma | 1,350 (68.1%) | 105 (5.3%) |
| College / Associate Degree | 2,768 (84.2%) | 161 (4.9%) |
| Bachelor's Degree or higher | 6,820 (89.0%) | 100 (1.3%) |
| Total | 11,029 (82.3%) | 375 (2.8%) |
Employment Occupations by Sex in Smithtown
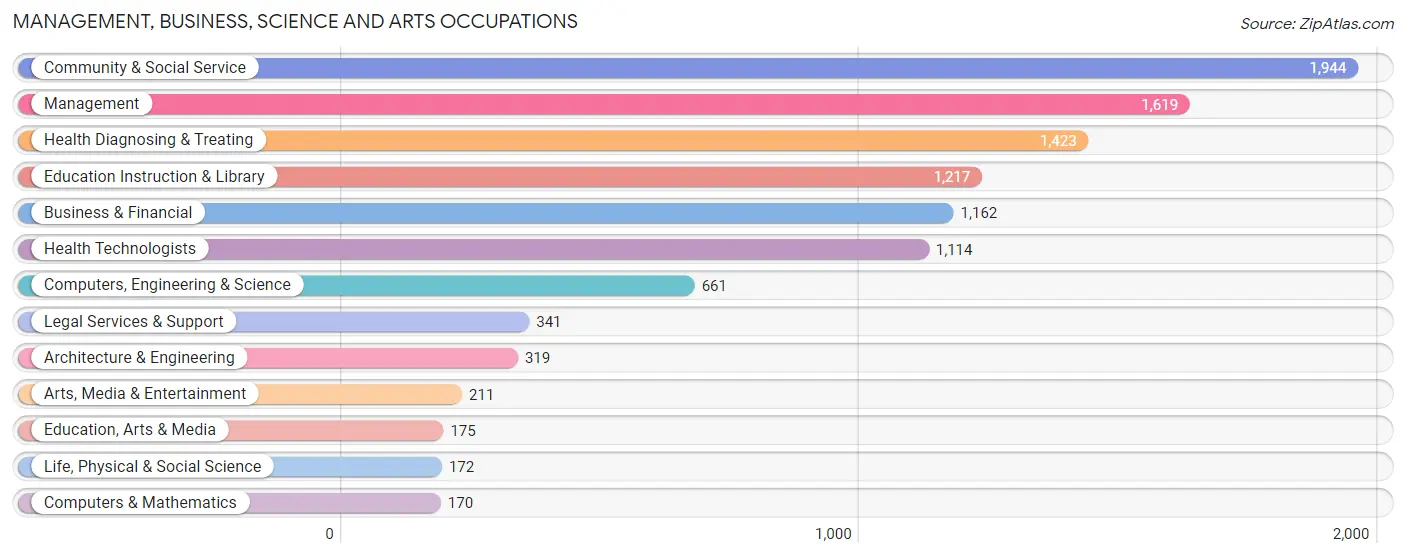
Management, Business, Science and Arts Occupations
The most common Management, Business, Science and Arts occupations in Smithtown are Community & Social Service (1,944 | 14.9%), Management (1,619 | 12.4%), Health Diagnosing & Treating (1,423 | 10.9%), Education Instruction & Library (1,217 | 9.3%), and Business & Financial (1,162 | 8.9%).
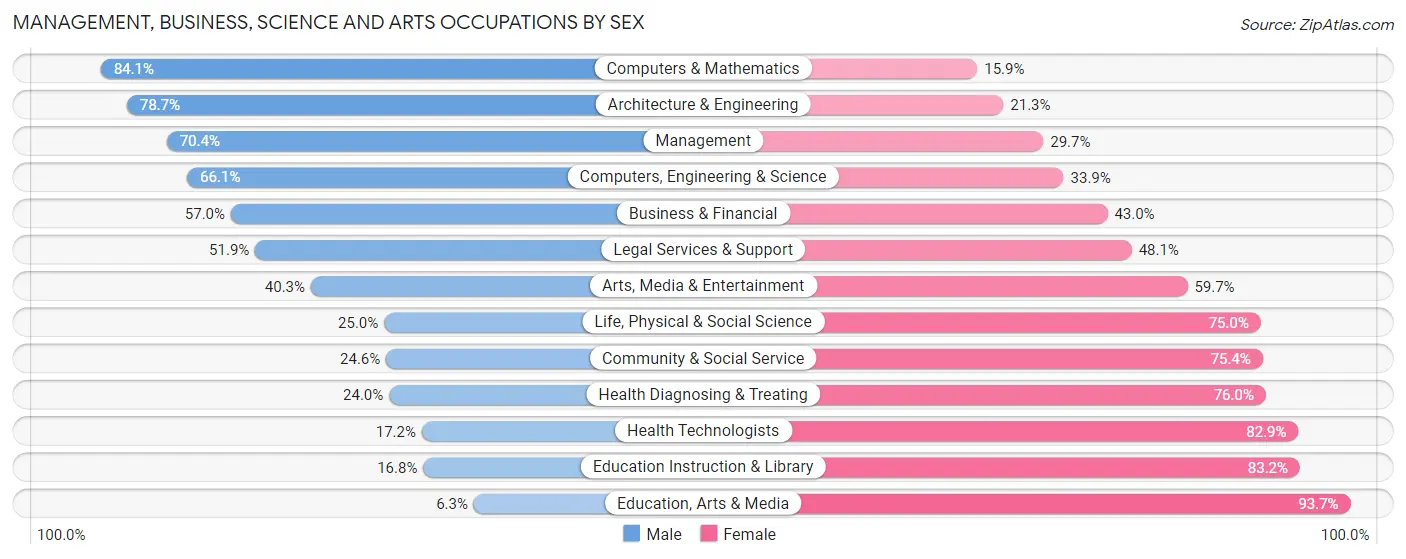
Management, Business, Science and Arts Occupations by Sex
Within the Management, Business, Science and Arts occupations in Smithtown, the most male-oriented occupations are Computers & Mathematics (84.1%), Architecture & Engineering (78.7%), and Management (70.4%), while the most female-oriented occupations are Education, Arts & Media (93.7%), Education Instruction & Library (83.2%), and Health Technologists (82.9%).
| Occupation | Male | Female |
| Management | 1,139 (70.4%) | 480 (29.6%) |
| Business & Financial | 662 (57.0%) | 500 (43.0%) |
| Computers, Engineering & Science | 437 (66.1%) | 224 (33.9%) |
| Computers & Mathematics | 143 (84.1%) | 27 (15.9%) |
| Architecture & Engineering | 251 (78.7%) | 68 (21.3%) |
| Life, Physical & Social Science | 43 (25.0%) | 129 (75.0%) |
| Community & Social Service | 478 (24.6%) | 1,466 (75.4%) |
| Education, Arts & Media | 11 (6.3%) | 164 (93.7%) |
| Legal Services & Support | 177 (51.9%) | 164 (48.1%) |
| Education Instruction & Library | 205 (16.8%) | 1,012 (83.2%) |
| Arts, Media & Entertainment | 85 (40.3%) | 126 (59.7%) |
| Health Diagnosing & Treating | 341 (24.0%) | 1,082 (76.0%) |
| Health Technologists | 191 (17.2%) | 923 (82.9%) |
| Total (Category) | 3,057 (44.9%) | 3,752 (55.1%) |
| Total (Overall) | 6,749 (51.9%) | 6,261 (48.1%) |
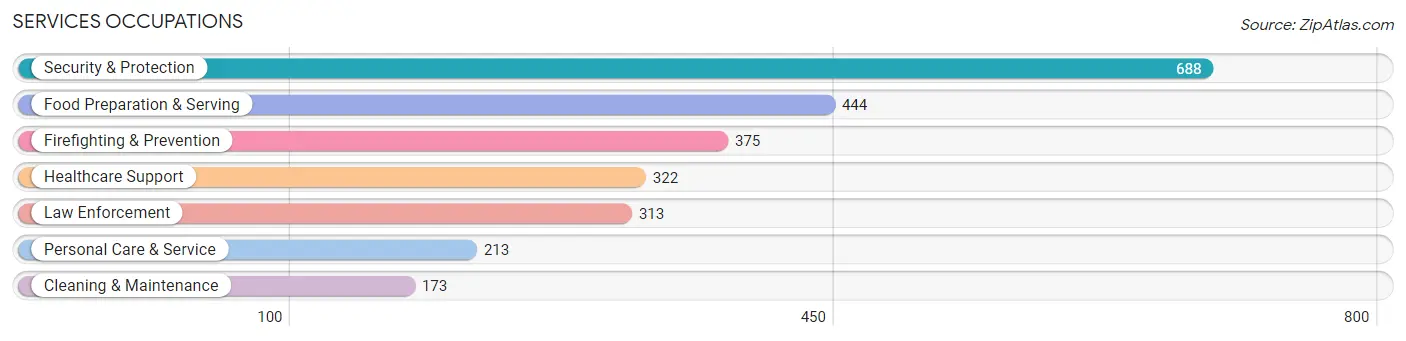
Services Occupations
The most common Services occupations in Smithtown are Security & Protection (688 | 5.3%), Food Preparation & Serving (444 | 3.4%), Firefighting & Prevention (375 | 2.9%), Healthcare Support (322 | 2.5%), and Law Enforcement (313 | 2.4%).
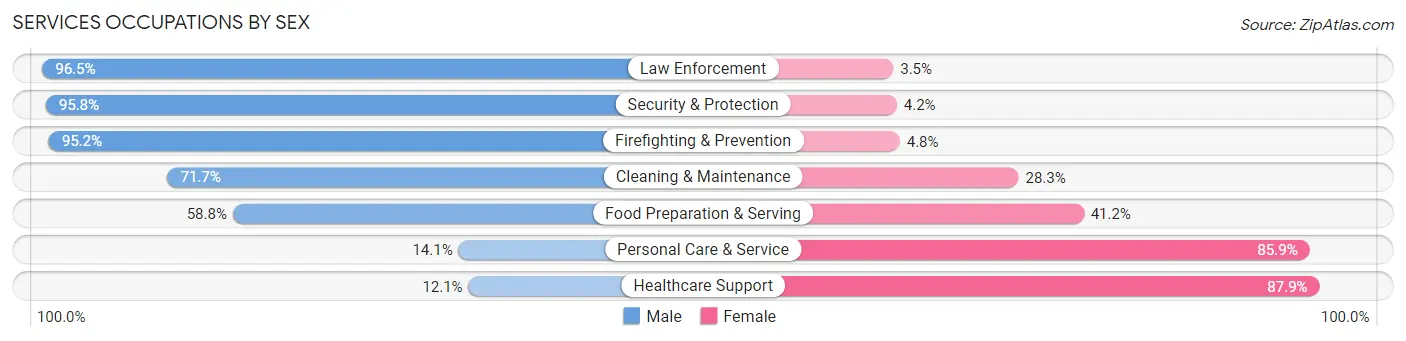
Services Occupations by Sex
Within the Services occupations in Smithtown, the most male-oriented occupations are Law Enforcement (96.5%), Security & Protection (95.8%), and Firefighting & Prevention (95.2%), while the most female-oriented occupations are Healthcare Support (87.9%), Personal Care & Service (85.9%), and Food Preparation & Serving (41.2%).
| Occupation | Male | Female |
| Healthcare Support | 39 (12.1%) | 283 (87.9%) |
| Security & Protection | 659 (95.8%) | 29 (4.2%) |
| Firefighting & Prevention | 357 (95.2%) | 18 (4.8%) |
| Law Enforcement | 302 (96.5%) | 11 (3.5%) |
| Food Preparation & Serving | 261 (58.8%) | 183 (41.2%) |
| Cleaning & Maintenance | 124 (71.7%) | 49 (28.3%) |
| Personal Care & Service | 30 (14.1%) | 183 (85.9%) |
| Total (Category) | 1,113 (60.5%) | 727 (39.5%) |
| Total (Overall) | 6,749 (51.9%) | 6,261 (48.1%) |
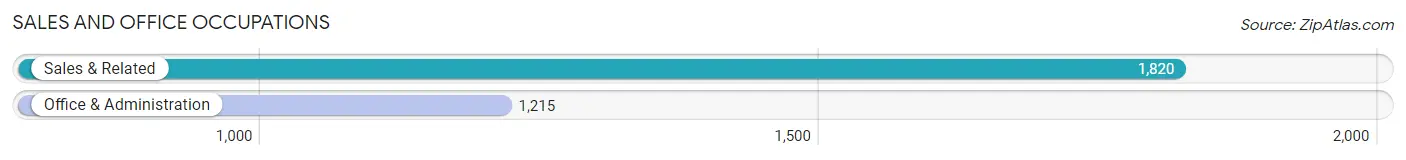
Sales and Office Occupations
The most common Sales and Office occupations in Smithtown are Sales & Related (1,820 | 14.0%), and Office & Administration (1,215 | 9.3%).
Sales and Office Occupations by Sex
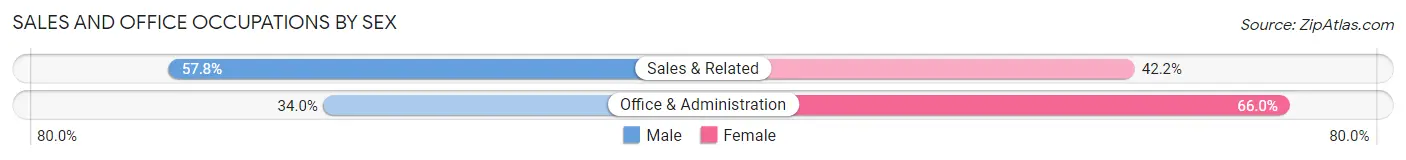
| Occupation | Male | Female |
| Sales & Related | 1,052 (57.8%) | 768 (42.2%) |
| Office & Administration | 413 (34.0%) | 802 (66.0%) |
| Total (Category) | 1,465 (48.3%) | 1,570 (51.7%) |
| Total (Overall) | 6,749 (51.9%) | 6,261 (48.1%) |
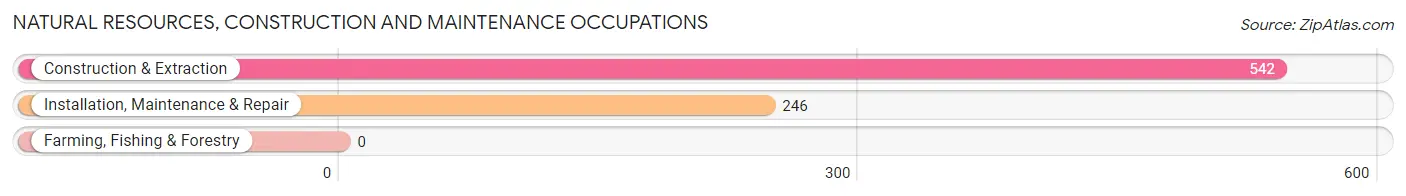
Natural Resources, Construction and Maintenance Occupations
The most common Natural Resources, Construction and Maintenance occupations in Smithtown are Construction & Extraction (542 | 4.2%), and Installation, Maintenance & Repair (246 | 1.9%).
Natural Resources, Construction and Maintenance Occupations by Sex
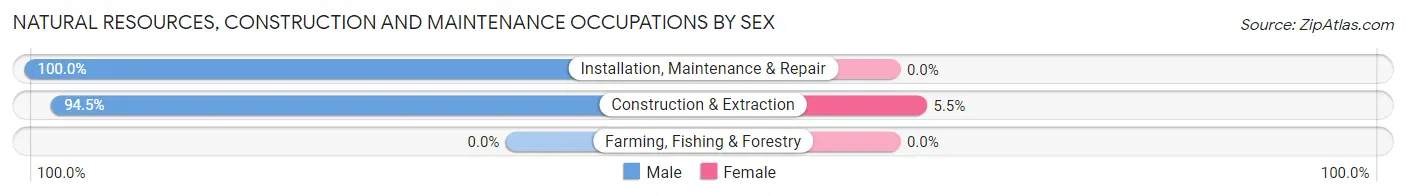
| Occupation | Male | Female |
| Farming, Fishing & Forestry | 0 (0.0%) | 0 (0.0%) |
| Construction & Extraction | 512 (94.5%) | 30 (5.5%) |
| Installation, Maintenance & Repair | 246 (100.0%) | 0 (0.0%) |
| Total (Category) | 758 (96.2%) | 30 (3.8%) |
| Total (Overall) | 6,749 (51.9%) | 6,261 (48.1%) |
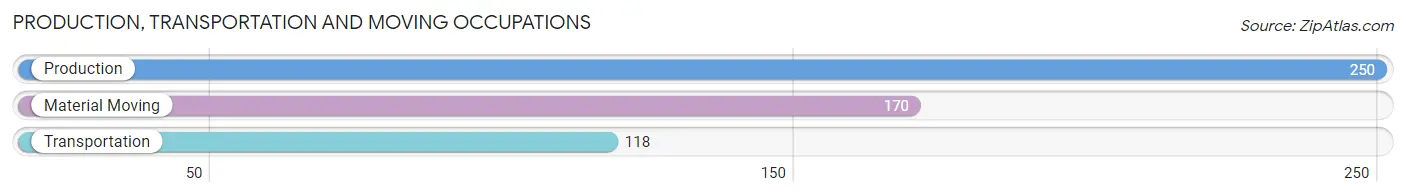
Production, Transportation and Moving Occupations
The most common Production, Transportation and Moving occupations in Smithtown are Production (250 | 1.9%), Material Moving (170 | 1.3%), and Transportation (118 | 0.9%).
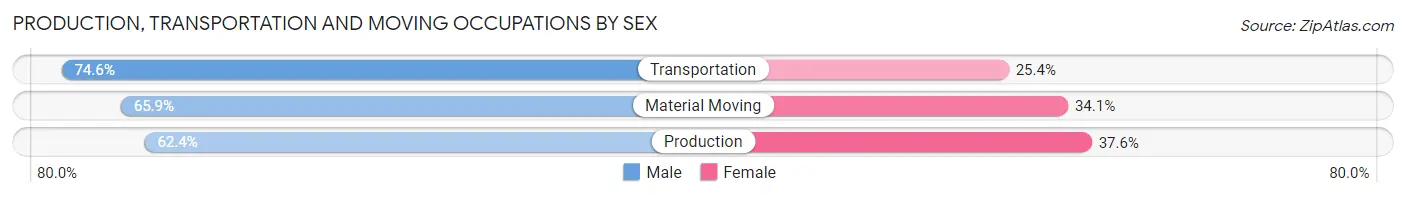
Production, Transportation and Moving Occupations by Sex
| Occupation | Male | Female |
| Production | 156 (62.4%) | 94 (37.6%) |
| Transportation | 88 (74.6%) | 30 (25.4%) |
| Material Moving | 112 (65.9%) | 58 (34.1%) |
| Total (Category) | 356 (66.2%) | 182 (33.8%) |
| Total (Overall) | 6,749 (51.9%) | 6,261 (48.1%) |
Employment Industries by Sex in Smithtown
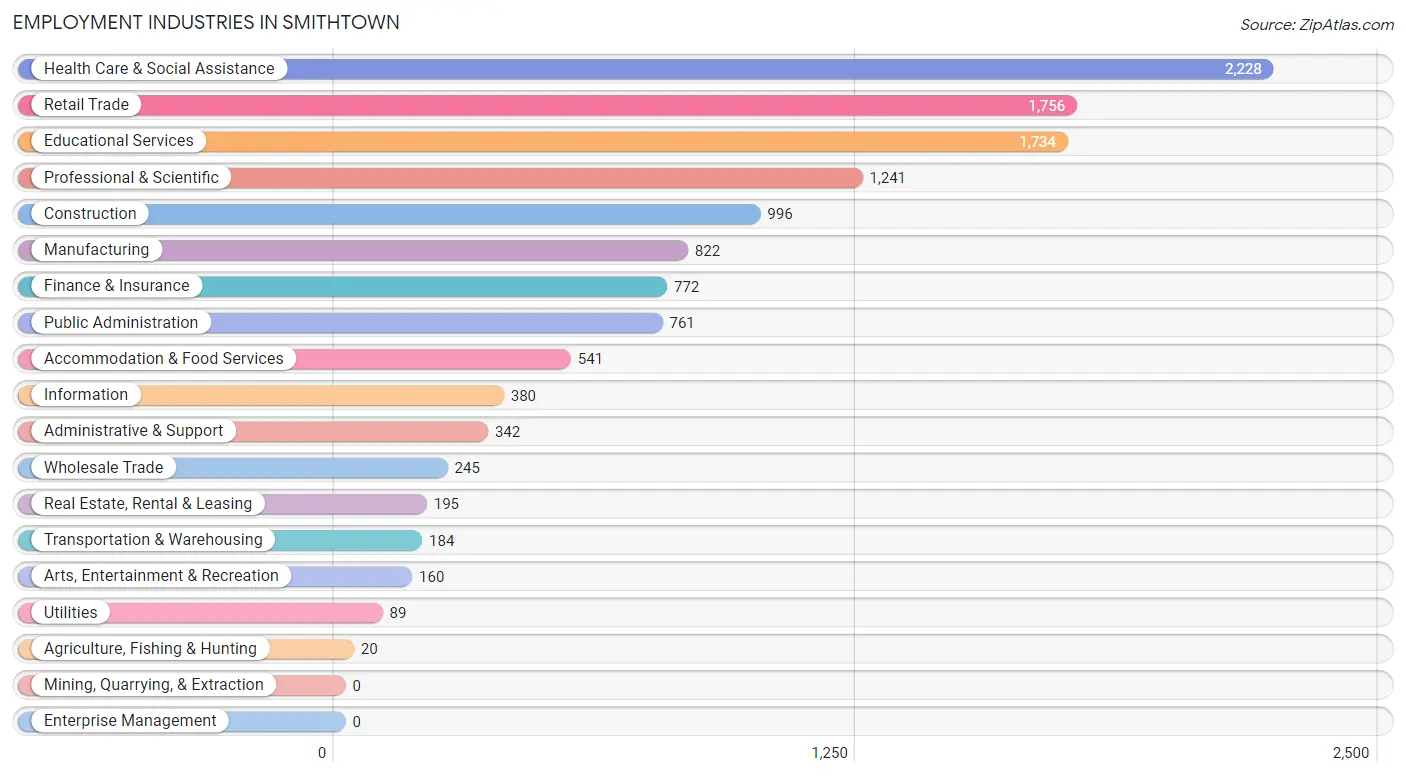
Employment Industries in Smithtown
The major employment industries in Smithtown include Health Care & Social Assistance (2,228 | 17.1%), Retail Trade (1,756 | 13.5%), Educational Services (1,734 | 13.3%), Professional & Scientific (1,241 | 9.5%), and Construction (996 | 7.7%).
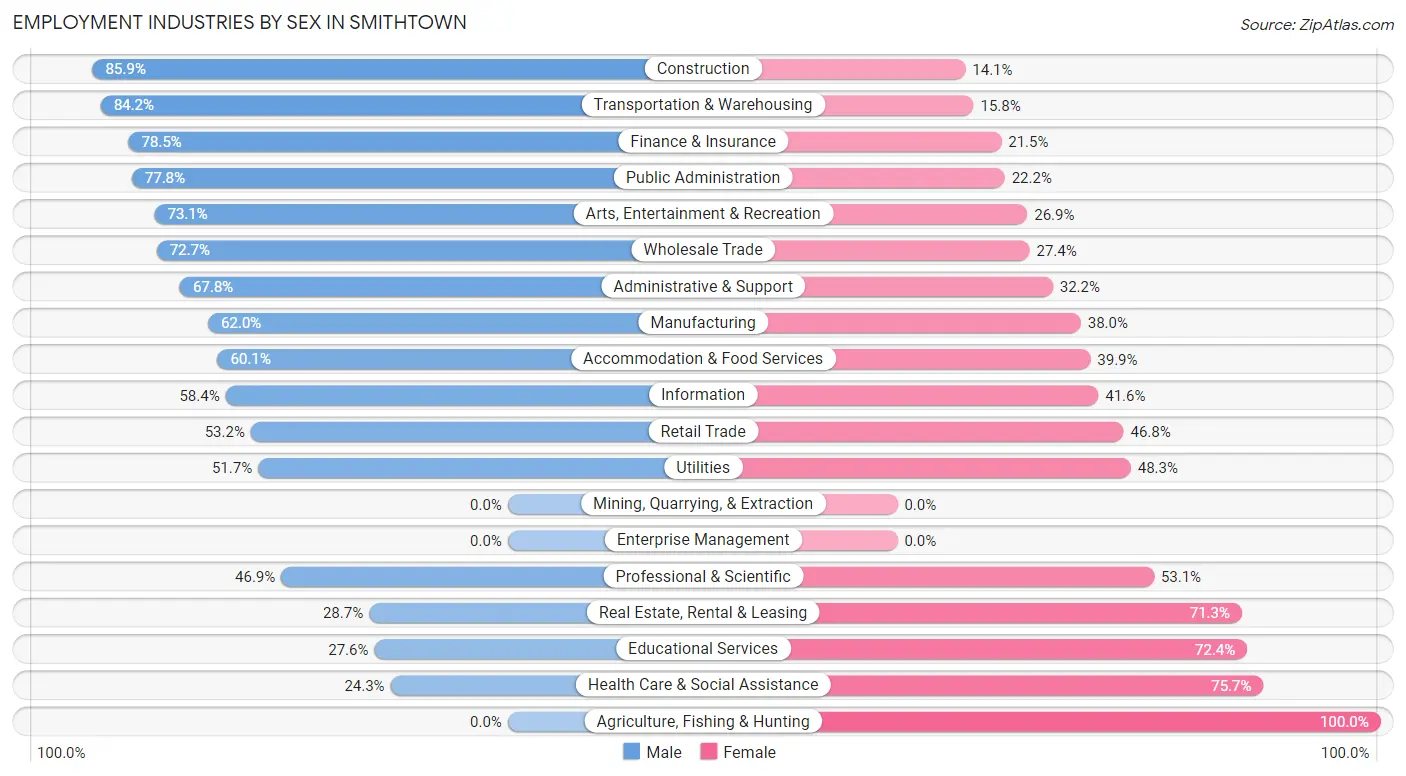
Employment Industries by Sex in Smithtown
The Smithtown industries that see more men than women are Construction (85.9%), Transportation & Warehousing (84.2%), and Finance & Insurance (78.5%), whereas the industries that tend to have a higher number of women are Agriculture, Fishing & Hunting (100.0%), Health Care & Social Assistance (75.7%), and Educational Services (72.4%).
| Industry | Male | Female |
| Agriculture, Fishing & Hunting | 0 (0.0%) | 20 (100.0%) |
| Mining, Quarrying, & Extraction | 0 (0.0%) | 0 (0.0%) |
| Construction | 856 (85.9%) | 140 (14.1%) |
| Manufacturing | 510 (62.0%) | 312 (38.0%) |
| Wholesale Trade | 178 (72.7%) | 67 (27.4%) |
| Retail Trade | 934 (53.2%) | 822 (46.8%) |
| Transportation & Warehousing | 155 (84.2%) | 29 (15.8%) |
| Utilities | 46 (51.7%) | 43 (48.3%) |
| Information | 222 (58.4%) | 158 (41.6%) |
| Finance & Insurance | 606 (78.5%) | 166 (21.5%) |
| Real Estate, Rental & Leasing | 56 (28.7%) | 139 (71.3%) |
| Professional & Scientific | 582 (46.9%) | 659 (53.1%) |
| Enterprise Management | 0 (0.0%) | 0 (0.0%) |
| Administrative & Support | 232 (67.8%) | 110 (32.2%) |
| Educational Services | 479 (27.6%) | 1,255 (72.4%) |
| Health Care & Social Assistance | 541 (24.3%) | 1,687 (75.7%) |
| Arts, Entertainment & Recreation | 117 (73.1%) | 43 (26.9%) |
| Accommodation & Food Services | 325 (60.1%) | 216 (39.9%) |
| Public Administration | 592 (77.8%) | 169 (22.2%) |
| Total | 6,749 (51.9%) | 6,261 (48.1%) |
Education in Smithtown
School Enrollment in Smithtown
The most common levels of schooling among the 6,083 students in Smithtown are high school (1,618 | 26.6%), college / undergraduate (1,207 | 19.8%), and elementary school (1,134 | 18.6%).
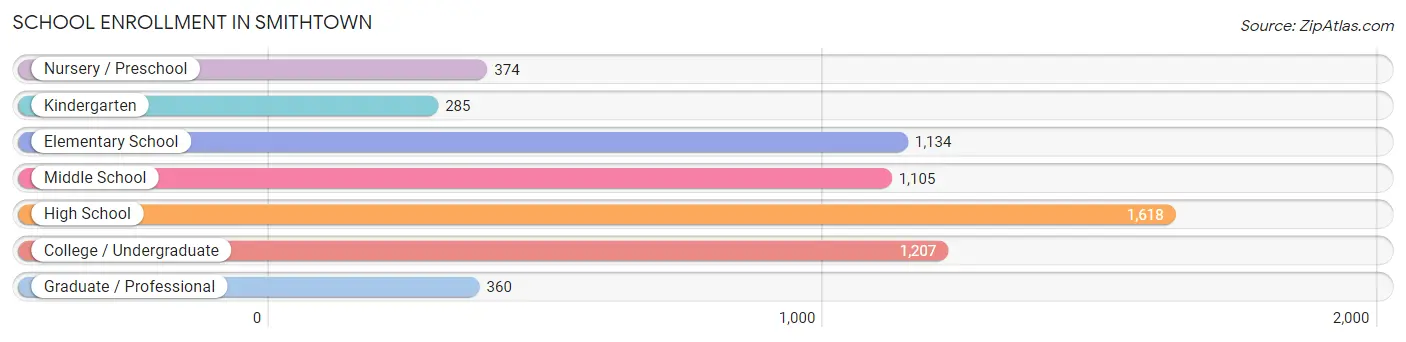
| School Level | # Students | % Students |
| Nursery / Preschool | 374 | 6.1% |
| Kindergarten | 285 | 4.7% |
| Elementary School | 1,134 | 18.6% |
| Middle School | 1,105 | 18.2% |
| High School | 1,618 | 26.6% |
| College / Undergraduate | 1,207 | 19.8% |
| Graduate / Professional | 360 | 5.9% |
| Total | 6,083 | 100.0% |
School Enrollment by Age by Funding Source in Smithtown
Out of a total of 6,083 students who are enrolled in schools in Smithtown, 852 (14.0%) attend a private institution, while the remaining 5,231 (86.0%) are enrolled in public schools. The age group of 3 to 4 year olds has the highest likelihood of being enrolled in private schools, with 221 (66.0% in the age bracket) enrolled. Conversely, the age group of 10 to 14 year olds has the lowest likelihood of being enrolled in a private school, with 1,372 (96.4% in the age bracket) attending a public institution.
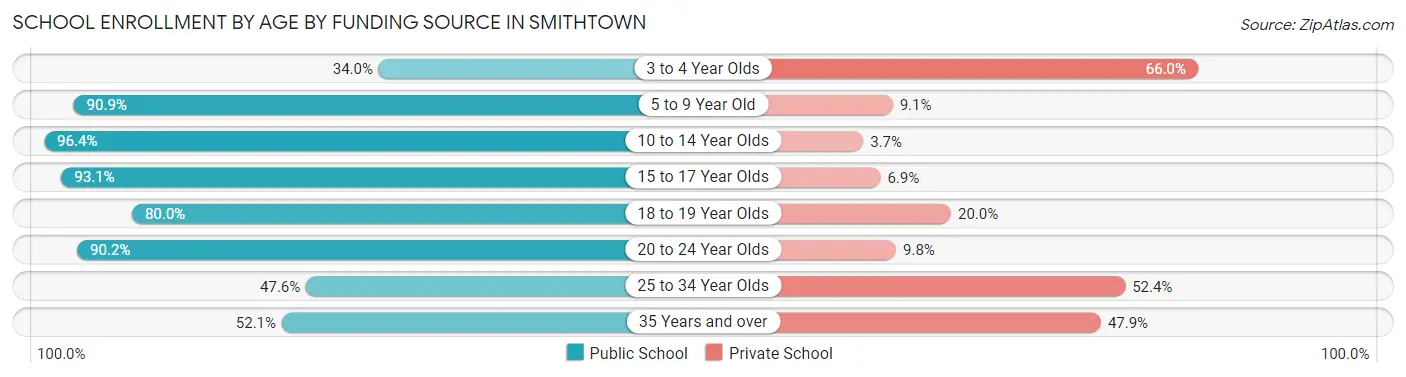
| Age Bracket | Public School | Private School |
| 3 to 4 Year Olds | 114 (34.0%) | 221 (66.0%) |
| 5 to 9 Year Old | 1,263 (90.9%) | 127 (9.1%) |
| 10 to 14 Year Olds | 1,372 (96.4%) | 52 (3.6%) |
| 15 to 17 Year Olds | 1,182 (93.1%) | 87 (6.9%) |
| 18 to 19 Year Olds | 332 (80.0%) | 83 (20.0%) |
| 20 to 24 Year Olds | 776 (90.2%) | 84 (9.8%) |
| 25 to 34 Year Olds | 117 (47.6%) | 129 (52.4%) |
| 35 Years and over | 75 (52.1%) | 69 (47.9%) |
| Total | 5,231 (86.0%) | 852 (14.0%) |
Educational Attainment by Field of Study in Smithtown
Business (2,320 | 24.0%), education (1,398 | 14.5%), science & technology (933 | 9.7%), social sciences (746 | 7.7%), and psychology (701 | 7.2%) are the most common fields of study among 9,665 individuals in Smithtown who have obtained a bachelor's degree or higher.
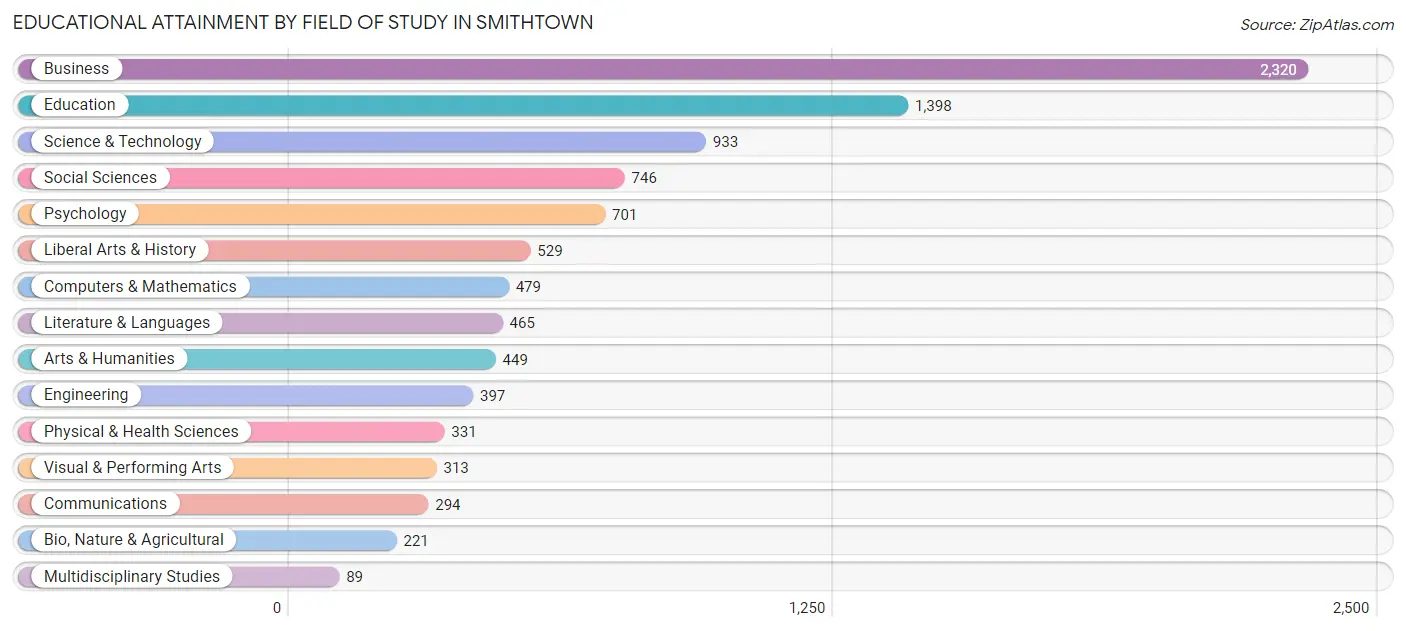
| Field of Study | # Graduates | % Graduates |
| Computers & Mathematics | 479 | 5.0% |
| Bio, Nature & Agricultural | 221 | 2.3% |
| Physical & Health Sciences | 331 | 3.4% |
| Psychology | 701 | 7.2% |
| Social Sciences | 746 | 7.7% |
| Engineering | 397 | 4.1% |
| Multidisciplinary Studies | 89 | 0.9% |
| Science & Technology | 933 | 9.7% |
| Business | 2,320 | 24.0% |
| Education | 1,398 | 14.5% |
| Literature & Languages | 465 | 4.8% |
| Liberal Arts & History | 529 | 5.5% |
| Visual & Performing Arts | 313 | 3.2% |
| Communications | 294 | 3.0% |
| Arts & Humanities | 449 | 4.6% |
| Total | 9,665 | 100.0% |
Transportation & Commute in Smithtown
Vehicle Availability by Sex in Smithtown
The most prevalent vehicle ownership categories in Smithtown are males with 2 vehicles (2,503, accounting for 37.3%) and females with 2 vehicles (2,204, making up 40.4%).
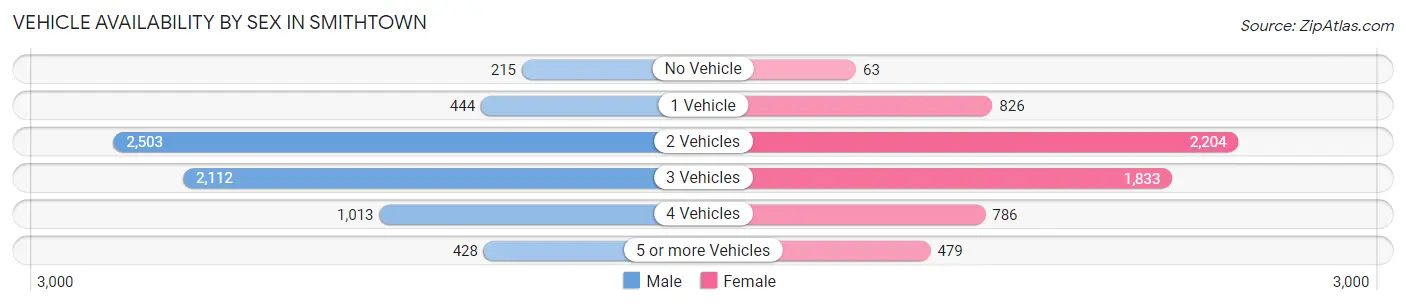
| Vehicles Available | Male | Female |
| No Vehicle | 215 (3.2%) | 63 (1.0%) |
| 1 Vehicle | 444 (6.6%) | 826 (13.3%) |
| 2 Vehicles | 2,503 (37.3%) | 2,204 (35.6%) |
| 3 Vehicles | 2,112 (31.5%) | 1,833 (29.6%) |
| 4 Vehicles | 1,013 (15.1%) | 786 (12.7%) |
| 5 or more Vehicles | 428 (6.4%) | 479 (7.7%) |
| Total | 6,715 (100.0%) | 6,191 (100.0%) |
Commute Time in Smithtown
The most frequently occuring commute durations in Smithtown are 30 to 34 minutes (2,288 commuters, 20.5%), 20 to 24 minutes (1,830 commuters, 16.4%), and 15 to 19 minutes (1,428 commuters, 12.8%).
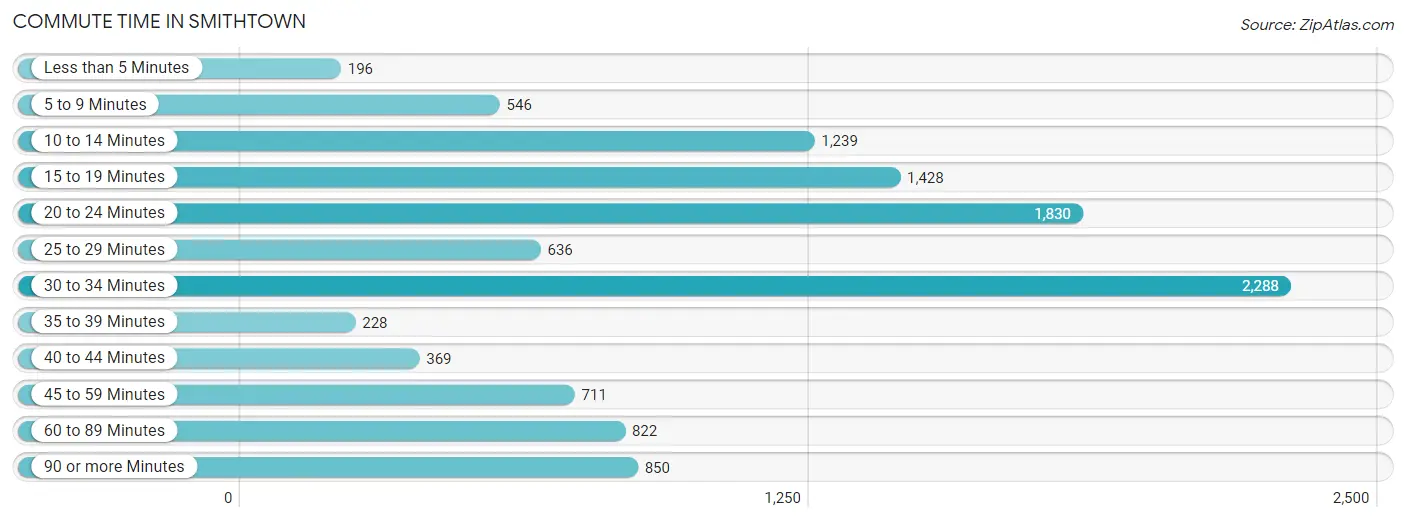
| Commute Time | # Commuters | % Commuters |
| Less than 5 Minutes | 196 | 1.8% |
| 5 to 9 Minutes | 546 | 4.9% |
| 10 to 14 Minutes | 1,239 | 11.1% |
| 15 to 19 Minutes | 1,428 | 12.8% |
| 20 to 24 Minutes | 1,830 | 16.4% |
| 25 to 29 Minutes | 636 | 5.7% |
| 30 to 34 Minutes | 2,288 | 20.5% |
| 35 to 39 Minutes | 228 | 2.1% |
| 40 to 44 Minutes | 369 | 3.3% |
| 45 to 59 Minutes | 711 | 6.4% |
| 60 to 89 Minutes | 822 | 7.4% |
| 90 or more Minutes | 850 | 7.6% |
Commute Time by Sex in Smithtown
The most common commute times in Smithtown are 30 to 34 minutes (1,536 commuters, 26.2%) for males and 20 to 24 minutes (1,052 commuters, 20.0%) for females.
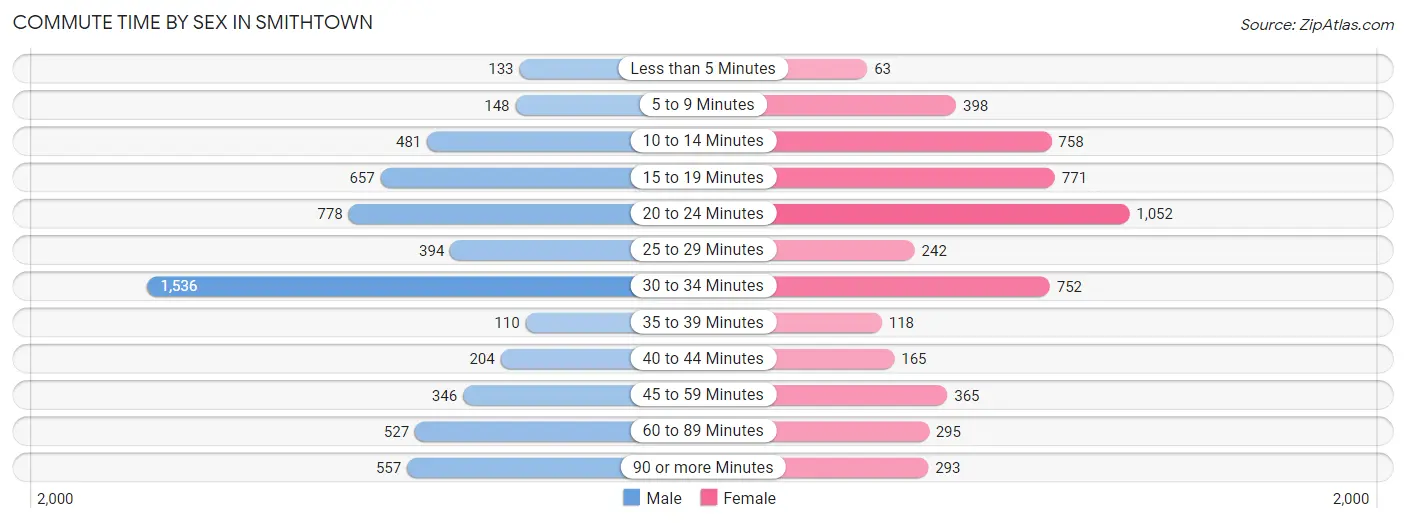
| Commute Time | Male | Female |
| Less than 5 Minutes | 133 (2.3%) | 63 (1.2%) |
| 5 to 9 Minutes | 148 (2.5%) | 398 (7.5%) |
| 10 to 14 Minutes | 481 (8.2%) | 758 (14.4%) |
| 15 to 19 Minutes | 657 (11.2%) | 771 (14.6%) |
| 20 to 24 Minutes | 778 (13.3%) | 1,052 (20.0%) |
| 25 to 29 Minutes | 394 (6.7%) | 242 (4.6%) |
| 30 to 34 Minutes | 1,536 (26.2%) | 752 (14.3%) |
| 35 to 39 Minutes | 110 (1.9%) | 118 (2.2%) |
| 40 to 44 Minutes | 204 (3.5%) | 165 (3.1%) |
| 45 to 59 Minutes | 346 (5.9%) | 365 (6.9%) |
| 60 to 89 Minutes | 527 (9.0%) | 295 (5.6%) |
| 90 or more Minutes | 557 (9.5%) | 293 (5.6%) |
Time of Departure to Work by Sex in Smithtown
The most frequent times of departure to work in Smithtown are 8:00 AM to 8:29 AM (1,093, 18.6%) for males and 8:00 AM to 8:29 AM (1,194, 22.7%) for females.
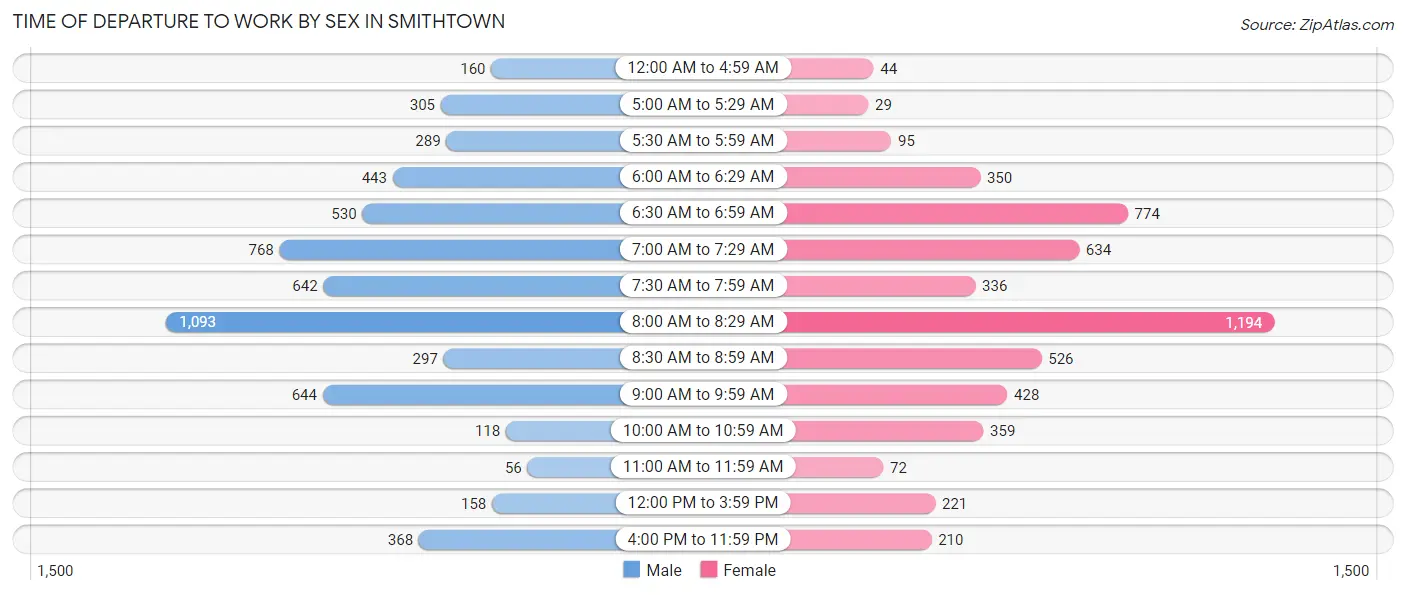
| Time of Departure | Male | Female |
| 12:00 AM to 4:59 AM | 160 (2.7%) | 44 (0.8%) |
| 5:00 AM to 5:29 AM | 305 (5.2%) | 29 (0.5%) |
| 5:30 AM to 5:59 AM | 289 (4.9%) | 95 (1.8%) |
| 6:00 AM to 6:29 AM | 443 (7.5%) | 350 (6.6%) |
| 6:30 AM to 6:59 AM | 530 (9.0%) | 774 (14.7%) |
| 7:00 AM to 7:29 AM | 768 (13.1%) | 634 (12.0%) |
| 7:30 AM to 7:59 AM | 642 (10.9%) | 336 (6.4%) |
| 8:00 AM to 8:29 AM | 1,093 (18.6%) | 1,194 (22.7%) |
| 8:30 AM to 8:59 AM | 297 (5.1%) | 526 (10.0%) |
| 9:00 AM to 9:59 AM | 644 (11.0%) | 428 (8.1%) |
| 10:00 AM to 10:59 AM | 118 (2.0%) | 359 (6.8%) |
| 11:00 AM to 11:59 AM | 56 (0.9%) | 72 (1.4%) |
| 12:00 PM to 3:59 PM | 158 (2.7%) | 221 (4.2%) |
| 4:00 PM to 11:59 PM | 368 (6.3%) | 210 (4.0%) |
| Total | 5,871 (100.0%) | 5,272 (100.0%) |
Housing Occupancy in Smithtown
Occupancy by Ownership in Smithtown
Of the total 8,421 dwellings in Smithtown, owner-occupied units account for 7,502 (89.1%), while renter-occupied units make up 919 (10.9%).
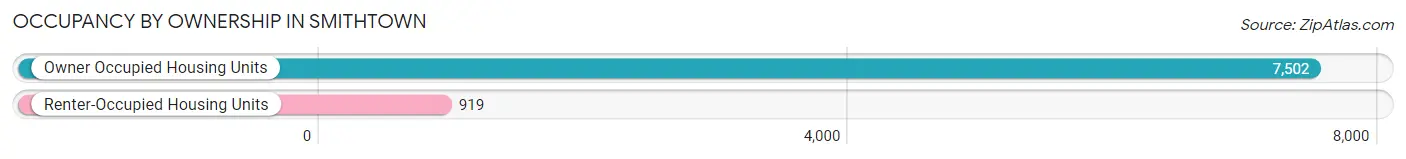
| Occupancy | # Housing Units | % Housing Units |
| Owner Occupied Housing Units | 7,502 | 89.1% |
| Renter-Occupied Housing Units | 919 | 10.9% |
| Total Occupied Housing Units | 8,421 | 100.0% |
Occupancy by Household Size in Smithtown
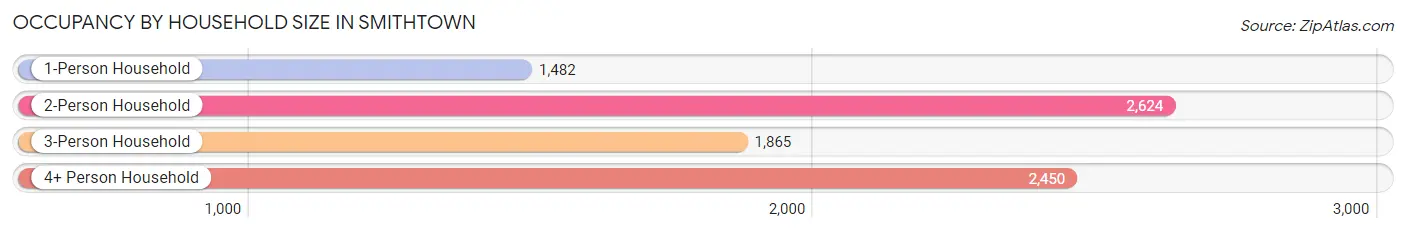
| Household Size | # Housing Units | % Housing Units |
| 1-Person Household | 1,482 | 17.6% |
| 2-Person Household | 2,624 | 31.2% |
| 3-Person Household | 1,865 | 22.2% |
| 4+ Person Household | 2,450 | 29.1% |
| Total Housing Units | 8,421 | 100.0% |
Occupancy by Ownership by Household Size in Smithtown
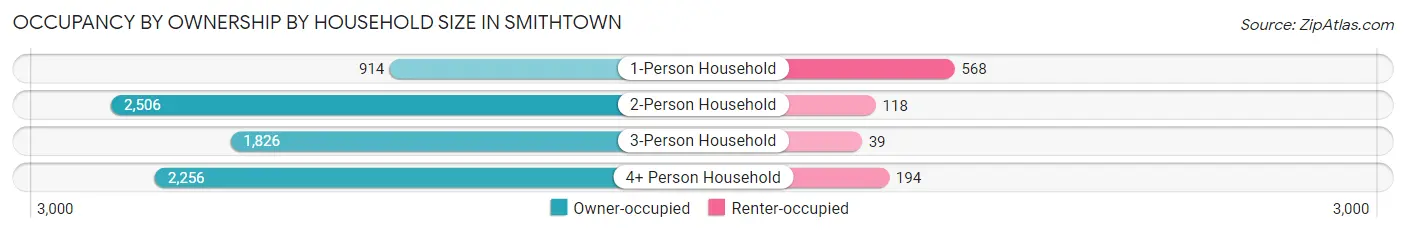
| Household Size | Owner-occupied | Renter-occupied |
| 1-Person Household | 914 (61.7%) | 568 (38.3%) |
| 2-Person Household | 2,506 (95.5%) | 118 (4.5%) |
| 3-Person Household | 1,826 (97.9%) | 39 (2.1%) |
| 4+ Person Household | 2,256 (92.1%) | 194 (7.9%) |
| Total Housing Units | 7,502 (89.1%) | 919 (10.9%) |
Occupancy by Educational Attainment in Smithtown
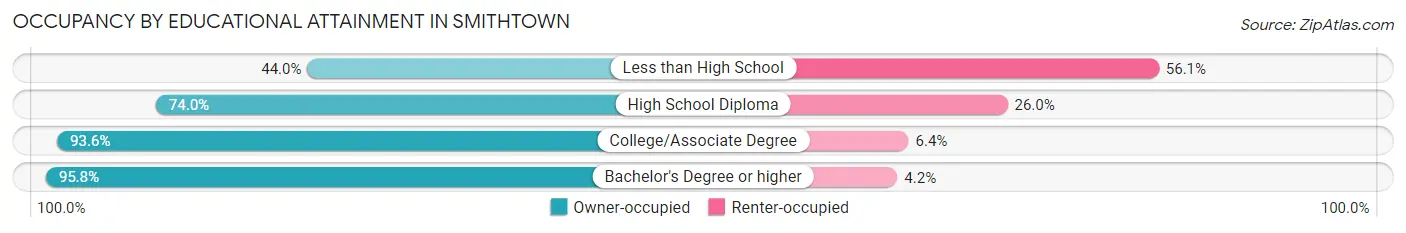
| Household Size | Owner-occupied | Renter-occupied |
| Less than High School | 189 (44.0%) | 241 (56.0%) |
| High School Diploma | 1,014 (74.0%) | 357 (26.0%) |
| College/Associate Degree | 1,776 (93.6%) | 122 (6.4%) |
| Bachelor's Degree or higher | 4,523 (95.8%) | 199 (4.2%) |
Occupancy by Age of Householder in Smithtown
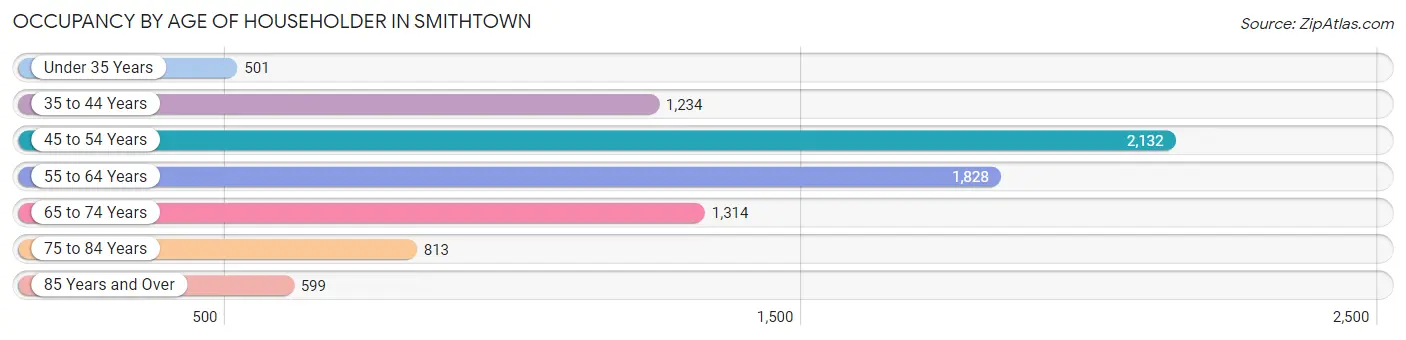
| Age Bracket | # Households | % Households |
| Under 35 Years | 501 | 5.9% |
| 35 to 44 Years | 1,234 | 14.6% |
| 45 to 54 Years | 2,132 | 25.3% |
| 55 to 64 Years | 1,828 | 21.7% |
| 65 to 74 Years | 1,314 | 15.6% |
| 75 to 84 Years | 813 | 9.7% |
| 85 Years and Over | 599 | 7.1% |
| Total | 8,421 | 100.0% |
Housing Finances in Smithtown
Median Income by Occupancy in Smithtown
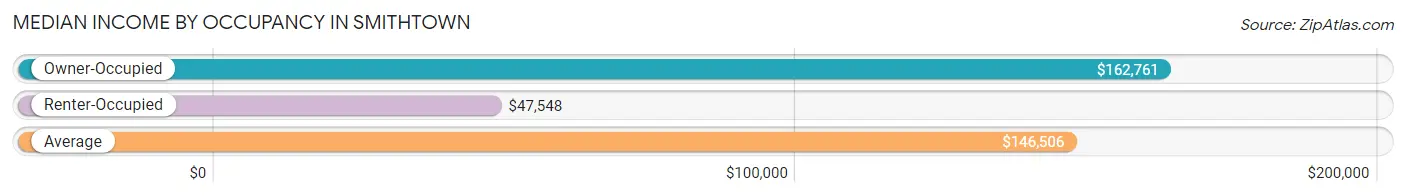
| Occupancy Type | # Households | Median Income |
| Owner-Occupied | 7,502 (89.1%) | $162,761 |
| Renter-Occupied | 919 (10.9%) | $47,548 |
| Average | 8,421 (100.0%) | $146,506 |
Occupancy by Householder Income Bracket in Smithtown
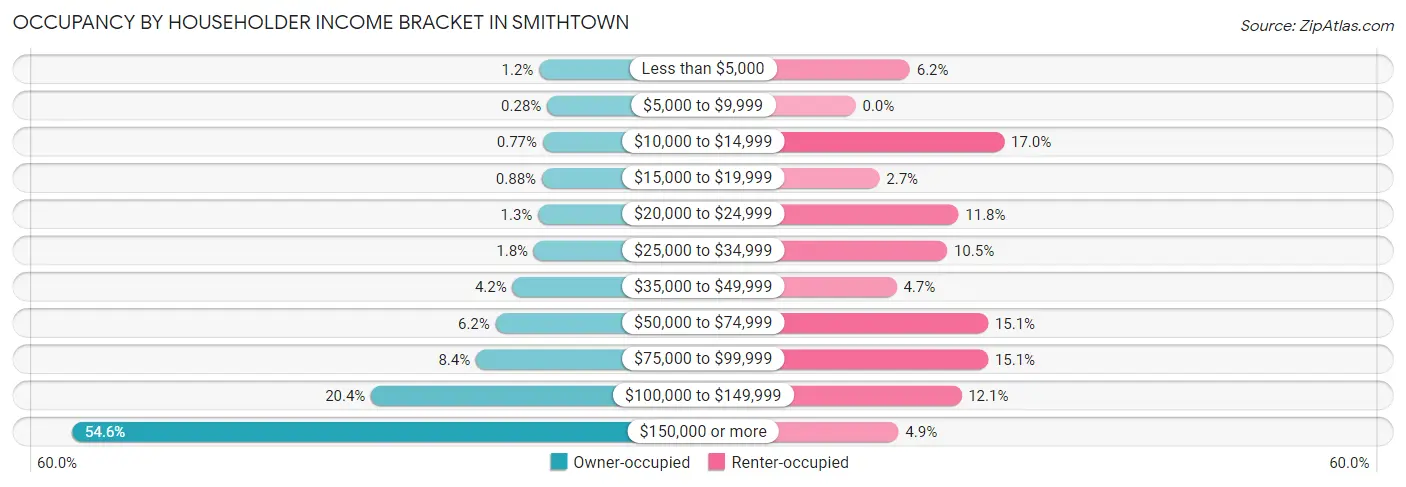
| Income Bracket | Owner-occupied | Renter-occupied |
| Less than $5,000 | 89 (1.2%) | 57 (6.2%) |
| $5,000 to $9,999 | 21 (0.3%) | 0 (0.0%) |
| $10,000 to $14,999 | 58 (0.8%) | 156 (17.0%) |
| $15,000 to $19,999 | 66 (0.9%) | 25 (2.7%) |
| $20,000 to $24,999 | 98 (1.3%) | 108 (11.7%) |
| $25,000 to $34,999 | 134 (1.8%) | 96 (10.4%) |
| $35,000 to $49,999 | 317 (4.2%) | 43 (4.7%) |
| $50,000 to $74,999 | 463 (6.2%) | 139 (15.1%) |
| $75,000 to $99,999 | 631 (8.4%) | 139 (15.1%) |
| $100,000 to $149,999 | 1,530 (20.4%) | 111 (12.1%) |
| $150,000 or more | 4,095 (54.6%) | 45 (4.9%) |
| Total | 7,502 (100.0%) | 919 (100.0%) |
Monthly Housing Cost Tiers in Smithtown
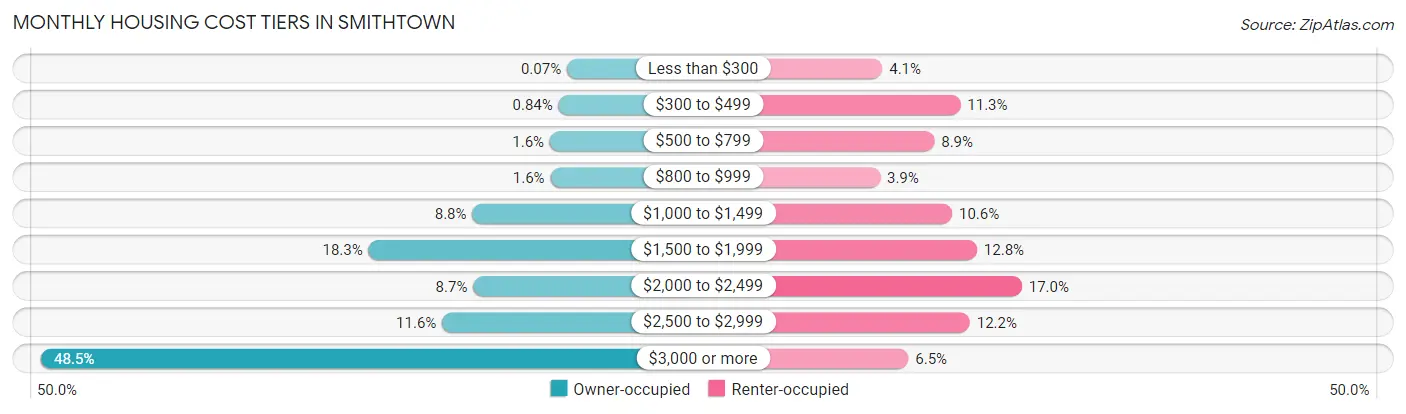
| Monthly Cost | Owner-occupied | Renter-occupied |
| Less than $300 | 5 (0.1%) | 38 (4.1%) |
| $300 to $499 | 63 (0.8%) | 104 (11.3%) |
| $500 to $799 | 123 (1.6%) | 82 (8.9%) |
| $800 to $999 | 119 (1.6%) | 36 (3.9%) |
| $1,000 to $1,499 | 659 (8.8%) | 97 (10.5%) |
| $1,500 to $1,999 | 1,376 (18.3%) | 118 (12.8%) |
| $2,000 to $2,499 | 653 (8.7%) | 156 (17.0%) |
| $2,500 to $2,999 | 867 (11.6%) | 112 (12.2%) |
| $3,000 or more | 3,637 (48.5%) | 60 (6.5%) |
| Total | 7,502 (100.0%) | 919 (100.0%) |
Physical Housing Characteristics in Smithtown
Housing Structures in Smithtown
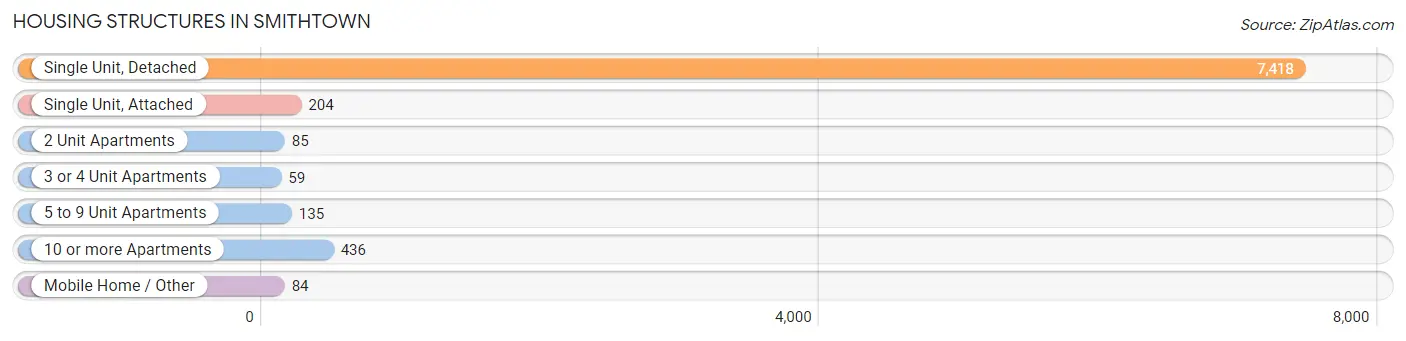
| Structure Type | # Housing Units | % Housing Units |
| Single Unit, Detached | 7,418 | 88.1% |
| Single Unit, Attached | 204 | 2.4% |
| 2 Unit Apartments | 85 | 1.0% |
| 3 or 4 Unit Apartments | 59 | 0.7% |
| 5 to 9 Unit Apartments | 135 | 1.6% |
| 10 or more Apartments | 436 | 5.2% |
| Mobile Home / Other | 84 | 1.0% |
| Total | 8,421 | 100.0% |
Housing Structures by Occupancy in Smithtown
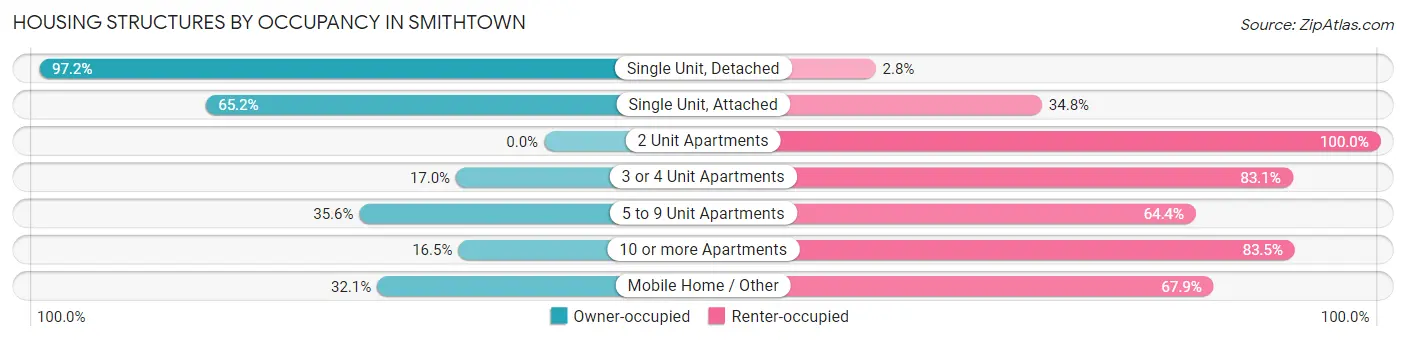
| Structure Type | Owner-occupied | Renter-occupied |
| Single Unit, Detached | 7,212 (97.2%) | 206 (2.8%) |
| Single Unit, Attached | 133 (65.2%) | 71 (34.8%) |
| 2 Unit Apartments | 0 (0.0%) | 85 (100.0%) |
| 3 or 4 Unit Apartments | 10 (17.0%) | 49 (83.1%) |
| 5 to 9 Unit Apartments | 48 (35.6%) | 87 (64.4%) |
| 10 or more Apartments | 72 (16.5%) | 364 (83.5%) |
| Mobile Home / Other | 27 (32.1%) | 57 (67.9%) |
| Total | 7,502 (89.1%) | 919 (10.9%) |
Housing Structures by Number of Rooms in Smithtown
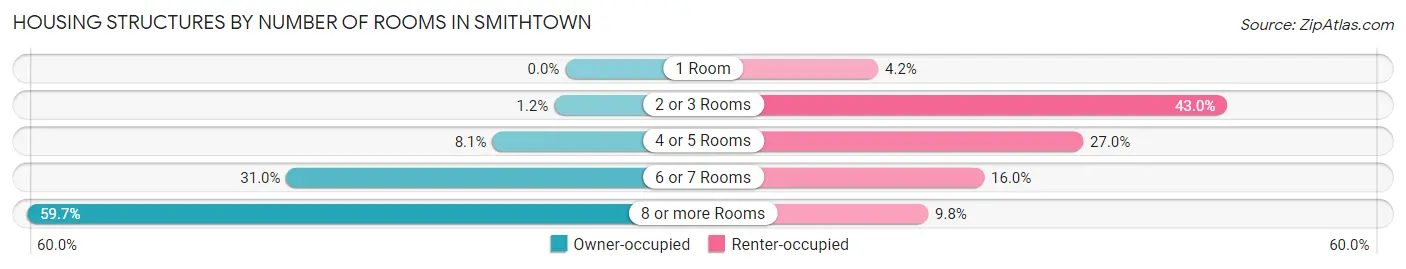
| Number of Rooms | Owner-occupied | Renter-occupied |
| 1 Room | 0 (0.0%) | 39 (4.2%) |
| 2 or 3 Rooms | 92 (1.2%) | 395 (43.0%) |
| 4 or 5 Rooms | 607 (8.1%) | 248 (27.0%) |
| 6 or 7 Rooms | 2,322 (30.9%) | 147 (16.0%) |
| 8 or more Rooms | 4,481 (59.7%) | 90 (9.8%) |
| Total | 7,502 (100.0%) | 919 (100.0%) |
Housing Structure by Heating Type in Smithtown
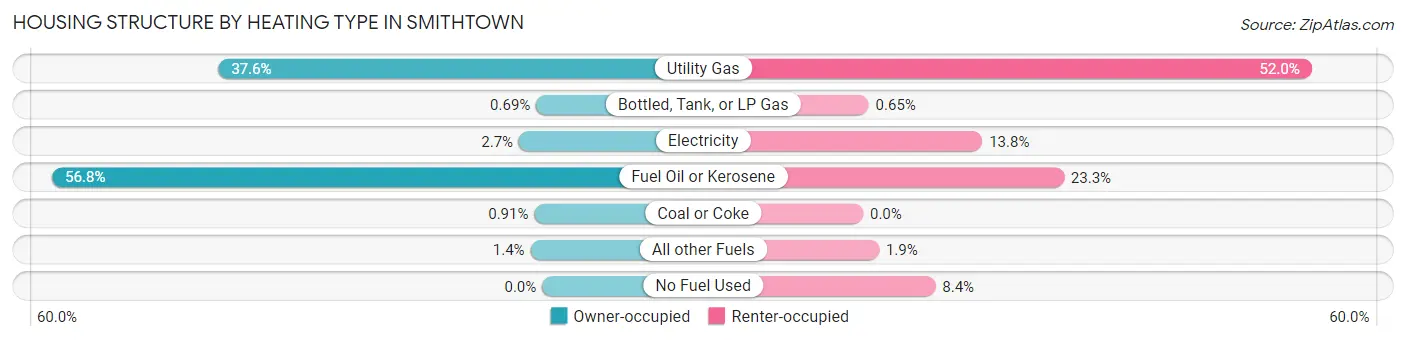
| Heating Type | Owner-occupied | Renter-occupied |
| Utility Gas | 2,817 (37.6%) | 478 (52.0%) |
| Bottled, Tank, or LP Gas | 52 (0.7%) | 6 (0.6%) |
| Electricity | 202 (2.7%) | 127 (13.8%) |
| Fuel Oil or Kerosene | 4,262 (56.8%) | 214 (23.3%) |
| Coal or Coke | 68 (0.9%) | 0 (0.0%) |
| All other Fuels | 101 (1.3%) | 17 (1.8%) |
| No Fuel Used | 0 (0.0%) | 77 (8.4%) |
| Total | 7,502 (100.0%) | 919 (100.0%) |
Household Vehicle Usage in Smithtown
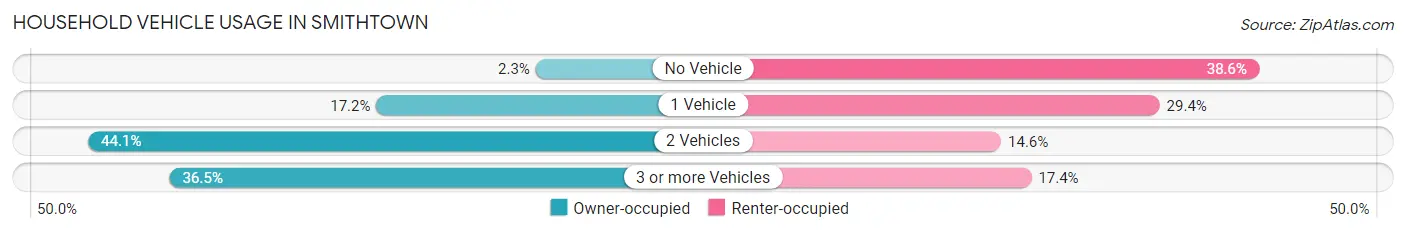
| Vehicles per Household | Owner-occupied | Renter-occupied |
| No Vehicle | 172 (2.3%) | 355 (38.6%) |
| 1 Vehicle | 1,288 (17.2%) | 270 (29.4%) |
| 2 Vehicles | 3,306 (44.1%) | 134 (14.6%) |
| 3 or more Vehicles | 2,736 (36.5%) | 160 (17.4%) |
| Total | 7,502 (100.0%) | 919 (100.0%) |
Real Estate & Mortgages in Smithtown
Real Estate and Mortgage Overview in Smithtown
| Characteristic | Without Mortgage | With Mortgage |
| Housing Units | 2,890 | 4,612 |
| Median Property Value | $634,000 | $634,300 |
| Median Household Income | $140,962 | $2,735 |
| Monthly Housing Costs | $1,501 | $3,416 |
| Real Estate Taxes | $10,001 | $27 |
Property Value by Mortgage Status in Smithtown
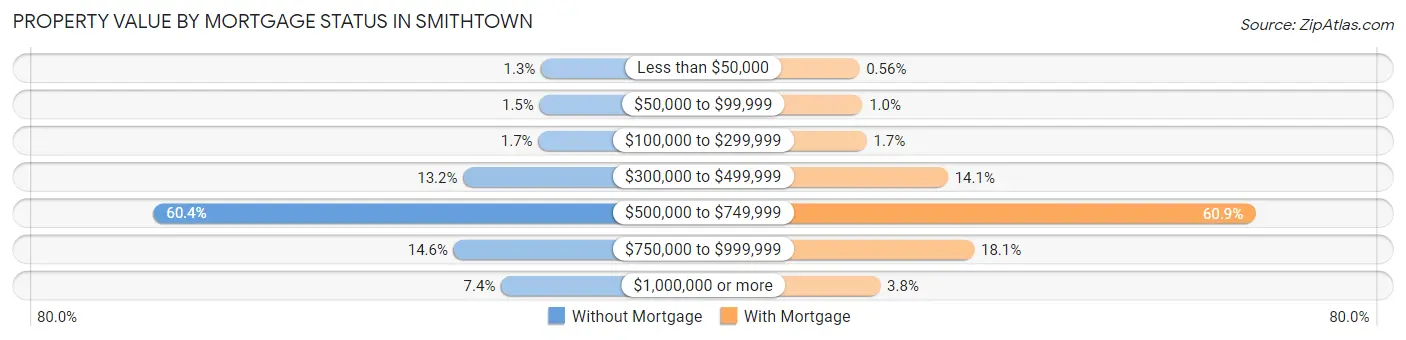
| Property Value | Without Mortgage | With Mortgage |
| Less than $50,000 | 37 (1.3%) | 26 (0.6%) |
| $50,000 to $99,999 | 44 (1.5%) | 47 (1.0%) |
| $100,000 to $299,999 | 49 (1.7%) | 77 (1.7%) |
| $300,000 to $499,999 | 380 (13.2%) | 648 (14.1%) |
| $500,000 to $749,999 | 1,745 (60.4%) | 2,808 (60.9%) |
| $750,000 to $999,999 | 422 (14.6%) | 833 (18.1%) |
| $1,000,000 or more | 213 (7.4%) | 173 (3.7%) |
| Total | 2,890 (100.0%) | 4,612 (100.0%) |
Household Income by Mortgage Status in Smithtown
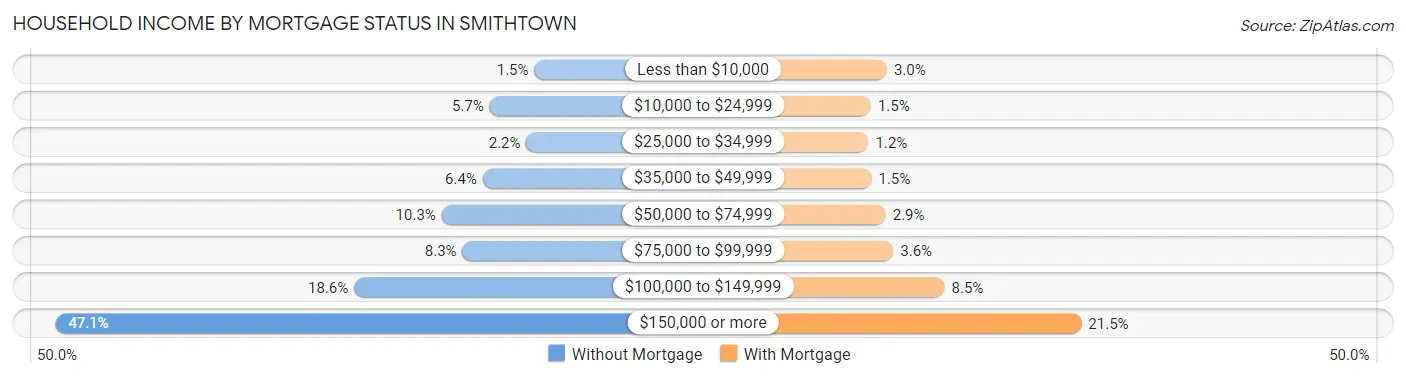
| Household Income | Without Mortgage | With Mortgage |
| Less than $10,000 | 42 (1.5%) | 138 (3.0%) |
| $10,000 to $24,999 | 165 (5.7%) | 68 (1.5%) |
| $25,000 to $34,999 | 64 (2.2%) | 57 (1.2%) |
| $35,000 to $49,999 | 184 (6.4%) | 70 (1.5%) |
| $50,000 to $74,999 | 297 (10.3%) | 133 (2.9%) |
| $75,000 to $99,999 | 240 (8.3%) | 166 (3.6%) |
| $100,000 to $149,999 | 538 (18.6%) | 391 (8.5%) |
| $150,000 or more | 1,360 (47.1%) | 992 (21.5%) |
| Total | 2,890 (100.0%) | 4,612 (100.0%) |
Property Value to Household Income Ratio in Smithtown
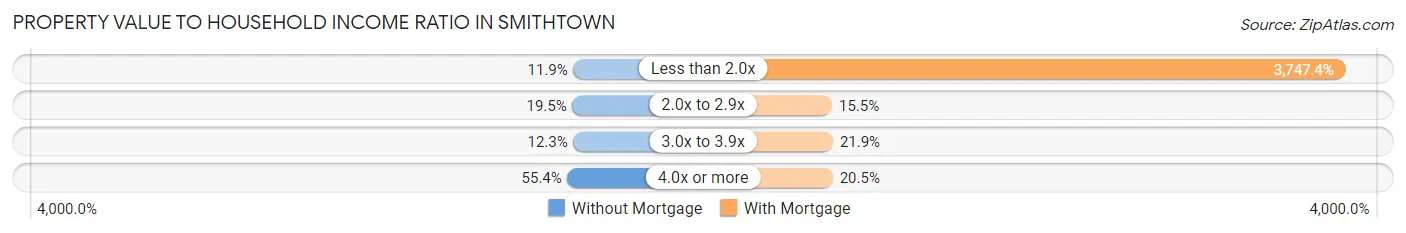
| Value-to-Income Ratio | Without Mortgage | With Mortgage |
| Less than 2.0x | 345 (11.9%) | 172,829 (3,747.4%) |
| 2.0x to 2.9x | 562 (19.5%) | 713 (15.5%) |
| 3.0x to 3.9x | 355 (12.3%) | 1,008 (21.9%) |
| 4.0x or more | 1,601 (55.4%) | 946 (20.5%) |
| Total | 2,890 (100.0%) | 4,612 (100.0%) |
Real Estate Taxes by Mortgage Status in Smithtown
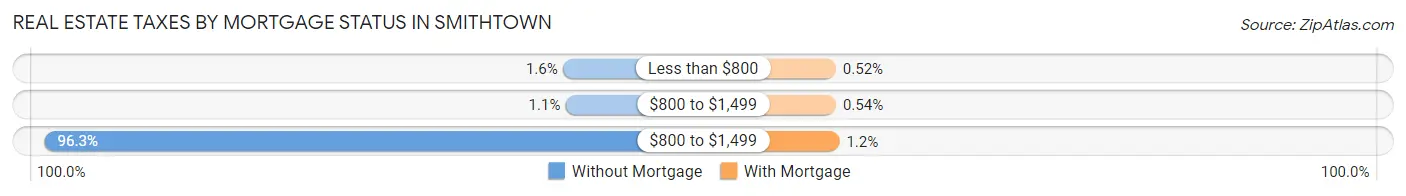
| Property Taxes | Without Mortgage | With Mortgage |
| Less than $800 | 45 (1.6%) | 24 (0.5%) |
| $800 to $1,499 | 31 (1.1%) | 25 (0.5%) |
| $800 to $1,499 | 2,784 (96.3%) | 54 (1.2%) |
| Total | 2,890 (100.0%) | 4,612 (100.0%) |
Health & Disability in Smithtown
Health Insurance Coverage by Age in Smithtown
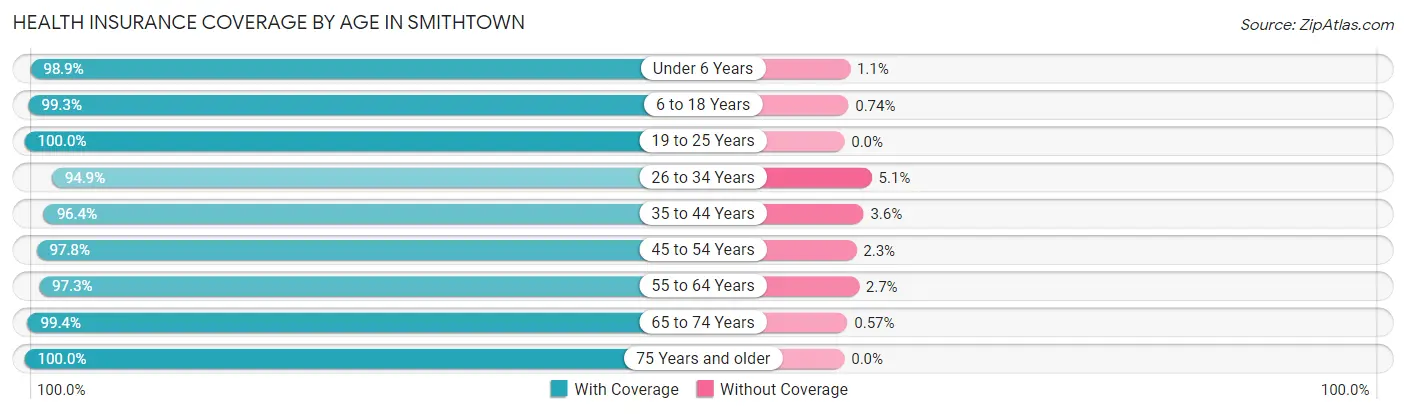
| Age Bracket | With Coverage | Without Coverage |
| Under 6 Years | 1,489 (98.9%) | 16 (1.1%) |
| 6 to 18 Years | 4,043 (99.3%) | 30 (0.7%) |
| 19 to 25 Years | 2,088 (100.0%) | 0 (0.0%) |
| 26 to 34 Years | 1,902 (94.9%) | 102 (5.1%) |
| 35 to 44 Years | 2,461 (96.4%) | 91 (3.6%) |
| 45 to 54 Years | 4,221 (97.8%) | 97 (2.2%) |
| 55 to 64 Years | 4,043 (97.3%) | 113 (2.7%) |
| 65 to 74 Years | 2,078 (99.4%) | 12 (0.6%) |
| 75 Years and older | 2,215 (100.0%) | 0 (0.0%) |
| Total | 24,540 (98.2%) | 461 (1.8%) |
Health Insurance Coverage by Citizenship Status in Smithtown
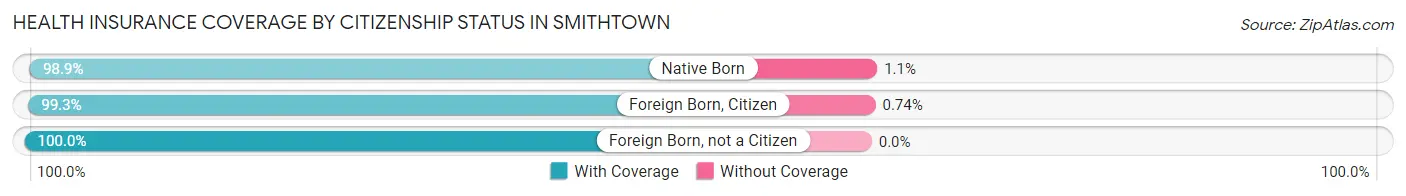
| Citizenship Status | With Coverage | Without Coverage |
| Native Born | 1,489 (98.9%) | 16 (1.1%) |
| Foreign Born, Citizen | 4,043 (99.3%) | 30 (0.7%) |
| Foreign Born, not a Citizen | 2,088 (100.0%) | 0 (0.0%) |
Health Insurance Coverage by Household Income in Smithtown
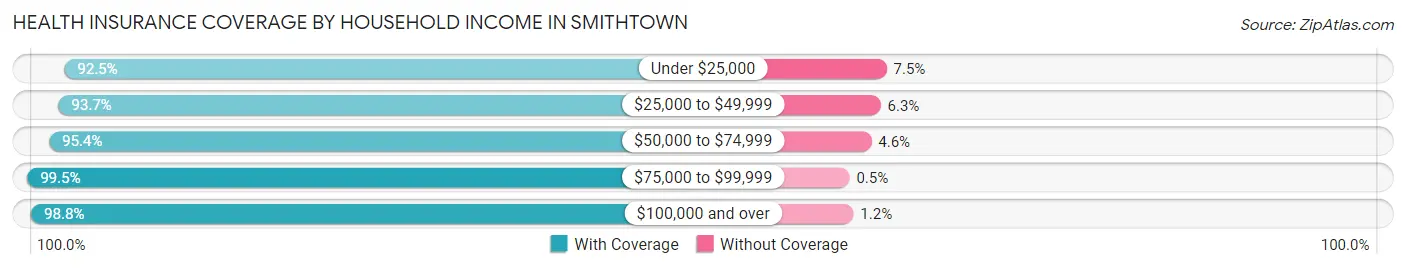
| Household Income | With Coverage | Without Coverage |
| Under $25,000 | 843 (92.5%) | 68 (7.5%) |
| $25,000 to $49,999 | 1,167 (93.7%) | 79 (6.3%) |
| $50,000 to $74,999 | 1,307 (95.4%) | 63 (4.6%) |
| $75,000 to $99,999 | 1,801 (99.5%) | 9 (0.5%) |
| $100,000 and over | 19,323 (98.8%) | 242 (1.2%) |
Public vs Private Health Insurance Coverage by Age in Smithtown
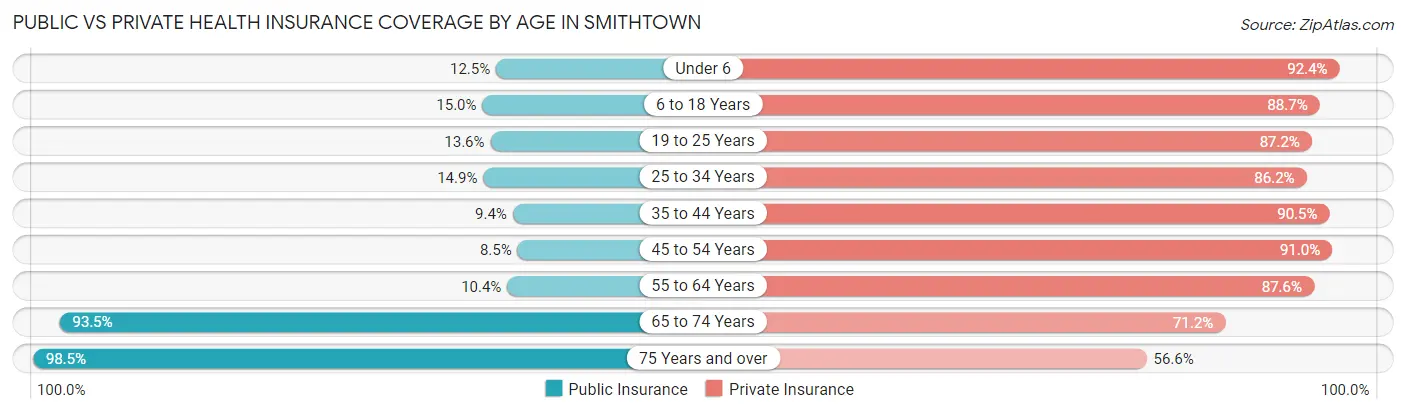
| Age Bracket | Public Insurance | Private Insurance |
| Under 6 | 188 (12.5%) | 1,390 (92.4%) |
| 6 to 18 Years | 612 (15.0%) | 3,611 (88.7%) |
| 19 to 25 Years | 283 (13.6%) | 1,821 (87.2%) |
| 25 to 34 Years | 298 (14.9%) | 1,728 (86.2%) |
| 35 to 44 Years | 240 (9.4%) | 2,309 (90.5%) |
| 45 to 54 Years | 367 (8.5%) | 3,929 (91.0%) |
| 55 to 64 Years | 433 (10.4%) | 3,641 (87.6%) |
| 65 to 74 Years | 1,955 (93.5%) | 1,487 (71.2%) |
| 75 Years and over | 2,181 (98.5%) | 1,253 (56.6%) |
| Total | 6,557 (26.2%) | 21,169 (84.7%) |
Disability Status by Sex by Age in Smithtown
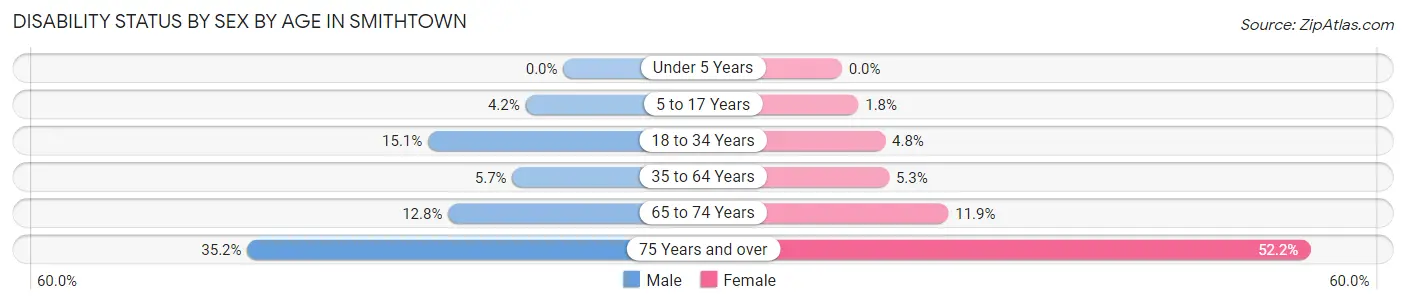
| Age Bracket | Male | Female |
| Under 5 Years | 0 (0.0%) | 0 (0.0%) |
| 5 to 17 Years | 101 (4.2%) | 32 (1.8%) |
| 18 to 34 Years | 315 (15.1%) | 109 (4.8%) |
| 35 to 64 Years | 311 (5.7%) | 291 (5.2%) |
| 65 to 74 Years | 135 (12.8%) | 123 (11.9%) |
| 75 Years and over | 316 (35.2%) | 687 (52.2%) |
Disability Class by Sex by Age in Smithtown
Disability Class: Hearing Difficulty
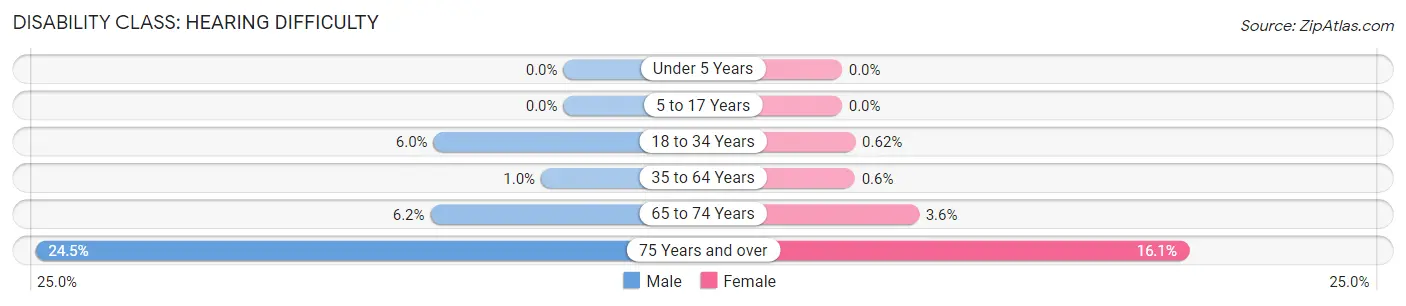
| Age Bracket | Male | Female |
| Under 5 Years | 0 (0.0%) | 0 (0.0%) |
| 5 to 17 Years | 0 (0.0%) | 0 (0.0%) |
| 18 to 34 Years | 126 (6.0%) | 14 (0.6%) |
| 35 to 64 Years | 57 (1.0%) | 33 (0.6%) |
| 65 to 74 Years | 65 (6.2%) | 37 (3.6%) |
| 75 Years and over | 220 (24.5%) | 212 (16.1%) |
Disability Class: Vision Difficulty
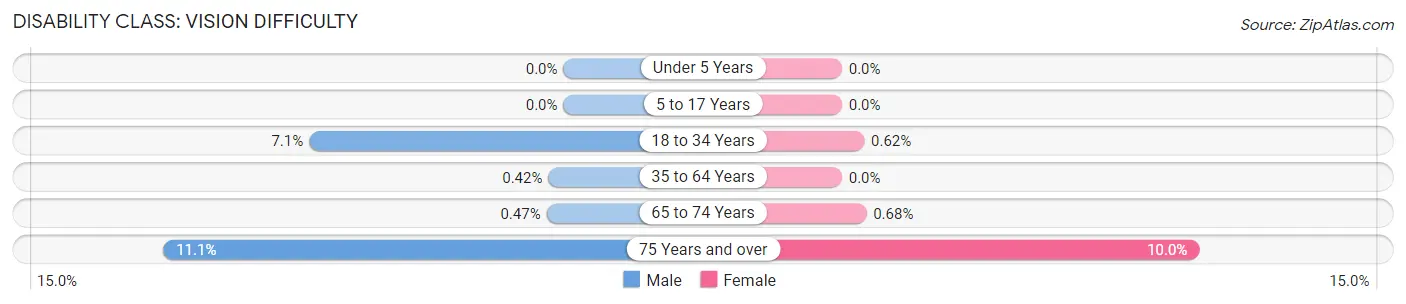
| Age Bracket | Male | Female |
| Under 5 Years | 0 (0.0%) | 0 (0.0%) |
| 5 to 17 Years | 0 (0.0%) | 0 (0.0%) |
| 18 to 34 Years | 148 (7.1%) | 14 (0.6%) |
| 35 to 64 Years | 23 (0.4%) | 0 (0.0%) |
| 65 to 74 Years | 5 (0.5%) | 7 (0.7%) |
| 75 Years and over | 100 (11.1%) | 131 (10.0%) |
Disability Class: Cognitive Difficulty
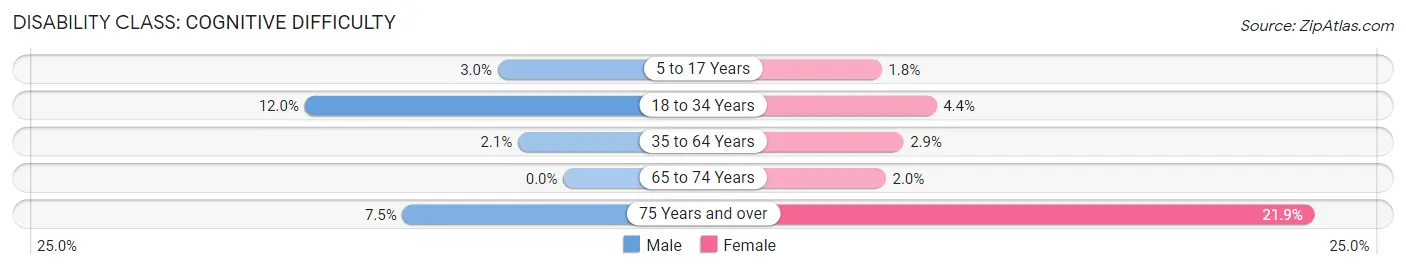
| Age Bracket | Male | Female |
| 5 to 17 Years | 73 (3.0%) | 32 (1.8%) |
| 18 to 34 Years | 251 (12.0%) | 99 (4.4%) |
| 35 to 64 Years | 115 (2.1%) | 158 (2.9%) |
| 65 to 74 Years | 0 (0.0%) | 21 (2.0%) |
| 75 Years and over | 67 (7.5%) | 289 (21.9%) |
Disability Class: Ambulatory Difficulty
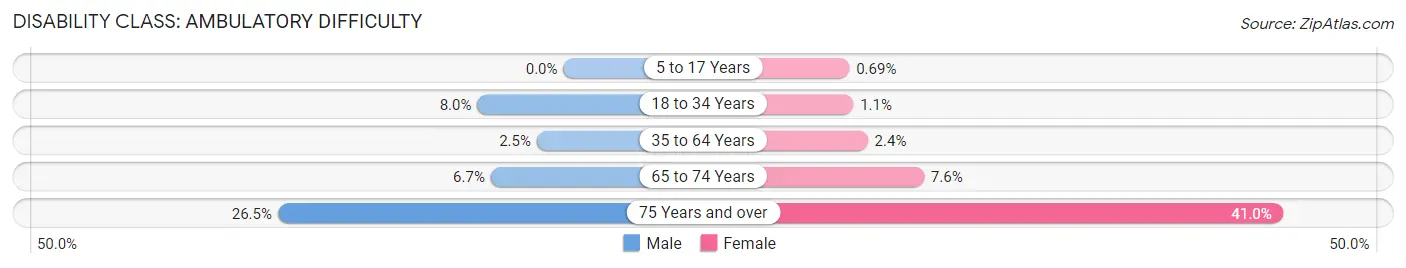
| Age Bracket | Male | Female |
| 5 to 17 Years | 0 (0.0%) | 12 (0.7%) |
| 18 to 34 Years | 167 (8.0%) | 24 (1.1%) |
| 35 to 64 Years | 135 (2.5%) | 133 (2.4%) |
| 65 to 74 Years | 71 (6.7%) | 79 (7.6%) |
| 75 Years and over | 238 (26.5%) | 540 (41.0%) |
Disability Class: Self-Care Difficulty
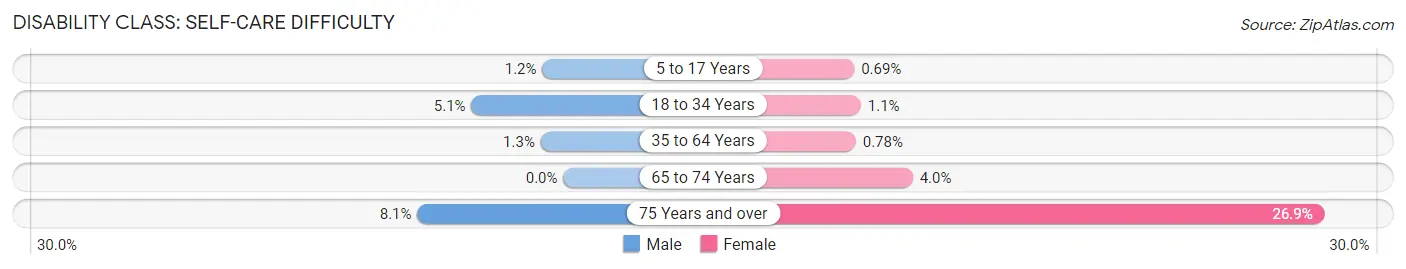
| Age Bracket | Male | Female |
| 5 to 17 Years | 28 (1.2%) | 12 (0.7%) |
| 18 to 34 Years | 107 (5.1%) | 24 (1.1%) |
| 35 to 64 Years | 69 (1.3%) | 43 (0.8%) |
| 65 to 74 Years | 0 (0.0%) | 41 (4.0%) |
| 75 Years and over | 73 (8.1%) | 354 (26.9%) |
Technology Access in Smithtown
Computing Device Access in Smithtown
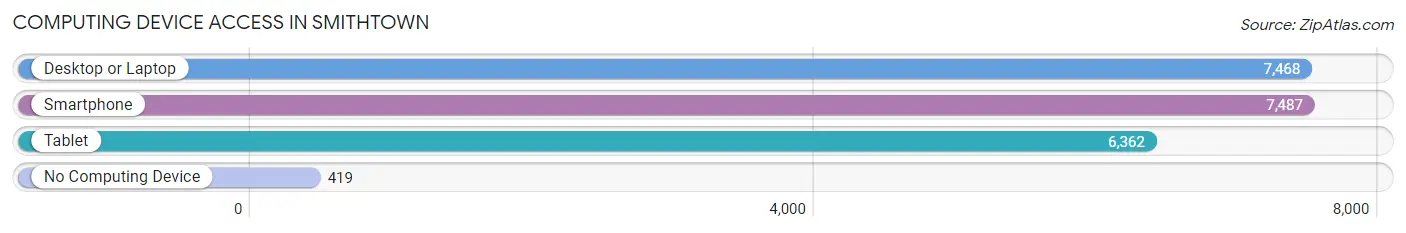
| Device Type | # Households | % Households |
| Desktop or Laptop | 7,468 | 88.7% |
| Smartphone | 7,487 | 88.9% |
| Tablet | 6,362 | 75.5% |
| No Computing Device | 419 | 5.0% |
| Total | 8,421 | 100.0% |
Internet Access in Smithtown
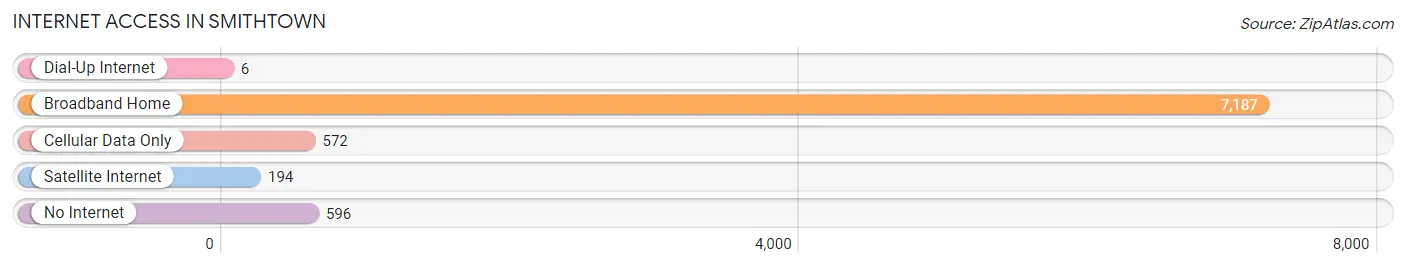
| Internet Type | # Households | % Households |
| Dial-Up Internet | 6 | 0.1% |
| Broadband Home | 7,187 | 85.4% |
| Cellular Data Only | 572 | 6.8% |
| Satellite Internet | 194 | 2.3% |
| No Internet | 596 | 7.1% |
| Total | 8,421 | 100.0% |
Smithtown Summary
History
The Town of Smithtown is located in Suffolk County, New York, on the north shore of Long Island. It is bordered by the towns of Huntington, Islip, Brookhaven, and Babylon. The town was founded in 1665 by Richard Smith, an English settler who purchased the land from the local Native American tribe, the Nissequogue. Smithtown was originally part of the Town of Huntington, but was incorporated as its own town in 1788.
The town was named after Richard Smith, who was a prominent landowner and politician in the area. Smithtown was a major agricultural center in the 19th century, and the town’s economy was largely based on farming and fishing. The town was also home to several mills, which provided employment for many of the town’s residents.
In the 20th century, Smithtown began to experience rapid population growth as the town became a popular suburban destination for New York City residents. The town’s population grew from just over 10,000 in 1950 to over 117,000 in 2010.
Geography
Smithtown is located in Suffolk County, New York, on the north shore of Long Island. It is bordered by the towns of Huntington, Islip, Brookhaven, and Babylon. The town covers an area of approximately 58 square miles and is home to several villages and hamlets, including Smithtown, Nesconset, Hauppauge, Kings Park, and St. James.
The town is located on the Smithtown Bay, which is part of the Long Island Sound. The town is also home to several parks, including Caleb Smith State Park, Blydenburgh County Park, and Nissequogue River State Park.
Economy
The economy of Smithtown is largely based on services and retail. The town is home to several large employers, including St. Catherine of Siena Medical Center, St. James Hospital, and the Smithtown Central School District. The town is also home to several shopping centers, including the Smith Haven Mall and the Smithtown Commons.
The town is also home to several technology companies, including Canon USA, Canon Solutions America, and Canon Business Solutions. The town is also home to several financial services companies, including Bank of America, Citibank, and JPMorgan Chase.
Demographics
As of the 2010 census, the population of Smithtown was 117,801. The racial makeup of the town was 87.3% White, 5.2% African American, 0.3% Native American, 3.7% Asian, 0.1% Pacific Islander, 1.7% from other races, and 1.9% from two or more races. Hispanic or Latino of any race were 6.3% of the population.
The median household income in Smithtown was $97,845, and the median family income was $112,917. The per capita income for the town was $41,945. About 3.2% of families and 4.7% of the population were below the poverty line, including 5.2% of those under age 18 and 4.2% of those age 65 or over.
Common Questions
What is Per Capita Income in Smithtown?
Per Capita income in Smithtown is $65,031.
What is the Median Family Income in Smithtown?
Median Family Income in Smithtown is $166,755.
What is the Median Household income in Smithtown?
Median Household Income in Smithtown is $146,506.
What is Income or Wage Gap in Smithtown?
Income or Wage Gap in Smithtown is 32.9%.
Women in Smithtown earn 67.1 cents for every dollar earned by a man.
What is Inequality or Gini Index in Smithtown?
Inequality or Gini Index in Smithtown is 0.44.
What is the Total Population of Smithtown?
Total Population of Smithtown is 25,588.
What is the Total Male Population of Smithtown?
Total Male Population of Smithtown is 12,713.
What is the Total Female Population of Smithtown?
Total Female Population of Smithtown is 12,875.
What is the Ratio of Males per 100 Females in Smithtown?
There are 98.74 Males per 100 Females in Smithtown.
What is the Ratio of Females per 100 Males in Smithtown?
There are 101.27 Females per 100 Males in Smithtown.
What is the Median Population Age in Smithtown?
Median Population Age in Smithtown is 46.7 Years.
What is the Average Family Size in Smithtown
Average Family Size in Smithtown is 3.4 People.
What is the Average Household Size in Smithtown
Average Household Size in Smithtown is 3.0 People.
How Large is the Labor Force in Smithtown?
There are 13,501 People in the Labor Forcein in Smithtown.
What is the Percentage of People in the Labor Force in Smithtown?
64.6% of People are in the Labor Force in Smithtown.
What is the Unemployment Rate in Smithtown?
Unemployment Rate in Smithtown is 3.6%.