Zip Codes with the Lowest Poverty Level Among Children Under the Age of 5 in Brooklyn, NY

RELATED REPORTS & OPTIONS

Lowest Poverty | Child 0-5
Population
Families and Households
Female Fertility
Female Fertility (Unmarried)
Race (Community Size)
Race (Percentage)
Ancestry (Community Size)
AfghanAfricanAlbanianAlsatianAmericanApacheArabArgentineanArmenianAssyrian / Chaldean / SyriacAustralianAustrianBahamianBangladeshiBarbadianBasqueBelgianBelizeanBermudanBhutaneseBlackfeetBolivianBrazilianBritishBritish West IndianBulgarianBurmeseCajunCambodianCanadianCape VerdeanCarpatho RusynCelticCentral AmericanCentral American IndianCherokeeChickasawChileanChippewaChoctawColombianCosta RicanCreekCroatianCrowCubanCypriotCzechCzechoslovakianDanishDominicanDutchDutch West IndianEastern EuropeanEcuadorianEgyptianEnglishEstonianEthiopianEuropeanFilipinoFinnishFrenchFrench American IndianFrench CanadianGermanGerman RussianGhanaianGreekGuamanian / ChamorroGuatemalanGuyaneseHaitianHonduranHungarianIcelanderIndian (Asian)IndonesianIranianIraqiIrishIroquoisIsraeliItalianJamaicanJapaneseJordanianKenyanKoreanLaotianLatvianLebaneseLiberianLithuanianLumbeeLuxembourgerMacedonianMalaysianMalteseMexicanMexican American IndianMongolianMoroccanNative HawaiianNavajoNew ZealanderNicaraguanNigerianNorthern EuropeanNorwegianOkinawanPakistaniPalestinianPanamanianParaguayanPennsylvania GermanPeruvianPolishPortuguesePuebloPuerto RicanRomanianRussianSalvadoranSamoanScandinavianScotch-IrishScottishSeminoleSenegaleseSerbianSierra LeoneanSiouxSlavicSlovakSloveneSomaliSouth AfricanSouth AmericanSouth American IndianSoviet UnionSpaniardSpanishSpanish AmericanSpanish American IndianSri LankanSubsaharan AfricanSudaneseSwedishSwissSyrianThaiTrinidadian and TobagonianTurkishU.S. Virgin IslanderUgandanUkrainianUruguayanVenezuelanVietnameseWelshWest IndianYugoslavian
Ancestry (Percentage)
AfghanAfricanAlbanianAlsatianAmericanApacheArabArgentineanArmenianAssyrian / Chaldean / SyriacAustralianAustrianBahamianBangladeshiBarbadianBasqueBelgianBelizeanBermudanBhutaneseBlackfeetBolivianBrazilianBritishBritish West IndianBulgarianBurmeseCajunCambodianCanadianCape VerdeanCarpatho RusynCelticCentral AmericanCentral American IndianCherokeeChickasawChileanChippewaChoctawColombianCosta RicanCreekCroatianCrowCubanCypriotCzechCzechoslovakianDanishDominicanDutchDutch West IndianEastern EuropeanEcuadorianEgyptianEnglishEstonianEthiopianEuropeanFilipinoFinnishFrenchFrench American IndianFrench CanadianGermanGerman RussianGhanaianGreekGuamanian / ChamorroGuatemalanGuyaneseHaitianHonduranHungarianIcelanderIndian (Asian)IndonesianIranianIraqiIrishIroquoisIsraeliItalianJamaicanJapaneseJordanianKenyanKoreanLaotianLatvianLebaneseLiberianLithuanianLumbeeLuxembourgerMacedonianMalaysianMalteseMexicanMexican American IndianMongolianMoroccanNative HawaiianNavajoNew ZealanderNicaraguanNigerianNorthern EuropeanNorwegianOkinawanPakistaniPalestinianPanamanianParaguayanPennsylvania GermanPeruvianPolishPortuguesePuebloPuerto RicanRomanianRussianSalvadoranSamoanScandinavianScotch-IrishScottishSeminoleSenegaleseSerbianSierra LeoneanSiouxSlavicSlovakSloveneSomaliSouth AfricanSouth AmericanSouth American IndianSoviet UnionSpaniardSpanishSpanish AmericanSpanish American IndianSri LankanSubsaharan AfricanSudaneseSwedishSwissSyrianThaiTrinidadian and TobagonianTurkishU.S. Virgin IslanderUgandanUkrainianUruguayanVenezuelanVietnameseWelshWest IndianYugoslavian
Immigrant Origin (Total)
AfghanistanAfricaAlbaniaArgentinaArmeniaAsiaAustraliaAustriaBahamasBangladeshBarbadosBelarusBelgiumBelizeBoliviaBosnia and HerzegovinaBrazilBulgariaBurma / MyanmarCambodiaCameroonCanadaCaribbeanCentral AmericaChileChinaColombiaCongoCosta RicaCroatiaCubaCzechoslovakiaDenmarkDominicaDominican RepublicEastern AfricaEastern AsiaEastern EuropeEcuadorEgyptEl SalvadorEnglandEritreaEthiopiaEuropeFranceGermanyGhanaGreeceGrenadaGuatemalaGuyanaHaitiHondurasHong KongHungaryIndiaIndonesiaIranIraqIrelandIsraelItalyJamaicaJapanJordanKazakhstanKenyaKoreaKuwaitLaosLatin AmericaLatviaLebanonLiberiaLithuaniaMalaysiaMexicoMicronesiaMiddle AfricaMoldovaMoroccoNepalNetherlandsNicaraguaNigeriaNorth MacedoniaNorthern AfricaNorthern EuropeNorwayOceaniaPakistanPanamaPeruPhilippinesPolandPortugalRomaniaRussiaSaudi ArabiaScotlandSenegalSerbiaSierra LeoneSingaporeSomaliaSouth AfricaSouth AmericaSouth Central AsiaSouth Eastern AsiaSouthern EuropeSpainSri LankaSt. Vincent and the GrenadinesSudanSwedenSwitzerlandSyriaTaiwanThailandTrinidad and TobagoTurkeyUgandaUkraineUruguayUzbekistanVenezuelaVietnamWest IndiesWestern AfricaWestern AsiaWestern EuropeYemenZaireZimbabwe
Immigrant Origin (Percentage)
AfghanistanAfricaAlbaniaArgentinaArmeniaAsiaAustraliaAustriaBahamasBangladeshBarbadosBelarusBelgiumBelizeBoliviaBosnia and HerzegovinaBrazilBulgariaBurma / MyanmarCambodiaCameroonCanadaCaribbeanCentral AmericaChileChinaColombiaCongoCosta RicaCroatiaCubaCzechoslovakiaDenmarkDominicaDominican RepublicEastern AfricaEastern AsiaEastern EuropeEcuadorEgyptEl SalvadorEnglandEritreaEthiopiaEuropeFranceGermanyGhanaGreeceGrenadaGuatemalaGuyanaHaitiHondurasHong KongHungaryIndiaIndonesiaIranIraqIrelandIsraelItalyJamaicaJapanJordanKazakhstanKenyaKoreaKuwaitLaosLatin AmericaLatviaLebanonLiberiaLithuaniaMalaysiaMexicoMicronesiaMiddle AfricaMoldovaMoroccoNepalNetherlandsNicaraguaNigeriaNorth MacedoniaNorthern AfricaNorthern EuropeNorwayOceaniaPakistanPanamaPeruPhilippinesPolandPortugalRomaniaRussiaSaudi ArabiaScotlandSenegalSerbiaSierra LeoneSingaporeSomaliaSouth AfricaSouth AmericaSouth Central AsiaSouth Eastern AsiaSouthern EuropeSpainSri LankaSt. Vincent and the GrenadinesSudanSwedenSwitzerlandSyriaTaiwanThailandTrinidad and TobagoTurkeyUgandaUkraineUruguayUzbekistanVenezuelaVietnamWest IndiesWestern AfricaWestern AsiaWestern EuropeYemenZaireZimbabwe
Income
Income (Families)
Income (Households)
Poverty
Poverty (Families)
Unemployment
Employment Occupations
Employment Industries
Employer Class
Commute Time
Commute Means
School Enrollment
Education by Degree Field
Occupancy
Finances
Physical Characteristics
Brooklyn
Compare Zip Codes
Comparison Subject

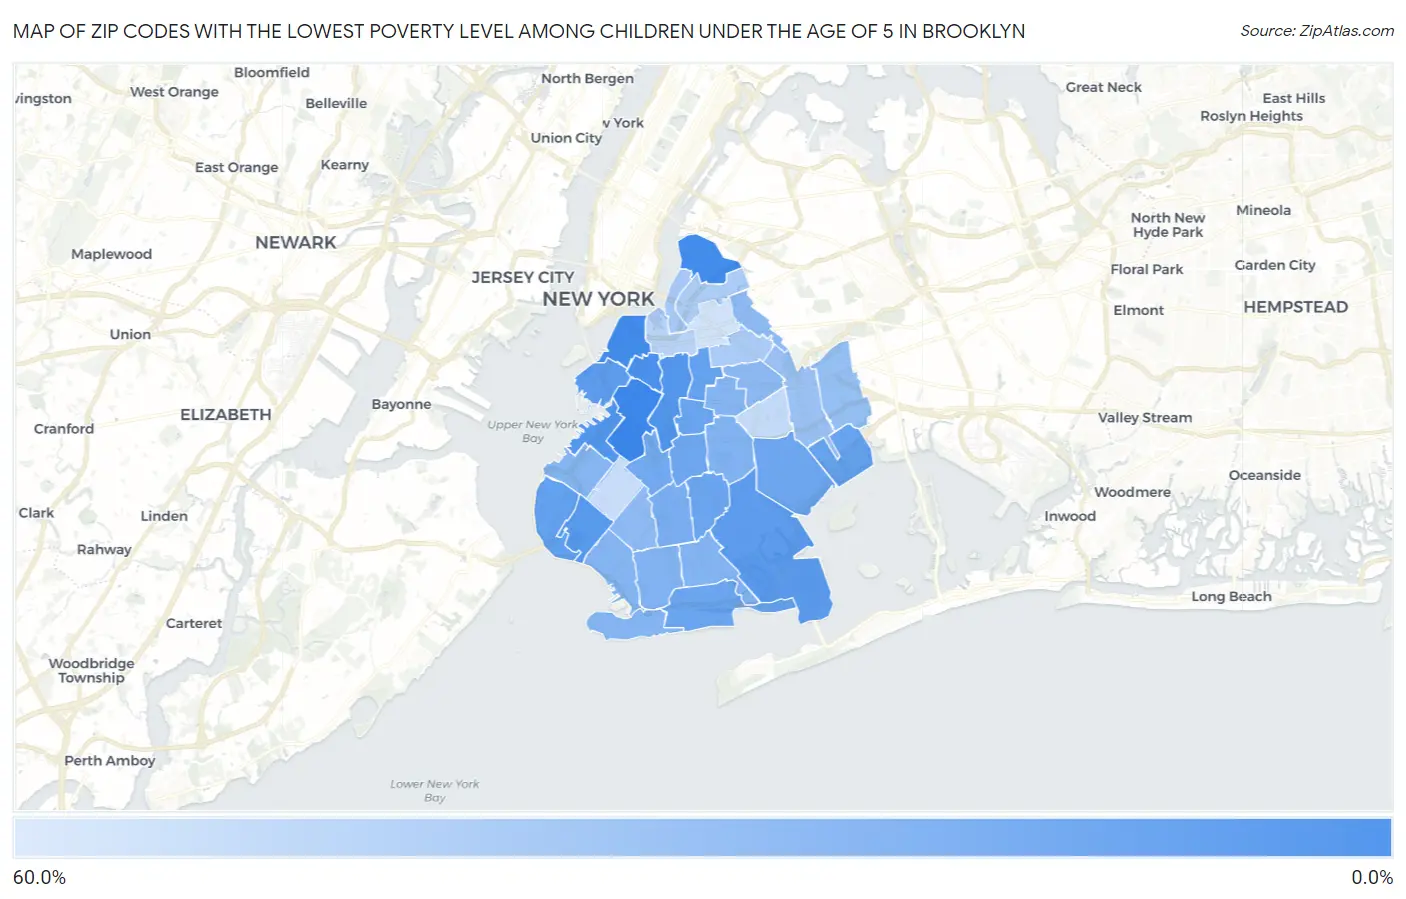
Map of Zip Codes with the Lowest Poverty Level Among Children Under the Age of 5 in Brooklyn

60.0%
0.0%
Zip Codes with the Lowest Poverty Level Among Children Under the Age of 5 in Brooklyn Map

Zip Codes with the Lowest Poverty Level Among Children Under the Age of 5 in Brooklyn, NY

Zip Code Child Poverty vs State vs National
1.112150.71%18.7%(-18.0)#618.1%(-17.4)#133
2.112012.7%18.7%(-16.1)#7618.1%(-15.4)#1,273
3.112222.9%18.7%(-15.9)#8718.1%(-15.2)#1,440
4.112174.5%18.7%(-14.2)#14318.1%(-13.5)#2,599
5.112327.6%18.7%(-11.2)#27318.1%(-10.5)#4,649
6.112388.1%18.7%(-10.6)#29418.1%(-9.92)#5,000
7.112289.6%18.7%(-9.16)#35418.1%(-8.47)#6,024
8.1123110.6%18.7%(-8.11)#38718.1%(-7.42)#6,644
9.1123411.1%18.7%(-7.68)#39918.1%(-7.00)#6,873
10.1120912.1%18.7%(-6.64)#43118.1%(-5.95)#7,529
11.1121613.0%18.7%(-5.70)#44818.1%(-5.02)#8,079
12.1123914.2%18.7%(-4.58)#48718.1%(-3.89)#8,726
13.1122514.2%18.7%(-4.53)#49018.1%(-3.85)#8,749
14.1123514.8%18.7%(-3.93)#50218.1%(-3.24)#9,107
15.1121015.3%18.7%(-3.42)#52518.1%(-2.74)#9,390
16.1122615.6%18.7%(-3.19)#53018.1%(-2.50)#9,525
17.1123615.7%18.7%(-3.03)#53418.1%(-2.35)#9,605
18.1121817.1%18.7%(-1.66)#56618.1%(-0.970)#10,286
19.1123019.8%18.7%(+1.06)#62518.1%(+1.74)#11,539
20.1120322.2%18.7%(+3.45)#67418.1%(+4.14)#12,558
21.1122322.3%18.7%(+3.52)#67918.1%(+4.21)#12,612
22.1122922.7%18.7%(+3.93)#69118.1%(+4.62)#12,785
23.1122023.2%18.7%(+4.43)#70018.1%(+5.12)#12,976
24.1121323.6%18.7%(+4.82)#70918.1%(+5.50)#13,128
25.1122423.8%18.7%(+5.07)#71718.1%(+5.75)#13,249
26.1121423.9%18.7%(+5.16)#71918.1%(+5.85)#13,282
27.1123326.2%18.7%(+7.43)#74618.1%(+8.12)#14,083
28.1123726.5%18.7%(+7.71)#74918.1%(+8.39)#14,178
29.1120426.9%18.7%(+8.20)#75618.1%(+8.88)#14,355
30.1120829.0%18.7%(+10.2)#78918.1%(+10.9)#15,012
31.1120730.9%18.7%(+12.2)#80318.1%(+12.8)#15,549
32.1124935.2%18.7%(+16.4)#85318.1%(+17.1)#16,646
33.1122136.9%18.7%(+18.2)#87418.1%(+18.9)#17,060
34.1121138.1%18.7%(+19.4)#88518.1%(+20.1)#17,293
35.1120542.5%18.7%(+23.8)#91918.1%(+24.5)#18,107
36.1121246.4%18.7%(+27.7)#94818.1%(+28.4)#18,687
37.1121948.3%18.7%(+29.6)#95718.1%(+30.3)#18,897
38.1120652.6%18.7%(+33.8)#97918.1%(+34.5)#19,381

Common Questions

What are the Top 10 Zip Codes with the Lowest Poverty Level Among Children Under the Age of 5 in Brooklyn, NY?
Top 10 Zip Codes with the Lowest Poverty Level Among Children Under the Age of 5 in Brooklyn, NY are:
#1
0.71%
#2
2.7%
#3
2.9%
#4
4.5%
#5
7.6%
#6
8.1%
#7
9.6%
#8
10.6%
#9
11.1%
#10
12.1%
What zip code has the Lowest Poverty Level Among Children Under the Age of 5 in Brooklyn, NY?
11215 has the Lowest Poverty Level Among Children Under the Age of 5 in Brooklyn, NY with 0.71%.
What is the Poverty Level Among Children Under the Age of 5 in New York?
Poverty Level Among Children Under the Age of 5 in New York is 18.7%.
What is the Poverty Level Among Children Under the Age of 5 in the United States?
Poverty Level Among Children Under the Age of 5 in the United States is 18.1%.