Scotia, NY Map & Demographics
Scotia Map
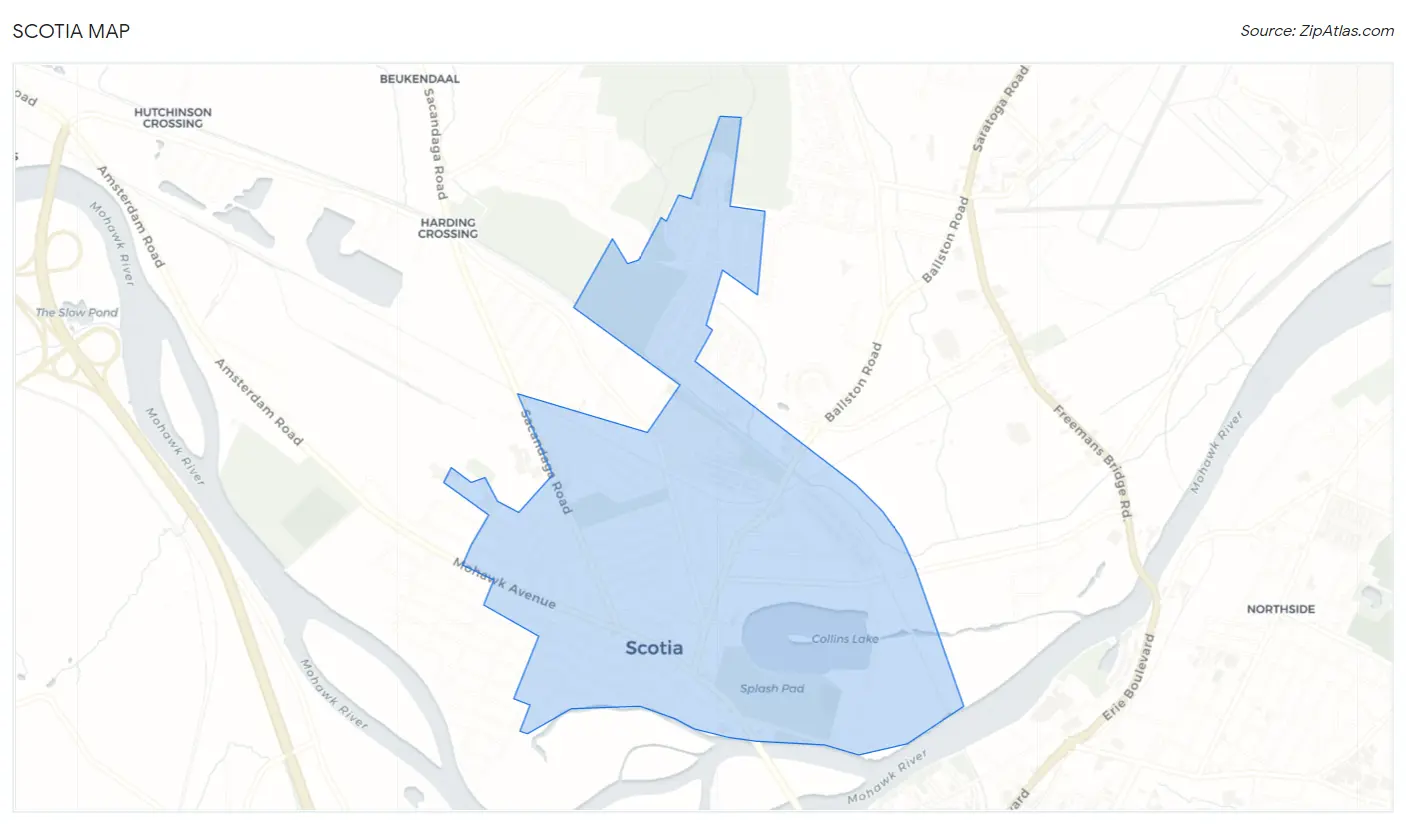
Scotia Overview
$39,461
PER CAPITA INCOME
$98,977
AVG FAMILY INCOME
$66,736
AVG HOUSEHOLD INCOME
27.3%
WAGE / INCOME GAP [ % ]
72.7¢/ $1
WAGE / INCOME GAP [ $ ]
$9,949
FAMILY INCOME DEFICIT
0.41
INEQUALITY / GINI INDEX
7,292
TOTAL POPULATION
3,255
MALE POPULATION
4,037
FEMALE POPULATION
80.63
MALES / 100 FEMALES
124.02
FEMALES / 100 MALES
37.4
MEDIAN AGE
3.1
AVG FAMILY SIZE
2.3
AVG HOUSEHOLD SIZE
4,112
LABOR FORCE [ PEOPLE ]
68.2%
PERCENT IN LABOR FORCE
2.2%
UNEMPLOYMENT RATE
Scotia Area Codes
Income in Scotia
Income Overview in Scotia
Per Capita Income in Scotia is $39,461, while median incomes of families and households are $98,977 and $66,736 respectively.
| Characteristic | Number | Measure |
| Per Capita Income | 7,292 | $39,461 |
| Median Family Income | 1,698 | $98,977 |
| Mean Family Income | 1,698 | $112,732 |
| Median Household Income | 3,156 | $66,736 |
| Mean Household Income | 3,156 | $85,290 |
| Income Deficit | 1,698 | $9,949 |
| Wage / Income Gap (%) | 7,292 | 27.32% |
| Wage / Income Gap ($) | 7,292 | 72.68¢ per $1 |
| Gini / Inequality Index | 7,292 | 0.41 |
Earnings by Sex in Scotia
Average Earnings in Scotia are $45,800, $56,804 for men and $41,286 for women, a difference of 27.3%.
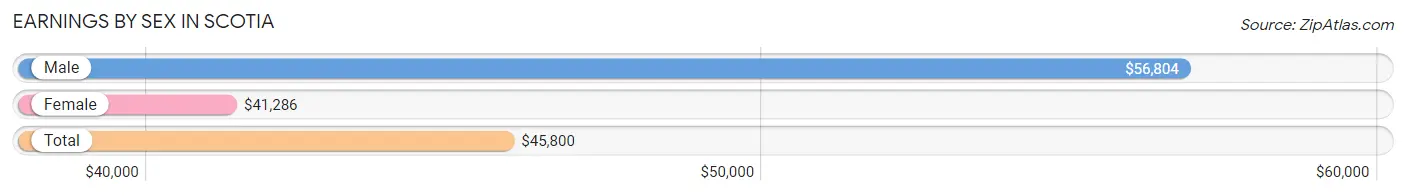
| Sex | Number | Average Earnings |
| Male | 1,903 (46.0%) | $56,804 |
| Female | 2,230 (54.0%) | $41,286 |
| Total | 4,133 (100.0%) | $45,800 |
Earnings by Sex by Income Bracket in Scotia
The most common earnings brackets in Scotia are $100,000+ for men (354 | 18.6%) and $25,000 to $29,999 for women (297 | 13.3%).
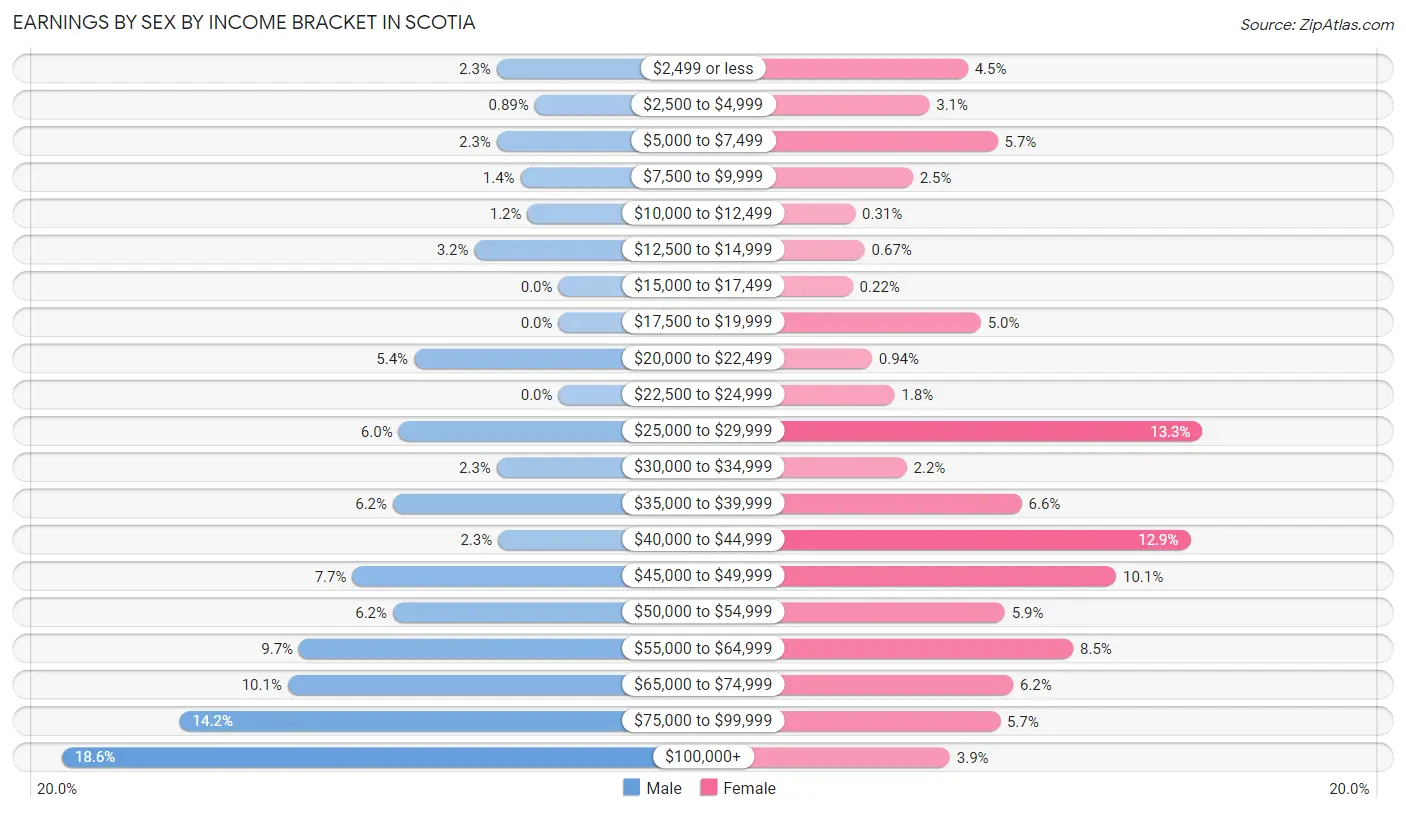
| Income | Male | Female |
| $2,499 or less | 44 (2.3%) | 101 (4.5%) |
| $2,500 to $4,999 | 17 (0.9%) | 69 (3.1%) |
| $5,000 to $7,499 | 44 (2.3%) | 126 (5.7%) |
| $7,500 to $9,999 | 27 (1.4%) | 55 (2.5%) |
| $10,000 to $12,499 | 22 (1.2%) | 7 (0.3%) |
| $12,500 to $14,999 | 60 (3.2%) | 15 (0.7%) |
| $15,000 to $17,499 | 0 (0.0%) | 5 (0.2%) |
| $17,500 to $19,999 | 0 (0.0%) | 112 (5.0%) |
| $20,000 to $22,499 | 103 (5.4%) | 21 (0.9%) |
| $22,500 to $24,999 | 0 (0.0%) | 40 (1.8%) |
| $25,000 to $29,999 | 114 (6.0%) | 297 (13.3%) |
| $30,000 to $34,999 | 44 (2.3%) | 50 (2.2%) |
| $35,000 to $39,999 | 118 (6.2%) | 146 (6.6%) |
| $40,000 to $44,999 | 43 (2.3%) | 287 (12.9%) |
| $45,000 to $49,999 | 147 (7.7%) | 225 (10.1%) |
| $50,000 to $54,999 | 118 (6.2%) | 132 (5.9%) |
| $55,000 to $64,999 | 185 (9.7%) | 189 (8.5%) |
| $65,000 to $74,999 | 193 (10.1%) | 139 (6.2%) |
| $75,000 to $99,999 | 270 (14.2%) | 128 (5.7%) |
| $100,000+ | 354 (18.6%) | 86 (3.9%) |
| Total | 1,903 (100.0%) | 2,230 (100.0%) |
Earnings by Sex by Educational Attainment in Scotia
Average earnings in Scotia are $65,510 for men and $42,111 for women, a difference of 35.7%. Men with an educational attainment of graduate degree enjoy the highest average annual earnings of $110,313, while those with high school diploma education earn the least with $42,778. Women with an educational attainment of bachelor's degree earn the most with the average annual earnings of $46,855, while those with graduate degree education have the smallest earnings of $27,097.
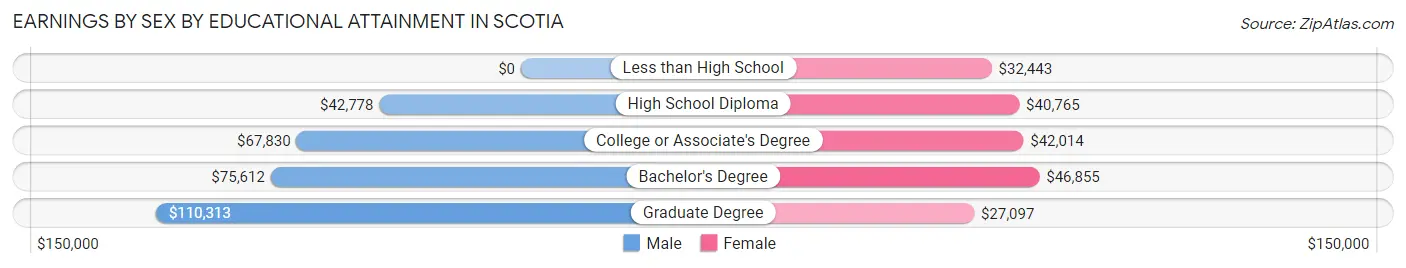
| Educational Attainment | Male Income | Female Income |
| Less than High School | - | - |
| High School Diploma | $42,778 | $40,765 |
| College or Associate's Degree | $67,830 | $42,014 |
| Bachelor's Degree | $75,612 | $46,855 |
| Graduate Degree | $110,313 | $27,097 |
| Total | $65,510 | $42,111 |
Family Income in Scotia
Family Income Brackets in Scotia
According to the Scotia family income data, there are 430 families falling into the $100,000 to $149,999 income range, which is the most common income bracket and makes up 25.3% of all families.
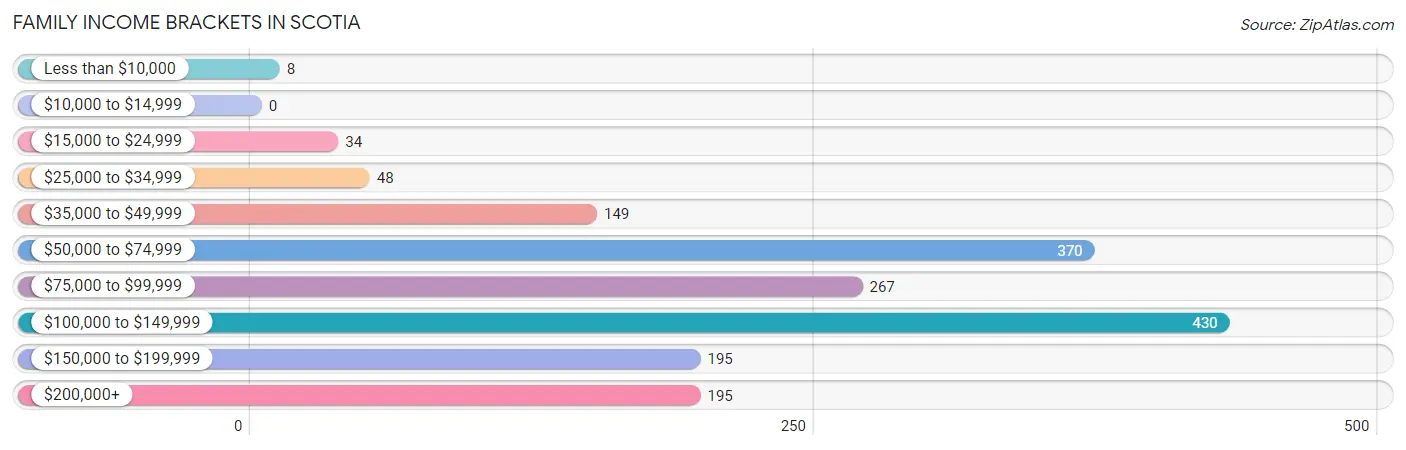
| Income Bracket | # Families | % Families |
| Less than $10,000 | 8 | 0.5% |
| $10,000 to $14,999 | 0 | 0.0% |
| $15,000 to $24,999 | 34 | 2.0% |
| $25,000 to $34,999 | 48 | 2.8% |
| $35,000 to $49,999 | 149 | 8.8% |
| $50,000 to $74,999 | 370 | 21.8% |
| $75,000 to $99,999 | 267 | 15.7% |
| $100,000 to $149,999 | 430 | 25.3% |
| $150,000 to $199,999 | 195 | 11.5% |
| $200,000+ | 195 | 11.5% |
Family Income by Famaliy Size in Scotia
6-person families (59 | 3.5%) account for the highest median family income in Scotia with $136,169 per family, while 2-person families (897 | 52.8%) have the highest median income of $38,418 per family member.
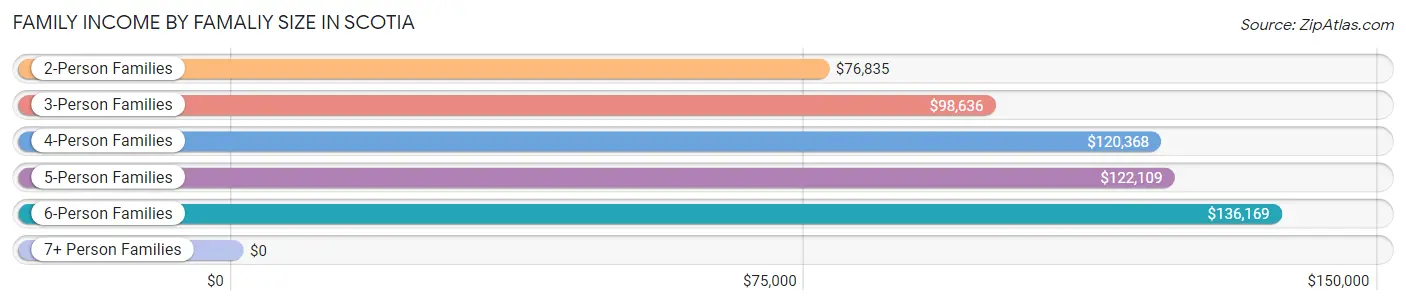
| Income Bracket | # Families | Median Income |
| 2-Person Families | 897 (52.8%) | $76,835 |
| 3-Person Families | 366 (21.5%) | $98,636 |
| 4-Person Families | 205 (12.1%) | $120,368 |
| 5-Person Families | 171 (10.1%) | $122,109 |
| 6-Person Families | 59 (3.5%) | $136,169 |
| 7+ Person Families | 0 (0.0%) | $0 |
| Total | 1,698 (100.0%) | $98,977 |
Family Income by Number of Earners in Scotia
The median family income in Scotia is $98,977, with families comprising 3+ earners (192) having the highest median family income of $169,318, while families with no earners (139) have the lowest median family income of $62,361, accounting for 11.3% and 8.2% of families, respectively.
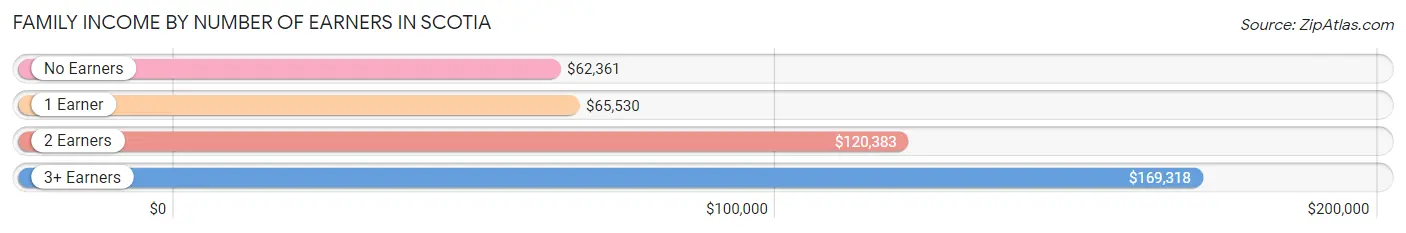
| Number of Earners | # Families | Median Income |
| No Earners | 139 (8.2%) | $62,361 |
| 1 Earner | 622 (36.6%) | $65,530 |
| 2 Earners | 745 (43.9%) | $120,383 |
| 3+ Earners | 192 (11.3%) | $169,318 |
| Total | 1,698 (100.0%) | $98,977 |
Household Income in Scotia
Household Income Brackets in Scotia
With 723 households falling in the category, the $100,000 to $149,999 income range is the most frequent in Scotia, accounting for 22.9% of all households. In contrast, only 35 households (1.1%) fall into the less than $10,000 income bracket, making it the least populous group.
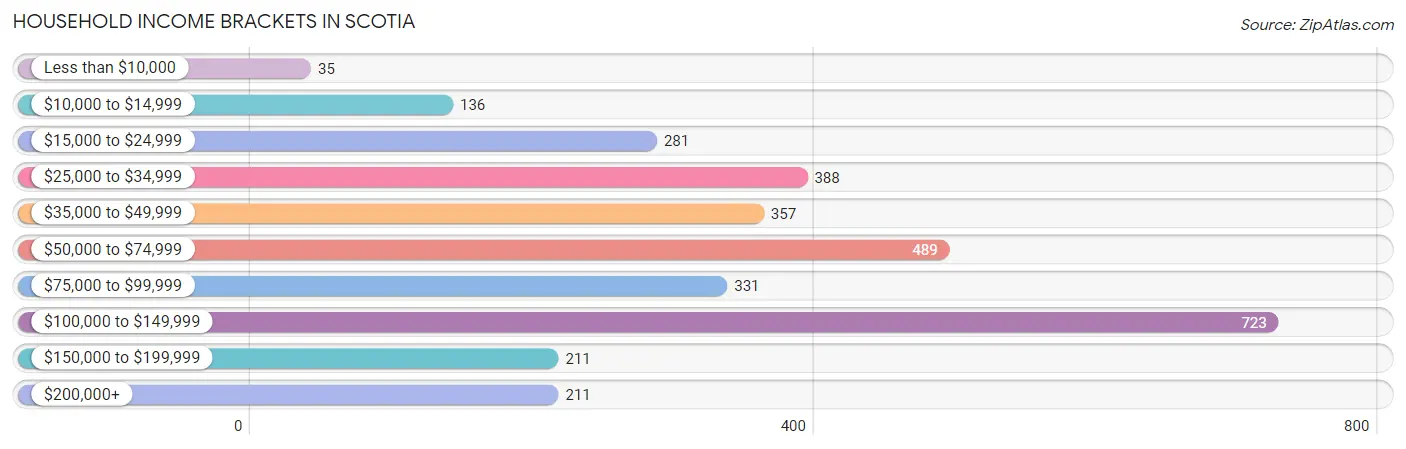
| Income Bracket | # Households | % Households |
| Less than $10,000 | 35 | 1.1% |
| $10,000 to $14,999 | 136 | 4.3% |
| $15,000 to $24,999 | 281 | 8.9% |
| $25,000 to $34,999 | 388 | 12.3% |
| $35,000 to $49,999 | 357 | 11.3% |
| $50,000 to $74,999 | 489 | 15.5% |
| $75,000 to $99,999 | 331 | 10.5% |
| $100,000 to $149,999 | 723 | 22.9% |
| $150,000 to $199,999 | 211 | 6.7% |
| $200,000+ | 211 | 6.7% |
Household Income by Householder Age in Scotia
The median household income in Scotia is $66,736, with the highest median household income of $94,010 found in the 45 to 64 years age bracket for the primary householder. A total of 1,101 households (34.9%) fall into this category. Meanwhile, the 65+ years age bracket for the primary householder has the lowest median household income of $51,250, with 850 households (26.9%) in this group.
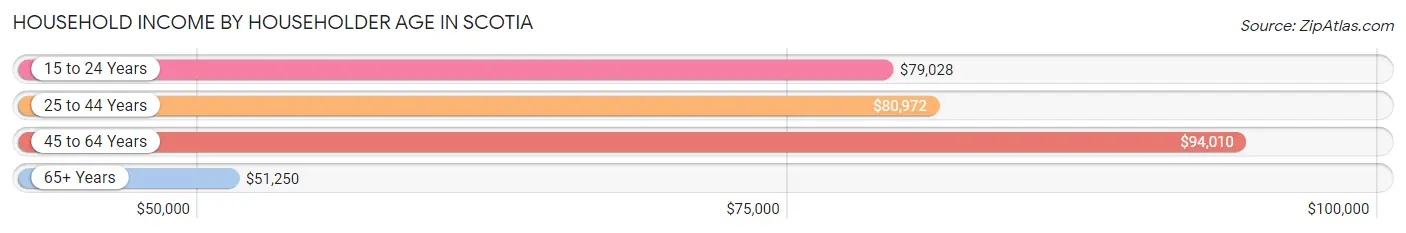
| Income Bracket | # Households | Median Income |
| 15 to 24 Years | 66 (2.1%) | $79,028 |
| 25 to 44 Years | 1,139 (36.1%) | $80,972 |
| 45 to 64 Years | 1,101 (34.9%) | $94,010 |
| 65+ Years | 850 (26.9%) | $51,250 |
| Total | 3,156 (100.0%) | $66,736 |
Poverty in Scotia
Income Below Poverty by Sex and Age in Scotia
With 5.1% poverty level for males and 5.7% for females among the residents of Scotia, 5 year old males and 15 year old females are the most vulnerable to poverty, with 23 males (65.7%) and 6 females (54.5%) in their respective age groups living below the poverty level.
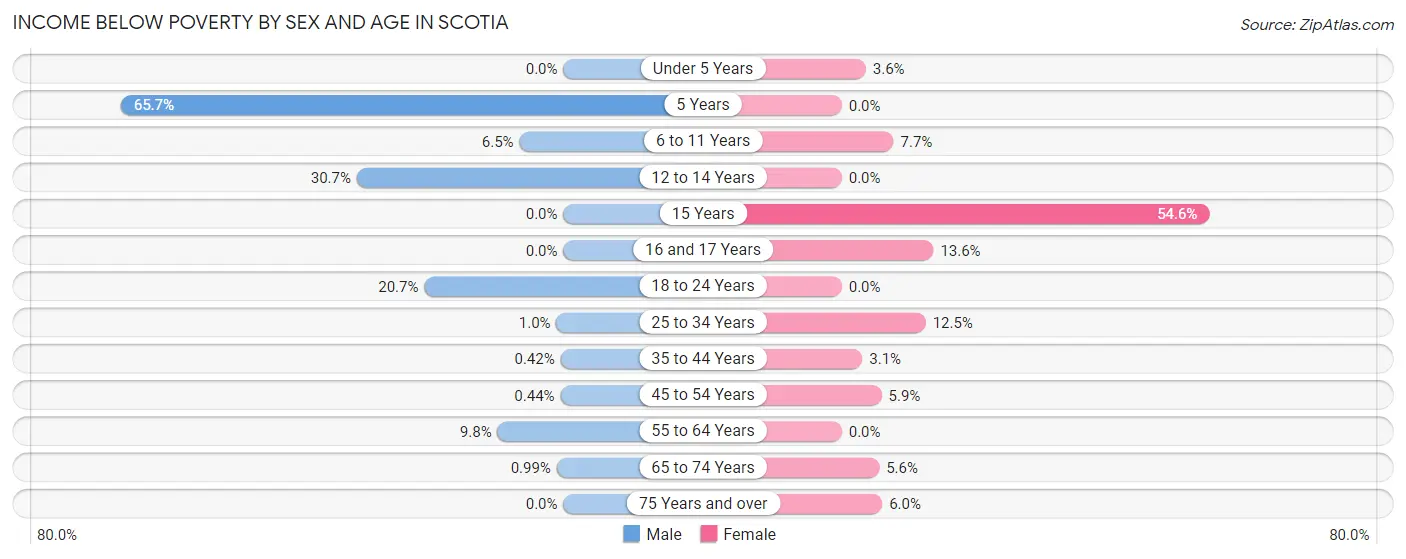
| Age Bracket | Male | Female |
| Under 5 Years | 0 (0.0%) | 8 (3.6%) |
| 5 Years | 23 (65.7%) | 0 (0.0%) |
| 6 to 11 Years | 24 (6.5%) | 21 (7.7%) |
| 12 to 14 Years | 23 (30.7%) | 0 (0.0%) |
| 15 Years | 0 (0.0%) | 6 (54.5%) |
| 16 and 17 Years | 0 (0.0%) | 23 (13.6%) |
| 18 to 24 Years | 57 (20.6%) | 0 (0.0%) |
| 25 to 34 Years | 5 (1.0%) | 87 (12.5%) |
| 35 to 44 Years | 2 (0.4%) | 15 (3.0%) |
| 45 to 54 Years | 2 (0.4%) | 27 (5.9%) |
| 55 to 64 Years | 27 (9.8%) | 0 (0.0%) |
| 65 to 74 Years | 3 (1.0%) | 19 (5.6%) |
| 75 Years and over | 0 (0.0%) | 21 (6.0%) |
| Total | 166 (5.1%) | 227 (5.7%) |
Income Above Poverty by Sex and Age in Scotia
According to the poverty statistics in Scotia, males aged under 5 years and females aged 5 years are the age groups that are most secure financially, with 100.0% of males and 100.0% of females in these age groups living above the poverty line.
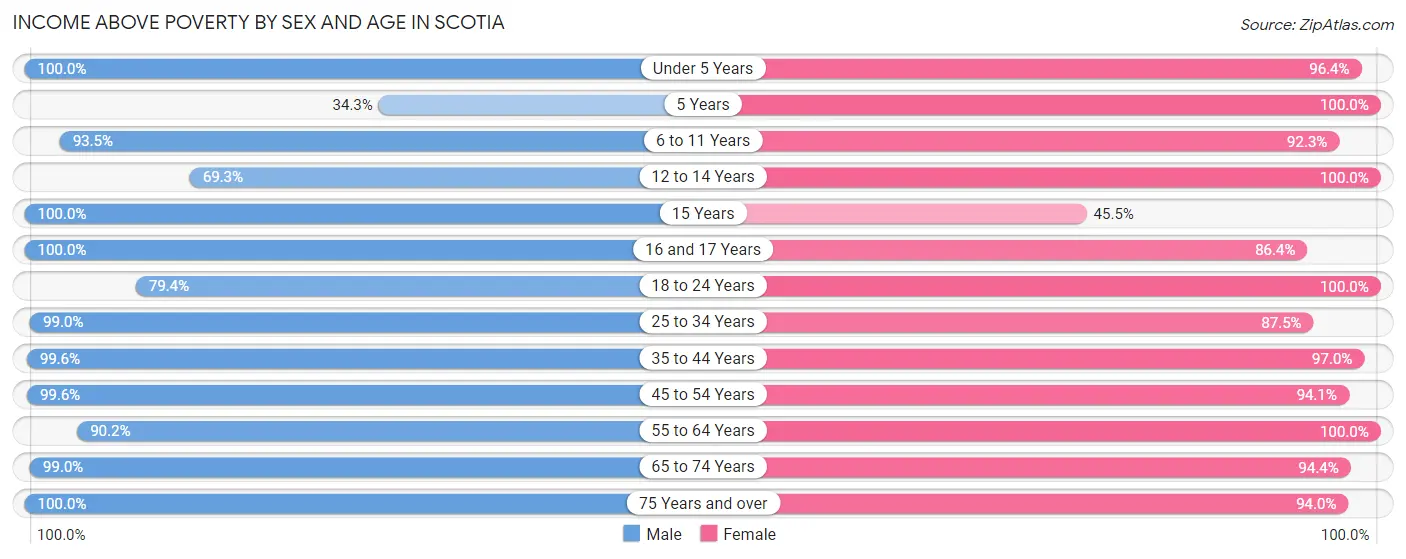
| Age Bracket | Male | Female |
| Under 5 Years | 120 (100.0%) | 216 (96.4%) |
| 5 Years | 12 (34.3%) | 16 (100.0%) |
| 6 to 11 Years | 344 (93.5%) | 252 (92.3%) |
| 12 to 14 Years | 52 (69.3%) | 69 (100.0%) |
| 15 Years | 68 (100.0%) | 5 (45.5%) |
| 16 and 17 Years | 163 (100.0%) | 146 (86.4%) |
| 18 to 24 Years | 219 (79.3%) | 383 (100.0%) |
| 25 to 34 Years | 482 (99.0%) | 611 (87.5%) |
| 35 to 44 Years | 474 (99.6%) | 476 (97.0%) |
| 45 to 54 Years | 452 (99.6%) | 430 (94.1%) |
| 55 to 64 Years | 249 (90.2%) | 478 (100.0%) |
| 65 to 74 Years | 300 (99.0%) | 323 (94.4%) |
| 75 Years and over | 136 (100.0%) | 329 (94.0%) |
| Total | 3,071 (94.9%) | 3,734 (94.3%) |
Income Below Poverty Among Married-Couple Families in Scotia
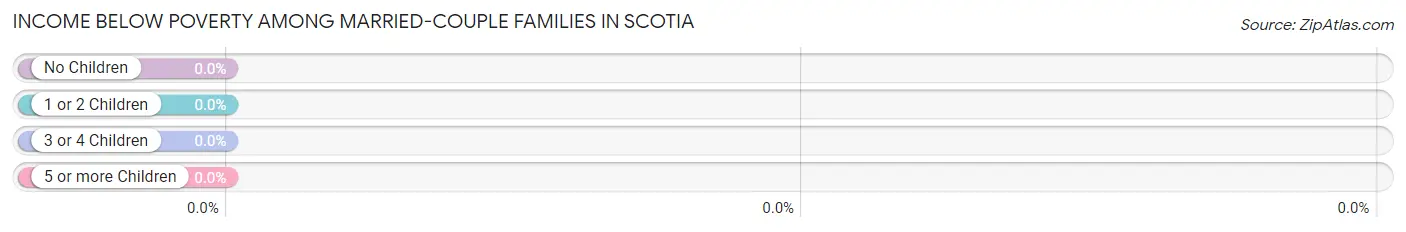
| Children | Above Poverty | Below Poverty |
| No Children | 650 (100.0%) | 0 (0.0%) |
| 1 or 2 Children | 472 (100.0%) | 0 (0.0%) |
| 3 or 4 Children | 98 (100.0%) | 0 (0.0%) |
| 5 or more Children | 0 (0.0%) | 0 (0.0%) |
| Total | 1,220 (100.0%) | 0 (0.0%) |
Income Below Poverty Among Single-Parent Households in Scotia
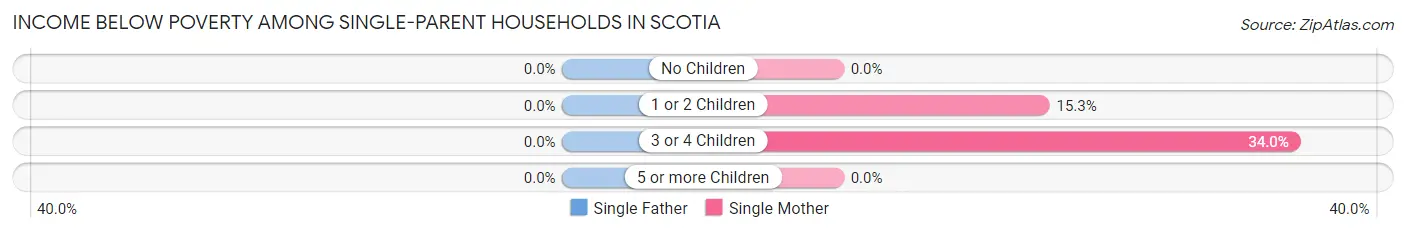
| Children | Single Father | Single Mother |
| No Children | 0 (0.0%) | 0 (0.0%) |
| 1 or 2 Children | 0 (0.0%) | 27 (15.3%) |
| 3 or 4 Children | 0 (0.0%) | 16 (34.0%) |
| 5 or more Children | 0 (0.0%) | 0 (0.0%) |
| Total | 0 (0.0%) | 43 (12.7%) |
Income Below Poverty Among Married-Couple vs Single-Parent Households in Scotia
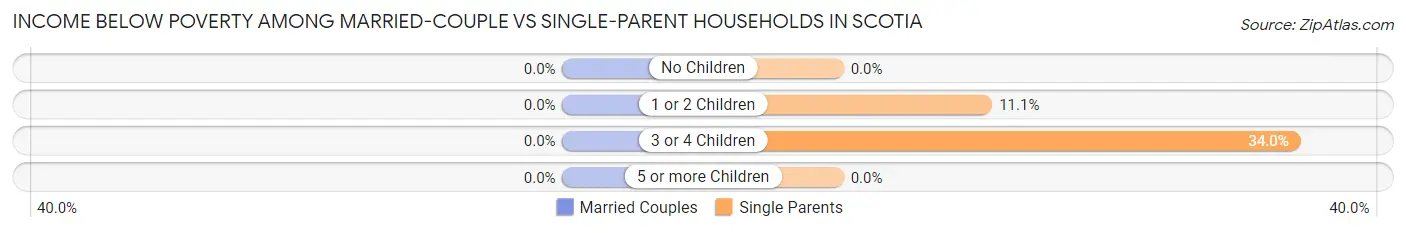
| Children | Married-Couple Families | Single-Parent Households |
| No Children | 0 (0.0%) | 0 (0.0%) |
| 1 or 2 Children | 0 (0.0%) | 27 (11.1%) |
| 3 or 4 Children | 0 (0.0%) | 16 (34.0%) |
| 5 or more Children | 0 (0.0%) | 0 (0.0%) |
| Total | 0 (0.0%) | 43 (9.0%) |
Race in Scotia
The most populous races in Scotia are White / Caucasian (6,785 | 93.0%), Two or more Races (439 | 6.0%), and Hispanic or Latino (320 | 4.4%).
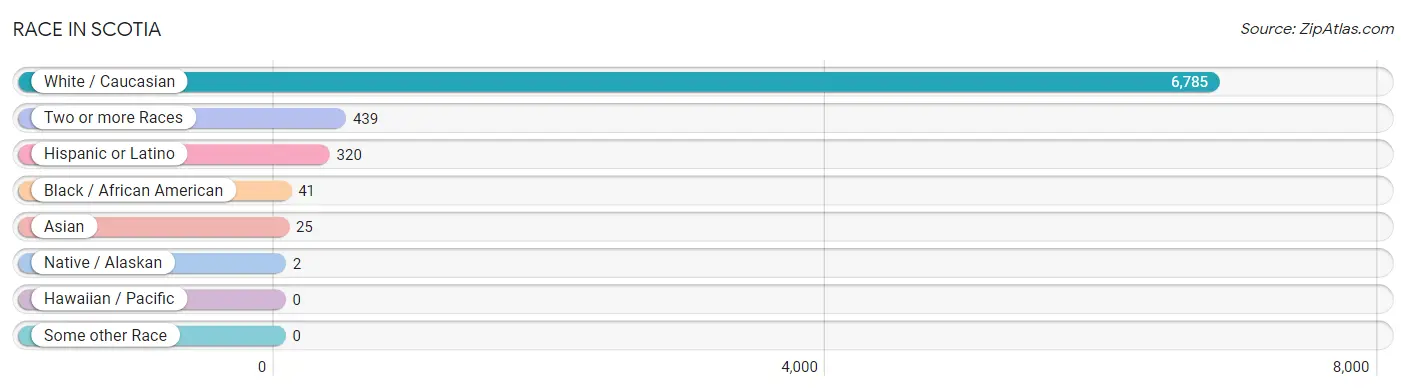
| Race | # Population | % Population |
| Asian | 25 | 0.3% |
| Black / African American | 41 | 0.6% |
| Hawaiian / Pacific | 0 | 0.0% |
| Hispanic or Latino | 320 | 4.4% |
| Native / Alaskan | 2 | 0.0% |
| White / Caucasian | 6,785 | 93.0% |
| Two or more Races | 439 | 6.0% |
| Some other Race | 0 | 0.0% |
| Total | 7,292 | 100.0% |
Ancestry in Scotia
The most populous ancestries reported in Scotia are Irish (1,532 | 21.0%), Italian (1,366 | 18.7%), German (934 | 12.8%), English (863 | 11.8%), and Polish (579 | 7.9%), together accounting for 72.3% of all Scotia residents.
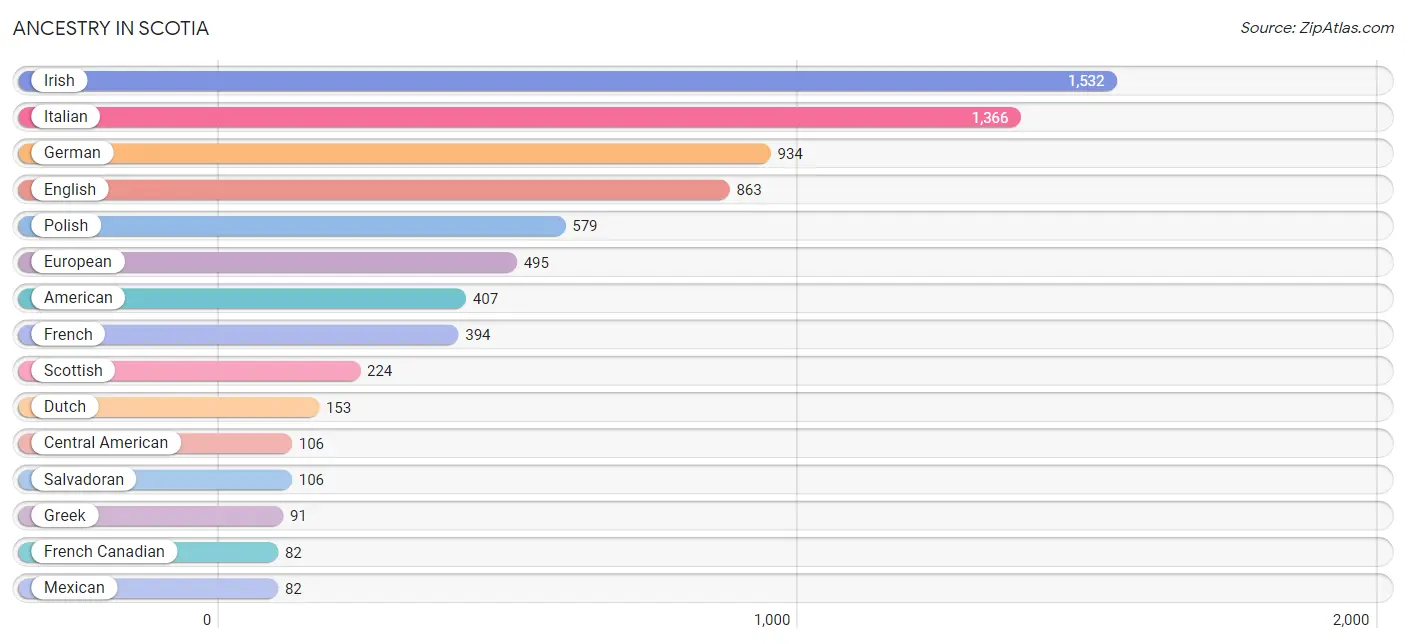
| Ancestry | # Population | % Population |
| American | 407 | 5.6% |
| Bahamian | 1 | 0.0% |
| British | 11 | 0.2% |
| Burmese | 18 | 0.3% |
| Canadian | 6 | 0.1% |
| Central American | 106 | 1.5% |
| Czech | 36 | 0.5% |
| Czechoslovakian | 20 | 0.3% |
| Dominican | 22 | 0.3% |
| Dutch | 153 | 2.1% |
| English | 863 | 11.8% |
| European | 495 | 6.8% |
| Finnish | 18 | 0.3% |
| French | 394 | 5.4% |
| French Canadian | 82 | 1.1% |
| German | 934 | 12.8% |
| Greek | 91 | 1.3% |
| Haitian | 2 | 0.0% |
| Hungarian | 58 | 0.8% |
| Irish | 1,532 | 21.0% |
| Iroquois | 6 | 0.1% |
| Italian | 1,366 | 18.7% |
| Jamaican | 27 | 0.4% |
| Korean | 5 | 0.1% |
| Lithuanian | 51 | 0.7% |
| Mexican | 82 | 1.1% |
| Pakistani | 19 | 0.3% |
| Polish | 579 | 7.9% |
| Puerto Rican | 59 | 0.8% |
| Romanian | 17 | 0.2% |
| Russian | 14 | 0.2% |
| Salvadoran | 106 | 1.5% |
| Scandinavian | 13 | 0.2% |
| Scotch-Irish | 54 | 0.7% |
| Scottish | 224 | 3.1% |
| Spaniard | 24 | 0.3% |
| Swedish | 26 | 0.4% |
| Swiss | 24 | 0.3% |
| Ukrainian | 25 | 0.3% |
| Welsh | 32 | 0.4% | View All 40 Rows |
Immigrants in Scotia
The most numerous immigrant groups reported in Scotia came from Asia (25 | 0.3%), Europe (23 | 0.3%), Canada (19 | 0.3%), Central America (16 | 0.2%), and El Salvador (16 | 0.2%), together accounting for 1.4% of all Scotia residents.
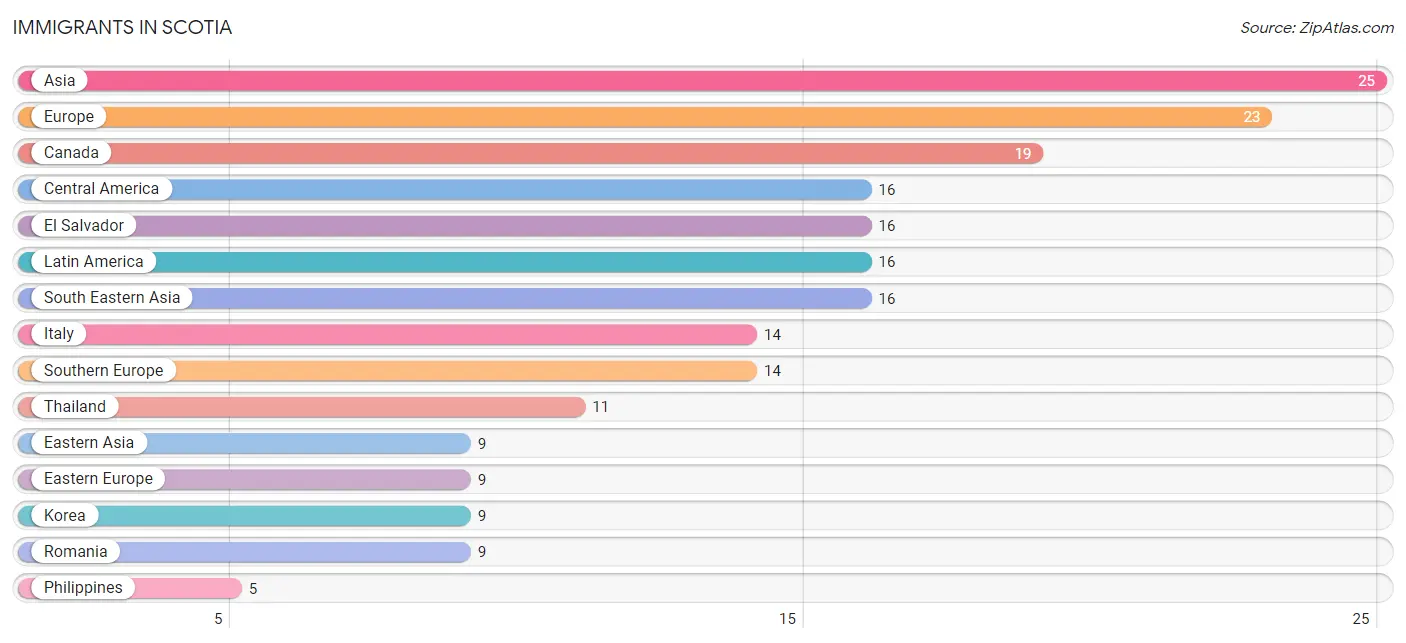
| Immigration Origin | # Population | % Population |
| Asia | 25 | 0.3% |
| Canada | 19 | 0.3% |
| Central America | 16 | 0.2% |
| Eastern Asia | 9 | 0.1% |
| Eastern Europe | 9 | 0.1% |
| El Salvador | 16 | 0.2% |
| Europe | 23 | 0.3% |
| Italy | 14 | 0.2% |
| Korea | 9 | 0.1% |
| Latin America | 16 | 0.2% |
| Philippines | 5 | 0.1% |
| Romania | 9 | 0.1% |
| South Eastern Asia | 16 | 0.2% |
| Southern Europe | 14 | 0.2% |
| Thailand | 11 | 0.2% | View All 15 Rows |
Sex and Age in Scotia
Sex and Age in Scotia
The most populous age groups in Scotia are 25 to 29 Years (326 | 10.0%) for men and 30 to 34 Years (414 | 10.3%) for women.
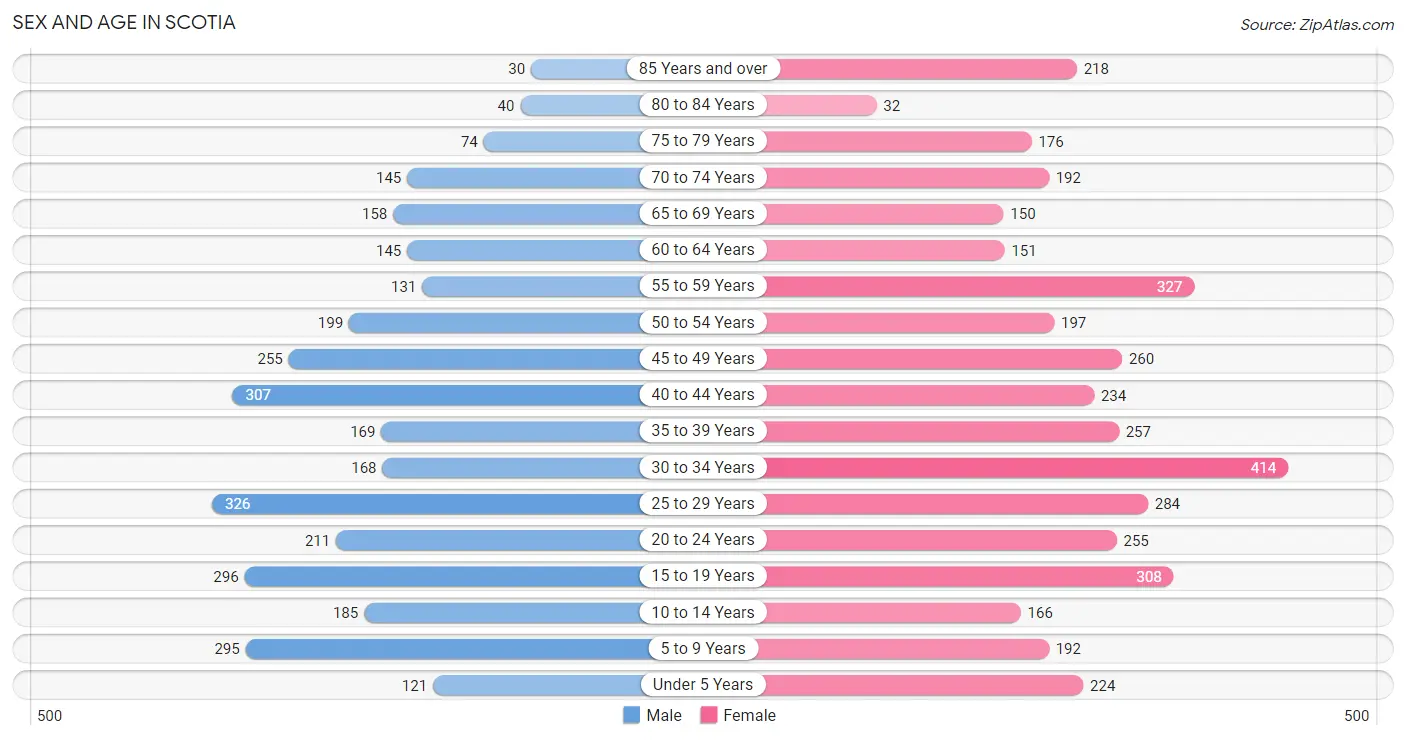
| Age Bracket | Male | Female |
| Under 5 Years | 121 (3.7%) | 224 (5.6%) |
| 5 to 9 Years | 295 (9.1%) | 192 (4.8%) |
| 10 to 14 Years | 185 (5.7%) | 166 (4.1%) |
| 15 to 19 Years | 296 (9.1%) | 308 (7.6%) |
| 20 to 24 Years | 211 (6.5%) | 255 (6.3%) |
| 25 to 29 Years | 326 (10.0%) | 284 (7.0%) |
| 30 to 34 Years | 168 (5.2%) | 414 (10.3%) |
| 35 to 39 Years | 169 (5.2%) | 257 (6.4%) |
| 40 to 44 Years | 307 (9.4%) | 234 (5.8%) |
| 45 to 49 Years | 255 (7.8%) | 260 (6.4%) |
| 50 to 54 Years | 199 (6.1%) | 197 (4.9%) |
| 55 to 59 Years | 131 (4.0%) | 327 (8.1%) |
| 60 to 64 Years | 145 (4.4%) | 151 (3.7%) |
| 65 to 69 Years | 158 (4.9%) | 150 (3.7%) |
| 70 to 74 Years | 145 (4.4%) | 192 (4.8%) |
| 75 to 79 Years | 74 (2.3%) | 176 (4.4%) |
| 80 to 84 Years | 40 (1.2%) | 32 (0.8%) |
| 85 Years and over | 30 (0.9%) | 218 (5.4%) |
| Total | 3,255 (100.0%) | 4,037 (100.0%) |
Families and Households in Scotia
Median Family Size in Scotia
The median family size in Scotia is 3.12 persons per family, with single female/mother families (339 | 20.0%) accounting for the largest median family size of 3.19 persons per family. On the other hand, single male/father families (139 | 8.2%) represent the smallest median family size with 2.43 persons per family.
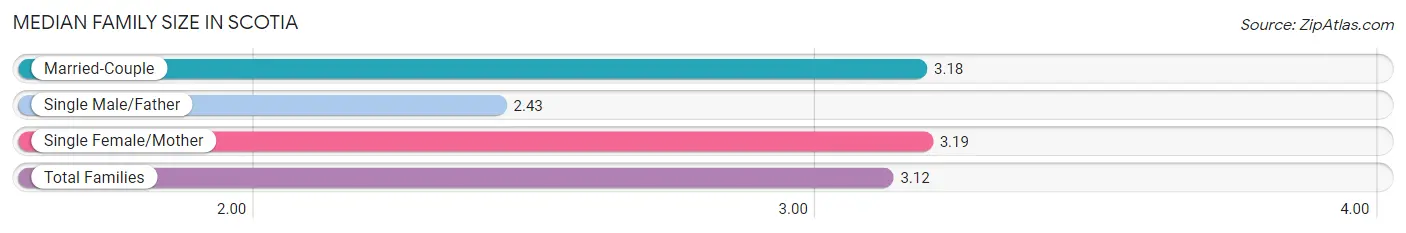
| Family Type | # Families | Family Size |
| Married-Couple | 1,220 (71.9%) | 3.18 |
| Single Male/Father | 139 (8.2%) | 2.43 |
| Single Female/Mother | 339 (20.0%) | 3.19 |
| Total Families | 1,698 (100.0%) | 3.12 |
Median Household Size in Scotia
The median household size in Scotia is 2.28 persons per household, with single female/mother households (339 | 10.7%) accounting for the largest median household size of 3.4 persons per household. non-family households (1,458 | 46.2%) represent the smallest median household size with 1.22 persons per household.
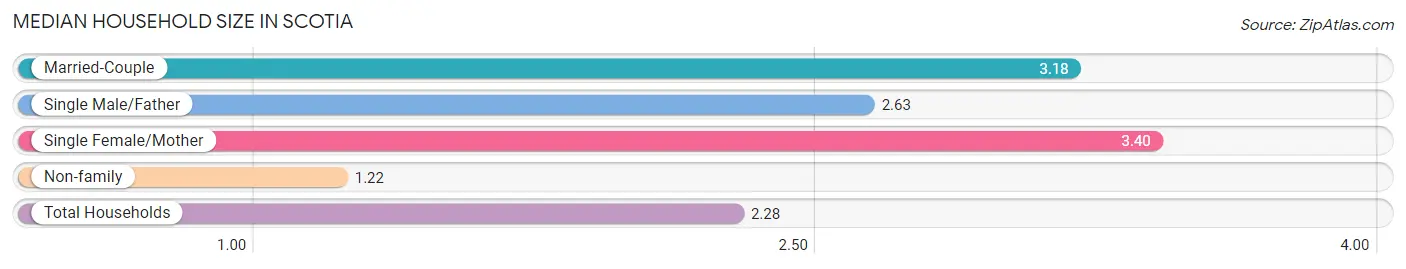
| Household Type | # Households | Household Size |
| Married-Couple | 1,220 (38.7%) | 3.18 |
| Single Male/Father | 139 (4.4%) | 2.63 |
| Single Female/Mother | 339 (10.7%) | 3.40 |
| Non-family | 1,458 (46.2%) | 1.22 |
| Total Households | 3,156 (100.0%) | 2.28 |
Household Size by Marriage Status in Scotia
Out of a total of 3,156 households in Scotia, 1,698 (53.8%) are family households, while 1,458 (46.2%) are nonfamily households. The most numerous type of family households are 2-person households, comprising 803, and the most common type of nonfamily households are 1-person households, comprising 1,091.
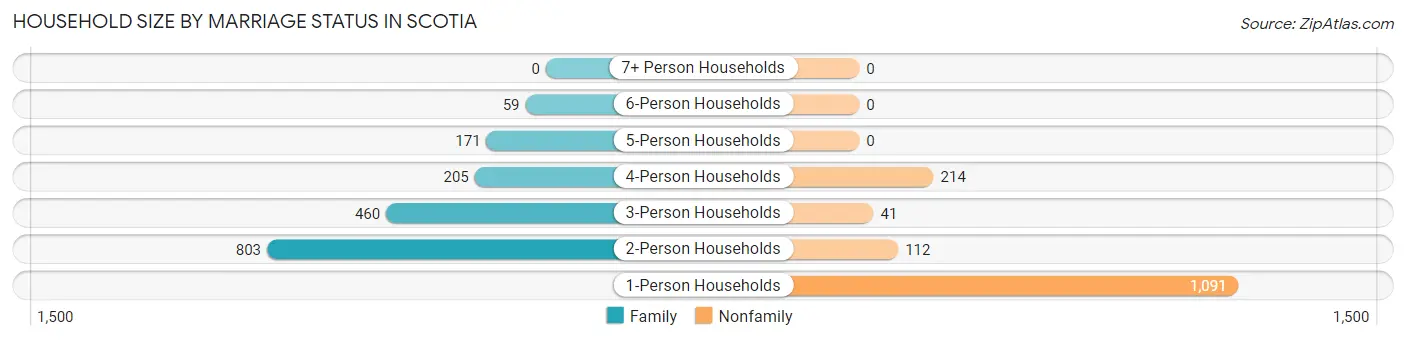
| Household Size | Family Households | Nonfamily Households |
| 1-Person Households | - | 1,091 (34.6%) |
| 2-Person Households | 803 (25.4%) | 112 (3.5%) |
| 3-Person Households | 460 (14.6%) | 41 (1.3%) |
| 4-Person Households | 205 (6.5%) | 214 (6.8%) |
| 5-Person Households | 171 (5.4%) | 0 (0.0%) |
| 6-Person Households | 59 (1.9%) | 0 (0.0%) |
| 7+ Person Households | 0 (0.0%) | 0 (0.0%) |
| Total | 1,698 (53.8%) | 1,458 (46.2%) |
Female Fertility in Scotia
Fertility by Age in Scotia
Average fertility rate in Scotia is 25.0 births per 1,000 women. Women in the age bracket of 20 to 34 years have the highest fertility rate with 45.0 births per 1,000 women. Women in the age bracket of 20 to 34 years acount for 82.7% of all women with births.
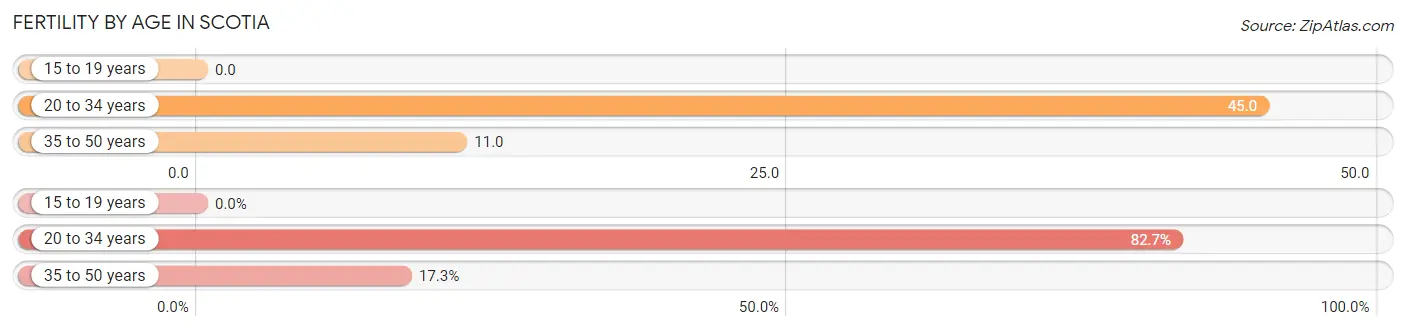
| Age Bracket | Women with Births | Births / 1,000 Women |
| 15 to 19 years | 0 (0.0%) | 0.0 |
| 20 to 34 years | 43 (82.7%) | 45.0 |
| 35 to 50 years | 9 (17.3%) | 11.0 |
| Total | 52 (100.0%) | 25.0 |
Fertility by Age by Marriage Status in Scotia
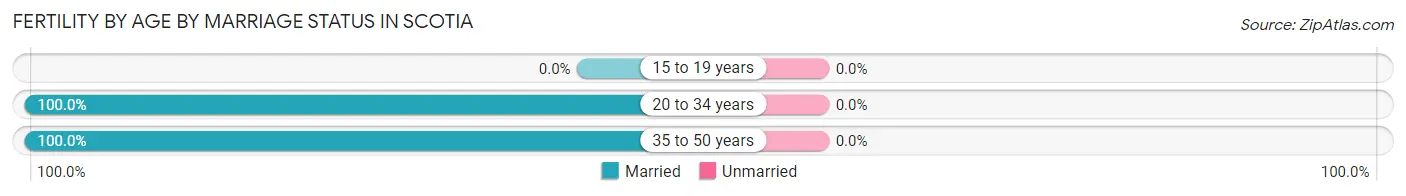
| Age Bracket | Married | Unmarried |
| 15 to 19 years | 0 (0.0%) | 0 (0.0%) |
| 20 to 34 years | 43 (100.0%) | 0 (0.0%) |
| 35 to 50 years | 9 (100.0%) | 0 (0.0%) |
| Total | 52 (100.0%) | 0 (0.0%) |
Fertility by Education in Scotia
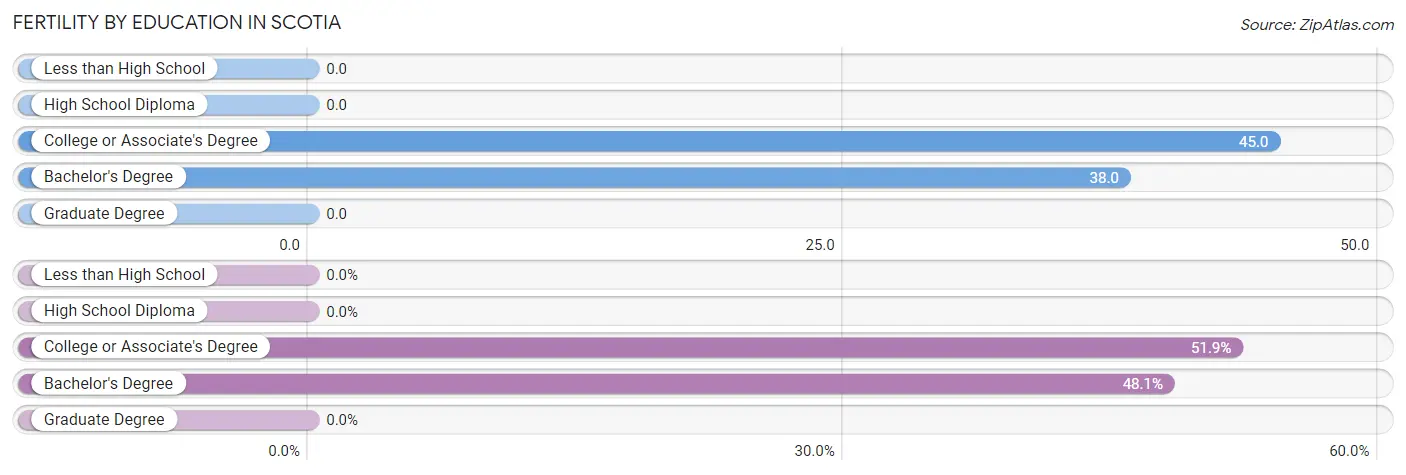
| Educational Attainment | Women with Births | Births / 1,000 Women |
| Less than High School | 0 (0.0%) | 0.0 |
| High School Diploma | 0 (0.0%) | 0.0 |
| College or Associate's Degree | 27 (51.9%) | 45.0 |
| Bachelor's Degree | 25 (48.1%) | 38.0 |
| Graduate Degree | 0 (0.0%) | 0.0 |
| Total | 52 (100.0%) | 25.0 |
Fertility by Education by Marriage Status in Scotia
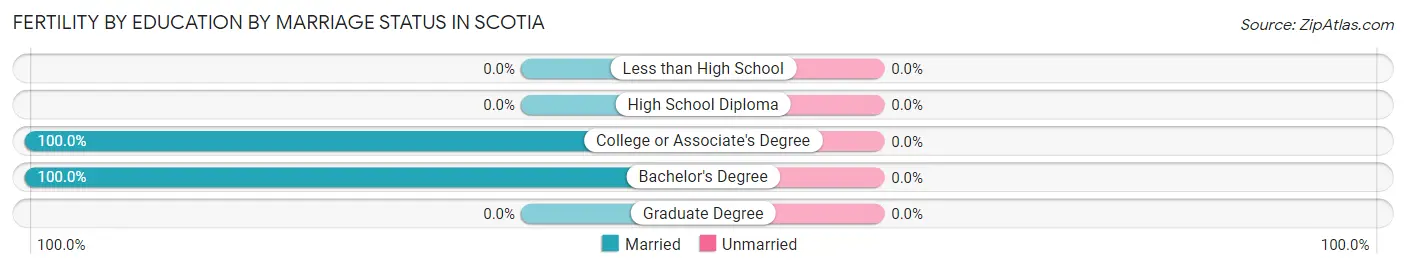
| Educational Attainment | Married | Unmarried |
| Less than High School | 0 (0.0%) | 0 (0.0%) |
| High School Diploma | 0 (0.0%) | 0 (0.0%) |
| College or Associate's Degree | 27 (100.0%) | 0 (0.0%) |
| Bachelor's Degree | 25 (100.0%) | 0 (0.0%) |
| Graduate Degree | 0 (0.0%) | 0 (0.0%) |
| Total | 52 (100.0%) | 0 (0.0%) |
Employment Characteristics in Scotia
Employment by Class of Employer in Scotia
Among the 3,972 employed individuals in Scotia, private company employees (2,390 | 60.2%), not-for-profit organizations (759 | 19.1%), and state government employees (418 | 10.5%) make up the most common classes of employment.
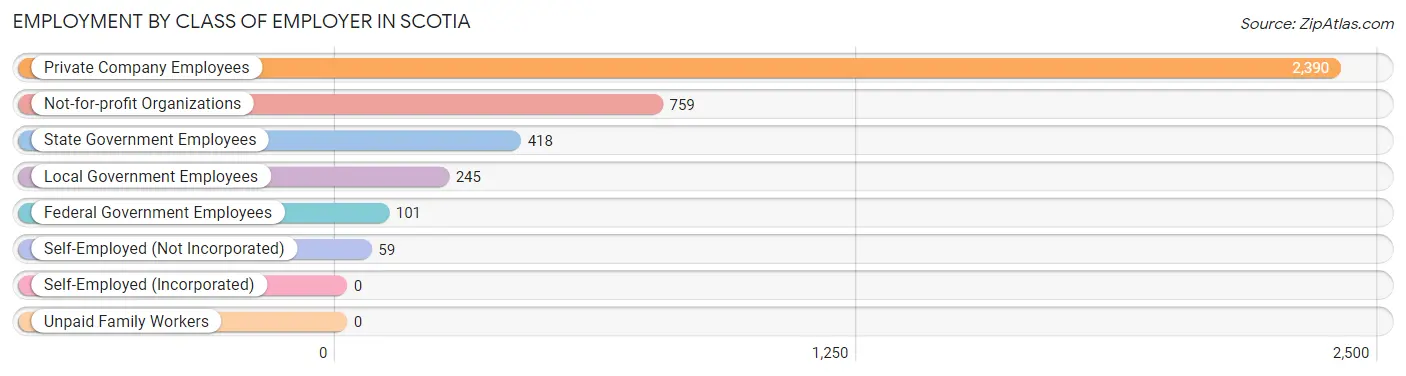
| Employer Class | # Employees | % Employees |
| Private Company Employees | 2,390 | 60.2% |
| Self-Employed (Incorporated) | 0 | 0.0% |
| Self-Employed (Not Incorporated) | 59 | 1.5% |
| Not-for-profit Organizations | 759 | 19.1% |
| Local Government Employees | 245 | 6.2% |
| State Government Employees | 418 | 10.5% |
| Federal Government Employees | 101 | 2.5% |
| Unpaid Family Workers | 0 | 0.0% |
| Total | 3,972 | 100.0% |
Employment Status by Age in Scotia
According to the labor force statistics for Scotia, out of the total population over 16 years of age (6,030), 68.2% or 4,112 individuals are in the labor force, with 2.2% or 90 of them unemployed. The age group with the highest labor force participation rate is 20 to 24 years, with 100.0% or 466 individuals in the labor force. Within the labor force, the 16 to 19 years age range has the highest percentage of unemployed individuals, with 34.2% or 52 of them being unemployed.
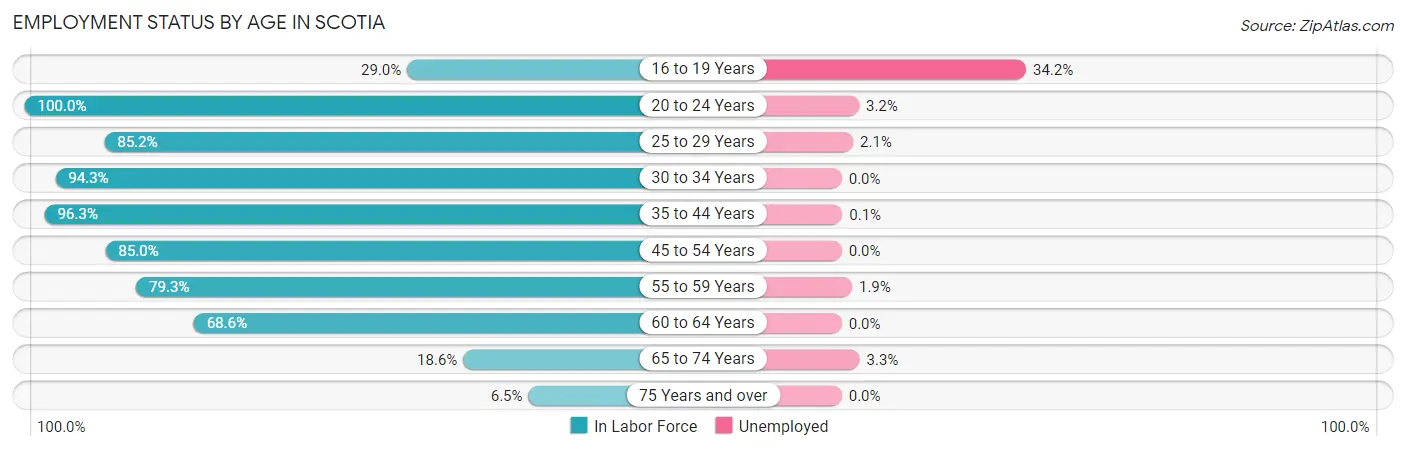
| Age Bracket | In Labor Force | Unemployed |
| 16 to 19 Years | 152 (29.0%) | 52 (34.2%) |
| 20 to 24 Years | 466 (100.0%) | 15 (3.2%) |
| 25 to 29 Years | 520 (85.2%) | 11 (2.1%) |
| 30 to 34 Years | 549 (94.3%) | 0 (0.0%) |
| 35 to 44 Years | 931 (96.3%) | 1 (0.1%) |
| 45 to 54 Years | 774 (85.0%) | 0 (0.0%) |
| 55 to 59 Years | 363 (79.3%) | 7 (1.9%) |
| 60 to 64 Years | 203 (68.6%) | 0 (0.0%) |
| 65 to 74 Years | 120 (18.6%) | 4 (3.3%) |
| 75 Years and over | 37 (6.5%) | 0 (0.0%) |
| Total | 4,112 (68.2%) | 90 (2.2%) |
Employment Status by Educational Attainment in Scotia
According to labor force statistics for Scotia, 87.3% of individuals (3,338) out of the total population between 25 and 64 years of age (3,824) are in the labor force, with 0.6% or 20 of them being unemployed. The group with the highest labor force participation rate are those with the educational attainment of bachelor's degree or higher, with 97.3% or 1,530 individuals in the labor force. Within the labor force, individuals with college / associate degree education have the highest percentage of unemployment, with 0.7% or 8 of them being unemployed.
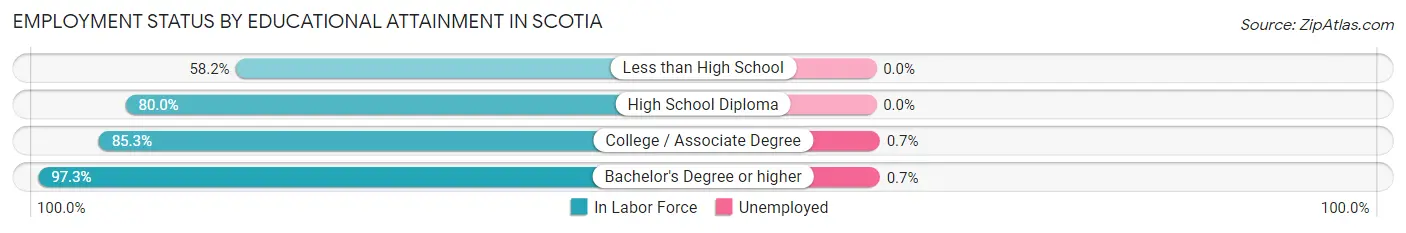
| Educational Attainment | In Labor Force | Unemployed |
| Less than High School | 164 (58.2%) | 0 (0.0%) |
| High School Diploma | 503 (80.0%) | 0 (0.0%) |
| College / Associate Degree | 1,144 (85.3%) | 9 (0.7%) |
| Bachelor's Degree or higher | 1,530 (97.3%) | 11 (0.7%) |
| Total | 3,338 (87.3%) | 23 (0.6%) |
Employment Occupations by Sex in Scotia
Management, Business, Science and Arts Occupations
The most common Management, Business, Science and Arts occupations in Scotia are Management (471 | 11.7%), Health Diagnosing & Treating (358 | 8.9%), Community & Social Service (327 | 8.1%), Computers, Engineering & Science (267 | 6.7%), and Business & Financial (189 | 4.7%).
Management, Business, Science and Arts Occupations by Sex
Within the Management, Business, Science and Arts occupations in Scotia, the most male-oriented occupations are Architecture & Engineering (100.0%), Arts, Media & Entertainment (100.0%), and Computers & Mathematics (63.9%), while the most female-oriented occupations are Health Technologists (100.0%), Health Diagnosing & Treating (91.1%), and Education Instruction & Library (80.6%).
| Occupation | Male | Female |
| Management | 225 (47.8%) | 246 (52.2%) |
| Business & Financial | 46 (24.3%) | 143 (75.7%) |
| Computers, Engineering & Science | 155 (58.1%) | 112 (41.9%) |
| Computers & Mathematics | 85 (63.9%) | 48 (36.1%) |
| Architecture & Engineering | 48 (100.0%) | 0 (0.0%) |
| Life, Physical & Social Science | 22 (25.6%) | 64 (74.4%) |
| Community & Social Service | 131 (40.1%) | 196 (59.9%) |
| Education, Arts & Media | 41 (38.0%) | 67 (62.0%) |
| Legal Services & Support | 0 (0.0%) | 0 (0.0%) |
| Education Instruction & Library | 31 (19.4%) | 129 (80.6%) |
| Arts, Media & Entertainment | 59 (100.0%) | 0 (0.0%) |
| Health Diagnosing & Treating | 32 (8.9%) | 326 (91.1%) |
| Health Technologists | 0 (0.0%) | 135 (100.0%) |
| Total (Category) | 589 (36.5%) | 1,023 (63.5%) |
| Total (Overall) | 1,827 (45.5%) | 2,189 (54.5%) |
Services Occupations
The most common Services occupations in Scotia are Personal Care & Service (130 | 3.2%), Food Preparation & Serving (121 | 3.0%), Security & Protection (117 | 2.9%), Healthcare Support (111 | 2.8%), and Firefighting & Prevention (104 | 2.6%).
Services Occupations by Sex
Within the Services occupations in Scotia, the most male-oriented occupations are Security & Protection (100.0%), Firefighting & Prevention (100.0%), and Law Enforcement (100.0%), while the most female-oriented occupations are Personal Care & Service (100.0%), Healthcare Support (80.2%), and Cleaning & Maintenance (67.4%).
| Occupation | Male | Female |
| Healthcare Support | 22 (19.8%) | 89 (80.2%) |
| Security & Protection | 117 (100.0%) | 0 (0.0%) |
| Firefighting & Prevention | 104 (100.0%) | 0 (0.0%) |
| Law Enforcement | 13 (100.0%) | 0 (0.0%) |
| Food Preparation & Serving | 54 (44.6%) | 67 (55.4%) |
| Cleaning & Maintenance | 28 (32.6%) | 58 (67.4%) |
| Personal Care & Service | 0 (0.0%) | 130 (100.0%) |
| Total (Category) | 221 (39.1%) | 344 (60.9%) |
| Total (Overall) | 1,827 (45.5%) | 2,189 (54.5%) |
Sales and Office Occupations
The most common Sales and Office occupations in Scotia are Office & Administration (639 | 15.9%), and Sales & Related (448 | 11.2%).

Sales and Office Occupations by Sex

| Occupation | Male | Female |
| Sales & Related | 289 (64.5%) | 159 (35.5%) |
| Office & Administration | 214 (33.5%) | 425 (66.5%) |
| Total (Category) | 503 (46.3%) | 584 (53.7%) |
| Total (Overall) | 1,827 (45.5%) | 2,189 (54.5%) |
Natural Resources, Construction and Maintenance Occupations
The most common Natural Resources, Construction and Maintenance occupations in Scotia are Farming, Fishing & Forestry (186 | 4.6%), Construction & Extraction (133 | 3.3%), and Installation, Maintenance & Repair (77 | 1.9%).
Natural Resources, Construction and Maintenance Occupations by Sex
| Occupation | Male | Female |
| Farming, Fishing & Forestry | 0 (0.0%) | 186 (100.0%) |
| Construction & Extraction | 133 (100.0%) | 0 (0.0%) |
| Installation, Maintenance & Repair | 77 (100.0%) | 0 (0.0%) |
| Total (Category) | 210 (53.0%) | 186 (47.0%) |
| Total (Overall) | 1,827 (45.5%) | 2,189 (54.5%) |
Production, Transportation and Moving Occupations
The most common Production, Transportation and Moving occupations in Scotia are Material Moving (171 | 4.3%), Production (168 | 4.2%), and Transportation (17 | 0.4%).
Production, Transportation and Moving Occupations by Sex
| Occupation | Male | Female |
| Production | 132 (78.6%) | 36 (21.4%) |
| Transportation | 17 (100.0%) | 0 (0.0%) |
| Material Moving | 155 (90.6%) | 16 (9.4%) |
| Total (Category) | 304 (85.4%) | 52 (14.6%) |
| Total (Overall) | 1,827 (45.5%) | 2,189 (54.5%) |
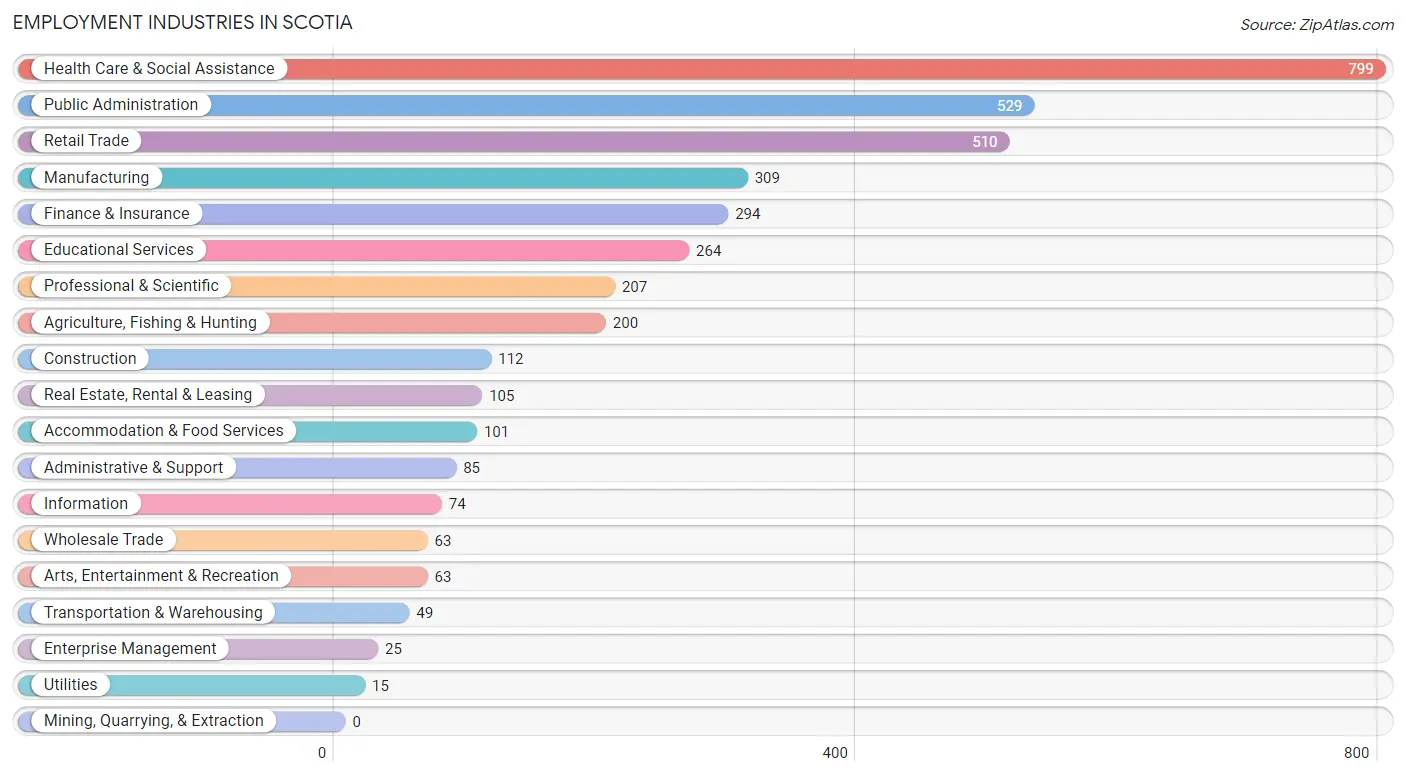
Employment Industries by Sex in Scotia
Employment Industries in Scotia
The major employment industries in Scotia include Health Care & Social Assistance (799 | 19.9%), Public Administration (529 | 13.2%), Retail Trade (510 | 12.7%), Manufacturing (309 | 7.7%), and Finance & Insurance (294 | 7.3%).
Employment Industries by Sex in Scotia
The Scotia industries that see more men than women are Wholesale Trade (100.0%), Transportation & Warehousing (100.0%), and Utilities (100.0%), whereas the industries that tend to have a higher number of women are Agriculture, Fishing & Hunting (93.0%), Health Care & Social Assistance (89.5%), and Administrative & Support (89.4%).
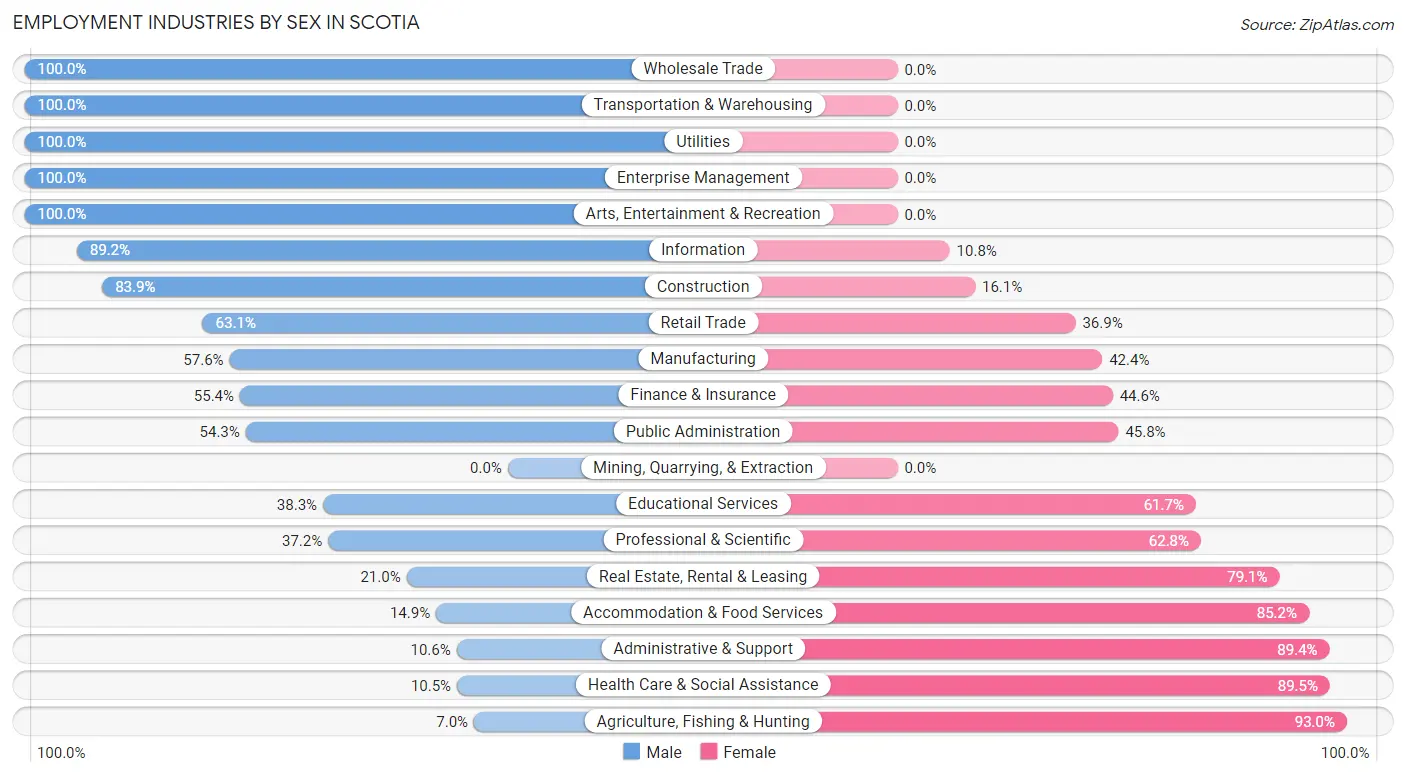
| Industry | Male | Female |
| Agriculture, Fishing & Hunting | 14 (7.0%) | 186 (93.0%) |
| Mining, Quarrying, & Extraction | 0 (0.0%) | 0 (0.0%) |
| Construction | 94 (83.9%) | 18 (16.1%) |
| Manufacturing | 178 (57.6%) | 131 (42.4%) |
| Wholesale Trade | 63 (100.0%) | 0 (0.0%) |
| Retail Trade | 322 (63.1%) | 188 (36.9%) |
| Transportation & Warehousing | 49 (100.0%) | 0 (0.0%) |
| Utilities | 15 (100.0%) | 0 (0.0%) |
| Information | 66 (89.2%) | 8 (10.8%) |
| Finance & Insurance | 163 (55.4%) | 131 (44.6%) |
| Real Estate, Rental & Leasing | 22 (20.9%) | 83 (79.0%) |
| Professional & Scientific | 77 (37.2%) | 130 (62.8%) |
| Enterprise Management | 25 (100.0%) | 0 (0.0%) |
| Administrative & Support | 9 (10.6%) | 76 (89.4%) |
| Educational Services | 101 (38.3%) | 163 (61.7%) |
| Health Care & Social Assistance | 84 (10.5%) | 715 (89.5%) |
| Arts, Entertainment & Recreation | 63 (100.0%) | 0 (0.0%) |
| Accommodation & Food Services | 15 (14.8%) | 86 (85.2%) |
| Public Administration | 287 (54.2%) | 242 (45.8%) |
| Total | 1,827 (45.5%) | 2,189 (54.5%) |
Education in Scotia
School Enrollment in Scotia
The most common levels of schooling among the 1,828 students in Scotia are elementary school (469 | 25.7%), college / undergraduate (467 | 25.6%), and high school (450 | 24.6%).
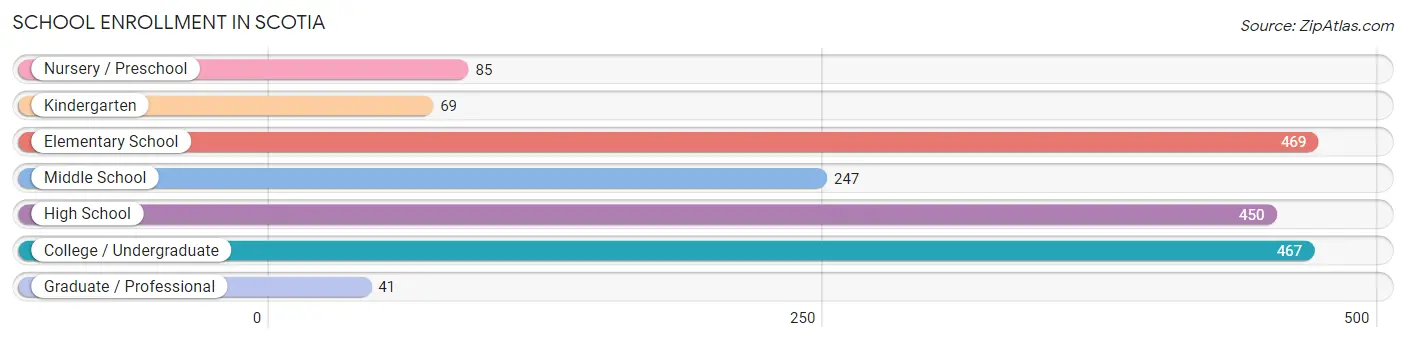
| School Level | # Students | % Students |
| Nursery / Preschool | 85 | 4.6% |
| Kindergarten | 69 | 3.8% |
| Elementary School | 469 | 25.7% |
| Middle School | 247 | 13.5% |
| High School | 450 | 24.6% |
| College / Undergraduate | 467 | 25.6% |
| Graduate / Professional | 41 | 2.2% |
| Total | 1,828 | 100.0% |
School Enrollment by Age by Funding Source in Scotia
Out of a total of 1,828 students who are enrolled in schools in Scotia, 133 (7.3%) attend a private institution, while the remaining 1,695 (92.7%) are enrolled in public schools. The age group of 3 to 4 year olds has the highest likelihood of being enrolled in private schools, with 85 (100.0% in the age bracket) enrolled. Conversely, the age group of 10 to 14 year olds has the lowest likelihood of being enrolled in a private school, with 351 (100.0% in the age bracket) attending a public institution.
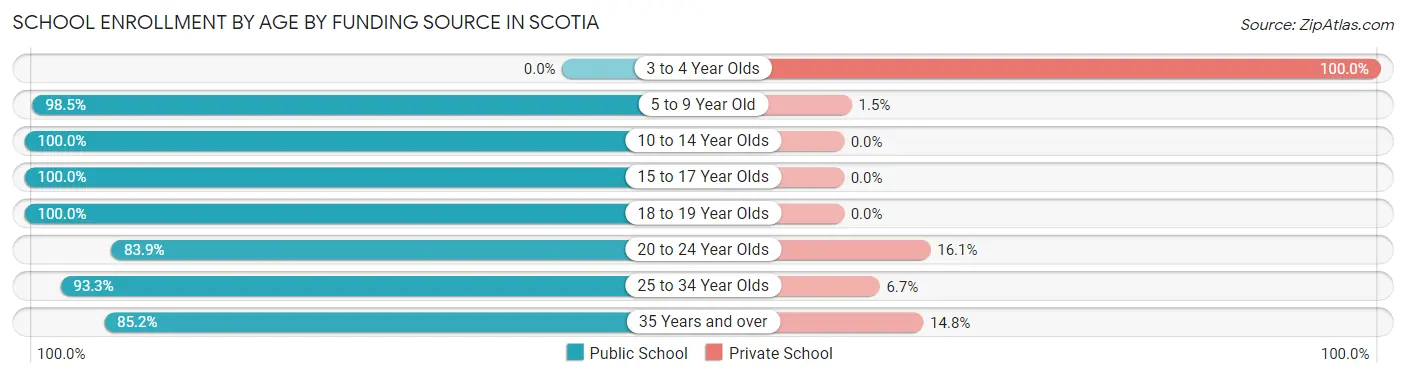
| Age Bracket | Public School | Private School |
| 3 to 4 Year Olds | 0 (0.0%) | 85 (100.0%) |
| 5 to 9 Year Old | 466 (98.5%) | 7 (1.5%) |
| 10 to 14 Year Olds | 351 (100.0%) | 0 (0.0%) |
| 15 to 17 Year Olds | 411 (100.0%) | 0 (0.0%) |
| 18 to 19 Year Olds | 157 (100.0%) | 0 (0.0%) |
| 20 to 24 Year Olds | 78 (83.9%) | 15 (16.1%) |
| 25 to 34 Year Olds | 140 (93.3%) | 10 (6.7%) |
| 35 Years and over | 92 (85.2%) | 16 (14.8%) |
| Total | 1,695 (92.7%) | 133 (7.3%) |
Educational Attainment by Field of Study in Scotia
Education (427 | 21.3%), science & technology (306 | 15.3%), business (291 | 14.5%), arts & humanities (175 | 8.7%), and bio, nature & agricultural (170 | 8.5%) are the most common fields of study among 2,002 individuals in Scotia who have obtained a bachelor's degree or higher.
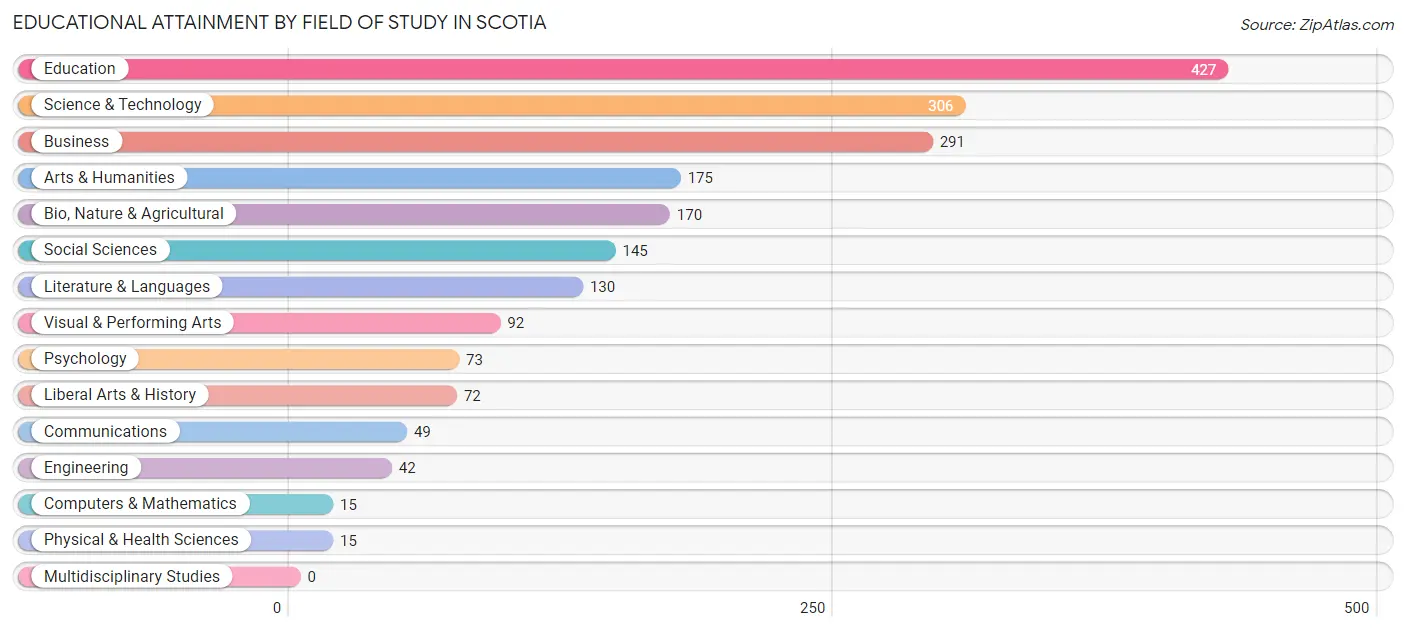
| Field of Study | # Graduates | % Graduates |
| Computers & Mathematics | 15 | 0.7% |
| Bio, Nature & Agricultural | 170 | 8.5% |
| Physical & Health Sciences | 15 | 0.7% |
| Psychology | 73 | 3.6% |
| Social Sciences | 145 | 7.2% |
| Engineering | 42 | 2.1% |
| Multidisciplinary Studies | 0 | 0.0% |
| Science & Technology | 306 | 15.3% |
| Business | 291 | 14.5% |
| Education | 427 | 21.3% |
| Literature & Languages | 130 | 6.5% |
| Liberal Arts & History | 72 | 3.6% |
| Visual & Performing Arts | 92 | 4.6% |
| Communications | 49 | 2.5% |
| Arts & Humanities | 175 | 8.7% |
| Total | 2,002 | 100.0% |
Transportation & Commute in Scotia
Vehicle Availability by Sex in Scotia
The most prevalent vehicle ownership categories in Scotia are males with 2 vehicles (962, accounting for 52.8%) and females with 2 vehicles (894, making up 44.8%).
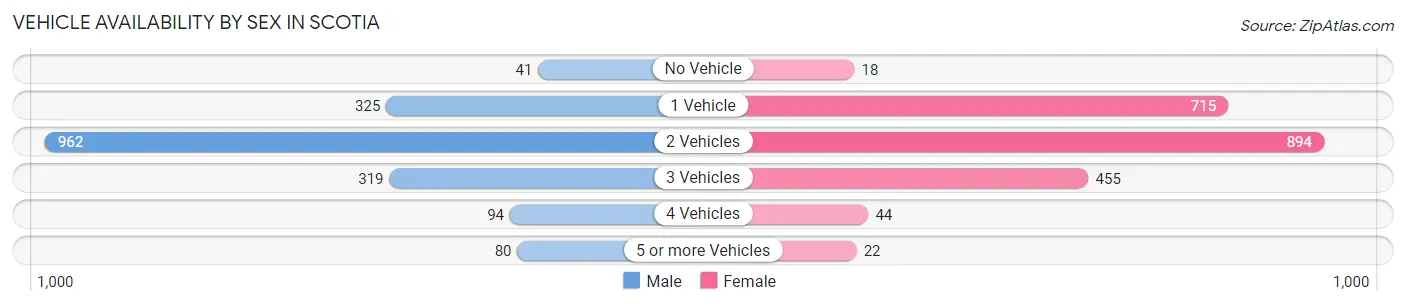
| Vehicles Available | Male | Female |
| No Vehicle | 41 (2.2%) | 18 (0.8%) |
| 1 Vehicle | 325 (17.8%) | 715 (33.3%) |
| 2 Vehicles | 962 (52.8%) | 894 (41.6%) |
| 3 Vehicles | 319 (17.5%) | 455 (21.2%) |
| 4 Vehicles | 94 (5.2%) | 44 (2.1%) |
| 5 or more Vehicles | 80 (4.4%) | 22 (1.0%) |
| Total | 1,821 (100.0%) | 2,148 (100.0%) |
Commute Time in Scotia
The most frequently occuring commute durations in Scotia are 15 to 19 minutes (640 commuters, 18.5%), 10 to 14 minutes (591 commuters, 17.1%), and 30 to 34 minutes (526 commuters, 15.2%).
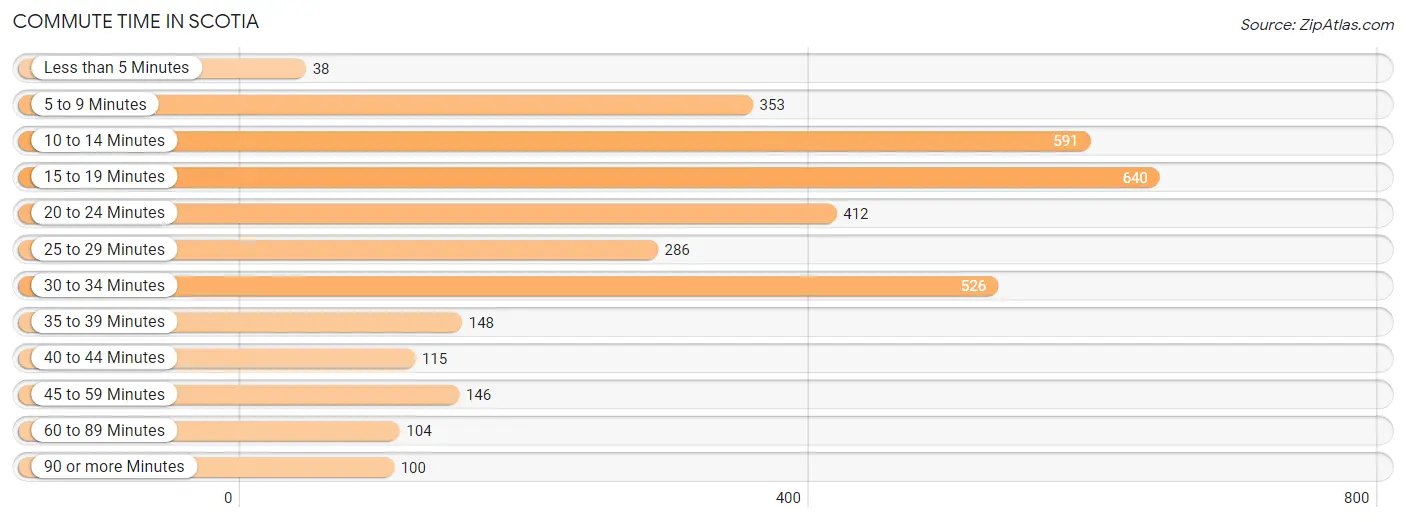
| Commute Time | # Commuters | % Commuters |
| Less than 5 Minutes | 38 | 1.1% |
| 5 to 9 Minutes | 353 | 10.2% |
| 10 to 14 Minutes | 591 | 17.1% |
| 15 to 19 Minutes | 640 | 18.5% |
| 20 to 24 Minutes | 412 | 11.9% |
| 25 to 29 Minutes | 286 | 8.3% |
| 30 to 34 Minutes | 526 | 15.2% |
| 35 to 39 Minutes | 148 | 4.3% |
| 40 to 44 Minutes | 115 | 3.3% |
| 45 to 59 Minutes | 146 | 4.2% |
| 60 to 89 Minutes | 104 | 3.0% |
| 90 or more Minutes | 100 | 2.9% |
Commute Time by Sex in Scotia
The most common commute times in Scotia are 30 to 34 minutes (362 commuters, 21.2%) for males and 15 to 19 minutes (430 commuters, 24.6%) for females.
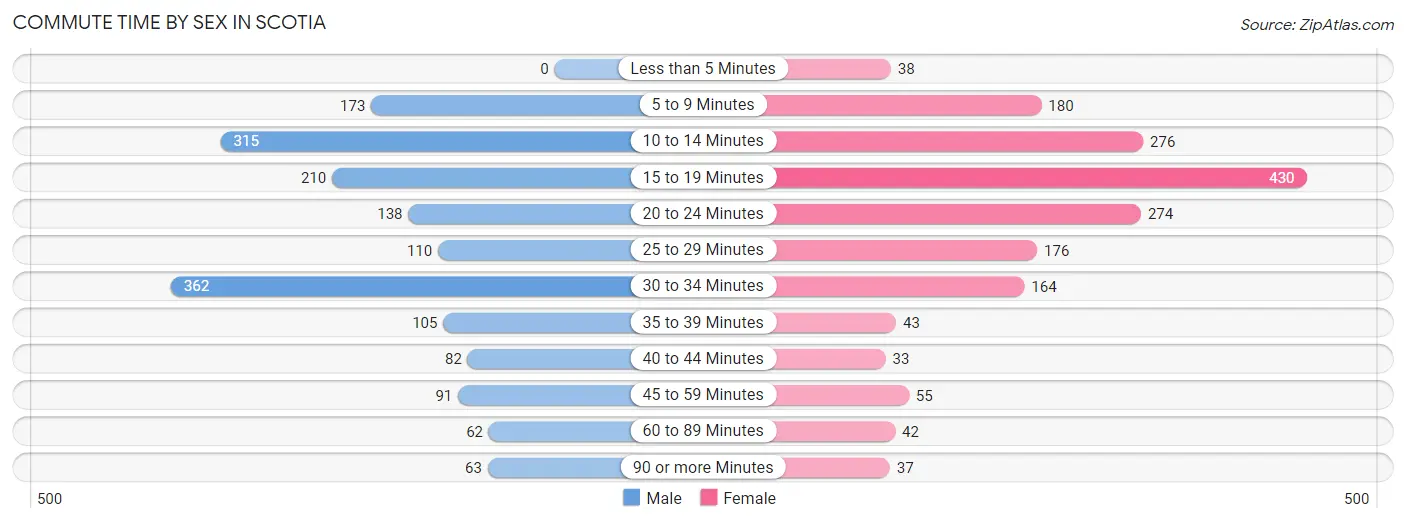
| Commute Time | Male | Female |
| Less than 5 Minutes | 0 (0.0%) | 38 (2.2%) |
| 5 to 9 Minutes | 173 (10.1%) | 180 (10.3%) |
| 10 to 14 Minutes | 315 (18.4%) | 276 (15.8%) |
| 15 to 19 Minutes | 210 (12.3%) | 430 (24.6%) |
| 20 to 24 Minutes | 138 (8.1%) | 274 (15.7%) |
| 25 to 29 Minutes | 110 (6.4%) | 176 (10.1%) |
| 30 to 34 Minutes | 362 (21.2%) | 164 (9.4%) |
| 35 to 39 Minutes | 105 (6.1%) | 43 (2.5%) |
| 40 to 44 Minutes | 82 (4.8%) | 33 (1.9%) |
| 45 to 59 Minutes | 91 (5.3%) | 55 (3.2%) |
| 60 to 89 Minutes | 62 (3.6%) | 42 (2.4%) |
| 90 or more Minutes | 63 (3.7%) | 37 (2.1%) |
Time of Departure to Work by Sex in Scotia
The most frequent times of departure to work in Scotia are 7:00 AM to 7:29 AM (437, 25.5%) for males and 8:00 AM to 8:29 AM (367, 21.0%) for females.
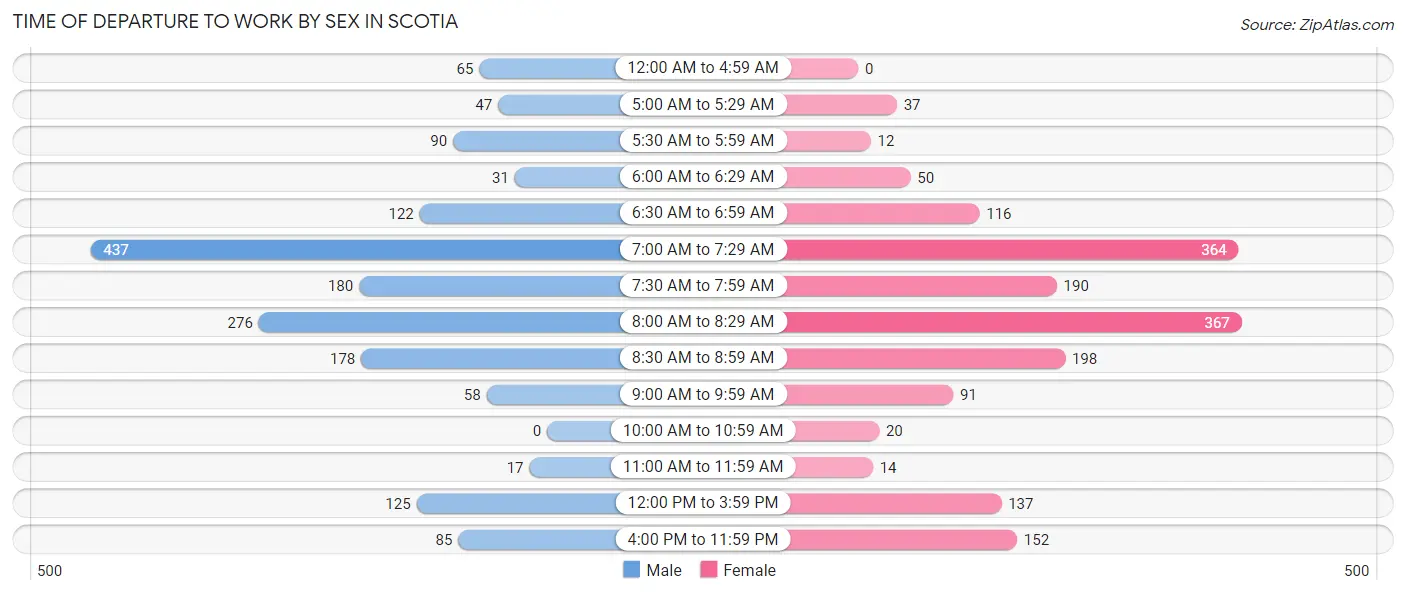
| Time of Departure | Male | Female |
| 12:00 AM to 4:59 AM | 65 (3.8%) | 0 (0.0%) |
| 5:00 AM to 5:29 AM | 47 (2.8%) | 37 (2.1%) |
| 5:30 AM to 5:59 AM | 90 (5.3%) | 12 (0.7%) |
| 6:00 AM to 6:29 AM | 31 (1.8%) | 50 (2.9%) |
| 6:30 AM to 6:59 AM | 122 (7.1%) | 116 (6.6%) |
| 7:00 AM to 7:29 AM | 437 (25.5%) | 364 (20.8%) |
| 7:30 AM to 7:59 AM | 180 (10.5%) | 190 (10.9%) |
| 8:00 AM to 8:29 AM | 276 (16.1%) | 367 (21.0%) |
| 8:30 AM to 8:59 AM | 178 (10.4%) | 198 (11.3%) |
| 9:00 AM to 9:59 AM | 58 (3.4%) | 91 (5.2%) |
| 10:00 AM to 10:59 AM | 0 (0.0%) | 20 (1.1%) |
| 11:00 AM to 11:59 AM | 17 (1.0%) | 14 (0.8%) |
| 12:00 PM to 3:59 PM | 125 (7.3%) | 137 (7.8%) |
| 4:00 PM to 11:59 PM | 85 (5.0%) | 152 (8.7%) |
| Total | 1,711 (100.0%) | 1,748 (100.0%) |
Housing Occupancy in Scotia
Occupancy by Ownership in Scotia
Of the total 3,156 dwellings in Scotia, owner-occupied units account for 2,315 (73.4%), while renter-occupied units make up 841 (26.7%).
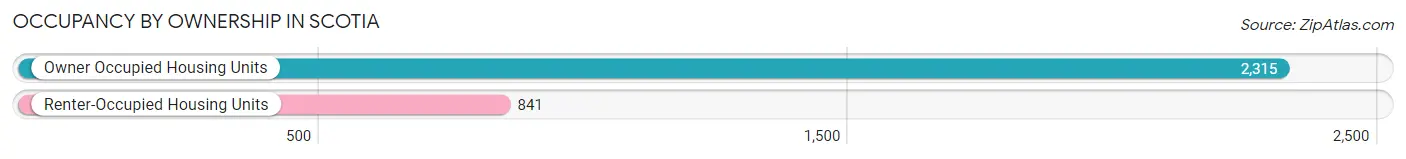
| Occupancy | # Housing Units | % Housing Units |
| Owner Occupied Housing Units | 2,315 | 73.4% |
| Renter-Occupied Housing Units | 841 | 26.7% |
| Total Occupied Housing Units | 3,156 | 100.0% |
Occupancy by Household Size in Scotia
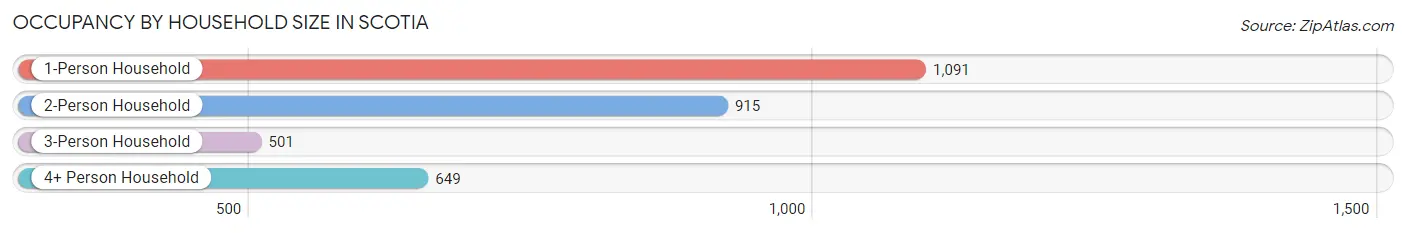
| Household Size | # Housing Units | % Housing Units |
| 1-Person Household | 1,091 | 34.6% |
| 2-Person Household | 915 | 29.0% |
| 3-Person Household | 501 | 15.9% |
| 4+ Person Household | 649 | 20.6% |
| Total Housing Units | 3,156 | 100.0% |
Occupancy by Ownership by Household Size in Scotia
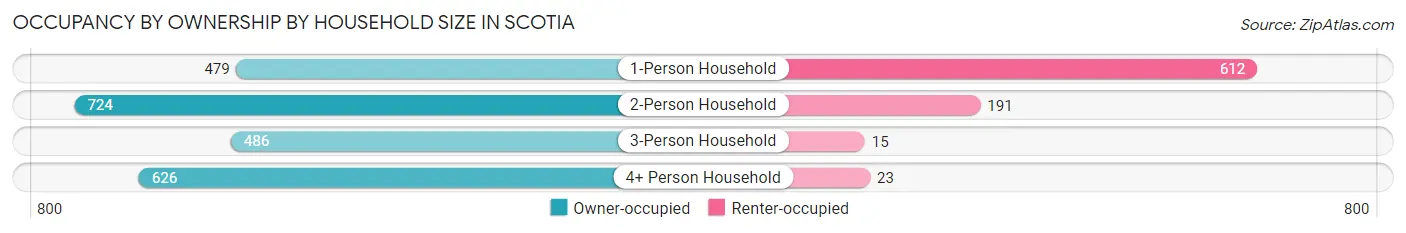
| Household Size | Owner-occupied | Renter-occupied |
| 1-Person Household | 479 (43.9%) | 612 (56.1%) |
| 2-Person Household | 724 (79.1%) | 191 (20.9%) |
| 3-Person Household | 486 (97.0%) | 15 (3.0%) |
| 4+ Person Household | 626 (96.5%) | 23 (3.5%) |
| Total Housing Units | 2,315 (73.4%) | 841 (26.7%) |
Occupancy by Educational Attainment in Scotia
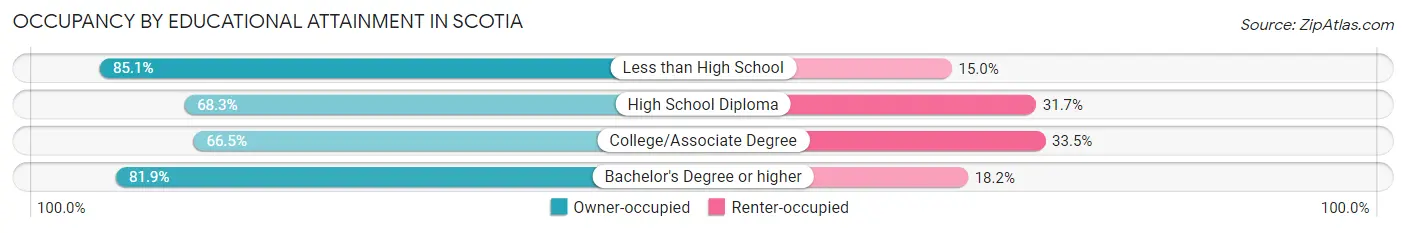
| Household Size | Owner-occupied | Renter-occupied |
| Less than High School | 91 (85.1%) | 16 (14.9%) |
| High School Diploma | 449 (68.3%) | 208 (31.7%) |
| College/Associate Degree | 792 (66.5%) | 399 (33.5%) |
| Bachelor's Degree or higher | 983 (81.9%) | 218 (18.1%) |
Occupancy by Age of Householder in Scotia
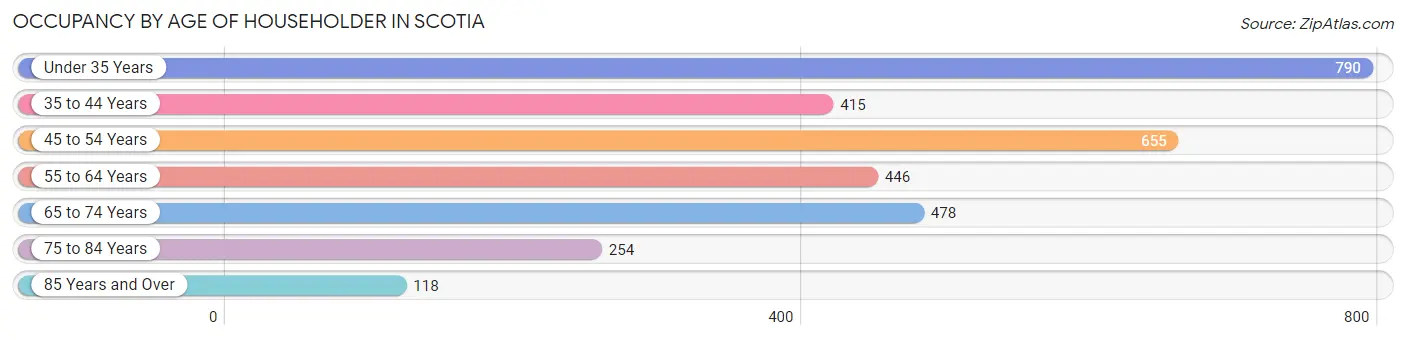
| Age Bracket | # Households | % Households |
| Under 35 Years | 790 | 25.0% |
| 35 to 44 Years | 415 | 13.2% |
| 45 to 54 Years | 655 | 20.7% |
| 55 to 64 Years | 446 | 14.1% |
| 65 to 74 Years | 478 | 15.1% |
| 75 to 84 Years | 254 | 8.1% |
| 85 Years and Over | 118 | 3.7% |
| Total | 3,156 | 100.0% |
Housing Finances in Scotia
Median Income by Occupancy in Scotia
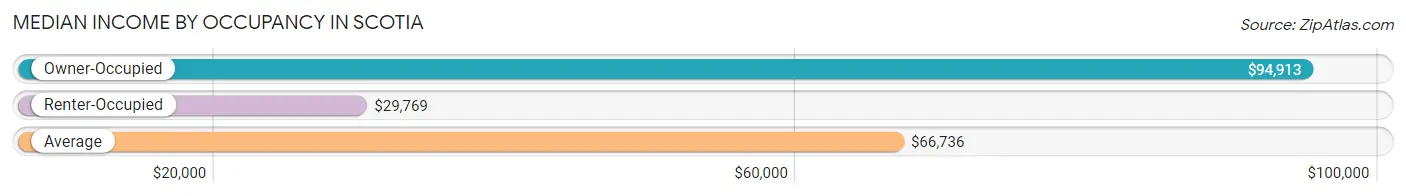
| Occupancy Type | # Households | Median Income |
| Owner-Occupied | 2,315 (73.4%) | $94,913 |
| Renter-Occupied | 841 (26.7%) | $29,769 |
| Average | 3,156 (100.0%) | $66,736 |
Occupancy by Householder Income Bracket in Scotia
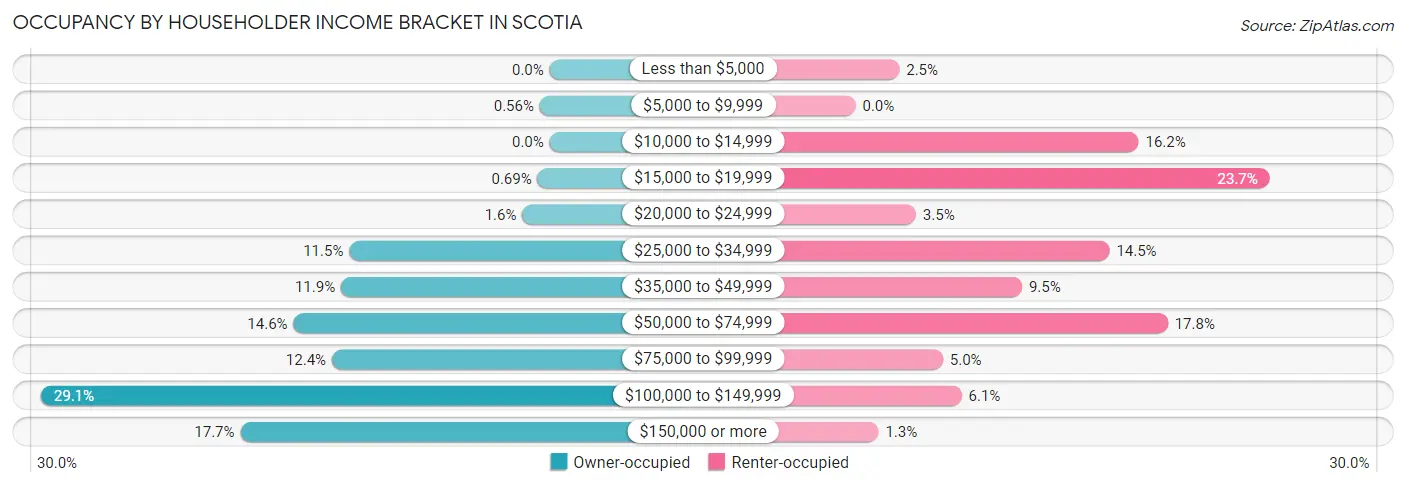
| Income Bracket | Owner-occupied | Renter-occupied |
| Less than $5,000 | 0 (0.0%) | 21 (2.5%) |
| $5,000 to $9,999 | 13 (0.6%) | 0 (0.0%) |
| $10,000 to $14,999 | 0 (0.0%) | 136 (16.2%) |
| $15,000 to $19,999 | 16 (0.7%) | 199 (23.7%) |
| $20,000 to $24,999 | 36 (1.6%) | 29 (3.5%) |
| $25,000 to $34,999 | 265 (11.5%) | 122 (14.5%) |
| $35,000 to $49,999 | 276 (11.9%) | 80 (9.5%) |
| $50,000 to $74,999 | 339 (14.6%) | 150 (17.8%) |
| $75,000 to $99,999 | 288 (12.4%) | 42 (5.0%) |
| $100,000 to $149,999 | 673 (29.1%) | 51 (6.1%) |
| $150,000 or more | 409 (17.7%) | 11 (1.3%) |
| Total | 2,315 (100.0%) | 841 (100.0%) |
Monthly Housing Cost Tiers in Scotia
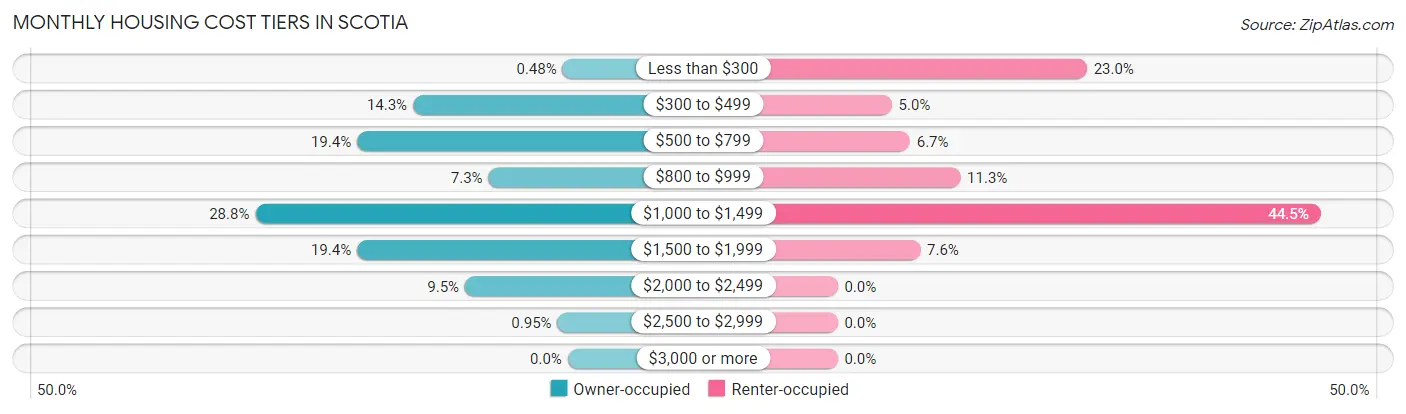
| Monthly Cost | Owner-occupied | Renter-occupied |
| Less than $300 | 11 (0.5%) | 193 (23.0%) |
| $300 to $499 | 330 (14.2%) | 42 (5.0%) |
| $500 to $799 | 449 (19.4%) | 56 (6.7%) |
| $800 to $999 | 169 (7.3%) | 95 (11.3%) |
| $1,000 to $1,499 | 666 (28.8%) | 374 (44.5%) |
| $1,500 to $1,999 | 449 (19.4%) | 64 (7.6%) |
| $2,000 to $2,499 | 219 (9.5%) | 0 (0.0%) |
| $2,500 to $2,999 | 22 (0.9%) | 0 (0.0%) |
| $3,000 or more | 0 (0.0%) | 0 (0.0%) |
| Total | 2,315 (100.0%) | 841 (100.0%) |
Physical Housing Characteristics in Scotia
Housing Structures in Scotia
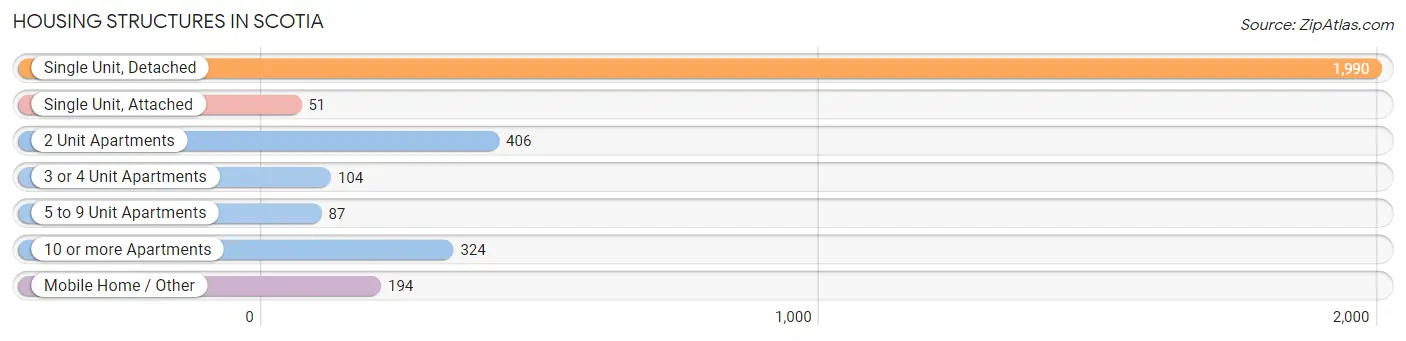
| Structure Type | # Housing Units | % Housing Units |
| Single Unit, Detached | 1,990 | 63.0% |
| Single Unit, Attached | 51 | 1.6% |
| 2 Unit Apartments | 406 | 12.9% |
| 3 or 4 Unit Apartments | 104 | 3.3% |
| 5 to 9 Unit Apartments | 87 | 2.8% |
| 10 or more Apartments | 324 | 10.3% |
| Mobile Home / Other | 194 | 6.1% |
| Total | 3,156 | 100.0% |
Housing Structures by Occupancy in Scotia
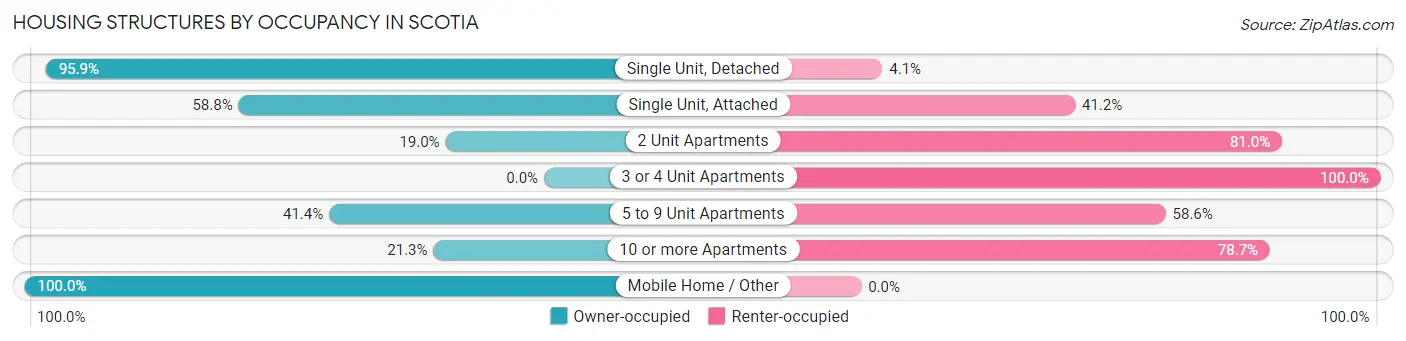
| Structure Type | Owner-occupied | Renter-occupied |
| Single Unit, Detached | 1,909 (95.9%) | 81 (4.1%) |
| Single Unit, Attached | 30 (58.8%) | 21 (41.2%) |
| 2 Unit Apartments | 77 (19.0%) | 329 (81.0%) |
| 3 or 4 Unit Apartments | 0 (0.0%) | 104 (100.0%) |
| 5 to 9 Unit Apartments | 36 (41.4%) | 51 (58.6%) |
| 10 or more Apartments | 69 (21.3%) | 255 (78.7%) |
| Mobile Home / Other | 194 (100.0%) | 0 (0.0%) |
| Total | 2,315 (73.4%) | 841 (26.7%) |
Housing Structures by Number of Rooms in Scotia
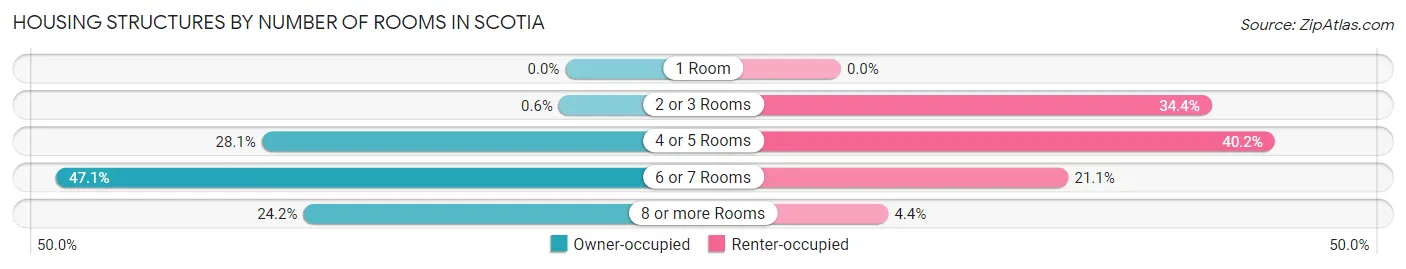
| Number of Rooms | Owner-occupied | Renter-occupied |
| 1 Room | 0 (0.0%) | 0 (0.0%) |
| 2 or 3 Rooms | 14 (0.6%) | 289 (34.4%) |
| 4 or 5 Rooms | 650 (28.1%) | 338 (40.2%) |
| 6 or 7 Rooms | 1,090 (47.1%) | 177 (21.0%) |
| 8 or more Rooms | 561 (24.2%) | 37 (4.4%) |
| Total | 2,315 (100.0%) | 841 (100.0%) |
Housing Structure by Heating Type in Scotia
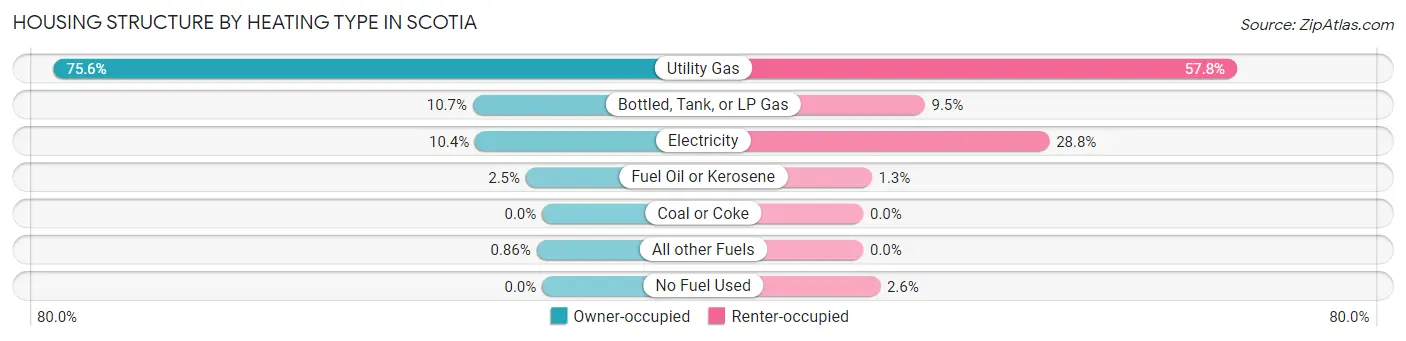
| Heating Type | Owner-occupied | Renter-occupied |
| Utility Gas | 1,749 (75.5%) | 486 (57.8%) |
| Bottled, Tank, or LP Gas | 248 (10.7%) | 80 (9.5%) |
| Electricity | 240 (10.4%) | 242 (28.8%) |
| Fuel Oil or Kerosene | 58 (2.5%) | 11 (1.3%) |
| Coal or Coke | 0 (0.0%) | 0 (0.0%) |
| All other Fuels | 20 (0.9%) | 0 (0.0%) |
| No Fuel Used | 0 (0.0%) | 22 (2.6%) |
| Total | 2,315 (100.0%) | 841 (100.0%) |
Household Vehicle Usage in Scotia
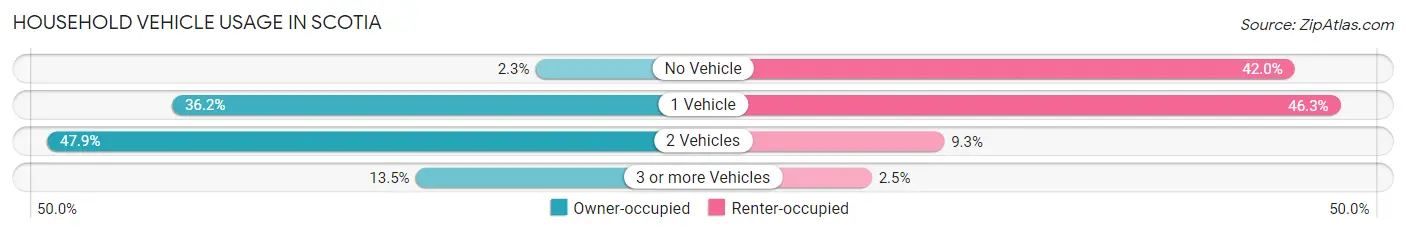
| Vehicles per Household | Owner-occupied | Renter-occupied |
| No Vehicle | 54 (2.3%) | 353 (42.0%) |
| 1 Vehicle | 839 (36.2%) | 389 (46.3%) |
| 2 Vehicles | 1,109 (47.9%) | 78 (9.3%) |
| 3 or more Vehicles | 313 (13.5%) | 21 (2.5%) |
| Total | 2,315 (100.0%) | 841 (100.0%) |
Real Estate & Mortgages in Scotia
Real Estate and Mortgage Overview in Scotia
| Characteristic | Without Mortgage | With Mortgage |
| Housing Units | 914 | 1,401 |
| Median Property Value | $166,200 | $179,800 |
| Median Household Income | $52,938 | $313 |
| Monthly Housing Costs | $630 | $0 |
| Real Estate Taxes | $3,797 | $24 |
Property Value by Mortgage Status in Scotia
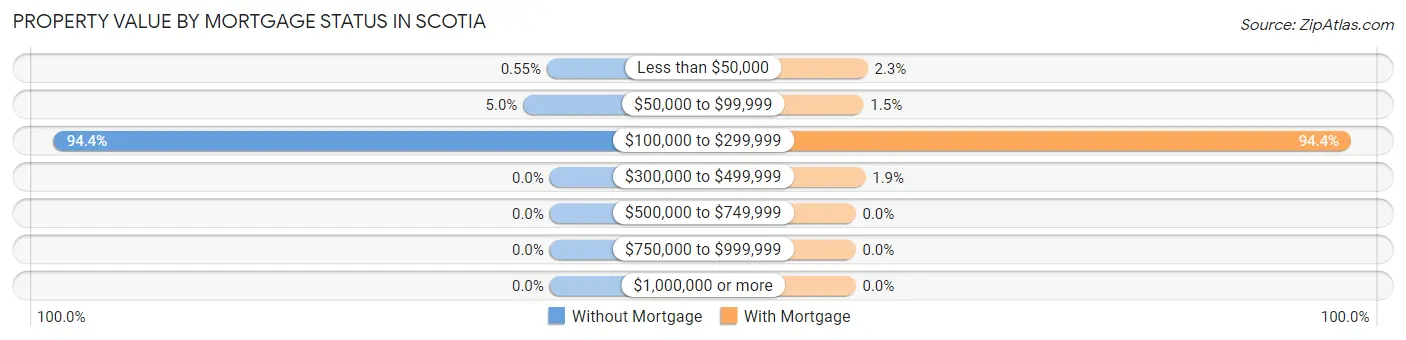
| Property Value | Without Mortgage | With Mortgage |
| Less than $50,000 | 5 (0.5%) | 32 (2.3%) |
| $50,000 to $99,999 | 46 (5.0%) | 21 (1.5%) |
| $100,000 to $299,999 | 863 (94.4%) | 1,322 (94.4%) |
| $300,000 to $499,999 | 0 (0.0%) | 26 (1.9%) |
| $500,000 to $749,999 | 0 (0.0%) | 0 (0.0%) |
| $750,000 to $999,999 | 0 (0.0%) | 0 (0.0%) |
| $1,000,000 or more | 0 (0.0%) | 0 (0.0%) |
| Total | 914 (100.0%) | 1,401 (100.0%) |
Household Income by Mortgage Status in Scotia
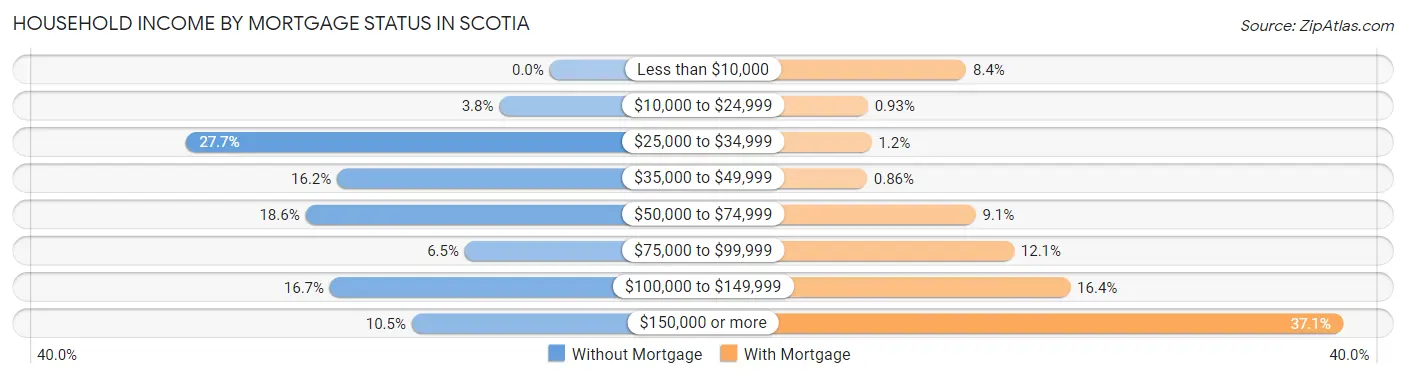
| Household Income | Without Mortgage | With Mortgage |
| Less than $10,000 | 0 (0.0%) | 118 (8.4%) |
| $10,000 to $24,999 | 35 (3.8%) | 13 (0.9%) |
| $25,000 to $34,999 | 253 (27.7%) | 17 (1.2%) |
| $35,000 to $49,999 | 148 (16.2%) | 12 (0.9%) |
| $50,000 to $74,999 | 170 (18.6%) | 128 (9.1%) |
| $75,000 to $99,999 | 59 (6.5%) | 169 (12.1%) |
| $100,000 to $149,999 | 153 (16.7%) | 229 (16.4%) |
| $150,000 or more | 96 (10.5%) | 520 (37.1%) |
| Total | 914 (100.0%) | 1,401 (100.0%) |
Property Value to Household Income Ratio in Scotia
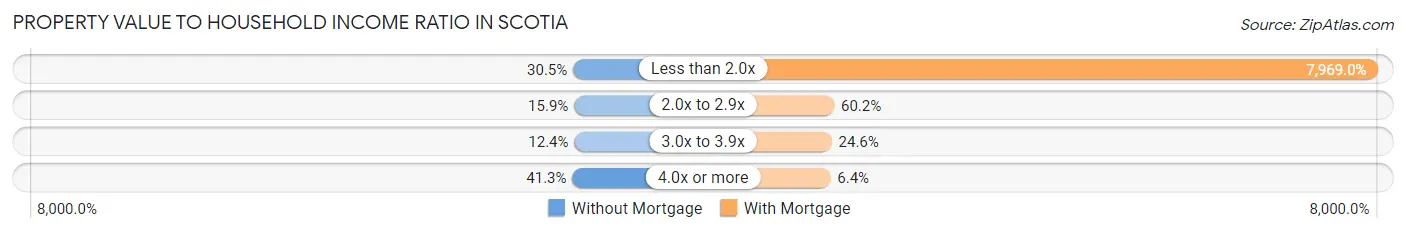
| Value-to-Income Ratio | Without Mortgage | With Mortgage |
| Less than 2.0x | 279 (30.5%) | 111,645 (7,968.9%) |
| 2.0x to 2.9x | 145 (15.9%) | 844 (60.2%) |
| 3.0x to 3.9x | 113 (12.4%) | 345 (24.6%) |
| 4.0x or more | 377 (41.2%) | 89 (6.4%) |
| Total | 914 (100.0%) | 1,401 (100.0%) |
Real Estate Taxes by Mortgage Status in Scotia

| Property Taxes | Without Mortgage | With Mortgage |
| Less than $800 | 25 (2.7%) | 0 (0.0%) |
| $800 to $1,499 | 47 (5.1%) | 16 (1.1%) |
| $800 to $1,499 | 822 (89.9%) | 60 (4.3%) |
| Total | 914 (100.0%) | 1,401 (100.0%) |
Health & Disability in Scotia
Health Insurance Coverage by Age in Scotia
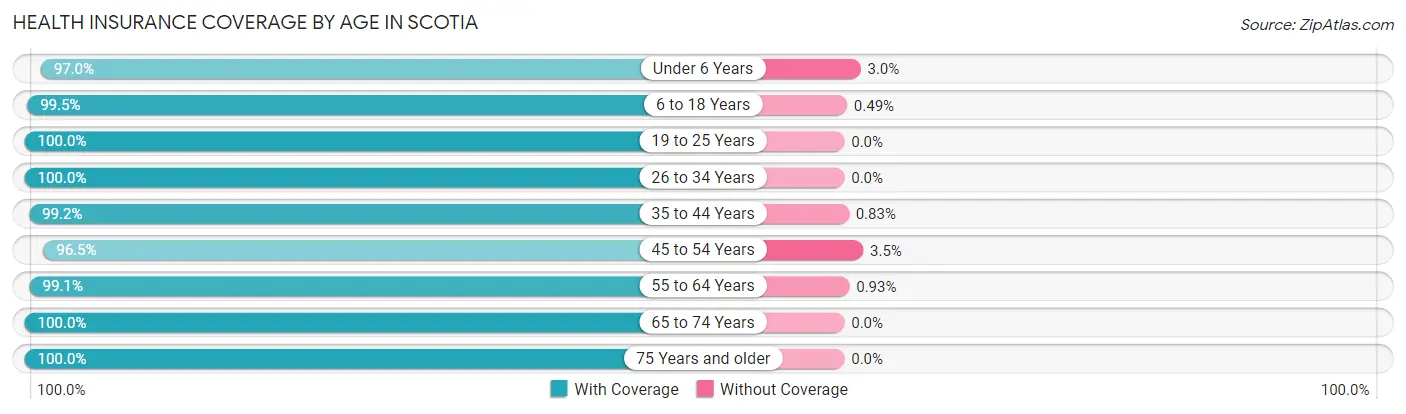
| Age Bracket | With Coverage | Without Coverage |
| Under 6 Years | 384 (97.0%) | 12 (3.0%) |
| 6 to 18 Years | 1,231 (99.5%) | 6 (0.5%) |
| 19 to 25 Years | 751 (100.0%) | 0 (0.0%) |
| 26 to 34 Years | 1,045 (100.0%) | 0 (0.0%) |
| 35 to 44 Years | 959 (99.2%) | 8 (0.8%) |
| 45 to 54 Years | 879 (96.5%) | 32 (3.5%) |
| 55 to 64 Years | 747 (99.1%) | 7 (0.9%) |
| 65 to 74 Years | 645 (100.0%) | 0 (0.0%) |
| 75 Years and older | 486 (100.0%) | 0 (0.0%) |
| Total | 7,127 (99.1%) | 65 (0.9%) |
Health Insurance Coverage by Citizenship Status in Scotia
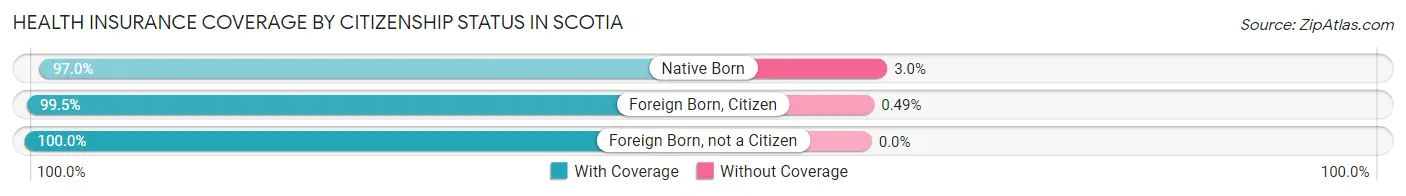
| Citizenship Status | With Coverage | Without Coverage |
| Native Born | 384 (97.0%) | 12 (3.0%) |
| Foreign Born, Citizen | 1,231 (99.5%) | 6 (0.5%) |
| Foreign Born, not a Citizen | 751 (100.0%) | 0 (0.0%) |
Health Insurance Coverage by Household Income in Scotia
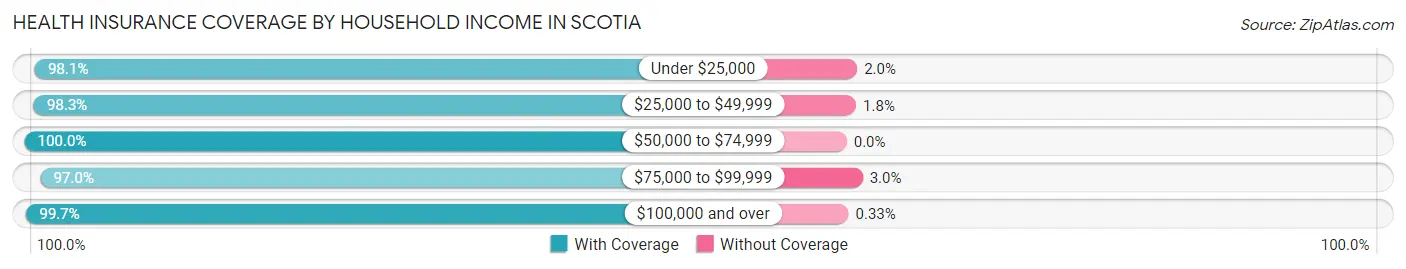
| Household Income | With Coverage | Without Coverage |
| Under $25,000 | 553 (98.1%) | 11 (1.9%) |
| $25,000 to $49,999 | 1,120 (98.3%) | 20 (1.8%) |
| $50,000 to $74,999 | 1,081 (100.0%) | 0 (0.0%) |
| $75,000 to $99,999 | 717 (97.0%) | 22 (3.0%) |
| $100,000 and over | 3,635 (99.7%) | 12 (0.3%) |
Public vs Private Health Insurance Coverage by Age in Scotia
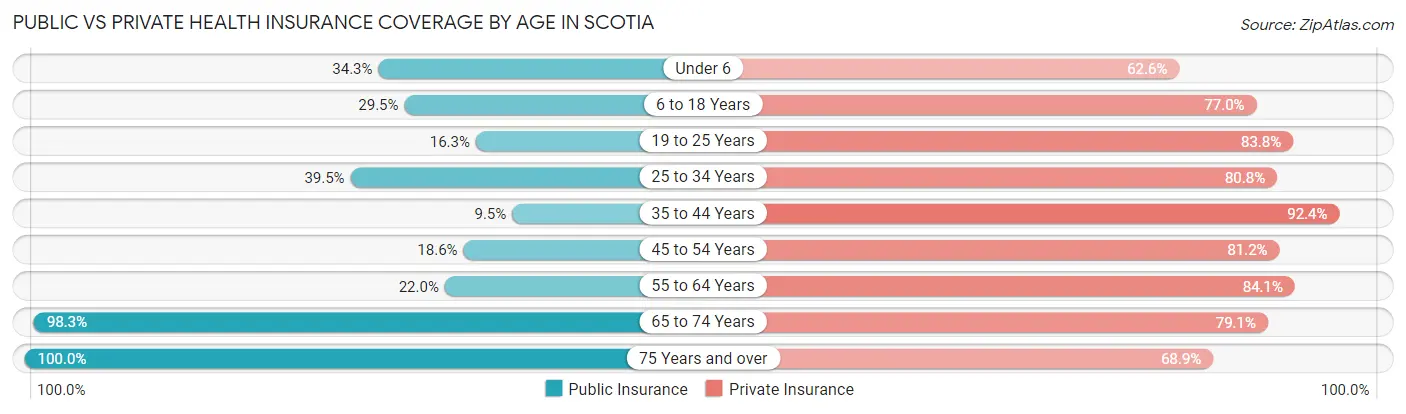
| Age Bracket | Public Insurance | Private Insurance |
| Under 6 | 136 (34.3%) | 248 (62.6%) |
| 6 to 18 Years | 365 (29.5%) | 952 (77.0%) |
| 19 to 25 Years | 122 (16.3%) | 629 (83.8%) |
| 25 to 34 Years | 413 (39.5%) | 844 (80.8%) |
| 35 to 44 Years | 92 (9.5%) | 893 (92.3%) |
| 45 to 54 Years | 169 (18.5%) | 740 (81.2%) |
| 55 to 64 Years | 166 (22.0%) | 634 (84.1%) |
| 65 to 74 Years | 634 (98.3%) | 510 (79.1%) |
| 75 Years and over | 486 (100.0%) | 335 (68.9%) |
| Total | 2,583 (35.9%) | 5,785 (80.4%) |
Disability Status by Sex by Age in Scotia
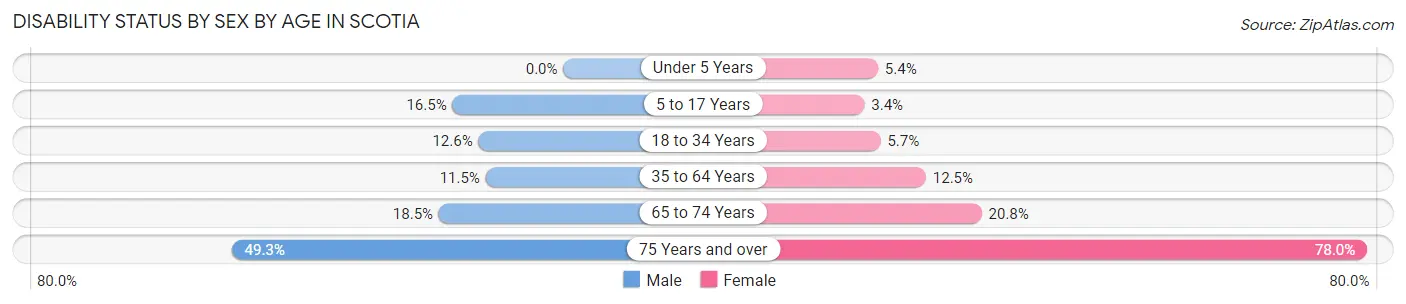
| Age Bracket | Male | Female |
| Under 5 Years | 0 (0.0%) | 12 (5.4%) |
| 5 to 17 Years | 117 (16.5%) | 18 (3.4%) |
| 18 to 34 Years | 95 (12.6%) | 62 (5.7%) |
| 35 to 64 Years | 139 (11.5%) | 178 (12.5%) |
| 65 to 74 Years | 56 (18.5%) | 71 (20.8%) |
| 75 Years and over | 67 (49.3%) | 273 (78.0%) |
Disability Class by Sex by Age in Scotia
Disability Class: Hearing Difficulty
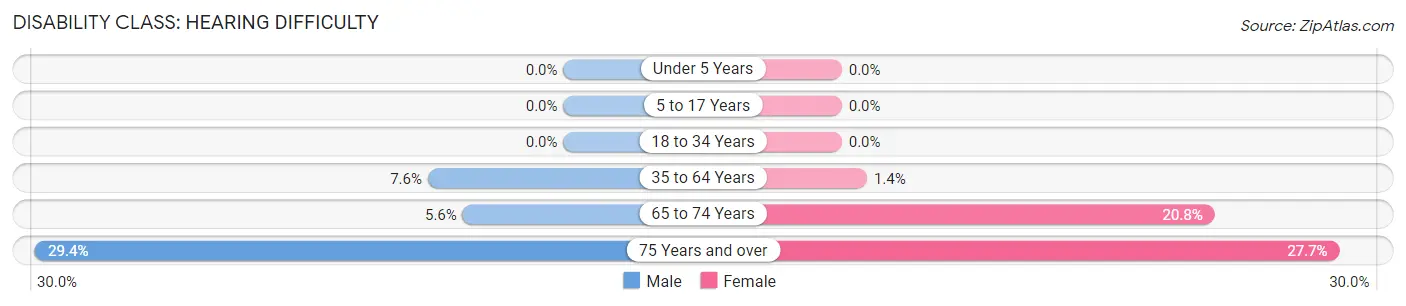
| Age Bracket | Male | Female |
| Under 5 Years | 0 (0.0%) | 0 (0.0%) |
| 5 to 17 Years | 0 (0.0%) | 0 (0.0%) |
| 18 to 34 Years | 0 (0.0%) | 0 (0.0%) |
| 35 to 64 Years | 91 (7.5%) | 20 (1.4%) |
| 65 to 74 Years | 17 (5.6%) | 71 (20.8%) |
| 75 Years and over | 40 (29.4%) | 97 (27.7%) |
Disability Class: Vision Difficulty
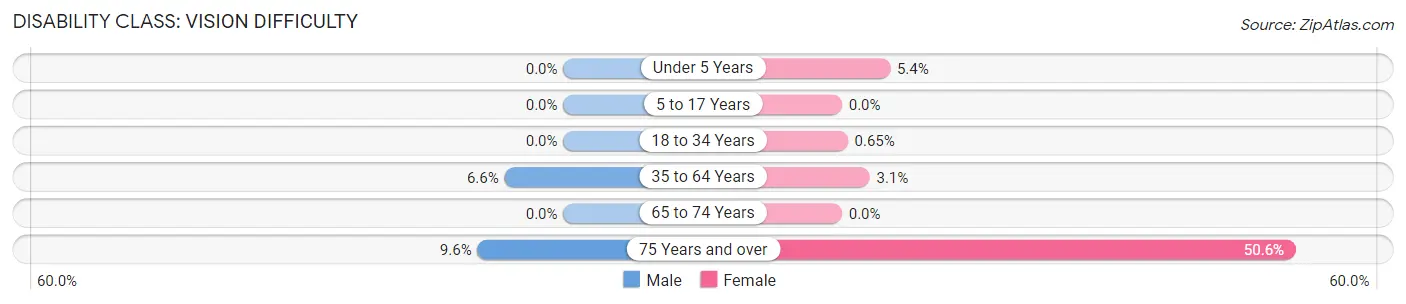
| Age Bracket | Male | Female |
| Under 5 Years | 0 (0.0%) | 12 (5.4%) |
| 5 to 17 Years | 0 (0.0%) | 0 (0.0%) |
| 18 to 34 Years | 0 (0.0%) | 7 (0.6%) |
| 35 to 64 Years | 79 (6.6%) | 44 (3.1%) |
| 65 to 74 Years | 0 (0.0%) | 0 (0.0%) |
| 75 Years and over | 13 (9.6%) | 177 (50.6%) |
Disability Class: Cognitive Difficulty
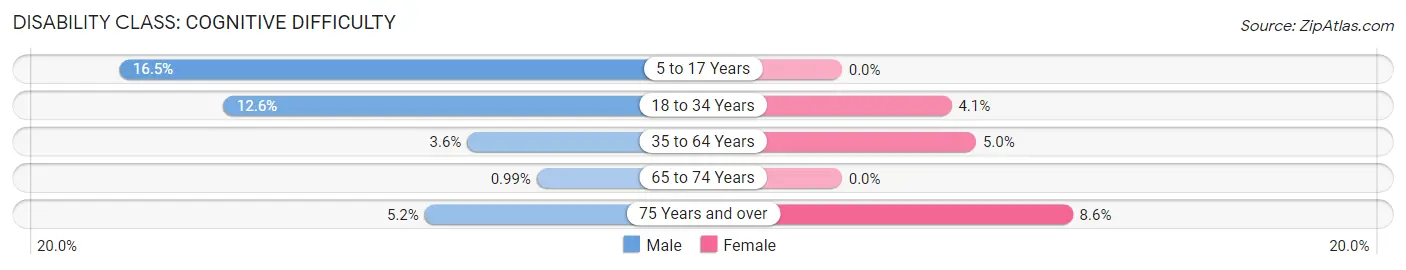
| Age Bracket | Male | Female |
| 5 to 17 Years | 117 (16.5%) | 0 (0.0%) |
| 18 to 34 Years | 95 (12.6%) | 44 (4.1%) |
| 35 to 64 Years | 43 (3.6%) | 71 (5.0%) |
| 65 to 74 Years | 3 (1.0%) | 0 (0.0%) |
| 75 Years and over | 7 (5.1%) | 30 (8.6%) |
Disability Class: Ambulatory Difficulty
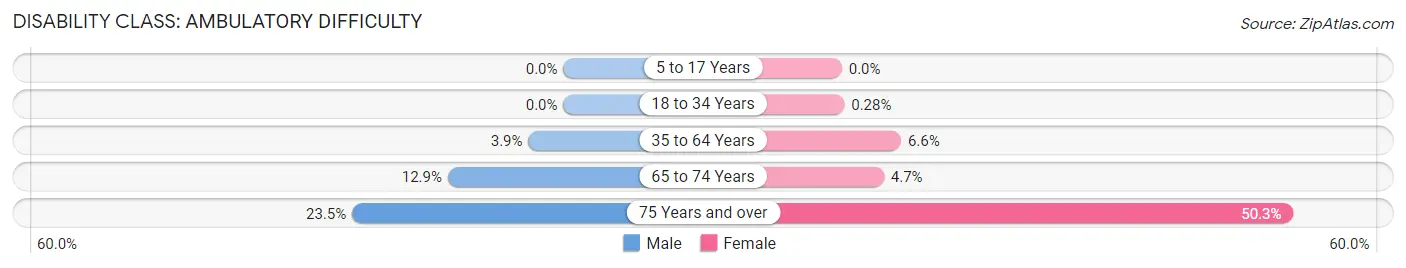
| Age Bracket | Male | Female |
| 5 to 17 Years | 0 (0.0%) | 0 (0.0%) |
| 18 to 34 Years | 0 (0.0%) | 3 (0.3%) |
| 35 to 64 Years | 47 (3.9%) | 94 (6.6%) |
| 65 to 74 Years | 39 (12.9%) | 16 (4.7%) |
| 75 Years and over | 32 (23.5%) | 176 (50.3%) |
Disability Class: Self-Care Difficulty
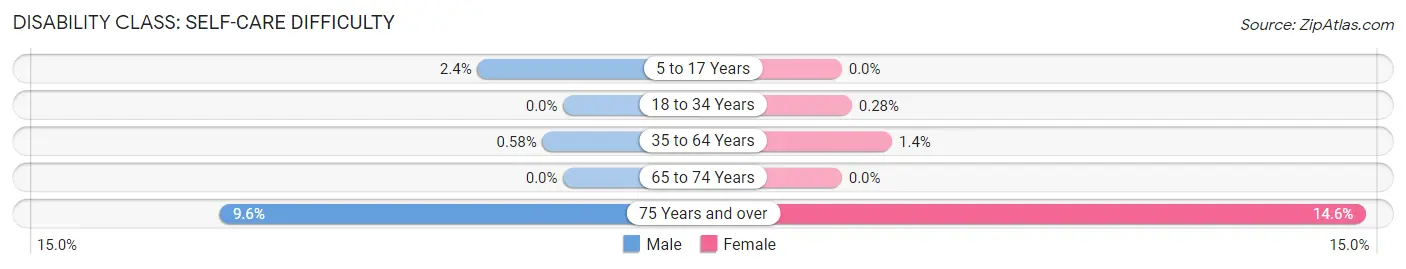
| Age Bracket | Male | Female |
| 5 to 17 Years | 17 (2.4%) | 0 (0.0%) |
| 18 to 34 Years | 0 (0.0%) | 3 (0.3%) |
| 35 to 64 Years | 7 (0.6%) | 20 (1.4%) |
| 65 to 74 Years | 0 (0.0%) | 0 (0.0%) |
| 75 Years and over | 13 (9.6%) | 51 (14.6%) |
Technology Access in Scotia
Computing Device Access in Scotia
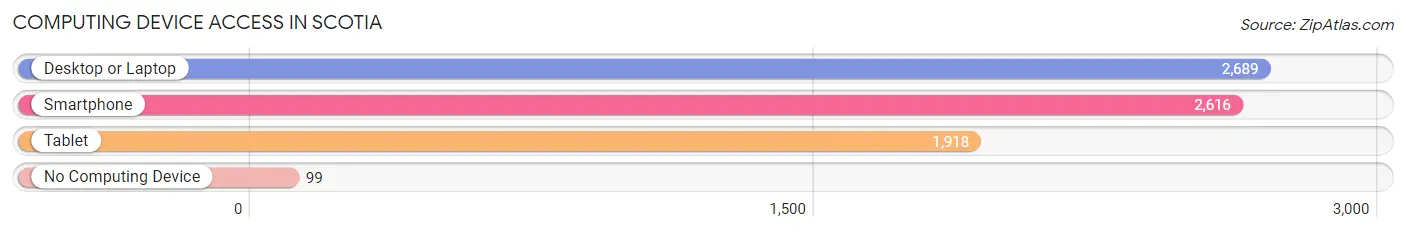
| Device Type | # Households | % Households |
| Desktop or Laptop | 2,689 | 85.2% |
| Smartphone | 2,616 | 82.9% |
| Tablet | 1,918 | 60.8% |
| No Computing Device | 99 | 3.1% |
| Total | 3,156 | 100.0% |
Internet Access in Scotia
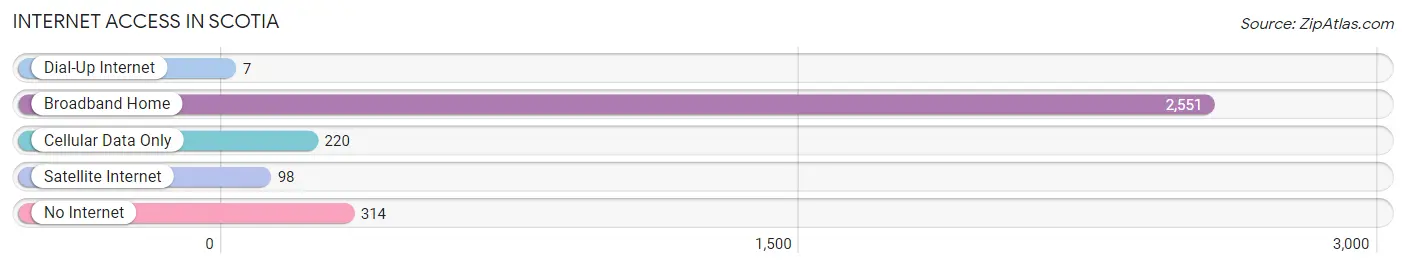
| Internet Type | # Households | % Households |
| Dial-Up Internet | 7 | 0.2% |
| Broadband Home | 2,551 | 80.8% |
| Cellular Data Only | 220 | 7.0% |
| Satellite Internet | 98 | 3.1% |
| No Internet | 314 | 10.0% |
| Total | 3,156 | 100.0% |
Scotia Summary
Scotia, New York is a small village located in Schenectady County, New York. It is situated on the Mohawk River, just north of the city of Schenectady. Scotia is a part of the town of Glenville and is located in the Capital District of New York. The village has a population of approximately 7,000 people and is home to a variety of businesses, including a number of small manufacturing companies.
History
The area that is now Scotia was originally inhabited by the Mohawk people, who were part of the Iroquois Confederacy. The first European settlers arrived in the area in the late 17th century, and the village was officially incorporated in 1832. The village was named after the Scottish town of Scotia, which was the birthplace of the first settler in the area.
In the 19th century, Scotia was a thriving industrial center, with a number of mills and factories located in the village. The village was also home to a number of tanneries, which produced leather goods for the local market. The village was also home to a number of churches, including the First Presbyterian Church, which was founded in 1837.
Geography
Scotia is located in the Capital District of New York, in the town of Glenville. The village is situated on the Mohawk River, just north of the city of Schenectady. The village is located in a hilly area, with the highest point in the village being the Scotia Hill, which is located at an elevation of 590 feet. The village is located in a temperate climate, with average temperatures ranging from the low 30s in the winter to the mid-80s in the summer.
Economy
The economy of Scotia is largely based on manufacturing and services. The village is home to a number of small manufacturing companies, including a number of tanneries and leather goods manufacturers. The village is also home to a number of retail stores, restaurants, and other businesses. The village is also home to a number of government offices, including the Scotia Police Department and the Scotia Fire Department.
Demographics
As of the 2010 census, the population of Scotia was 7,070. The population is largely white, with approximately 90% of the population being white. The median household income in the village is $50,945, and the median home value is $179,000. The village is home to a number of churches, including the First Presbyterian Church, which was founded in 1837.
Conclusion
Scotia, New York is a small village located in Schenectady County, New York. It is situated on the Mohawk River, just north of the city of Schenectady. The village has a population of approximately 7,000 people and is home to a variety of businesses, including a number of small manufacturing companies. The economy of Scotia is largely based on manufacturing and services, and the village is home to a number of government offices. The population of Scotia is largely white, with a median household income of $50,945 and a median home value of $179,000.
Common Questions
What is Per Capita Income in Scotia?
Per Capita income in Scotia is $39,461.
What is the Median Family Income in Scotia?
Median Family Income in Scotia is $98,977.
What is the Median Household income in Scotia?
Median Household Income in Scotia is $66,736.
What is Income or Wage Gap in Scotia?
Income or Wage Gap in Scotia is 27.3%.
Women in Scotia earn 72.7 cents for every dollar earned by a man.
What is Family Income Deficit in Scotia?
Family Income Deficit in Scotia is $9,949.
Families that are below poverty line in Scotia earn $9,949 less on average than the poverty threshold level.
What is Inequality or Gini Index in Scotia?
Inequality or Gini Index in Scotia is 0.41.
What is the Total Population of Scotia?
Total Population of Scotia is 7,292.
What is the Total Male Population of Scotia?
Total Male Population of Scotia is 3,255.
What is the Total Female Population of Scotia?
Total Female Population of Scotia is 4,037.
What is the Ratio of Males per 100 Females in Scotia?
There are 80.63 Males per 100 Females in Scotia.
What is the Ratio of Females per 100 Males in Scotia?
There are 124.02 Females per 100 Males in Scotia.
What is the Median Population Age in Scotia?
Median Population Age in Scotia is 37.4 Years.
What is the Average Family Size in Scotia
Average Family Size in Scotia is 3.1 People.
What is the Average Household Size in Scotia
Average Household Size in Scotia is 2.3 People.
How Large is the Labor Force in Scotia?
There are 4,112 People in the Labor Forcein in Scotia.
What is the Percentage of People in the Labor Force in Scotia?
68.2% of People are in the Labor Force in Scotia.
What is the Unemployment Rate in Scotia?
Unemployment Rate in Scotia is 2.2%.