Boonville, NY Map & Demographics
Boonville Map
Boonville Overview
$32,149
PER CAPITA INCOME
$72,875
AVG FAMILY INCOME
$39,934
AVG HOUSEHOLD INCOME
20.8%
WAGE / INCOME GAP [ % ]
79.2¢/ $1
WAGE / INCOME GAP [ $ ]
$13,227
FAMILY INCOME DEFICIT
0.50
INEQUALITY / GINI INDEX
1,912
TOTAL POPULATION
805
MALE POPULATION
1,107
FEMALE POPULATION
72.72
MALES / 100 FEMALES
137.52
FEMALES / 100 MALES
46.0
MEDIAN AGE
2.7
AVG FAMILY SIZE
1.9
AVG HOUSEHOLD SIZE
892
LABOR FORCE [ PEOPLE ]
54.2%
PERCENT IN LABOR FORCE
8.0%
UNEMPLOYMENT RATE
Boonville Zip Codes
Boonville Area Codes
Income in Boonville
Income Overview in Boonville
Per Capita Income in Boonville is $32,149, while median incomes of families and households are $72,875 and $39,934 respectively.
| Characteristic | Number | Measure |
| Per Capita Income | 1,912 | $32,149 |
| Median Family Income | 441 | $72,875 |
| Mean Family Income | 441 | $88,900 |
| Median Household Income | 920 | $39,934 |
| Mean Household Income | 920 | $62,215 |
| Income Deficit | 441 | $13,227 |
| Wage / Income Gap (%) | 1,912 | 20.82% |
| Wage / Income Gap ($) | 1,912 | 79.18¢ per $1 |
| Gini / Inequality Index | 1,912 | 0.50 |
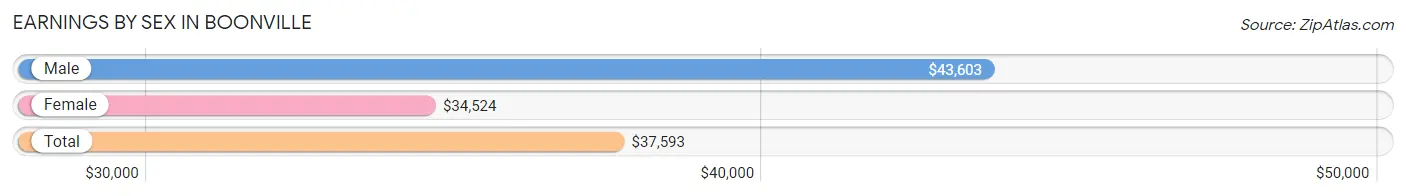
Earnings by Sex in Boonville
Average Earnings in Boonville are $37,593, $43,603 for men and $34,524 for women, a difference of 20.8%.
| Sex | Number | Average Earnings |
| Male | 498 (50.8%) | $43,603 |
| Female | 482 (49.2%) | $34,524 |
| Total | 980 (100.0%) | $37,593 |
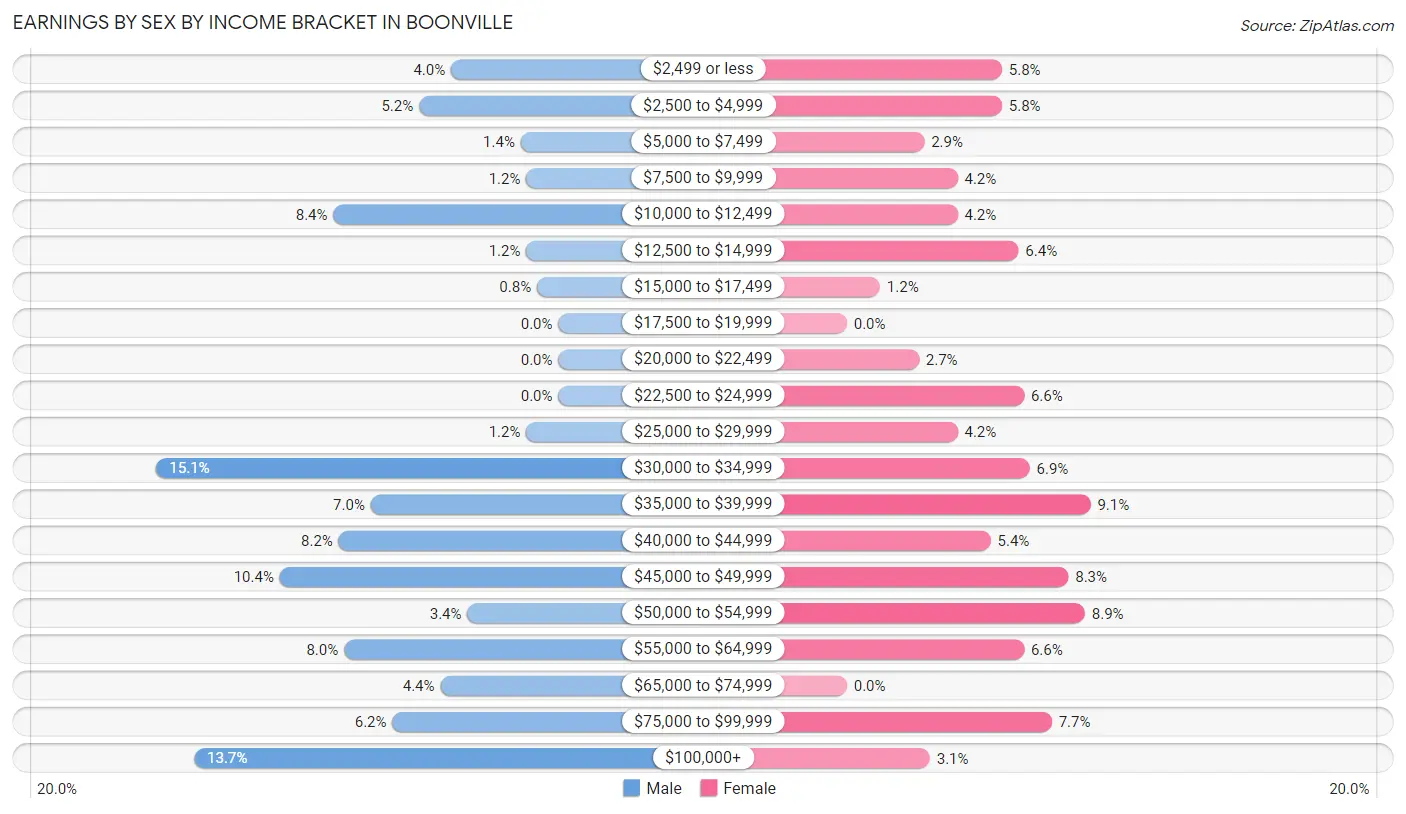
Earnings by Sex by Income Bracket in Boonville
The most common earnings brackets in Boonville are $30,000 to $34,999 for men (75 | 15.1%) and $35,000 to $39,999 for women (44 | 9.1%).
| Income | Male | Female |
| $2,499 or less | 20 (4.0%) | 28 (5.8%) |
| $2,500 to $4,999 | 26 (5.2%) | 28 (5.8%) |
| $5,000 to $7,499 | 7 (1.4%) | 14 (2.9%) |
| $7,500 to $9,999 | 6 (1.2%) | 20 (4.2%) |
| $10,000 to $12,499 | 42 (8.4%) | 20 (4.2%) |
| $12,500 to $14,999 | 6 (1.2%) | 31 (6.4%) |
| $15,000 to $17,499 | 4 (0.8%) | 6 (1.2%) |
| $17,500 to $19,999 | 0 (0.0%) | 0 (0.0%) |
| $20,000 to $22,499 | 0 (0.0%) | 13 (2.7%) |
| $22,500 to $24,999 | 0 (0.0%) | 32 (6.6%) |
| $25,000 to $29,999 | 6 (1.2%) | 20 (4.2%) |
| $30,000 to $34,999 | 75 (15.1%) | 33 (6.9%) |
| $35,000 to $39,999 | 35 (7.0%) | 44 (9.1%) |
| $40,000 to $44,999 | 41 (8.2%) | 26 (5.4%) |
| $45,000 to $49,999 | 52 (10.4%) | 40 (8.3%) |
| $50,000 to $54,999 | 17 (3.4%) | 43 (8.9%) |
| $55,000 to $64,999 | 40 (8.0%) | 32 (6.6%) |
| $65,000 to $74,999 | 22 (4.4%) | 0 (0.0%) |
| $75,000 to $99,999 | 31 (6.2%) | 37 (7.7%) |
| $100,000+ | 68 (13.7%) | 15 (3.1%) |
| Total | 498 (100.0%) | 482 (100.0%) |
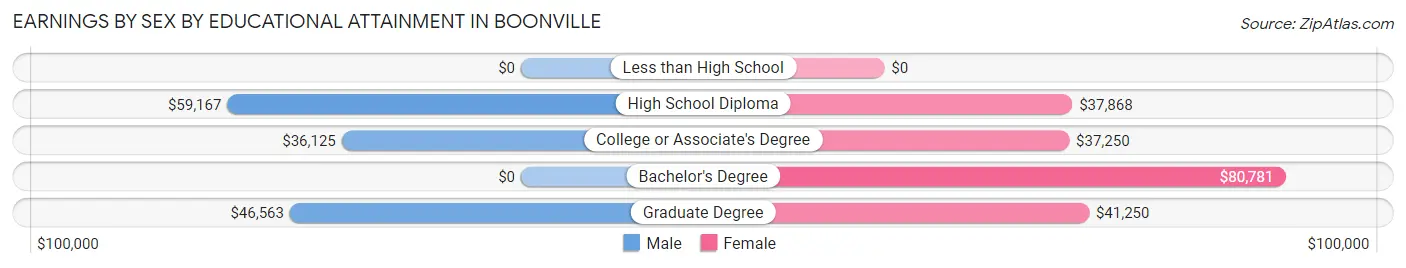
Earnings by Sex by Educational Attainment in Boonville
Average earnings in Boonville are $45,603 for men and $39,226 for women, a difference of 14.0%. Men with an educational attainment of high school diploma enjoy the highest average annual earnings of $59,167, while those with college or associate's degree education earn the least with $36,125. Women with an educational attainment of bachelor's degree earn the most with the average annual earnings of $80,781, while those with college or associate's degree education have the smallest earnings of $37,250.
| Educational Attainment | Male Income | Female Income |
| Less than High School | - | - |
| High School Diploma | $59,167 | $37,868 |
| College or Associate's Degree | $36,125 | $37,250 |
| Bachelor's Degree | - | - |
| Graduate Degree | $46,563 | $41,250 |
| Total | $45,603 | $39,226 |
Family Income in Boonville
Family Income Brackets in Boonville
According to the Boonville family income data, there are 102 families falling into the $100,000 to $149,999 income range, which is the most common income bracket and makes up 23.1% of all families.
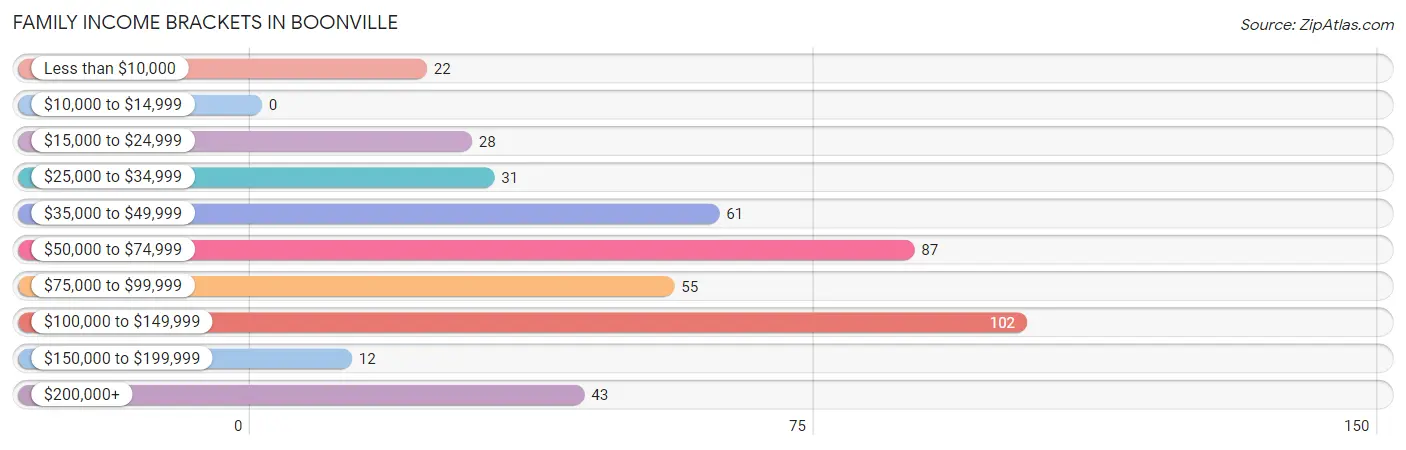
| Income Bracket | # Families | % Families |
| Less than $10,000 | 22 | 5.0% |
| $10,000 to $14,999 | 0 | 0.0% |
| $15,000 to $24,999 | 28 | 6.3% |
| $25,000 to $34,999 | 31 | 7.0% |
| $35,000 to $49,999 | 61 | 13.8% |
| $50,000 to $74,999 | 87 | 19.7% |
| $75,000 to $99,999 | 55 | 12.5% |
| $100,000 to $149,999 | 102 | 23.1% |
| $150,000 to $199,999 | 12 | 2.7% |
| $200,000+ | 43 | 9.8% |
Family Income by Famaliy Size in Boonville
2-person families (245 | 55.6%) account for the highest median family income in Boonville with $75,625 per family, while 2-person families (245 | 55.6%) have the highest median income of $37,812 per family member.
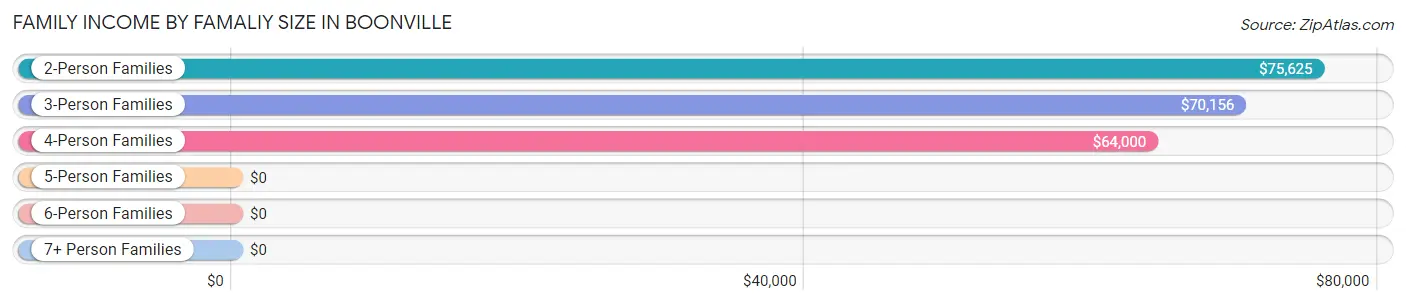
| Income Bracket | # Families | Median Income |
| 2-Person Families | 245 (55.6%) | $75,625 |
| 3-Person Families | 129 (29.2%) | $70,156 |
| 4-Person Families | 44 (10.0%) | $64,000 |
| 5-Person Families | 12 (2.7%) | $0 |
| 6-Person Families | 11 (2.5%) | $0 |
| 7+ Person Families | 0 (0.0%) | $0 |
| Total | 441 (100.0%) | $72,875 |
Family Income by Number of Earners in Boonville
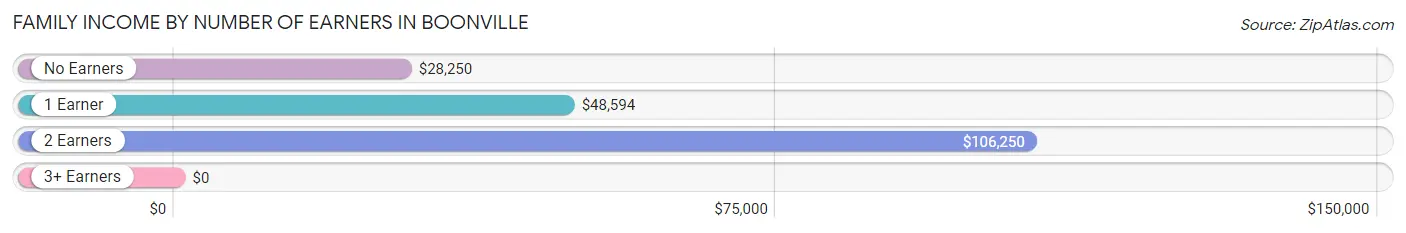
| Number of Earners | # Families | Median Income |
| No Earners | 69 (15.7%) | $28,250 |
| 1 Earner | 123 (27.9%) | $48,594 |
| 2 Earners | 194 (44.0%) | $106,250 |
| 3+ Earners | 55 (12.5%) | $0 |
| Total | 441 (100.0%) | $72,875 |
Household Income in Boonville
Household Income Brackets in Boonville
With 135 households falling in the category, the $50,000 to $74,999 income range is the most frequent in Boonville, accounting for 14.7% of all households. In contrast, only 27 households (2.9%) fall into the $150,000 to $199,999 income bracket, making it the least populous group.
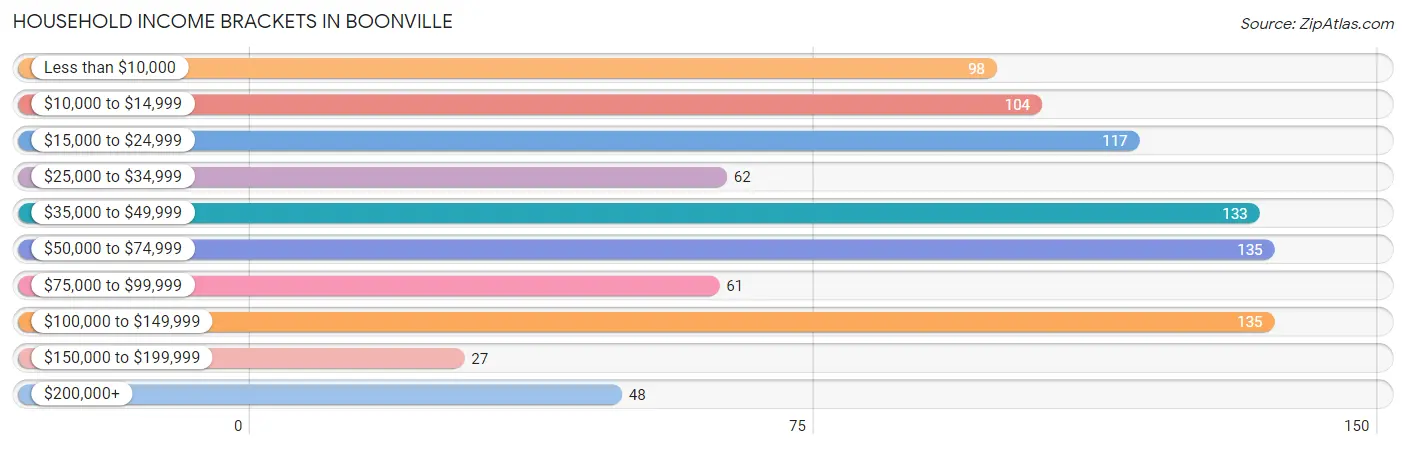
| Income Bracket | # Households | % Households |
| Less than $10,000 | 98 | 10.7% |
| $10,000 to $14,999 | 104 | 11.3% |
| $15,000 to $24,999 | 117 | 12.7% |
| $25,000 to $34,999 | 62 | 6.7% |
| $35,000 to $49,999 | 133 | 14.5% |
| $50,000 to $74,999 | 135 | 14.7% |
| $75,000 to $99,999 | 61 | 6.6% |
| $100,000 to $149,999 | 135 | 14.7% |
| $150,000 to $199,999 | 27 | 2.9% |
| $200,000+ | 48 | 5.2% |
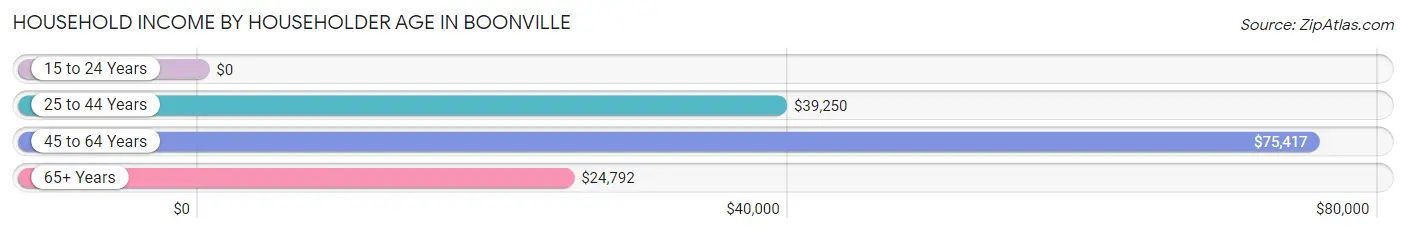
Household Income by Householder Age in Boonville
The median household income in Boonville is $39,934, with the highest median household income of $75,417 found in the 45 to 64 years age bracket for the primary householder. A total of 304 households (33.0%) fall into this category. Meanwhile, the 15 to 24 years age bracket for the primary householder has the lowest median household income of $0, with 21 households (2.3%) in this group.
| Income Bracket | # Households | Median Income |
| 15 to 24 Years | 21 (2.3%) | $0 |
| 25 to 44 Years | 280 (30.4%) | $39,250 |
| 45 to 64 Years | 304 (33.0%) | $75,417 |
| 65+ Years | 315 (34.2%) | $24,792 |
| Total | 920 (100.0%) | $39,934 |
Poverty in Boonville
Income Below Poverty by Sex and Age in Boonville
With 15.7% poverty level for males and 25.1% for females among the residents of Boonville, 35 to 44 year old males and 75 year old and over females are the most vulnerable to poverty, with 62 males (33.0%) and 65 females (41.1%) in their respective age groups living below the poverty level.
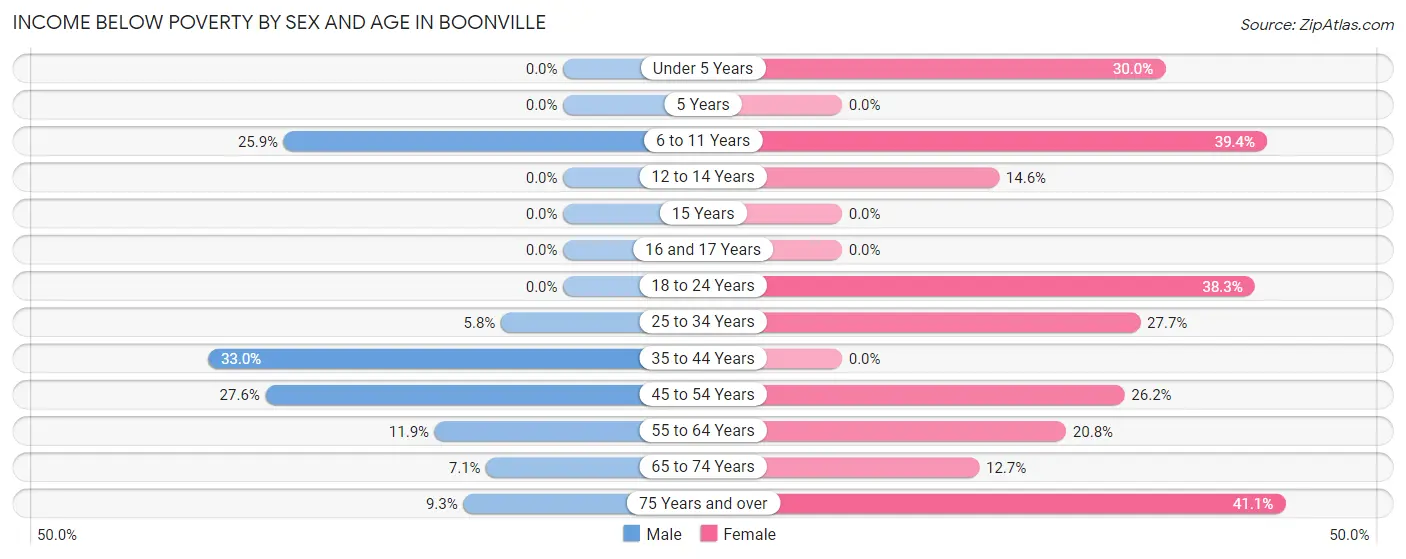
| Age Bracket | Male | Female |
| Under 5 Years | 0 (0.0%) | 9 (30.0%) |
| 5 Years | 0 (0.0%) | 0 (0.0%) |
| 6 to 11 Years | 7 (25.9%) | 28 (39.4%) |
| 12 to 14 Years | 0 (0.0%) | 7 (14.6%) |
| 15 Years | 0 (0.0%) | 0 (0.0%) |
| 16 and 17 Years | 0 (0.0%) | 0 (0.0%) |
| 18 to 24 Years | 0 (0.0%) | 36 (38.3%) |
| 25 to 34 Years | 6 (5.8%) | 36 (27.7%) |
| 35 to 44 Years | 62 (33.0%) | 0 (0.0%) |
| 45 to 54 Years | 21 (27.6%) | 32 (26.2%) |
| 55 to 64 Years | 18 (11.9%) | 26 (20.8%) |
| 65 to 74 Years | 4 (7.1%) | 20 (12.7%) |
| 75 Years and over | 5 (9.3%) | 65 (41.1%) |
| Total | 123 (15.7%) | 259 (25.1%) |
Income Above Poverty by Sex and Age in Boonville
According to the poverty statistics in Boonville, males aged under 5 years and females aged 5 years are the age groups that are most secure financially, with 100.0% of males and 100.0% of females in these age groups living above the poverty line.
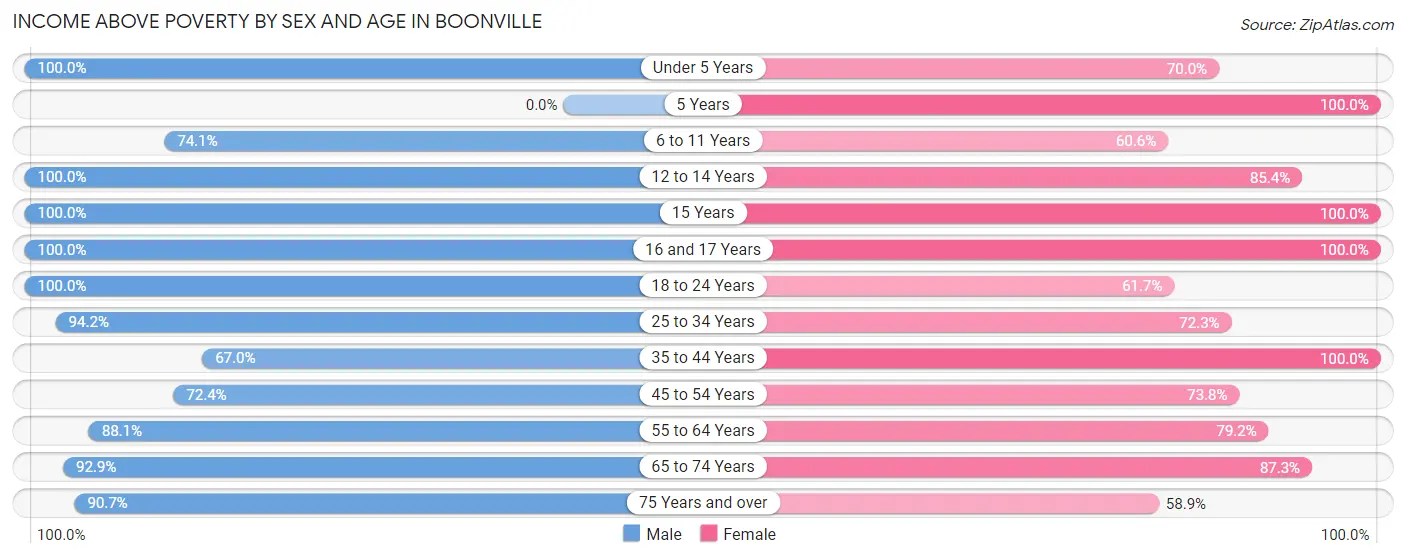
| Age Bracket | Male | Female |
| Under 5 Years | 45 (100.0%) | 21 (70.0%) |
| 5 Years | 0 (0.0%) | 7 (100.0%) |
| 6 to 11 Years | 20 (74.1%) | 43 (60.6%) |
| 12 to 14 Years | 19 (100.0%) | 41 (85.4%) |
| 15 Years | 7 (100.0%) | 13 (100.0%) |
| 16 and 17 Years | 15 (100.0%) | 13 (100.0%) |
| 18 to 24 Years | 44 (100.0%) | 58 (61.7%) |
| 25 to 34 Years | 98 (94.2%) | 94 (72.3%) |
| 35 to 44 Years | 126 (67.0%) | 66 (100.0%) |
| 45 to 54 Years | 55 (72.4%) | 90 (73.8%) |
| 55 to 64 Years | 133 (88.1%) | 99 (79.2%) |
| 65 to 74 Years | 52 (92.9%) | 137 (87.3%) |
| 75 Years and over | 49 (90.7%) | 93 (58.9%) |
| Total | 663 (84.4%) | 775 (75.0%) |
Income Below Poverty Among Married-Couple Families in Boonville
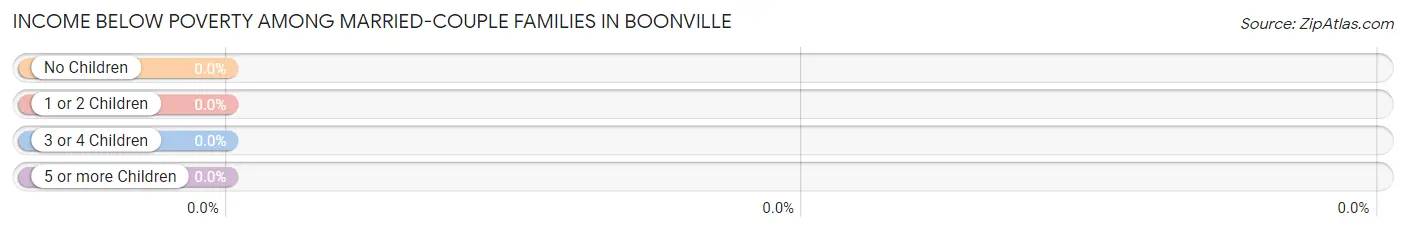
| Children | Above Poverty | Below Poverty |
| No Children | 195 (100.0%) | 0 (0.0%) |
| 1 or 2 Children | 70 (100.0%) | 0 (0.0%) |
| 3 or 4 Children | 23 (100.0%) | 0 (0.0%) |
| 5 or more Children | 0 (0.0%) | 0 (0.0%) |
| Total | 288 (100.0%) | 0 (0.0%) |
Income Below Poverty Among Single-Parent Households in Boonville
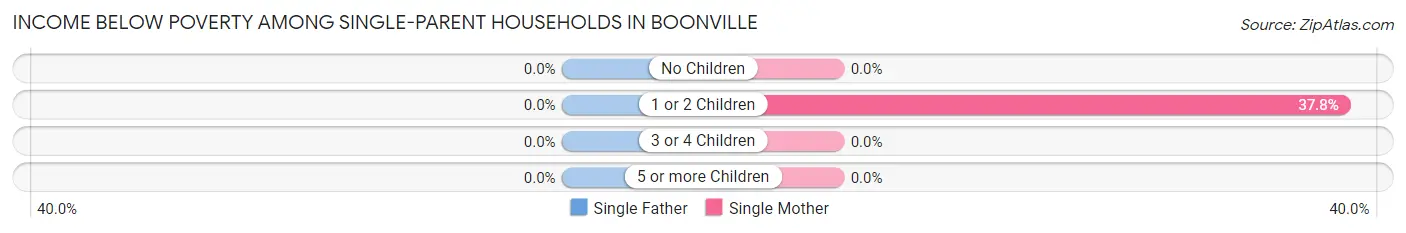
| Children | Single Father | Single Mother |
| No Children | 0 (0.0%) | 0 (0.0%) |
| 1 or 2 Children | 0 (0.0%) | 37 (37.8%) |
| 3 or 4 Children | 0 (0.0%) | 0 (0.0%) |
| 5 or more Children | 0 (0.0%) | 0 (0.0%) |
| Total | 0 (0.0%) | 37 (27.0%) |
Income Below Poverty Among Married-Couple vs Single-Parent Households in Boonville
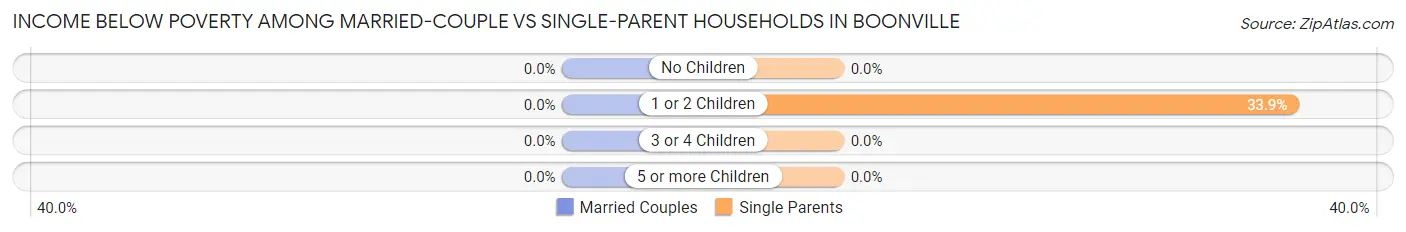
| Children | Married-Couple Families | Single-Parent Households |
| No Children | 0 (0.0%) | 0 (0.0%) |
| 1 or 2 Children | 0 (0.0%) | 37 (33.9%) |
| 3 or 4 Children | 0 (0.0%) | 0 (0.0%) |
| 5 or more Children | 0 (0.0%) | 0 (0.0%) |
| Total | 0 (0.0%) | 37 (24.2%) |
Race in Boonville
The most populous races in Boonville are White / Caucasian (1,796 | 93.9%), Two or more Races (79 | 4.1%), and Black / African American (36 | 1.9%).
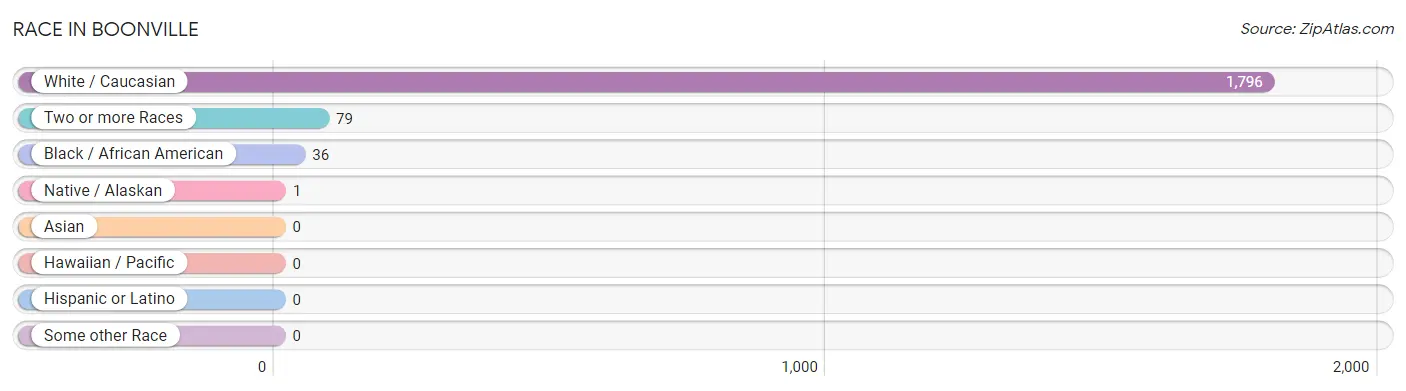
| Race | # Population | % Population |
| Asian | 0 | 0.0% |
| Black / African American | 36 | 1.9% |
| Hawaiian / Pacific | 0 | 0.0% |
| Hispanic or Latino | 0 | 0.0% |
| Native / Alaskan | 1 | 0.1% |
| White / Caucasian | 1,796 | 93.9% |
| Two or more Races | 79 | 4.1% |
| Some other Race | 0 | 0.0% |
| Total | 1,912 | 100.0% |
Ancestry in Boonville
The most populous ancestries reported in Boonville are German (397 | 20.8%), English (269 | 14.1%), Irish (266 | 13.9%), American (244 | 12.8%), and Polish (222 | 11.6%), together accounting for 73.1% of all Boonville residents.
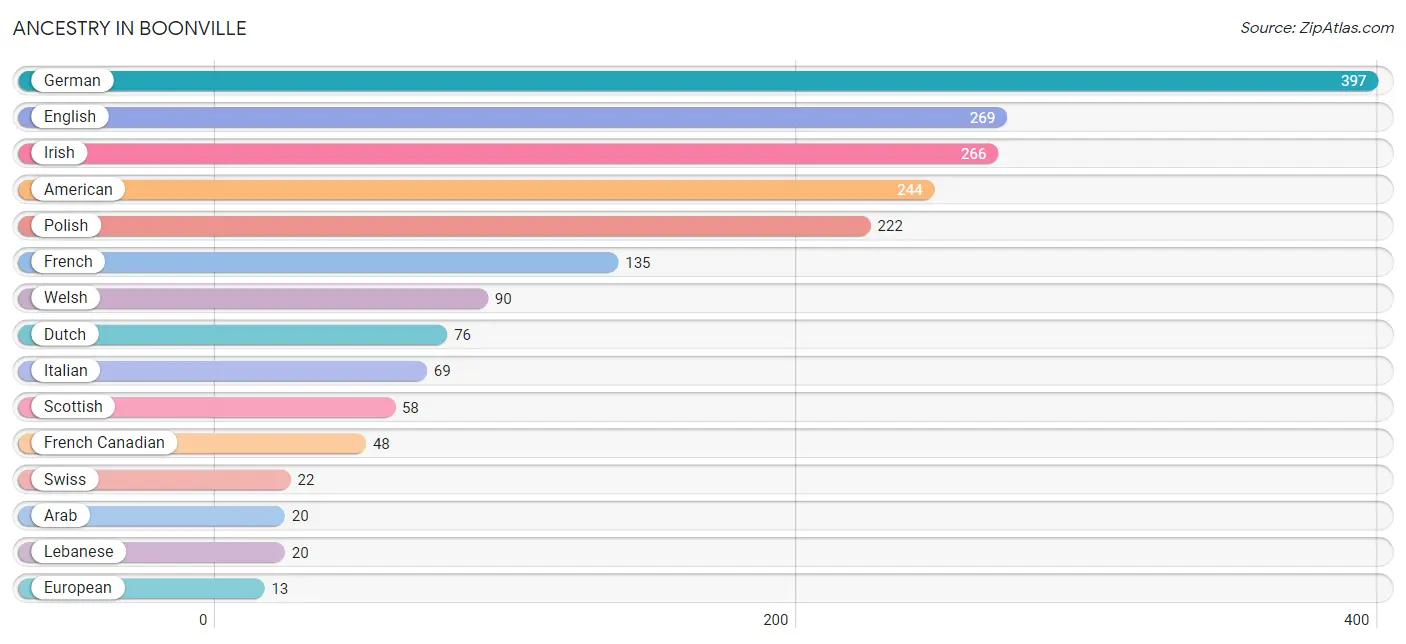
| Ancestry | # Population | % Population |
| American | 244 | 12.8% |
| Arab | 20 | 1.1% |
| Bulgarian | 5 | 0.3% |
| Canadian | 4 | 0.2% |
| Chippewa | 6 | 0.3% |
| Croatian | 8 | 0.4% |
| Czechoslovakian | 6 | 0.3% |
| Danish | 10 | 0.5% |
| Dutch | 76 | 4.0% |
| English | 269 | 14.1% |
| European | 13 | 0.7% |
| French | 135 | 7.1% |
| French American Indian | 4 | 0.2% |
| French Canadian | 48 | 2.5% |
| German | 397 | 20.8% |
| Hungarian | 8 | 0.4% |
| Irish | 266 | 13.9% |
| Israeli | 6 | 0.3% |
| Italian | 69 | 3.6% |
| Korean | 1 | 0.1% |
| Lebanese | 20 | 1.1% |
| Native Hawaiian | 1 | 0.1% |
| Polish | 222 | 11.6% |
| Russian | 5 | 0.3% |
| Scotch-Irish | 9 | 0.5% |
| Scottish | 58 | 3.0% |
| Swedish | 7 | 0.4% |
| Swiss | 22 | 1.1% |
| Welsh | 90 | 4.7% | View All 29 Rows |
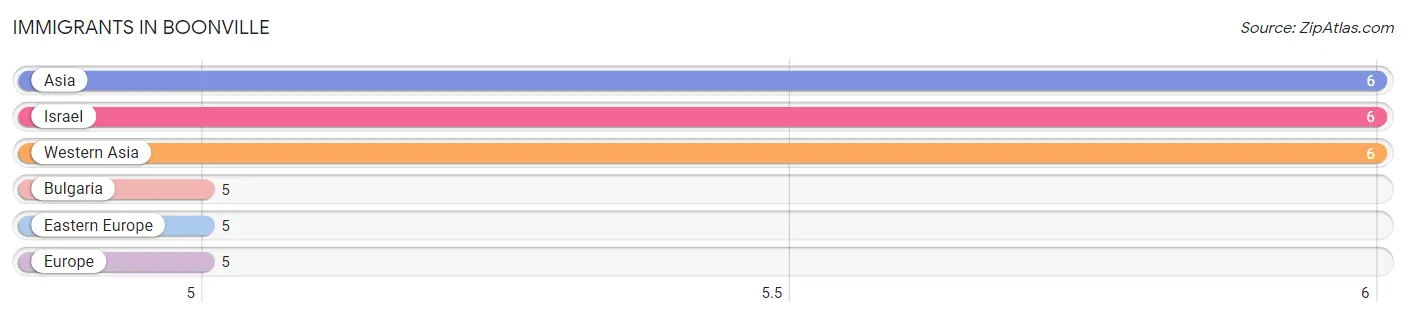
Immigrants in Boonville
The most numerous immigrant groups reported in Boonville came from Asia (6 | 0.3%), Israel (6 | 0.3%), Western Asia (6 | 0.3%), Bulgaria (5 | 0.3%), and Eastern Europe (5 | 0.3%), together accounting for 1.4% of all Boonville residents.
| Immigration Origin | # Population | % Population |
| Asia | 6 | 0.3% |
| Bulgaria | 5 | 0.3% |
| Eastern Europe | 5 | 0.3% |
| Europe | 5 | 0.3% |
| Israel | 6 | 0.3% |
| Western Asia | 6 | 0.3% | View All 6 Rows |
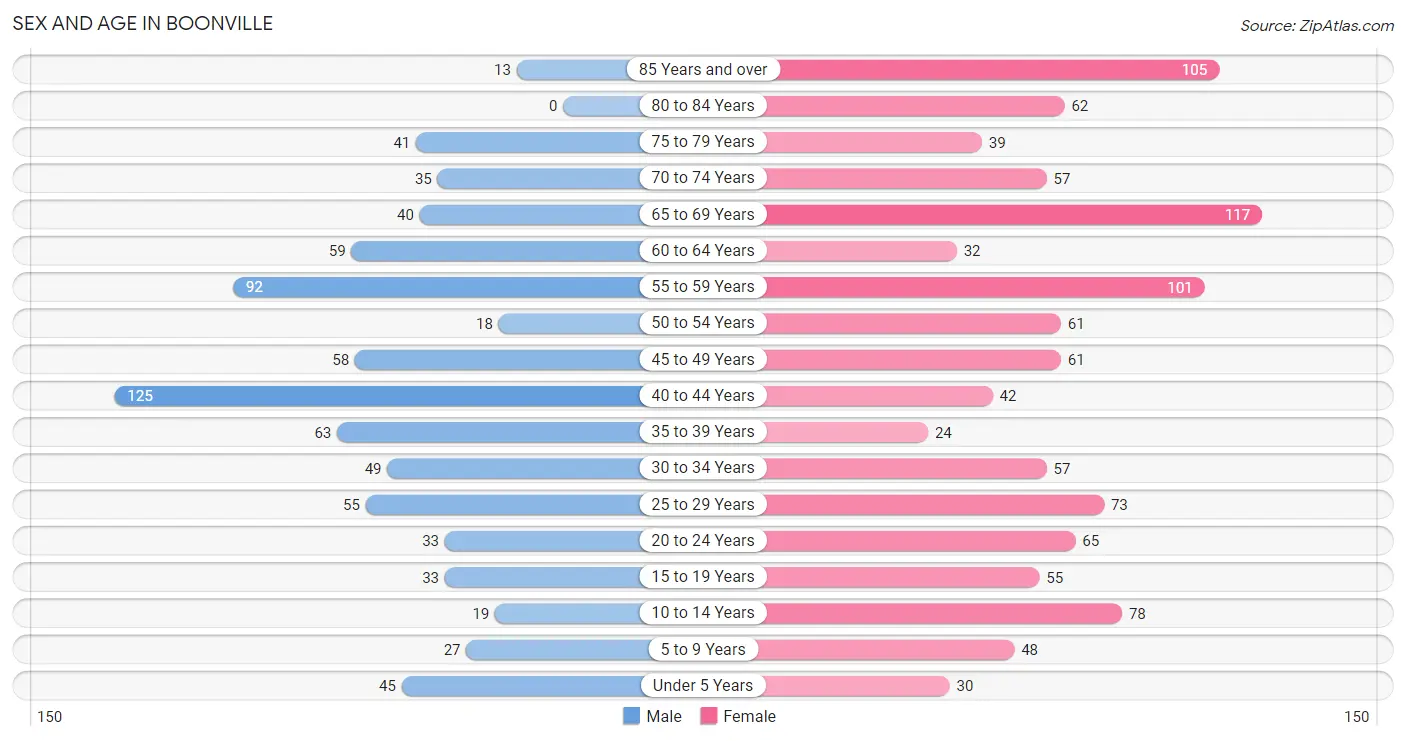
Sex and Age in Boonville
Sex and Age in Boonville
The most populous age groups in Boonville are 40 to 44 Years (125 | 15.5%) for men and 65 to 69 Years (117 | 10.6%) for women.
| Age Bracket | Male | Female |
| Under 5 Years | 45 (5.6%) | 30 (2.7%) |
| 5 to 9 Years | 27 (3.4%) | 48 (4.3%) |
| 10 to 14 Years | 19 (2.4%) | 78 (7.0%) |
| 15 to 19 Years | 33 (4.1%) | 55 (5.0%) |
| 20 to 24 Years | 33 (4.1%) | 65 (5.9%) |
| 25 to 29 Years | 55 (6.8%) | 73 (6.6%) |
| 30 to 34 Years | 49 (6.1%) | 57 (5.1%) |
| 35 to 39 Years | 63 (7.8%) | 24 (2.2%) |
| 40 to 44 Years | 125 (15.5%) | 42 (3.8%) |
| 45 to 49 Years | 58 (7.2%) | 61 (5.5%) |
| 50 to 54 Years | 18 (2.2%) | 61 (5.5%) |
| 55 to 59 Years | 92 (11.4%) | 101 (9.1%) |
| 60 to 64 Years | 59 (7.3%) | 32 (2.9%) |
| 65 to 69 Years | 40 (5.0%) | 117 (10.6%) |
| 70 to 74 Years | 35 (4.3%) | 57 (5.1%) |
| 75 to 79 Years | 41 (5.1%) | 39 (3.5%) |
| 80 to 84 Years | 0 (0.0%) | 62 (5.6%) |
| 85 Years and over | 13 (1.6%) | 105 (9.5%) |
| Total | 805 (100.0%) | 1,107 (100.0%) |
Families and Households in Boonville
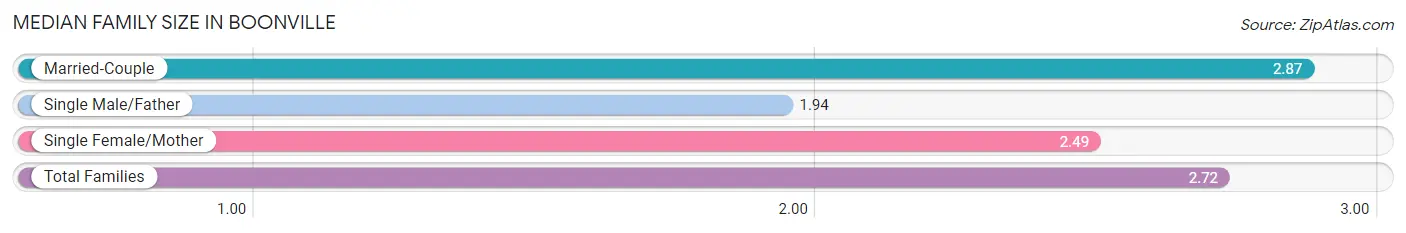
Median Family Size in Boonville
The median family size in Boonville is 2.72 persons per family, with married-couple families (288 | 65.3%) accounting for the largest median family size of 2.87 persons per family. On the other hand, single male/father families (16 | 3.6%) represent the smallest median family size with 1.94 persons per family.
| Family Type | # Families | Family Size |
| Married-Couple | 288 (65.3%) | 2.87 |
| Single Male/Father | 16 (3.6%) | 1.94 |
| Single Female/Mother | 137 (31.1%) | 2.49 |
| Total Families | 441 (100.0%) | 2.72 |
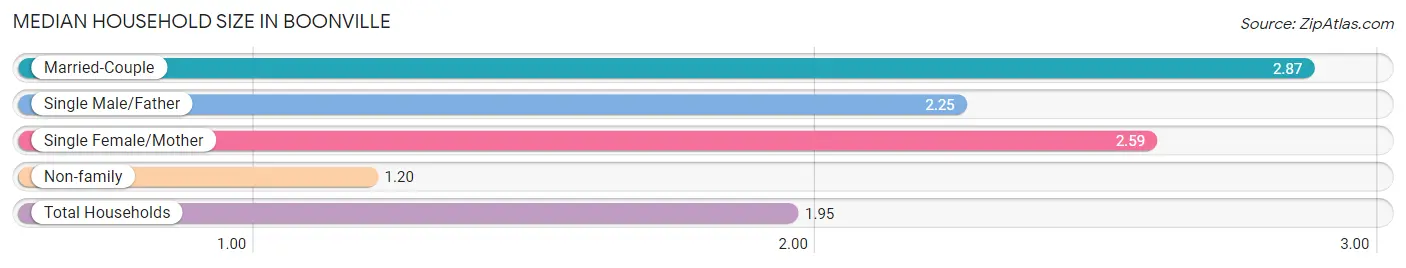
Median Household Size in Boonville
The median household size in Boonville is 1.95 persons per household, with married-couple households (288 | 31.3%) accounting for the largest median household size of 2.87 persons per household. non-family households (479 | 52.1%) represent the smallest median household size with 1.20 persons per household.
| Household Type | # Households | Household Size |
| Married-Couple | 288 (31.3%) | 2.87 |
| Single Male/Father | 16 (1.7%) | 2.25 |
| Single Female/Mother | 137 (14.9%) | 2.59 |
| Non-family | 479 (52.1%) | 1.20 |
| Total Households | 920 (100.0%) | 1.95 |
Household Size by Marriage Status in Boonville
Out of a total of 920 households in Boonville, 441 (47.9%) are family households, while 479 (52.1%) are nonfamily households. The most numerous type of family households are 2-person households, comprising 229, and the most common type of nonfamily households are 1-person households, comprising 377.
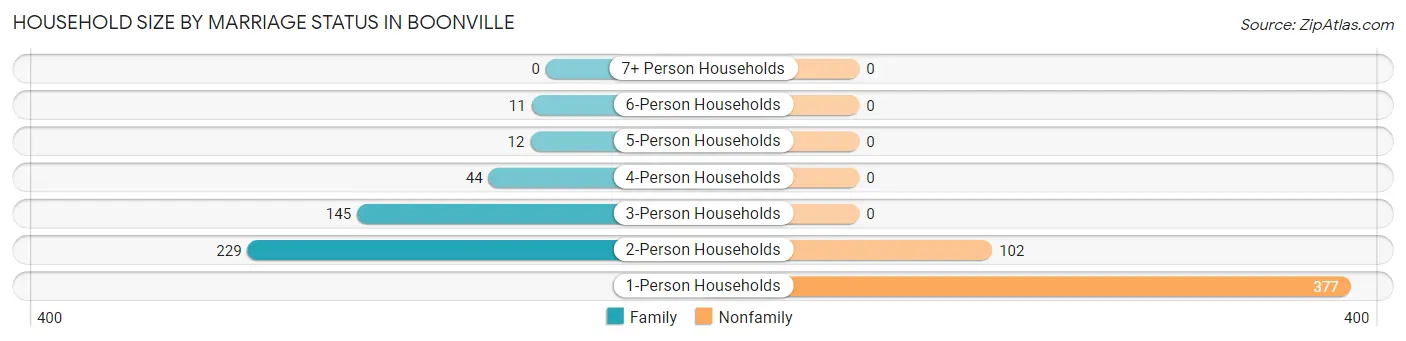
| Household Size | Family Households | Nonfamily Households |
| 1-Person Households | - | 377 (41.0%) |
| 2-Person Households | 229 (24.9%) | 102 (11.1%) |
| 3-Person Households | 145 (15.8%) | 0 (0.0%) |
| 4-Person Households | 44 (4.8%) | 0 (0.0%) |
| 5-Person Households | 12 (1.3%) | 0 (0.0%) |
| 6-Person Households | 11 (1.2%) | 0 (0.0%) |
| 7+ Person Households | 0 (0.0%) | 0 (0.0%) |
| Total | 441 (47.9%) | 479 (52.1%) |
Female Fertility in Boonville
Fertility by Age in Boonville
Average fertility rate in Boonville is 57.0 births per 1,000 women. Women in the age bracket of 35 to 50 years have the highest fertility rate with 119.0 births per 1,000 women. Women in the age bracket of 35 to 50 years acount for 78.3% of all women with births.
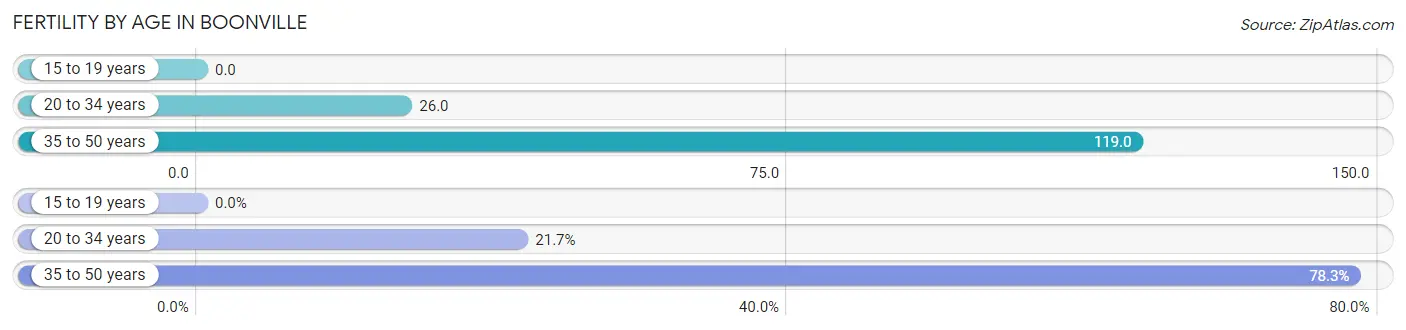
| Age Bracket | Women with Births | Births / 1,000 Women |
| 15 to 19 years | 0 (0.0%) | 0.0 |
| 20 to 34 years | 5 (21.7%) | 26.0 |
| 35 to 50 years | 18 (78.3%) | 119.0 |
| Total | 23 (100.0%) | 57.0 |
Fertility by Age by Marriage Status in Boonville
21.7% of women with births (23) in Boonville are married. The highest percentage of unmarried women with births falls into 35 to 50 years age bracket with 100.0% of them unmarried at the time of birth, while the lowest percentage of unmarried women with births belong to 20 to 34 years age bracket with 0.0% of them unmarried.
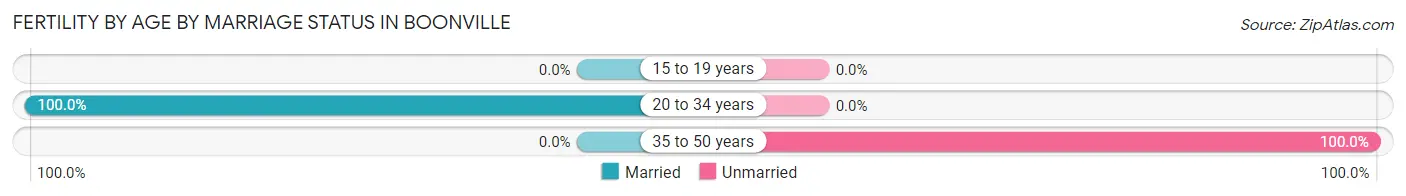
| Age Bracket | Married | Unmarried |
| 15 to 19 years | 0 (0.0%) | 0 (0.0%) |
| 20 to 34 years | 5 (100.0%) | 0 (0.0%) |
| 35 to 50 years | 0 (0.0%) | 18 (100.0%) |
| Total | 5 (21.7%) | 18 (78.3%) |
Fertility by Education in Boonville
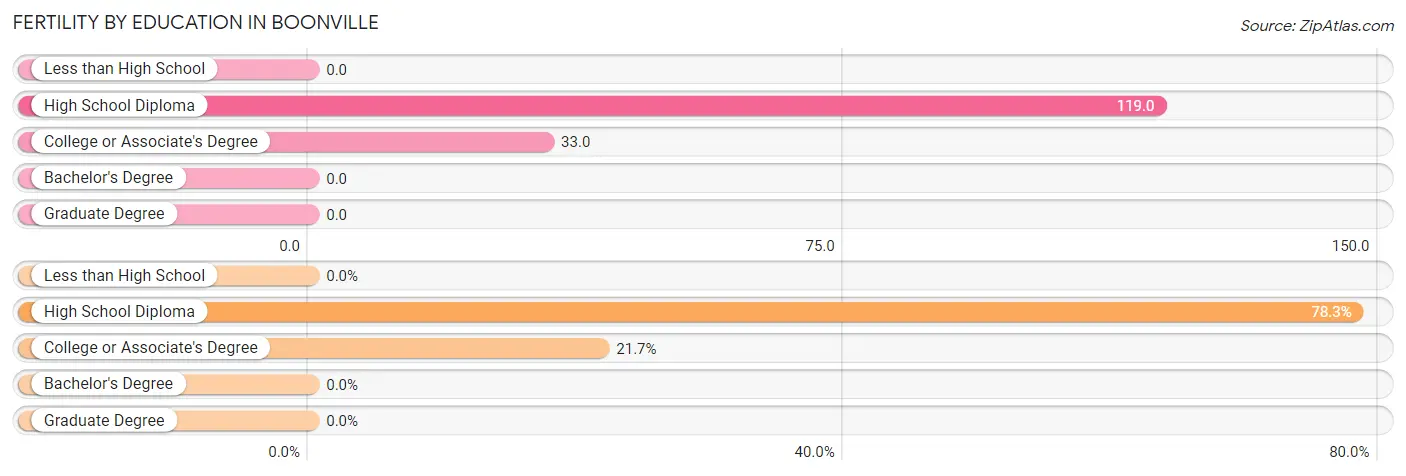
| Educational Attainment | Women with Births | Births / 1,000 Women |
| Less than High School | 0 (0.0%) | 0.0 |
| High School Diploma | 18 (78.3%) | 119.0 |
| College or Associate's Degree | 5 (21.7%) | 33.0 |
| Bachelor's Degree | 0 (0.0%) | 0.0 |
| Graduate Degree | 0 (0.0%) | 0.0 |
| Total | 23 (100.0%) | 57.0 |
Fertility by Education by Marriage Status in Boonville
78.3% of women with births in Boonville are unmarried. Women with the educational attainment of college or associate's degree are most likely to be married with 100.0% of them married at childbirth, while women with the educational attainment of high school diploma are least likely to be married with 100.0% of them unmarried at childbirth.
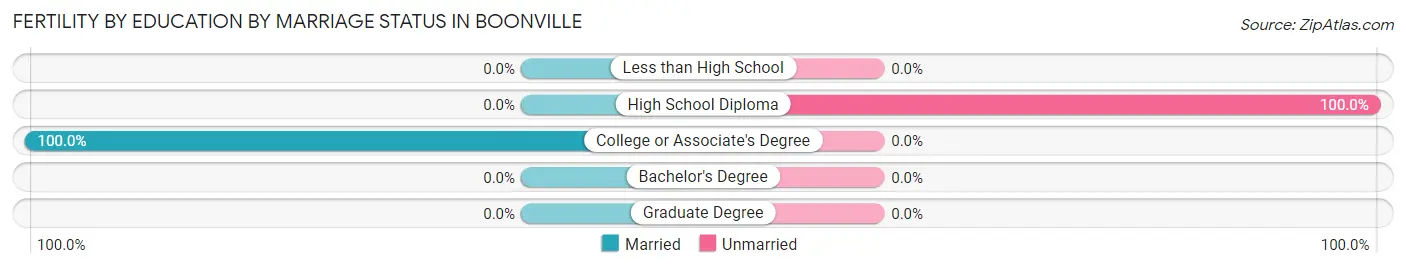
| Educational Attainment | Married | Unmarried |
| Less than High School | 0 (0.0%) | 0 (0.0%) |
| High School Diploma | 0 (0.0%) | 18 (100.0%) |
| College or Associate's Degree | 5 (100.0%) | 0 (0.0%) |
| Bachelor's Degree | 0 (0.0%) | 0 (0.0%) |
| Graduate Degree | 0 (0.0%) | 0 (0.0%) |
| Total | 5 (21.7%) | 18 (78.3%) |
Employment Characteristics in Boonville
Employment by Class of Employer in Boonville
Among the 815 employed individuals in Boonville, private company employees (513 | 62.9%), local government employees (95 | 11.7%), and not-for-profit organizations (90 | 11.0%) make up the most common classes of employment.
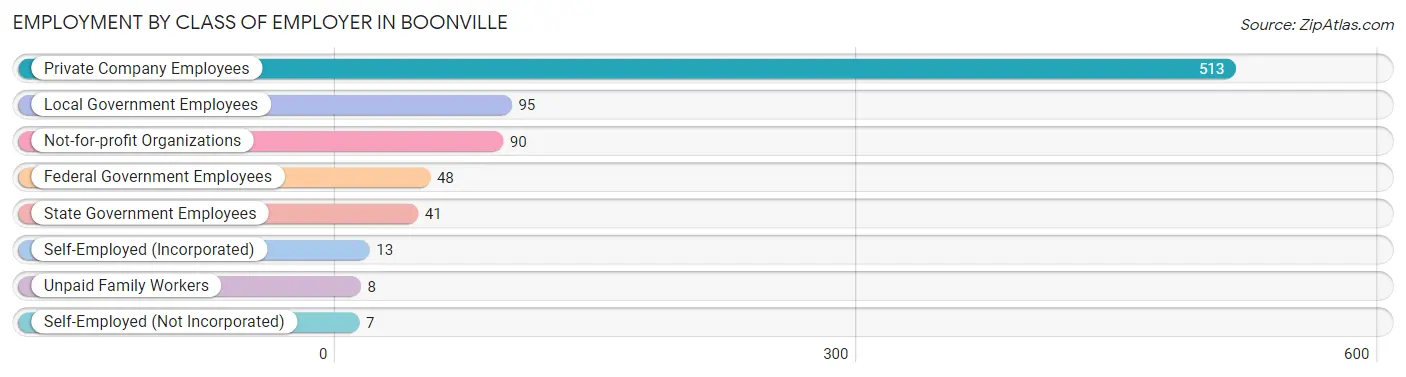
| Employer Class | # Employees | % Employees |
| Private Company Employees | 513 | 62.9% |
| Self-Employed (Incorporated) | 13 | 1.6% |
| Self-Employed (Not Incorporated) | 7 | 0.9% |
| Not-for-profit Organizations | 90 | 11.0% |
| Local Government Employees | 95 | 11.7% |
| State Government Employees | 41 | 5.0% |
| Federal Government Employees | 48 | 5.9% |
| Unpaid Family Workers | 8 | 1.0% |
| Total | 815 | 100.0% |
Employment Status by Age in Boonville
According to the labor force statistics for Boonville, out of the total population over 16 years of age (1,645), 54.2% or 892 individuals are in the labor force, with 8.0% or 71 of them unemployed. The age group with the highest labor force participation rate is 30 to 34 years, with 93.4% or 99 individuals in the labor force. Within the labor force, the 16 to 19 years age range has the highest percentage of unemployed individuals, with 60.0% or 12 of them being unemployed.
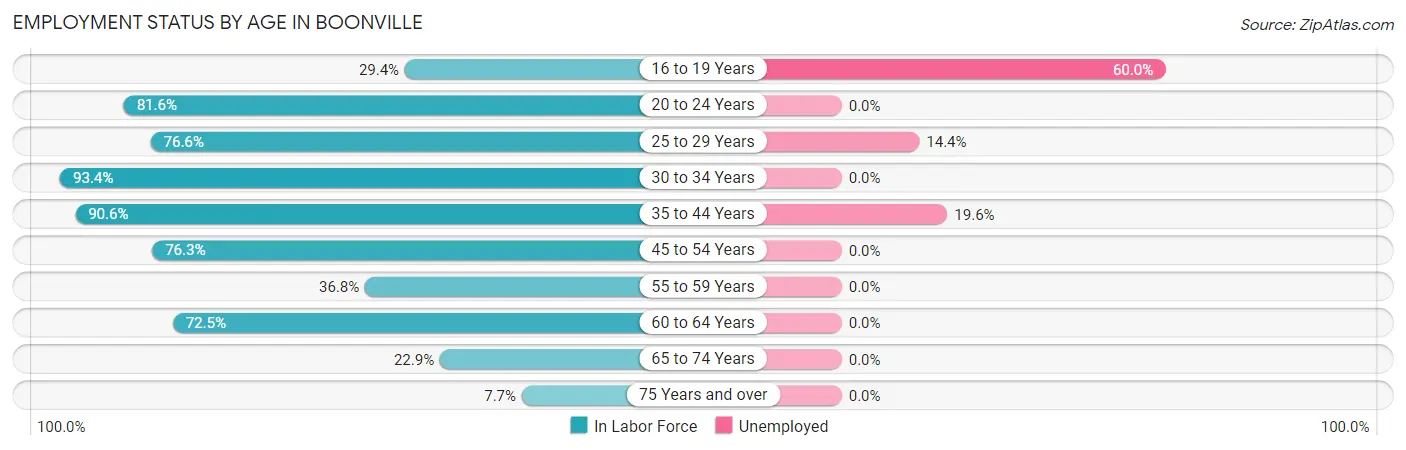
| Age Bracket | In Labor Force | Unemployed |
| 16 to 19 Years | 20 (29.4%) | 12 (60.0%) |
| 20 to 24 Years | 80 (81.6%) | 0 (0.0%) |
| 25 to 29 Years | 98 (76.6%) | 14 (14.4%) |
| 30 to 34 Years | 99 (93.4%) | 0 (0.0%) |
| 35 to 44 Years | 230 (90.6%) | 45 (19.6%) |
| 45 to 54 Years | 151 (76.3%) | 0 (0.0%) |
| 55 to 59 Years | 71 (36.8%) | 0 (0.0%) |
| 60 to 64 Years | 66 (72.5%) | 0 (0.0%) |
| 65 to 74 Years | 57 (22.9%) | 0 (0.0%) |
| 75 Years and over | 20 (7.7%) | 0 (0.0%) |
| Total | 892 (54.2%) | 71 (8.0%) |
Employment Status by Educational Attainment in Boonville
According to labor force statistics for Boonville, 73.7% of individuals (715) out of the total population between 25 and 64 years of age (970) are in the labor force, with 8.4% or 60 of them being unemployed. The group with the highest labor force participation rate are those with the educational attainment of bachelor's degree or higher, with 86.9% or 146 individuals in the labor force. Within the labor force, individuals with high school diploma education have the highest percentage of unemployment, with 19.6% or 54 of them being unemployed.
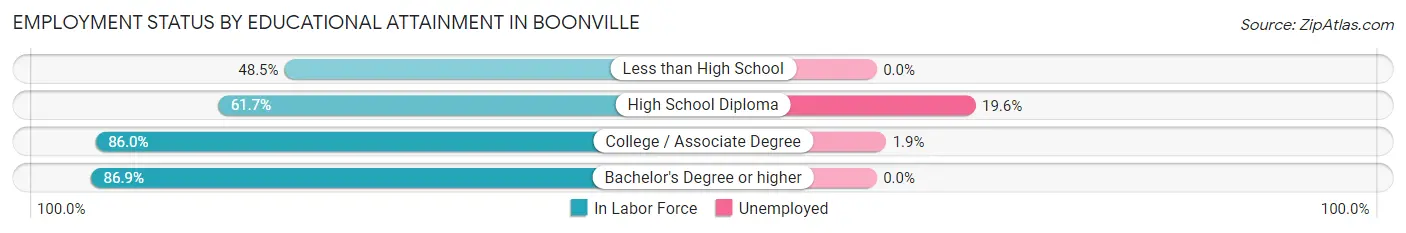
| Educational Attainment | In Labor Force | Unemployed |
| Less than High School | 16 (48.5%) | 0 (0.0%) |
| High School Diploma | 276 (61.7%) | 88 (19.6%) |
| College / Associate Degree | 277 (86.0%) | 6 (1.9%) |
| Bachelor's Degree or higher | 146 (86.9%) | 0 (0.0%) |
| Total | 715 (73.7%) | 81 (8.4%) |
Employment Occupations by Sex in Boonville
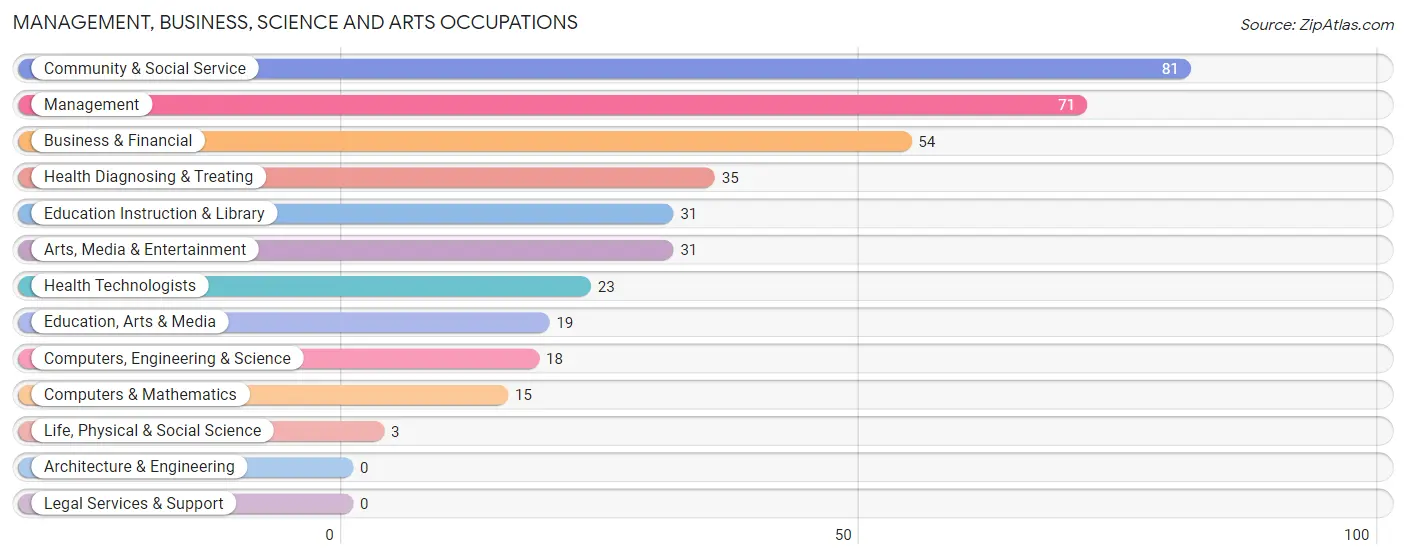
Management, Business, Science and Arts Occupations
The most common Management, Business, Science and Arts occupations in Boonville are Community & Social Service (81 | 10.0%), Management (71 | 8.7%), Business & Financial (54 | 6.7%), Health Diagnosing & Treating (35 | 4.3%), and Education Instruction & Library (31 | 3.8%).
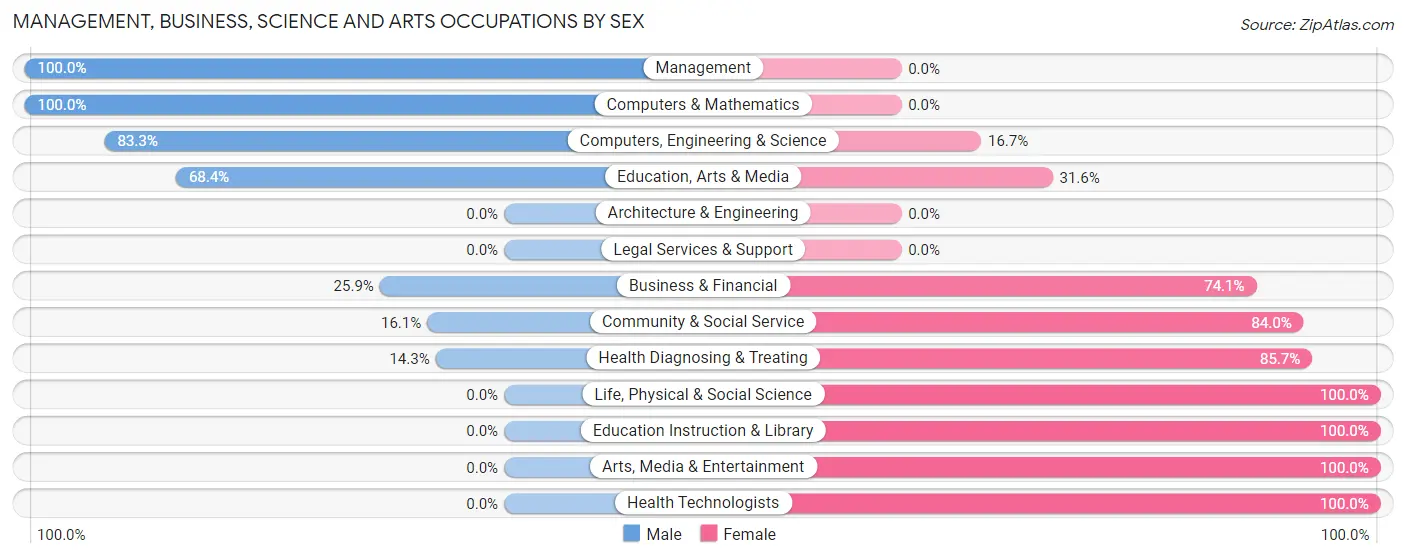
Management, Business, Science and Arts Occupations by Sex
Within the Management, Business, Science and Arts occupations in Boonville, the most male-oriented occupations are Management (100.0%), Computers & Mathematics (100.0%), and Computers, Engineering & Science (83.3%), while the most female-oriented occupations are Life, Physical & Social Science (100.0%), Education Instruction & Library (100.0%), and Arts, Media & Entertainment (100.0%).
| Occupation | Male | Female |
| Management | 71 (100.0%) | 0 (0.0%) |
| Business & Financial | 14 (25.9%) | 40 (74.1%) |
| Computers, Engineering & Science | 15 (83.3%) | 3 (16.7%) |
| Computers & Mathematics | 15 (100.0%) | 0 (0.0%) |
| Architecture & Engineering | 0 (0.0%) | 0 (0.0%) |
| Life, Physical & Social Science | 0 (0.0%) | 3 (100.0%) |
| Community & Social Service | 13 (16.1%) | 68 (84.0%) |
| Education, Arts & Media | 13 (68.4%) | 6 (31.6%) |
| Legal Services & Support | 0 (0.0%) | 0 (0.0%) |
| Education Instruction & Library | 0 (0.0%) | 31 (100.0%) |
| Arts, Media & Entertainment | 0 (0.0%) | 31 (100.0%) |
| Health Diagnosing & Treating | 5 (14.3%) | 30 (85.7%) |
| Health Technologists | 0 (0.0%) | 23 (100.0%) |
| Total (Category) | 118 (45.6%) | 141 (54.4%) |
| Total (Overall) | 407 (50.1%) | 405 (49.9%) |
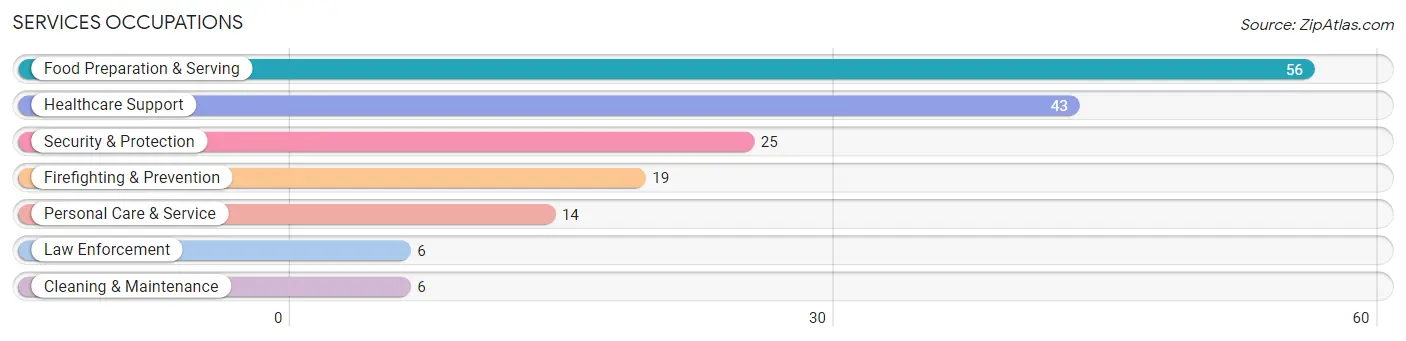
Services Occupations
The most common Services occupations in Boonville are Food Preparation & Serving (56 | 6.9%), Healthcare Support (43 | 5.3%), Security & Protection (25 | 3.1%), Firefighting & Prevention (19 | 2.3%), and Personal Care & Service (14 | 1.7%).
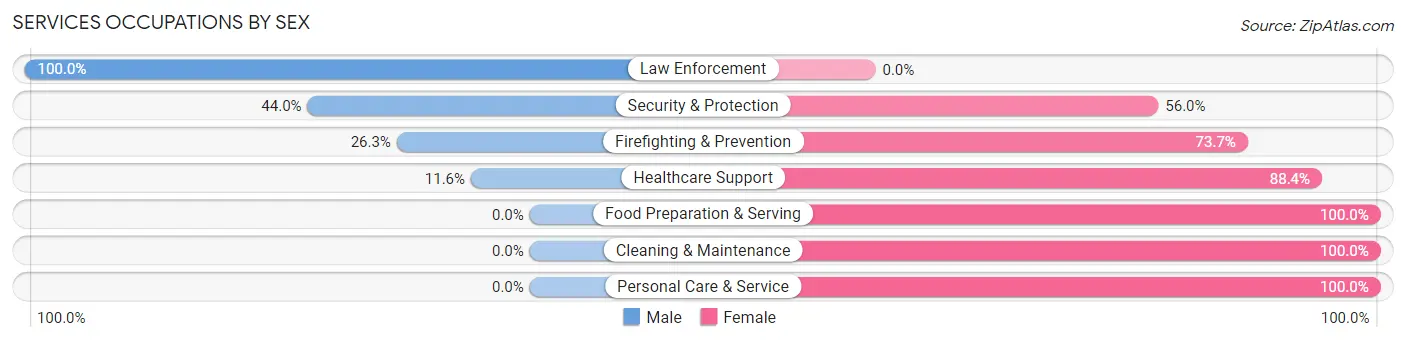
Services Occupations by Sex
Within the Services occupations in Boonville, the most male-oriented occupations are Law Enforcement (100.0%), Security & Protection (44.0%), and Firefighting & Prevention (26.3%), while the most female-oriented occupations are Food Preparation & Serving (100.0%), Cleaning & Maintenance (100.0%), and Personal Care & Service (100.0%).
| Occupation | Male | Female |
| Healthcare Support | 5 (11.6%) | 38 (88.4%) |
| Security & Protection | 11 (44.0%) | 14 (56.0%) |
| Firefighting & Prevention | 5 (26.3%) | 14 (73.7%) |
| Law Enforcement | 6 (100.0%) | 0 (0.0%) |
| Food Preparation & Serving | 0 (0.0%) | 56 (100.0%) |
| Cleaning & Maintenance | 0 (0.0%) | 6 (100.0%) |
| Personal Care & Service | 0 (0.0%) | 14 (100.0%) |
| Total (Category) | 16 (11.1%) | 128 (88.9%) |
| Total (Overall) | 407 (50.1%) | 405 (49.9%) |
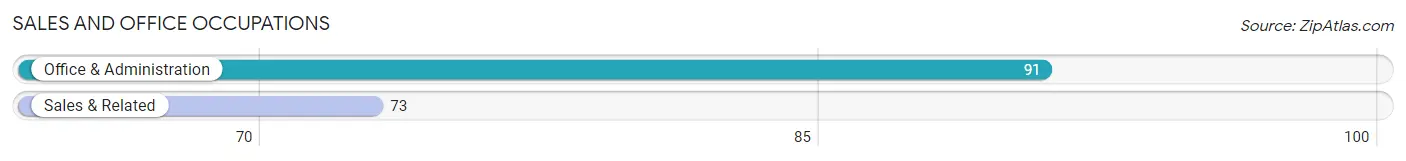
Sales and Office Occupations
The most common Sales and Office occupations in Boonville are Office & Administration (91 | 11.2%), and Sales & Related (73 | 9.0%).
Sales and Office Occupations by Sex
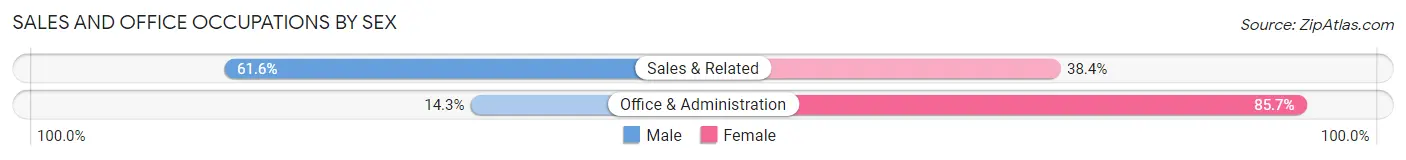
| Occupation | Male | Female |
| Sales & Related | 45 (61.6%) | 28 (38.4%) |
| Office & Administration | 13 (14.3%) | 78 (85.7%) |
| Total (Category) | 58 (35.4%) | 106 (64.6%) |
| Total (Overall) | 407 (50.1%) | 405 (49.9%) |
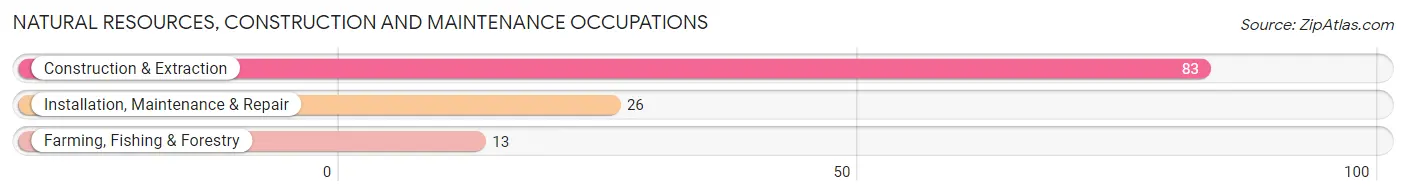
Natural Resources, Construction and Maintenance Occupations
The most common Natural Resources, Construction and Maintenance occupations in Boonville are Construction & Extraction (83 | 10.2%), Installation, Maintenance & Repair (26 | 3.2%), and Farming, Fishing & Forestry (13 | 1.6%).
Natural Resources, Construction and Maintenance Occupations by Sex
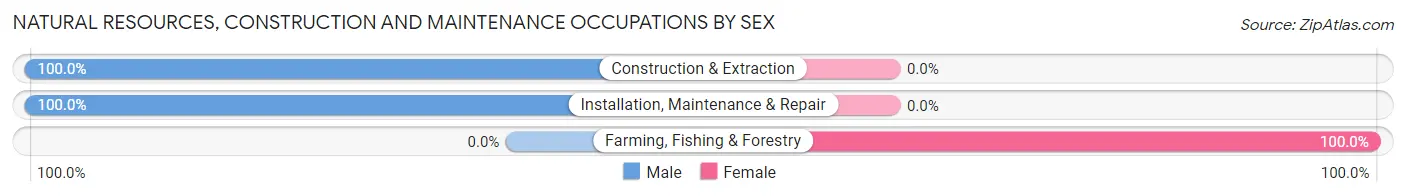
| Occupation | Male | Female |
| Farming, Fishing & Forestry | 0 (0.0%) | 13 (100.0%) |
| Construction & Extraction | 83 (100.0%) | 0 (0.0%) |
| Installation, Maintenance & Repair | 26 (100.0%) | 0 (0.0%) |
| Total (Category) | 109 (89.3%) | 13 (10.7%) |
| Total (Overall) | 407 (50.1%) | 405 (49.9%) |
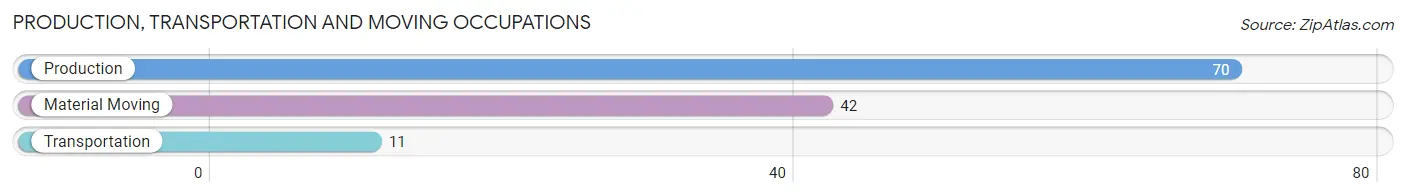
Production, Transportation and Moving Occupations
The most common Production, Transportation and Moving occupations in Boonville are Production (70 | 8.6%), Material Moving (42 | 5.2%), and Transportation (11 | 1.3%).
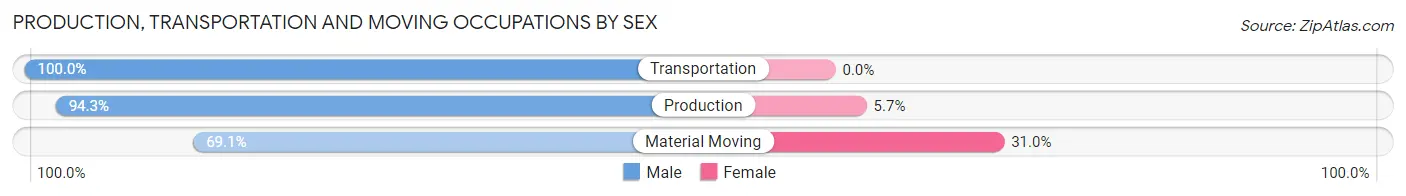
Production, Transportation and Moving Occupations by Sex
| Occupation | Male | Female |
| Production | 66 (94.3%) | 4 (5.7%) |
| Transportation | 11 (100.0%) | 0 (0.0%) |
| Material Moving | 29 (69.1%) | 13 (30.9%) |
| Total (Category) | 106 (86.2%) | 17 (13.8%) |
| Total (Overall) | 407 (50.1%) | 405 (49.9%) |
Employment Industries by Sex in Boonville
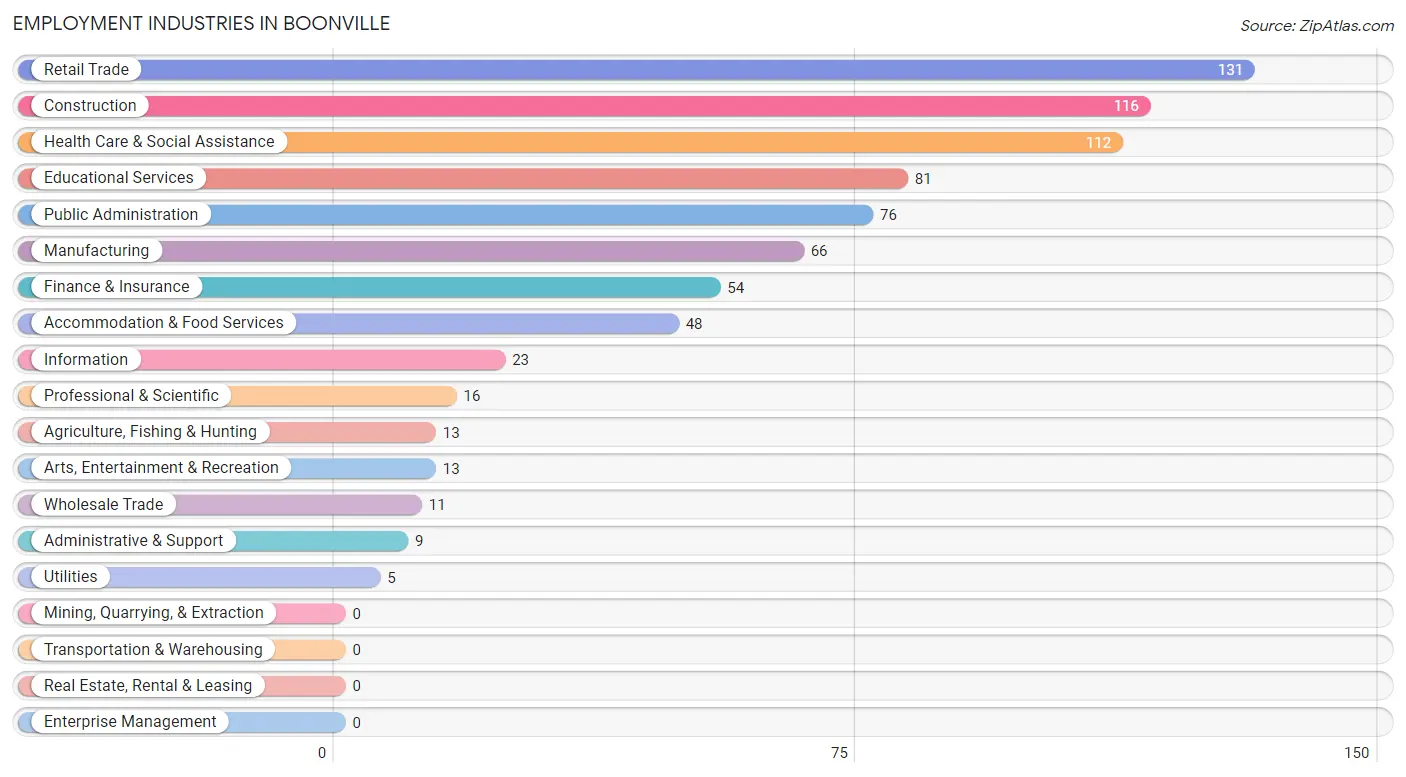
Employment Industries in Boonville
The major employment industries in Boonville include Retail Trade (131 | 16.1%), Construction (116 | 14.3%), Health Care & Social Assistance (112 | 13.8%), Educational Services (81 | 10.0%), and Public Administration (76 | 9.4%).
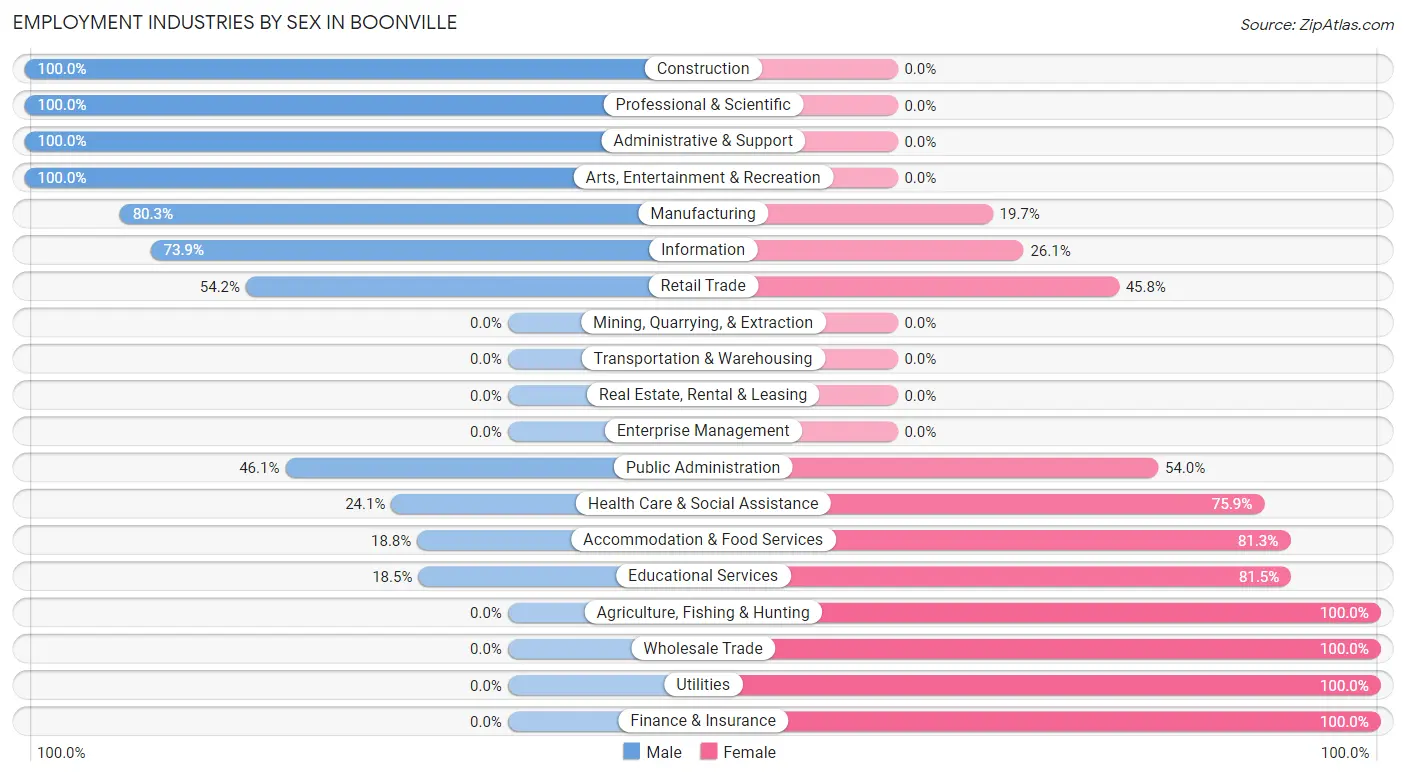
Employment Industries by Sex in Boonville
The Boonville industries that see more men than women are Construction (100.0%), Professional & Scientific (100.0%), and Administrative & Support (100.0%), whereas the industries that tend to have a higher number of women are Agriculture, Fishing & Hunting (100.0%), Wholesale Trade (100.0%), and Utilities (100.0%).
| Industry | Male | Female |
| Agriculture, Fishing & Hunting | 0 (0.0%) | 13 (100.0%) |
| Mining, Quarrying, & Extraction | 0 (0.0%) | 0 (0.0%) |
| Construction | 116 (100.0%) | 0 (0.0%) |
| Manufacturing | 53 (80.3%) | 13 (19.7%) |
| Wholesale Trade | 0 (0.0%) | 11 (100.0%) |
| Retail Trade | 71 (54.2%) | 60 (45.8%) |
| Transportation & Warehousing | 0 (0.0%) | 0 (0.0%) |
| Utilities | 0 (0.0%) | 5 (100.0%) |
| Information | 17 (73.9%) | 6 (26.1%) |
| Finance & Insurance | 0 (0.0%) | 54 (100.0%) |
| Real Estate, Rental & Leasing | 0 (0.0%) | 0 (0.0%) |
| Professional & Scientific | 16 (100.0%) | 0 (0.0%) |
| Enterprise Management | 0 (0.0%) | 0 (0.0%) |
| Administrative & Support | 9 (100.0%) | 0 (0.0%) |
| Educational Services | 15 (18.5%) | 66 (81.5%) |
| Health Care & Social Assistance | 27 (24.1%) | 85 (75.9%) |
| Arts, Entertainment & Recreation | 13 (100.0%) | 0 (0.0%) |
| Accommodation & Food Services | 9 (18.8%) | 39 (81.2%) |
| Public Administration | 35 (46.1%) | 41 (53.9%) |
| Total | 407 (50.1%) | 405 (49.9%) |
Education in Boonville
School Enrollment in Boonville
The most common levels of schooling among the 311 students in Boonville are high school (96 | 30.9%), elementary school (73 | 23.5%), and middle school (52 | 16.7%).
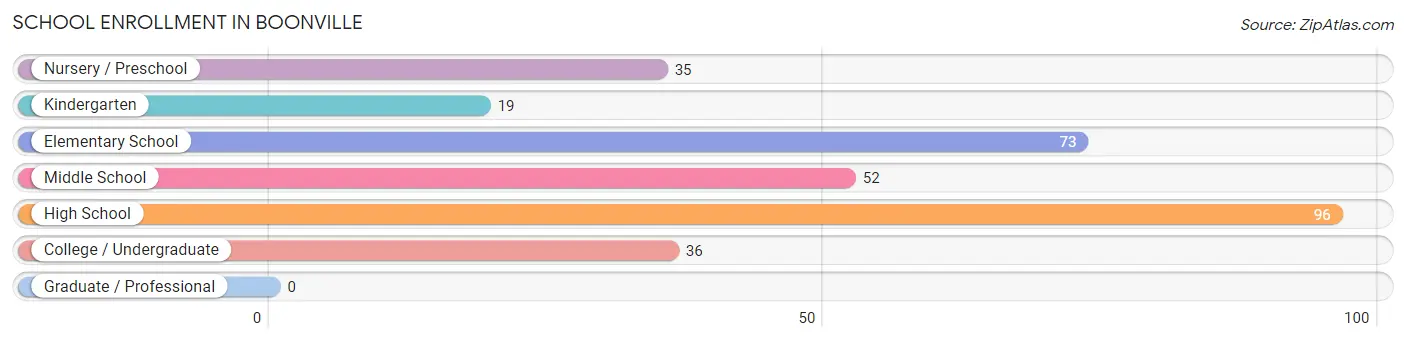
| School Level | # Students | % Students |
| Nursery / Preschool | 35 | 11.3% |
| Kindergarten | 19 | 6.1% |
| Elementary School | 73 | 23.5% |
| Middle School | 52 | 16.7% |
| High School | 96 | 30.9% |
| College / Undergraduate | 36 | 11.6% |
| Graduate / Professional | 0 | 0.0% |
| Total | 311 | 100.0% |
School Enrollment by Age by Funding Source in Boonville
Out of a total of 311 students who are enrolled in schools in Boonville, 13 (4.2%) attend a private institution, while the remaining 298 (95.8%) are enrolled in public schools. The age group of 20 to 24 year olds has the highest likelihood of being enrolled in private schools, with 6 (28.6% in the age bracket) enrolled. Conversely, the age group of 3 to 4 year olds has the lowest likelihood of being enrolled in a private school, with 28 (100.0% in the age bracket) attending a public institution.
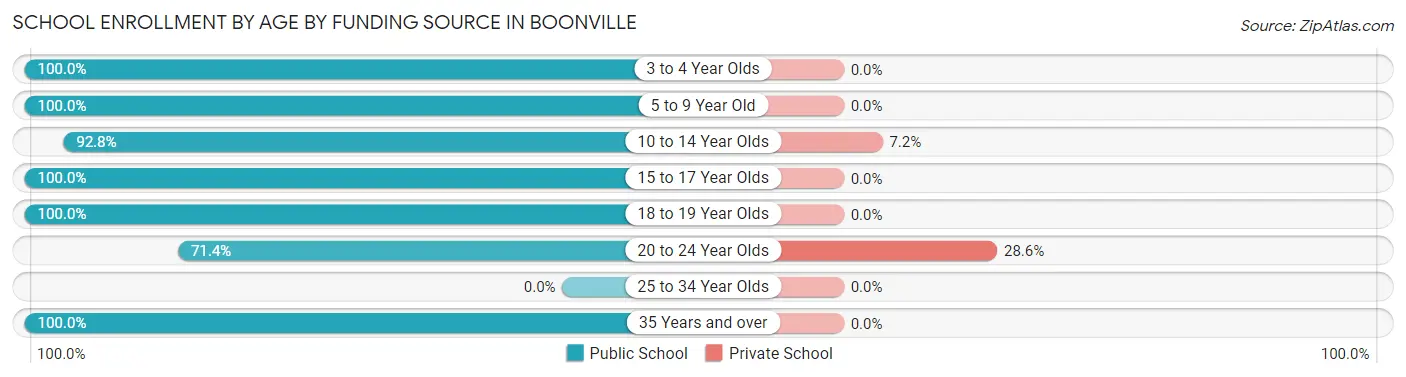
| Age Bracket | Public School | Private School |
| 3 to 4 Year Olds | 28 (100.0%) | 0 (0.0%) |
| 5 to 9 Year Old | 75 (100.0%) | 0 (0.0%) |
| 10 to 14 Year Olds | 90 (92.8%) | 7 (7.2%) |
| 15 to 17 Year Olds | 48 (100.0%) | 0 (0.0%) |
| 18 to 19 Year Olds | 36 (100.0%) | 0 (0.0%) |
| 20 to 24 Year Olds | 15 (71.4%) | 6 (28.6%) |
| 25 to 34 Year Olds | 0 (0.0%) | 0 (0.0%) |
| 35 Years and over | 6 (100.0%) | 0 (0.0%) |
| Total | 298 (95.8%) | 13 (4.2%) |
Educational Attainment by Field of Study in Boonville
Education (67 | 24.0%), computers & mathematics (42 | 15.0%), bio, nature & agricultural (34 | 12.2%), arts & humanities (31 | 11.1%), and business (17 | 6.1%) are the most common fields of study among 279 individuals in Boonville who have obtained a bachelor's degree or higher.
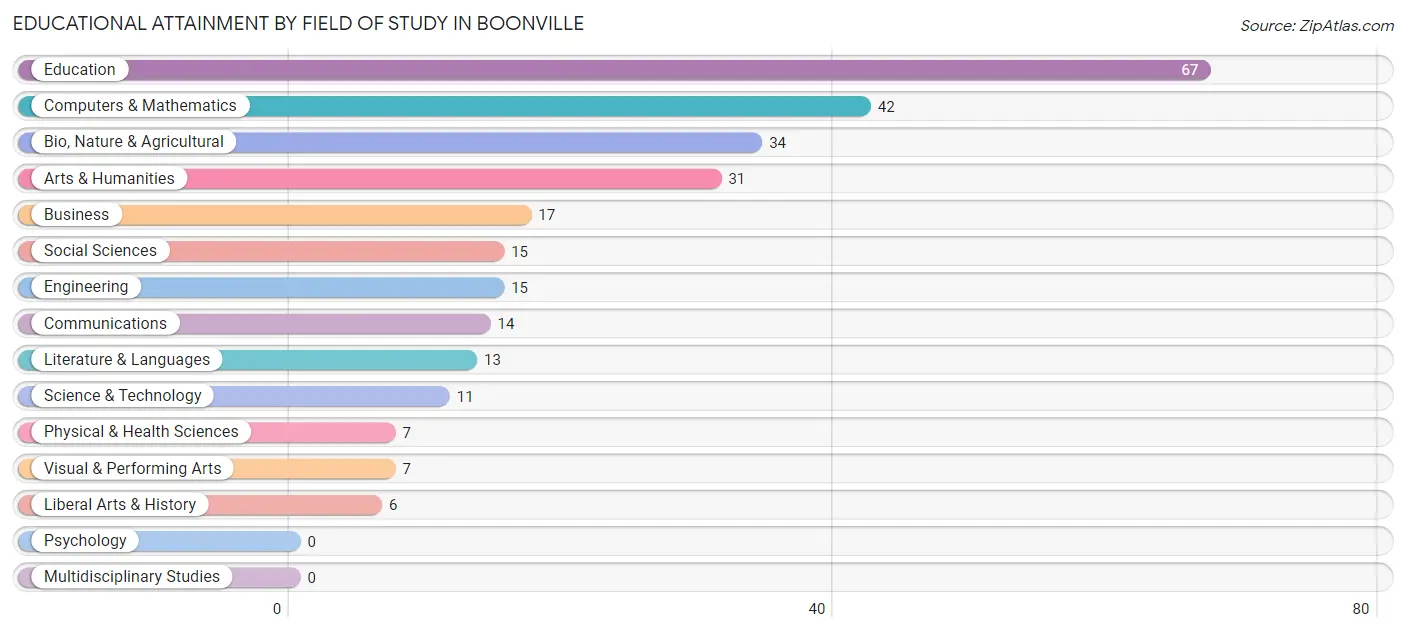
| Field of Study | # Graduates | % Graduates |
| Computers & Mathematics | 42 | 15.0% |
| Bio, Nature & Agricultural | 34 | 12.2% |
| Physical & Health Sciences | 7 | 2.5% |
| Psychology | 0 | 0.0% |
| Social Sciences | 15 | 5.4% |
| Engineering | 15 | 5.4% |
| Multidisciplinary Studies | 0 | 0.0% |
| Science & Technology | 11 | 3.9% |
| Business | 17 | 6.1% |
| Education | 67 | 24.0% |
| Literature & Languages | 13 | 4.7% |
| Liberal Arts & History | 6 | 2.1% |
| Visual & Performing Arts | 7 | 2.5% |
| Communications | 14 | 5.0% |
| Arts & Humanities | 31 | 11.1% |
| Total | 279 | 100.0% |
Transportation & Commute in Boonville
Vehicle Availability by Sex in Boonville
The most prevalent vehicle ownership categories in Boonville are males with 2 vehicles (228, accounting for 56.6%) and females with 2 vehicles (131, making up 56.2%).
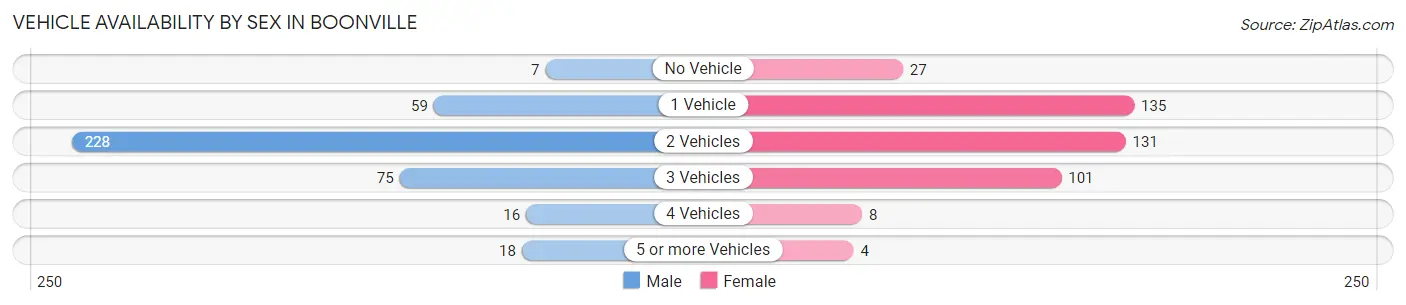
| Vehicles Available | Male | Female |
| No Vehicle | 7 (1.7%) | 27 (6.7%) |
| 1 Vehicle | 59 (14.6%) | 135 (33.3%) |
| 2 Vehicles | 228 (56.6%) | 131 (32.3%) |
| 3 Vehicles | 75 (18.6%) | 101 (24.9%) |
| 4 Vehicles | 16 (4.0%) | 8 (2.0%) |
| 5 or more Vehicles | 18 (4.5%) | 4 (1.0%) |
| Total | 403 (100.0%) | 406 (100.0%) |
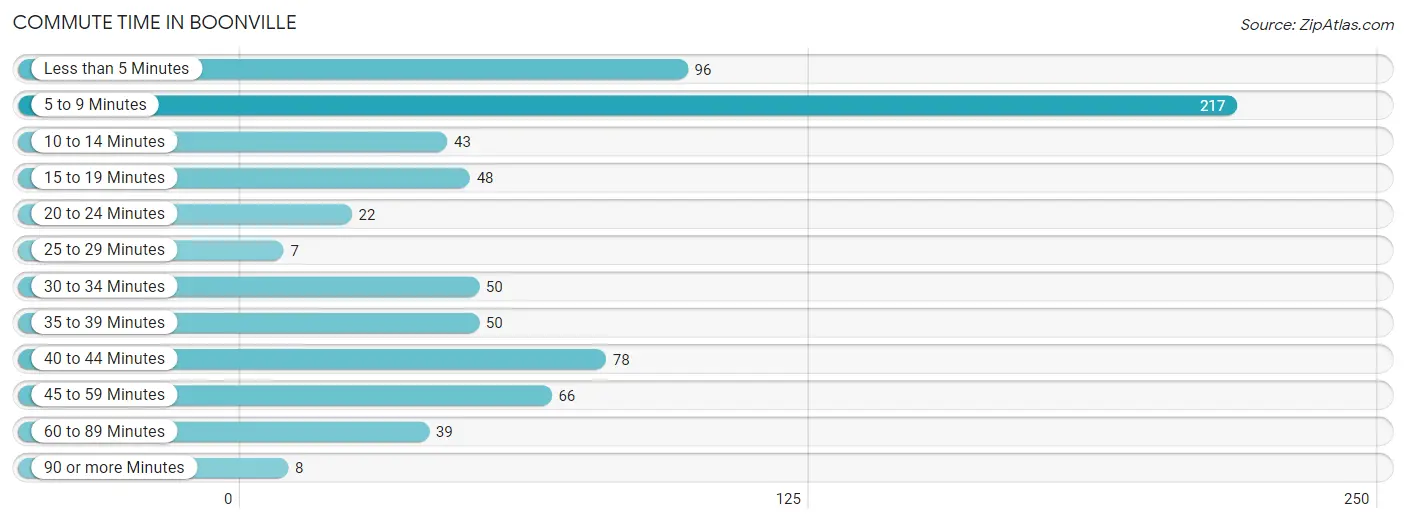
Commute Time in Boonville
The most frequently occuring commute durations in Boonville are 5 to 9 minutes (217 commuters, 30.0%), less than 5 minutes (96 commuters, 13.3%), and 40 to 44 minutes (78 commuters, 10.8%).
| Commute Time | # Commuters | % Commuters |
| Less than 5 Minutes | 96 | 13.3% |
| 5 to 9 Minutes | 217 | 30.0% |
| 10 to 14 Minutes | 43 | 5.9% |
| 15 to 19 Minutes | 48 | 6.6% |
| 20 to 24 Minutes | 22 | 3.0% |
| 25 to 29 Minutes | 7 | 1.0% |
| 30 to 34 Minutes | 50 | 6.9% |
| 35 to 39 Minutes | 50 | 6.9% |
| 40 to 44 Minutes | 78 | 10.8% |
| 45 to 59 Minutes | 66 | 9.1% |
| 60 to 89 Minutes | 39 | 5.4% |
| 90 or more Minutes | 8 | 1.1% |
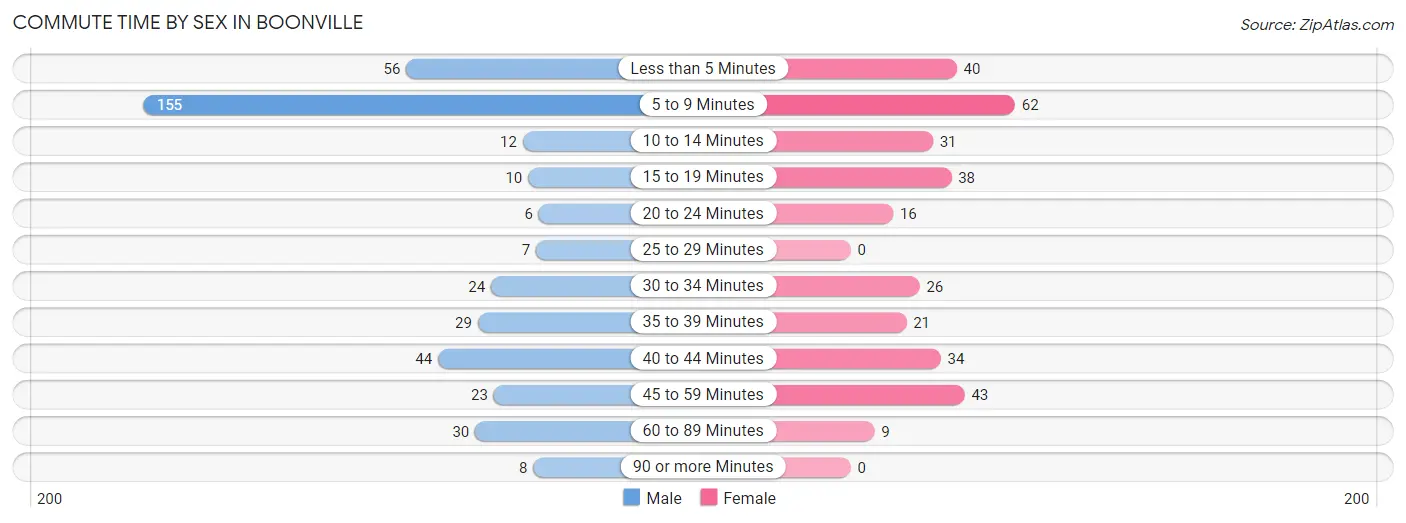
Commute Time by Sex in Boonville
The most common commute times in Boonville are 5 to 9 minutes (155 commuters, 38.4%) for males and 5 to 9 minutes (62 commuters, 19.4%) for females.
| Commute Time | Male | Female |
| Less than 5 Minutes | 56 (13.9%) | 40 (12.5%) |
| 5 to 9 Minutes | 155 (38.4%) | 62 (19.4%) |
| 10 to 14 Minutes | 12 (3.0%) | 31 (9.7%) |
| 15 to 19 Minutes | 10 (2.5%) | 38 (11.9%) |
| 20 to 24 Minutes | 6 (1.5%) | 16 (5.0%) |
| 25 to 29 Minutes | 7 (1.7%) | 0 (0.0%) |
| 30 to 34 Minutes | 24 (5.9%) | 26 (8.1%) |
| 35 to 39 Minutes | 29 (7.2%) | 21 (6.6%) |
| 40 to 44 Minutes | 44 (10.9%) | 34 (10.6%) |
| 45 to 59 Minutes | 23 (5.7%) | 43 (13.4%) |
| 60 to 89 Minutes | 30 (7.4%) | 9 (2.8%) |
| 90 or more Minutes | 8 (2.0%) | 0 (0.0%) |
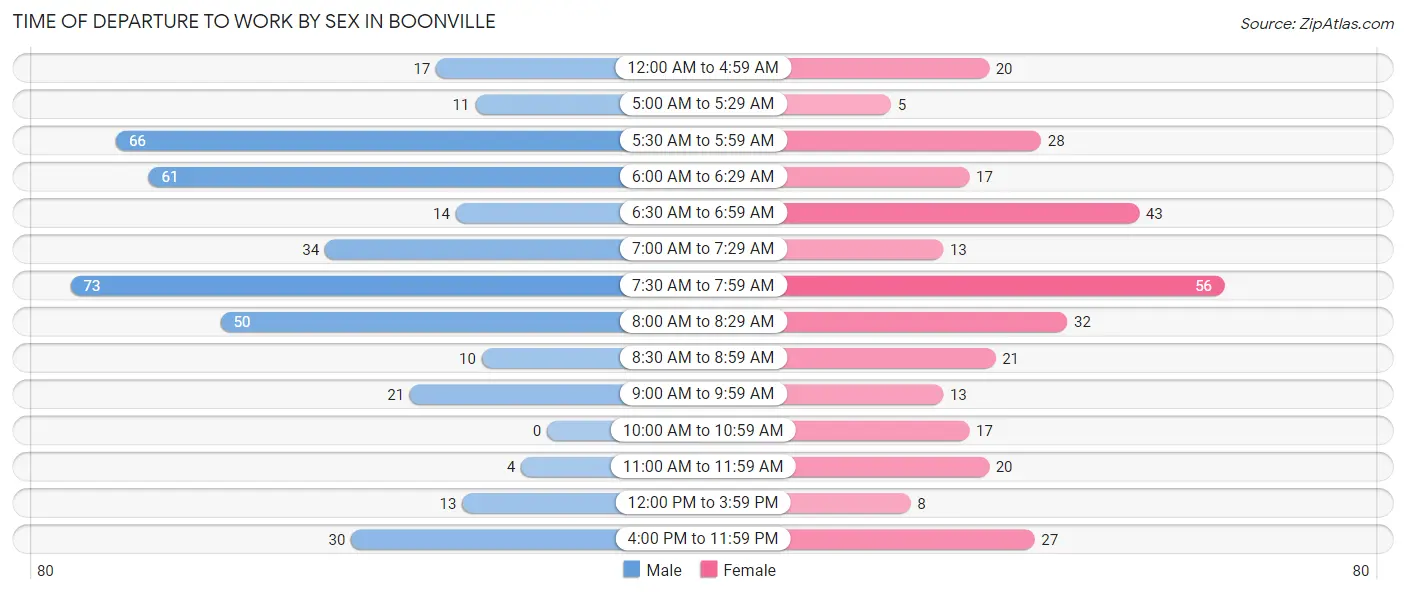
Time of Departure to Work by Sex in Boonville
The most frequent times of departure to work in Boonville are 7:30 AM to 7:59 AM (73, 18.1%) for males and 7:30 AM to 7:59 AM (56, 17.5%) for females.
| Time of Departure | Male | Female |
| 12:00 AM to 4:59 AM | 17 (4.2%) | 20 (6.2%) |
| 5:00 AM to 5:29 AM | 11 (2.7%) | 5 (1.6%) |
| 5:30 AM to 5:59 AM | 66 (16.3%) | 28 (8.7%) |
| 6:00 AM to 6:29 AM | 61 (15.1%) | 17 (5.3%) |
| 6:30 AM to 6:59 AM | 14 (3.5%) | 43 (13.4%) |
| 7:00 AM to 7:29 AM | 34 (8.4%) | 13 (4.1%) |
| 7:30 AM to 7:59 AM | 73 (18.1%) | 56 (17.5%) |
| 8:00 AM to 8:29 AM | 50 (12.4%) | 32 (10.0%) |
| 8:30 AM to 8:59 AM | 10 (2.5%) | 21 (6.6%) |
| 9:00 AM to 9:59 AM | 21 (5.2%) | 13 (4.1%) |
| 10:00 AM to 10:59 AM | 0 (0.0%) | 17 (5.3%) |
| 11:00 AM to 11:59 AM | 4 (1.0%) | 20 (6.2%) |
| 12:00 PM to 3:59 PM | 13 (3.2%) | 8 (2.5%) |
| 4:00 PM to 11:59 PM | 30 (7.4%) | 27 (8.4%) |
| Total | 404 (100.0%) | 320 (100.0%) |
Housing Occupancy in Boonville
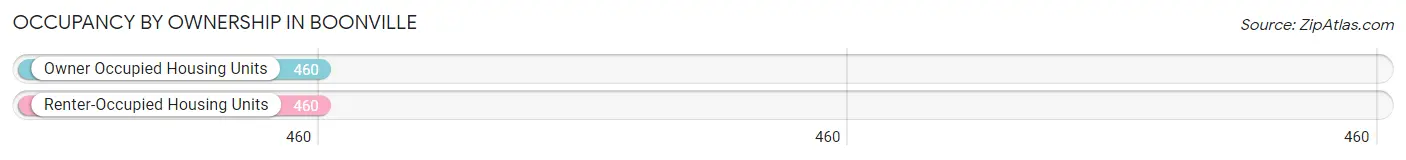
Occupancy by Ownership in Boonville
Of the total 920 dwellings in Boonville, owner-occupied units account for 460 (50.0%), while renter-occupied units make up 460 (50.0%).
| Occupancy | # Housing Units | % Housing Units |
| Owner Occupied Housing Units | 460 | 50.0% |
| Renter-Occupied Housing Units | 460 | 50.0% |
| Total Occupied Housing Units | 920 | 100.0% |
Occupancy by Household Size in Boonville
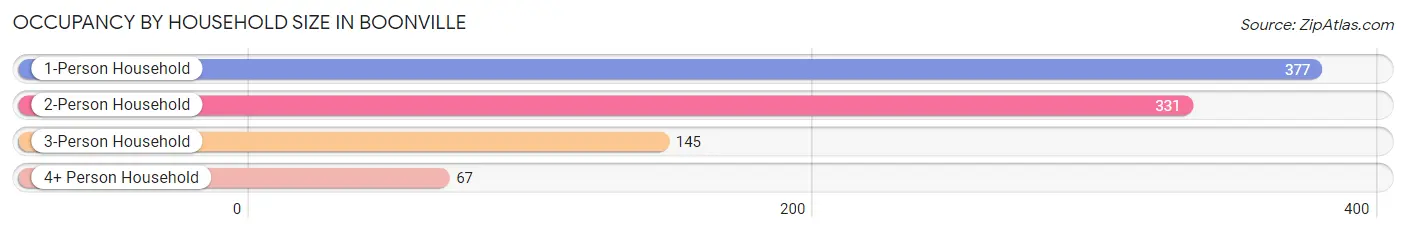
| Household Size | # Housing Units | % Housing Units |
| 1-Person Household | 377 | 41.0% |
| 2-Person Household | 331 | 36.0% |
| 3-Person Household | 145 | 15.8% |
| 4+ Person Household | 67 | 7.3% |
| Total Housing Units | 920 | 100.0% |
Occupancy by Ownership by Household Size in Boonville
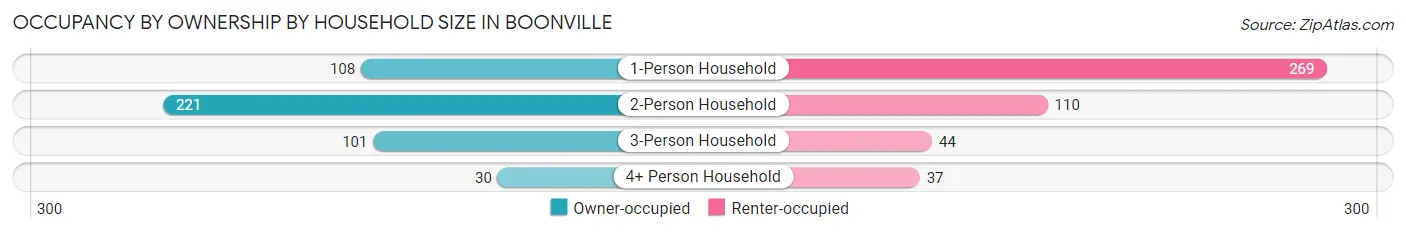
| Household Size | Owner-occupied | Renter-occupied |
| 1-Person Household | 108 (28.6%) | 269 (71.4%) |
| 2-Person Household | 221 (66.8%) | 110 (33.2%) |
| 3-Person Household | 101 (69.7%) | 44 (30.3%) |
| 4+ Person Household | 30 (44.8%) | 37 (55.2%) |
| Total Housing Units | 460 (50.0%) | 460 (50.0%) |
Occupancy by Educational Attainment in Boonville
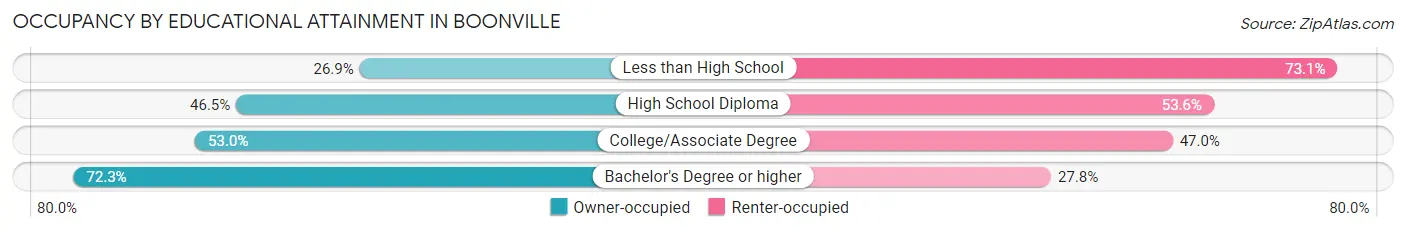
| Household Size | Owner-occupied | Renter-occupied |
| Less than High School | 36 (26.9%) | 98 (73.1%) |
| High School Diploma | 183 (46.5%) | 211 (53.5%) |
| College/Associate Degree | 116 (53.0%) | 103 (47.0%) |
| Bachelor's Degree or higher | 125 (72.3%) | 48 (27.8%) |
Occupancy by Age of Householder in Boonville
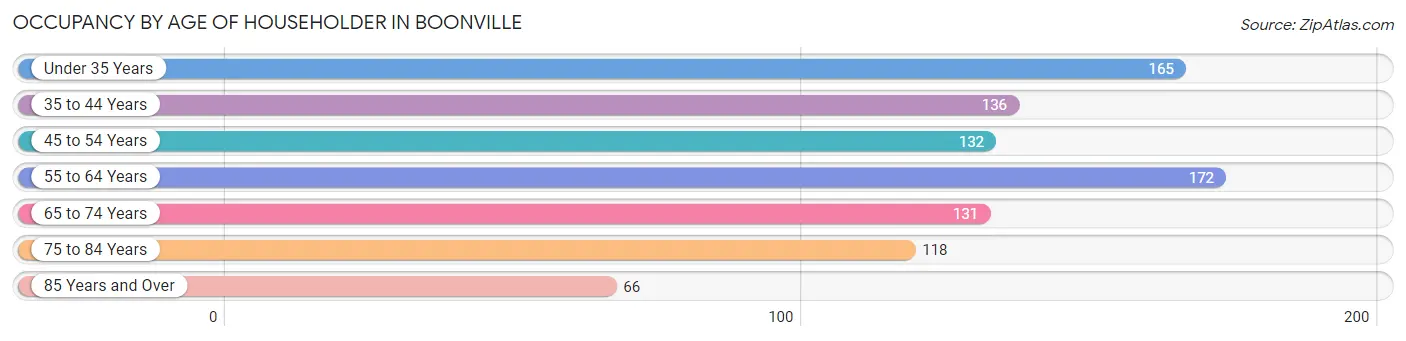
| Age Bracket | # Households | % Households |
| Under 35 Years | 165 | 17.9% |
| 35 to 44 Years | 136 | 14.8% |
| 45 to 54 Years | 132 | 14.3% |
| 55 to 64 Years | 172 | 18.7% |
| 65 to 74 Years | 131 | 14.2% |
| 75 to 84 Years | 118 | 12.8% |
| 85 Years and Over | 66 | 7.2% |
| Total | 920 | 100.0% |
Housing Finances in Boonville
Median Income by Occupancy in Boonville
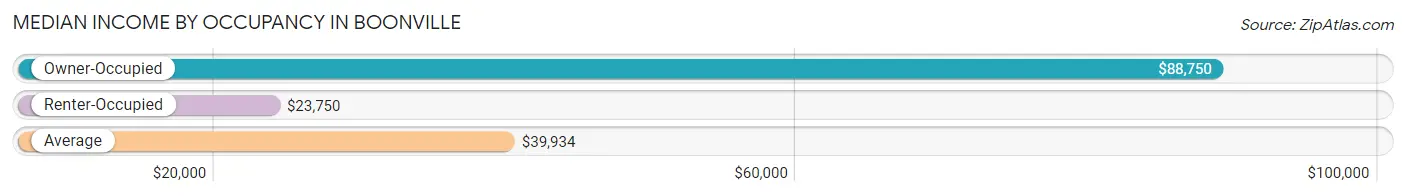
| Occupancy Type | # Households | Median Income |
| Owner-Occupied | 460 (50.0%) | $88,750 |
| Renter-Occupied | 460 (50.0%) | $23,750 |
| Average | 920 (100.0%) | $39,934 |
Occupancy by Householder Income Bracket in Boonville
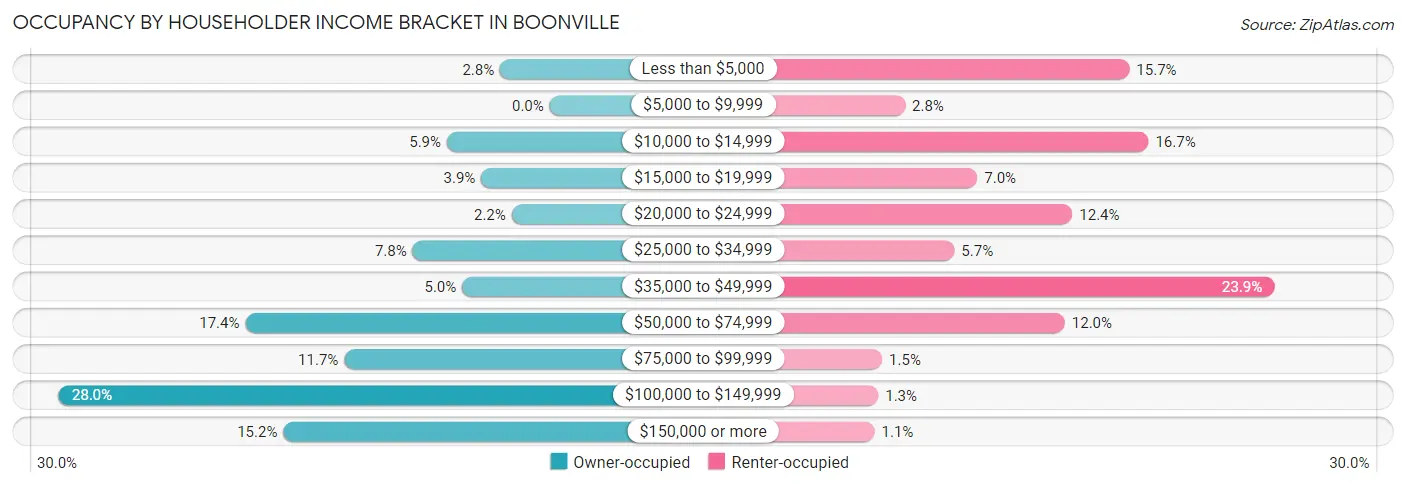
| Income Bracket | Owner-occupied | Renter-occupied |
| Less than $5,000 | 13 (2.8%) | 72 (15.7%) |
| $5,000 to $9,999 | 0 (0.0%) | 13 (2.8%) |
| $10,000 to $14,999 | 27 (5.9%) | 77 (16.7%) |
| $15,000 to $19,999 | 18 (3.9%) | 32 (7.0%) |
| $20,000 to $24,999 | 10 (2.2%) | 57 (12.4%) |
| $25,000 to $34,999 | 36 (7.8%) | 26 (5.7%) |
| $35,000 to $49,999 | 23 (5.0%) | 110 (23.9%) |
| $50,000 to $74,999 | 80 (17.4%) | 55 (12.0%) |
| $75,000 to $99,999 | 54 (11.7%) | 7 (1.5%) |
| $100,000 to $149,999 | 129 (28.0%) | 6 (1.3%) |
| $150,000 or more | 70 (15.2%) | 5 (1.1%) |
| Total | 460 (100.0%) | 460 (100.0%) |
Monthly Housing Cost Tiers in Boonville
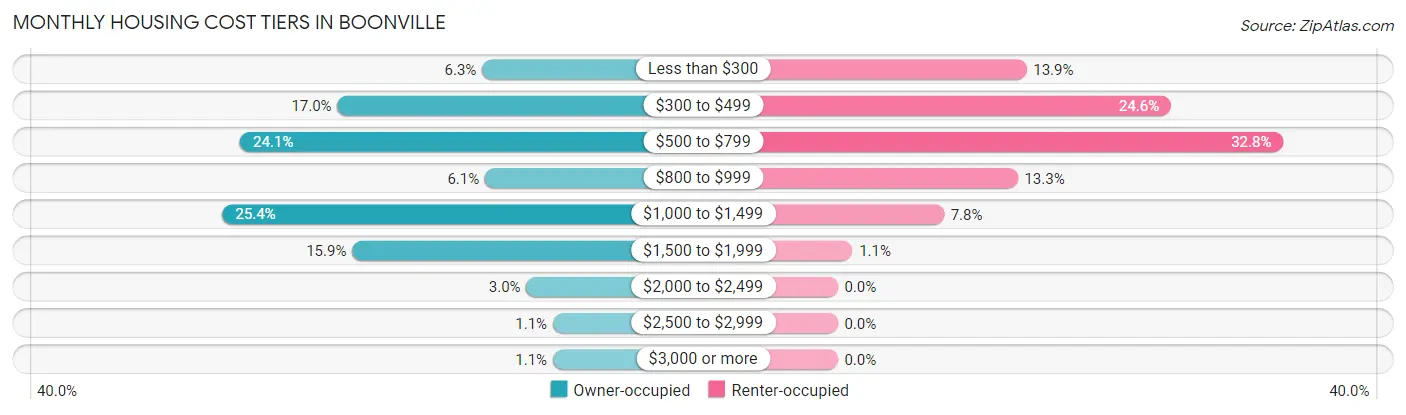
| Monthly Cost | Owner-occupied | Renter-occupied |
| Less than $300 | 29 (6.3%) | 64 (13.9%) |
| $300 to $499 | 78 (17.0%) | 113 (24.6%) |
| $500 to $799 | 111 (24.1%) | 151 (32.8%) |
| $800 to $999 | 28 (6.1%) | 61 (13.3%) |
| $1,000 to $1,499 | 117 (25.4%) | 36 (7.8%) |
| $1,500 to $1,999 | 73 (15.9%) | 5 (1.1%) |
| $2,000 to $2,499 | 14 (3.0%) | 0 (0.0%) |
| $2,500 to $2,999 | 5 (1.1%) | 0 (0.0%) |
| $3,000 or more | 5 (1.1%) | 0 (0.0%) |
| Total | 460 (100.0%) | 460 (100.0%) |
Physical Housing Characteristics in Boonville
Housing Structures in Boonville
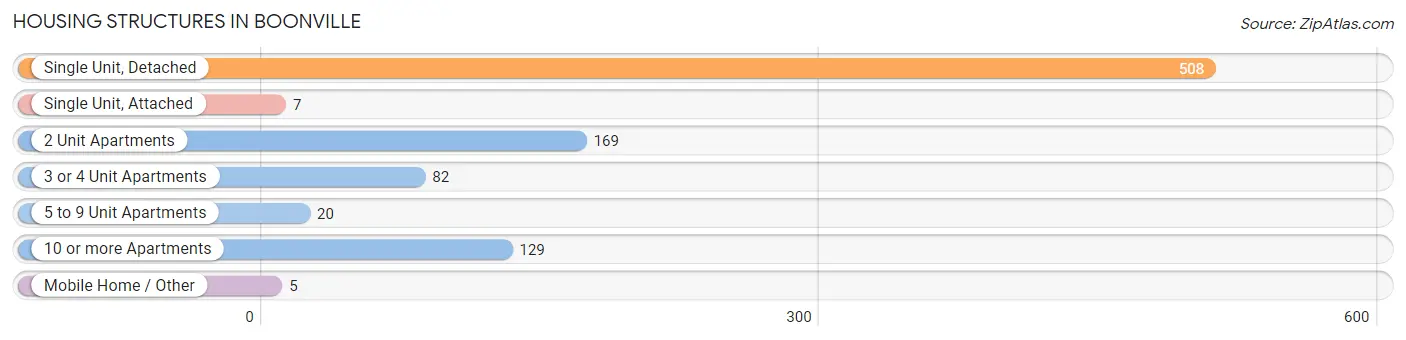
| Structure Type | # Housing Units | % Housing Units |
| Single Unit, Detached | 508 | 55.2% |
| Single Unit, Attached | 7 | 0.8% |
| 2 Unit Apartments | 169 | 18.4% |
| 3 or 4 Unit Apartments | 82 | 8.9% |
| 5 to 9 Unit Apartments | 20 | 2.2% |
| 10 or more Apartments | 129 | 14.0% |
| Mobile Home / Other | 5 | 0.5% |
| Total | 920 | 100.0% |
Housing Structures by Occupancy in Boonville
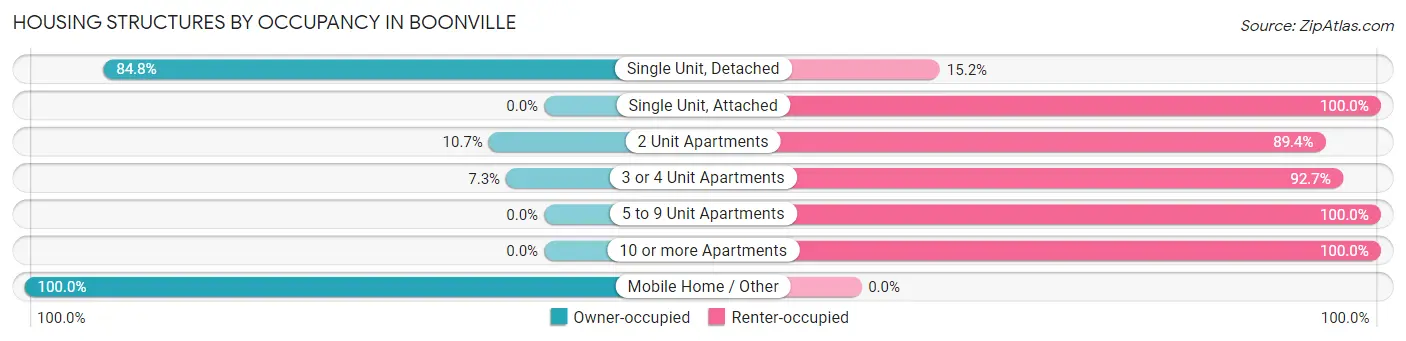
| Structure Type | Owner-occupied | Renter-occupied |
| Single Unit, Detached | 431 (84.8%) | 77 (15.2%) |
| Single Unit, Attached | 0 (0.0%) | 7 (100.0%) |
| 2 Unit Apartments | 18 (10.6%) | 151 (89.3%) |
| 3 or 4 Unit Apartments | 6 (7.3%) | 76 (92.7%) |
| 5 to 9 Unit Apartments | 0 (0.0%) | 20 (100.0%) |
| 10 or more Apartments | 0 (0.0%) | 129 (100.0%) |
| Mobile Home / Other | 5 (100.0%) | 0 (0.0%) |
| Total | 460 (50.0%) | 460 (50.0%) |
Housing Structures by Number of Rooms in Boonville
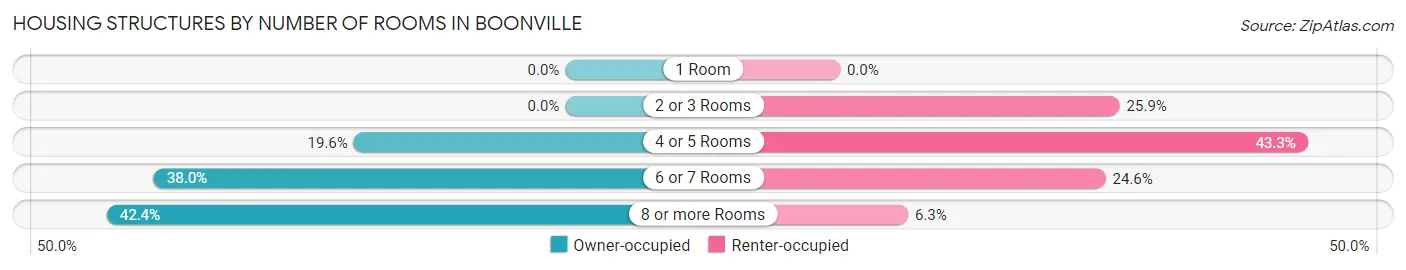
| Number of Rooms | Owner-occupied | Renter-occupied |
| 1 Room | 0 (0.0%) | 0 (0.0%) |
| 2 or 3 Rooms | 0 (0.0%) | 119 (25.9%) |
| 4 or 5 Rooms | 90 (19.6%) | 199 (43.3%) |
| 6 or 7 Rooms | 175 (38.0%) | 113 (24.6%) |
| 8 or more Rooms | 195 (42.4%) | 29 (6.3%) |
| Total | 460 (100.0%) | 460 (100.0%) |
Housing Structure by Heating Type in Boonville
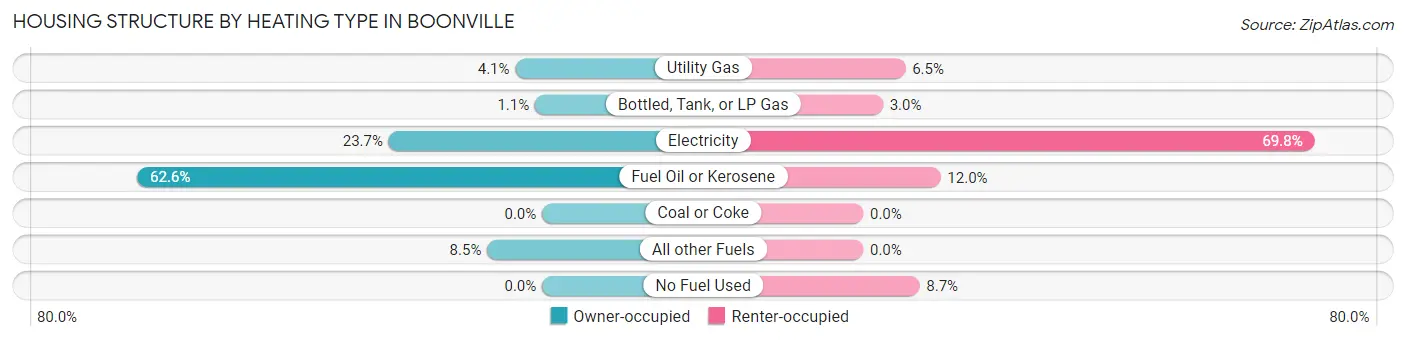
| Heating Type | Owner-occupied | Renter-occupied |
| Utility Gas | 19 (4.1%) | 30 (6.5%) |
| Bottled, Tank, or LP Gas | 5 (1.1%) | 14 (3.0%) |
| Electricity | 109 (23.7%) | 321 (69.8%) |
| Fuel Oil or Kerosene | 288 (62.6%) | 55 (12.0%) |
| Coal or Coke | 0 (0.0%) | 0 (0.0%) |
| All other Fuels | 39 (8.5%) | 0 (0.0%) |
| No Fuel Used | 0 (0.0%) | 40 (8.7%) |
| Total | 460 (100.0%) | 460 (100.0%) |
Household Vehicle Usage in Boonville
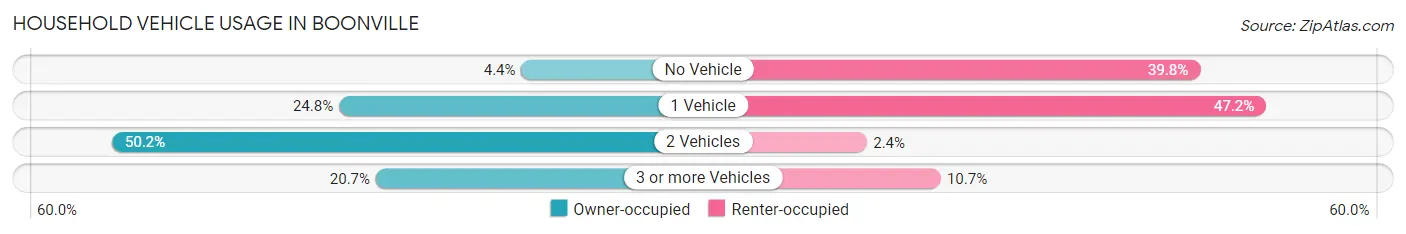
| Vehicles per Household | Owner-occupied | Renter-occupied |
| No Vehicle | 20 (4.3%) | 183 (39.8%) |
| 1 Vehicle | 114 (24.8%) | 217 (47.2%) |
| 2 Vehicles | 231 (50.2%) | 11 (2.4%) |
| 3 or more Vehicles | 95 (20.6%) | 49 (10.6%) |
| Total | 460 (100.0%) | 460 (100.0%) |
Real Estate & Mortgages in Boonville
Real Estate and Mortgage Overview in Boonville
| Characteristic | Without Mortgage | With Mortgage |
| Housing Units | 208 | 252 |
| Median Property Value | $117,500 | $181,000 |
| Median Household Income | $70,972 | $48 |
| Monthly Housing Costs | $504 | $5 |
| Real Estate Taxes | $1,734 | $14 |
Property Value by Mortgage Status in Boonville
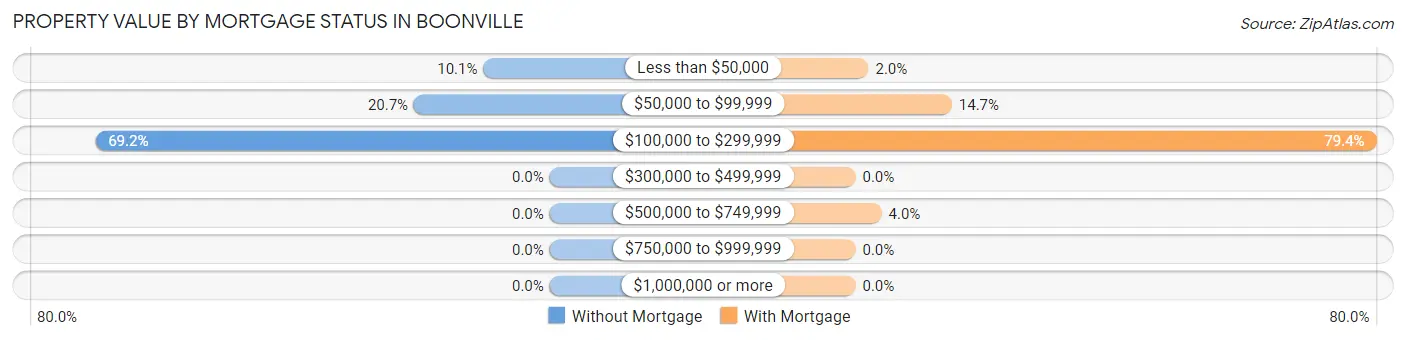
| Property Value | Without Mortgage | With Mortgage |
| Less than $50,000 | 21 (10.1%) | 5 (2.0%) |
| $50,000 to $99,999 | 43 (20.7%) | 37 (14.7%) |
| $100,000 to $299,999 | 144 (69.2%) | 200 (79.4%) |
| $300,000 to $499,999 | 0 (0.0%) | 0 (0.0%) |
| $500,000 to $749,999 | 0 (0.0%) | 10 (4.0%) |
| $750,000 to $999,999 | 0 (0.0%) | 0 (0.0%) |
| $1,000,000 or more | 0 (0.0%) | 0 (0.0%) |
| Total | 208 (100.0%) | 252 (100.0%) |
Household Income by Mortgage Status in Boonville
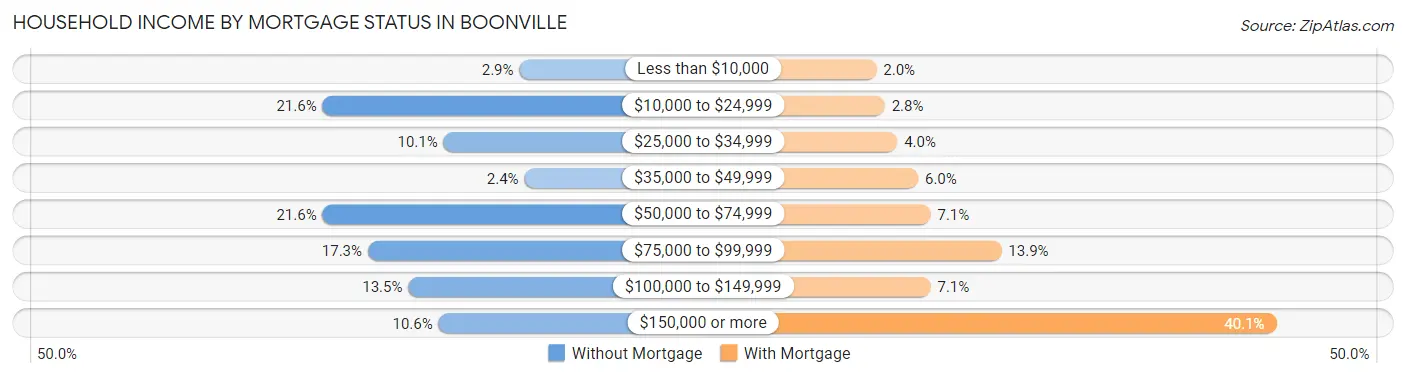
| Household Income | Without Mortgage | With Mortgage |
| Less than $10,000 | 6 (2.9%) | 5 (2.0%) |
| $10,000 to $24,999 | 45 (21.6%) | 7 (2.8%) |
| $25,000 to $34,999 | 21 (10.1%) | 10 (4.0%) |
| $35,000 to $49,999 | 5 (2.4%) | 15 (5.9%) |
| $50,000 to $74,999 | 45 (21.6%) | 18 (7.1%) |
| $75,000 to $99,999 | 36 (17.3%) | 35 (13.9%) |
| $100,000 to $149,999 | 28 (13.5%) | 18 (7.1%) |
| $150,000 or more | 22 (10.6%) | 101 (40.1%) |
| Total | 208 (100.0%) | 252 (100.0%) |
Property Value to Household Income Ratio in Boonville
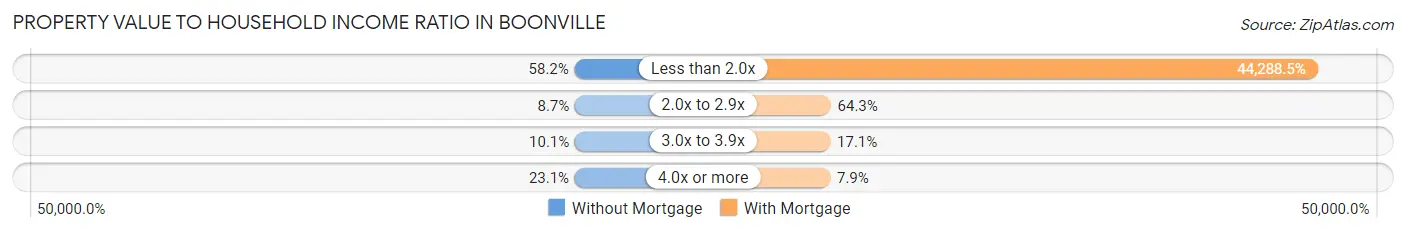
| Value-to-Income Ratio | Without Mortgage | With Mortgage |
| Less than 2.0x | 121 (58.2%) | 111,607 (44,288.5%) |
| 2.0x to 2.9x | 18 (8.6%) | 162 (64.3%) |
| 3.0x to 3.9x | 21 (10.1%) | 43 (17.1%) |
| 4.0x or more | 48 (23.1%) | 20 (7.9%) |
| Total | 208 (100.0%) | 252 (100.0%) |
Real Estate Taxes by Mortgage Status in Boonville
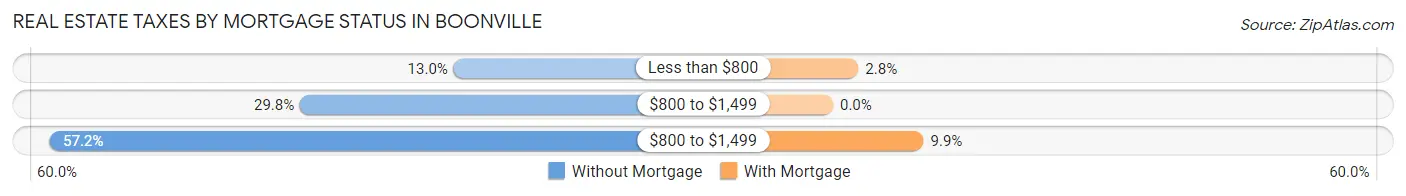
| Property Taxes | Without Mortgage | With Mortgage |
| Less than $800 | 27 (13.0%) | 7 (2.8%) |
| $800 to $1,499 | 62 (29.8%) | 0 (0.0%) |
| $800 to $1,499 | 119 (57.2%) | 25 (9.9%) |
| Total | 208 (100.0%) | 252 (100.0%) |
Health & Disability in Boonville
Health Insurance Coverage by Age in Boonville
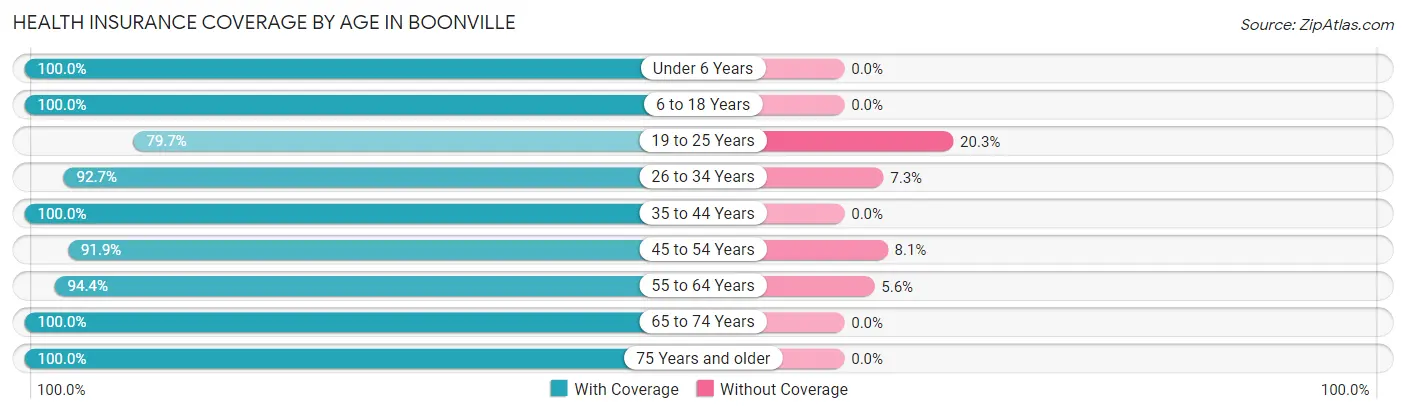
| Age Bracket | With Coverage | Without Coverage |
| Under 6 Years | 82 (100.0%) | 0 (0.0%) |
| 6 to 18 Years | 245 (100.0%) | 0 (0.0%) |
| 19 to 25 Years | 106 (79.7%) | 27 (20.3%) |
| 26 to 34 Years | 191 (92.7%) | 15 (7.3%) |
| 35 to 44 Years | 254 (100.0%) | 0 (0.0%) |
| 45 to 54 Years | 182 (91.9%) | 16 (8.1%) |
| 55 to 64 Years | 253 (94.4%) | 15 (5.6%) |
| 65 to 74 Years | 213 (100.0%) | 0 (0.0%) |
| 75 Years and older | 212 (100.0%) | 0 (0.0%) |
| Total | 1,738 (96.0%) | 73 (4.0%) |
Health Insurance Coverage by Citizenship Status in Boonville
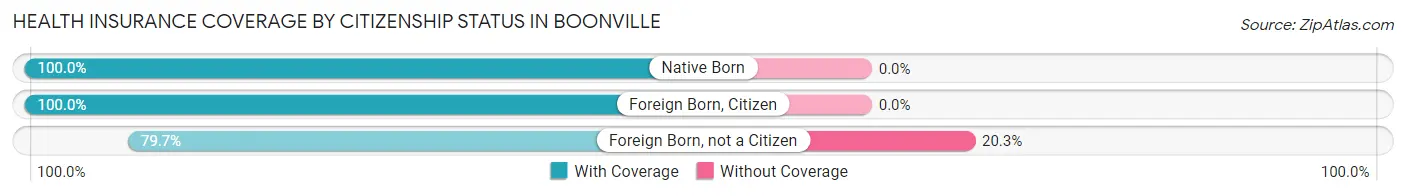
| Citizenship Status | With Coverage | Without Coverage |
| Native Born | 82 (100.0%) | 0 (0.0%) |
| Foreign Born, Citizen | 245 (100.0%) | 0 (0.0%) |
| Foreign Born, not a Citizen | 106 (79.7%) | 27 (20.3%) |
Health Insurance Coverage by Household Income in Boonville
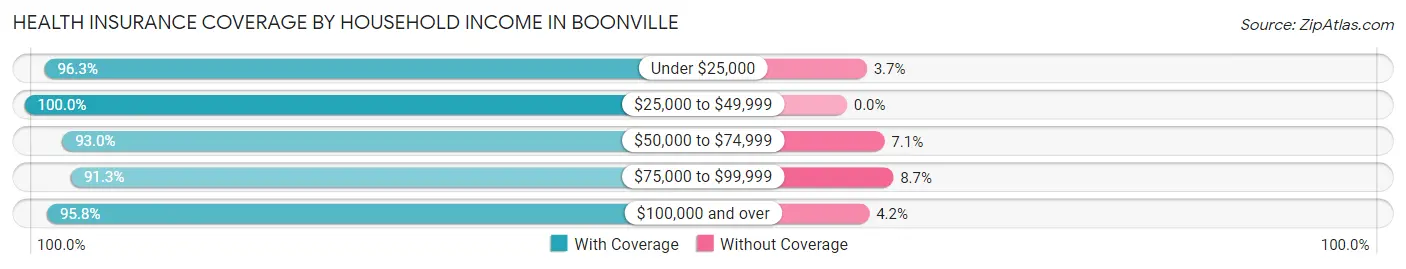
| Household Income | With Coverage | Without Coverage |
| Under $25,000 | 413 (96.3%) | 16 (3.7%) |
| $25,000 to $49,999 | 346 (100.0%) | 0 (0.0%) |
| $50,000 to $74,999 | 277 (92.9%) | 21 (7.0%) |
| $75,000 to $99,999 | 126 (91.3%) | 12 (8.7%) |
| $100,000 and over | 548 (95.8%) | 24 (4.2%) |
Public vs Private Health Insurance Coverage by Age in Boonville
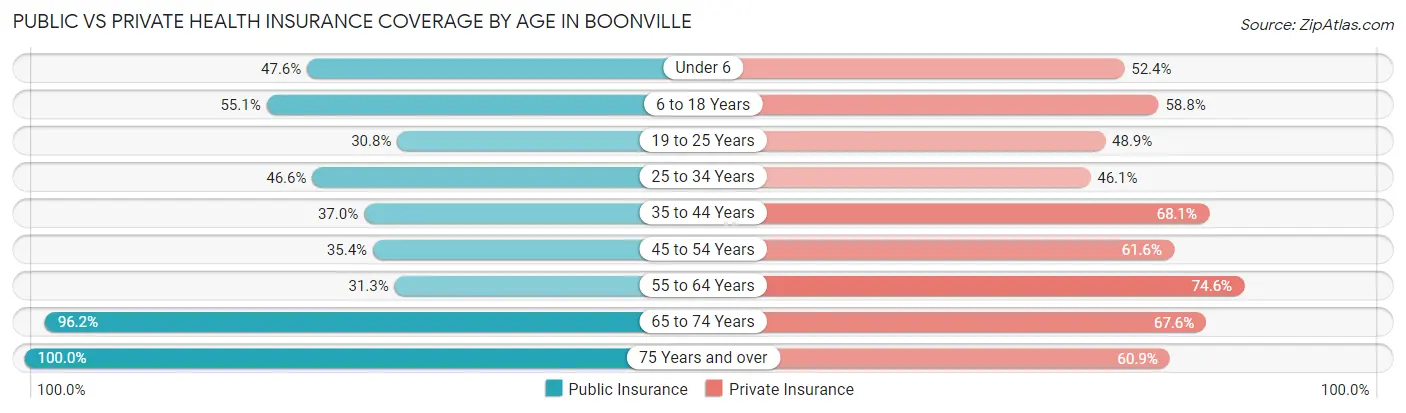
| Age Bracket | Public Insurance | Private Insurance |
| Under 6 | 39 (47.6%) | 43 (52.4%) |
| 6 to 18 Years | 135 (55.1%) | 144 (58.8%) |
| 19 to 25 Years | 41 (30.8%) | 65 (48.9%) |
| 25 to 34 Years | 96 (46.6%) | 95 (46.1%) |
| 35 to 44 Years | 94 (37.0%) | 173 (68.1%) |
| 45 to 54 Years | 70 (35.3%) | 122 (61.6%) |
| 55 to 64 Years | 84 (31.3%) | 200 (74.6%) |
| 65 to 74 Years | 205 (96.2%) | 144 (67.6%) |
| 75 Years and over | 212 (100.0%) | 129 (60.9%) |
| Total | 976 (53.9%) | 1,115 (61.6%) |
Disability Status by Sex by Age in Boonville
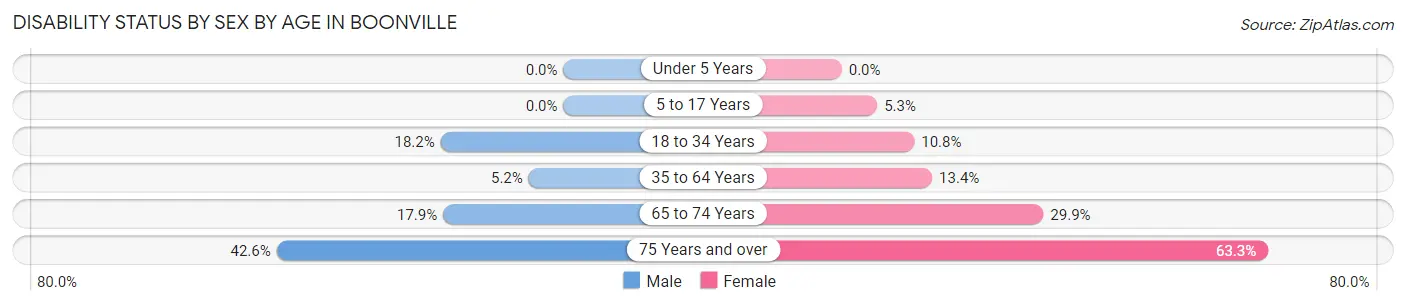
| Age Bracket | Male | Female |
| Under 5 Years | 0 (0.0%) | 0 (0.0%) |
| 5 to 17 Years | 0 (0.0%) | 8 (5.3%) |
| 18 to 34 Years | 27 (18.2%) | 24 (10.8%) |
| 35 to 64 Years | 21 (5.2%) | 42 (13.4%) |
| 65 to 74 Years | 10 (17.9%) | 47 (29.9%) |
| 75 Years and over | 23 (42.6%) | 100 (63.3%) |
Disability Class by Sex by Age in Boonville
Disability Class: Hearing Difficulty
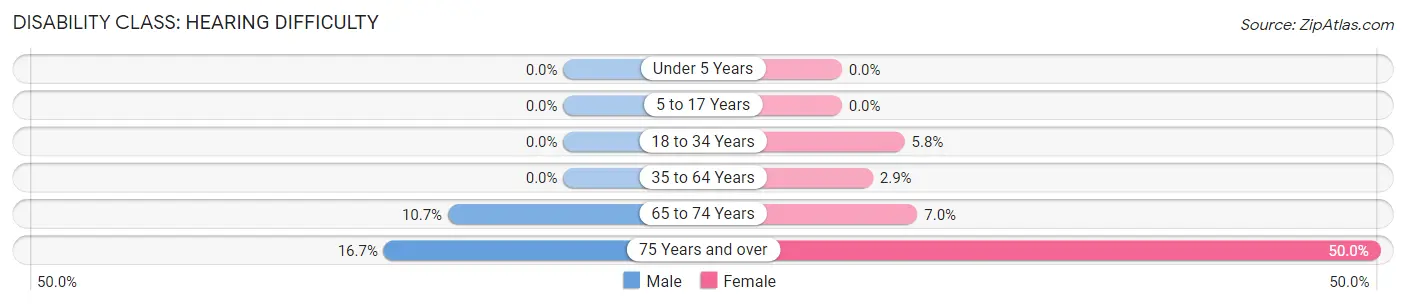
| Age Bracket | Male | Female |
| Under 5 Years | 0 (0.0%) | 0 (0.0%) |
| 5 to 17 Years | 0 (0.0%) | 0 (0.0%) |
| 18 to 34 Years | 0 (0.0%) | 13 (5.8%) |
| 35 to 64 Years | 0 (0.0%) | 9 (2.9%) |
| 65 to 74 Years | 6 (10.7%) | 11 (7.0%) |
| 75 Years and over | 9 (16.7%) | 79 (50.0%) |
Disability Class: Vision Difficulty
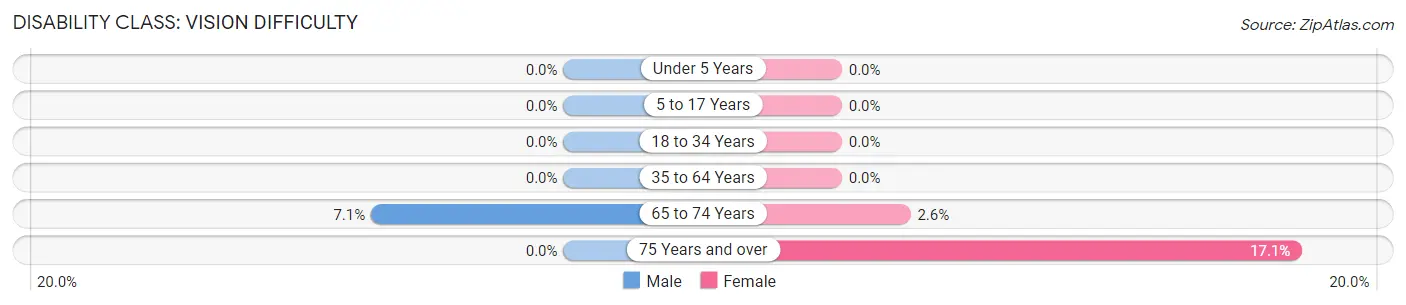
| Age Bracket | Male | Female |
| Under 5 Years | 0 (0.0%) | 0 (0.0%) |
| 5 to 17 Years | 0 (0.0%) | 0 (0.0%) |
| 18 to 34 Years | 0 (0.0%) | 0 (0.0%) |
| 35 to 64 Years | 0 (0.0%) | 0 (0.0%) |
| 65 to 74 Years | 4 (7.1%) | 4 (2.5%) |
| 75 Years and over | 0 (0.0%) | 27 (17.1%) |
Disability Class: Cognitive Difficulty
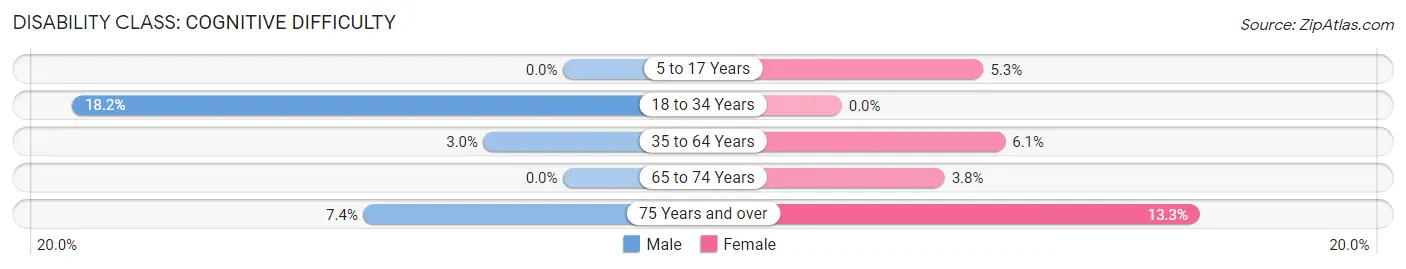
| Age Bracket | Male | Female |
| 5 to 17 Years | 0 (0.0%) | 8 (5.3%) |
| 18 to 34 Years | 27 (18.2%) | 0 (0.0%) |
| 35 to 64 Years | 12 (2.9%) | 19 (6.1%) |
| 65 to 74 Years | 0 (0.0%) | 6 (3.8%) |
| 75 Years and over | 4 (7.4%) | 21 (13.3%) |
Disability Class: Ambulatory Difficulty
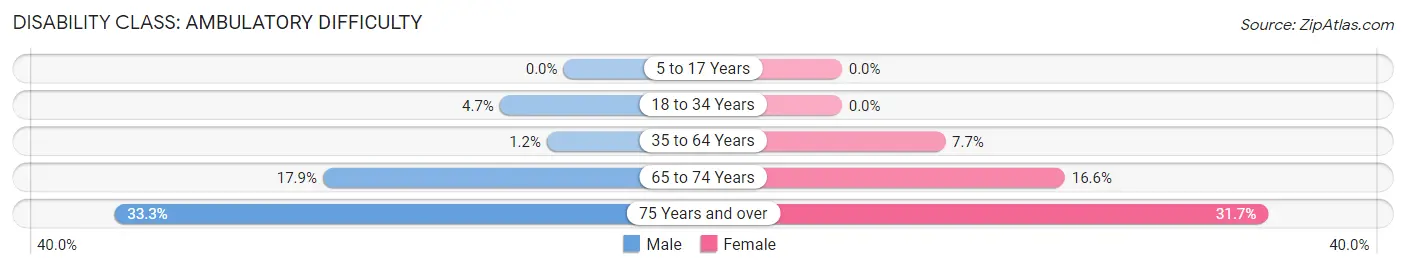
| Age Bracket | Male | Female |
| 5 to 17 Years | 0 (0.0%) | 0 (0.0%) |
| 18 to 34 Years | 7 (4.7%) | 0 (0.0%) |
| 35 to 64 Years | 5 (1.2%) | 24 (7.7%) |
| 65 to 74 Years | 10 (17.9%) | 26 (16.6%) |
| 75 Years and over | 18 (33.3%) | 50 (31.7%) |
Disability Class: Self-Care Difficulty
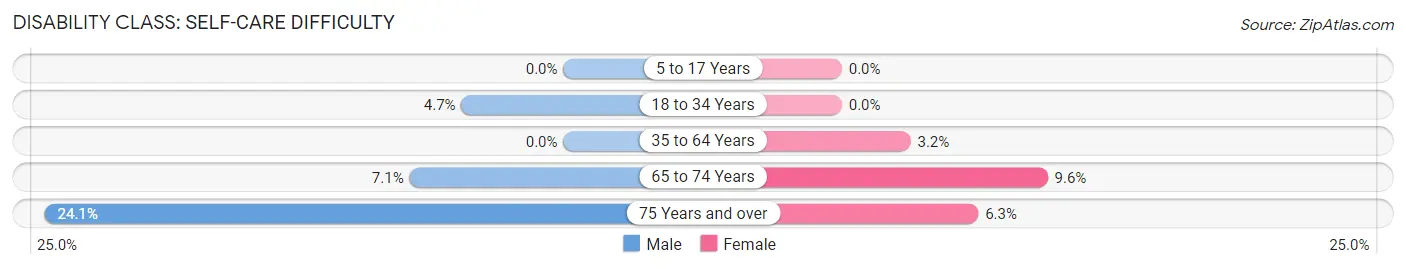
| Age Bracket | Male | Female |
| 5 to 17 Years | 0 (0.0%) | 0 (0.0%) |
| 18 to 34 Years | 7 (4.7%) | 0 (0.0%) |
| 35 to 64 Years | 0 (0.0%) | 10 (3.2%) |
| 65 to 74 Years | 4 (7.1%) | 15 (9.6%) |
| 75 Years and over | 13 (24.1%) | 10 (6.3%) |
Technology Access in Boonville
Computing Device Access in Boonville
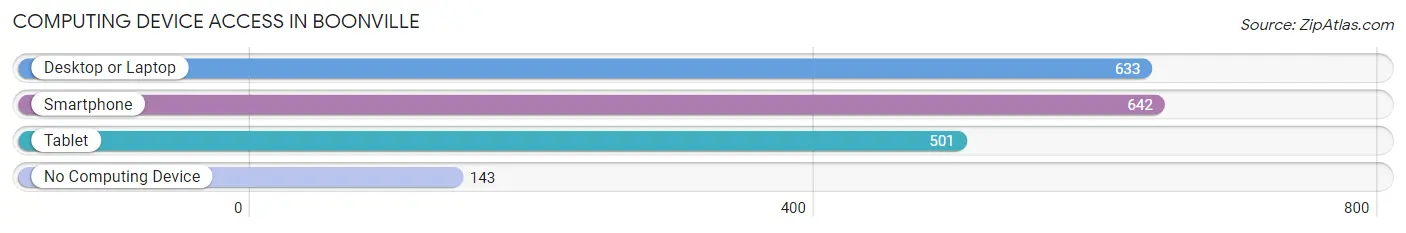
| Device Type | # Households | % Households |
| Desktop or Laptop | 633 | 68.8% |
| Smartphone | 642 | 69.8% |
| Tablet | 501 | 54.5% |
| No Computing Device | 143 | 15.5% |
| Total | 920 | 100.0% |
Internet Access in Boonville
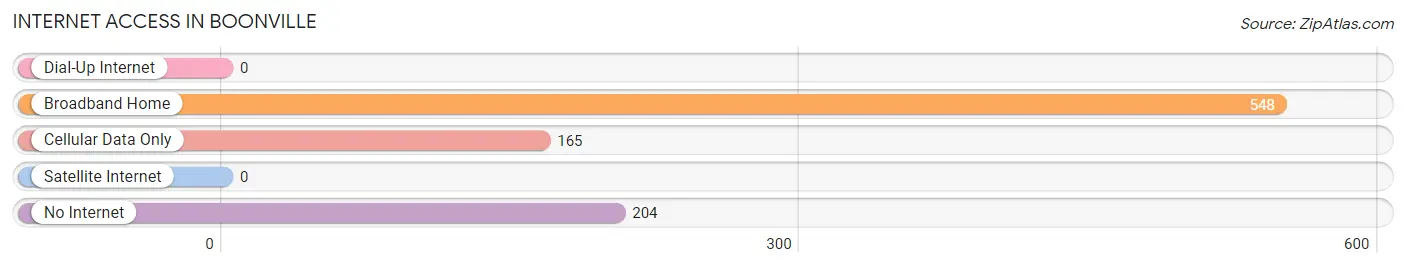
| Internet Type | # Households | % Households |
| Dial-Up Internet | 0 | 0.0% |
| Broadband Home | 548 | 59.6% |
| Cellular Data Only | 165 | 17.9% |
| Satellite Internet | 0 | 0.0% |
| No Internet | 204 | 22.2% |
| Total | 920 | 100.0% |
Boonville Summary
Boonville is a small town located in Oneida County, New York, United States. It is situated in the foothills of the Adirondack Mountains, about 20 miles east of Utica. The town was founded in 1795 and has a population of approximately 2,000 people.
History
Boonville was founded in 1795 by John Boon, a Revolutionary War veteran. He purchased the land from the Oneida Indians and named the town after himself. The town was originally part of the Burnetsfield Patent, which was granted to the Burnetsfield Company in 1788. The company was made up of a group of Revolutionary War veterans who had served under General George Washington.
The town grew slowly but steadily over the years, and by the mid-1800s, it had become a thriving agricultural community. The town was also home to several mills, including a grist mill, a saw mill, and a woolen mill.
In the late 1800s, the town began to experience a period of growth and prosperity. The railroad arrived in 1872, and the town became a popular tourist destination. The town was also home to several resorts, including the Boonville Hotel, which was built in 1876.
Geography
Boonville is located in the foothills of the Adirondack Mountains, about 20 miles east of Utica. The town is situated on the Black River, which flows through the town and is a popular destination for fishing and canoeing. The town is also home to several parks, including the Boonville Nature Preserve, which is a popular spot for hiking and bird watching.
The town has a total area of 8.2 square miles, of which 8.1 square miles is land and 0.1 square miles is water. The town is bordered by the towns of Ava, Forestport, and Remsen to the north, the town of Steuben to the east, the town of Trenton to the south, and the town of Western to the west.
Economy
Boonville’s economy is largely based on agriculture and tourism. The town is home to several farms, which produce a variety of crops, including corn, soybeans, and hay. The town is also home to several wineries, which produce a variety of wines.
The town is also a popular tourist destination, and is home to several resorts, including the Boonville Hotel. The town is also home to several parks, including the Boonville Nature Preserve, which is a popular spot for hiking and bird watching.
Demographics
As of the 2010 census, Boonville had a population of 2,039. The racial makeup of the town was 97.2% White, 0.7% African American, 0.3% Native American, 0.3% Asian, 0.1% Pacific Islander, 0.2% from other races, and 1.3% from two or more races. Hispanic or Latino of any race were 1.2% of the population.
The median income for a household in the town was $41,250, and the median income for a family was $50,000. The per capita income for the town was $20,945. About 10.2% of families and 13.2% of the population were below the poverty line, including 17.2% of those under age 18 and 8.2% of those age 65 or over.
Common Questions
What is Per Capita Income in Boonville?
Per Capita income in Boonville is $32,149.
What is the Median Family Income in Boonville?
Median Family Income in Boonville is $72,875.
What is the Median Household income in Boonville?
Median Household Income in Boonville is $39,934.
What is Income or Wage Gap in Boonville?
Income or Wage Gap in Boonville is 20.8%.
Women in Boonville earn 79.2 cents for every dollar earned by a man.
What is Family Income Deficit in Boonville?
Family Income Deficit in Boonville is $13,227.
Families that are below poverty line in Boonville earn $13,227 less on average than the poverty threshold level.
What is Inequality or Gini Index in Boonville?
Inequality or Gini Index in Boonville is 0.50.
What is the Total Population of Boonville?
Total Population of Boonville is 1,912.
What is the Total Male Population of Boonville?
Total Male Population of Boonville is 805.
What is the Total Female Population of Boonville?
Total Female Population of Boonville is 1,107.
What is the Ratio of Males per 100 Females in Boonville?
There are 72.72 Males per 100 Females in Boonville.
What is the Ratio of Females per 100 Males in Boonville?
There are 137.52 Females per 100 Males in Boonville.
What is the Median Population Age in Boonville?
Median Population Age in Boonville is 46.0 Years.
What is the Average Family Size in Boonville
Average Family Size in Boonville is 2.7 People.
What is the Average Household Size in Boonville
Average Household Size in Boonville is 1.9 People.
How Large is the Labor Force in Boonville?
There are 892 People in the Labor Forcein in Boonville.
What is the Percentage of People in the Labor Force in Boonville?
54.2% of People are in the Labor Force in Boonville.
What is the Unemployment Rate in Boonville?
Unemployment Rate in Boonville is 8.0%.