Mastic Beach, NY Map & Demographics
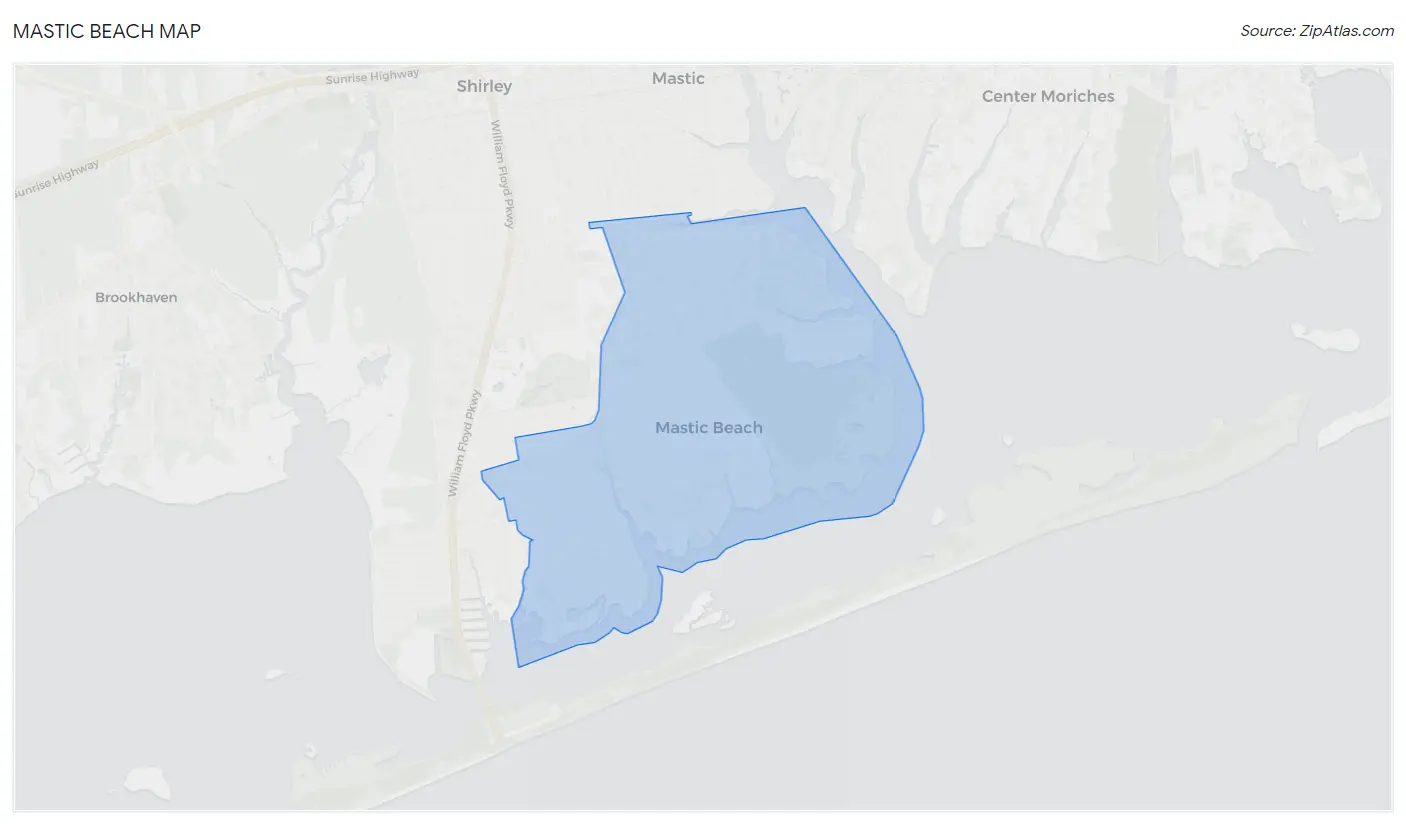
Mastic Beach Map
Mastic Beach Overview
$37,060
PER CAPITA INCOME
$105,805
AVG FAMILY INCOME
$103,099
AVG HOUSEHOLD INCOME
29.0%
WAGE / INCOME GAP [ % ]
71.0¢/ $1
WAGE / INCOME GAP [ $ ]
$11,202
FAMILY INCOME DEFICIT
0.43
INEQUALITY / GINI INDEX
16,189
TOTAL POPULATION
7,152
MALE POPULATION
9,037
FEMALE POPULATION
79.14
MALES / 100 FEMALES
126.36
FEMALES / 100 MALES
38.9
MEDIAN AGE
3.5
AVG FAMILY SIZE
3.1
AVG HOUSEHOLD SIZE
7,751
LABOR FORCE [ PEOPLE ]
63.5%
PERCENT IN LABOR FORCE
5.7%
UNEMPLOYMENT RATE
Mastic Beach Zip Codes
Mastic Beach Area Codes
Income in Mastic Beach
Income Overview in Mastic Beach
Per Capita Income in Mastic Beach is $37,060, while median incomes of families and households are $105,805 and $103,099 respectively.
| Characteristic | Number | Measure |
| Per Capita Income | 16,189 | $37,060 |
| Median Family Income | 3,966 | $105,805 |
| Mean Family Income | 3,966 | $122,237 |
| Median Household Income | 5,189 | $103,099 |
| Mean Household Income | 5,189 | $111,859 |
| Income Deficit | 3,966 | $11,202 |
| Wage / Income Gap (%) | 16,189 | 28.96% |
| Wage / Income Gap ($) | 16,189 | 71.04¢ per $1 |
| Gini / Inequality Index | 16,189 | 0.43 |
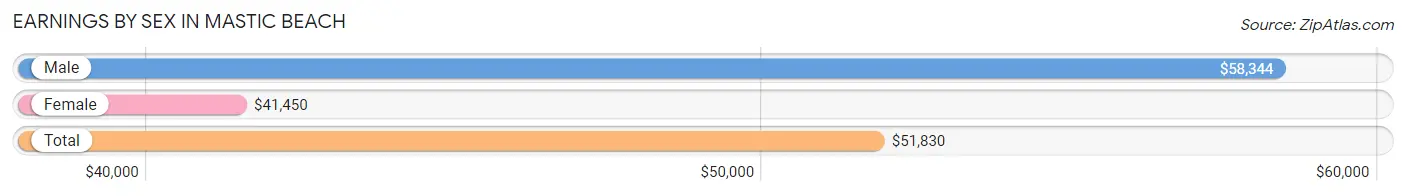
Earnings by Sex in Mastic Beach
Average Earnings in Mastic Beach are $51,830, $58,344 for men and $41,450 for women, a difference of 29.0%.
| Sex | Number | Average Earnings |
| Male | 4,463 (54.0%) | $58,344 |
| Female | 3,797 (46.0%) | $41,450 |
| Total | 8,260 (100.0%) | $51,830 |
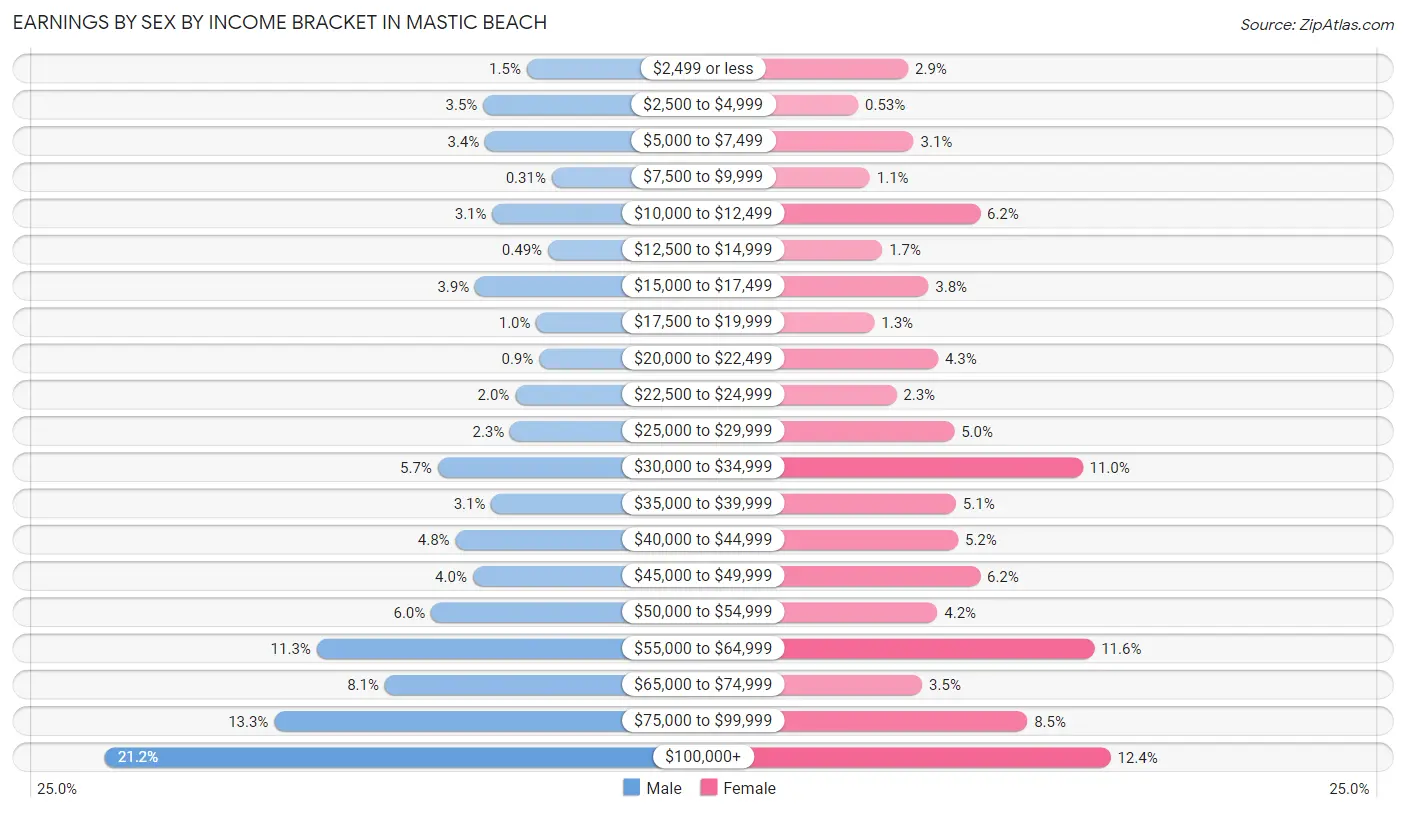
Earnings by Sex by Income Bracket in Mastic Beach
The most common earnings brackets in Mastic Beach are $100,000+ for men (948 | 21.2%) and $100,000+ for women (469 | 12.3%).
| Income | Male | Female |
| $2,499 or less | 66 (1.5%) | 109 (2.9%) |
| $2,500 to $4,999 | 157 (3.5%) | 20 (0.5%) |
| $5,000 to $7,499 | 153 (3.4%) | 119 (3.1%) |
| $7,500 to $9,999 | 14 (0.3%) | 41 (1.1%) |
| $10,000 to $12,499 | 138 (3.1%) | 237 (6.2%) |
| $12,500 to $14,999 | 22 (0.5%) | 63 (1.7%) |
| $15,000 to $17,499 | 174 (3.9%) | 145 (3.8%) |
| $17,500 to $19,999 | 46 (1.0%) | 49 (1.3%) |
| $20,000 to $22,499 | 40 (0.9%) | 162 (4.3%) |
| $22,500 to $24,999 | 90 (2.0%) | 88 (2.3%) |
| $25,000 to $29,999 | 101 (2.3%) | 191 (5.0%) |
| $30,000 to $34,999 | 252 (5.7%) | 419 (11.0%) |
| $35,000 to $39,999 | 140 (3.1%) | 194 (5.1%) |
| $40,000 to $44,999 | 215 (4.8%) | 198 (5.2%) |
| $45,000 to $49,999 | 179 (4.0%) | 237 (6.2%) |
| $50,000 to $54,999 | 266 (6.0%) | 161 (4.2%) |
| $55,000 to $64,999 | 505 (11.3%) | 440 (11.6%) |
| $65,000 to $74,999 | 363 (8.1%) | 134 (3.5%) |
| $75,000 to $99,999 | 594 (13.3%) | 321 (8.5%) |
| $100,000+ | 948 (21.2%) | 469 (12.3%) |
| Total | 4,463 (100.0%) | 3,797 (100.0%) |
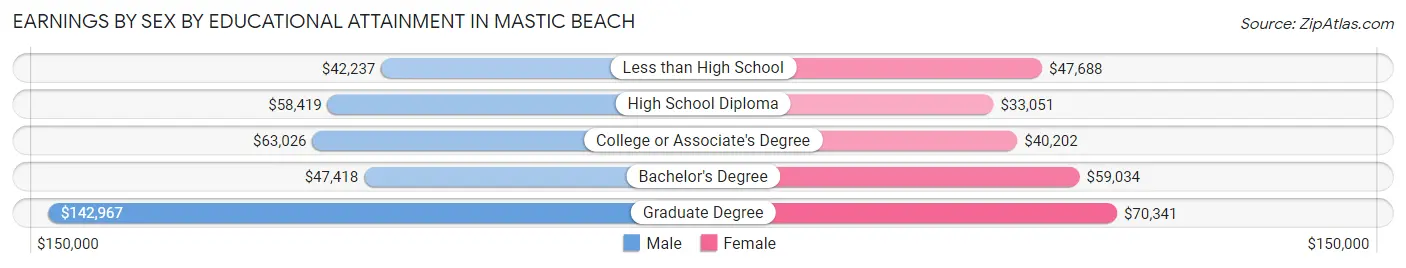
Earnings by Sex by Educational Attainment in Mastic Beach
Average earnings in Mastic Beach are $62,561 for men and $47,711 for women, a difference of 23.7%. Men with an educational attainment of graduate degree enjoy the highest average annual earnings of $142,967, while those with less than high school education earn the least with $42,237. Women with an educational attainment of graduate degree earn the most with the average annual earnings of $70,341, while those with high school diploma education have the smallest earnings of $33,051.
| Educational Attainment | Male Income | Female Income |
| Less than High School | $42,237 | $47,688 |
| High School Diploma | $58,419 | $33,051 |
| College or Associate's Degree | $63,026 | $40,202 |
| Bachelor's Degree | $47,418 | $59,034 |
| Graduate Degree | $142,967 | $70,341 |
| Total | $62,561 | $47,711 |
Family Income in Mastic Beach
Family Income Brackets in Mastic Beach
According to the Mastic Beach family income data, there are 1,487 families falling into the $100,000 to $149,999 income range, which is the most common income bracket and makes up 37.5% of all families. Conversely, the $10,000 to $14,999 income bracket is the least frequent group with only 24 families (0.6%) belonging to this category.
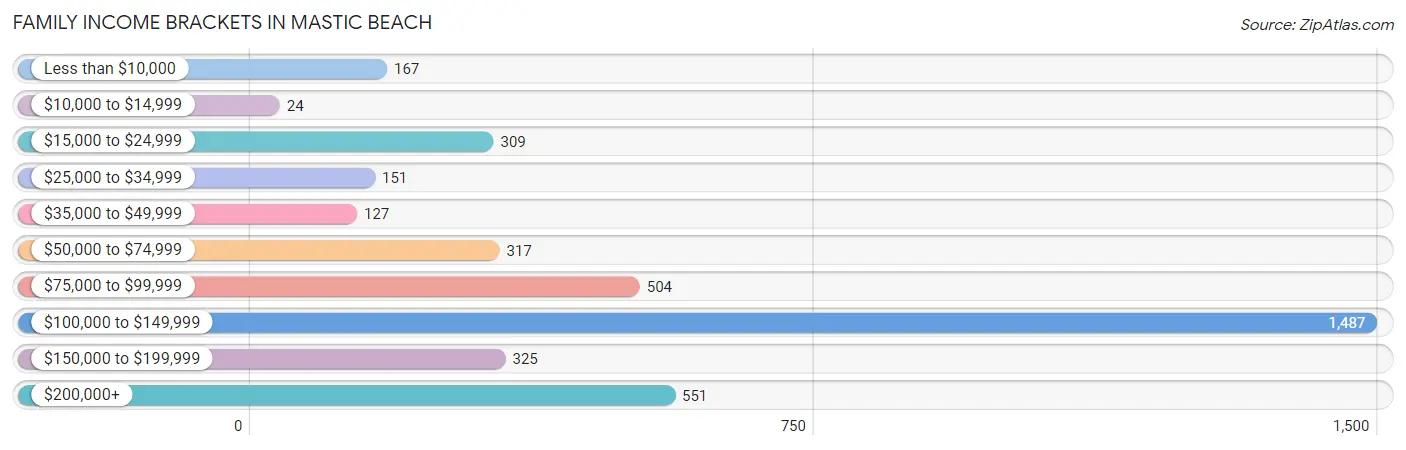
| Income Bracket | # Families | % Families |
| Less than $10,000 | 167 | 4.2% |
| $10,000 to $14,999 | 24 | 0.6% |
| $15,000 to $24,999 | 309 | 7.8% |
| $25,000 to $34,999 | 151 | 3.8% |
| $35,000 to $49,999 | 127 | 3.2% |
| $50,000 to $74,999 | 317 | 8.0% |
| $75,000 to $99,999 | 504 | 12.7% |
| $100,000 to $149,999 | 1,487 | 37.5% |
| $150,000 to $199,999 | 325 | 8.2% |
| $200,000+ | 551 | 13.9% |
Family Income by Famaliy Size in Mastic Beach
5-person families (298 | 7.5%) account for the highest median family income in Mastic Beach with $143,570 per family, while 2-person families (1,638 | 41.3%) have the highest median income of $51,844 per family member.
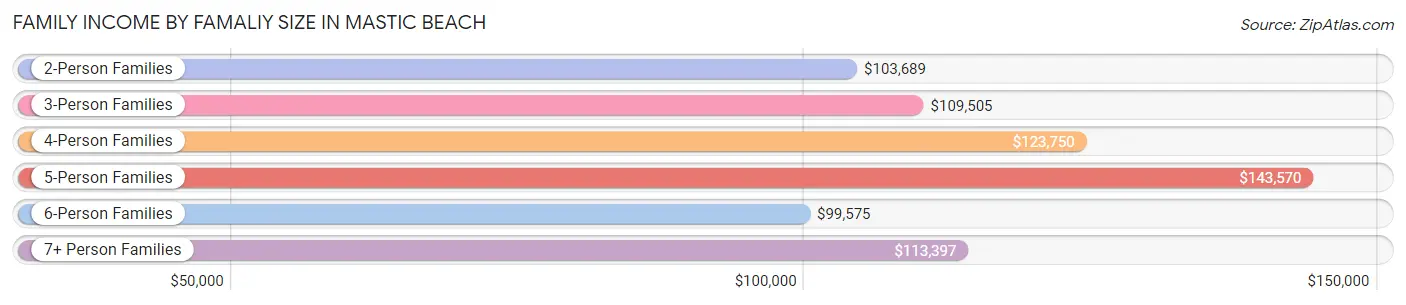
| Income Bracket | # Families | Median Income |
| 2-Person Families | 1,638 (41.3%) | $103,689 |
| 3-Person Families | 859 (21.7%) | $109,505 |
| 4-Person Families | 653 (16.5%) | $123,750 |
| 5-Person Families | 298 (7.5%) | $143,570 |
| 6-Person Families | 409 (10.3%) | $99,575 |
| 7+ Person Families | 109 (2.8%) | $113,397 |
| Total | 3,966 (100.0%) | $105,805 |
Family Income by Number of Earners in Mastic Beach
The median family income in Mastic Beach is $105,805, with families comprising 3+ earners (593) having the highest median family income of $194,271, while families with no earners (397) have the lowest median family income of $24,033, accounting for 14.9% and 10.0% of families, respectively.
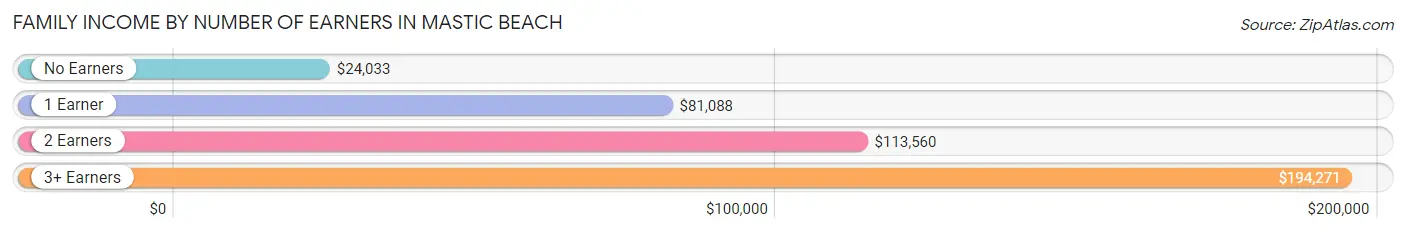
| Number of Earners | # Families | Median Income |
| No Earners | 397 (10.0%) | $24,033 |
| 1 Earner | 1,209 (30.5%) | $81,088 |
| 2 Earners | 1,767 (44.6%) | $113,560 |
| 3+ Earners | 593 (14.9%) | $194,271 |
| Total | 3,966 (100.0%) | $105,805 |
Household Income in Mastic Beach
Household Income Brackets in Mastic Beach
With 1,718 households falling in the category, the $100,000 to $149,999 income range is the most frequent in Mastic Beach, accounting for 33.1% of all households. In contrast, only 57 households (1.1%) fall into the $10,000 to $14,999 income bracket, making it the least populous group.
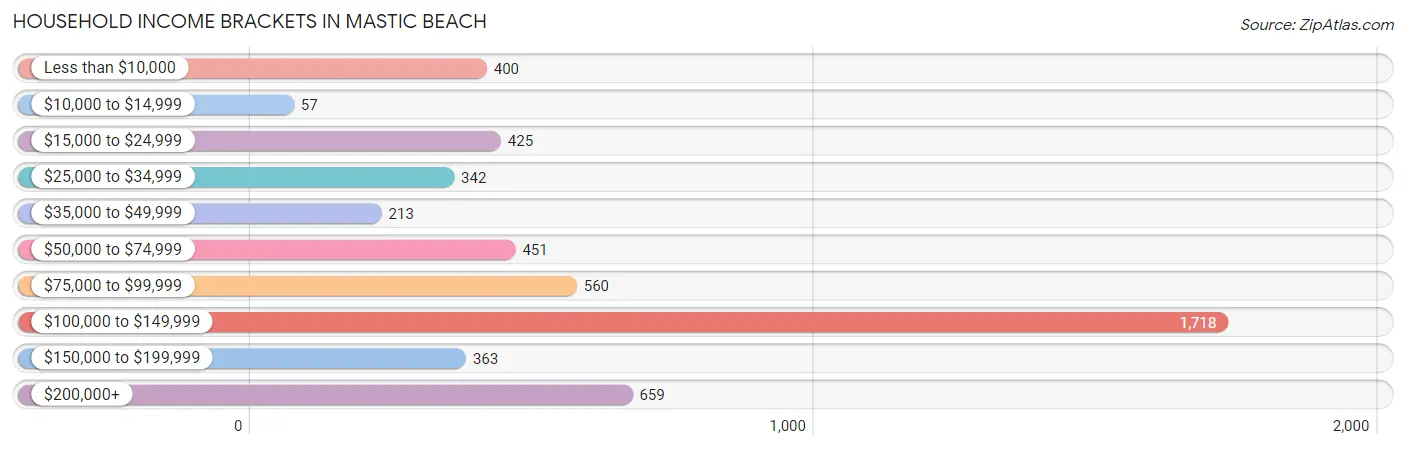
| Income Bracket | # Households | % Households |
| Less than $10,000 | 400 | 7.7% |
| $10,000 to $14,999 | 57 | 1.1% |
| $15,000 to $24,999 | 425 | 8.2% |
| $25,000 to $34,999 | 342 | 6.6% |
| $35,000 to $49,999 | 213 | 4.1% |
| $50,000 to $74,999 | 451 | 8.7% |
| $75,000 to $99,999 | 560 | 10.8% |
| $100,000 to $149,999 | 1,718 | 33.1% |
| $150,000 to $199,999 | 363 | 7.0% |
| $200,000+ | 659 | 12.7% |
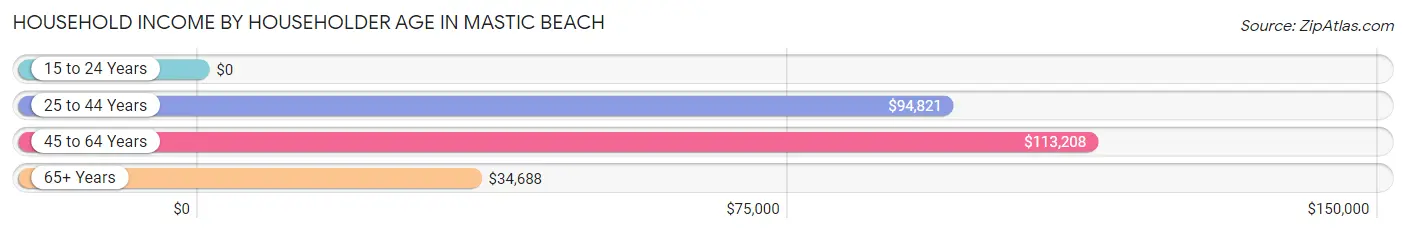
Household Income by Householder Age in Mastic Beach
The median household income in Mastic Beach is $103,099, with the highest median household income of $113,208 found in the 45 to 64 years age bracket for the primary householder. A total of 2,439 households (47.0%) fall into this category. Meanwhile, the 15 to 24 years age bracket for the primary householder has the lowest median household income of $0, with 101 households (1.9%) in this group.
| Income Bracket | # Households | Median Income |
| 15 to 24 Years | 101 (1.9%) | $0 |
| 25 to 44 Years | 1,561 (30.1%) | $94,821 |
| 45 to 64 Years | 2,439 (47.0%) | $113,208 |
| 65+ Years | 1,088 (21.0%) | $34,688 |
| Total | 5,189 (100.0%) | $103,099 |
Poverty in Mastic Beach
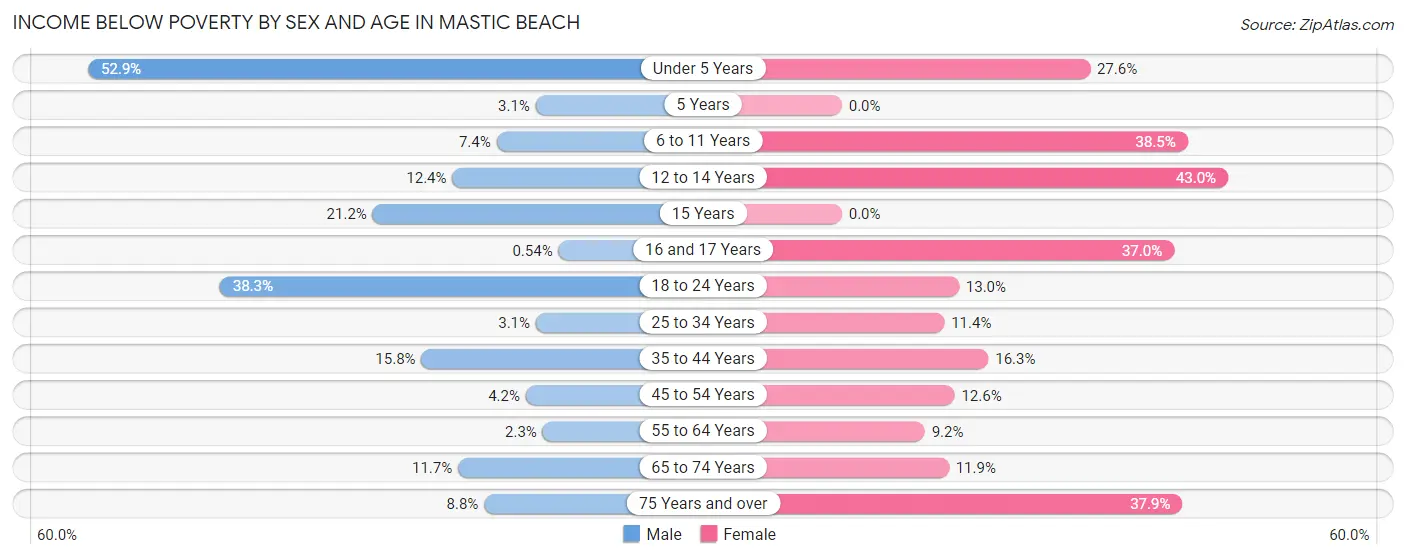
Income Below Poverty by Sex and Age in Mastic Beach
With 11.7% poverty level for males and 20.2% for females among the residents of Mastic Beach, under 5 year old males and 12 to 14 year old females are the most vulnerable to poverty, with 153 males (52.9%) and 89 females (43.0%) in their respective age groups living below the poverty level.
| Age Bracket | Male | Female |
| Under 5 Years | 153 (52.9%) | 264 (27.6%) |
| 5 Years | 7 (3.1%) | 0 (0.0%) |
| 6 to 11 Years | 37 (7.4%) | 446 (38.5%) |
| 12 to 14 Years | 32 (12.4%) | 89 (43.0%) |
| 15 Years | 24 (21.2%) | 0 (0.0%) |
| 16 and 17 Years | 1 (0.5%) | 54 (37.0%) |
| 18 to 24 Years | 251 (38.3%) | 78 (13.0%) |
| 25 to 34 Years | 31 (3.1%) | 102 (11.4%) |
| 35 to 44 Years | 164 (15.8%) | 273 (16.3%) |
| 45 to 54 Years | 40 (4.2%) | 115 (12.6%) |
| 55 to 64 Years | 30 (2.3%) | 92 (9.2%) |
| 65 to 74 Years | 40 (11.7%) | 73 (11.9%) |
| 75 Years and over | 24 (8.8%) | 229 (37.9%) |
| Total | 834 (11.7%) | 1,815 (20.2%) |
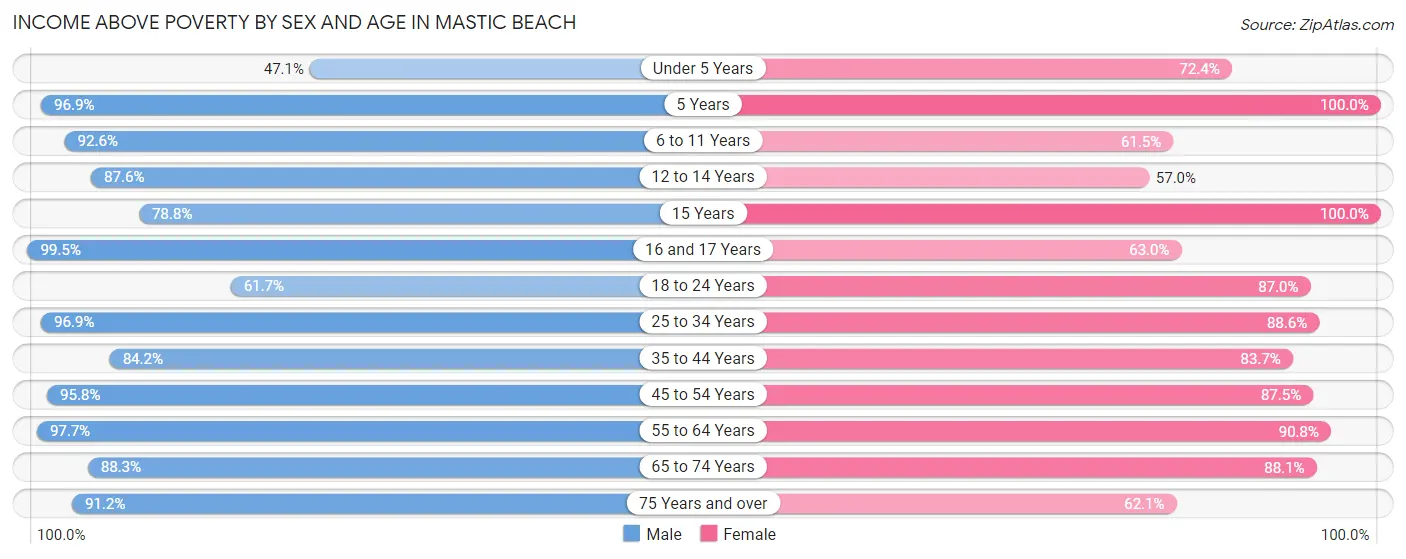
Income Above Poverty by Sex and Age in Mastic Beach
According to the poverty statistics in Mastic Beach, males aged 16 and 17 years and females aged 5 years are the age groups that are most secure financially, with 99.5% of males and 100.0% of females in these age groups living above the poverty line.
| Age Bracket | Male | Female |
| Under 5 Years | 136 (47.1%) | 691 (72.4%) |
| 5 Years | 220 (96.9%) | 42 (100.0%) |
| 6 to 11 Years | 460 (92.6%) | 712 (61.5%) |
| 12 to 14 Years | 227 (87.6%) | 118 (57.0%) |
| 15 Years | 89 (78.8%) | 190 (100.0%) |
| 16 and 17 Years | 185 (99.5%) | 92 (63.0%) |
| 18 to 24 Years | 405 (61.7%) | 520 (87.0%) |
| 25 to 34 Years | 982 (96.9%) | 792 (88.6%) |
| 35 to 44 Years | 873 (84.2%) | 1,400 (83.7%) |
| 45 to 54 Years | 917 (95.8%) | 801 (87.5%) |
| 55 to 64 Years | 1,274 (97.7%) | 904 (90.8%) |
| 65 to 74 Years | 301 (88.3%) | 540 (88.1%) |
| 75 Years and over | 248 (91.2%) | 375 (62.1%) |
| Total | 6,317 (88.3%) | 7,177 (79.8%) |
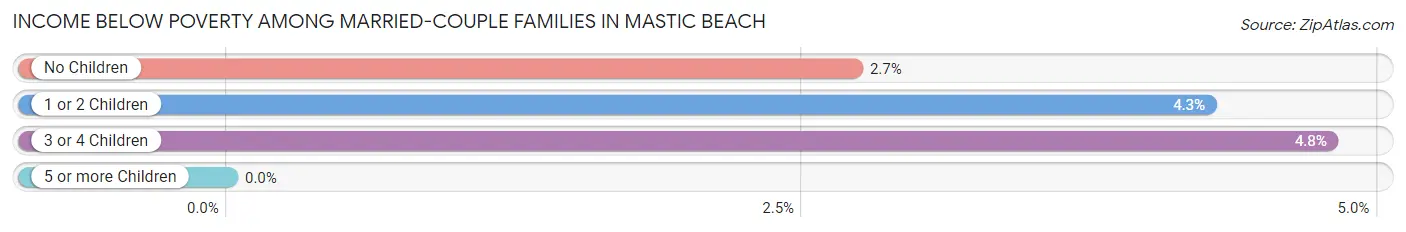
Income Below Poverty Among Married-Couple Families in Mastic Beach
The poverty statistics for married-couple families in Mastic Beach show that 3.4% or 100 of the total 2,959 families live below the poverty line. Families with 3 or 4 children have the highest poverty rate of 4.8%, comprising of 25 families. On the other hand, families with no children have the lowest poverty rate of 2.7%, which includes 51 families.
| Children | Above Poverty | Below Poverty |
| No Children | 1,823 (97.3%) | 51 (2.7%) |
| 1 or 2 Children | 539 (95.7%) | 24 (4.3%) |
| 3 or 4 Children | 497 (95.2%) | 25 (4.8%) |
| 5 or more Children | 0 (0.0%) | 0 (0.0%) |
| Total | 2,859 (96.6%) | 100 (3.4%) |
Income Below Poverty Among Single-Parent Households in Mastic Beach
According to the poverty data in Mastic Beach, 12.8% or 43 single-father households and 47.0% or 316 single-mother households are living below the poverty line. Among single-father households, those with no children have the highest poverty rate, with 37 households (24.3%) experiencing poverty. Likewise, among single-mother households, those with 1 or 2 children have the highest poverty rate, with 220 households (60.6%) falling below the poverty line.
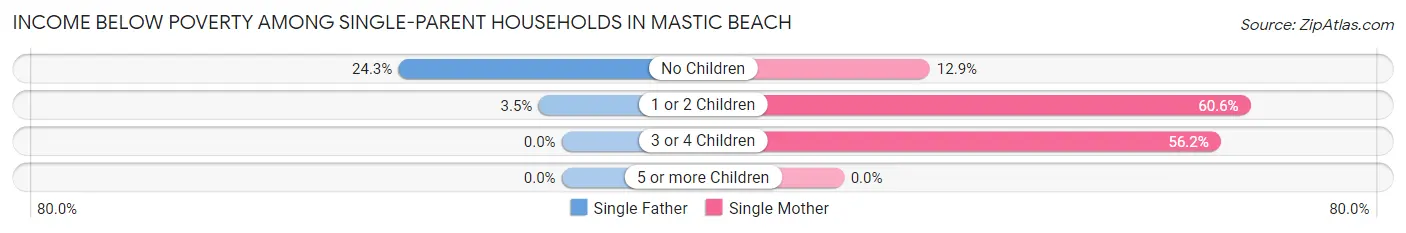
| Children | Single Father | Single Mother |
| No Children | 37 (24.3%) | 23 (12.9%) |
| 1 or 2 Children | 6 (3.5%) | 220 (60.6%) |
| 3 or 4 Children | 0 (0.0%) | 73 (56.1%) |
| 5 or more Children | 0 (0.0%) | 0 (0.0%) |
| Total | 43 (12.8%) | 316 (47.0%) |
Income Below Poverty Among Married-Couple vs Single-Parent Households in Mastic Beach
The poverty data for Mastic Beach shows that 100 of the married-couple family households (3.4%) and 359 of the single-parent households (35.6%) are living below the poverty level. Within the married-couple family households, those with 3 or 4 children have the highest poverty rate, with 25 households (4.8%) falling below the poverty line. Among the single-parent households, those with 3 or 4 children have the highest poverty rate, with 73 household (52.1%) living below poverty.
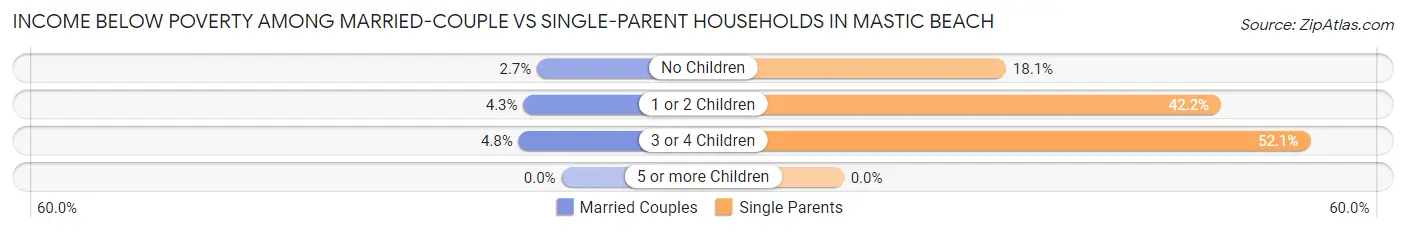
| Children | Married-Couple Families | Single-Parent Households |
| No Children | 51 (2.7%) | 60 (18.1%) |
| 1 or 2 Children | 24 (4.3%) | 226 (42.2%) |
| 3 or 4 Children | 25 (4.8%) | 73 (52.1%) |
| 5 or more Children | 0 (0.0%) | 0 (0.0%) |
| Total | 100 (3.4%) | 359 (35.6%) |
Race in Mastic Beach
The most populous races in Mastic Beach are White / Caucasian (12,829 | 79.2%), Hispanic or Latino (2,858 | 17.6%), and Black / African American (1,526 | 9.4%).
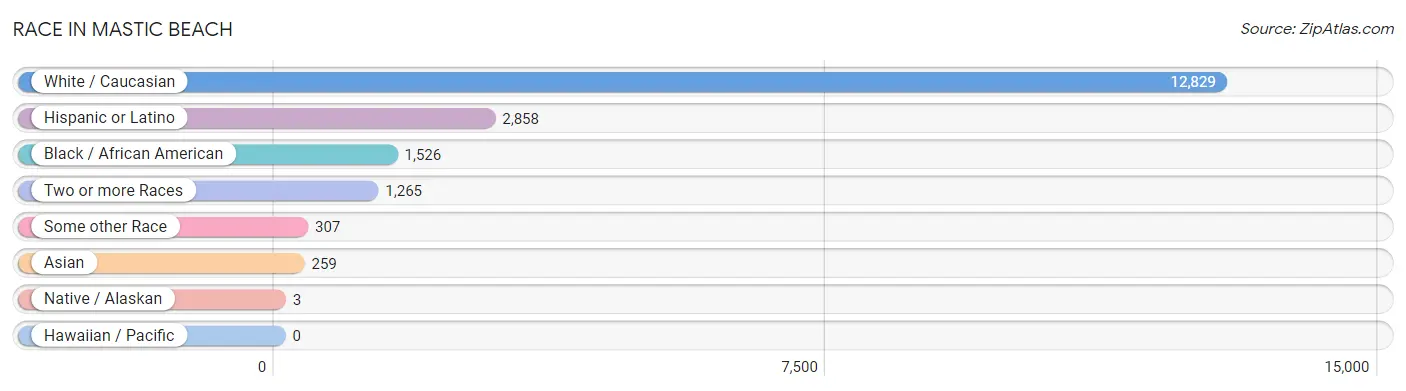
| Race | # Population | % Population |
| Asian | 259 | 1.6% |
| Black / African American | 1,526 | 9.4% |
| Hawaiian / Pacific | 0 | 0.0% |
| Hispanic or Latino | 2,858 | 17.6% |
| Native / Alaskan | 3 | 0.0% |
| White / Caucasian | 12,829 | 79.2% |
| Two or more Races | 1,265 | 7.8% |
| Some other Race | 307 | 1.9% |
| Total | 16,189 | 100.0% |
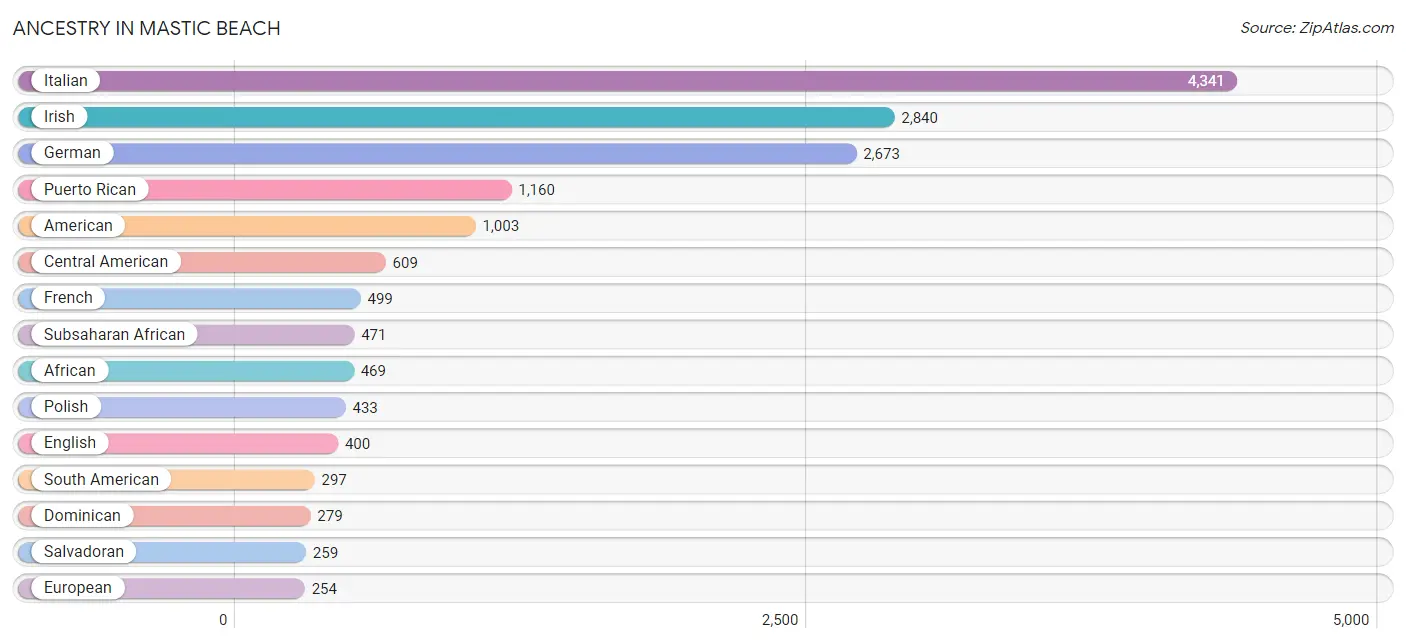
Ancestry in Mastic Beach
The most populous ancestries reported in Mastic Beach are Italian (4,341 | 26.8%), Irish (2,840 | 17.5%), German (2,673 | 16.5%), Puerto Rican (1,160 | 7.2%), and American (1,003 | 6.2%), together accounting for 74.2% of all Mastic Beach residents.
| Ancestry | # Population | % Population |
| African | 469 | 2.9% |
| American | 1,003 | 6.2% |
| Armenian | 21 | 0.1% |
| Austrian | 41 | 0.3% |
| Barbadian | 13 | 0.1% |
| Bolivian | 57 | 0.4% |
| British | 95 | 0.6% |
| Burmese | 11 | 0.1% |
| Central American | 609 | 3.8% |
| Central American Indian | 3 | 0.0% |
| Colombian | 2 | 0.0% |
| Costa Rican | 8 | 0.1% |
| Cuban | 230 | 1.4% |
| Czech | 9 | 0.1% |
| Dominican | 279 | 1.7% |
| Dutch | 95 | 0.6% |
| Eastern European | 34 | 0.2% |
| Ecuadorian | 100 | 0.6% |
| English | 400 | 2.5% |
| European | 254 | 1.6% |
| Finnish | 16 | 0.1% |
| French | 499 | 3.1% |
| French Canadian | 75 | 0.5% |
| German | 2,673 | 16.5% |
| Ghanaian | 1 | 0.0% |
| Greek | 249 | 1.5% |
| Guatemalan | 192 | 1.2% |
| Guyanese | 22 | 0.1% |
| Haitian | 1 | 0.0% |
| Honduran | 15 | 0.1% |
| Hungarian | 20 | 0.1% |
| Indian (Asian) | 108 | 0.7% |
| Irish | 2,840 | 17.5% |
| Iroquois | 7 | 0.0% |
| Italian | 4,341 | 26.8% |
| Jamaican | 8 | 0.1% |
| Korean | 13 | 0.1% |
| Latvian | 17 | 0.1% |
| Lithuanian | 64 | 0.4% |
| Mexican | 127 | 0.8% |
| Nicaraguan | 135 | 0.8% |
| Northern European | 38 | 0.2% |
| Norwegian | 131 | 0.8% |
| Peruvian | 121 | 0.7% |
| Polish | 433 | 2.7% |
| Portuguese | 47 | 0.3% |
| Puerto Rican | 1,160 | 7.2% |
| Russian | 183 | 1.1% |
| Salvadoran | 259 | 1.6% |
| Scandinavian | 209 | 1.3% |
| Scotch-Irish | 16 | 0.1% |
| Scottish | 46 | 0.3% |
| Sioux | 18 | 0.1% |
| South African | 1 | 0.0% |
| South American | 297 | 1.8% |
| Spaniard | 104 | 0.6% |
| Spanish | 10 | 0.1% |
| Sri Lankan | 97 | 0.6% |
| Subsaharan African | 471 | 2.9% |
| Swedish | 12 | 0.1% |
| Thai | 46 | 0.3% |
| Ukrainian | 76 | 0.5% |
| Venezuelan | 17 | 0.1% |
| West Indian | 3 | 0.0% |
| Yugoslavian | 4 | 0.0% | View All 65 Rows |
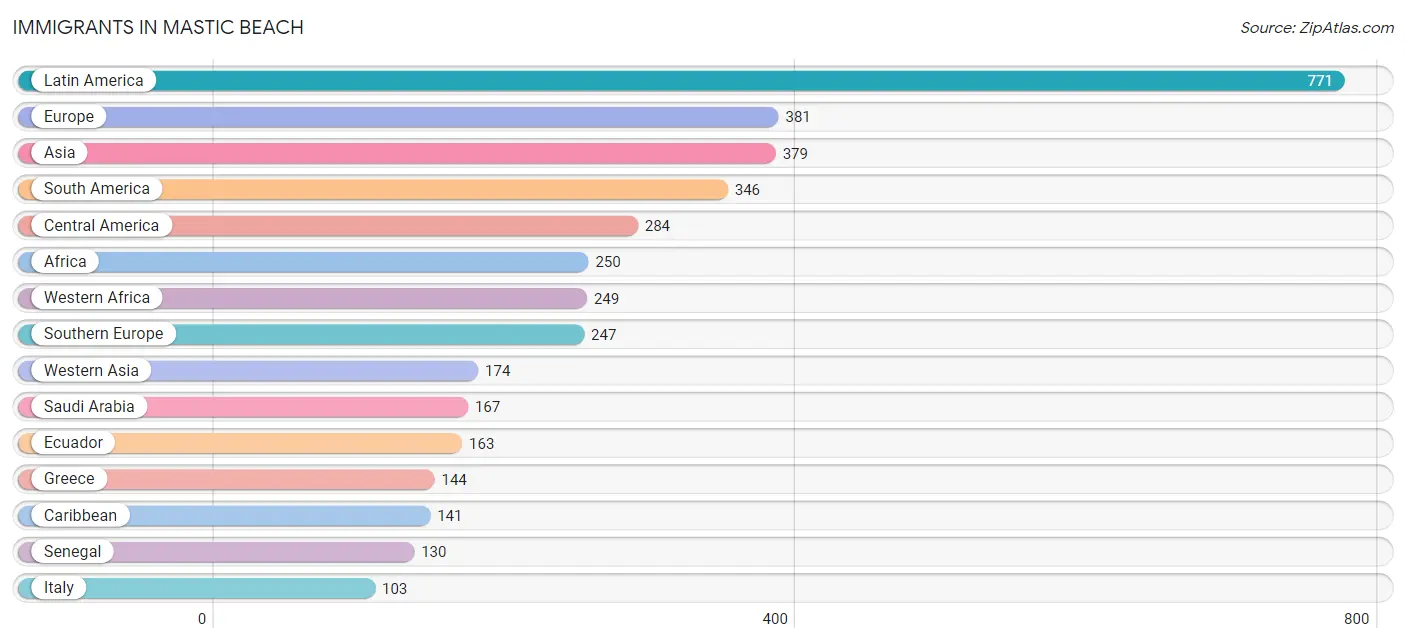
Immigrants in Mastic Beach
The most numerous immigrant groups reported in Mastic Beach came from Latin America (771 | 4.8%), Europe (381 | 2.4%), Asia (379 | 2.3%), South America (346 | 2.1%), and Central America (284 | 1.8%), together accounting for 13.3% of all Mastic Beach residents.
| Immigration Origin | # Population | % Population |
| Africa | 250 | 1.5% |
| Asia | 379 | 2.3% |
| Barbados | 56 | 0.4% |
| Bolivia | 57 | 0.4% |
| Caribbean | 141 | 0.9% |
| Central America | 284 | 1.8% |
| China | 63 | 0.4% |
| Colombia | 15 | 0.1% |
| Costa Rica | 16 | 0.1% |
| Cuba | 60 | 0.4% |
| Dominican Republic | 25 | 0.2% |
| Eastern Asia | 63 | 0.4% |
| Eastern Europe | 69 | 0.4% |
| Ecuador | 163 | 1.0% |
| El Salvador | 71 | 0.4% |
| Europe | 381 | 2.4% |
| Germany | 25 | 0.2% |
| Ghana | 1 | 0.0% |
| Greece | 144 | 0.9% |
| Guatemala | 82 | 0.5% |
| Guyana | 22 | 0.1% |
| Honduras | 7 | 0.0% |
| Hungary | 7 | 0.0% |
| India | 55 | 0.3% |
| Iran | 21 | 0.1% |
| Italy | 103 | 0.6% |
| Latin America | 771 | 4.8% |
| Mexico | 44 | 0.3% |
| Nicaragua | 64 | 0.4% |
| Northern Europe | 40 | 0.3% |
| Norway | 40 | 0.3% |
| Peru | 72 | 0.4% |
| Philippines | 8 | 0.1% |
| Poland | 26 | 0.2% |
| Saudi Arabia | 167 | 1.0% |
| Senegal | 130 | 0.8% |
| South Africa | 1 | 0.0% |
| South America | 346 | 2.1% |
| South Central Asia | 76 | 0.5% |
| South Eastern Asia | 66 | 0.4% |
| Southern Europe | 247 | 1.5% |
| Ukraine | 36 | 0.2% |
| Venezuela | 17 | 0.1% |
| Vietnam | 58 | 0.4% |
| Western Africa | 249 | 1.5% |
| Western Asia | 174 | 1.1% |
| Western Europe | 25 | 0.2% | View All 47 Rows |
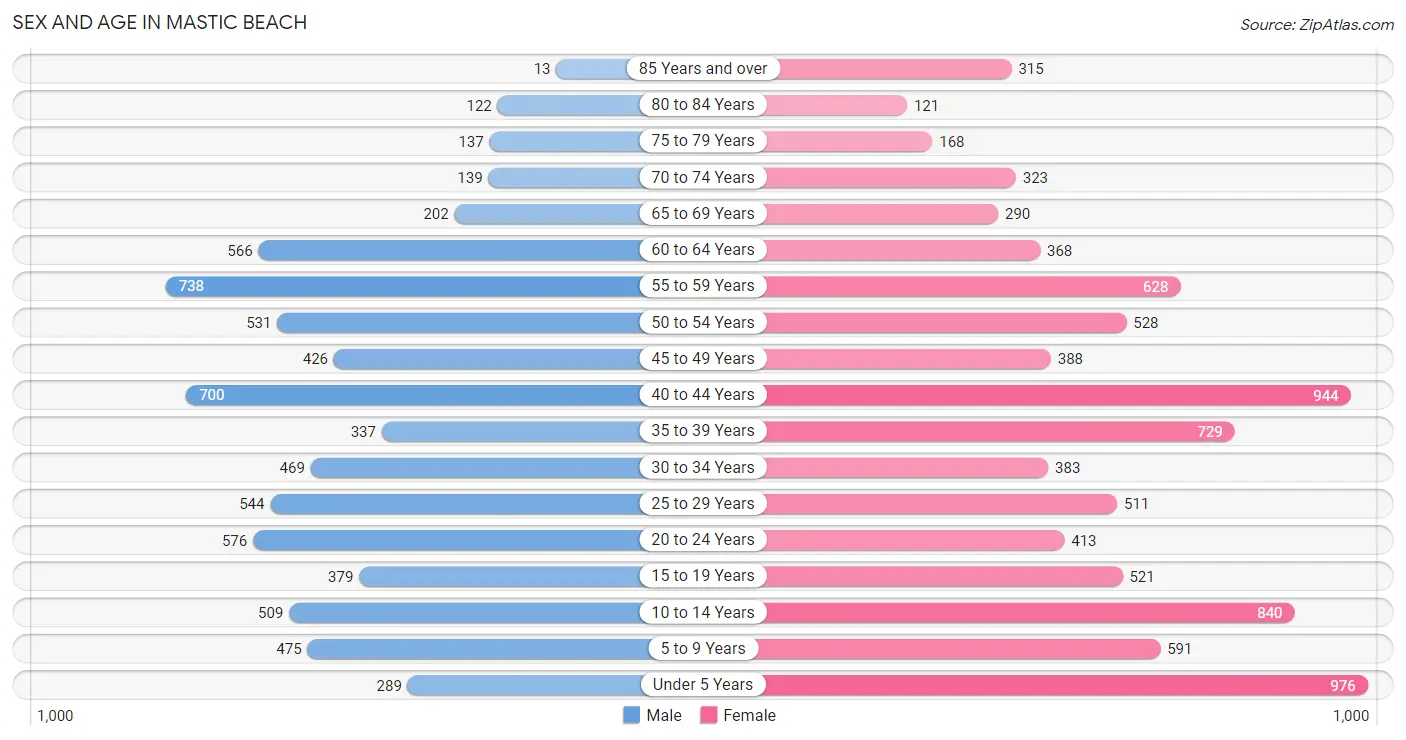
Sex and Age in Mastic Beach
Sex and Age in Mastic Beach
The most populous age groups in Mastic Beach are 55 to 59 Years (738 | 10.3%) for men and Under 5 Years (976 | 10.8%) for women.
| Age Bracket | Male | Female |
| Under 5 Years | 289 (4.0%) | 976 (10.8%) |
| 5 to 9 Years | 475 (6.6%) | 591 (6.5%) |
| 10 to 14 Years | 509 (7.1%) | 840 (9.3%) |
| 15 to 19 Years | 379 (5.3%) | 521 (5.8%) |
| 20 to 24 Years | 576 (8.1%) | 413 (4.6%) |
| 25 to 29 Years | 544 (7.6%) | 511 (5.7%) |
| 30 to 34 Years | 469 (6.6%) | 383 (4.2%) |
| 35 to 39 Years | 337 (4.7%) | 729 (8.1%) |
| 40 to 44 Years | 700 (9.8%) | 944 (10.4%) |
| 45 to 49 Years | 426 (6.0%) | 388 (4.3%) |
| 50 to 54 Years | 531 (7.4%) | 528 (5.8%) |
| 55 to 59 Years | 738 (10.3%) | 628 (7.0%) |
| 60 to 64 Years | 566 (7.9%) | 368 (4.1%) |
| 65 to 69 Years | 202 (2.8%) | 290 (3.2%) |
| 70 to 74 Years | 139 (1.9%) | 323 (3.6%) |
| 75 to 79 Years | 137 (1.9%) | 168 (1.9%) |
| 80 to 84 Years | 122 (1.7%) | 121 (1.3%) |
| 85 Years and over | 13 (0.2%) | 315 (3.5%) |
| Total | 7,152 (100.0%) | 9,037 (100.0%) |
Families and Households in Mastic Beach
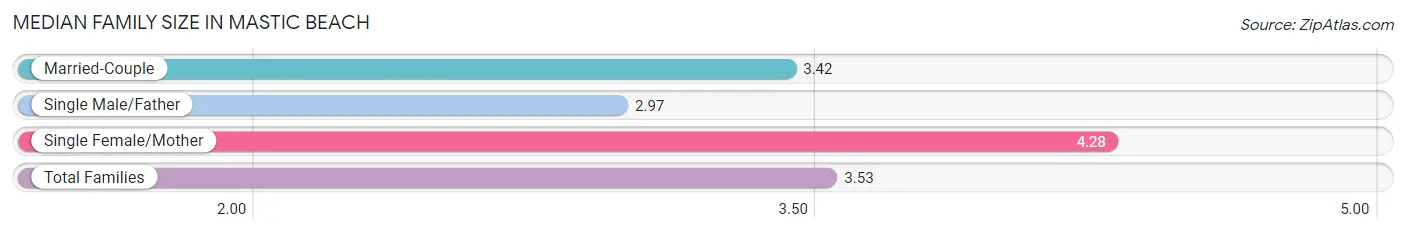
Median Family Size in Mastic Beach
The median family size in Mastic Beach is 3.53 persons per family, with single female/mother families (672 | 16.9%) accounting for the largest median family size of 4.28 persons per family. On the other hand, single male/father families (335 | 8.5%) represent the smallest median family size with 2.97 persons per family.
| Family Type | # Families | Family Size |
| Married-Couple | 2,959 (74.6%) | 3.42 |
| Single Male/Father | 335 (8.5%) | 2.97 |
| Single Female/Mother | 672 (16.9%) | 4.28 |
| Total Families | 3,966 (100.0%) | 3.53 |
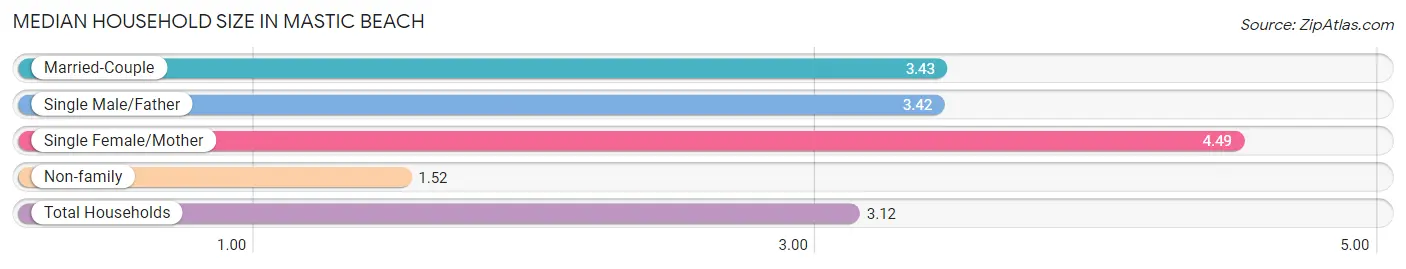
Median Household Size in Mastic Beach
The median household size in Mastic Beach is 3.12 persons per household, with single female/mother households (672 | 13.0%) accounting for the largest median household size of 4.49 persons per household. non-family households (1,223 | 23.6%) represent the smallest median household size with 1.52 persons per household.
| Household Type | # Households | Household Size |
| Married-Couple | 2,959 (57.0%) | 3.43 |
| Single Male/Father | 335 (6.5%) | 3.42 |
| Single Female/Mother | 672 (13.0%) | 4.49 |
| Non-family | 1,223 (23.6%) | 1.52 |
| Total Households | 5,189 (100.0%) | 3.12 |
Household Size by Marriage Status in Mastic Beach
Out of a total of 5,189 households in Mastic Beach, 3,966 (76.4%) are family households, while 1,223 (23.6%) are nonfamily households. The most numerous type of family households are 2-person households, comprising 1,562, and the most common type of nonfamily households are 1-person households, comprising 877.
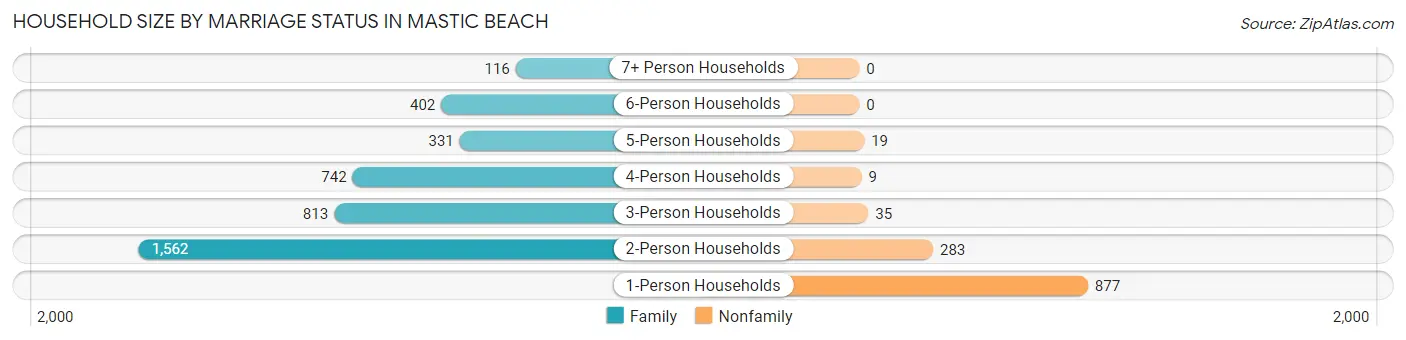
| Household Size | Family Households | Nonfamily Households |
| 1-Person Households | - | 877 (16.9%) |
| 2-Person Households | 1,562 (30.1%) | 283 (5.4%) |
| 3-Person Households | 813 (15.7%) | 35 (0.7%) |
| 4-Person Households | 742 (14.3%) | 9 (0.2%) |
| 5-Person Households | 331 (6.4%) | 19 (0.4%) |
| 6-Person Households | 402 (7.7%) | 0 (0.0%) |
| 7+ Person Households | 116 (2.2%) | 0 (0.0%) |
| Total | 3,966 (76.4%) | 1,223 (23.6%) |
Female Fertility in Mastic Beach
Fertility by Age in Mastic Beach
Average fertility rate in Mastic Beach is 40.0 births per 1,000 women. Women in the age bracket of 20 to 34 years have the highest fertility rate with 89.0 births per 1,000 women. Women in the age bracket of 20 to 34 years acount for 72.1% of all women with births.
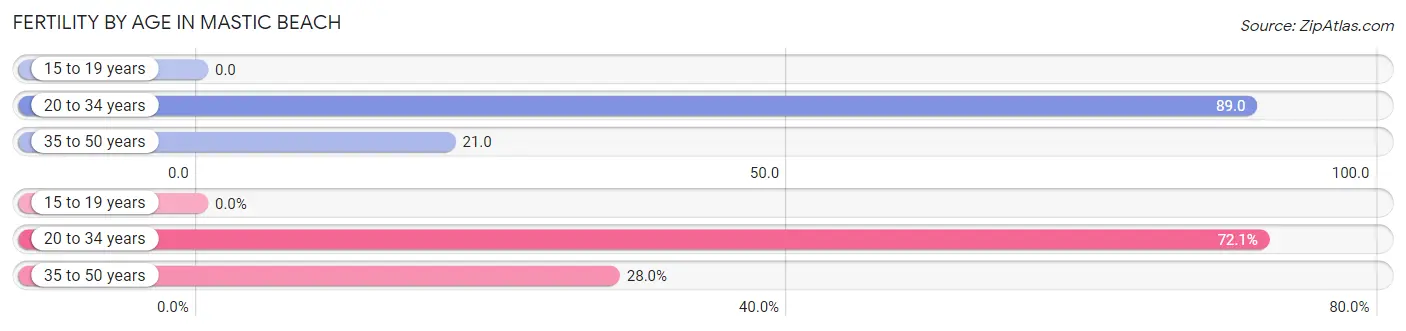
| Age Bracket | Women with Births | Births / 1,000 Women |
| 15 to 19 years | 0 (0.0%) | 0.0 |
| 20 to 34 years | 116 (72.1%) | 89.0 |
| 35 to 50 years | 45 (28.0%) | 21.0 |
| Total | 161 (100.0%) | 40.0 |
Fertility by Age by Marriage Status in Mastic Beach
65.2% of women with births (161) in Mastic Beach are married. The highest percentage of unmarried women with births falls into 35 to 50 years age bracket with 100.0% of them unmarried at the time of birth, while the lowest percentage of unmarried women with births belong to 20 to 34 years age bracket with 9.5% of them unmarried.
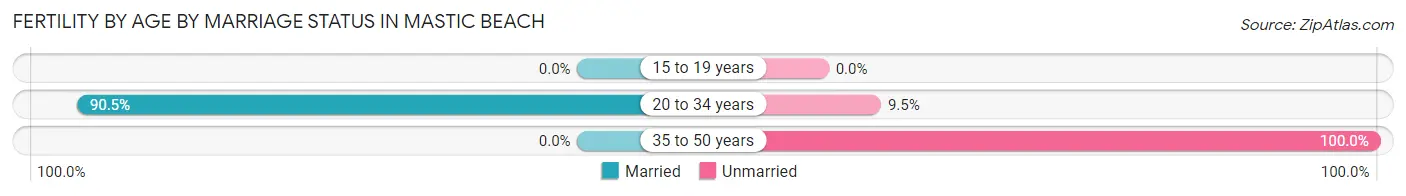
| Age Bracket | Married | Unmarried |
| 15 to 19 years | 0 (0.0%) | 0 (0.0%) |
| 20 to 34 years | 105 (90.5%) | 11 (9.5%) |
| 35 to 50 years | 0 (0.0%) | 45 (100.0%) |
| Total | 105 (65.2%) | 56 (34.8%) |
Fertility by Education in Mastic Beach
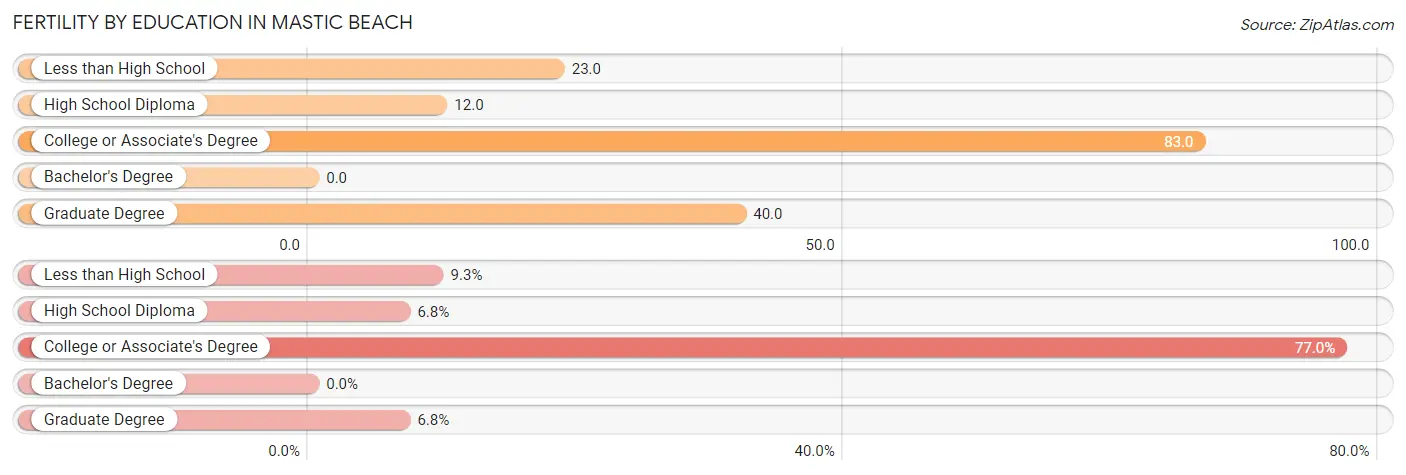
| Educational Attainment | Women with Births | Births / 1,000 Women |
| Less than High School | 15 (9.3%) | 23.0 |
| High School Diploma | 11 (6.8%) | 12.0 |
| College or Associate's Degree | 124 (77.0%) | 83.0 |
| Bachelor's Degree | 0 (0.0%) | 0.0 |
| Graduate Degree | 11 (6.8%) | 40.0 |
| Total | 161 (100.0%) | 40.0 |
Fertility by Education by Marriage Status in Mastic Beach
34.8% of women with births in Mastic Beach are unmarried. Women with the educational attainment of graduate degree are most likely to be married with 100.0% of them married at childbirth, while women with the educational attainment of less than high school are least likely to be married with 100.0% of them unmarried at childbirth.
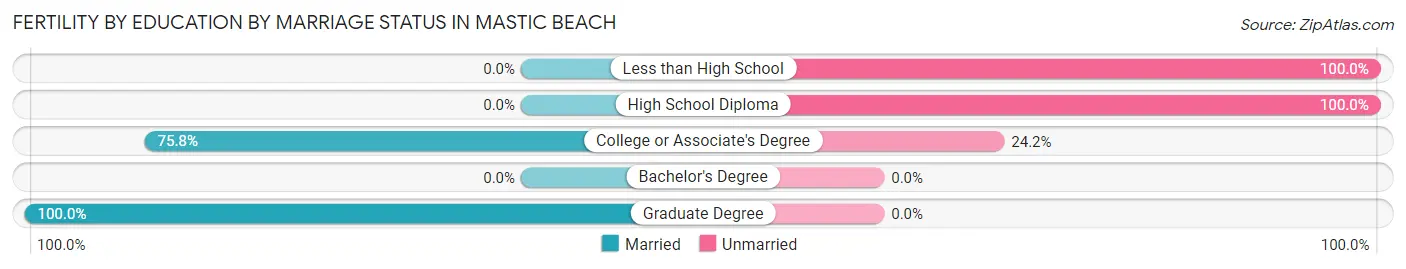
| Educational Attainment | Married | Unmarried |
| Less than High School | 0 (0.0%) | 15 (100.0%) |
| High School Diploma | 0 (0.0%) | 11 (100.0%) |
| College or Associate's Degree | 94 (75.8%) | 30 (24.2%) |
| Bachelor's Degree | 0 (0.0%) | 0 (0.0%) |
| Graduate Degree | 11 (100.0%) | 0 (0.0%) |
| Total | 105 (65.2%) | 56 (34.8%) |
Employment Characteristics in Mastic Beach
Employment by Class of Employer in Mastic Beach
Among the 7,182 employed individuals in Mastic Beach, private company employees (5,409 | 75.3%), not-for-profit organizations (517 | 7.2%), and local government employees (391 | 5.4%) make up the most common classes of employment.
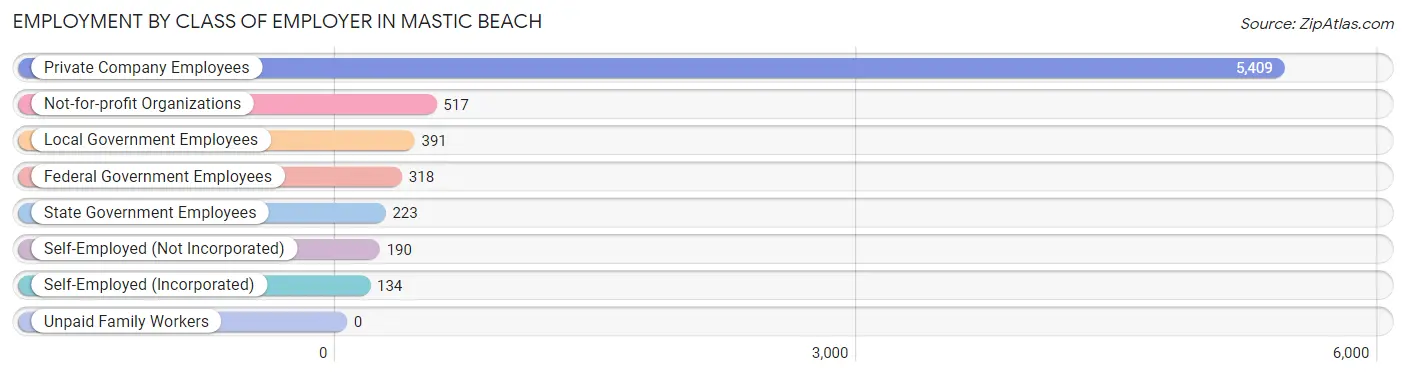
| Employer Class | # Employees | % Employees |
| Private Company Employees | 5,409 | 75.3% |
| Self-Employed (Incorporated) | 134 | 1.9% |
| Self-Employed (Not Incorporated) | 190 | 2.6% |
| Not-for-profit Organizations | 517 | 7.2% |
| Local Government Employees | 391 | 5.4% |
| State Government Employees | 223 | 3.1% |
| Federal Government Employees | 318 | 4.4% |
| Unpaid Family Workers | 0 | 0.0% |
| Total | 7,182 | 100.0% |
Employment Status by Age in Mastic Beach
According to the labor force statistics for Mastic Beach, out of the total population over 16 years of age (12,206), 63.5% or 7,751 individuals are in the labor force, with 5.7% or 442 of them unemployed. The age group with the highest labor force participation rate is 30 to 34 years, with 85.3% or 727 individuals in the labor force. Within the labor force, the 16 to 19 years age range has the highest percentage of unemployed individuals, with 41.6% or 97 of them being unemployed.
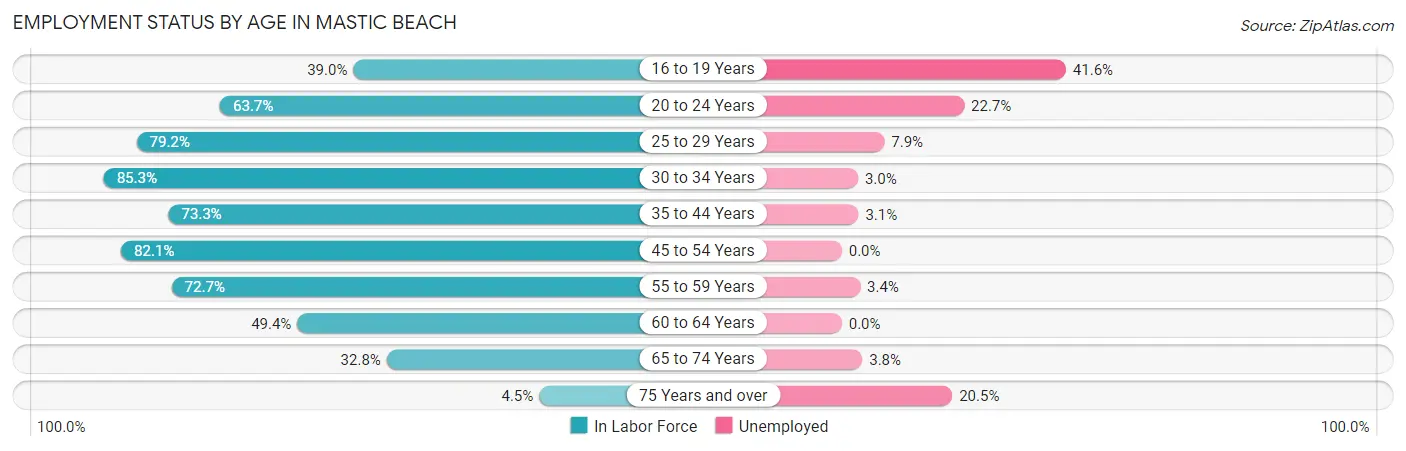
| Age Bracket | In Labor Force | Unemployed |
| 16 to 19 Years | 233 (39.0%) | 97 (41.6%) |
| 20 to 24 Years | 630 (63.7%) | 143 (22.7%) |
| 25 to 29 Years | 836 (79.2%) | 66 (7.9%) |
| 30 to 34 Years | 727 (85.3%) | 22 (3.0%) |
| 35 to 44 Years | 1,986 (73.3%) | 62 (3.1%) |
| 45 to 54 Years | 1,538 (82.1%) | 0 (0.0%) |
| 55 to 59 Years | 993 (72.7%) | 34 (3.4%) |
| 60 to 64 Years | 461 (49.4%) | 0 (0.0%) |
| 65 to 74 Years | 313 (32.8%) | 12 (3.8%) |
| 75 Years and over | 39 (4.5%) | 8 (20.5%) |
| Total | 7,751 (63.5%) | 442 (5.7%) |
Employment Status by Educational Attainment in Mastic Beach
According to labor force statistics for Mastic Beach, 74.4% of individuals (6,540) out of the total population between 25 and 64 years of age (8,790) are in the labor force, with 2.8% or 183 of them being unemployed. The group with the highest labor force participation rate are those with the educational attainment of bachelor's degree or higher, with 94.4% or 1,813 individuals in the labor force. Within the labor force, individuals with less than high school education have the highest percentage of unemployment, with 4.8% or 27 of them being unemployed.
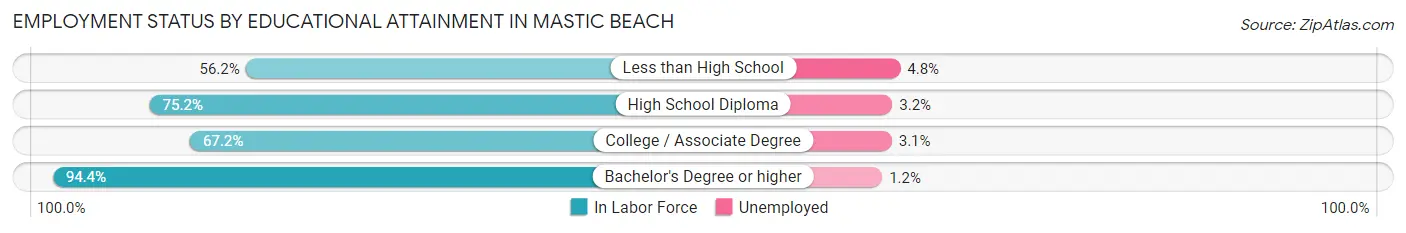
| Educational Attainment | In Labor Force | Unemployed |
| Less than High School | 560 (56.2%) | 48 (4.8%) |
| High School Diploma | 2,095 (75.2%) | 89 (3.2%) |
| College / Associate Degree | 2,074 (67.2%) | 96 (3.1%) |
| Bachelor's Degree or higher | 1,813 (94.4%) | 23 (1.2%) |
| Total | 6,540 (74.4%) | 246 (2.8%) |
Employment Occupations by Sex in Mastic Beach
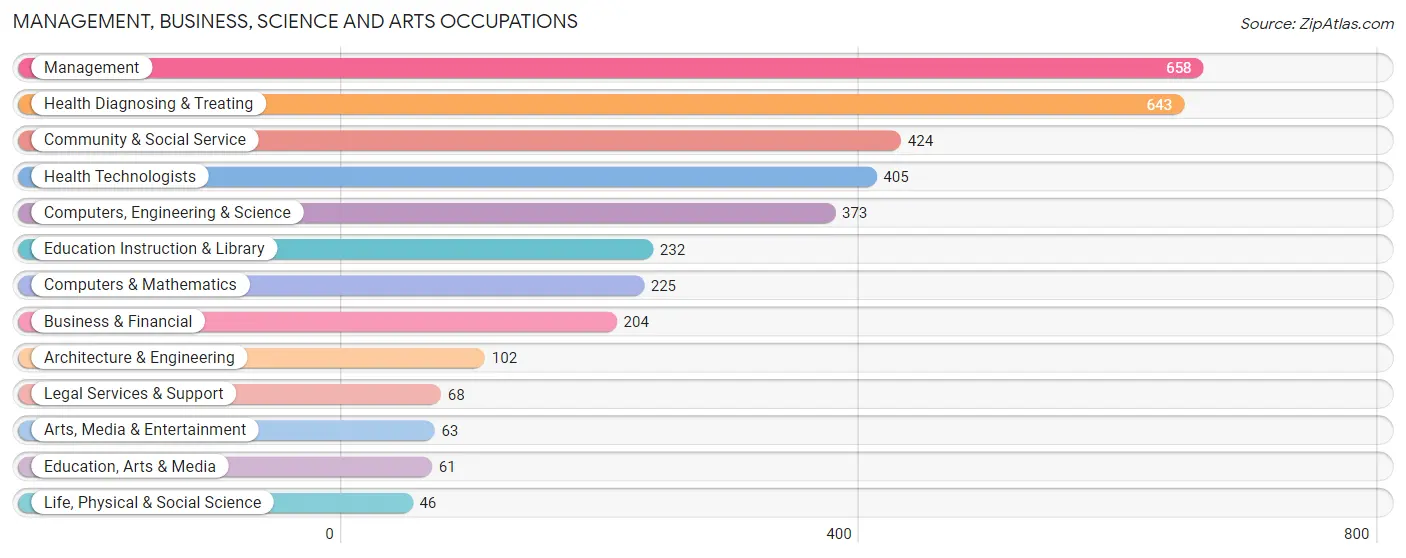
Management, Business, Science and Arts Occupations
The most common Management, Business, Science and Arts occupations in Mastic Beach are Management (658 | 9.0%), Health Diagnosing & Treating (643 | 8.8%), Community & Social Service (424 | 5.8%), Health Technologists (405 | 5.6%), and Computers, Engineering & Science (373 | 5.1%).
Management, Business, Science and Arts Occupations by Sex
Within the Management, Business, Science and Arts occupations in Mastic Beach, the most male-oriented occupations are Architecture & Engineering (100.0%), Computers & Mathematics (98.2%), and Computers, Engineering & Science (92.5%), while the most female-oriented occupations are Legal Services & Support (100.0%), Arts, Media & Entertainment (100.0%), and Health Technologists (98.5%).
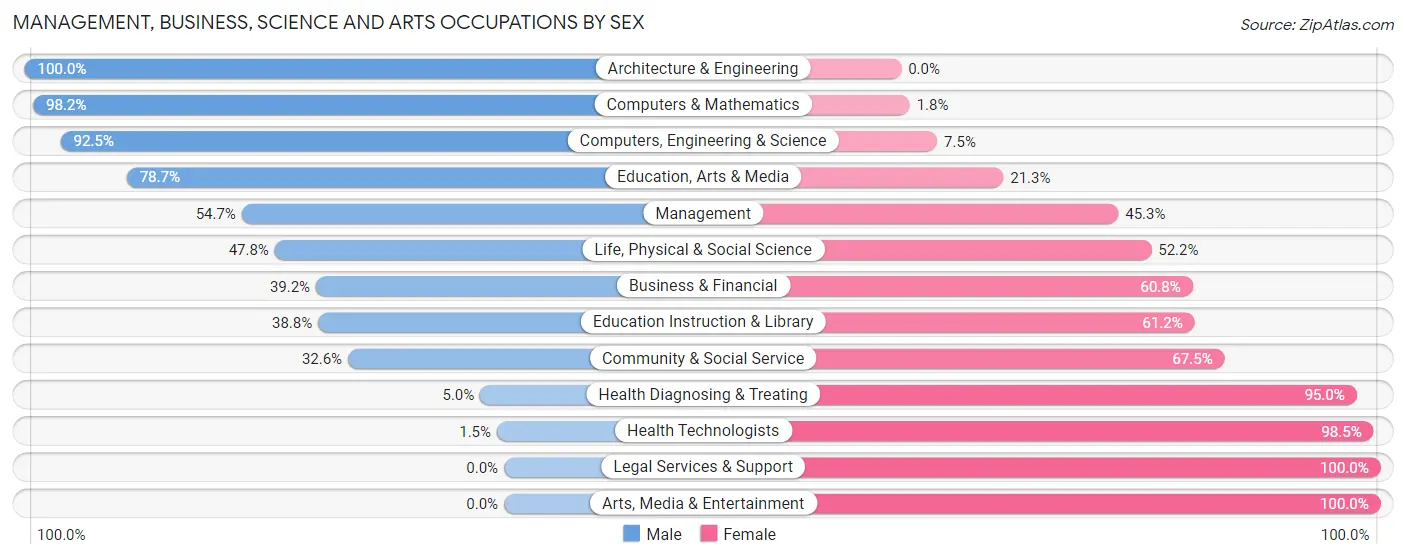
| Occupation | Male | Female |
| Management | 360 (54.7%) | 298 (45.3%) |
| Business & Financial | 80 (39.2%) | 124 (60.8%) |
| Computers, Engineering & Science | 345 (92.5%) | 28 (7.5%) |
| Computers & Mathematics | 221 (98.2%) | 4 (1.8%) |
| Architecture & Engineering | 102 (100.0%) | 0 (0.0%) |
| Life, Physical & Social Science | 22 (47.8%) | 24 (52.2%) |
| Community & Social Service | 138 (32.6%) | 286 (67.4%) |
| Education, Arts & Media | 48 (78.7%) | 13 (21.3%) |
| Legal Services & Support | 0 (0.0%) | 68 (100.0%) |
| Education Instruction & Library | 90 (38.8%) | 142 (61.2%) |
| Arts, Media & Entertainment | 0 (0.0%) | 63 (100.0%) |
| Health Diagnosing & Treating | 32 (5.0%) | 611 (95.0%) |
| Health Technologists | 6 (1.5%) | 399 (98.5%) |
| Total (Category) | 955 (41.5%) | 1,347 (58.5%) |
| Total (Overall) | 3,604 (49.4%) | 3,685 (50.6%) |
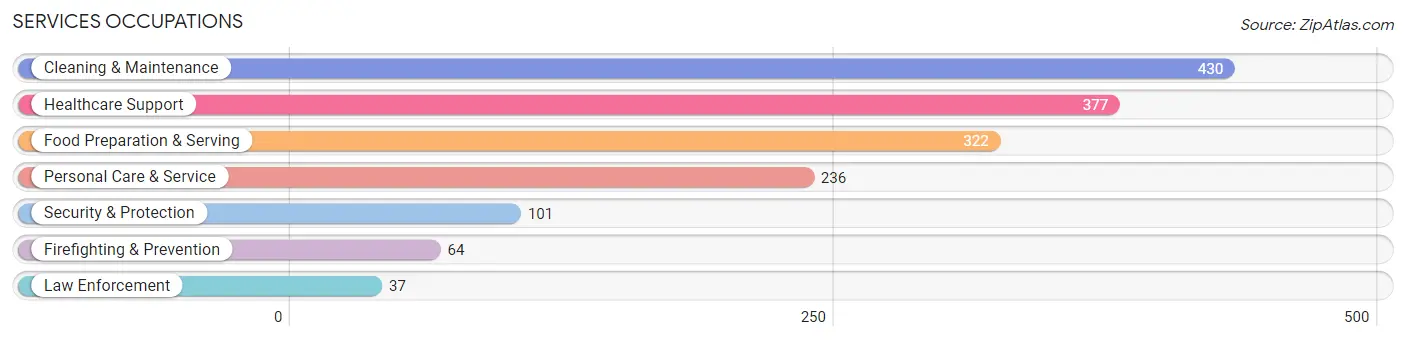
Services Occupations
The most common Services occupations in Mastic Beach are Cleaning & Maintenance (430 | 5.9%), Healthcare Support (377 | 5.2%), Food Preparation & Serving (322 | 4.4%), Personal Care & Service (236 | 3.2%), and Security & Protection (101 | 1.4%).
Services Occupations by Sex
Within the Services occupations in Mastic Beach, the most male-oriented occupations are Firefighting & Prevention (100.0%), Security & Protection (69.3%), and Cleaning & Maintenance (61.4%), while the most female-oriented occupations are Food Preparation & Serving (87.0%), Law Enforcement (83.8%), and Personal Care & Service (72.5%).
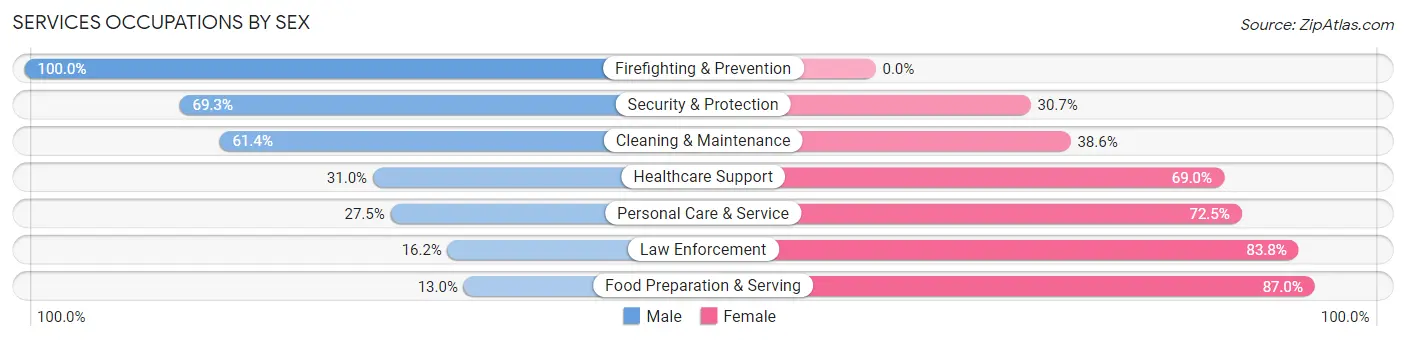
| Occupation | Male | Female |
| Healthcare Support | 117 (31.0%) | 260 (69.0%) |
| Security & Protection | 70 (69.3%) | 31 (30.7%) |
| Firefighting & Prevention | 64 (100.0%) | 0 (0.0%) |
| Law Enforcement | 6 (16.2%) | 31 (83.8%) |
| Food Preparation & Serving | 42 (13.0%) | 280 (87.0%) |
| Cleaning & Maintenance | 264 (61.4%) | 166 (38.6%) |
| Personal Care & Service | 65 (27.5%) | 171 (72.5%) |
| Total (Category) | 558 (38.1%) | 908 (61.9%) |
| Total (Overall) | 3,604 (49.4%) | 3,685 (50.6%) |
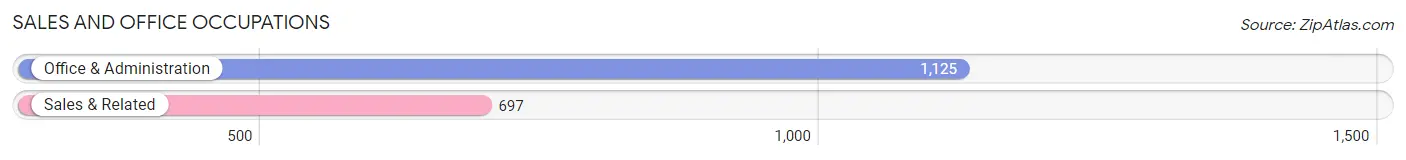
Sales and Office Occupations
The most common Sales and Office occupations in Mastic Beach are Office & Administration (1,125 | 15.4%), and Sales & Related (697 | 9.6%).
Sales and Office Occupations by Sex
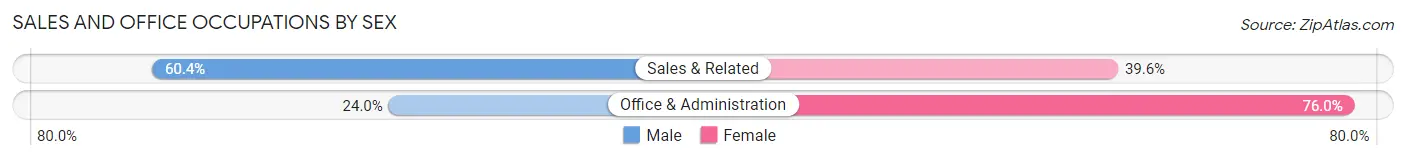
| Occupation | Male | Female |
| Sales & Related | 421 (60.4%) | 276 (39.6%) |
| Office & Administration | 270 (24.0%) | 855 (76.0%) |
| Total (Category) | 691 (37.9%) | 1,131 (62.1%) |
| Total (Overall) | 3,604 (49.4%) | 3,685 (50.6%) |
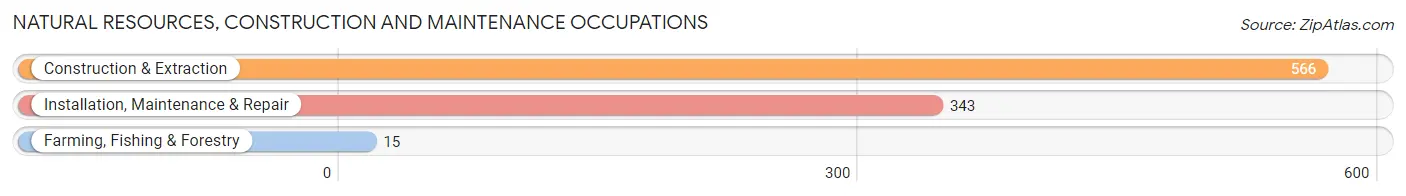
Natural Resources, Construction and Maintenance Occupations
The most common Natural Resources, Construction and Maintenance occupations in Mastic Beach are Construction & Extraction (566 | 7.8%), Installation, Maintenance & Repair (343 | 4.7%), and Farming, Fishing & Forestry (15 | 0.2%).
Natural Resources, Construction and Maintenance Occupations by Sex
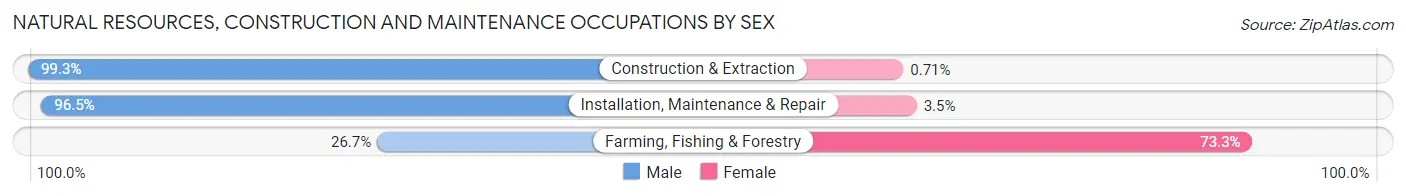
| Occupation | Male | Female |
| Farming, Fishing & Forestry | 4 (26.7%) | 11 (73.3%) |
| Construction & Extraction | 562 (99.3%) | 4 (0.7%) |
| Installation, Maintenance & Repair | 331 (96.5%) | 12 (3.5%) |
| Total (Category) | 897 (97.1%) | 27 (2.9%) |
| Total (Overall) | 3,604 (49.4%) | 3,685 (50.6%) |
Production, Transportation and Moving Occupations
The most common Production, Transportation and Moving occupations in Mastic Beach are Transportation (447 | 6.1%), Production (243 | 3.3%), and Material Moving (85 | 1.2%).
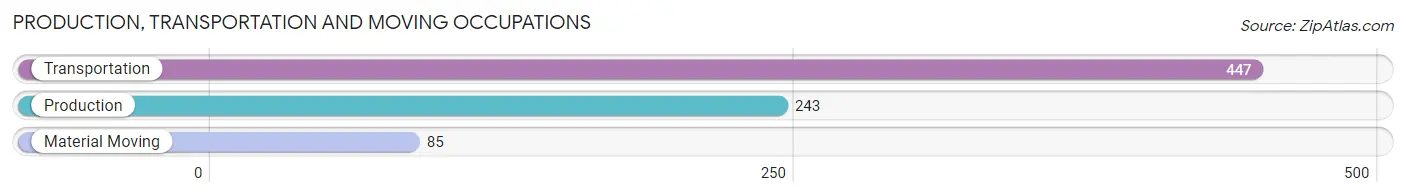
Production, Transportation and Moving Occupations by Sex
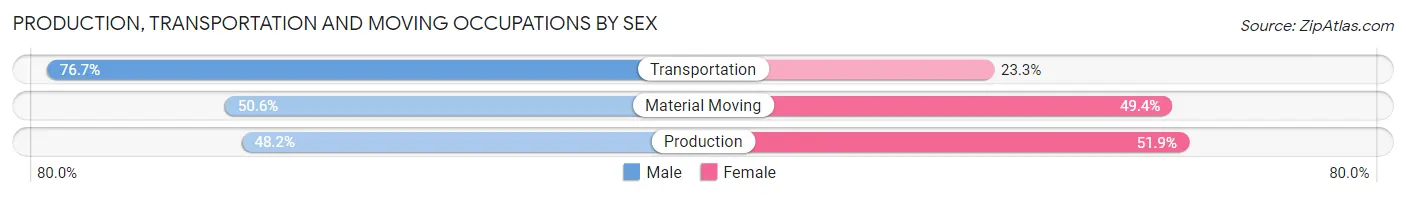
| Occupation | Male | Female |
| Production | 117 (48.1%) | 126 (51.8%) |
| Transportation | 343 (76.7%) | 104 (23.3%) |
| Material Moving | 43 (50.6%) | 42 (49.4%) |
| Total (Category) | 503 (64.9%) | 272 (35.1%) |
| Total (Overall) | 3,604 (49.4%) | 3,685 (50.6%) |
Employment Industries by Sex in Mastic Beach
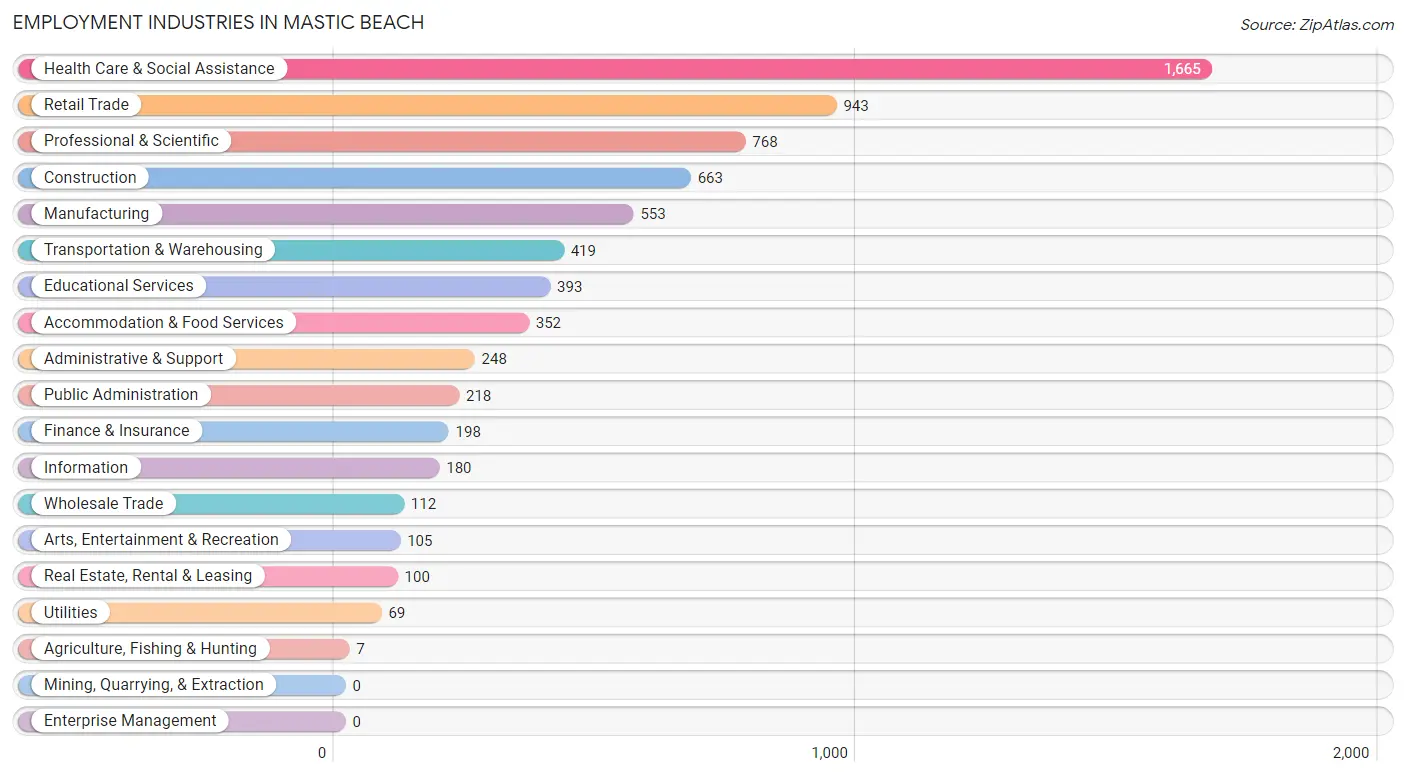
Employment Industries in Mastic Beach
The major employment industries in Mastic Beach include Health Care & Social Assistance (1,665 | 22.8%), Retail Trade (943 | 12.9%), Professional & Scientific (768 | 10.5%), Construction (663 | 9.1%), and Manufacturing (553 | 7.6%).
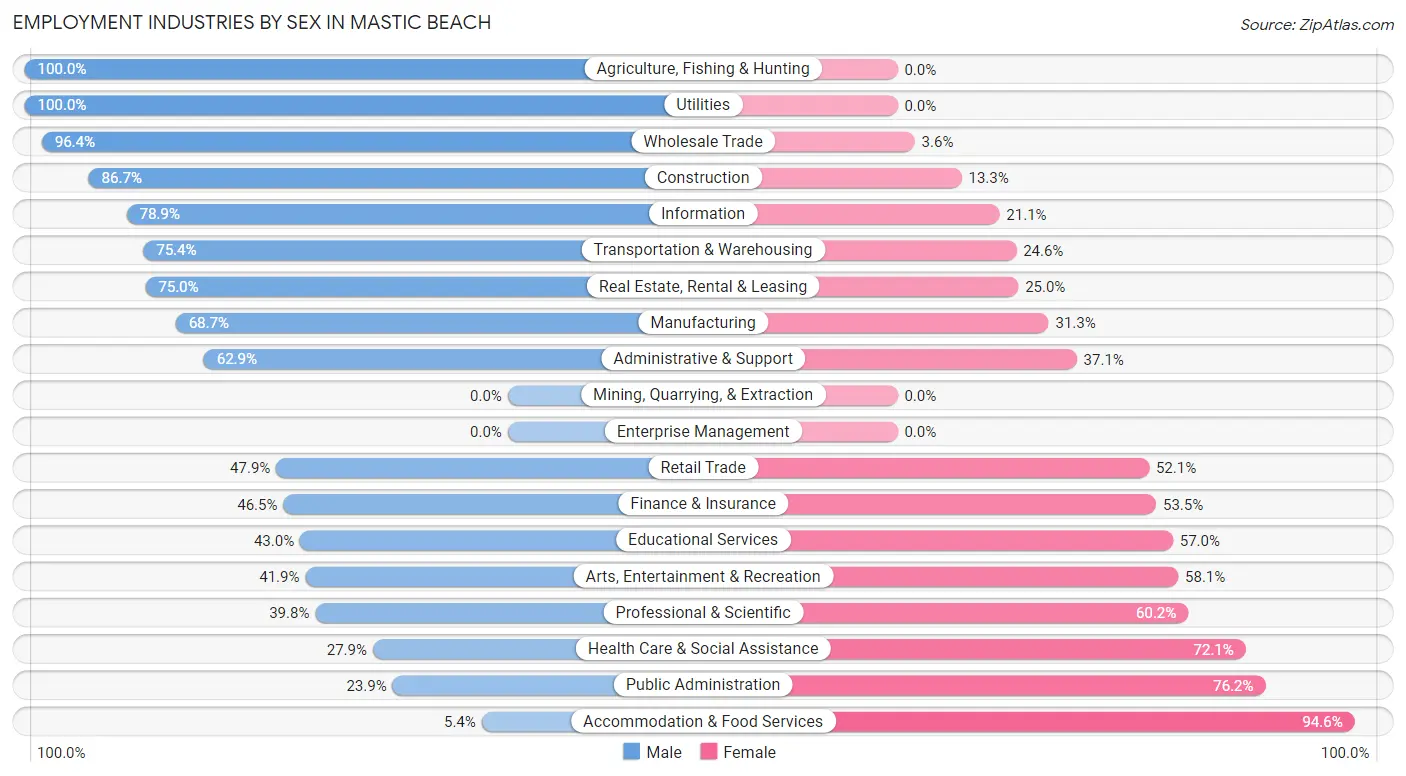
Employment Industries by Sex in Mastic Beach
The Mastic Beach industries that see more men than women are Agriculture, Fishing & Hunting (100.0%), Utilities (100.0%), and Wholesale Trade (96.4%), whereas the industries that tend to have a higher number of women are Accommodation & Food Services (94.6%), Public Administration (76.1%), and Health Care & Social Assistance (72.1%).
| Industry | Male | Female |
| Agriculture, Fishing & Hunting | 7 (100.0%) | 0 (0.0%) |
| Mining, Quarrying, & Extraction | 0 (0.0%) | 0 (0.0%) |
| Construction | 575 (86.7%) | 88 (13.3%) |
| Manufacturing | 380 (68.7%) | 173 (31.3%) |
| Wholesale Trade | 108 (96.4%) | 4 (3.6%) |
| Retail Trade | 452 (47.9%) | 491 (52.1%) |
| Transportation & Warehousing | 316 (75.4%) | 103 (24.6%) |
| Utilities | 69 (100.0%) | 0 (0.0%) |
| Information | 142 (78.9%) | 38 (21.1%) |
| Finance & Insurance | 92 (46.5%) | 106 (53.5%) |
| Real Estate, Rental & Leasing | 75 (75.0%) | 25 (25.0%) |
| Professional & Scientific | 306 (39.8%) | 462 (60.2%) |
| Enterprise Management | 0 (0.0%) | 0 (0.0%) |
| Administrative & Support | 156 (62.9%) | 92 (37.1%) |
| Educational Services | 169 (43.0%) | 224 (57.0%) |
| Health Care & Social Assistance | 465 (27.9%) | 1,200 (72.1%) |
| Arts, Entertainment & Recreation | 44 (41.9%) | 61 (58.1%) |
| Accommodation & Food Services | 19 (5.4%) | 333 (94.6%) |
| Public Administration | 52 (23.8%) | 166 (76.1%) |
| Total | 3,604 (49.4%) | 3,685 (50.6%) |
Education in Mastic Beach
School Enrollment in Mastic Beach
The most common levels of schooling among the 3,946 students in Mastic Beach are middle school (1,207 | 30.6%), high school (914 | 23.2%), and elementary school (790 | 20.0%).
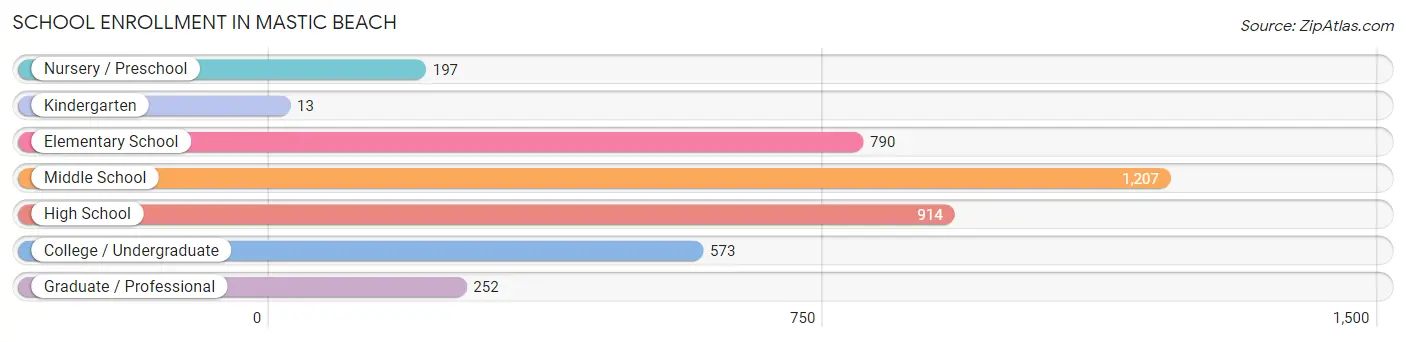
| School Level | # Students | % Students |
| Nursery / Preschool | 197 | 5.0% |
| Kindergarten | 13 | 0.3% |
| Elementary School | 790 | 20.0% |
| Middle School | 1,207 | 30.6% |
| High School | 914 | 23.2% |
| College / Undergraduate | 573 | 14.5% |
| Graduate / Professional | 252 | 6.4% |
| Total | 3,946 | 100.0% |
School Enrollment by Age by Funding Source in Mastic Beach
Out of a total of 3,946 students who are enrolled in schools in Mastic Beach, 284 (7.2%) attend a private institution, while the remaining 3,662 (92.8%) are enrolled in public schools. The age group of 25 to 34 year olds has the highest likelihood of being enrolled in private schools, with 93 (78.8% in the age bracket) enrolled. Conversely, the age group of 3 to 4 year olds has the lowest likelihood of being enrolled in a private school, with 155 (100.0% in the age bracket) attending a public institution.
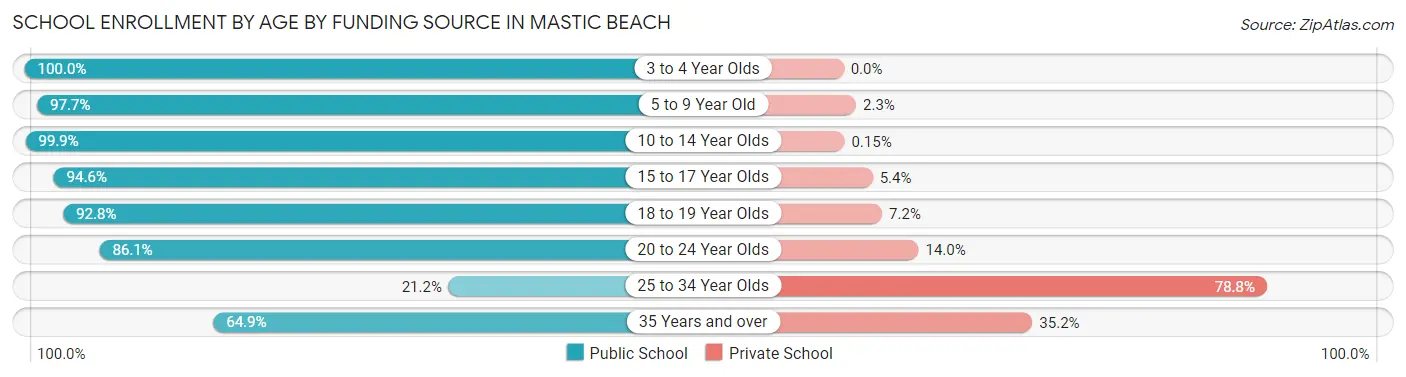
| Age Bracket | Public School | Private School |
| 3 to 4 Year Olds | 155 (100.0%) | 0 (0.0%) |
| 5 to 9 Year Old | 842 (97.7%) | 20 (2.3%) |
| 10 to 14 Year Olds | 1,339 (99.9%) | 2 (0.2%) |
| 15 to 17 Year Olds | 577 (94.6%) | 33 (5.4%) |
| 18 to 19 Year Olds | 246 (92.8%) | 19 (7.2%) |
| 20 to 24 Year Olds | 370 (86.1%) | 60 (14.0%) |
| 25 to 34 Year Olds | 25 (21.2%) | 93 (78.8%) |
| 35 Years and over | 107 (64.8%) | 58 (35.1%) |
| Total | 3,662 (92.8%) | 284 (7.2%) |
Educational Attainment by Field of Study in Mastic Beach
Science & technology (539 | 25.2%), business (466 | 21.8%), education (206 | 9.6%), computers & mathematics (141 | 6.6%), and social sciences (118 | 5.5%) are the most common fields of study among 2,142 individuals in Mastic Beach who have obtained a bachelor's degree or higher.
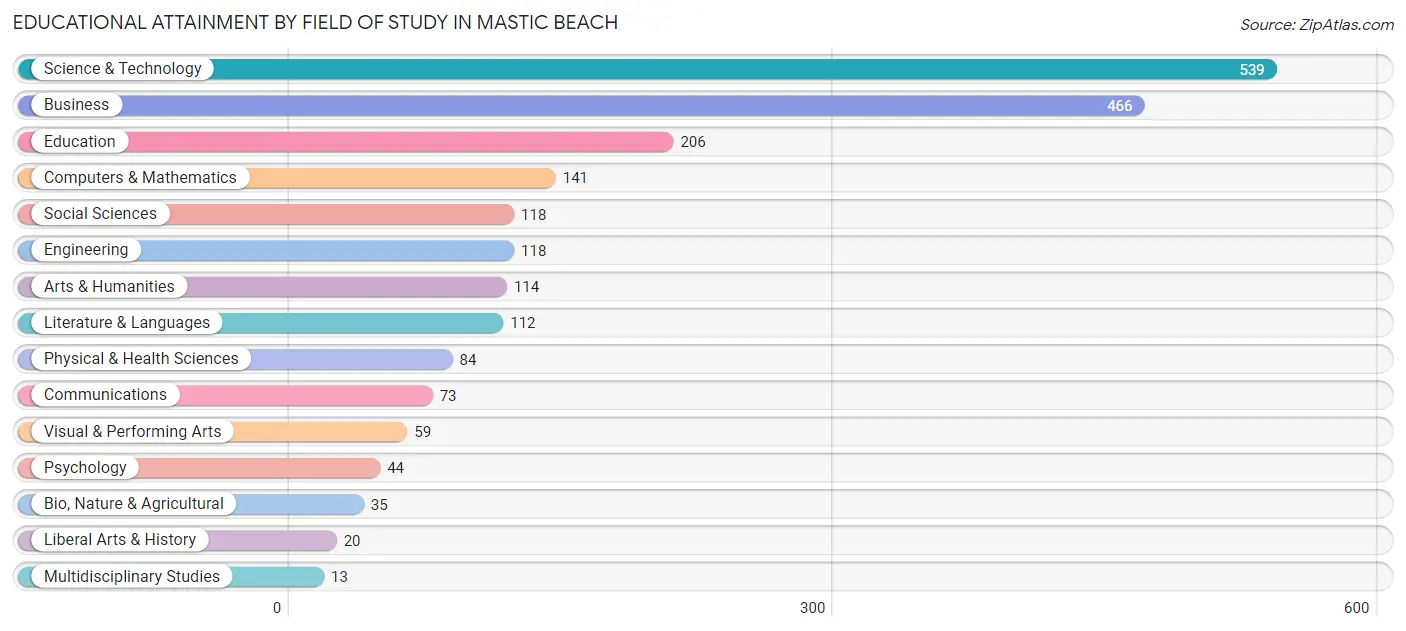
| Field of Study | # Graduates | % Graduates |
| Computers & Mathematics | 141 | 6.6% |
| Bio, Nature & Agricultural | 35 | 1.6% |
| Physical & Health Sciences | 84 | 3.9% |
| Psychology | 44 | 2.1% |
| Social Sciences | 118 | 5.5% |
| Engineering | 118 | 5.5% |
| Multidisciplinary Studies | 13 | 0.6% |
| Science & Technology | 539 | 25.2% |
| Business | 466 | 21.8% |
| Education | 206 | 9.6% |
| Literature & Languages | 112 | 5.2% |
| Liberal Arts & History | 20 | 0.9% |
| Visual & Performing Arts | 59 | 2.8% |
| Communications | 73 | 3.4% |
| Arts & Humanities | 114 | 5.3% |
| Total | 2,142 | 100.0% |
Transportation & Commute in Mastic Beach
Vehicle Availability by Sex in Mastic Beach
The most prevalent vehicle ownership categories in Mastic Beach are males with 2 vehicles (1,976, accounting for 56.0%) and females with 2 vehicles (1,994, making up 54.2%).
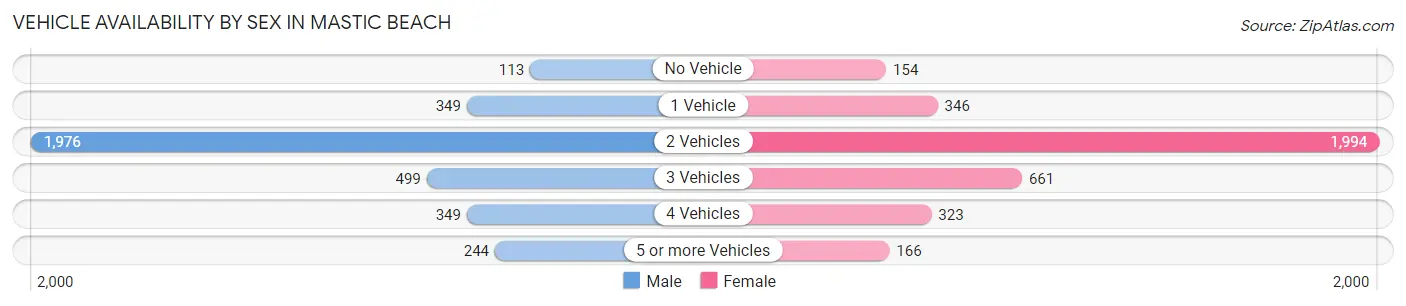
| Vehicles Available | Male | Female |
| No Vehicle | 113 (3.2%) | 154 (4.2%) |
| 1 Vehicle | 349 (9.9%) | 346 (9.5%) |
| 2 Vehicles | 1,976 (56.0%) | 1,994 (54.7%) |
| 3 Vehicles | 499 (14.1%) | 661 (18.1%) |
| 4 Vehicles | 349 (9.9%) | 323 (8.9%) |
| 5 or more Vehicles | 244 (6.9%) | 166 (4.6%) |
| Total | 3,530 (100.0%) | 3,644 (100.0%) |
Commute Time in Mastic Beach
The most frequently occuring commute durations in Mastic Beach are 30 to 34 minutes (1,412 commuters, 20.8%), 60 to 89 minutes (925 commuters, 13.7%), and 45 to 59 minutes (824 commuters, 12.2%).
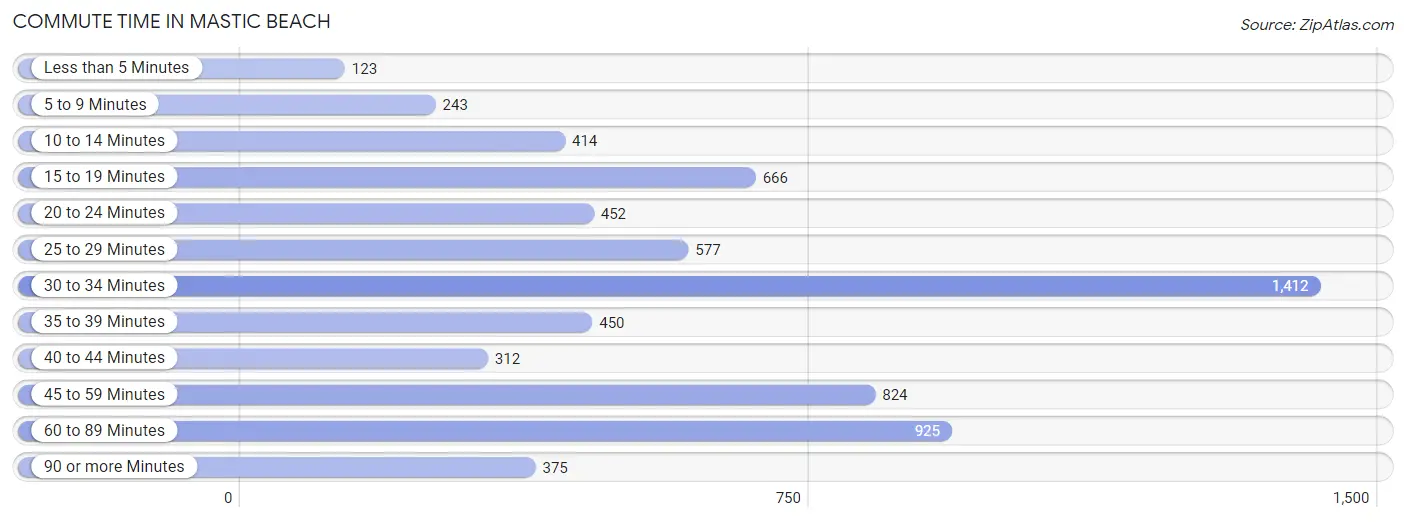
| Commute Time | # Commuters | % Commuters |
| Less than 5 Minutes | 123 | 1.8% |
| 5 to 9 Minutes | 243 | 3.6% |
| 10 to 14 Minutes | 414 | 6.1% |
| 15 to 19 Minutes | 666 | 9.8% |
| 20 to 24 Minutes | 452 | 6.7% |
| 25 to 29 Minutes | 577 | 8.5% |
| 30 to 34 Minutes | 1,412 | 20.8% |
| 35 to 39 Minutes | 450 | 6.6% |
| 40 to 44 Minutes | 312 | 4.6% |
| 45 to 59 Minutes | 824 | 12.2% |
| 60 to 89 Minutes | 925 | 13.7% |
| 90 or more Minutes | 375 | 5.5% |
Commute Time by Sex in Mastic Beach
The most common commute times in Mastic Beach are 30 to 34 minutes (865 commuters, 26.1%) for males and 30 to 34 minutes (547 commuters, 15.8%) for females.
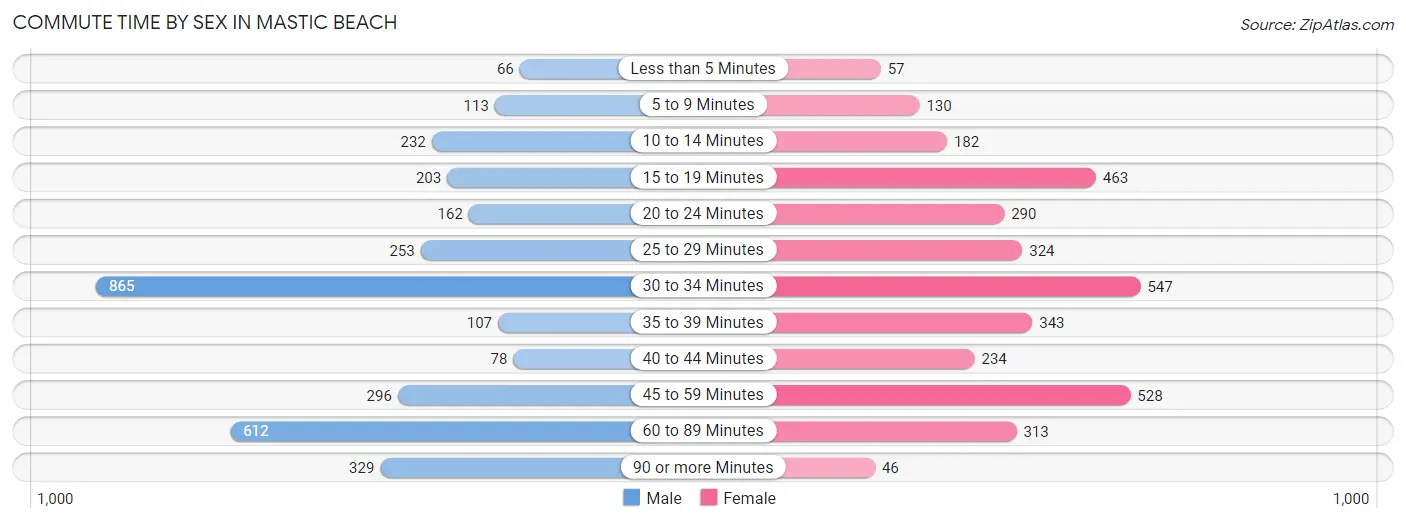
| Commute Time | Male | Female |
| Less than 5 Minutes | 66 (2.0%) | 57 (1.7%) |
| 5 to 9 Minutes | 113 (3.4%) | 130 (3.8%) |
| 10 to 14 Minutes | 232 (7.0%) | 182 (5.3%) |
| 15 to 19 Minutes | 203 (6.1%) | 463 (13.4%) |
| 20 to 24 Minutes | 162 (4.9%) | 290 (8.4%) |
| 25 to 29 Minutes | 253 (7.6%) | 324 (9.4%) |
| 30 to 34 Minutes | 865 (26.1%) | 547 (15.8%) |
| 35 to 39 Minutes | 107 (3.2%) | 343 (9.9%) |
| 40 to 44 Minutes | 78 (2.4%) | 234 (6.8%) |
| 45 to 59 Minutes | 296 (8.9%) | 528 (15.3%) |
| 60 to 89 Minutes | 612 (18.5%) | 313 (9.0%) |
| 90 or more Minutes | 329 (9.9%) | 46 (1.3%) |
Time of Departure to Work by Sex in Mastic Beach
The most frequent times of departure to work in Mastic Beach are 7:00 AM to 7:29 AM (645, 19.5%) for males and 8:00 AM to 8:29 AM (599, 17.3%) for females.
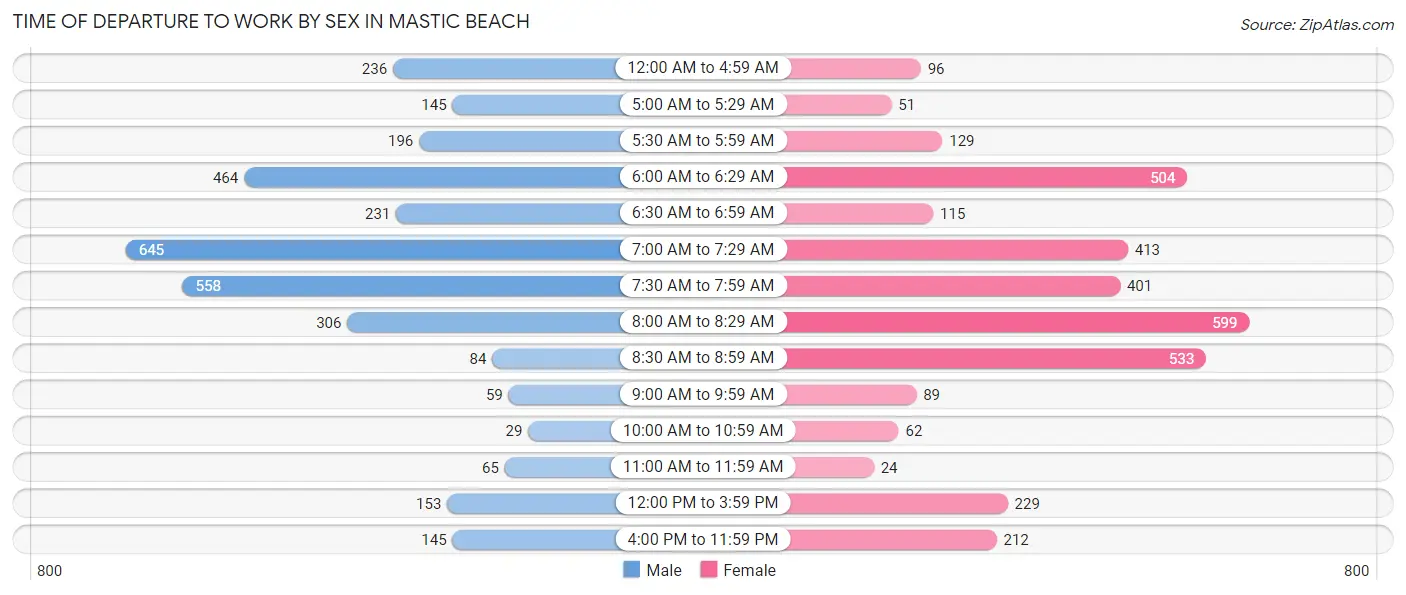
| Time of Departure | Male | Female |
| 12:00 AM to 4:59 AM | 236 (7.1%) | 96 (2.8%) |
| 5:00 AM to 5:29 AM | 145 (4.4%) | 51 (1.5%) |
| 5:30 AM to 5:59 AM | 196 (5.9%) | 129 (3.7%) |
| 6:00 AM to 6:29 AM | 464 (14.0%) | 504 (14.6%) |
| 6:30 AM to 6:59 AM | 231 (7.0%) | 115 (3.3%) |
| 7:00 AM to 7:29 AM | 645 (19.5%) | 413 (11.9%) |
| 7:30 AM to 7:59 AM | 558 (16.8%) | 401 (11.6%) |
| 8:00 AM to 8:29 AM | 306 (9.2%) | 599 (17.3%) |
| 8:30 AM to 8:59 AM | 84 (2.5%) | 533 (15.4%) |
| 9:00 AM to 9:59 AM | 59 (1.8%) | 89 (2.6%) |
| 10:00 AM to 10:59 AM | 29 (0.9%) | 62 (1.8%) |
| 11:00 AM to 11:59 AM | 65 (2.0%) | 24 (0.7%) |
| 12:00 PM to 3:59 PM | 153 (4.6%) | 229 (6.6%) |
| 4:00 PM to 11:59 PM | 145 (4.4%) | 212 (6.1%) |
| Total | 3,316 (100.0%) | 3,457 (100.0%) |
Housing Occupancy in Mastic Beach
Occupancy by Ownership in Mastic Beach
Of the total 5,189 dwellings in Mastic Beach, owner-occupied units account for 4,195 (80.8%), while renter-occupied units make up 994 (19.2%).
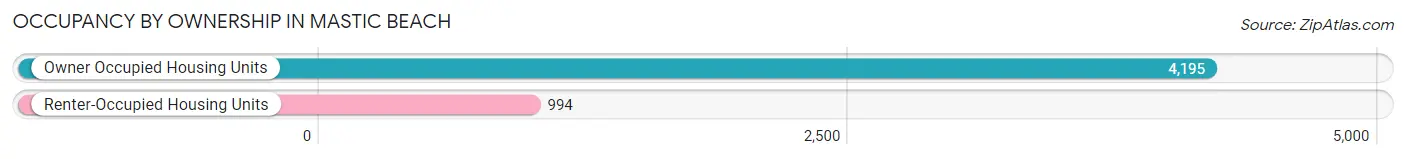
| Occupancy | # Housing Units | % Housing Units |
| Owner Occupied Housing Units | 4,195 | 80.8% |
| Renter-Occupied Housing Units | 994 | 19.2% |
| Total Occupied Housing Units | 5,189 | 100.0% |
Occupancy by Household Size in Mastic Beach
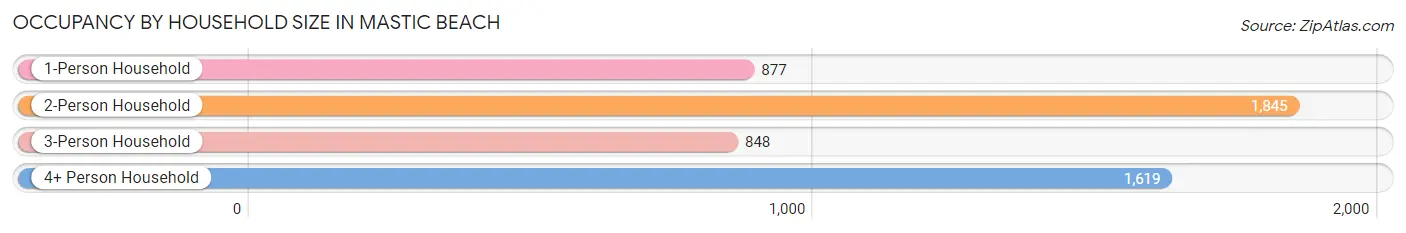
| Household Size | # Housing Units | % Housing Units |
| 1-Person Household | 877 | 16.9% |
| 2-Person Household | 1,845 | 35.6% |
| 3-Person Household | 848 | 16.3% |
| 4+ Person Household | 1,619 | 31.2% |
| Total Housing Units | 5,189 | 100.0% |
Occupancy by Ownership by Household Size in Mastic Beach
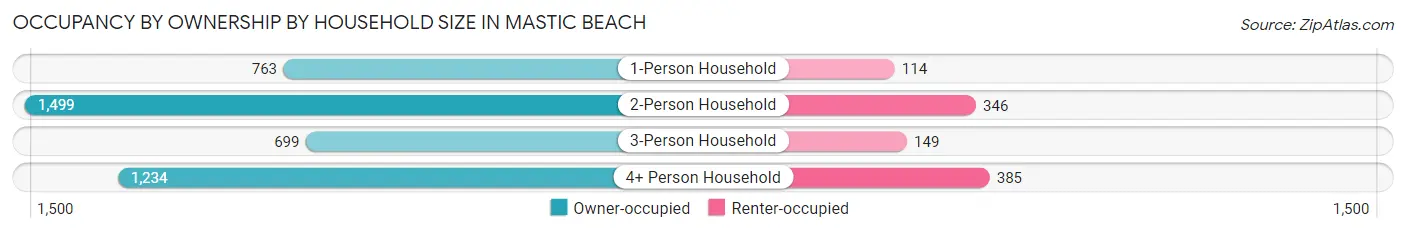
| Household Size | Owner-occupied | Renter-occupied |
| 1-Person Household | 763 (87.0%) | 114 (13.0%) |
| 2-Person Household | 1,499 (81.2%) | 346 (18.8%) |
| 3-Person Household | 699 (82.4%) | 149 (17.6%) |
| 4+ Person Household | 1,234 (76.2%) | 385 (23.8%) |
| Total Housing Units | 4,195 (80.8%) | 994 (19.2%) |
Occupancy by Educational Attainment in Mastic Beach
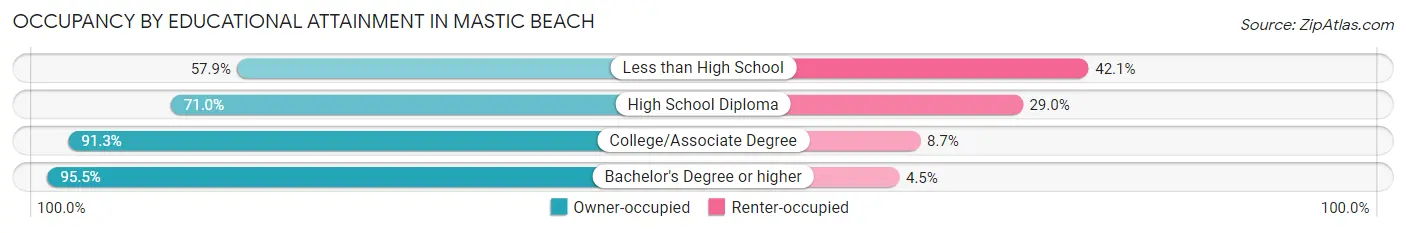
| Household Size | Owner-occupied | Renter-occupied |
| Less than High School | 500 (57.9%) | 363 (42.1%) |
| High School Diploma | 1,013 (71.0%) | 414 (29.0%) |
| College/Associate Degree | 1,882 (91.3%) | 179 (8.7%) |
| Bachelor's Degree or higher | 800 (95.5%) | 38 (4.5%) |
Occupancy by Age of Householder in Mastic Beach
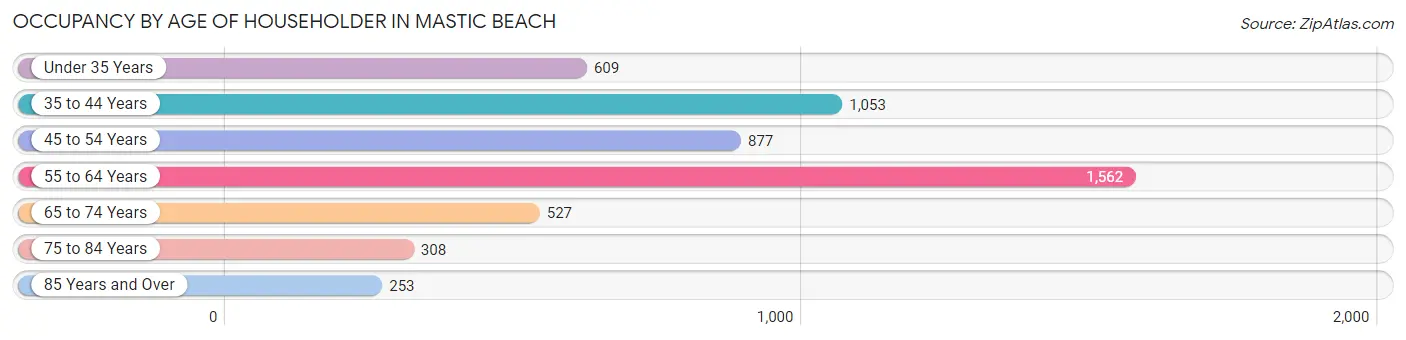
| Age Bracket | # Households | % Households |
| Under 35 Years | 609 | 11.7% |
| 35 to 44 Years | 1,053 | 20.3% |
| 45 to 54 Years | 877 | 16.9% |
| 55 to 64 Years | 1,562 | 30.1% |
| 65 to 74 Years | 527 | 10.2% |
| 75 to 84 Years | 308 | 5.9% |
| 85 Years and Over | 253 | 4.9% |
| Total | 5,189 | 100.0% |
Housing Finances in Mastic Beach
Median Income by Occupancy in Mastic Beach
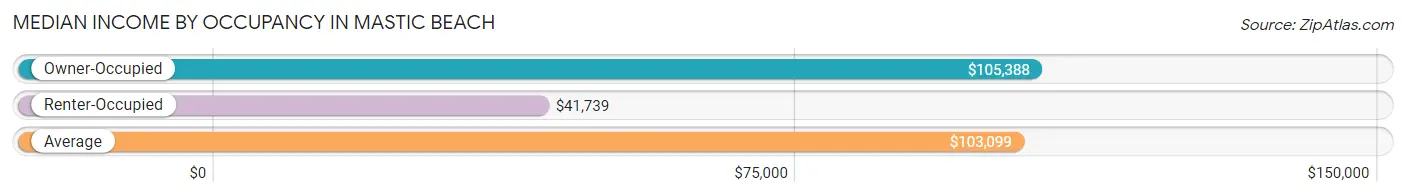
| Occupancy Type | # Households | Median Income |
| Owner-Occupied | 4,195 (80.8%) | $105,388 |
| Renter-Occupied | 994 (19.2%) | $41,739 |
| Average | 5,189 (100.0%) | $103,099 |
Occupancy by Householder Income Bracket in Mastic Beach
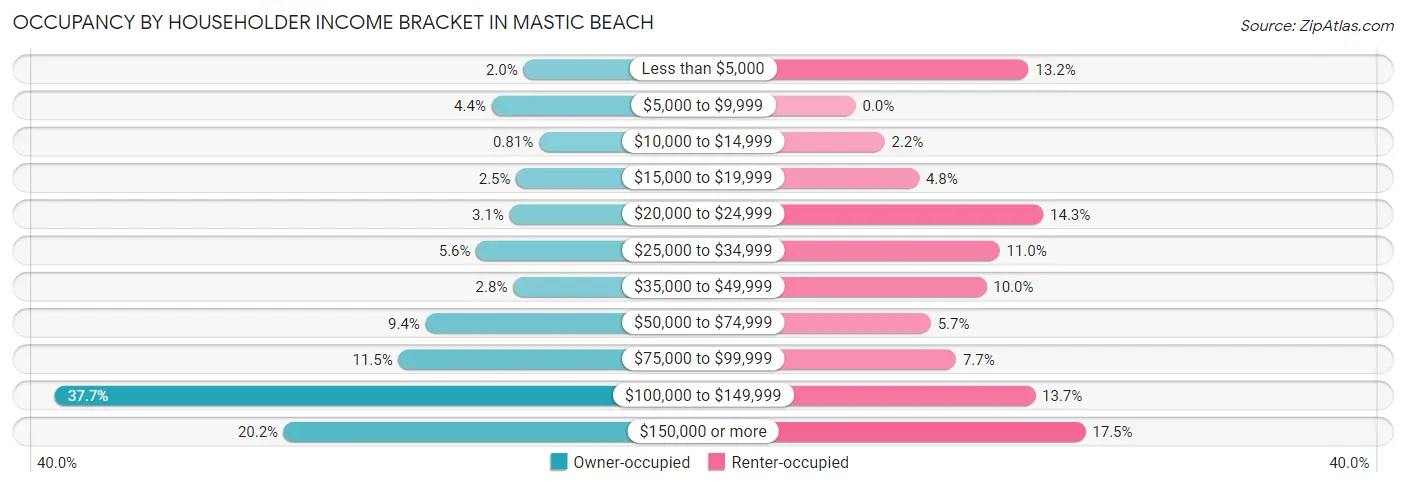
| Income Bracket | Owner-occupied | Renter-occupied |
| Less than $5,000 | 83 (2.0%) | 131 (13.2%) |
| $5,000 to $9,999 | 185 (4.4%) | 0 (0.0%) |
| $10,000 to $14,999 | 34 (0.8%) | 22 (2.2%) |
| $15,000 to $19,999 | 106 (2.5%) | 48 (4.8%) |
| $20,000 to $24,999 | 128 (3.0%) | 142 (14.3%) |
| $25,000 to $34,999 | 234 (5.6%) | 109 (11.0%) |
| $35,000 to $49,999 | 116 (2.8%) | 99 (10.0%) |
| $50,000 to $74,999 | 396 (9.4%) | 57 (5.7%) |
| $75,000 to $99,999 | 483 (11.5%) | 76 (7.6%) |
| $100,000 to $149,999 | 1,581 (37.7%) | 136 (13.7%) |
| $150,000 or more | 849 (20.2%) | 174 (17.5%) |
| Total | 4,195 (100.0%) | 994 (100.0%) |
Monthly Housing Cost Tiers in Mastic Beach
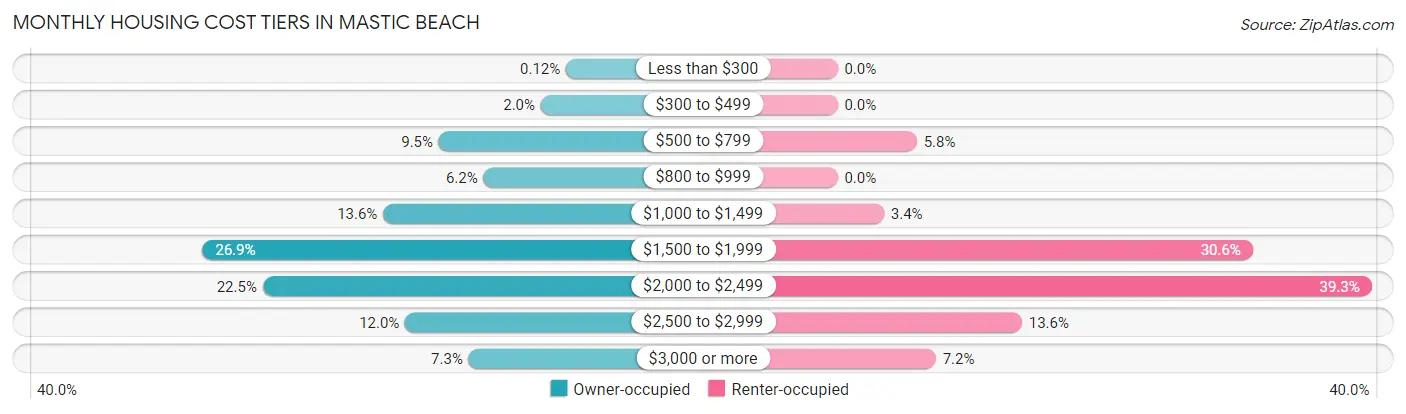
| Monthly Cost | Owner-occupied | Renter-occupied |
| Less than $300 | 5 (0.1%) | 0 (0.0%) |
| $300 to $499 | 83 (2.0%) | 0 (0.0%) |
| $500 to $799 | 398 (9.5%) | 58 (5.8%) |
| $800 to $999 | 260 (6.2%) | 0 (0.0%) |
| $1,000 to $1,499 | 570 (13.6%) | 34 (3.4%) |
| $1,500 to $1,999 | 1,129 (26.9%) | 304 (30.6%) |
| $2,000 to $2,499 | 942 (22.5%) | 391 (39.3%) |
| $2,500 to $2,999 | 502 (12.0%) | 135 (13.6%) |
| $3,000 or more | 306 (7.3%) | 72 (7.2%) |
| Total | 4,195 (100.0%) | 994 (100.0%) |
Physical Housing Characteristics in Mastic Beach
Housing Structures in Mastic Beach
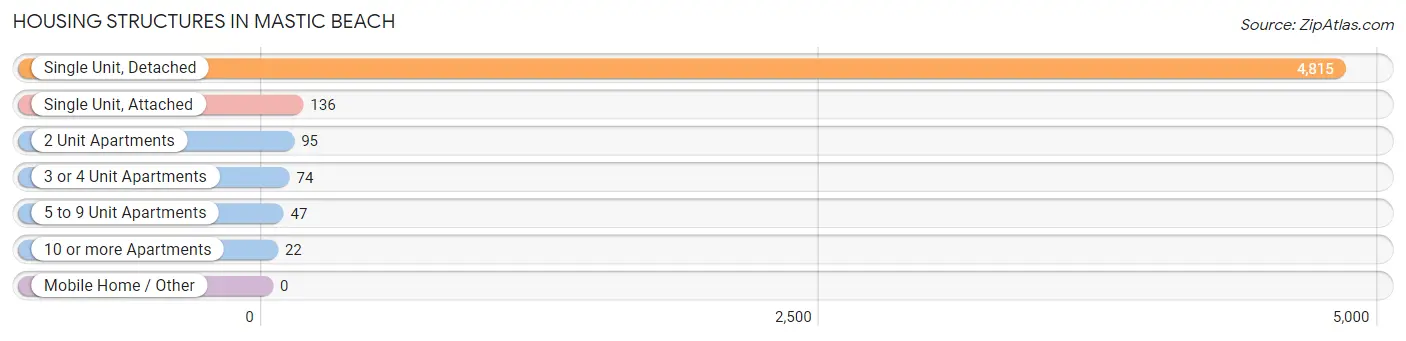
| Structure Type | # Housing Units | % Housing Units |
| Single Unit, Detached | 4,815 | 92.8% |
| Single Unit, Attached | 136 | 2.6% |
| 2 Unit Apartments | 95 | 1.8% |
| 3 or 4 Unit Apartments | 74 | 1.4% |
| 5 to 9 Unit Apartments | 47 | 0.9% |
| 10 or more Apartments | 22 | 0.4% |
| Mobile Home / Other | 0 | 0.0% |
| Total | 5,189 | 100.0% |
Housing Structures by Occupancy in Mastic Beach
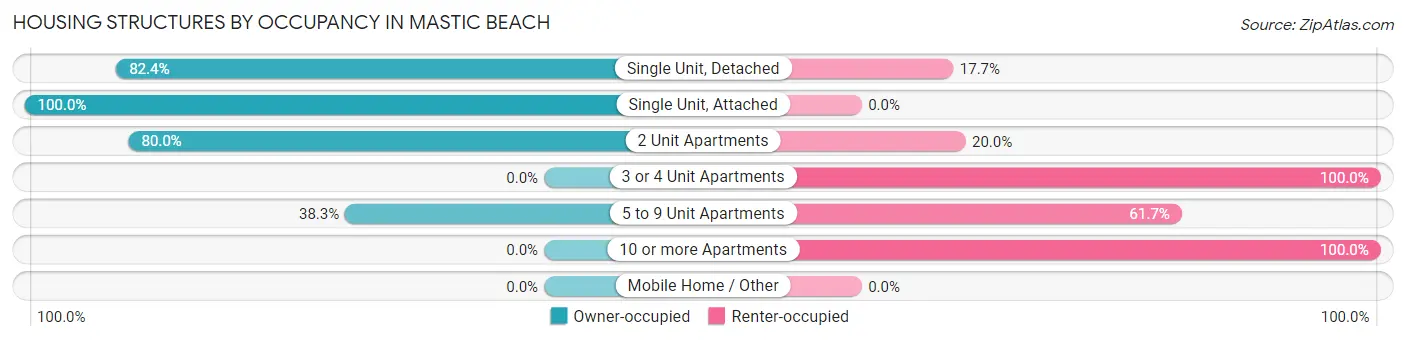
| Structure Type | Owner-occupied | Renter-occupied |
| Single Unit, Detached | 3,965 (82.4%) | 850 (17.6%) |
| Single Unit, Attached | 136 (100.0%) | 0 (0.0%) |
| 2 Unit Apartments | 76 (80.0%) | 19 (20.0%) |
| 3 or 4 Unit Apartments | 0 (0.0%) | 74 (100.0%) |
| 5 to 9 Unit Apartments | 18 (38.3%) | 29 (61.7%) |
| 10 or more Apartments | 0 (0.0%) | 22 (100.0%) |
| Mobile Home / Other | 0 (0.0%) | 0 (0.0%) |
| Total | 4,195 (80.8%) | 994 (19.2%) |
Housing Structures by Number of Rooms in Mastic Beach
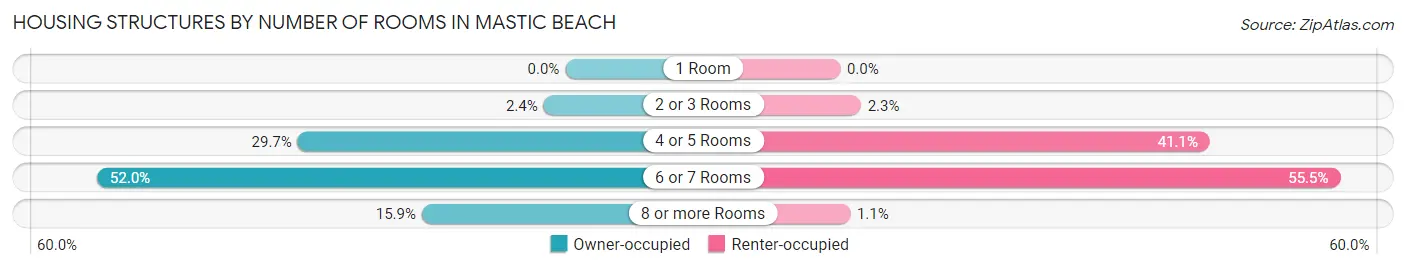
| Number of Rooms | Owner-occupied | Renter-occupied |
| 1 Room | 0 (0.0%) | 0 (0.0%) |
| 2 or 3 Rooms | 101 (2.4%) | 23 (2.3%) |
| 4 or 5 Rooms | 1,246 (29.7%) | 408 (41.0%) |
| 6 or 7 Rooms | 2,180 (52.0%) | 552 (55.5%) |
| 8 or more Rooms | 668 (15.9%) | 11 (1.1%) |
| Total | 4,195 (100.0%) | 994 (100.0%) |
Housing Structure by Heating Type in Mastic Beach
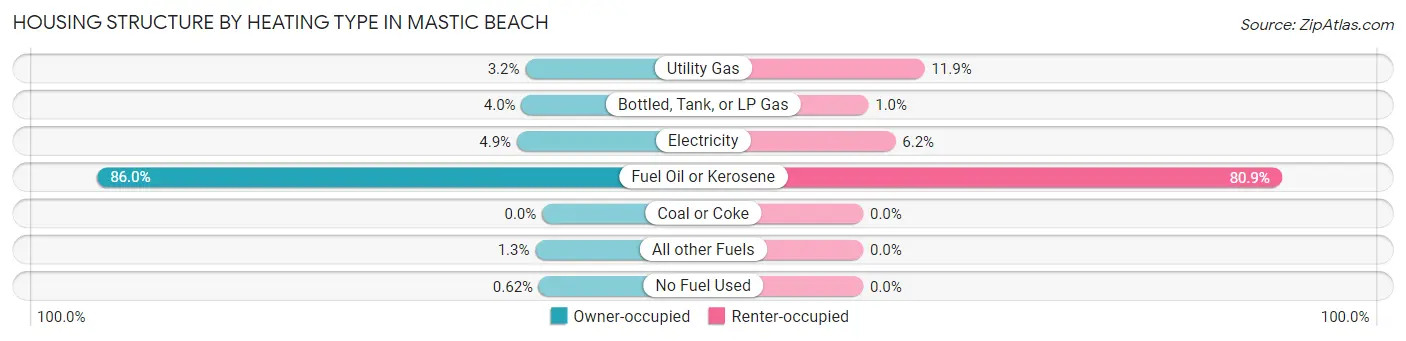
| Heating Type | Owner-occupied | Renter-occupied |
| Utility Gas | 136 (3.2%) | 118 (11.9%) |
| Bottled, Tank, or LP Gas | 168 (4.0%) | 10 (1.0%) |
| Electricity | 204 (4.9%) | 62 (6.2%) |
| Fuel Oil or Kerosene | 3,606 (86.0%) | 804 (80.9%) |
| Coal or Coke | 0 (0.0%) | 0 (0.0%) |
| All other Fuels | 55 (1.3%) | 0 (0.0%) |
| No Fuel Used | 26 (0.6%) | 0 (0.0%) |
| Total | 4,195 (100.0%) | 994 (100.0%) |
Household Vehicle Usage in Mastic Beach
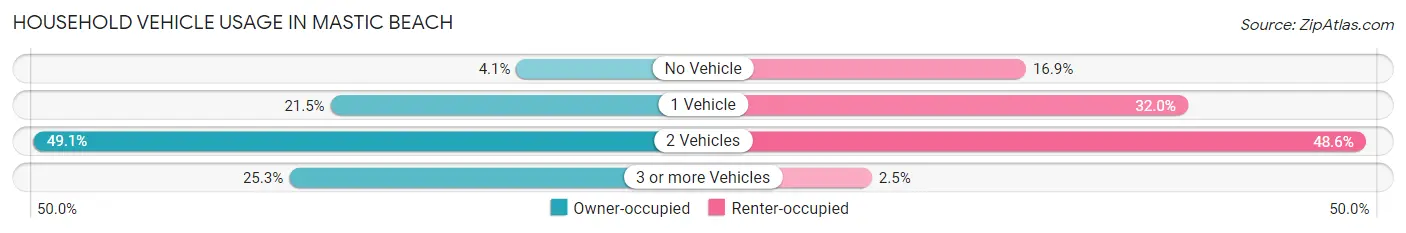
| Vehicles per Household | Owner-occupied | Renter-occupied |
| No Vehicle | 172 (4.1%) | 168 (16.9%) |
| 1 Vehicle | 900 (21.4%) | 318 (32.0%) |
| 2 Vehicles | 2,061 (49.1%) | 483 (48.6%) |
| 3 or more Vehicles | 1,062 (25.3%) | 25 (2.5%) |
| Total | 4,195 (100.0%) | 994 (100.0%) |
Real Estate & Mortgages in Mastic Beach
Real Estate and Mortgage Overview in Mastic Beach
| Characteristic | Without Mortgage | With Mortgage |
| Housing Units | 1,211 | 2,984 |
| Median Property Value | $267,200 | $317,900 |
| Median Household Income | $69,911 | $630 |
| Monthly Housing Costs | $881 | $300 |
| Real Estate Taxes | $6,074 | $29 |
Property Value by Mortgage Status in Mastic Beach
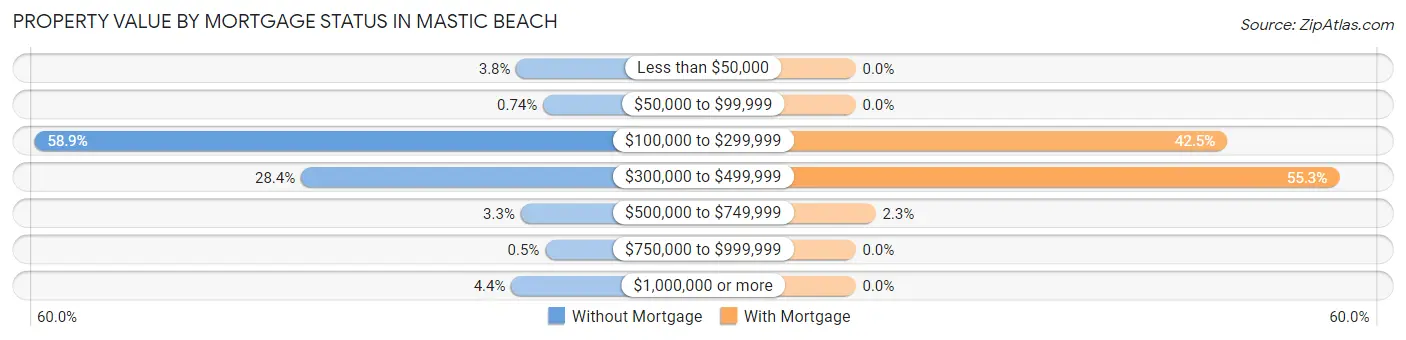
| Property Value | Without Mortgage | With Mortgage |
| Less than $50,000 | 46 (3.8%) | 0 (0.0%) |
| $50,000 to $99,999 | 9 (0.7%) | 0 (0.0%) |
| $100,000 to $299,999 | 713 (58.9%) | 1,267 (42.5%) |
| $300,000 to $499,999 | 344 (28.4%) | 1,649 (55.3%) |
| $500,000 to $749,999 | 40 (3.3%) | 68 (2.3%) |
| $750,000 to $999,999 | 6 (0.5%) | 0 (0.0%) |
| $1,000,000 or more | 53 (4.4%) | 0 (0.0%) |
| Total | 1,211 (100.0%) | 2,984 (100.0%) |
Household Income by Mortgage Status in Mastic Beach
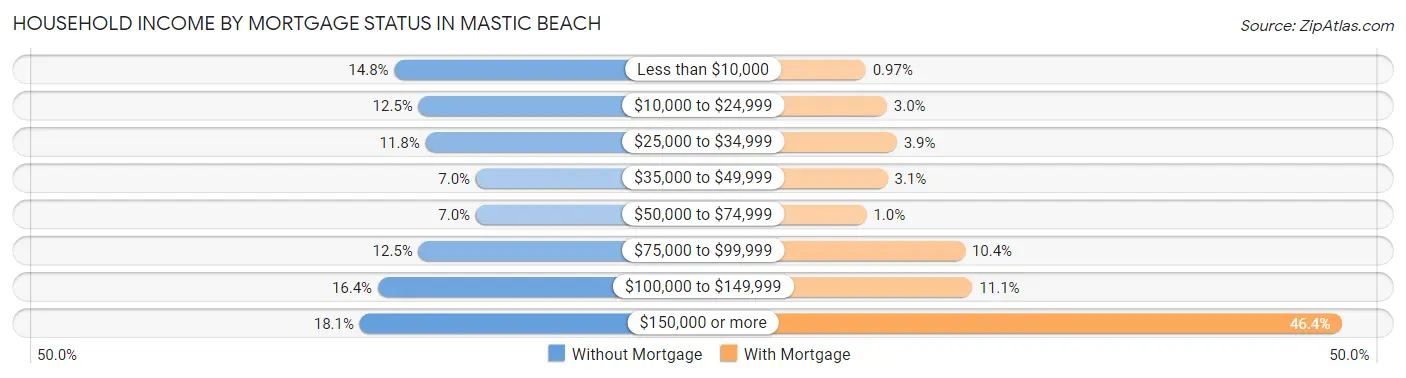
| Household Income | Without Mortgage | With Mortgage |
| Less than $10,000 | 179 (14.8%) | 29 (1.0%) |
| $10,000 to $24,999 | 151 (12.5%) | 89 (3.0%) |
| $25,000 to $34,999 | 143 (11.8%) | 117 (3.9%) |
| $35,000 to $49,999 | 85 (7.0%) | 91 (3.0%) |
| $50,000 to $74,999 | 85 (7.0%) | 31 (1.0%) |
| $75,000 to $99,999 | 151 (12.5%) | 311 (10.4%) |
| $100,000 to $149,999 | 198 (16.4%) | 332 (11.1%) |
| $150,000 or more | 219 (18.1%) | 1,383 (46.4%) |
| Total | 1,211 (100.0%) | 2,984 (100.0%) |
Property Value to Household Income Ratio in Mastic Beach
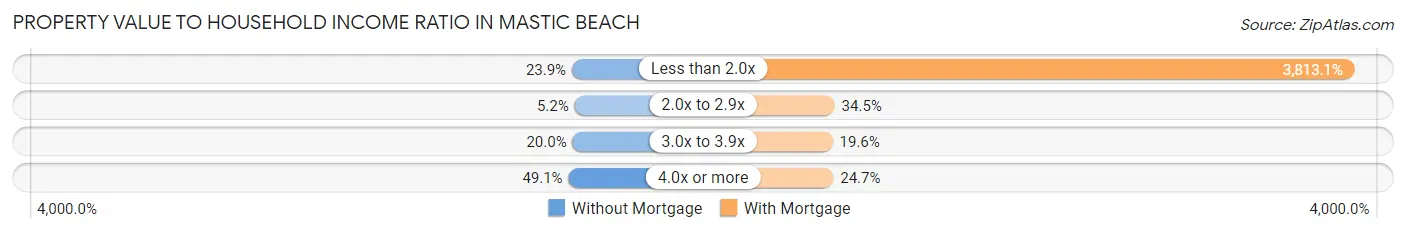
| Value-to-Income Ratio | Without Mortgage | With Mortgage |
| Less than 2.0x | 289 (23.9%) | 113,783 (3,813.1%) |
| 2.0x to 2.9x | 63 (5.2%) | 1,030 (34.5%) |
| 3.0x to 3.9x | 242 (20.0%) | 584 (19.6%) |
| 4.0x or more | 595 (49.1%) | 736 (24.7%) |
| Total | 1,211 (100.0%) | 2,984 (100.0%) |
Real Estate Taxes by Mortgage Status in Mastic Beach
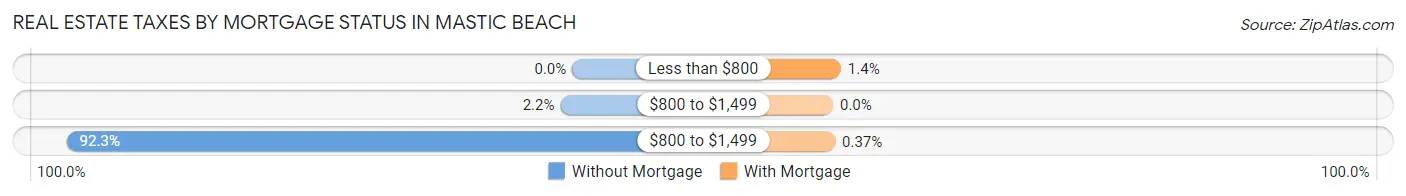
| Property Taxes | Without Mortgage | With Mortgage |
| Less than $800 | 0 (0.0%) | 43 (1.4%) |
| $800 to $1,499 | 26 (2.1%) | 0 (0.0%) |
| $800 to $1,499 | 1,118 (92.3%) | 11 (0.4%) |
| Total | 1,211 (100.0%) | 2,984 (100.0%) |
Health & Disability in Mastic Beach
Health Insurance Coverage by Age in Mastic Beach
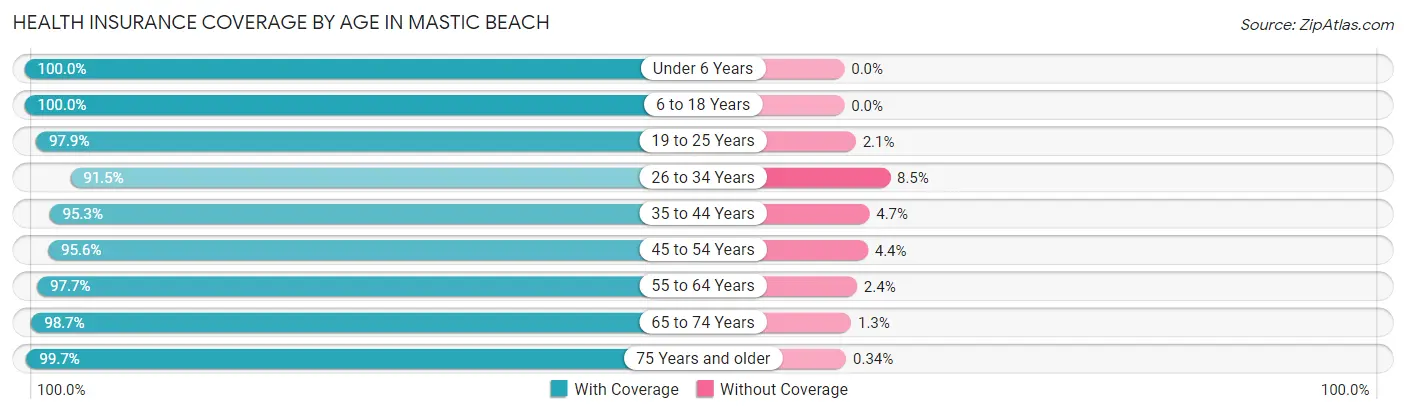
| Age Bracket | With Coverage | Without Coverage |
| Under 6 Years | 1,534 (100.0%) | 0 (0.0%) |
| 6 to 18 Years | 2,921 (100.0%) | 0 (0.0%) |
| 19 to 25 Years | 1,241 (97.9%) | 27 (2.1%) |
| 26 to 34 Years | 1,588 (91.5%) | 148 (8.5%) |
| 35 to 44 Years | 2,576 (95.3%) | 126 (4.7%) |
| 45 to 54 Years | 1,791 (95.6%) | 82 (4.4%) |
| 55 to 64 Years | 2,246 (97.7%) | 54 (2.4%) |
| 65 to 74 Years | 942 (98.7%) | 12 (1.3%) |
| 75 Years and older | 873 (99.7%) | 3 (0.3%) |
| Total | 15,712 (97.2%) | 452 (2.8%) |
Health Insurance Coverage by Citizenship Status in Mastic Beach
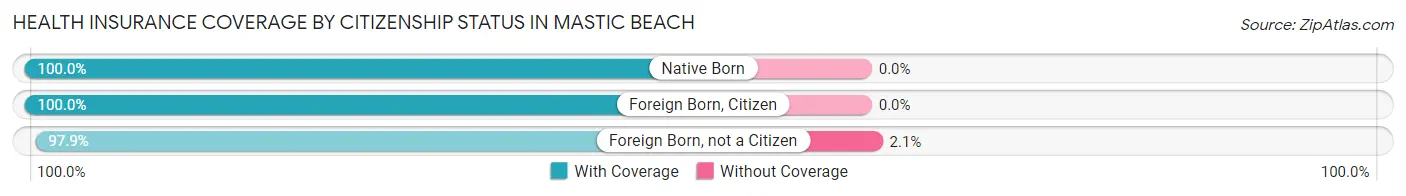
| Citizenship Status | With Coverage | Without Coverage |
| Native Born | 1,534 (100.0%) | 0 (0.0%) |
| Foreign Born, Citizen | 2,921 (100.0%) | 0 (0.0%) |
| Foreign Born, not a Citizen | 1,241 (97.9%) | 27 (2.1%) |
Health Insurance Coverage by Household Income in Mastic Beach
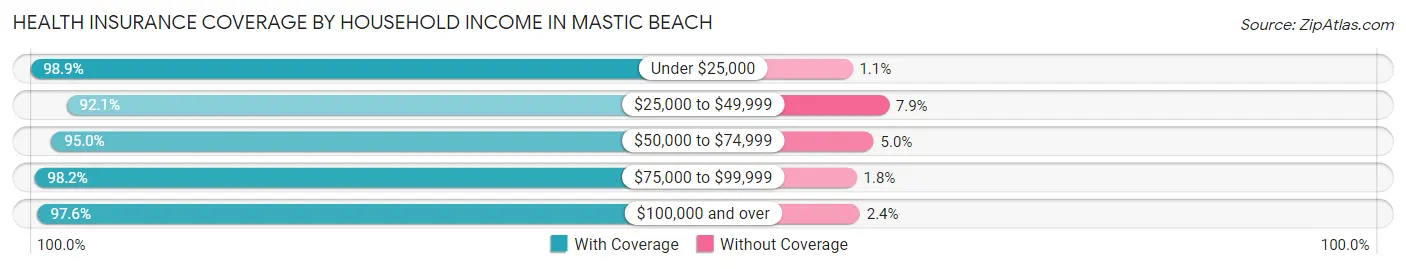
| Household Income | With Coverage | Without Coverage |
| Under $25,000 | 2,432 (98.9%) | 26 (1.1%) |
| $25,000 to $49,999 | 1,180 (92.1%) | 101 (7.9%) |
| $50,000 to $74,999 | 1,212 (95.0%) | 64 (5.0%) |
| $75,000 to $99,999 | 1,973 (98.2%) | 37 (1.8%) |
| $100,000 and over | 8,897 (97.6%) | 222 (2.4%) |
Public vs Private Health Insurance Coverage by Age in Mastic Beach
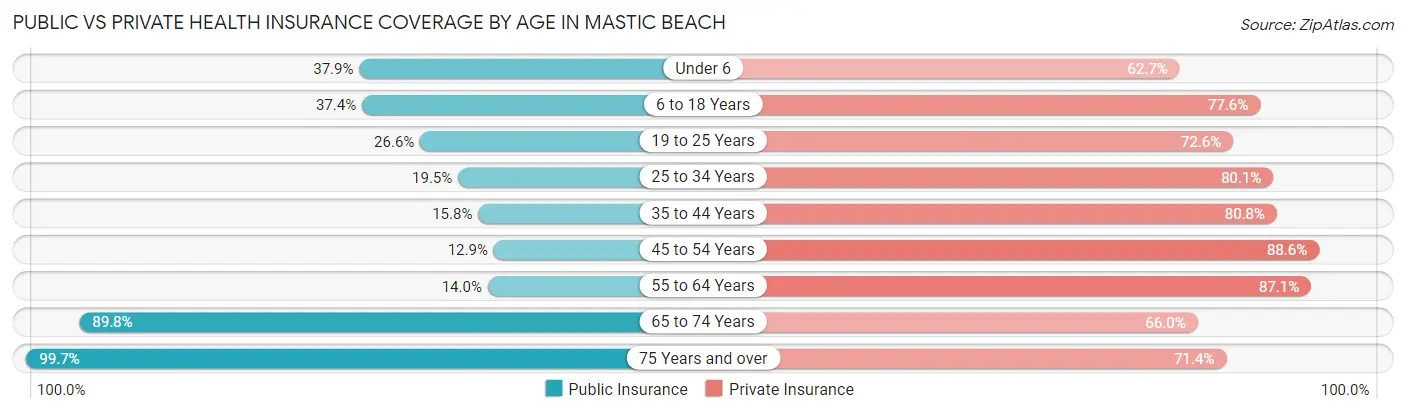
| Age Bracket | Public Insurance | Private Insurance |
| Under 6 | 581 (37.9%) | 962 (62.7%) |
| 6 to 18 Years | 1,092 (37.4%) | 2,268 (77.6%) |
| 19 to 25 Years | 337 (26.6%) | 921 (72.6%) |
| 25 to 34 Years | 339 (19.5%) | 1,390 (80.1%) |
| 35 to 44 Years | 427 (15.8%) | 2,182 (80.7%) |
| 45 to 54 Years | 242 (12.9%) | 1,659 (88.6%) |
| 55 to 64 Years | 323 (14.0%) | 2,003 (87.1%) |
| 65 to 74 Years | 857 (89.8%) | 630 (66.0%) |
| 75 Years and over | 873 (99.7%) | 625 (71.4%) |
| Total | 5,071 (31.4%) | 12,640 (78.2%) |
Disability Status by Sex by Age in Mastic Beach
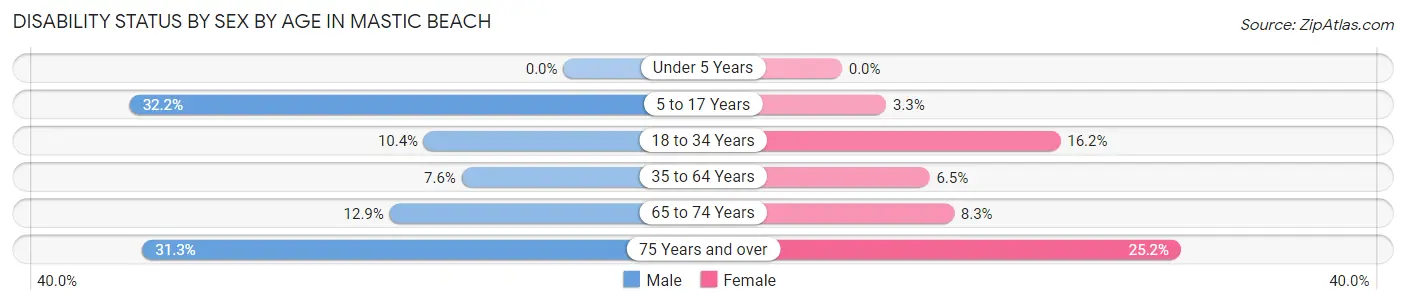
| Age Bracket | Male | Female |
| Under 5 Years | 0 (0.0%) | 0 (0.0%) |
| 5 to 17 Years | 413 (32.2%) | 58 (3.3%) |
| 18 to 34 Years | 171 (10.3%) | 242 (16.2%) |
| 35 to 64 Years | 249 (7.5%) | 233 (6.5%) |
| 65 to 74 Years | 44 (12.9%) | 51 (8.3%) |
| 75 Years and over | 85 (31.2%) | 152 (25.2%) |
Disability Class by Sex by Age in Mastic Beach
Disability Class: Hearing Difficulty
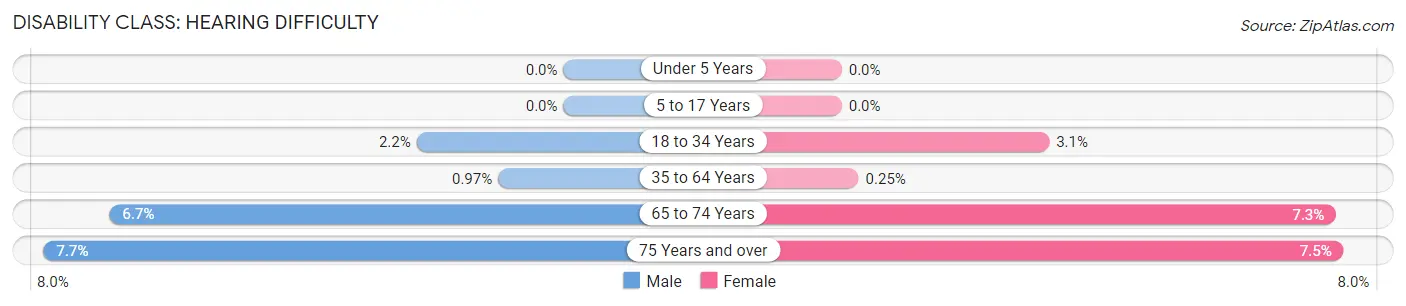
| Age Bracket | Male | Female |
| Under 5 Years | 0 (0.0%) | 0 (0.0%) |
| 5 to 17 Years | 0 (0.0%) | 0 (0.0%) |
| 18 to 34 Years | 36 (2.2%) | 46 (3.1%) |
| 35 to 64 Years | 32 (1.0%) | 9 (0.3%) |
| 65 to 74 Years | 23 (6.7%) | 45 (7.3%) |
| 75 Years and over | 21 (7.7%) | 45 (7.4%) |
Disability Class: Vision Difficulty
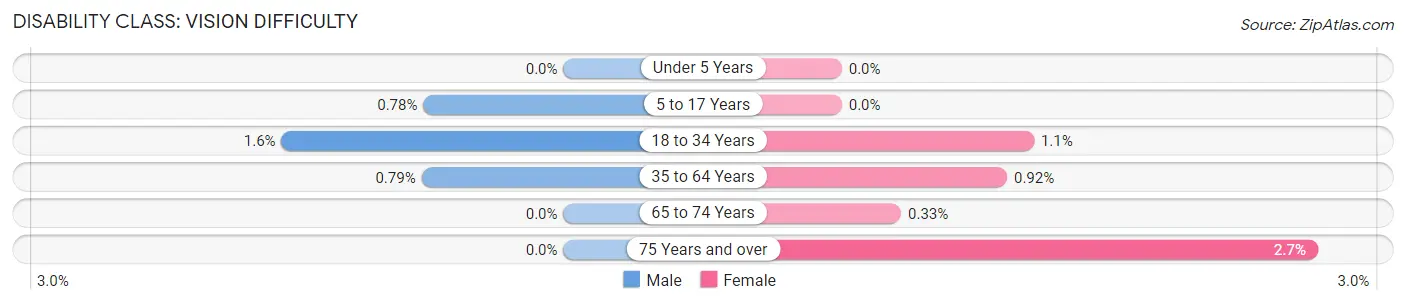
| Age Bracket | Male | Female |
| Under 5 Years | 0 (0.0%) | 0 (0.0%) |
| 5 to 17 Years | 10 (0.8%) | 0 (0.0%) |
| 18 to 34 Years | 26 (1.6%) | 16 (1.1%) |
| 35 to 64 Years | 26 (0.8%) | 33 (0.9%) |
| 65 to 74 Years | 0 (0.0%) | 2 (0.3%) |
| 75 Years and over | 0 (0.0%) | 16 (2.6%) |
Disability Class: Cognitive Difficulty
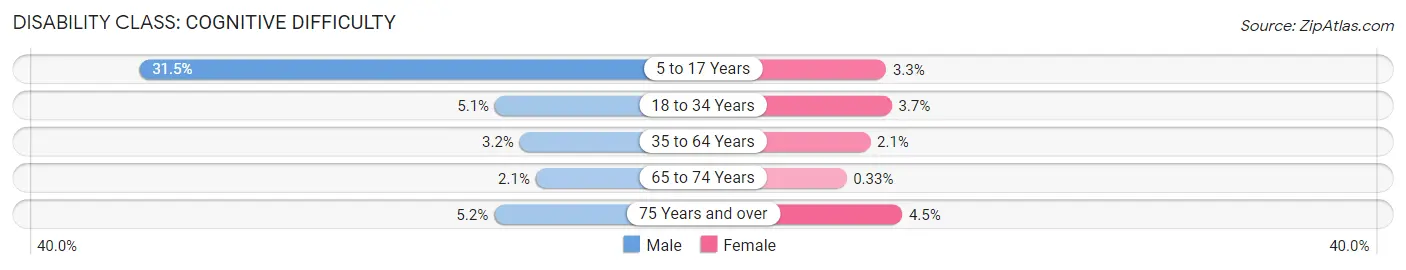
| Age Bracket | Male | Female |
| 5 to 17 Years | 404 (31.5%) | 58 (3.3%) |
| 18 to 34 Years | 84 (5.1%) | 55 (3.7%) |
| 35 to 64 Years | 107 (3.2%) | 75 (2.1%) |
| 65 to 74 Years | 7 (2.1%) | 2 (0.3%) |
| 75 Years and over | 14 (5.1%) | 27 (4.5%) |
Disability Class: Ambulatory Difficulty
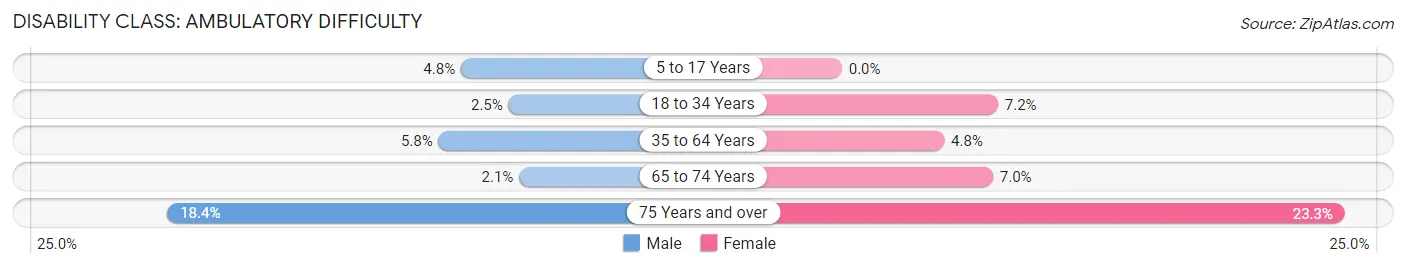
| Age Bracket | Male | Female |
| 5 to 17 Years | 61 (4.8%) | 0 (0.0%) |
| 18 to 34 Years | 42 (2.5%) | 108 (7.2%) |
| 35 to 64 Years | 191 (5.8%) | 170 (4.8%) |
| 65 to 74 Years | 7 (2.1%) | 43 (7.0%) |
| 75 Years and over | 50 (18.4%) | 141 (23.3%) |
Disability Class: Self-Care Difficulty
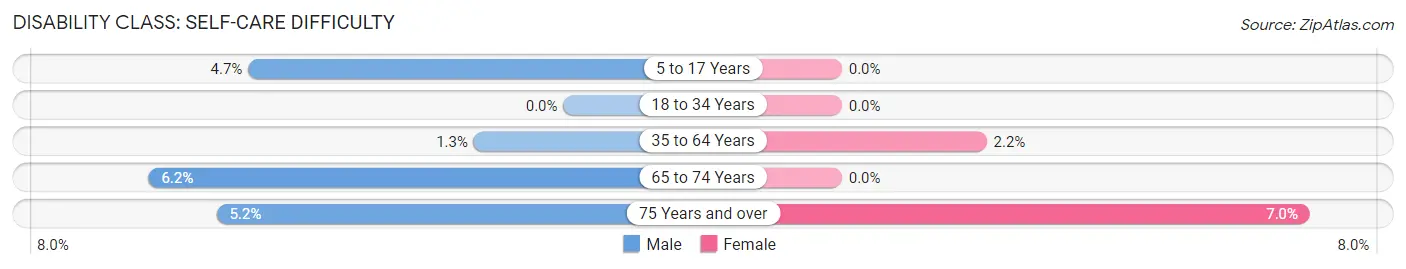
| Age Bracket | Male | Female |
| 5 to 17 Years | 60 (4.7%) | 0 (0.0%) |
| 18 to 34 Years | 0 (0.0%) | 0 (0.0%) |
| 35 to 64 Years | 44 (1.3%) | 77 (2.1%) |
| 65 to 74 Years | 21 (6.2%) | 0 (0.0%) |
| 75 Years and over | 14 (5.1%) | 42 (7.0%) |
Technology Access in Mastic Beach
Computing Device Access in Mastic Beach
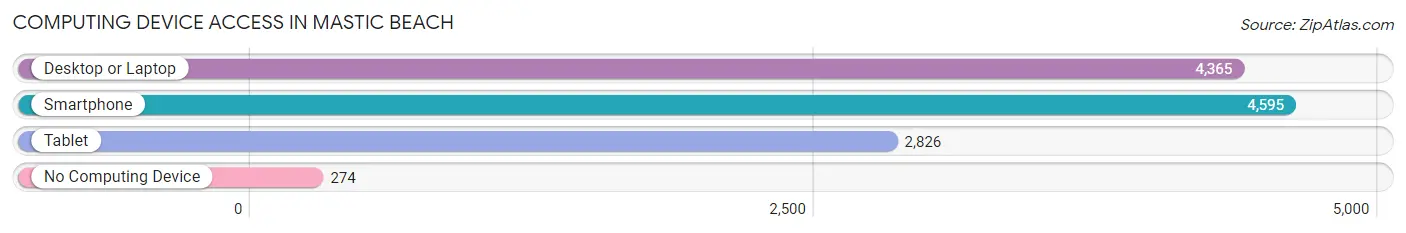
| Device Type | # Households | % Households |
| Desktop or Laptop | 4,365 | 84.1% |
| Smartphone | 4,595 | 88.5% |
| Tablet | 2,826 | 54.5% |
| No Computing Device | 274 | 5.3% |
| Total | 5,189 | 100.0% |
Internet Access in Mastic Beach
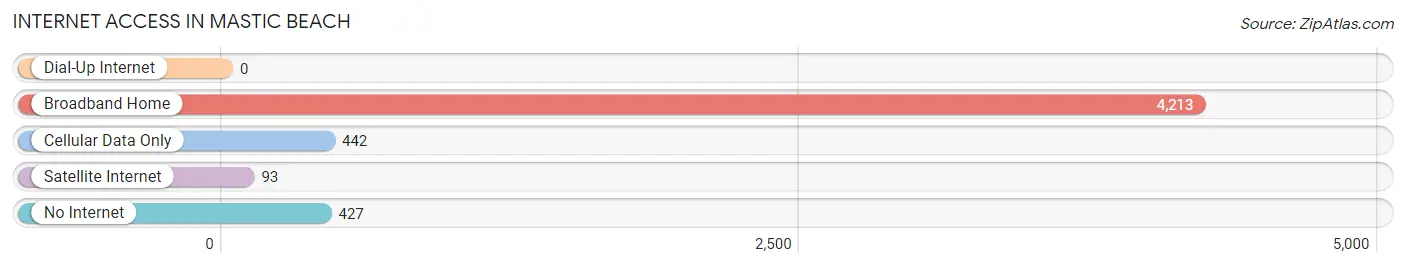
| Internet Type | # Households | % Households |
| Dial-Up Internet | 0 | 0.0% |
| Broadband Home | 4,213 | 81.2% |
| Cellular Data Only | 442 | 8.5% |
| Satellite Internet | 93 | 1.8% |
| No Internet | 427 | 8.2% |
| Total | 5,189 | 100.0% |
Mastic Beach Summary
Mastic Beach is a village located in the Town of Brookhaven in Suffolk County, New York. It is situated on the south shore of Long Island, approximately 60 miles east of New York City. The village has a population of approximately 11,000 people and covers an area of 2.3 square miles.
History
Mastic Beach was originally inhabited by the Shinnecock Indians, who were the first inhabitants of Long Island. The area was first settled by Europeans in the late 1600s, when English settlers began to move into the area. The area was originally known as “Mastic Neck” and was part of the Town of Brookhaven. In the late 1800s, the area began to be developed as a summer resort community. The area was known for its beautiful beaches and was a popular destination for vacationers from New York City.
In the early 1900s, the area began to be developed as a residential community. The area was incorporated as the Village of Mastic Beach in 1925. The village was named after the Mastic tree, which is native to the area. The village was originally a summer resort community, but over time it became a year-round residential community.
Geography
Mastic Beach is located on the south shore of Long Island, approximately 60 miles east of New York City. The village covers an area of 2.3 square miles and is bordered by the Great South Bay to the north, the Moriches Bay to the east, and the Atlantic Ocean to the south. The village is located in the Town of Brookhaven and is part of Suffolk County.
The village is located on a barrier island, which is separated from the mainland by the Great South Bay. The village is located on a narrow strip of land between the bay and the ocean. The village is located on a flat plain, with no significant hills or mountains. The highest point in the village is approximately 20 feet above sea level.
Economy
The economy of Mastic Beach is largely based on tourism and retail. The village is home to several small businesses, including restaurants, shops, and other retail establishments. The village is also home to several marinas, which provide services to boaters and fishermen. The village is also home to several small manufacturing companies.
The village is also home to several large employers, including the Brookhaven National Laboratory, which is located in the nearby town of Upton. The laboratory is a major employer in the area and provides jobs to many local residents.
Demographics
As of the 2010 census, the population of Mastic Beach was 11,064. The population is predominantly white, with approximately 85% of the population being white. The remaining 15% of the population is made up of African Americans, Hispanics, and other ethnic groups. The median household income in the village is approximately $60,000. The median age of the population is approximately 40 years old.
Conclusion
Mastic Beach is a village located in the Town of Brookhaven in Suffolk County, New York. It is situated on the south shore of Long Island, approximately 60 miles east of New York City. The village has a population of approximately 11,000 people and covers an area of 2.3 square miles. The village was originally inhabited by the Shinnecock Indians and was later settled by Europeans in the late 1600s. The village was incorporated in 1925 and is now a year-round residential community. The economy of Mastic Beach is largely based on tourism and retail, and the village is home to several large employers, including the Brookhaven National Laboratory. The population of Mastic Beach is predominantly white, with a median household income of approximately $60,000.
Common Questions
What is Per Capita Income in Mastic Beach?
Per Capita income in Mastic Beach is $37,060.
What is the Median Family Income in Mastic Beach?
Median Family Income in Mastic Beach is $105,805.
What is the Median Household income in Mastic Beach?
Median Household Income in Mastic Beach is $103,099.
What is Income or Wage Gap in Mastic Beach?
Income or Wage Gap in Mastic Beach is 29.0%.
Women in Mastic Beach earn 71.0 cents for every dollar earned by a man.
What is Family Income Deficit in Mastic Beach?
Family Income Deficit in Mastic Beach is $11,202.
Families that are below poverty line in Mastic Beach earn $11,202 less on average than the poverty threshold level.
What is Inequality or Gini Index in Mastic Beach?
Inequality or Gini Index in Mastic Beach is 0.43.
What is the Total Population of Mastic Beach?
Total Population of Mastic Beach is 16,189.
What is the Total Male Population of Mastic Beach?
Total Male Population of Mastic Beach is 7,152.
What is the Total Female Population of Mastic Beach?
Total Female Population of Mastic Beach is 9,037.
What is the Ratio of Males per 100 Females in Mastic Beach?
There are 79.14 Males per 100 Females in Mastic Beach.
What is the Ratio of Females per 100 Males in Mastic Beach?
There are 126.36 Females per 100 Males in Mastic Beach.
What is the Median Population Age in Mastic Beach?
Median Population Age in Mastic Beach is 38.9 Years.
What is the Average Family Size in Mastic Beach
Average Family Size in Mastic Beach is 3.5 People.
What is the Average Household Size in Mastic Beach
Average Household Size in Mastic Beach is 3.1 People.
How Large is the Labor Force in Mastic Beach?
There are 7,751 People in the Labor Forcein in Mastic Beach.
What is the Percentage of People in the Labor Force in Mastic Beach?
63.5% of People are in the Labor Force in Mastic Beach.
What is the Unemployment Rate in Mastic Beach?
Unemployment Rate in Mastic Beach is 5.7%.