Esperance, NY Map & Demographics
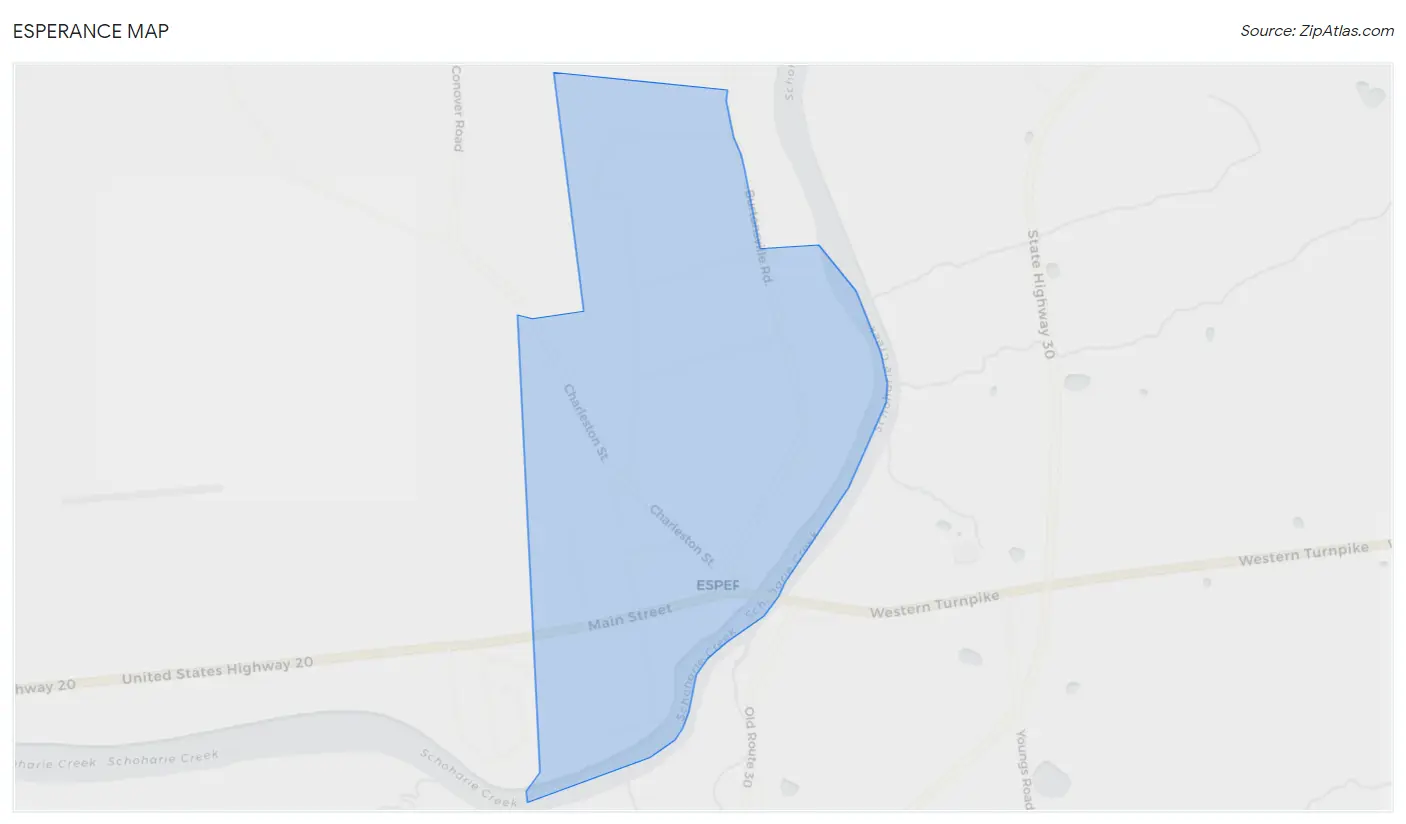
Esperance Map
Esperance Overview
$32,239
PER CAPITA INCOME
$71,563
AVG FAMILY INCOME
$65,625
AVG HOUSEHOLD INCOME
27.3%
WAGE / INCOME GAP [ % ]
72.7¢/ $1
WAGE / INCOME GAP [ $ ]
0.39
INEQUALITY / GINI INDEX
277
TOTAL POPULATION
158
MALE POPULATION
119
FEMALE POPULATION
132.77
MALES / 100 FEMALES
75.32
FEMALES / 100 MALES
49.3
MEDIAN AGE
2.9
AVG FAMILY SIZE
2.2
AVG HOUSEHOLD SIZE
140
LABOR FORCE [ PEOPLE ]
56.9%
PERCENT IN LABOR FORCE
2.9%
UNEMPLOYMENT RATE
Esperance Zip Codes
Esperance Area Codes
Income in Esperance
Income Overview in Esperance
Per Capita Income in Esperance is $32,239, while median incomes of families and households are $71,563 and $65,625 respectively.
| Characteristic | Number | Measure |
| Per Capita Income | 277 | $32,239 |
| Median Family Income | 68 | $71,563 |
| Mean Family Income | 68 | $85,776 |
| Median Household Income | 127 | $65,625 |
| Mean Household Income | 127 | $68,653 |
| Income Deficit | 68 | $0 |
| Wage / Income Gap (%) | 277 | 27.27% |
| Wage / Income Gap ($) | 277 | 72.73¢ per $1 |
| Gini / Inequality Index | 277 | 0.39 |
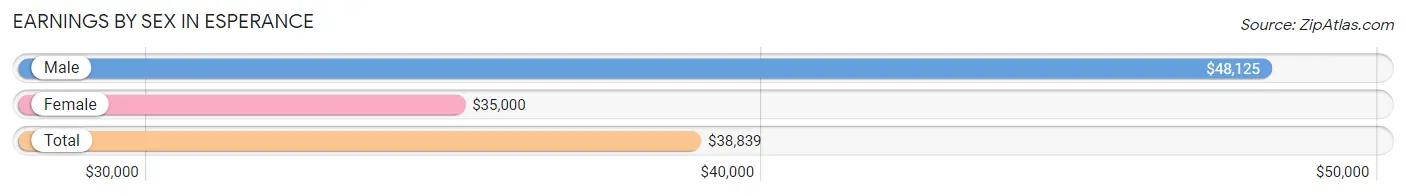
Earnings by Sex in Esperance
Average Earnings in Esperance are $38,839, $48,125 for men and $35,000 for women, a difference of 27.3%.
| Sex | Number | Average Earnings |
| Male | 87 (59.2%) | $48,125 |
| Female | 60 (40.8%) | $35,000 |
| Total | 147 (100.0%) | $38,839 |
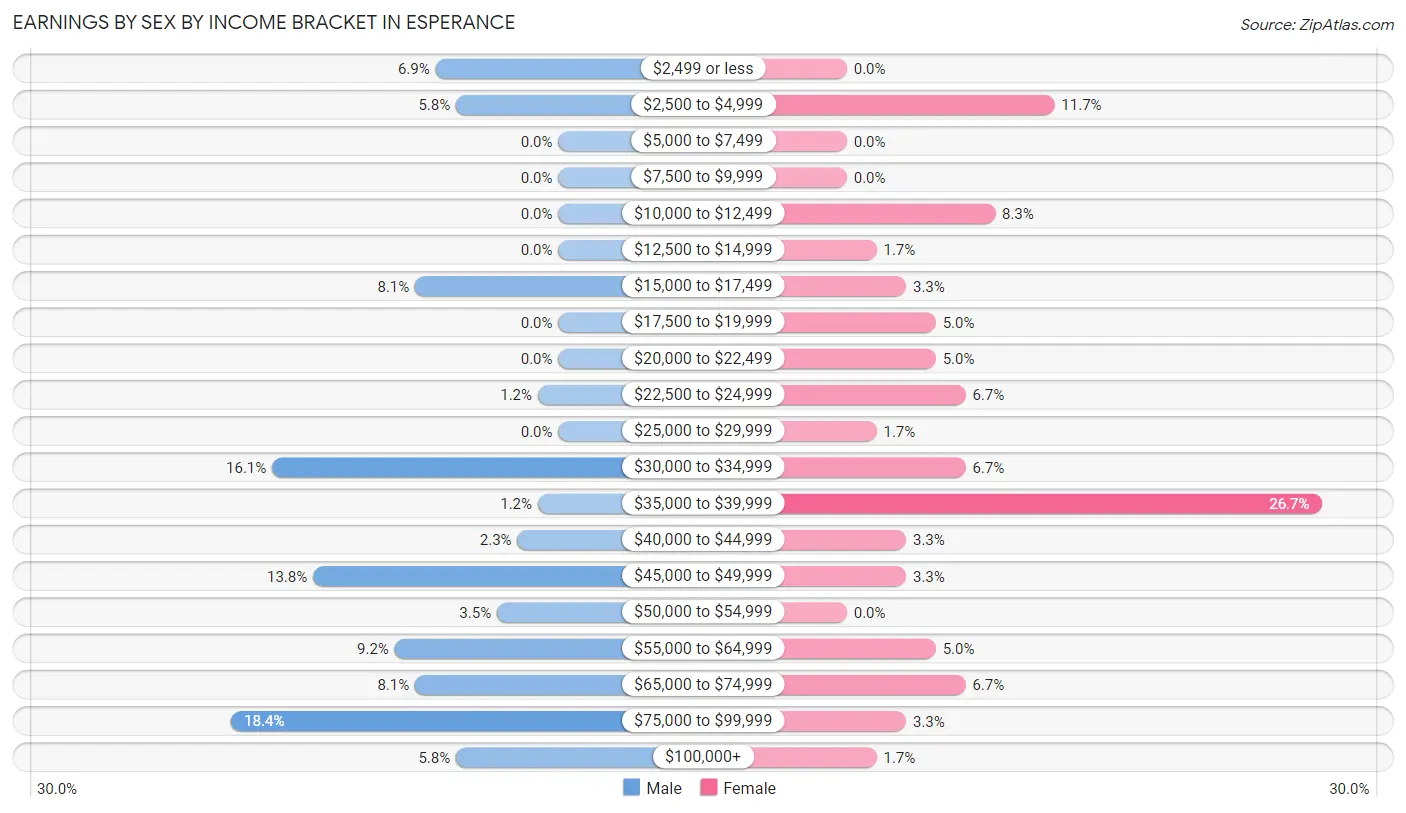
Earnings by Sex by Income Bracket in Esperance
The most common earnings brackets in Esperance are $75,000 to $99,999 for men (16 | 18.4%) and $35,000 to $39,999 for women (16 | 26.7%).
| Income | Male | Female |
| $2,499 or less | 6 (6.9%) | 0 (0.0%) |
| $2,500 to $4,999 | 5 (5.8%) | 7 (11.7%) |
| $5,000 to $7,499 | 0 (0.0%) | 0 (0.0%) |
| $7,500 to $9,999 | 0 (0.0%) | 0 (0.0%) |
| $10,000 to $12,499 | 0 (0.0%) | 5 (8.3%) |
| $12,500 to $14,999 | 0 (0.0%) | 1 (1.7%) |
| $15,000 to $17,499 | 7 (8.1%) | 2 (3.3%) |
| $17,500 to $19,999 | 0 (0.0%) | 3 (5.0%) |
| $20,000 to $22,499 | 0 (0.0%) | 3 (5.0%) |
| $22,500 to $24,999 | 1 (1.1%) | 4 (6.7%) |
| $25,000 to $29,999 | 0 (0.0%) | 1 (1.7%) |
| $30,000 to $34,999 | 14 (16.1%) | 4 (6.7%) |
| $35,000 to $39,999 | 1 (1.1%) | 16 (26.7%) |
| $40,000 to $44,999 | 2 (2.3%) | 2 (3.3%) |
| $45,000 to $49,999 | 12 (13.8%) | 2 (3.3%) |
| $50,000 to $54,999 | 3 (3.5%) | 0 (0.0%) |
| $55,000 to $64,999 | 8 (9.2%) | 3 (5.0%) |
| $65,000 to $74,999 | 7 (8.1%) | 4 (6.7%) |
| $75,000 to $99,999 | 16 (18.4%) | 2 (3.3%) |
| $100,000+ | 5 (5.8%) | 1 (1.7%) |
| Total | 87 (100.0%) | 60 (100.0%) |
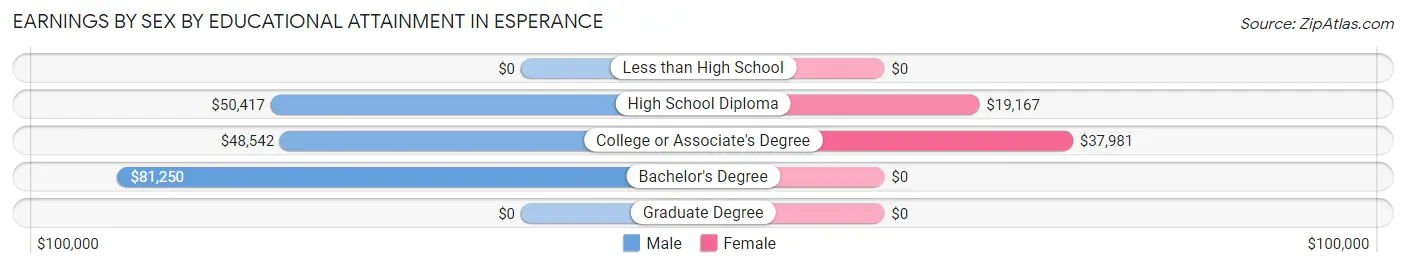
Earnings by Sex by Educational Attainment in Esperance
Average earnings in Esperance are $50,000 for men and $37,596 for women, a difference of 24.8%. Men with an educational attainment of bachelor's degree enjoy the highest average annual earnings of $81,250, while those with college or associate's degree education earn the least with $48,542. Women with an educational attainment of college or associate's degree earn the most with the average annual earnings of $37,981, while those with high school diploma education have the smallest earnings of $19,167.
| Educational Attainment | Male Income | Female Income |
| Less than High School | - | - |
| High School Diploma | $50,417 | $19,167 |
| College or Associate's Degree | $48,542 | $37,981 |
| Bachelor's Degree | $81,250 | $0 |
| Graduate Degree | - | - |
| Total | $50,000 | $37,596 |
Family Income in Esperance
Family Income Brackets in Esperance
According to the Esperance family income data, there are 22 families falling into the $50,000 to $74,999 income range, which is the most common income bracket and makes up 32.4% of all families.
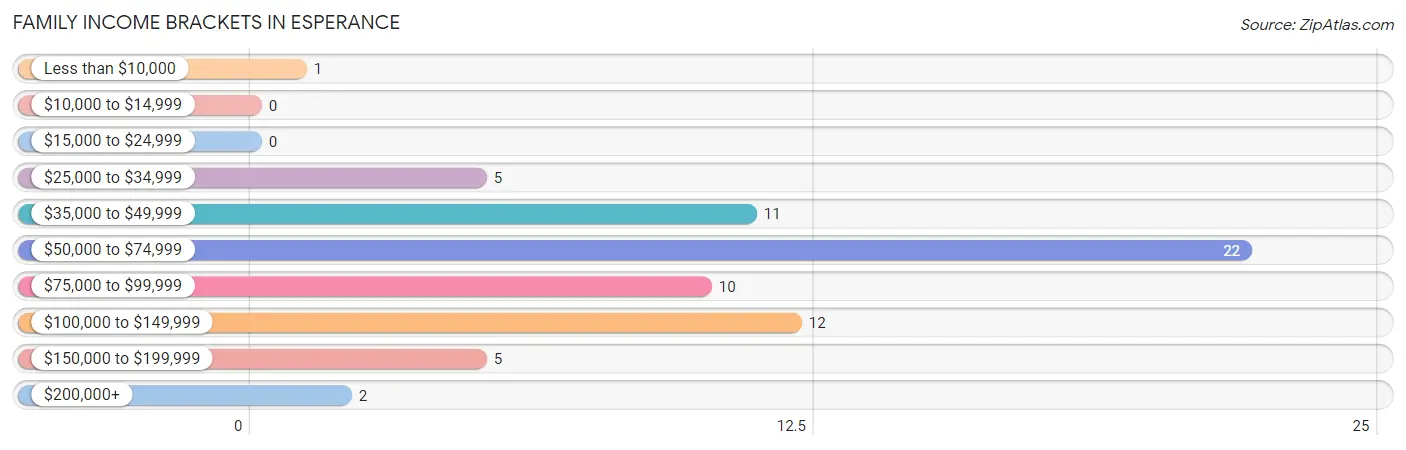
| Income Bracket | # Families | % Families |
| Less than $10,000 | 1 | 1.5% |
| $10,000 to $14,999 | 0 | 0.0% |
| $15,000 to $24,999 | 0 | 0.0% |
| $25,000 to $34,999 | 5 | 7.4% |
| $35,000 to $49,999 | 11 | 16.2% |
| $50,000 to $74,999 | 22 | 32.4% |
| $75,000 to $99,999 | 10 | 14.7% |
| $100,000 to $149,999 | 12 | 17.6% |
| $150,000 to $199,999 | 5 | 7.4% |
| $200,000+ | 2 | 2.9% |
Family Income by Famaliy Size in Esperance
3-person families (21 | 30.9%) account for the highest median family income in Esperance with $127,656 per family, while 3-person families (21 | 30.9%) have the highest median income of $42,552 per family member.
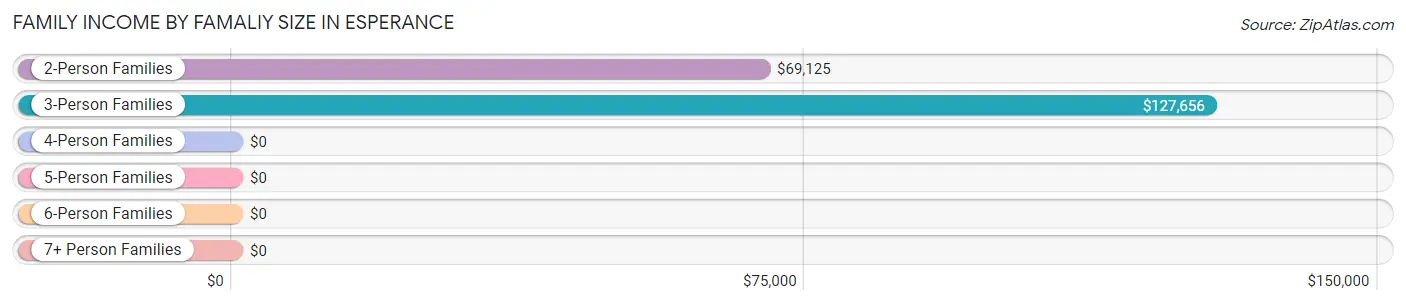
| Income Bracket | # Families | Median Income |
| 2-Person Families | 33 (48.5%) | $69,125 |
| 3-Person Families | 21 (30.9%) | $127,656 |
| 4-Person Families | 6 (8.8%) | $0 |
| 5-Person Families | 7 (10.3%) | $0 |
| 6-Person Families | 0 (0.0%) | $0 |
| 7+ Person Families | 1 (1.5%) | $0 |
| Total | 68 (100.0%) | $71,563 |
Family Income by Number of Earners in Esperance
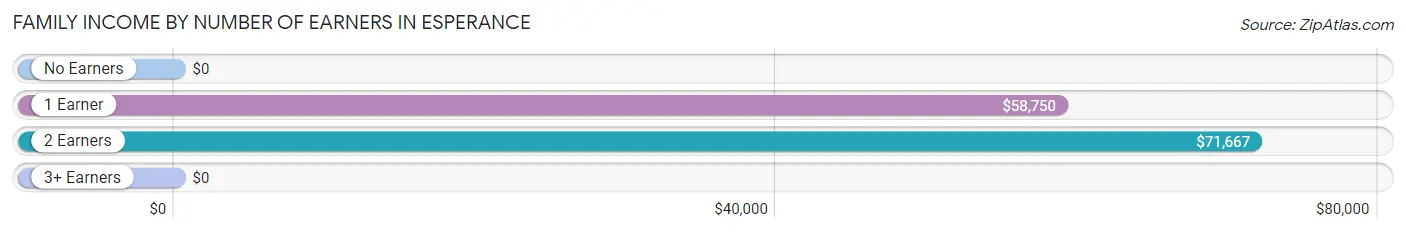
| Number of Earners | # Families | Median Income |
| No Earners | 13 (19.1%) | $0 |
| 1 Earner | 15 (22.1%) | $58,750 |
| 2 Earners | 32 (47.1%) | $71,667 |
| 3+ Earners | 8 (11.8%) | $0 |
| Total | 68 (100.0%) | $71,563 |
Household Income in Esperance
Household Income Brackets in Esperance
With 35 households falling in the category, the $50,000 to $74,999 income range is the most frequent in Esperance, accounting for 27.6% of all households.
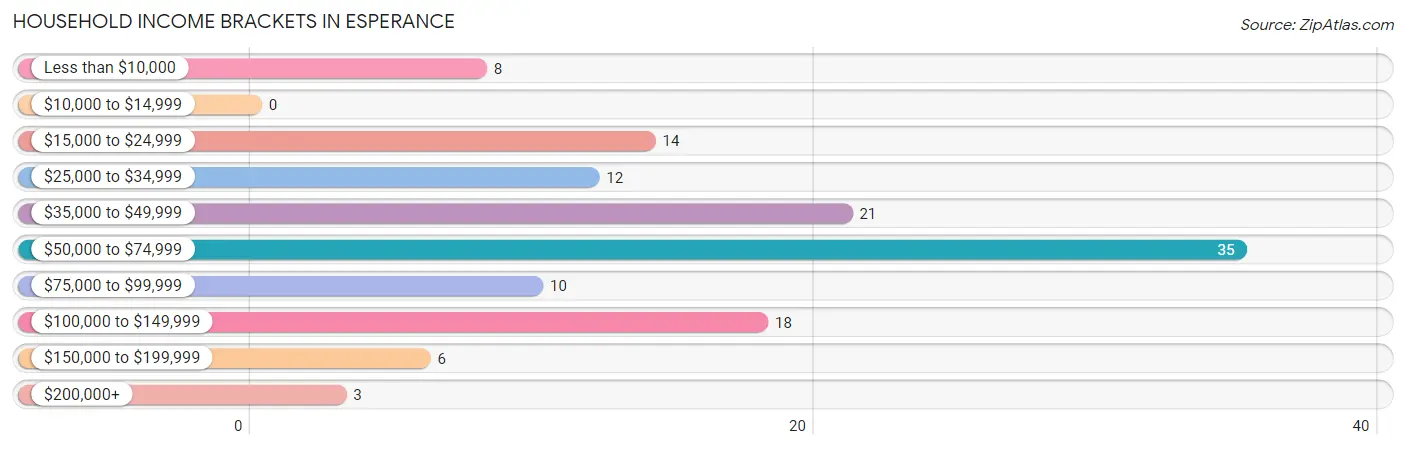
| Income Bracket | # Households | % Households |
| Less than $10,000 | 8 | 6.3% |
| $10,000 to $14,999 | 0 | 0.0% |
| $15,000 to $24,999 | 14 | 11.0% |
| $25,000 to $34,999 | 12 | 9.4% |
| $35,000 to $49,999 | 21 | 16.5% |
| $50,000 to $74,999 | 35 | 27.6% |
| $75,000 to $99,999 | 10 | 7.9% |
| $100,000 to $149,999 | 18 | 14.2% |
| $150,000 to $199,999 | 6 | 4.7% |
| $200,000+ | 3 | 2.4% |
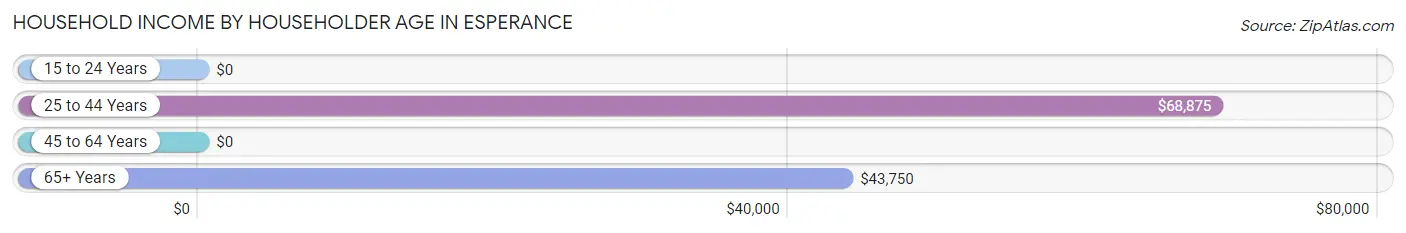
Household Income by Householder Age in Esperance
The median household income in Esperance is $65,625, with the highest median household income of $68,875 found in the 25 to 44 years age bracket for the primary householder. A total of 35 households (27.6%) fall into this category.
| Income Bracket | # Households | Median Income |
| 15 to 24 Years | 0 (0.0%) | $0 |
| 25 to 44 Years | 35 (27.6%) | $68,875 |
| 45 to 64 Years | 52 (40.9%) | $0 |
| 65+ Years | 40 (31.5%) | $43,750 |
| Total | 127 (100.0%) | $65,625 |
Poverty in Esperance
Income Below Poverty by Sex and Age in Esperance
With 10.1% poverty level for males and 9.2% for females among the residents of Esperance, 75 year old and over males and 25 to 34 year old females are the most vulnerable to poverty, with 8 males (50.0%) and 6 females (26.1%) in their respective age groups living below the poverty level.
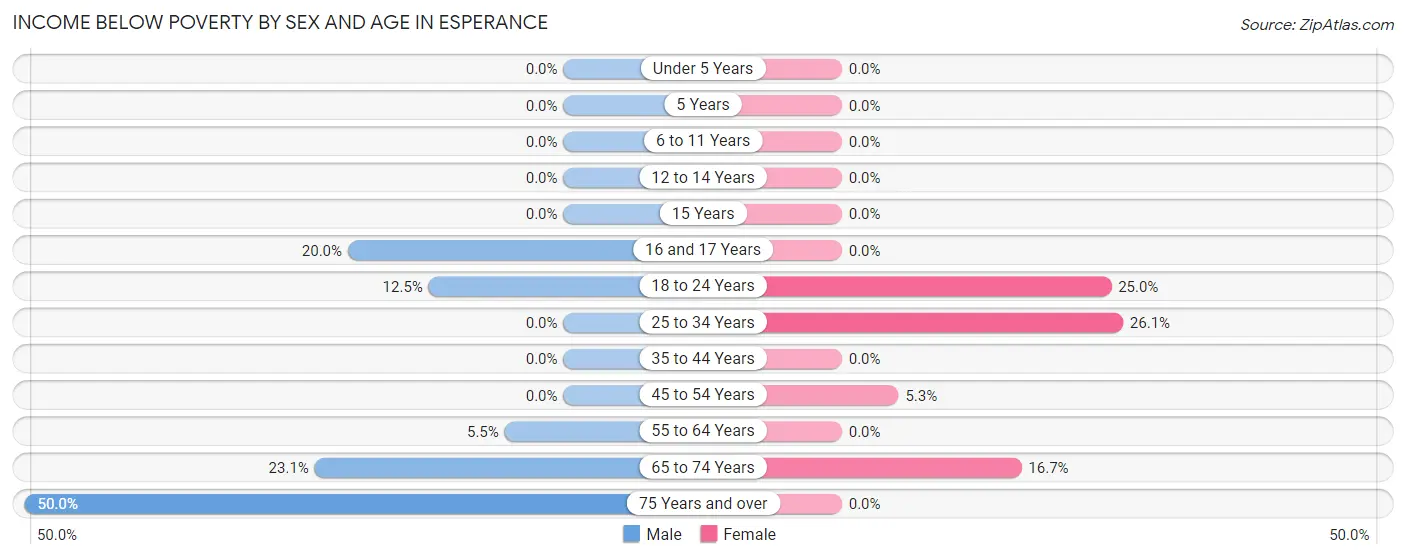
| Age Bracket | Male | Female |
| Under 5 Years | 0 (0.0%) | 0 (0.0%) |
| 5 Years | 0 (0.0%) | 0 (0.0%) |
| 6 to 11 Years | 0 (0.0%) | 0 (0.0%) |
| 12 to 14 Years | 0 (0.0%) | 0 (0.0%) |
| 15 Years | 0 (0.0%) | 0 (0.0%) |
| 16 and 17 Years | 1 (20.0%) | 0 (0.0%) |
| 18 to 24 Years | 1 (12.5%) | 2 (25.0%) |
| 25 to 34 Years | 0 (0.0%) | 6 (26.1%) |
| 35 to 44 Years | 0 (0.0%) | 0 (0.0%) |
| 45 to 54 Years | 0 (0.0%) | 1 (5.3%) |
| 55 to 64 Years | 3 (5.4%) | 0 (0.0%) |
| 65 to 74 Years | 3 (23.1%) | 2 (16.7%) |
| 75 Years and over | 8 (50.0%) | 0 (0.0%) |
| Total | 16 (10.1%) | 11 (9.2%) |
Income Above Poverty by Sex and Age in Esperance
According to the poverty statistics in Esperance, males aged under 5 years and females aged under 5 years are the age groups that are most secure financially, with 100.0% of males and 100.0% of females in these age groups living above the poverty line.
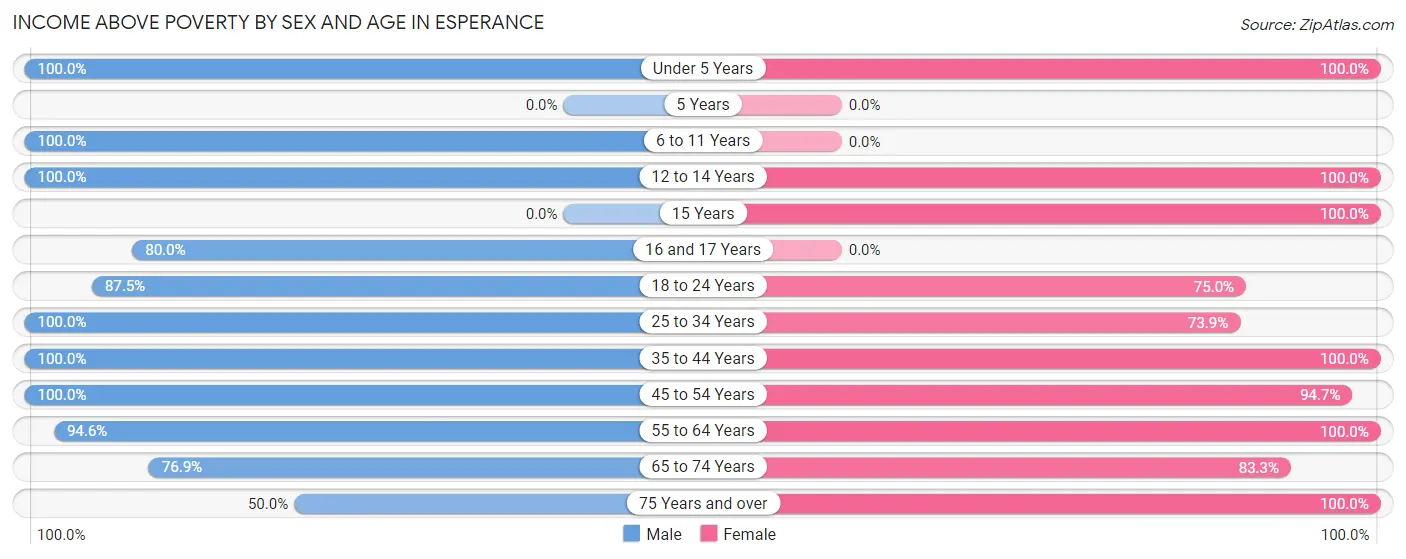
| Age Bracket | Male | Female |
| Under 5 Years | 5 (100.0%) | 2 (100.0%) |
| 5 Years | 0 (0.0%) | 0 (0.0%) |
| 6 to 11 Years | 8 (100.0%) | 0 (0.0%) |
| 12 to 14 Years | 4 (100.0%) | 9 (100.0%) |
| 15 Years | 0 (0.0%) | 3 (100.0%) |
| 16 and 17 Years | 4 (80.0%) | 0 (0.0%) |
| 18 to 24 Years | 7 (87.5%) | 6 (75.0%) |
| 25 to 34 Years | 21 (100.0%) | 17 (73.9%) |
| 35 to 44 Years | 8 (100.0%) | 12 (100.0%) |
| 45 to 54 Years | 15 (100.0%) | 18 (94.7%) |
| 55 to 64 Years | 52 (94.6%) | 16 (100.0%) |
| 65 to 74 Years | 10 (76.9%) | 10 (83.3%) |
| 75 Years and over | 8 (50.0%) | 15 (100.0%) |
| Total | 142 (89.9%) | 108 (90.8%) |
Income Below Poverty Among Married-Couple Families in Esperance
The poverty statistics for married-couple families in Esperance show that 3.5% or 2 of the total 57 families live below the poverty line. Families with 1 or 2 children have the highest poverty rate of 8.3%, comprising of 1 families. On the other hand, families with 3 or 4 children have the lowest poverty rate of 0.0%, which includes 0 families.
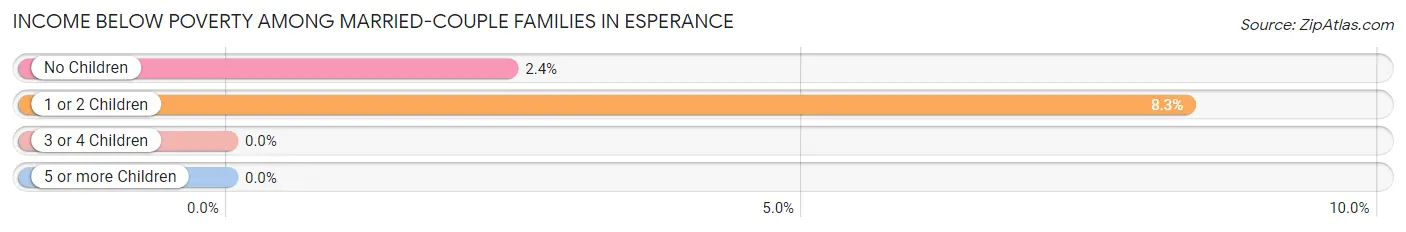
| Children | Above Poverty | Below Poverty |
| No Children | 40 (97.6%) | 1 (2.4%) |
| 1 or 2 Children | 11 (91.7%) | 1 (8.3%) |
| 3 or 4 Children | 4 (100.0%) | 0 (0.0%) |
| 5 or more Children | 0 (0.0%) | 0 (0.0%) |
| Total | 55 (96.5%) | 2 (3.5%) |
Income Below Poverty Among Single-Parent Households in Esperance
| Children | Single Father | Single Mother |
| No Children | 0 (0.0%) | 0 (0.0%) |
| 1 or 2 Children | 0 (0.0%) | 0 (0.0%) |
| 3 or 4 Children | 0 (0.0%) | 0 (0.0%) |
| 5 or more Children | 0 (0.0%) | 0 (0.0%) |
| Total | 0 (0.0%) | 0 (0.0%) |
Income Below Poverty Among Married-Couple vs Single-Parent Households in Esperance
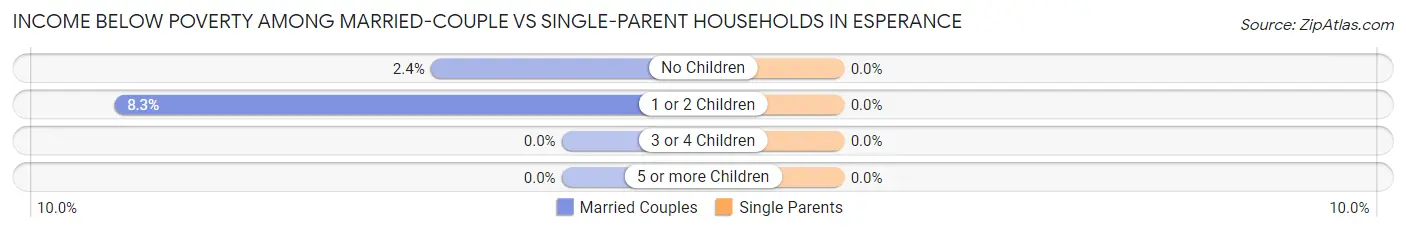
| Children | Married-Couple Families | Single-Parent Households |
| No Children | 1 (2.4%) | 0 (0.0%) |
| 1 or 2 Children | 1 (8.3%) | 0 (0.0%) |
| 3 or 4 Children | 0 (0.0%) | 0 (0.0%) |
| 5 or more Children | 0 (0.0%) | 0 (0.0%) |
| Total | 2 (3.5%) | 0 (0.0%) |
Race in Esperance
The most populous races in Esperance are White / Caucasian (241 | 87.0%), Two or more Races (20 | 7.2%), and Black / African American (15 | 5.4%).
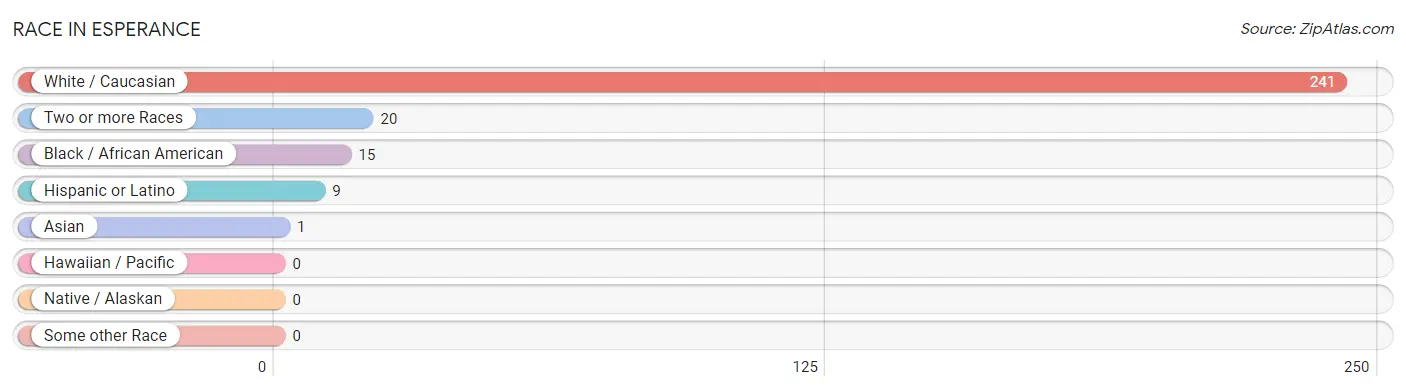
| Race | # Population | % Population |
| Asian | 1 | 0.4% |
| Black / African American | 15 | 5.4% |
| Hawaiian / Pacific | 0 | 0.0% |
| Hispanic or Latino | 9 | 3.3% |
| Native / Alaskan | 0 | 0.0% |
| White / Caucasian | 241 | 87.0% |
| Two or more Races | 20 | 7.2% |
| Some other Race | 0 | 0.0% |
| Total | 277 | 100.0% |
Ancestry in Esperance
The most populous ancestries reported in Esperance are German (81 | 29.2%), Irish (42 | 15.2%), American (24 | 8.7%), Italian (23 | 8.3%), and English (21 | 7.6%), together accounting for 68.9% of all Esperance residents.
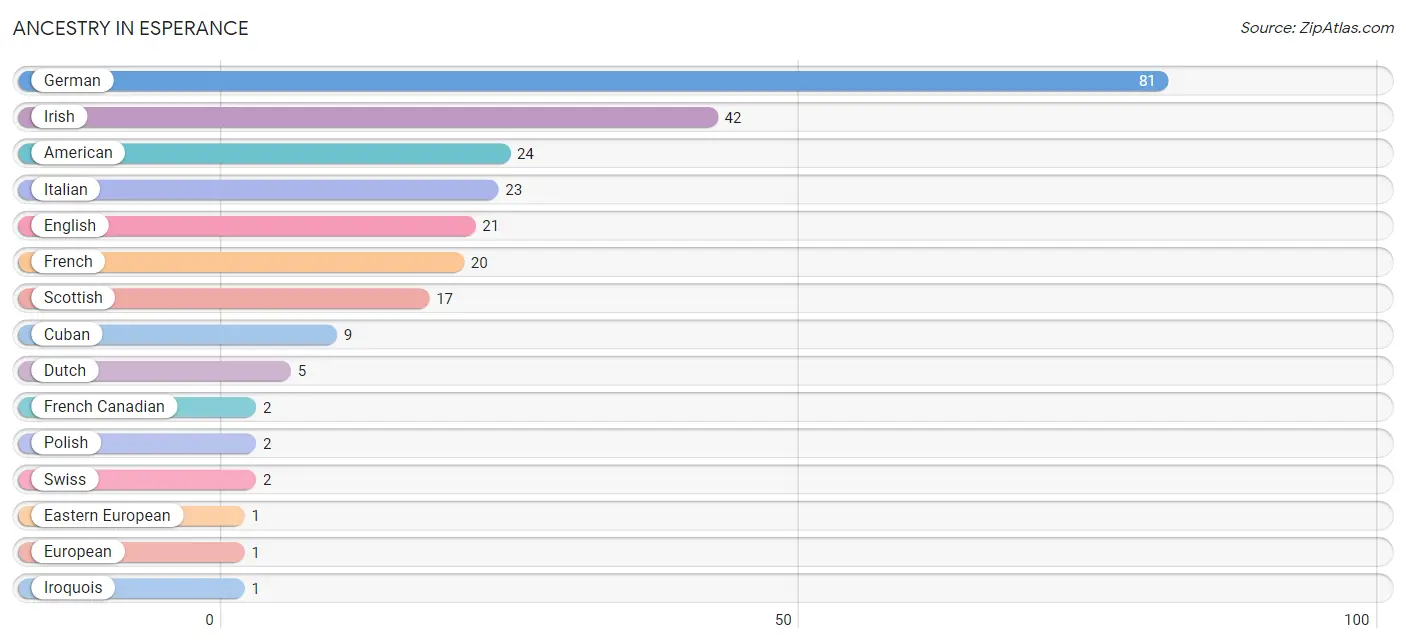
| Ancestry | # Population | % Population |
| American | 24 | 8.7% |
| Cuban | 9 | 3.3% |
| Dutch | 5 | 1.8% |
| Eastern European | 1 | 0.4% |
| English | 21 | 7.6% |
| European | 1 | 0.4% |
| French | 20 | 7.2% |
| French Canadian | 2 | 0.7% |
| German | 81 | 29.2% |
| Irish | 42 | 15.2% |
| Iroquois | 1 | 0.4% |
| Italian | 23 | 8.3% |
| Korean | 1 | 0.4% |
| Polish | 2 | 0.7% |
| Scottish | 17 | 6.1% |
| Swiss | 2 | 0.7% | View All 16 Rows |
Immigrants in Esperance
The most numerous immigrant groups reported in Esperance came from Asia (1 | 0.4%), Canada (1 | 0.4%), Europe (1 | 0.4%), Germany (1 | 0.4%), and Philippines (1 | 0.4%), together accounting for 1.8% of all Esperance residents.
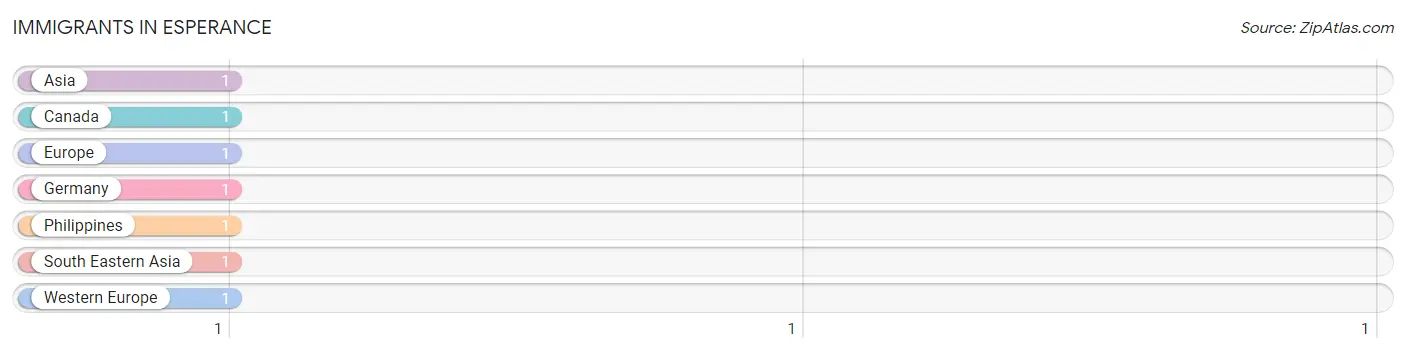
| Immigration Origin | # Population | % Population |
| Asia | 1 | 0.4% |
| Canada | 1 | 0.4% |
| Europe | 1 | 0.4% |
| Germany | 1 | 0.4% |
| Philippines | 1 | 0.4% |
| South Eastern Asia | 1 | 0.4% |
| Western Europe | 1 | 0.4% | View All 7 Rows |
Sex and Age in Esperance
Sex and Age in Esperance
The most populous age groups in Esperance are 60 to 64 Years (28 | 17.7%) for men and 45 to 49 Years (17 | 14.3%) for women.
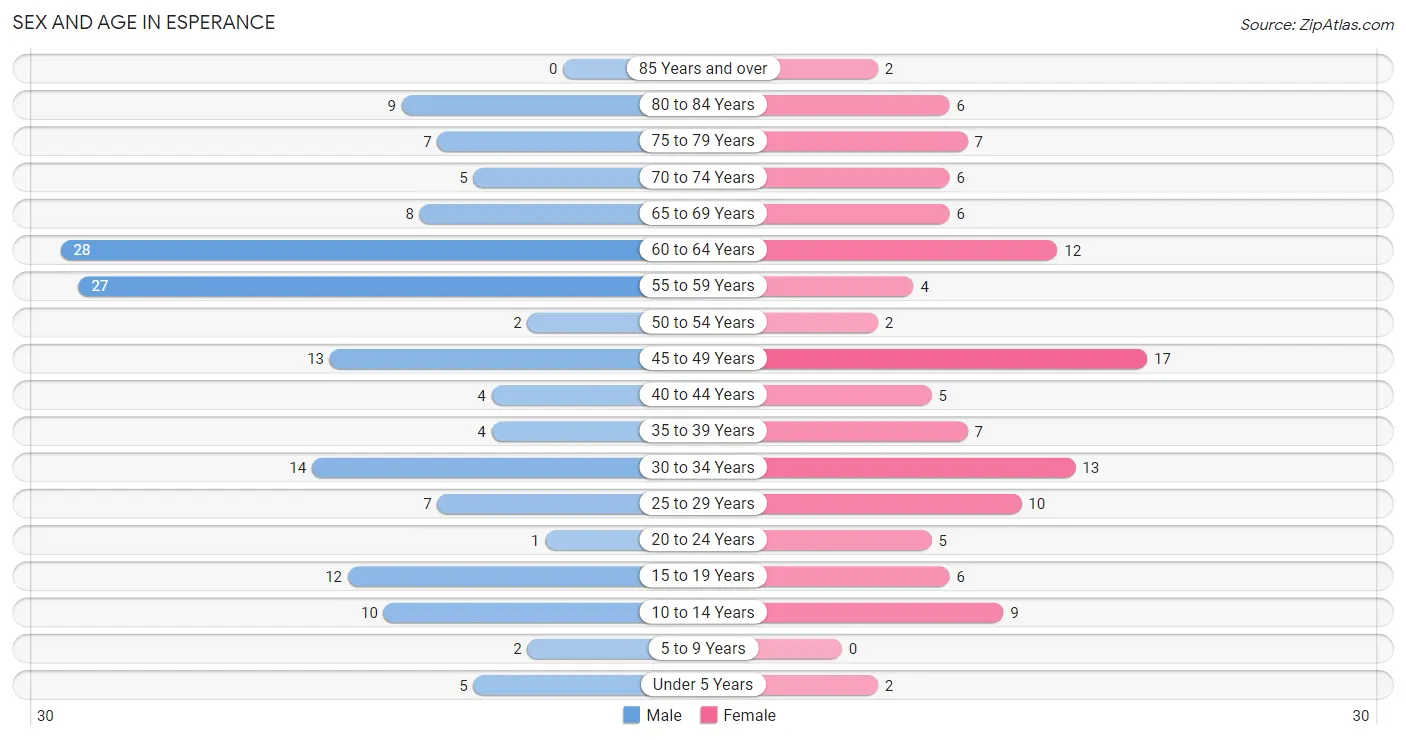
| Age Bracket | Male | Female |
| Under 5 Years | 5 (3.2%) | 2 (1.7%) |
| 5 to 9 Years | 2 (1.3%) | 0 (0.0%) |
| 10 to 14 Years | 10 (6.3%) | 9 (7.6%) |
| 15 to 19 Years | 12 (7.6%) | 6 (5.0%) |
| 20 to 24 Years | 1 (0.6%) | 5 (4.2%) |
| 25 to 29 Years | 7 (4.4%) | 10 (8.4%) |
| 30 to 34 Years | 14 (8.9%) | 13 (10.9%) |
| 35 to 39 Years | 4 (2.5%) | 7 (5.9%) |
| 40 to 44 Years | 4 (2.5%) | 5 (4.2%) |
| 45 to 49 Years | 13 (8.2%) | 17 (14.3%) |
| 50 to 54 Years | 2 (1.3%) | 2 (1.7%) |
| 55 to 59 Years | 27 (17.1%) | 4 (3.4%) |
| 60 to 64 Years | 28 (17.7%) | 12 (10.1%) |
| 65 to 69 Years | 8 (5.1%) | 6 (5.0%) |
| 70 to 74 Years | 5 (3.2%) | 6 (5.0%) |
| 75 to 79 Years | 7 (4.4%) | 7 (5.9%) |
| 80 to 84 Years | 9 (5.7%) | 6 (5.0%) |
| 85 Years and over | 0 (0.0%) | 2 (1.7%) |
| Total | 158 (100.0%) | 119 (100.0%) |
Families and Households in Esperance
Median Family Size in Esperance
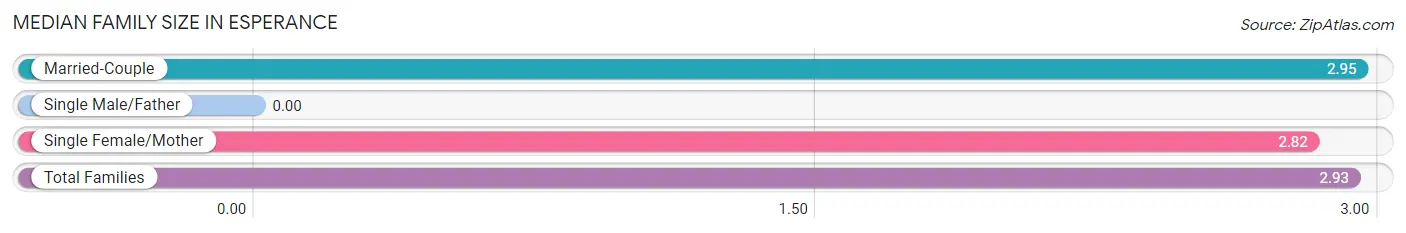
| Family Type | # Families | Family Size |
| Married-Couple | 57 (83.8%) | 2.95 |
| Single Male/Father | 0 (0.0%) | - |
| Single Female/Mother | 11 (16.2%) | 2.82 |
| Total Families | 68 (100.0%) | 2.93 |
Median Household Size in Esperance
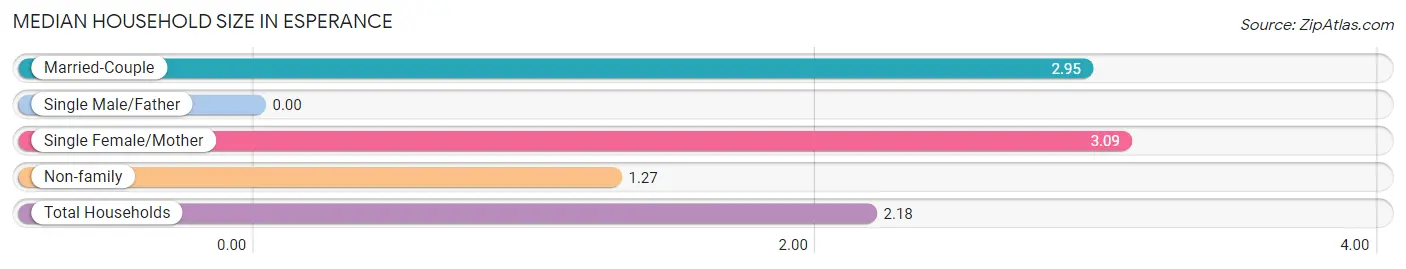
| Household Type | # Households | Household Size |
| Married-Couple | 57 (44.9%) | 2.95 |
| Single Male/Father | 0 (0.0%) | - |
| Single Female/Mother | 11 (8.7%) | 3.09 |
| Non-family | 59 (46.5%) | 1.27 |
| Total Households | 127 (100.0%) | 2.18 |
Household Size by Marriage Status in Esperance
Out of a total of 127 households in Esperance, 68 (53.5%) are family households, while 59 (46.5%) are nonfamily households. The most numerous type of family households are 2-person households, comprising 33, and the most common type of nonfamily households are 1-person households, comprising 45.
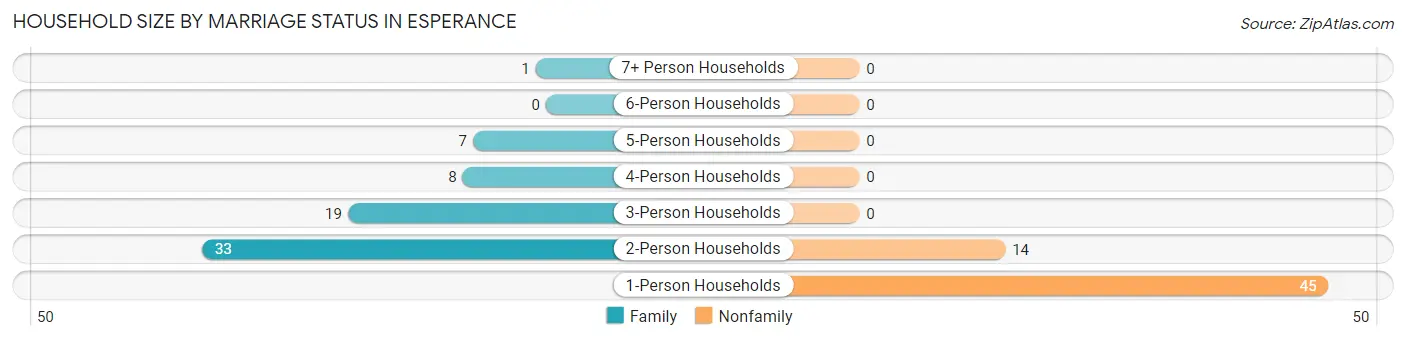
| Household Size | Family Households | Nonfamily Households |
| 1-Person Households | - | 45 (35.4%) |
| 2-Person Households | 33 (26.0%) | 14 (11.0%) |
| 3-Person Households | 19 (15.0%) | 0 (0.0%) |
| 4-Person Households | 8 (6.3%) | 0 (0.0%) |
| 5-Person Households | 7 (5.5%) | 0 (0.0%) |
| 6-Person Households | 0 (0.0%) | 0 (0.0%) |
| 7+ Person Households | 1 (0.8%) | 0 (0.0%) |
| Total | 68 (53.5%) | 59 (46.5%) |
Female Fertility in Esperance
Fertility by Age in Esperance
| Age Bracket | Women with Births | Births / 1,000 Women |
| 15 to 19 years | 0 (0.0%) | 0.0 |
| 20 to 34 years | 0 (0.0%) | 0.0 |
| 35 to 50 years | 0 (0.0%) | 0.0 |
| Total | 0 (0.0%) | 0.0 |
Fertility by Age by Marriage Status in Esperance
| Age Bracket | Married | Unmarried |
| 15 to 19 years | 0 (0.0%) | 0 (0.0%) |
| 20 to 34 years | 0 (0.0%) | 0 (0.0%) |
| 35 to 50 years | 0 (0.0%) | 0 (0.0%) |
| Total | 0 (0.0%) | 0 (0.0%) |
Fertility by Education in Esperance
| Educational Attainment | Women with Births | Births / 1,000 Women |
| Less than High School | 0 (0.0%) | 0.0 |
| High School Diploma | 0 (0.0%) | 0.0 |
| College or Associate's Degree | 0 (0.0%) | 0.0 |
| Bachelor's Degree | 0 (0.0%) | 0.0 |
| Graduate Degree | 0 (0.0%) | 0.0 |
| Total | 0 (0.0%) | 0.0 |
Fertility by Education by Marriage Status in Esperance
| Educational Attainment | Married | Unmarried |
| Less than High School | 0 (0.0%) | 0 (0.0%) |
| High School Diploma | 0 (0.0%) | 0 (0.0%) |
| College or Associate's Degree | 0 (0.0%) | 0 (0.0%) |
| Bachelor's Degree | 0 (0.0%) | 0 (0.0%) |
| Graduate Degree | 0 (0.0%) | 0 (0.0%) |
| Total | 0 (0.0%) | 0 (0.0%) |
Employment Characteristics in Esperance
Employment by Class of Employer in Esperance
Among the 136 employed individuals in Esperance, private company employees (97 | 71.3%), self-employed (incorporated) (10 | 7.3%), and self-employed (not incorporated) (10 | 7.3%) make up the most common classes of employment.
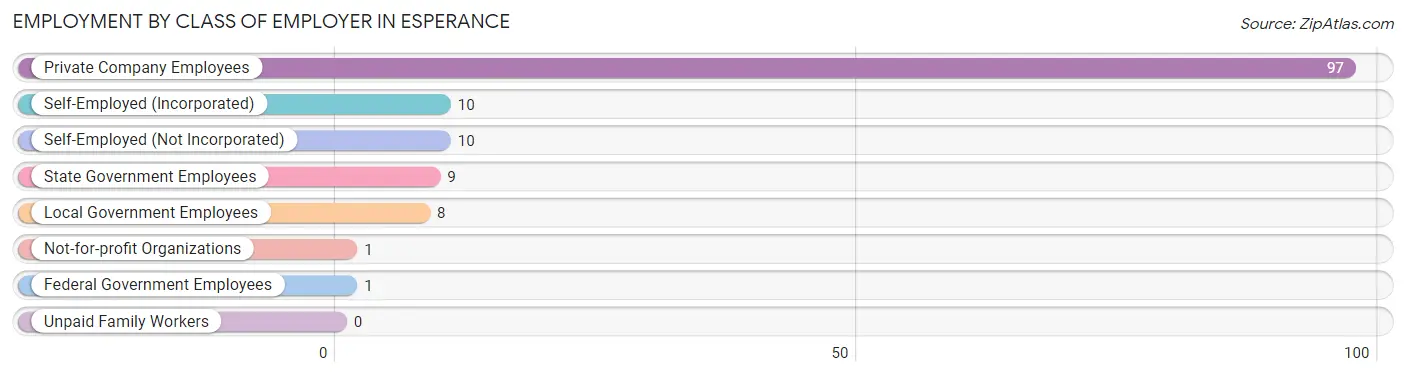
| Employer Class | # Employees | % Employees |
| Private Company Employees | 97 | 71.3% |
| Self-Employed (Incorporated) | 10 | 7.3% |
| Self-Employed (Not Incorporated) | 10 | 7.3% |
| Not-for-profit Organizations | 1 | 0.7% |
| Local Government Employees | 8 | 5.9% |
| State Government Employees | 9 | 6.6% |
| Federal Government Employees | 1 | 0.7% |
| Unpaid Family Workers | 0 | 0.0% |
| Total | 136 | 100.0% |
Employment Status by Age in Esperance
According to the labor force statistics for Esperance, out of the total population over 16 years of age (246), 56.9% or 140 individuals are in the labor force, with 2.9% or 4 of them unemployed. The age group with the highest labor force participation rate is 20 to 24 years, with 100.0% or 6 individuals in the labor force. Within the labor force, the 35 to 44 years age range has the highest percentage of unemployed individuals, with 20.0% or 3 of them being unemployed.
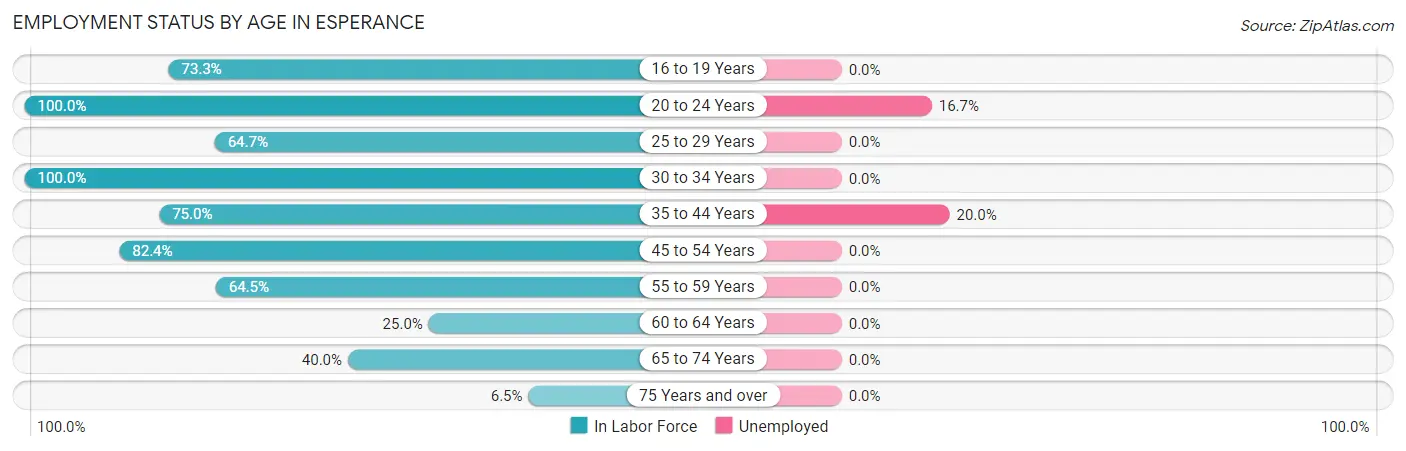
| Age Bracket | In Labor Force | Unemployed |
| 16 to 19 Years | 11 (73.3%) | 0 (0.0%) |
| 20 to 24 Years | 6 (100.0%) | 1 (16.7%) |
| 25 to 29 Years | 11 (64.7%) | 0 (0.0%) |
| 30 to 34 Years | 27 (100.0%) | 0 (0.0%) |
| 35 to 44 Years | 15 (75.0%) | 3 (20.0%) |
| 45 to 54 Years | 28 (82.4%) | 0 (0.0%) |
| 55 to 59 Years | 20 (64.5%) | 0 (0.0%) |
| 60 to 64 Years | 10 (25.0%) | 0 (0.0%) |
| 65 to 74 Years | 10 (40.0%) | 0 (0.0%) |
| 75 Years and over | 2 (6.5%) | 0 (0.0%) |
| Total | 140 (56.9%) | 4 (2.9%) |
Employment Status by Educational Attainment in Esperance
According to labor force statistics for Esperance, 65.7% of individuals (111) out of the total population between 25 and 64 years of age (169) are in the labor force, with 2.7% or 3 of them being unemployed. The group with the highest labor force participation rate are those with the educational attainment of bachelor's degree or higher, with 100.0% or 10 individuals in the labor force. Within the labor force, individuals with college / associate degree education have the highest percentage of unemployment, with 4.3% or 3 of them being unemployed.
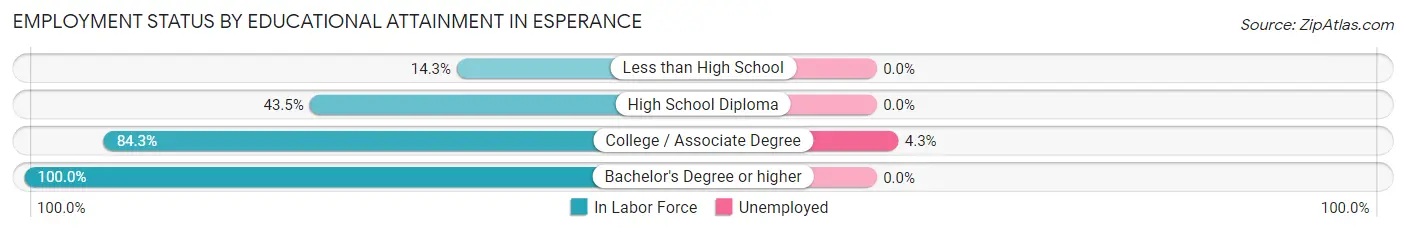
| Educational Attainment | In Labor Force | Unemployed |
| Less than High School | 1 (14.3%) | 0 (0.0%) |
| High School Diploma | 30 (43.5%) | 0 (0.0%) |
| College / Associate Degree | 70 (84.3%) | 4 (4.3%) |
| Bachelor's Degree or higher | 10 (100.0%) | 0 (0.0%) |
| Total | 111 (65.7%) | 5 (2.7%) |
Employment Occupations by Sex in Esperance
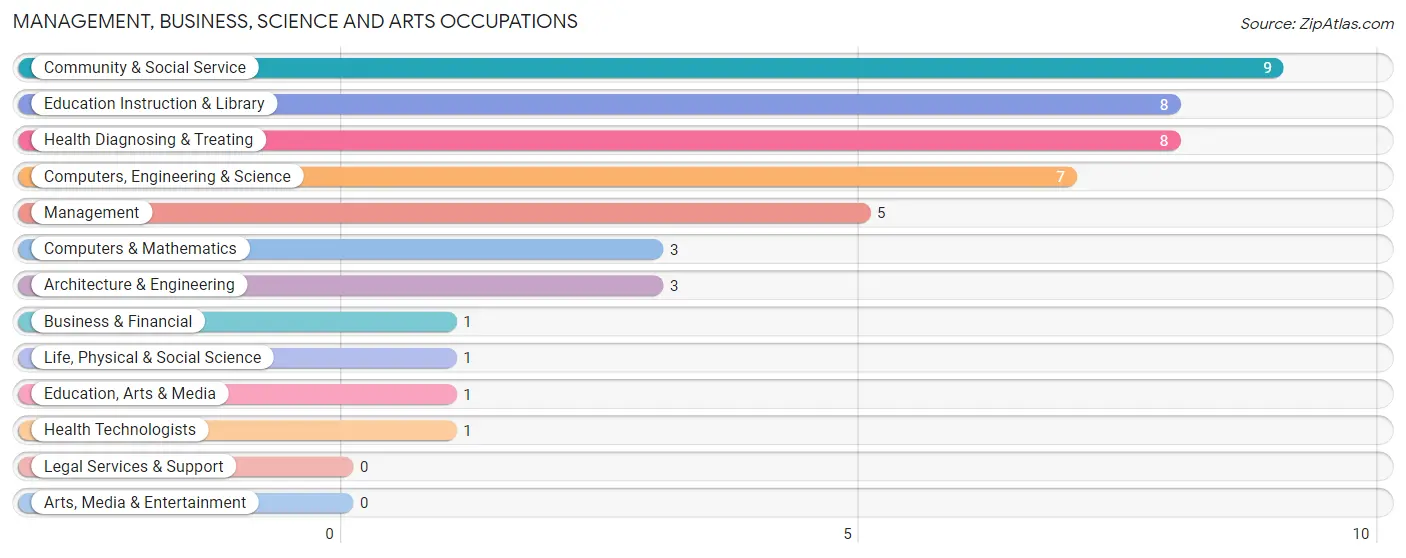
Management, Business, Science and Arts Occupations
The most common Management, Business, Science and Arts occupations in Esperance are Community & Social Service (9 | 6.6%), Education Instruction & Library (8 | 5.9%), Health Diagnosing & Treating (8 | 5.9%), Computers, Engineering & Science (7 | 5.1%), and Management (5 | 3.7%).
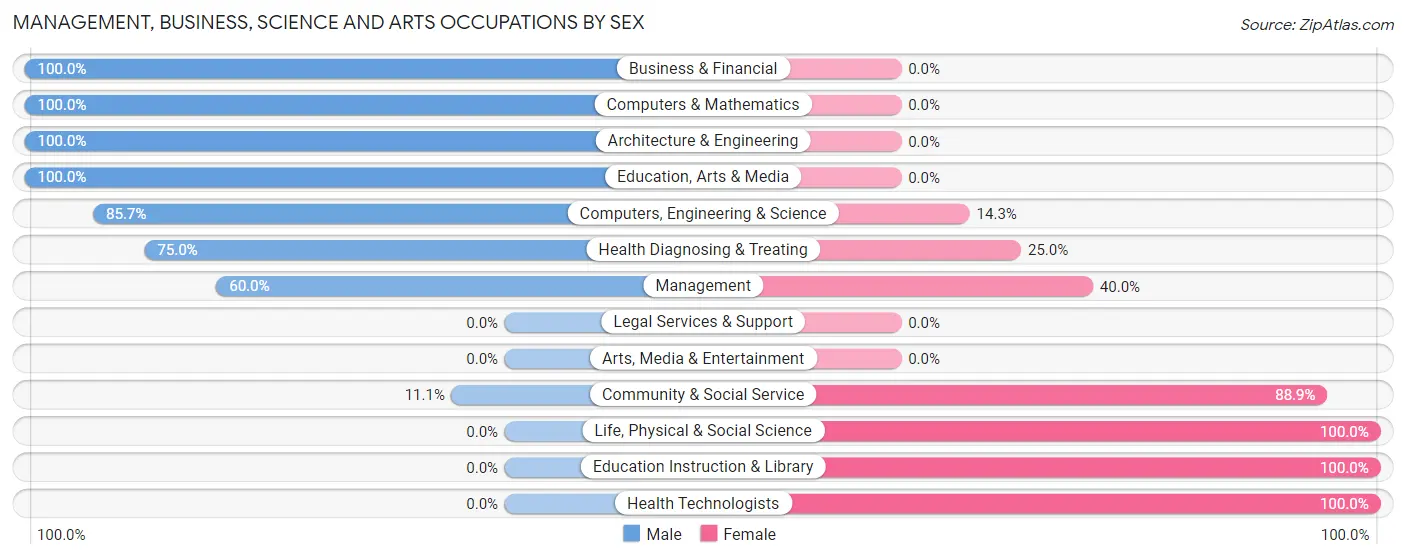
Management, Business, Science and Arts Occupations by Sex
Within the Management, Business, Science and Arts occupations in Esperance, the most male-oriented occupations are Business & Financial (100.0%), Computers & Mathematics (100.0%), and Architecture & Engineering (100.0%), while the most female-oriented occupations are Life, Physical & Social Science (100.0%), Education Instruction & Library (100.0%), and Health Technologists (100.0%).
| Occupation | Male | Female |
| Management | 3 (60.0%) | 2 (40.0%) |
| Business & Financial | 1 (100.0%) | 0 (0.0%) |
| Computers, Engineering & Science | 6 (85.7%) | 1 (14.3%) |
| Computers & Mathematics | 3 (100.0%) | 0 (0.0%) |
| Architecture & Engineering | 3 (100.0%) | 0 (0.0%) |
| Life, Physical & Social Science | 0 (0.0%) | 1 (100.0%) |
| Community & Social Service | 1 (11.1%) | 8 (88.9%) |
| Education, Arts & Media | 1 (100.0%) | 0 (0.0%) |
| Legal Services & Support | 0 (0.0%) | 0 (0.0%) |
| Education Instruction & Library | 0 (0.0%) | 8 (100.0%) |
| Arts, Media & Entertainment | 0 (0.0%) | 0 (0.0%) |
| Health Diagnosing & Treating | 6 (75.0%) | 2 (25.0%) |
| Health Technologists | 0 (0.0%) | 1 (100.0%) |
| Total (Category) | 17 (56.7%) | 13 (43.3%) |
| Total (Overall) | 79 (58.1%) | 57 (41.9%) |
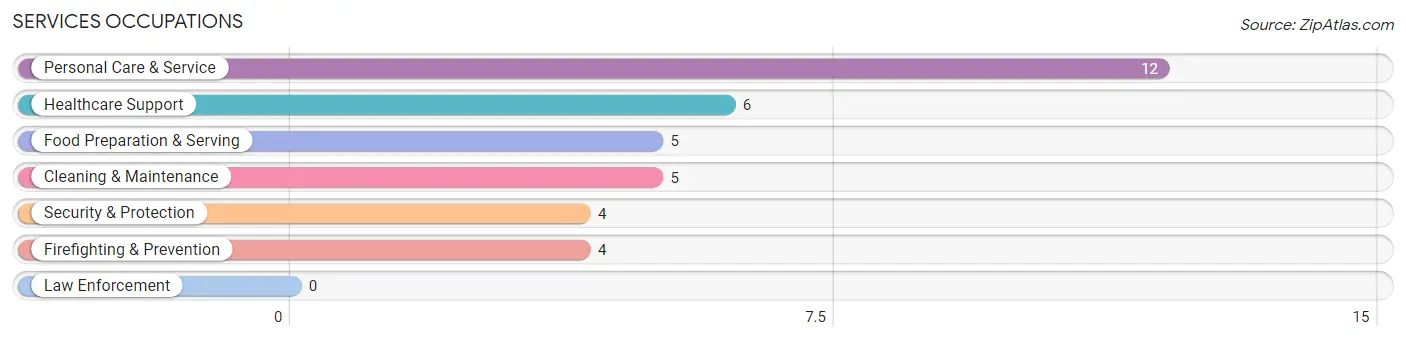
Services Occupations
The most common Services occupations in Esperance are Personal Care & Service (12 | 8.8%), Healthcare Support (6 | 4.4%), Food Preparation & Serving (5 | 3.7%), Cleaning & Maintenance (5 | 3.7%), and Security & Protection (4 | 2.9%).
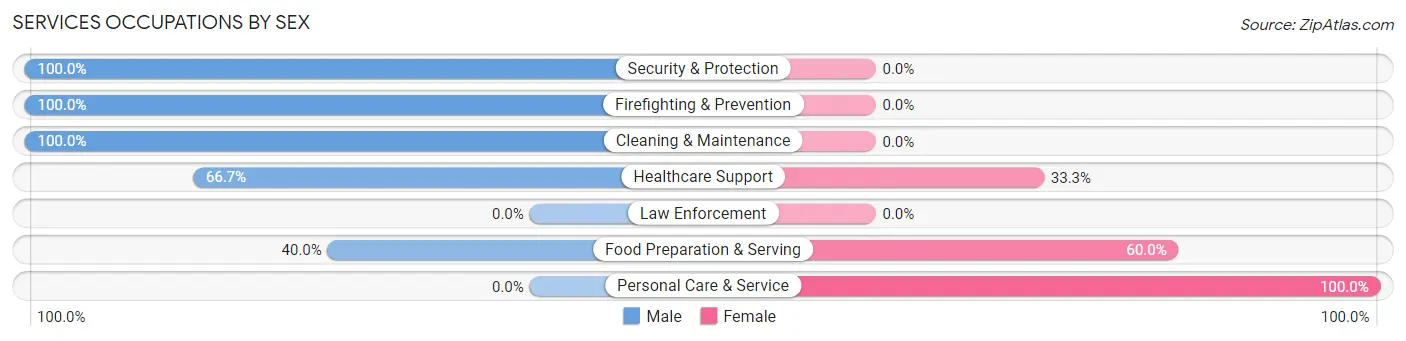
Services Occupations by Sex
Within the Services occupations in Esperance, the most male-oriented occupations are Security & Protection (100.0%), Firefighting & Prevention (100.0%), and Cleaning & Maintenance (100.0%), while the most female-oriented occupations are Personal Care & Service (100.0%), Food Preparation & Serving (60.0%), and Healthcare Support (33.3%).
| Occupation | Male | Female |
| Healthcare Support | 4 (66.7%) | 2 (33.3%) |
| Security & Protection | 4 (100.0%) | 0 (0.0%) |
| Firefighting & Prevention | 4 (100.0%) | 0 (0.0%) |
| Law Enforcement | 0 (0.0%) | 0 (0.0%) |
| Food Preparation & Serving | 2 (40.0%) | 3 (60.0%) |
| Cleaning & Maintenance | 5 (100.0%) | 0 (0.0%) |
| Personal Care & Service | 0 (0.0%) | 12 (100.0%) |
| Total (Category) | 15 (46.9%) | 17 (53.1%) |
| Total (Overall) | 79 (58.1%) | 57 (41.9%) |
Sales and Office Occupations
The most common Sales and Office occupations in Esperance are Office & Administration (19 | 14.0%), and Sales & Related (10 | 7.3%).
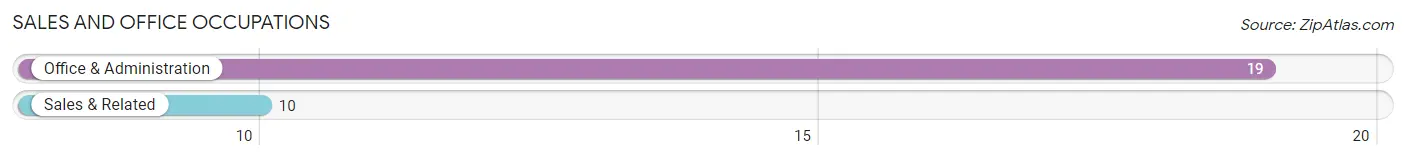
Sales and Office Occupations by Sex
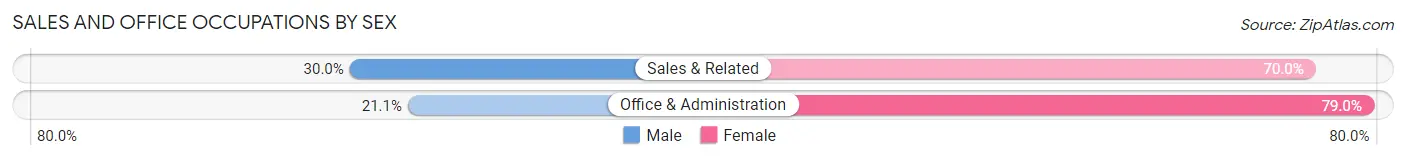
| Occupation | Male | Female |
| Sales & Related | 3 (30.0%) | 7 (70.0%) |
| Office & Administration | 4 (21.0%) | 15 (78.9%) |
| Total (Category) | 7 (24.1%) | 22 (75.9%) |
| Total (Overall) | 79 (58.1%) | 57 (41.9%) |
Natural Resources, Construction and Maintenance Occupations
The most common Natural Resources, Construction and Maintenance occupations in Esperance are Construction & Extraction (10 | 7.3%), Installation, Maintenance & Repair (6 | 4.4%), and Farming, Fishing & Forestry (3 | 2.2%).
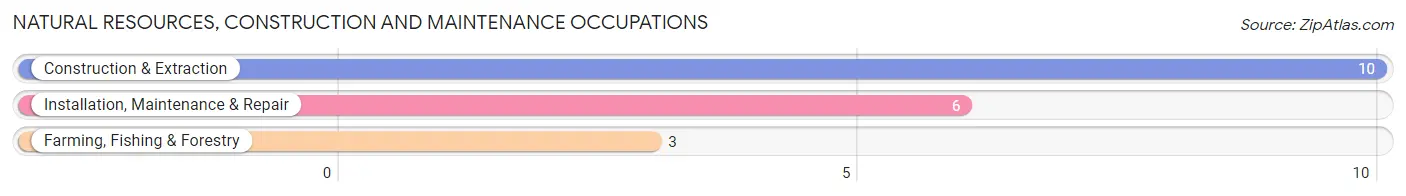
Natural Resources, Construction and Maintenance Occupations by Sex
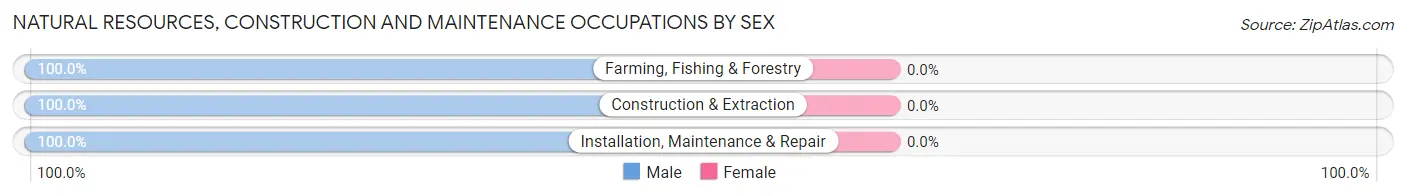
| Occupation | Male | Female |
| Farming, Fishing & Forestry | 3 (100.0%) | 0 (0.0%) |
| Construction & Extraction | 10 (100.0%) | 0 (0.0%) |
| Installation, Maintenance & Repair | 6 (100.0%) | 0 (0.0%) |
| Total (Category) | 19 (100.0%) | 0 (0.0%) |
| Total (Overall) | 79 (58.1%) | 57 (41.9%) |
Production, Transportation and Moving Occupations
The most common Production, Transportation and Moving occupations in Esperance are Production (17 | 12.5%), and Material Moving (9 | 6.6%).
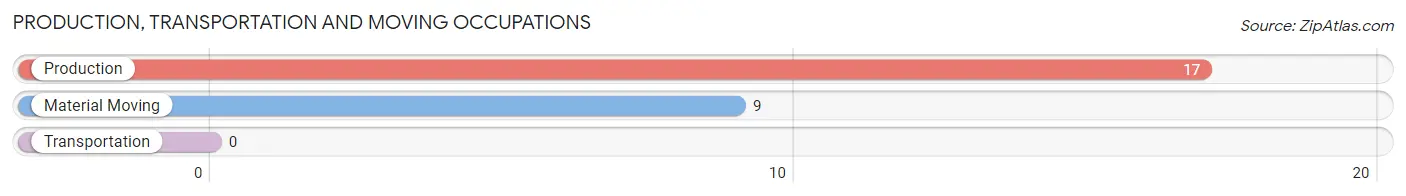
Production, Transportation and Moving Occupations by Sex
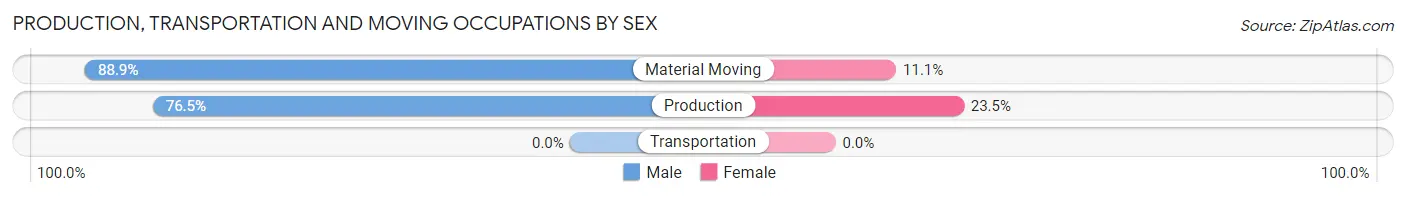
| Occupation | Male | Female |
| Production | 13 (76.5%) | 4 (23.5%) |
| Transportation | 0 (0.0%) | 0 (0.0%) |
| Material Moving | 8 (88.9%) | 1 (11.1%) |
| Total (Category) | 21 (80.8%) | 5 (19.2%) |
| Total (Overall) | 79 (58.1%) | 57 (41.9%) |
Employment Industries by Sex in Esperance
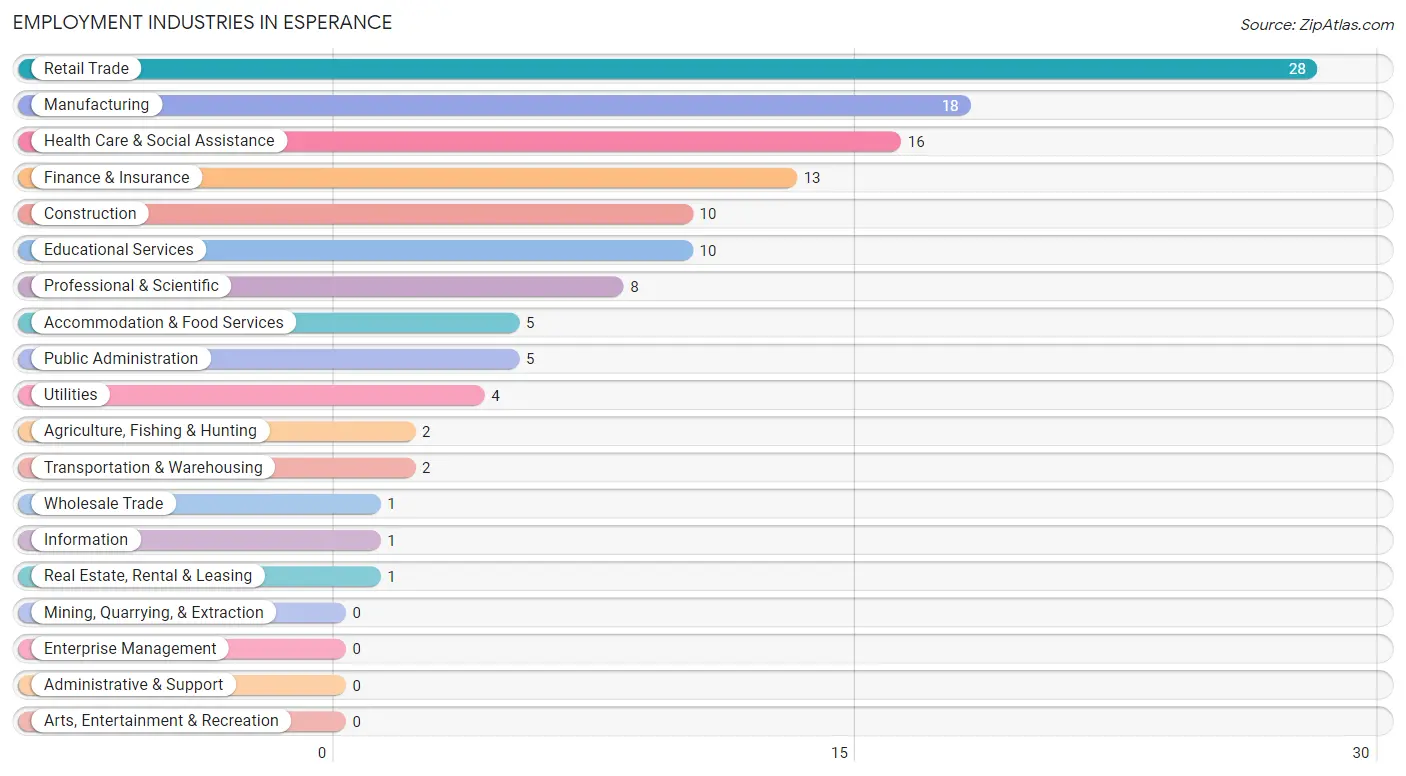
Employment Industries in Esperance
The major employment industries in Esperance include Retail Trade (28 | 20.6%), Manufacturing (18 | 13.2%), Health Care & Social Assistance (16 | 11.8%), Finance & Insurance (13 | 9.6%), and Construction (10 | 7.3%).
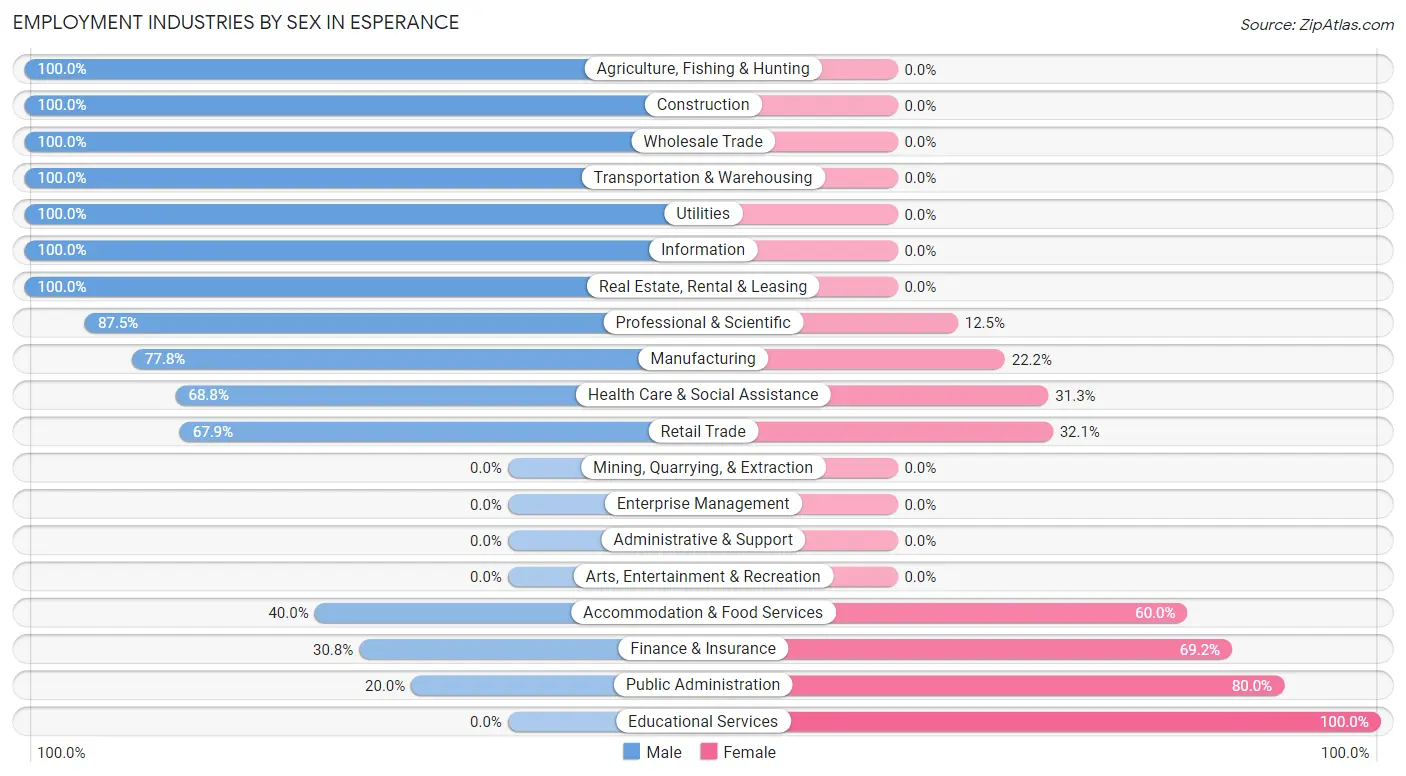
Employment Industries by Sex in Esperance
The Esperance industries that see more men than women are Agriculture, Fishing & Hunting (100.0%), Construction (100.0%), and Wholesale Trade (100.0%), whereas the industries that tend to have a higher number of women are Educational Services (100.0%), Public Administration (80.0%), and Finance & Insurance (69.2%).
| Industry | Male | Female |
| Agriculture, Fishing & Hunting | 2 (100.0%) | 0 (0.0%) |
| Mining, Quarrying, & Extraction | 0 (0.0%) | 0 (0.0%) |
| Construction | 10 (100.0%) | 0 (0.0%) |
| Manufacturing | 14 (77.8%) | 4 (22.2%) |
| Wholesale Trade | 1 (100.0%) | 0 (0.0%) |
| Retail Trade | 19 (67.9%) | 9 (32.1%) |
| Transportation & Warehousing | 2 (100.0%) | 0 (0.0%) |
| Utilities | 4 (100.0%) | 0 (0.0%) |
| Information | 1 (100.0%) | 0 (0.0%) |
| Finance & Insurance | 4 (30.8%) | 9 (69.2%) |
| Real Estate, Rental & Leasing | 1 (100.0%) | 0 (0.0%) |
| Professional & Scientific | 7 (87.5%) | 1 (12.5%) |
| Enterprise Management | 0 (0.0%) | 0 (0.0%) |
| Administrative & Support | 0 (0.0%) | 0 (0.0%) |
| Educational Services | 0 (0.0%) | 10 (100.0%) |
| Health Care & Social Assistance | 11 (68.8%) | 5 (31.2%) |
| Arts, Entertainment & Recreation | 0 (0.0%) | 0 (0.0%) |
| Accommodation & Food Services | 2 (40.0%) | 3 (60.0%) |
| Public Administration | 1 (20.0%) | 4 (80.0%) |
| Total | 79 (58.1%) | 57 (41.9%) |
Education in Esperance
School Enrollment in Esperance
The most common levels of schooling among the 39 students in Esperance are high school (22 | 56.4%), middle school (12 | 30.8%), and nursery / preschool (2 | 5.1%).
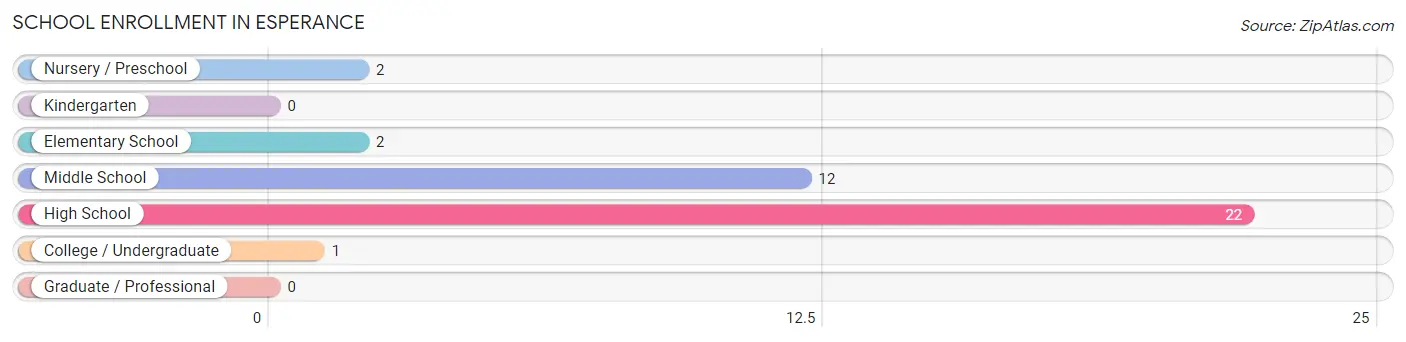
| School Level | # Students | % Students |
| Nursery / Preschool | 2 | 5.1% |
| Kindergarten | 0 | 0.0% |
| Elementary School | 2 | 5.1% |
| Middle School | 12 | 30.8% |
| High School | 22 | 56.4% |
| College / Undergraduate | 1 | 2.6% |
| Graduate / Professional | 0 | 0.0% |
| Total | 39 | 100.0% |
School Enrollment by Age by Funding Source in Esperance
Out of a total of 39 students who are enrolled in schools in Esperance, 3 (7.7%) attend a private institution, while the remaining 36 (92.3%) are enrolled in public schools. The age group of 20 to 24 year olds has the highest likelihood of being enrolled in private schools, with 1 (100.0% in the age bracket) enrolled. Conversely, the age group of 3 to 4 year olds has the lowest likelihood of being enrolled in a private school, with 2 (100.0% in the age bracket) attending a public institution.
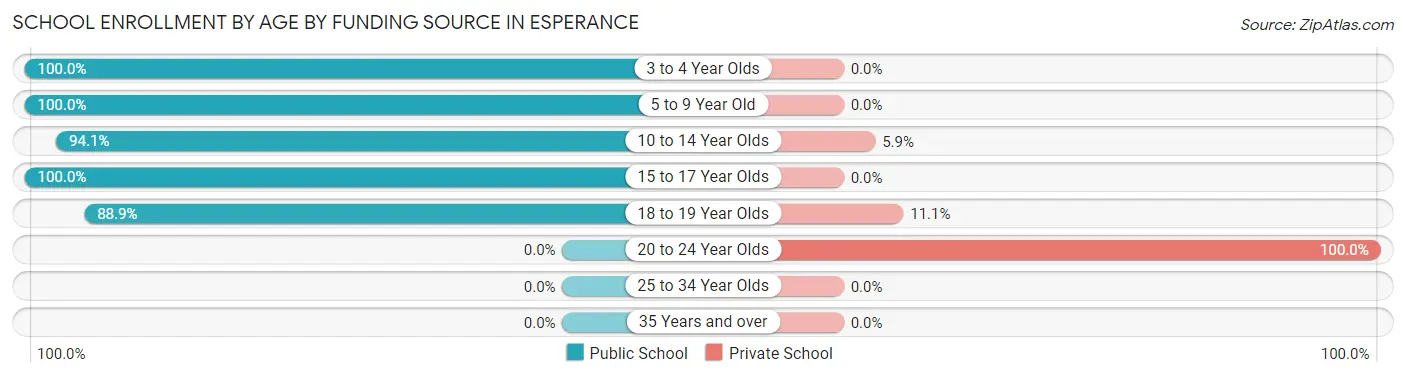
| Age Bracket | Public School | Private School |
| 3 to 4 Year Olds | 2 (100.0%) | 0 (0.0%) |
| 5 to 9 Year Old | 2 (100.0%) | 0 (0.0%) |
| 10 to 14 Year Olds | 16 (94.1%) | 1 (5.9%) |
| 15 to 17 Year Olds | 8 (100.0%) | 0 (0.0%) |
| 18 to 19 Year Olds | 8 (88.9%) | 1 (11.1%) |
| 20 to 24 Year Olds | 0 (0.0%) | 1 (100.0%) |
| 25 to 34 Year Olds | 0 (0.0%) | 0 (0.0%) |
| 35 Years and over | 0 (0.0%) | 0 (0.0%) |
| Total | 36 (92.3%) | 3 (7.7%) |
Educational Attainment by Field of Study in Esperance
Business (5 | 19.2%), communications (5 | 19.2%), social sciences (4 | 15.4%), education (3 | 11.5%), and science & technology (2 | 7.7%) are the most common fields of study among 26 individuals in Esperance who have obtained a bachelor's degree or higher.
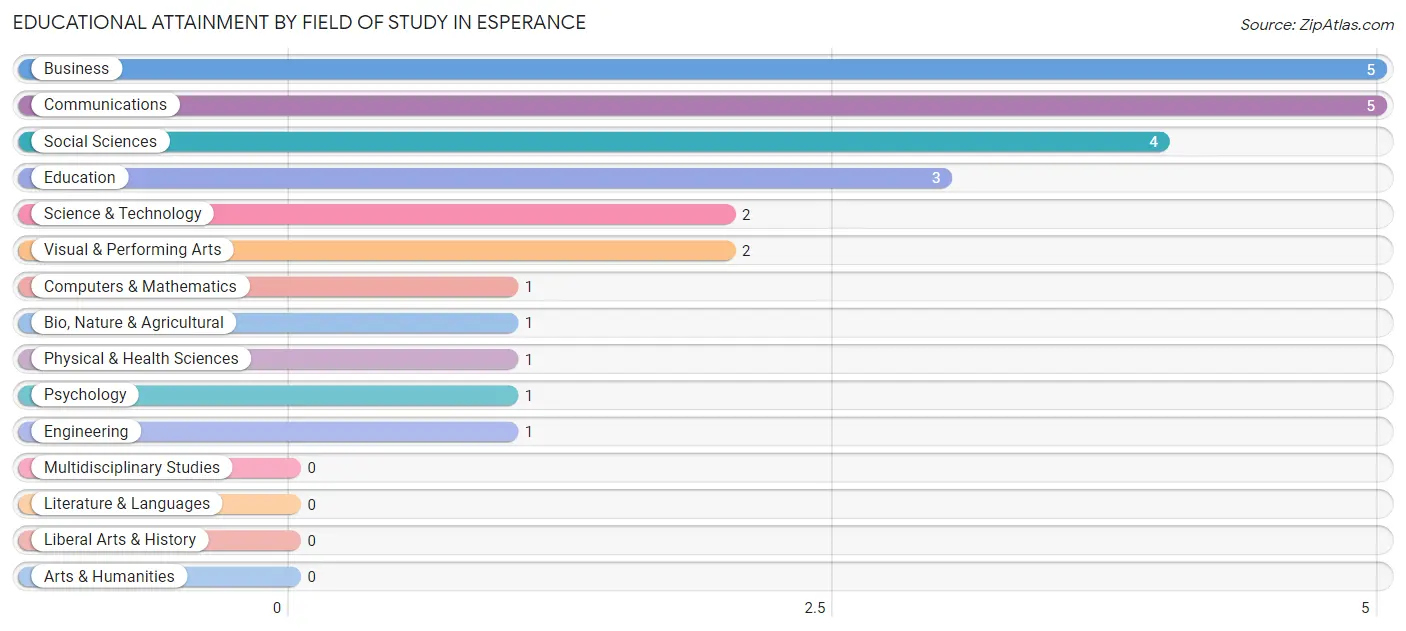
| Field of Study | # Graduates | % Graduates |
| Computers & Mathematics | 1 | 3.8% |
| Bio, Nature & Agricultural | 1 | 3.8% |
| Physical & Health Sciences | 1 | 3.8% |
| Psychology | 1 | 3.8% |
| Social Sciences | 4 | 15.4% |
| Engineering | 1 | 3.8% |
| Multidisciplinary Studies | 0 | 0.0% |
| Science & Technology | 2 | 7.7% |
| Business | 5 | 19.2% |
| Education | 3 | 11.5% |
| Literature & Languages | 0 | 0.0% |
| Liberal Arts & History | 0 | 0.0% |
| Visual & Performing Arts | 2 | 7.7% |
| Communications | 5 | 19.2% |
| Arts & Humanities | 0 | 0.0% |
| Total | 26 | 100.0% |
Transportation & Commute in Esperance
Vehicle Availability by Sex in Esperance
The most prevalent vehicle ownership categories in Esperance are males with 2 vehicles (42, accounting for 53.2%) and females with 2 vehicles (28, making up 73.7%).
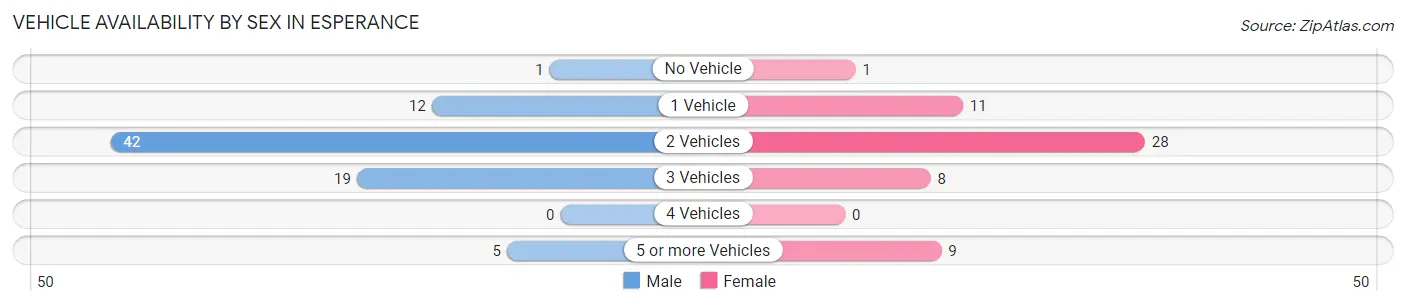
| Vehicles Available | Male | Female |
| No Vehicle | 1 (1.3%) | 1 (1.8%) |
| 1 Vehicle | 12 (15.2%) | 11 (19.3%) |
| 2 Vehicles | 42 (53.2%) | 28 (49.1%) |
| 3 Vehicles | 19 (24.0%) | 8 (14.0%) |
| 4 Vehicles | 0 (0.0%) | 0 (0.0%) |
| 5 or more Vehicles | 5 (6.3%) | 9 (15.8%) |
| Total | 79 (100.0%) | 57 (100.0%) |
Commute Time in Esperance
The most frequently occuring commute durations in Esperance are 20 to 24 minutes (26 commuters, 21.3%), 25 to 29 minutes (22 commuters, 18.0%), and 35 to 39 minutes (17 commuters, 13.9%).
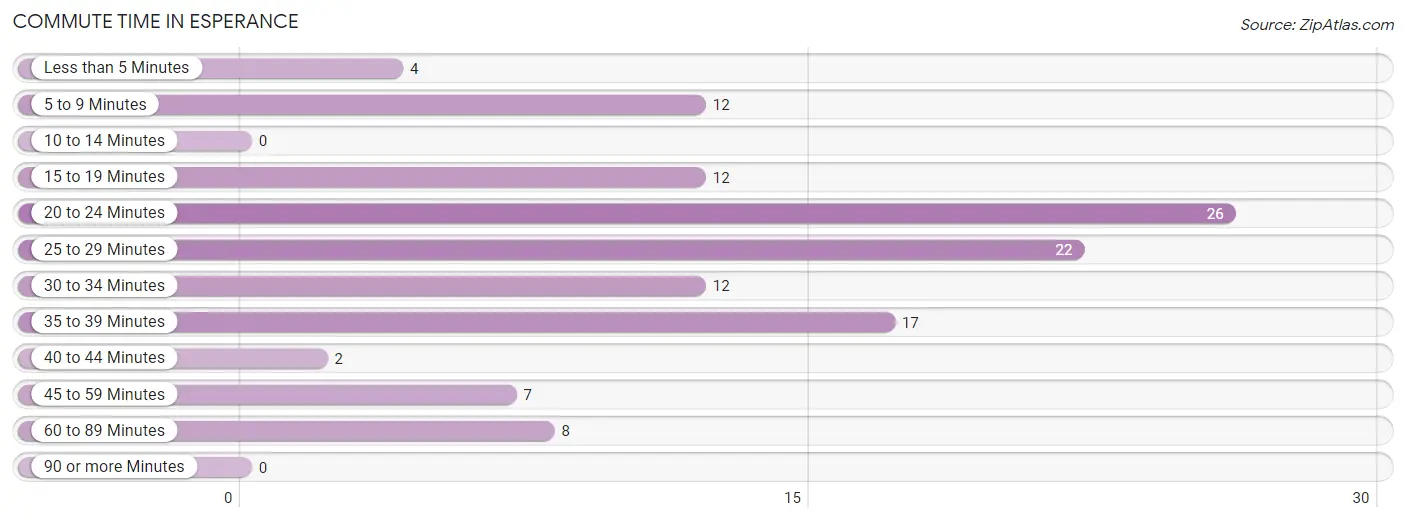
| Commute Time | # Commuters | % Commuters |
| Less than 5 Minutes | 4 | 3.3% |
| 5 to 9 Minutes | 12 | 9.8% |
| 10 to 14 Minutes | 0 | 0.0% |
| 15 to 19 Minutes | 12 | 9.8% |
| 20 to 24 Minutes | 26 | 21.3% |
| 25 to 29 Minutes | 22 | 18.0% |
| 30 to 34 Minutes | 12 | 9.8% |
| 35 to 39 Minutes | 17 | 13.9% |
| 40 to 44 Minutes | 2 | 1.6% |
| 45 to 59 Minutes | 7 | 5.7% |
| 60 to 89 Minutes | 8 | 6.6% |
| 90 or more Minutes | 0 | 0.0% |
Commute Time by Sex in Esperance
The most common commute times in Esperance are 20 to 24 minutes (16 commuters, 22.5%) for males and 25 to 29 minutes (19 commuters, 37.2%) for females.
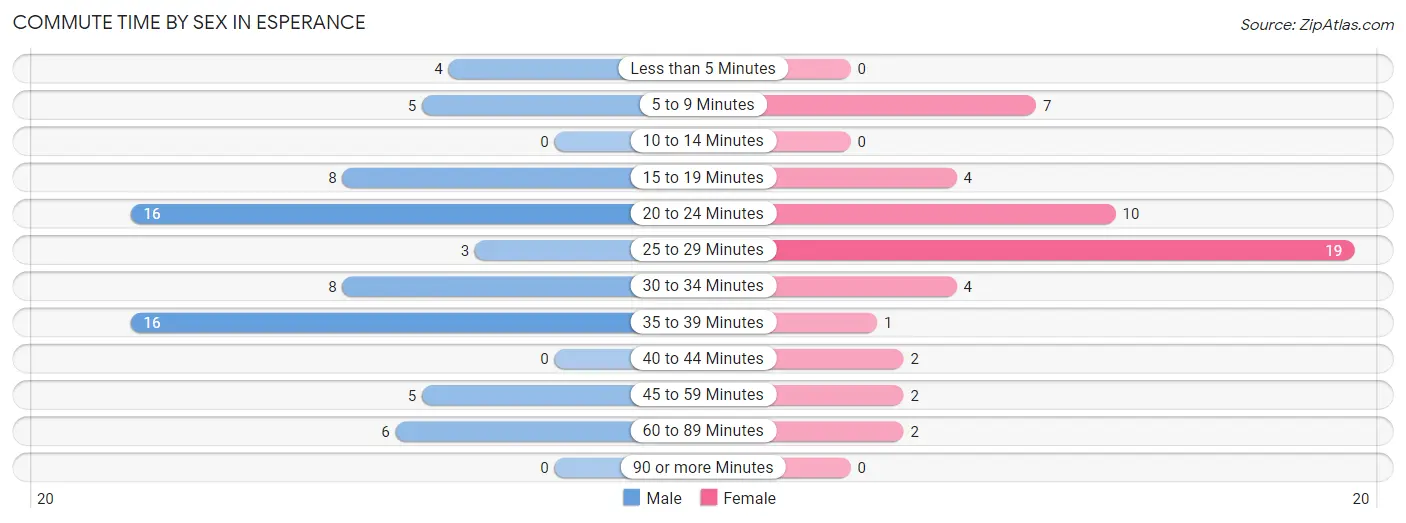
| Commute Time | Male | Female |
| Less than 5 Minutes | 4 (5.6%) | 0 (0.0%) |
| 5 to 9 Minutes | 5 (7.0%) | 7 (13.7%) |
| 10 to 14 Minutes | 0 (0.0%) | 0 (0.0%) |
| 15 to 19 Minutes | 8 (11.3%) | 4 (7.8%) |
| 20 to 24 Minutes | 16 (22.5%) | 10 (19.6%) |
| 25 to 29 Minutes | 3 (4.2%) | 19 (37.2%) |
| 30 to 34 Minutes | 8 (11.3%) | 4 (7.8%) |
| 35 to 39 Minutes | 16 (22.5%) | 1 (2.0%) |
| 40 to 44 Minutes | 0 (0.0%) | 2 (3.9%) |
| 45 to 59 Minutes | 5 (7.0%) | 2 (3.9%) |
| 60 to 89 Minutes | 6 (8.5%) | 2 (3.9%) |
| 90 or more Minutes | 0 (0.0%) | 0 (0.0%) |
Time of Departure to Work by Sex in Esperance
The most frequent times of departure to work in Esperance are 6:00 AM to 6:29 AM (12, 16.9%) for males and 7:00 AM to 7:29 AM (13, 25.5%) for females.
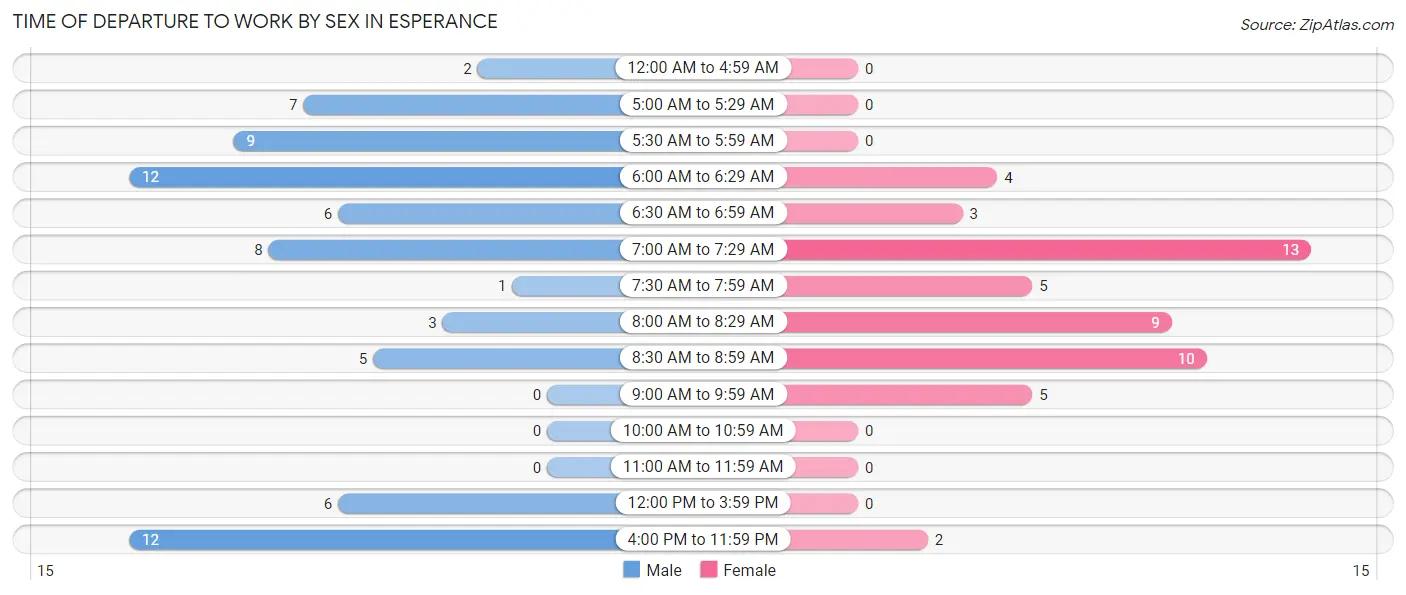
| Time of Departure | Male | Female |
| 12:00 AM to 4:59 AM | 2 (2.8%) | 0 (0.0%) |
| 5:00 AM to 5:29 AM | 7 (9.9%) | 0 (0.0%) |
| 5:30 AM to 5:59 AM | 9 (12.7%) | 0 (0.0%) |
| 6:00 AM to 6:29 AM | 12 (16.9%) | 4 (7.8%) |
| 6:30 AM to 6:59 AM | 6 (8.5%) | 3 (5.9%) |
| 7:00 AM to 7:29 AM | 8 (11.3%) | 13 (25.5%) |
| 7:30 AM to 7:59 AM | 1 (1.4%) | 5 (9.8%) |
| 8:00 AM to 8:29 AM | 3 (4.2%) | 9 (17.6%) |
| 8:30 AM to 8:59 AM | 5 (7.0%) | 10 (19.6%) |
| 9:00 AM to 9:59 AM | 0 (0.0%) | 5 (9.8%) |
| 10:00 AM to 10:59 AM | 0 (0.0%) | 0 (0.0%) |
| 11:00 AM to 11:59 AM | 0 (0.0%) | 0 (0.0%) |
| 12:00 PM to 3:59 PM | 6 (8.5%) | 0 (0.0%) |
| 4:00 PM to 11:59 PM | 12 (16.9%) | 2 (3.9%) |
| Total | 71 (100.0%) | 51 (100.0%) |
Housing Occupancy in Esperance
Occupancy by Ownership in Esperance
Of the total 127 dwellings in Esperance, owner-occupied units account for 96 (75.6%), while renter-occupied units make up 31 (24.4%).
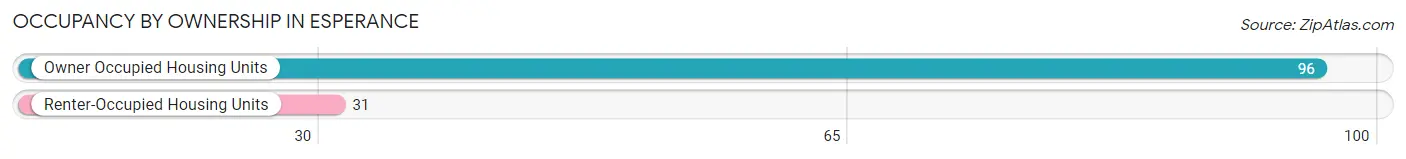
| Occupancy | # Housing Units | % Housing Units |
| Owner Occupied Housing Units | 96 | 75.6% |
| Renter-Occupied Housing Units | 31 | 24.4% |
| Total Occupied Housing Units | 127 | 100.0% |
Occupancy by Household Size in Esperance
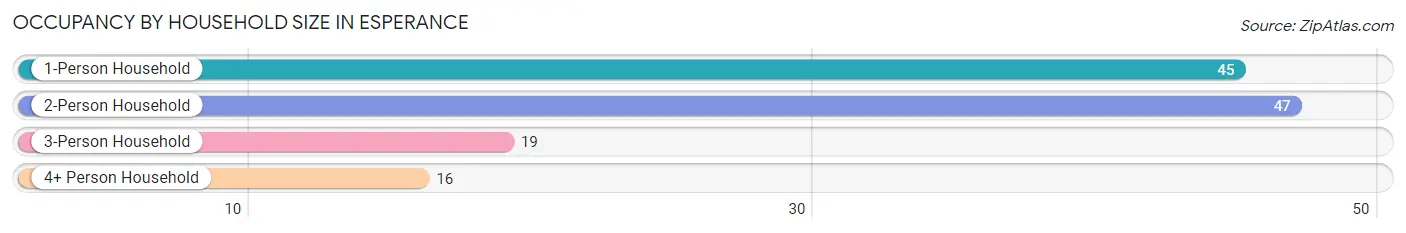
| Household Size | # Housing Units | % Housing Units |
| 1-Person Household | 45 | 35.4% |
| 2-Person Household | 47 | 37.0% |
| 3-Person Household | 19 | 15.0% |
| 4+ Person Household | 16 | 12.6% |
| Total Housing Units | 127 | 100.0% |
Occupancy by Ownership by Household Size in Esperance
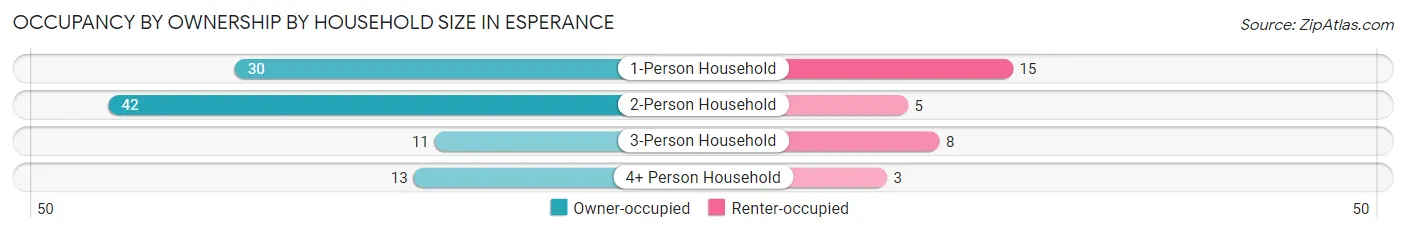
| Household Size | Owner-occupied | Renter-occupied |
| 1-Person Household | 30 (66.7%) | 15 (33.3%) |
| 2-Person Household | 42 (89.4%) | 5 (10.6%) |
| 3-Person Household | 11 (57.9%) | 8 (42.1%) |
| 4+ Person Household | 13 (81.2%) | 3 (18.8%) |
| Total Housing Units | 96 (75.6%) | 31 (24.4%) |
Occupancy by Educational Attainment in Esperance
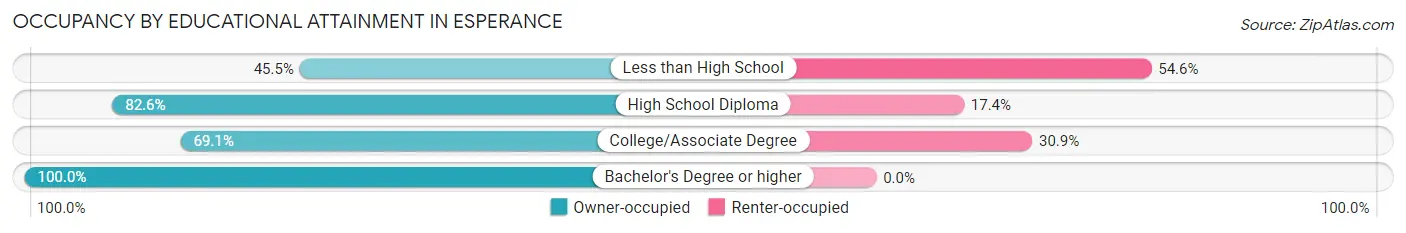
| Household Size | Owner-occupied | Renter-occupied |
| Less than High School | 5 (45.5%) | 6 (54.5%) |
| High School Diploma | 38 (82.6%) | 8 (17.4%) |
| College/Associate Degree | 38 (69.1%) | 17 (30.9%) |
| Bachelor's Degree or higher | 15 (100.0%) | 0 (0.0%) |
Occupancy by Age of Householder in Esperance
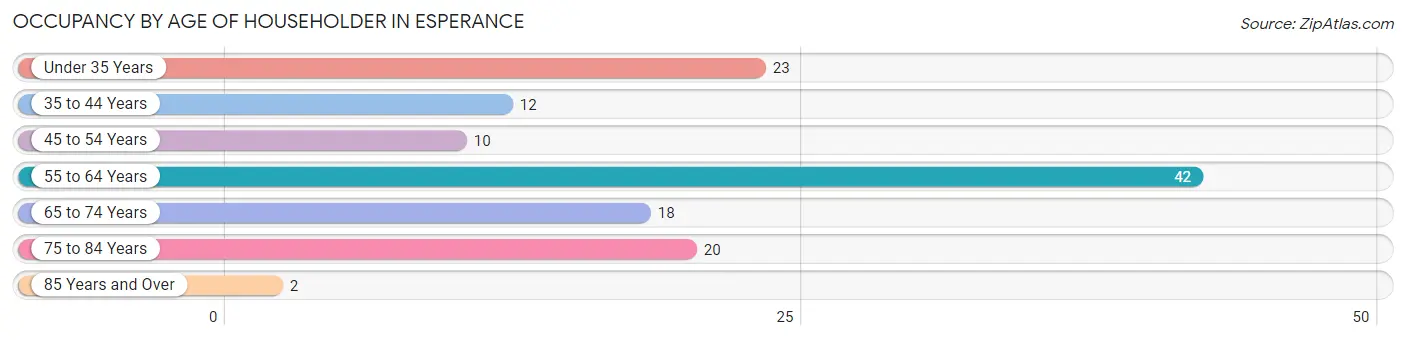
| Age Bracket | # Households | % Households |
| Under 35 Years | 23 | 18.1% |
| 35 to 44 Years | 12 | 9.5% |
| 45 to 54 Years | 10 | 7.9% |
| 55 to 64 Years | 42 | 33.1% |
| 65 to 74 Years | 18 | 14.2% |
| 75 to 84 Years | 20 | 15.8% |
| 85 Years and Over | 2 | 1.6% |
| Total | 127 | 100.0% |
Housing Finances in Esperance
Median Income by Occupancy in Esperance
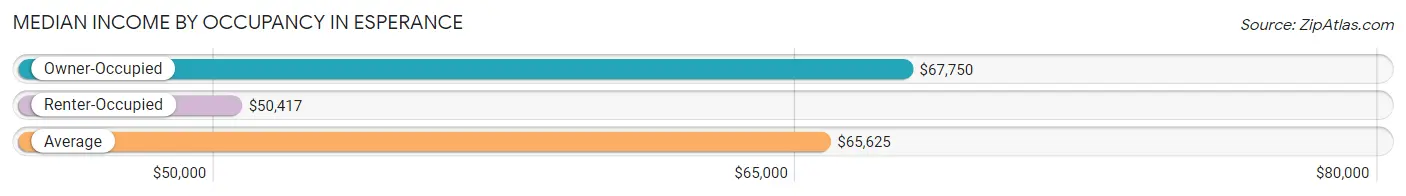
| Occupancy Type | # Households | Median Income |
| Owner-Occupied | 96 (75.6%) | $67,750 |
| Renter-Occupied | 31 (24.4%) | $50,417 |
| Average | 127 (100.0%) | $65,625 |
Occupancy by Householder Income Bracket in Esperance
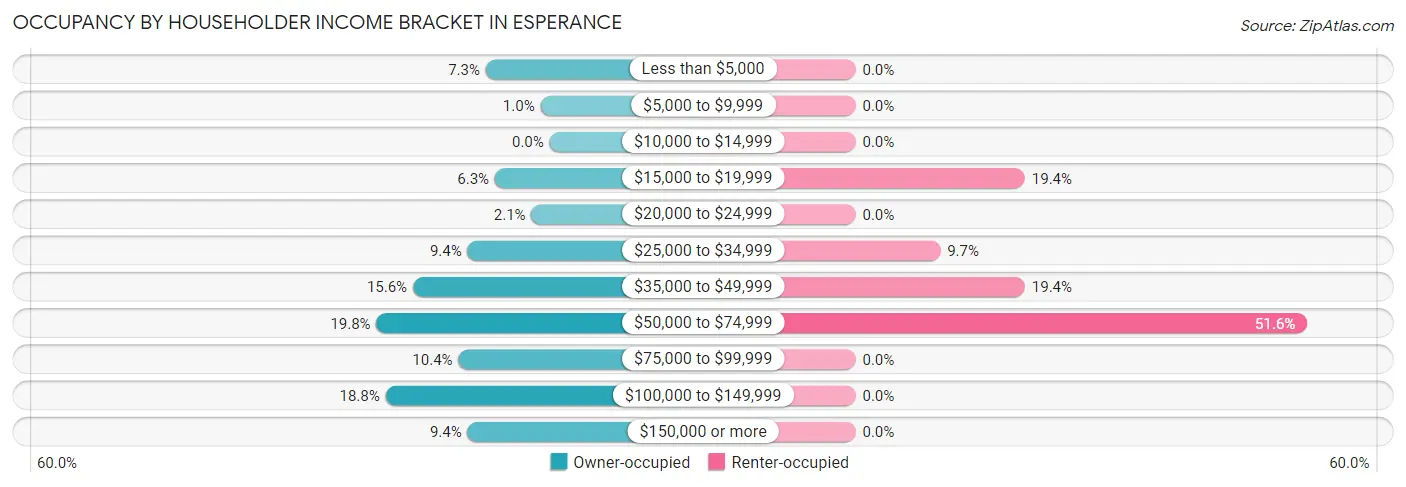
| Income Bracket | Owner-occupied | Renter-occupied |
| Less than $5,000 | 7 (7.3%) | 0 (0.0%) |
| $5,000 to $9,999 | 1 (1.0%) | 0 (0.0%) |
| $10,000 to $14,999 | 0 (0.0%) | 0 (0.0%) |
| $15,000 to $19,999 | 6 (6.2%) | 6 (19.4%) |
| $20,000 to $24,999 | 2 (2.1%) | 0 (0.0%) |
| $25,000 to $34,999 | 9 (9.4%) | 3 (9.7%) |
| $35,000 to $49,999 | 15 (15.6%) | 6 (19.4%) |
| $50,000 to $74,999 | 19 (19.8%) | 16 (51.6%) |
| $75,000 to $99,999 | 10 (10.4%) | 0 (0.0%) |
| $100,000 to $149,999 | 18 (18.8%) | 0 (0.0%) |
| $150,000 or more | 9 (9.4%) | 0 (0.0%) |
| Total | 96 (100.0%) | 31 (100.0%) |
Monthly Housing Cost Tiers in Esperance
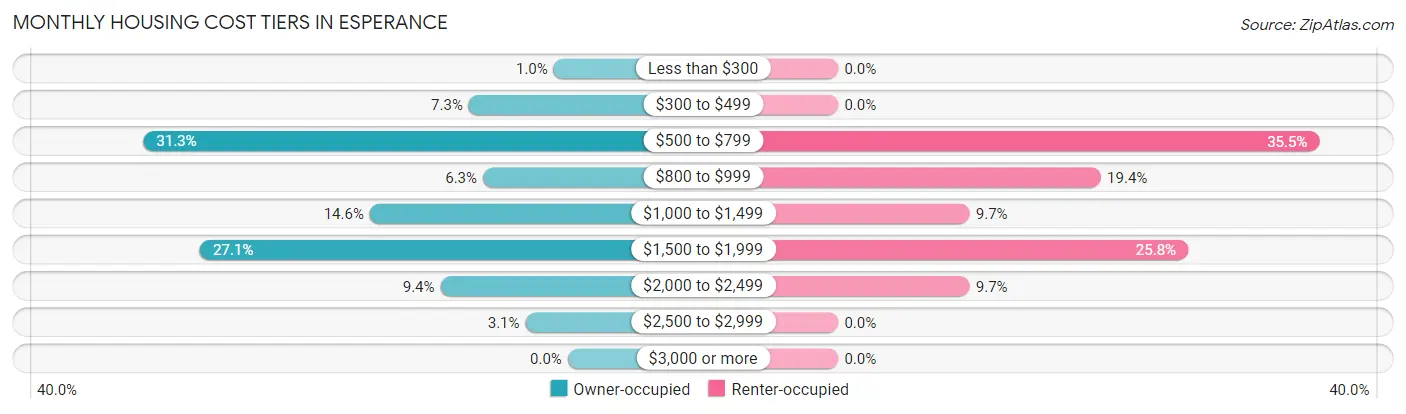
| Monthly Cost | Owner-occupied | Renter-occupied |
| Less than $300 | 1 (1.0%) | 0 (0.0%) |
| $300 to $499 | 7 (7.3%) | 0 (0.0%) |
| $500 to $799 | 30 (31.2%) | 11 (35.5%) |
| $800 to $999 | 6 (6.2%) | 6 (19.4%) |
| $1,000 to $1,499 | 14 (14.6%) | 3 (9.7%) |
| $1,500 to $1,999 | 26 (27.1%) | 8 (25.8%) |
| $2,000 to $2,499 | 9 (9.4%) | 3 (9.7%) |
| $2,500 to $2,999 | 3 (3.1%) | 0 (0.0%) |
| $3,000 or more | 0 (0.0%) | 0 (0.0%) |
| Total | 96 (100.0%) | 31 (100.0%) |
Physical Housing Characteristics in Esperance
Housing Structures in Esperance
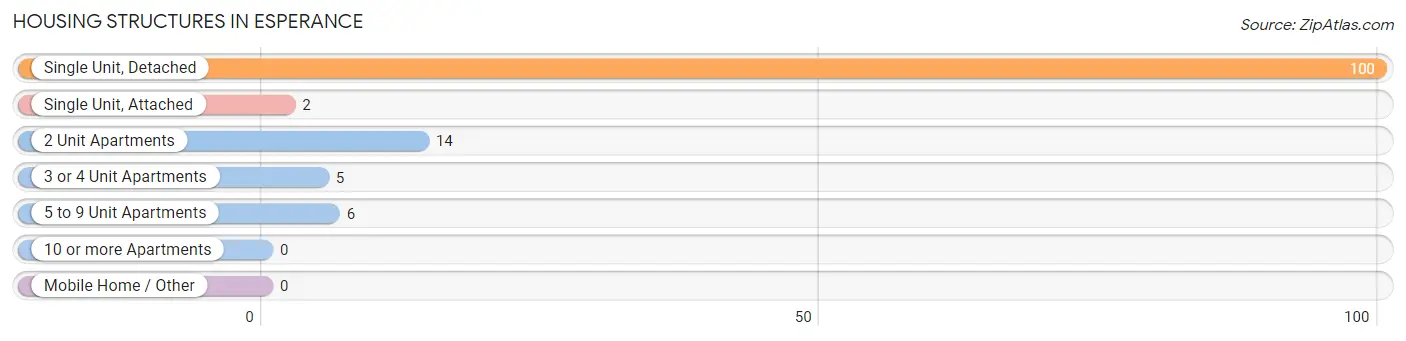
| Structure Type | # Housing Units | % Housing Units |
| Single Unit, Detached | 100 | 78.7% |
| Single Unit, Attached | 2 | 1.6% |
| 2 Unit Apartments | 14 | 11.0% |
| 3 or 4 Unit Apartments | 5 | 3.9% |
| 5 to 9 Unit Apartments | 6 | 4.7% |
| 10 or more Apartments | 0 | 0.0% |
| Mobile Home / Other | 0 | 0.0% |
| Total | 127 | 100.0% |
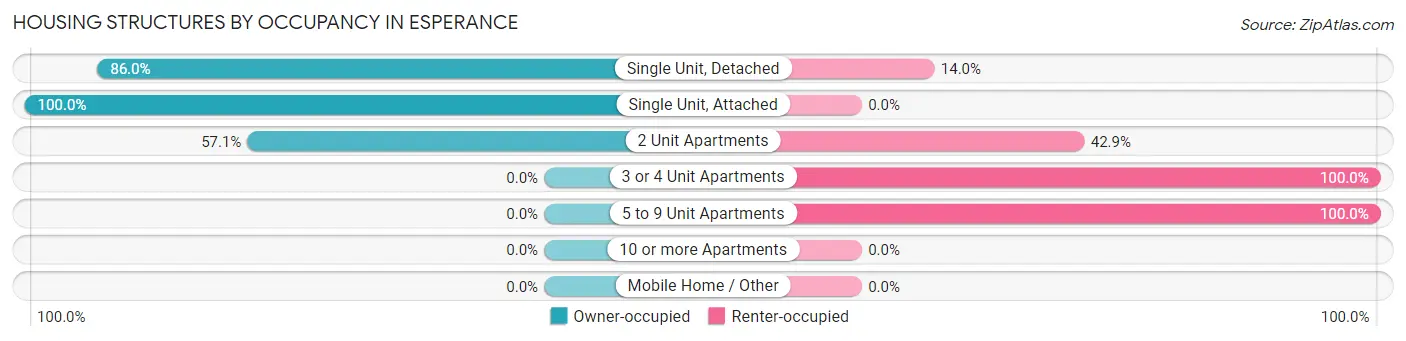
Housing Structures by Occupancy in Esperance
| Structure Type | Owner-occupied | Renter-occupied |
| Single Unit, Detached | 86 (86.0%) | 14 (14.0%) |
| Single Unit, Attached | 2 (100.0%) | 0 (0.0%) |
| 2 Unit Apartments | 8 (57.1%) | 6 (42.9%) |
| 3 or 4 Unit Apartments | 0 (0.0%) | 5 (100.0%) |
| 5 to 9 Unit Apartments | 0 (0.0%) | 6 (100.0%) |
| 10 or more Apartments | 0 (0.0%) | 0 (0.0%) |
| Mobile Home / Other | 0 (0.0%) | 0 (0.0%) |
| Total | 96 (75.6%) | 31 (24.4%) |
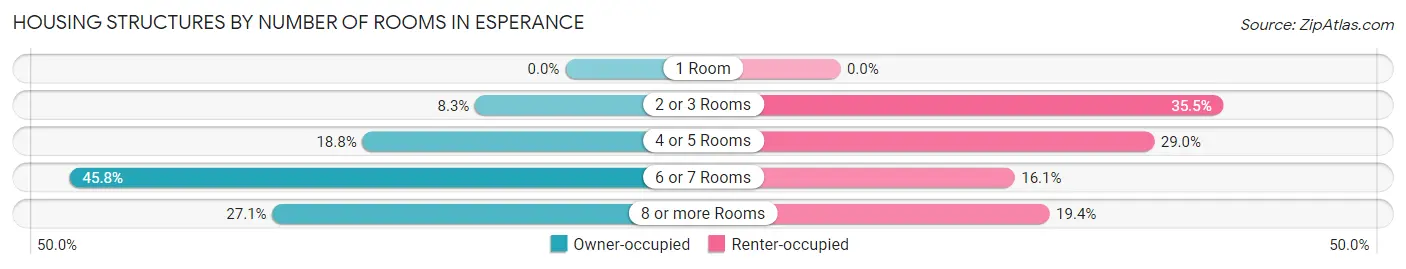
Housing Structures by Number of Rooms in Esperance
| Number of Rooms | Owner-occupied | Renter-occupied |
| 1 Room | 0 (0.0%) | 0 (0.0%) |
| 2 or 3 Rooms | 8 (8.3%) | 11 (35.5%) |
| 4 or 5 Rooms | 18 (18.8%) | 9 (29.0%) |
| 6 or 7 Rooms | 44 (45.8%) | 5 (16.1%) |
| 8 or more Rooms | 26 (27.1%) | 6 (19.4%) |
| Total | 96 (100.0%) | 31 (100.0%) |
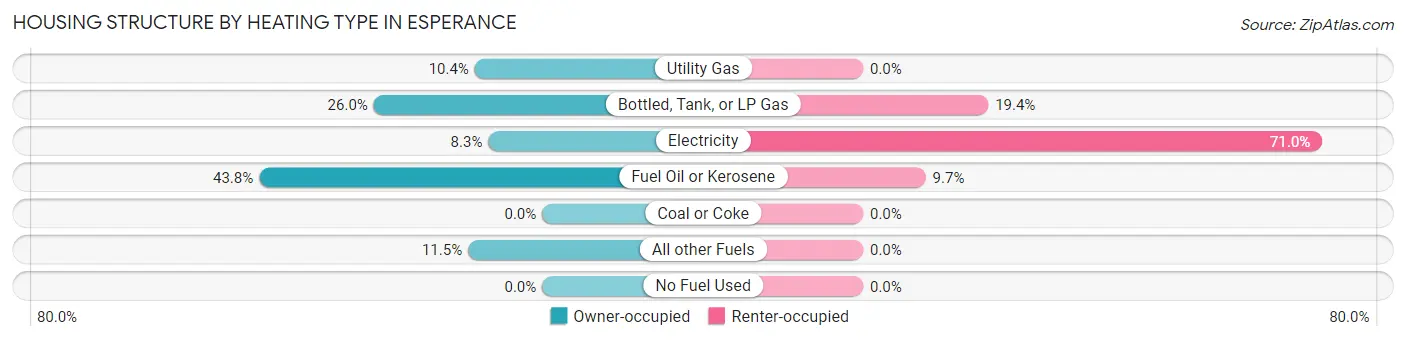
Housing Structure by Heating Type in Esperance
| Heating Type | Owner-occupied | Renter-occupied |
| Utility Gas | 10 (10.4%) | 0 (0.0%) |
| Bottled, Tank, or LP Gas | 25 (26.0%) | 6 (19.4%) |
| Electricity | 8 (8.3%) | 22 (71.0%) |
| Fuel Oil or Kerosene | 42 (43.8%) | 3 (9.7%) |
| Coal or Coke | 0 (0.0%) | 0 (0.0%) |
| All other Fuels | 11 (11.5%) | 0 (0.0%) |
| No Fuel Used | 0 (0.0%) | 0 (0.0%) |
| Total | 96 (100.0%) | 31 (100.0%) |
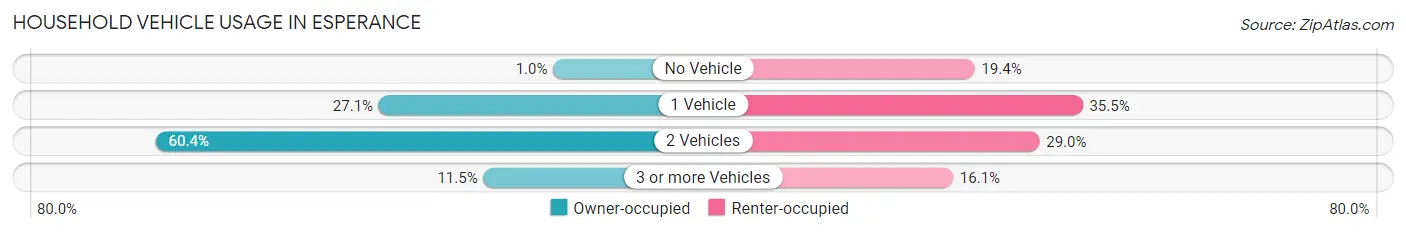
Household Vehicle Usage in Esperance
| Vehicles per Household | Owner-occupied | Renter-occupied |
| No Vehicle | 1 (1.0%) | 6 (19.4%) |
| 1 Vehicle | 26 (27.1%) | 11 (35.5%) |
| 2 Vehicles | 58 (60.4%) | 9 (29.0%) |
| 3 or more Vehicles | 11 (11.5%) | 5 (16.1%) |
| Total | 96 (100.0%) | 31 (100.0%) |
Real Estate & Mortgages in Esperance
Real Estate and Mortgage Overview in Esperance
| Characteristic | Without Mortgage | With Mortgage |
| Housing Units | 43 | 53 |
| Median Property Value | $163,800 | $158,600 |
| Median Household Income | $42,250 | $8 |
| Monthly Housing Costs | $650 | $0 |
| Real Estate Taxes | $4,579 | $0 |
Property Value by Mortgage Status in Esperance
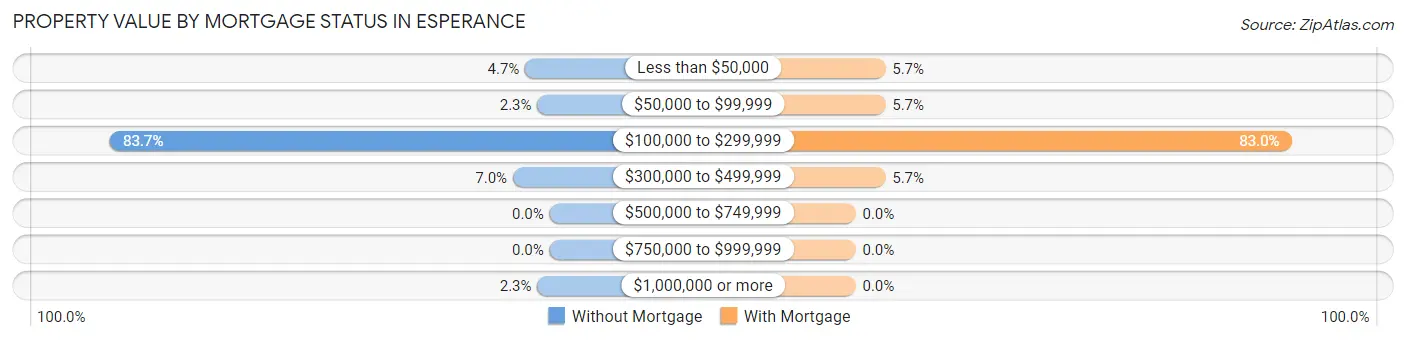
| Property Value | Without Mortgage | With Mortgage |
| Less than $50,000 | 2 (4.6%) | 3 (5.7%) |
| $50,000 to $99,999 | 1 (2.3%) | 3 (5.7%) |
| $100,000 to $299,999 | 36 (83.7%) | 44 (83.0%) |
| $300,000 to $499,999 | 3 (7.0%) | 3 (5.7%) |
| $500,000 to $749,999 | 0 (0.0%) | 0 (0.0%) |
| $750,000 to $999,999 | 0 (0.0%) | 0 (0.0%) |
| $1,000,000 or more | 1 (2.3%) | 0 (0.0%) |
| Total | 43 (100.0%) | 53 (100.0%) |
Household Income by Mortgage Status in Esperance
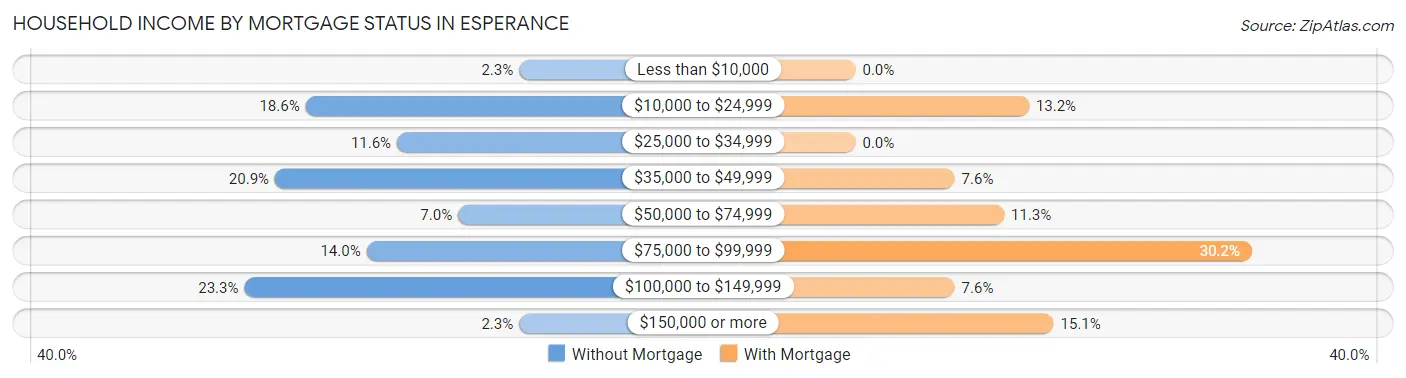
| Household Income | Without Mortgage | With Mortgage |
| Less than $10,000 | 1 (2.3%) | 0 (0.0%) |
| $10,000 to $24,999 | 8 (18.6%) | 7 (13.2%) |
| $25,000 to $34,999 | 5 (11.6%) | 0 (0.0%) |
| $35,000 to $49,999 | 9 (20.9%) | 4 (7.5%) |
| $50,000 to $74,999 | 3 (7.0%) | 6 (11.3%) |
| $75,000 to $99,999 | 6 (14.0%) | 16 (30.2%) |
| $100,000 to $149,999 | 10 (23.3%) | 4 (7.5%) |
| $150,000 or more | 1 (2.3%) | 8 (15.1%) |
| Total | 43 (100.0%) | 53 (100.0%) |
Property Value to Household Income Ratio in Esperance
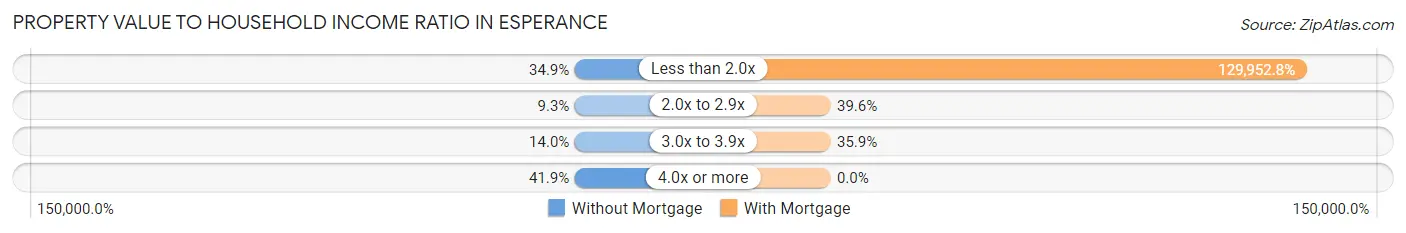
| Value-to-Income Ratio | Without Mortgage | With Mortgage |
| Less than 2.0x | 15 (34.9%) | 68,875 (129,952.8%) |
| 2.0x to 2.9x | 4 (9.3%) | 21 (39.6%) |
| 3.0x to 3.9x | 6 (14.0%) | 19 (35.8%) |
| 4.0x or more | 18 (41.9%) | 0 (0.0%) |
| Total | 43 (100.0%) | 53 (100.0%) |
Real Estate Taxes by Mortgage Status in Esperance
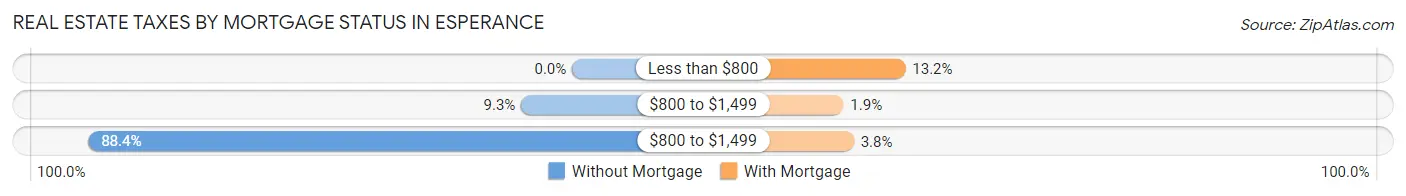
| Property Taxes | Without Mortgage | With Mortgage |
| Less than $800 | 0 (0.0%) | 7 (13.2%) |
| $800 to $1,499 | 4 (9.3%) | 1 (1.9%) |
| $800 to $1,499 | 38 (88.4%) | 2 (3.8%) |
| Total | 43 (100.0%) | 53 (100.0%) |
Health & Disability in Esperance
Health Insurance Coverage by Age in Esperance
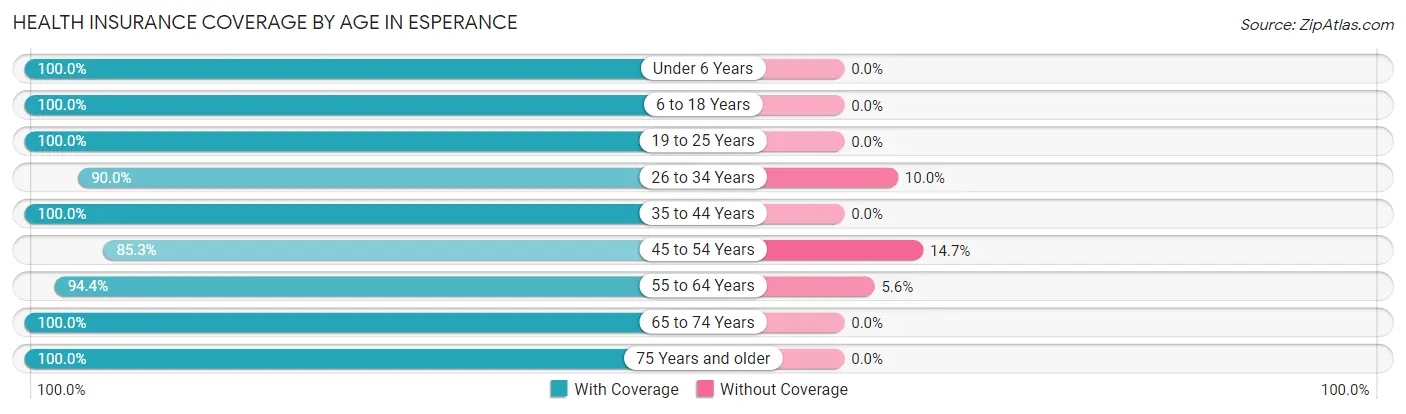
| Age Bracket | With Coverage | Without Coverage |
| Under 6 Years | 7 (100.0%) | 0 (0.0%) |
| 6 to 18 Years | 37 (100.0%) | 0 (0.0%) |
| 19 to 25 Years | 12 (100.0%) | 0 (0.0%) |
| 26 to 34 Years | 36 (90.0%) | 4 (10.0%) |
| 35 to 44 Years | 20 (100.0%) | 0 (0.0%) |
| 45 to 54 Years | 29 (85.3%) | 5 (14.7%) |
| 55 to 64 Years | 67 (94.4%) | 4 (5.6%) |
| 65 to 74 Years | 25 (100.0%) | 0 (0.0%) |
| 75 Years and older | 31 (100.0%) | 0 (0.0%) |
| Total | 264 (95.3%) | 13 (4.7%) |
Health Insurance Coverage by Citizenship Status in Esperance
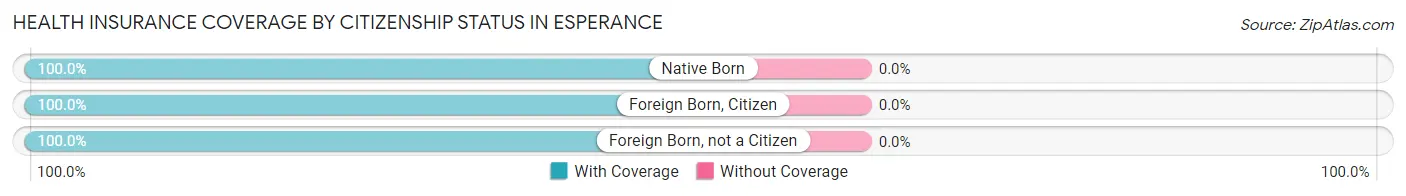
| Citizenship Status | With Coverage | Without Coverage |
| Native Born | 7 (100.0%) | 0 (0.0%) |
| Foreign Born, Citizen | 37 (100.0%) | 0 (0.0%) |
| Foreign Born, not a Citizen | 12 (100.0%) | 0 (0.0%) |
Health Insurance Coverage by Household Income in Esperance
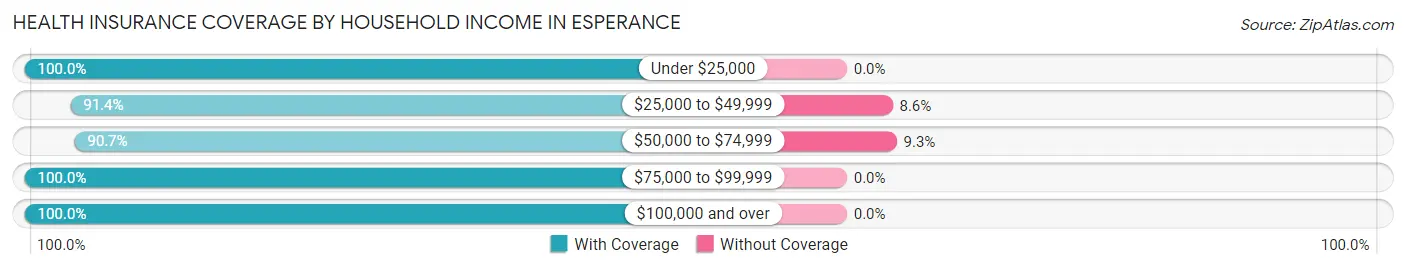
| Household Income | With Coverage | Without Coverage |
| Under $25,000 | 24 (100.0%) | 0 (0.0%) |
| $25,000 to $49,999 | 64 (91.4%) | 6 (8.6%) |
| $50,000 to $74,999 | 68 (90.7%) | 7 (9.3%) |
| $75,000 to $99,999 | 22 (100.0%) | 0 (0.0%) |
| $100,000 and over | 86 (100.0%) | 0 (0.0%) |
Public vs Private Health Insurance Coverage by Age in Esperance
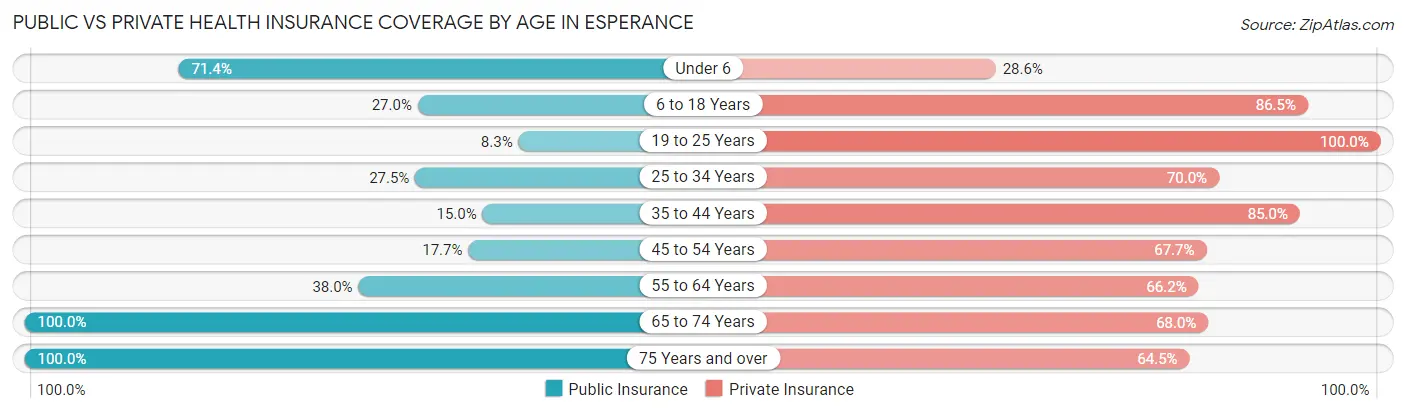
| Age Bracket | Public Insurance | Private Insurance |
| Under 6 | 5 (71.4%) | 2 (28.6%) |
| 6 to 18 Years | 10 (27.0%) | 32 (86.5%) |
| 19 to 25 Years | 1 (8.3%) | 12 (100.0%) |
| 25 to 34 Years | 11 (27.5%) | 28 (70.0%) |
| 35 to 44 Years | 3 (15.0%) | 17 (85.0%) |
| 45 to 54 Years | 6 (17.6%) | 23 (67.6%) |
| 55 to 64 Years | 27 (38.0%) | 47 (66.2%) |
| 65 to 74 Years | 25 (100.0%) | 17 (68.0%) |
| 75 Years and over | 31 (100.0%) | 20 (64.5%) |
| Total | 119 (43.0%) | 198 (71.5%) |
Disability Status by Sex by Age in Esperance
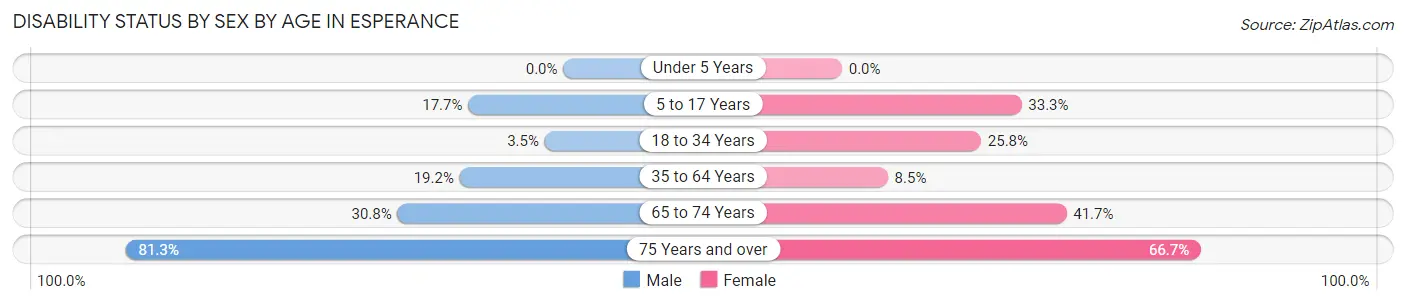
| Age Bracket | Male | Female |
| Under 5 Years | 0 (0.0%) | 0 (0.0%) |
| 5 to 17 Years | 3 (17.6%) | 4 (33.3%) |
| 18 to 34 Years | 1 (3.5%) | 8 (25.8%) |
| 35 to 64 Years | 15 (19.2%) | 4 (8.5%) |
| 65 to 74 Years | 4 (30.8%) | 5 (41.7%) |
| 75 Years and over | 13 (81.2%) | 10 (66.7%) |
Disability Class by Sex by Age in Esperance
Disability Class: Hearing Difficulty
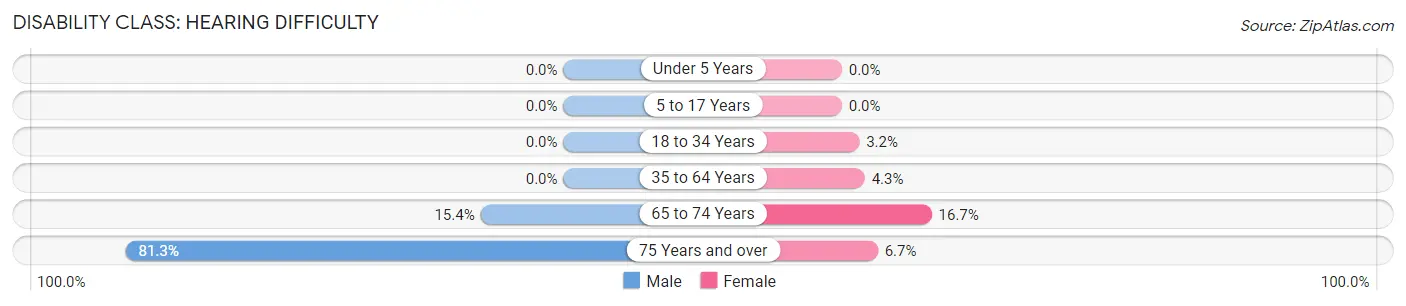
| Age Bracket | Male | Female |
| Under 5 Years | 0 (0.0%) | 0 (0.0%) |
| 5 to 17 Years | 0 (0.0%) | 0 (0.0%) |
| 18 to 34 Years | 0 (0.0%) | 1 (3.2%) |
| 35 to 64 Years | 0 (0.0%) | 2 (4.3%) |
| 65 to 74 Years | 2 (15.4%) | 2 (16.7%) |
| 75 Years and over | 13 (81.2%) | 1 (6.7%) |
Disability Class: Vision Difficulty
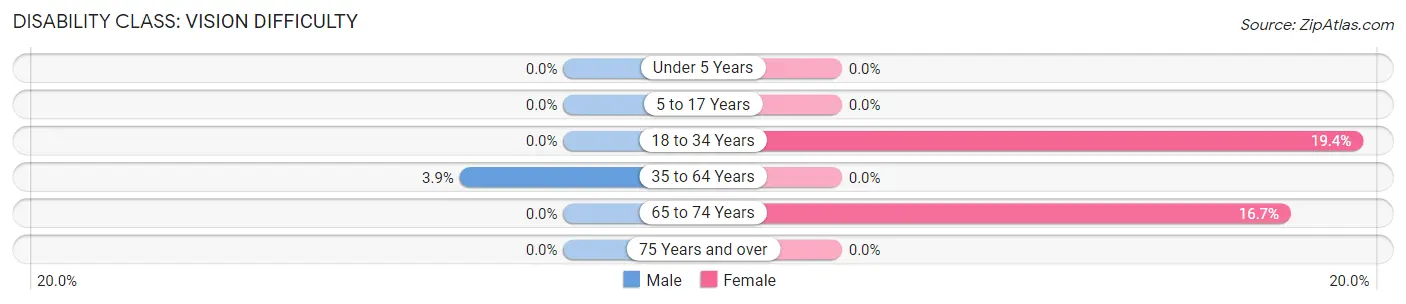
| Age Bracket | Male | Female |
| Under 5 Years | 0 (0.0%) | 0 (0.0%) |
| 5 to 17 Years | 0 (0.0%) | 0 (0.0%) |
| 18 to 34 Years | 0 (0.0%) | 6 (19.4%) |
| 35 to 64 Years | 3 (3.8%) | 0 (0.0%) |
| 65 to 74 Years | 0 (0.0%) | 2 (16.7%) |
| 75 Years and over | 0 (0.0%) | 0 (0.0%) |
Disability Class: Cognitive Difficulty
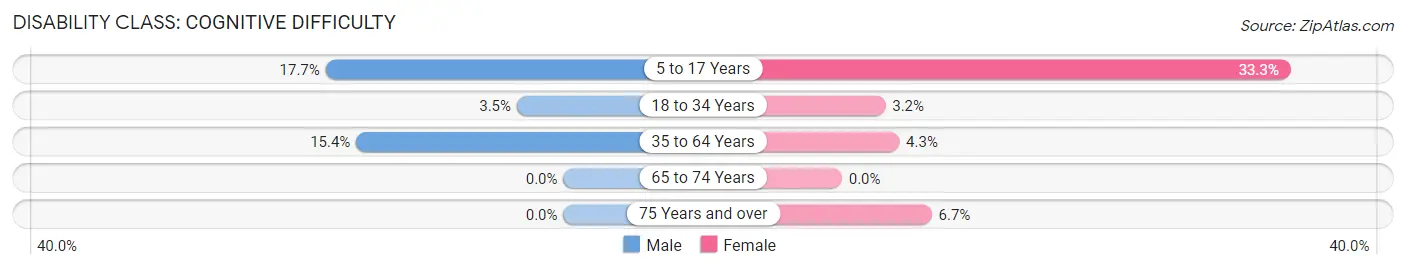
| Age Bracket | Male | Female |
| 5 to 17 Years | 3 (17.6%) | 4 (33.3%) |
| 18 to 34 Years | 1 (3.5%) | 1 (3.2%) |
| 35 to 64 Years | 12 (15.4%) | 2 (4.3%) |
| 65 to 74 Years | 0 (0.0%) | 0 (0.0%) |
| 75 Years and over | 0 (0.0%) | 1 (6.7%) |
Disability Class: Ambulatory Difficulty
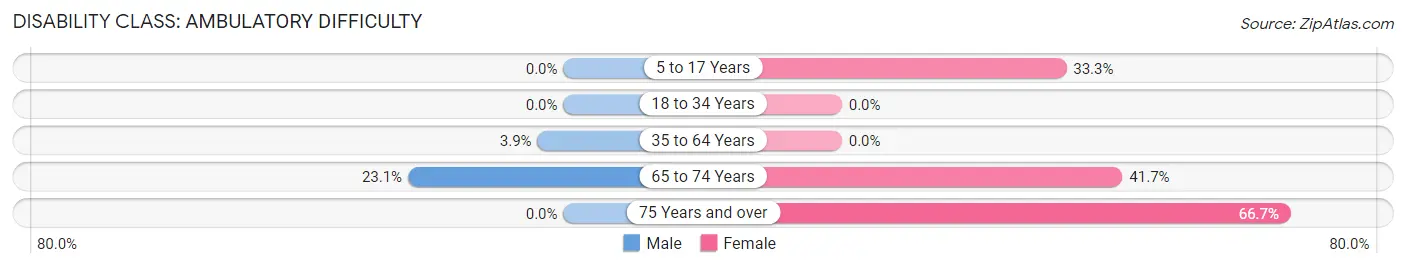
| Age Bracket | Male | Female |
| 5 to 17 Years | 0 (0.0%) | 4 (33.3%) |
| 18 to 34 Years | 0 (0.0%) | 0 (0.0%) |
| 35 to 64 Years | 3 (3.8%) | 0 (0.0%) |
| 65 to 74 Years | 3 (23.1%) | 5 (41.7%) |
| 75 Years and over | 0 (0.0%) | 10 (66.7%) |
Disability Class: Self-Care Difficulty
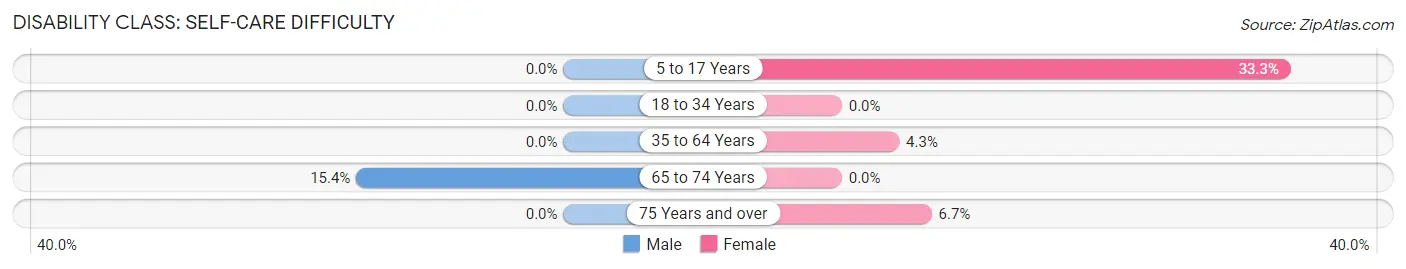
| Age Bracket | Male | Female |
| 5 to 17 Years | 0 (0.0%) | 4 (33.3%) |
| 18 to 34 Years | 0 (0.0%) | 0 (0.0%) |
| 35 to 64 Years | 0 (0.0%) | 2 (4.3%) |
| 65 to 74 Years | 2 (15.4%) | 0 (0.0%) |
| 75 Years and over | 0 (0.0%) | 1 (6.7%) |
Technology Access in Esperance
Computing Device Access in Esperance
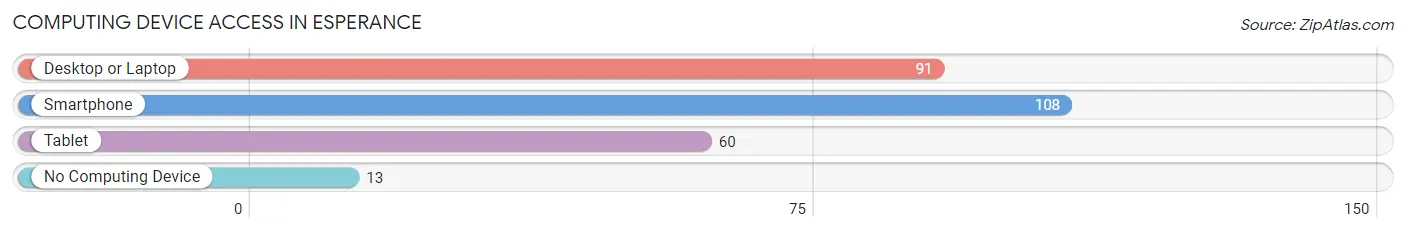
| Device Type | # Households | % Households |
| Desktop or Laptop | 91 | 71.7% |
| Smartphone | 108 | 85.0% |
| Tablet | 60 | 47.2% |
| No Computing Device | 13 | 10.2% |
| Total | 127 | 100.0% |
Internet Access in Esperance

| Internet Type | # Households | % Households |
| Dial-Up Internet | 0 | 0.0% |
| Broadband Home | 95 | 74.8% |
| Cellular Data Only | 13 | 10.2% |
| Satellite Internet | 2 | 1.6% |
| No Internet | 19 | 15.0% |
| Total | 127 | 100.0% |
Esperance Summary
Esperance is a town located in the Schoharie County of New York, United States. It is situated in the foothills of the Catskill Mountains, and is part of the Albany-Schenectady-Troy Metropolitan Statistical Area. The town was established in 1793 and has a population of 1,845 as of the 2010 census.
History
Esperance was first settled in 1793 by a group of Dutch settlers from the nearby town of Schoharie. The town was originally known as “Esperance”, which is Dutch for “hope”. The town was officially established in 1808 and was named after the nearby Schoharie Creek.
The town was an important agricultural center in the 19th century, with many farms producing dairy products, grains, and vegetables. The town also had several mills, including a grist mill, a saw mill, and a woolen mill.
In the late 19th century, the town began to experience a decline in population as many of its residents moved away to larger cities. This trend continued into the 20th century, and by the 1950s the town’s population had dropped to just over 1,000.
Geography
Esperance is located in the foothills of the Catskill Mountains, and is part of the Albany-Schenectady-Troy Metropolitan Statistical Area. The town is bordered by the towns of Schoharie to the north, Middleburgh to the east, and Cobleskill to the south.
The town has a total area of 33.2 square miles, of which 33.1 square miles is land and 0.1 square miles is water. The terrain is mostly hilly, with elevations ranging from 500 to 1,000 feet above sea level.
Economy
Esperance’s economy is largely based on agriculture and tourism. The town is home to several farms, which produce dairy products, grains, and vegetables. The town also has several wineries, which attract tourists from all over the region.
The town is also home to several small businesses, including a hardware store, a grocery store, and a few restaurants. The town also has a post office, a library, and a fire department.
Demographics
As of the 2010 census, the town had a population of 1,845. The racial makeup of the town was 97.2% White, 0.7% African American, 0.3% Native American, 0.2% Asian, 0.1% Pacific Islander, 0.4% from other races, and 1.1% from two or more races. Hispanic or Latino of any race were 1.7% of the population.
The median income for a household in the town was $45,000, and the median income for a family was $50,000. The per capita income for the town was $20,000. About 8.3% of families and 10.2% of the population were below the poverty line, including 14.2% of those under age 18 and 5.2% of those age 65 or over.
Common Questions
What is Per Capita Income in Esperance?
Per Capita income in Esperance is $32,239.
What is the Median Family Income in Esperance?
Median Family Income in Esperance is $71,563.
What is the Median Household income in Esperance?
Median Household Income in Esperance is $65,625.
What is Income or Wage Gap in Esperance?
Income or Wage Gap in Esperance is 27.3%.
Women in Esperance earn 72.7 cents for every dollar earned by a man.
What is Inequality or Gini Index in Esperance?
Inequality or Gini Index in Esperance is 0.39.
What is the Total Population of Esperance?
Total Population of Esperance is 277.
What is the Total Male Population of Esperance?
Total Male Population of Esperance is 158.
What is the Total Female Population of Esperance?
Total Female Population of Esperance is 119.
What is the Ratio of Males per 100 Females in Esperance?
There are 132.77 Males per 100 Females in Esperance.
What is the Ratio of Females per 100 Males in Esperance?
There are 75.32 Females per 100 Males in Esperance.
What is the Median Population Age in Esperance?
Median Population Age in Esperance is 49.3 Years.
What is the Average Family Size in Esperance
Average Family Size in Esperance is 2.9 People.
What is the Average Household Size in Esperance
Average Household Size in Esperance is 2.2 People.
How Large is the Labor Force in Esperance?
There are 140 People in the Labor Forcein in Esperance.
What is the Percentage of People in the Labor Force in Esperance?
56.9% of People are in the Labor Force in Esperance.
What is the Unemployment Rate in Esperance?
Unemployment Rate in Esperance is 2.9%.