Hillside Lake, NY Map & Demographics
Hillside Lake Map
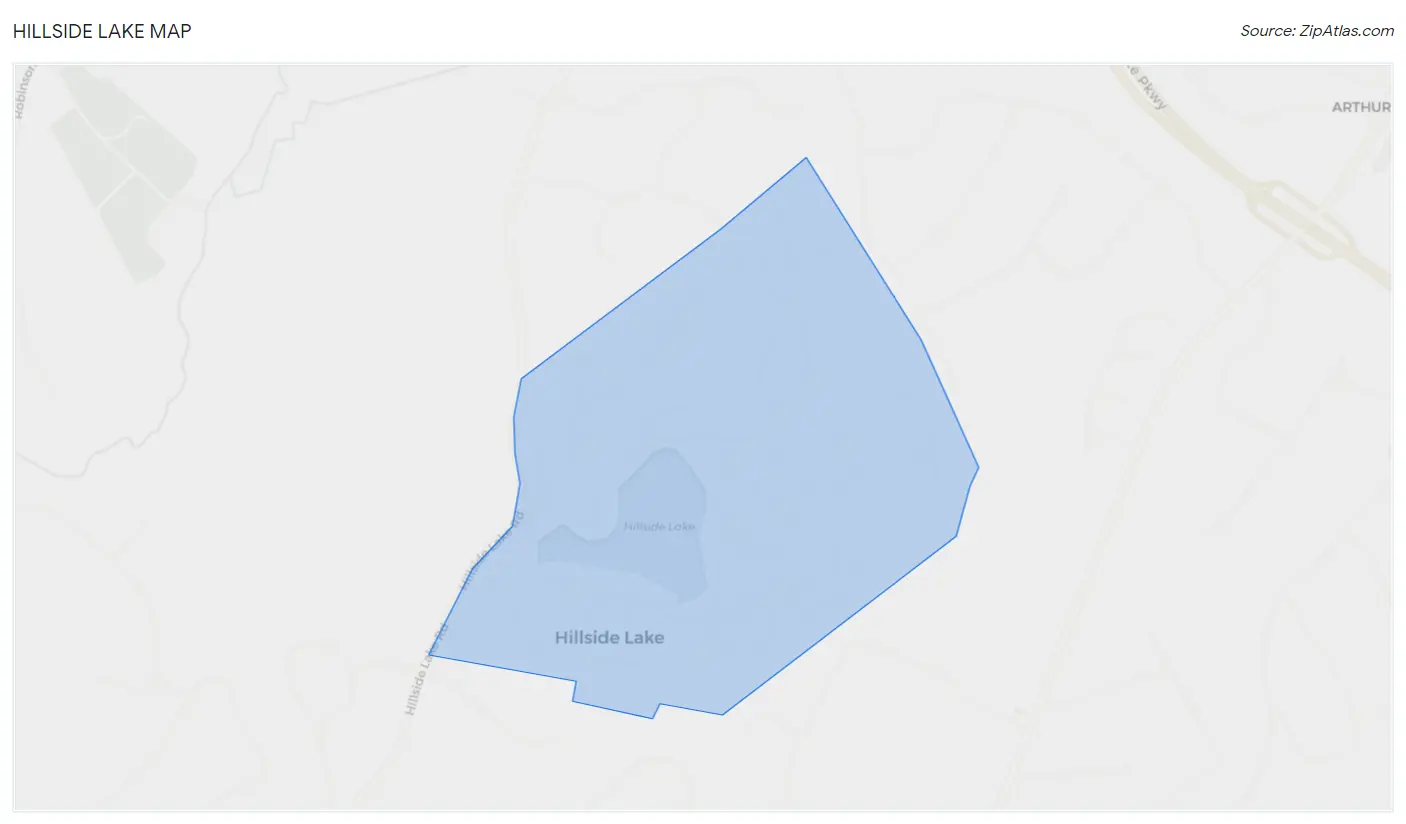
Hillside Lake Overview
$49,763
PER CAPITA INCOME
$127,653
AVG FAMILY INCOME
$116,417
AVG HOUSEHOLD INCOME
65.3%
WAGE / INCOME GAP [ % ]
34.7¢/ $1
WAGE / INCOME GAP [ $ ]
0.35
INEQUALITY / GINI INDEX
1,256
TOTAL POPULATION
717
MALE POPULATION
539
FEMALE POPULATION
133.02
MALES / 100 FEMALES
75.17
FEMALES / 100 MALES
37.5
MEDIAN AGE
3.0
AVG FAMILY SIZE
2.8
AVG HOUSEHOLD SIZE
823
LABOR FORCE [ PEOPLE ]
76.2%
PERCENT IN LABOR FORCE
0.9%
UNEMPLOYMENT RATE
Income in Hillside Lake
Income Overview in Hillside Lake
Per Capita Income in Hillside Lake is $49,763, while median incomes of families and households are $127,653 and $116,417 respectively.
| Characteristic | Number | Measure |
| Per Capita Income | 1,256 | $49,763 |
| Median Family Income | 380 | $127,653 |
| Mean Family Income | 380 | $146,103 |
| Median Household Income | 447 | $116,417 |
| Mean Household Income | 447 | $135,406 |
| Income Deficit | 380 | $0 |
| Wage / Income Gap (%) | 1,256 | 65.32% |
| Wage / Income Gap ($) | 1,256 | 34.68¢ per $1 |
| Gini / Inequality Index | 1,256 | 0.35 |
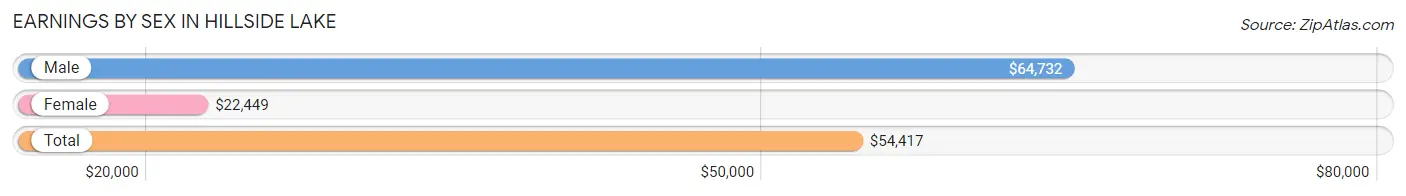
Earnings by Sex in Hillside Lake
Average Earnings in Hillside Lake are $54,417, $64,732 for men and $22,449 for women, a difference of 65.3%.
| Sex | Number | Average Earnings |
| Male | 467 (52.4%) | $64,732 |
| Female | 424 (47.6%) | $22,449 |
| Total | 891 (100.0%) | $54,417 |
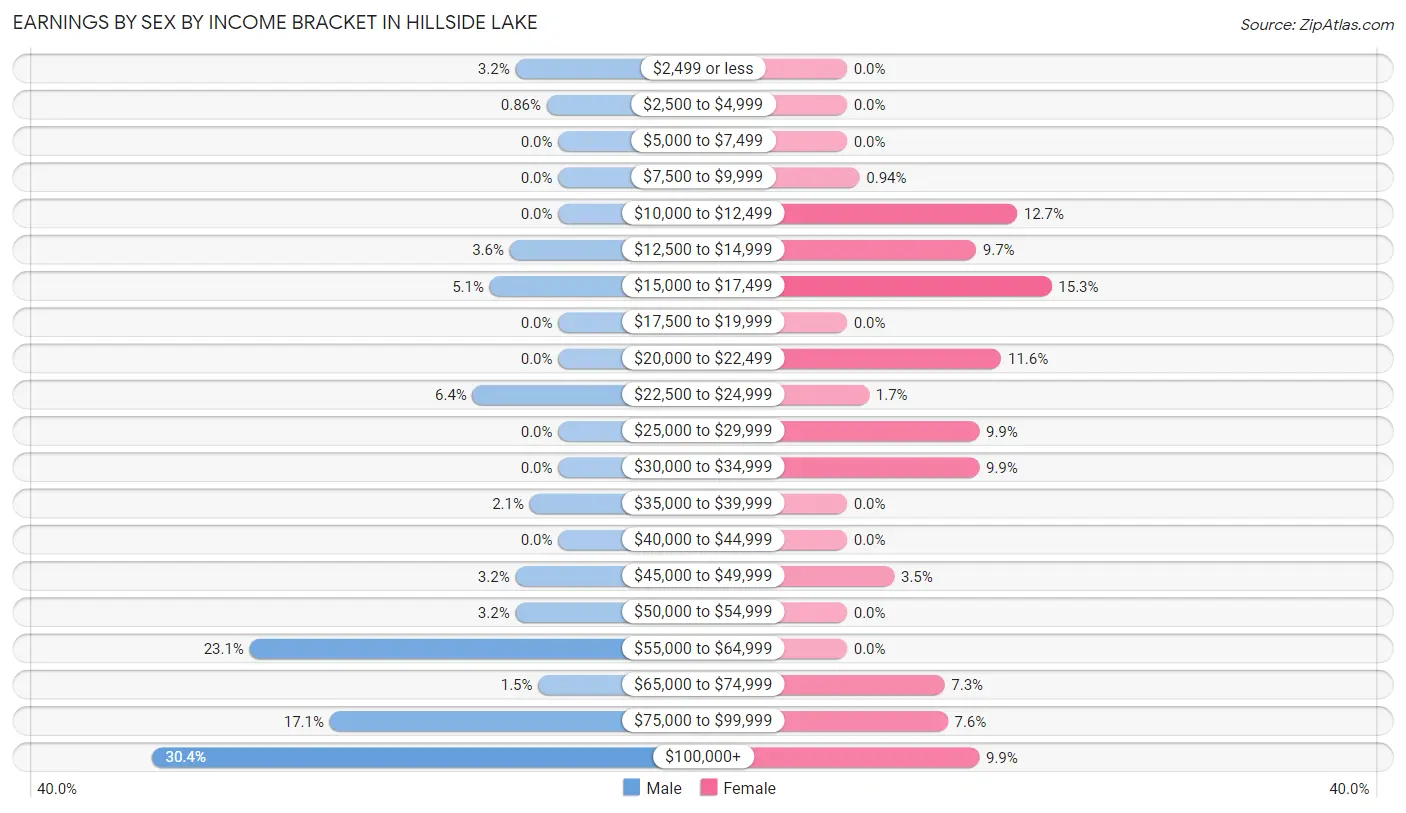
Earnings by Sex by Income Bracket in Hillside Lake
The most common earnings brackets in Hillside Lake are $100,000+ for men (142 | 30.4%) and $15,000 to $17,499 for women (65 | 15.3%).
| Income | Male | Female |
| $2,499 or less | 15 (3.2%) | 0 (0.0%) |
| $2,500 to $4,999 | 4 (0.9%) | 0 (0.0%) |
| $5,000 to $7,499 | 0 (0.0%) | 0 (0.0%) |
| $7,500 to $9,999 | 0 (0.0%) | 4 (0.9%) |
| $10,000 to $12,499 | 0 (0.0%) | 54 (12.7%) |
| $12,500 to $14,999 | 17 (3.6%) | 41 (9.7%) |
| $15,000 to $17,499 | 24 (5.1%) | 65 (15.3%) |
| $17,500 to $19,999 | 0 (0.0%) | 0 (0.0%) |
| $20,000 to $22,499 | 0 (0.0%) | 49 (11.6%) |
| $22,500 to $24,999 | 30 (6.4%) | 7 (1.7%) |
| $25,000 to $29,999 | 0 (0.0%) | 42 (9.9%) |
| $30,000 to $34,999 | 0 (0.0%) | 42 (9.9%) |
| $35,000 to $39,999 | 10 (2.1%) | 0 (0.0%) |
| $40,000 to $44,999 | 0 (0.0%) | 0 (0.0%) |
| $45,000 to $49,999 | 15 (3.2%) | 15 (3.5%) |
| $50,000 to $54,999 | 15 (3.2%) | 0 (0.0%) |
| $55,000 to $64,999 | 108 (23.1%) | 0 (0.0%) |
| $65,000 to $74,999 | 7 (1.5%) | 31 (7.3%) |
| $75,000 to $99,999 | 80 (17.1%) | 32 (7.5%) |
| $100,000+ | 142 (30.4%) | 42 (9.9%) |
| Total | 467 (100.0%) | 424 (100.0%) |
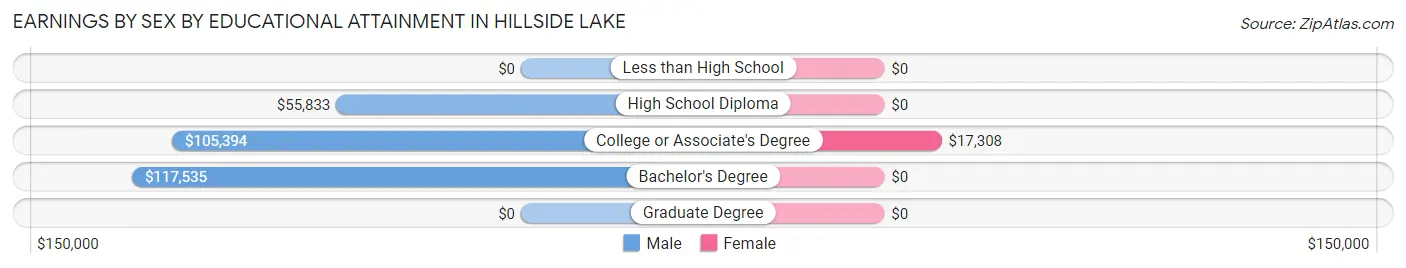
Earnings by Sex by Educational Attainment in Hillside Lake
Average earnings in Hillside Lake are $88,813 for men and $22,423 for women, a difference of 74.8%. Men with an educational attainment of bachelor's degree enjoy the highest average annual earnings of $117,535, while those with high school diploma education earn the least with $55,833. Women with an educational attainment of college or associate's degree earn the most with the average annual earnings of $17,308, while those with college or associate's degree education have the smallest earnings of $17,308.
| Educational Attainment | Male Income | Female Income |
| Less than High School | - | - |
| High School Diploma | $55,833 | $0 |
| College or Associate's Degree | $105,394 | $17,308 |
| Bachelor's Degree | $117,535 | $0 |
| Graduate Degree | - | - |
| Total | $88,813 | $22,423 |
Family Income in Hillside Lake
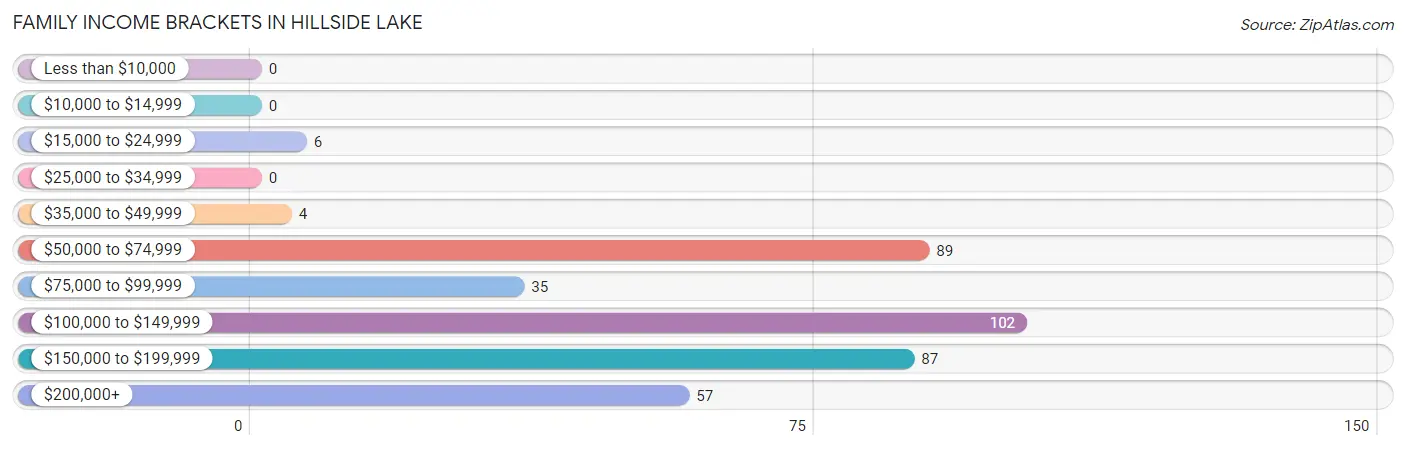
Family Income Brackets in Hillside Lake
According to the Hillside Lake family income data, there are 102 families falling into the $100,000 to $149,999 income range, which is the most common income bracket and makes up 26.8% of all families.
| Income Bracket | # Families | % Families |
| Less than $10,000 | 0 | 0.0% |
| $10,000 to $14,999 | 0 | 0.0% |
| $15,000 to $24,999 | 6 | 1.6% |
| $25,000 to $34,999 | 0 | 0.0% |
| $35,000 to $49,999 | 4 | 1.1% |
| $50,000 to $74,999 | 89 | 23.4% |
| $75,000 to $99,999 | 35 | 9.2% |
| $100,000 to $149,999 | 102 | 26.8% |
| $150,000 to $199,999 | 87 | 22.9% |
| $200,000+ | 57 | 15.0% |
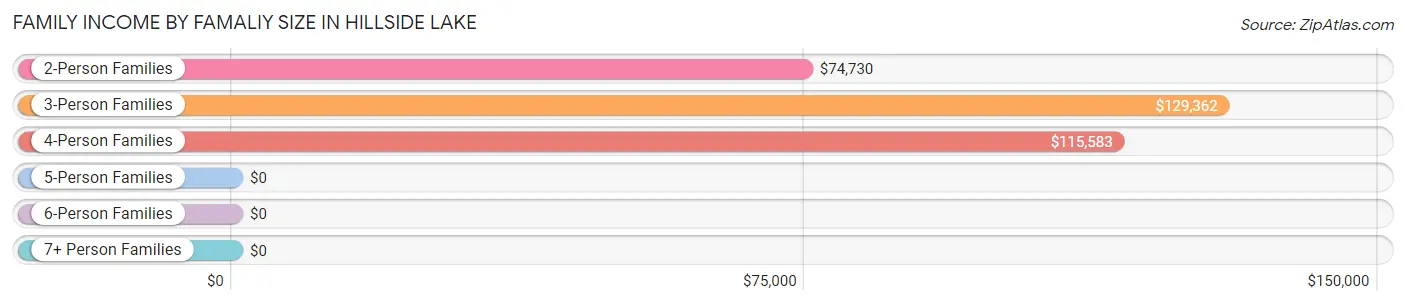
Family Income by Famaliy Size in Hillside Lake
3-person families (119 | 31.3%) account for the highest median family income in Hillside Lake with $129,362 per family, while 3-person families (119 | 31.3%) have the highest median income of $43,121 per family member.
| Income Bracket | # Families | Median Income |
| 2-Person Families | 166 (43.7%) | $74,730 |
| 3-Person Families | 119 (31.3%) | $129,362 |
| 4-Person Families | 43 (11.3%) | $115,583 |
| 5-Person Families | 52 (13.7%) | $0 |
| 6-Person Families | 0 (0.0%) | $0 |
| 7+ Person Families | 0 (0.0%) | $0 |
| Total | 380 (100.0%) | $127,653 |
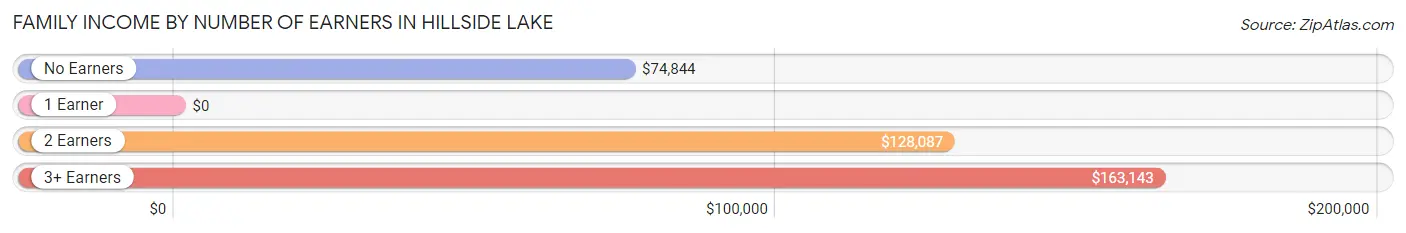
Family Income by Number of Earners in Hillside Lake
| Number of Earners | # Families | Median Income |
| No Earners | 41 (10.8%) | $74,844 |
| 1 Earner | 28 (7.4%) | $0 |
| 2 Earners | 193 (50.8%) | $128,087 |
| 3+ Earners | 118 (31.0%) | $163,143 |
| Total | 380 (100.0%) | $127,653 |
Household Income in Hillside Lake
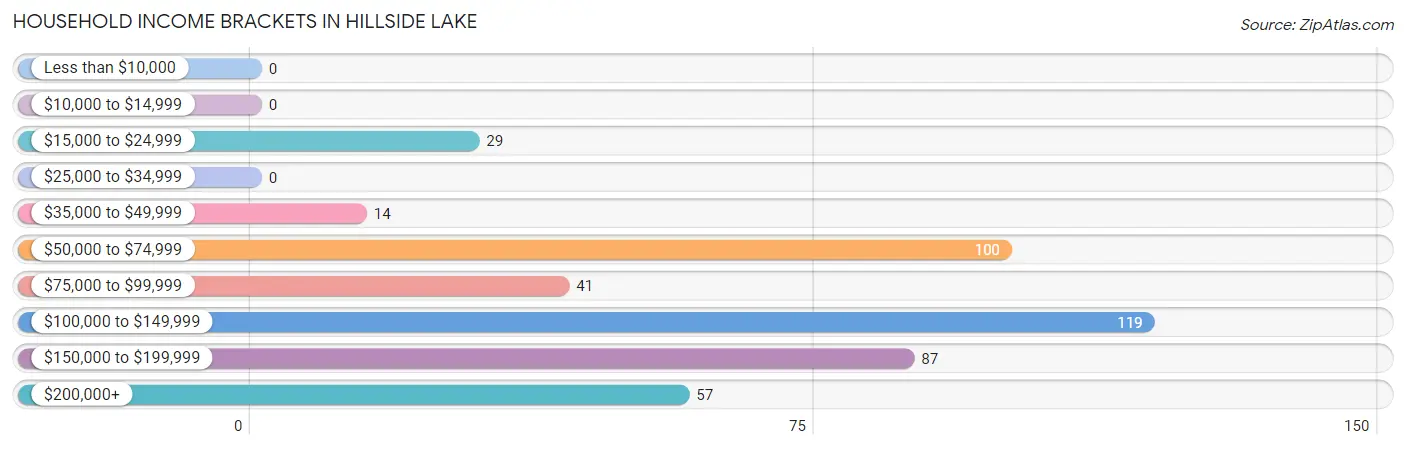
Household Income Brackets in Hillside Lake
With 119 households falling in the category, the $100,000 to $149,999 income range is the most frequent in Hillside Lake, accounting for 26.6% of all households.
| Income Bracket | # Households | % Households |
| Less than $10,000 | 0 | 0.0% |
| $10,000 to $14,999 | 0 | 0.0% |
| $15,000 to $24,999 | 29 | 6.5% |
| $25,000 to $34,999 | 0 | 0.0% |
| $35,000 to $49,999 | 14 | 3.1% |
| $50,000 to $74,999 | 100 | 22.4% |
| $75,000 to $99,999 | 41 | 9.2% |
| $100,000 to $149,999 | 119 | 26.6% |
| $150,000 to $199,999 | 87 | 19.5% |
| $200,000+ | 57 | 12.8% |
Household Income by Householder Age in Hillside Lake
The median household income in Hillside Lake is $116,417, with the highest median household income of $137,500 found in the 45 to 64 years age bracket for the primary householder. A total of 218 households (48.8%) fall into this category.
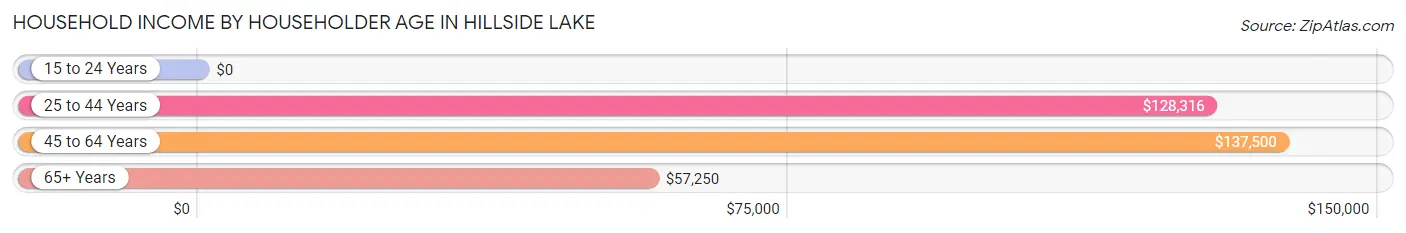
| Income Bracket | # Households | Median Income |
| 15 to 24 Years | 0 (0.0%) | $0 |
| 25 to 44 Years | 136 (30.4%) | $128,316 |
| 45 to 64 Years | 218 (48.8%) | $137,500 |
| 65+ Years | 93 (20.8%) | $57,250 |
| Total | 447 (100.0%) | $116,417 |
Poverty in Hillside Lake
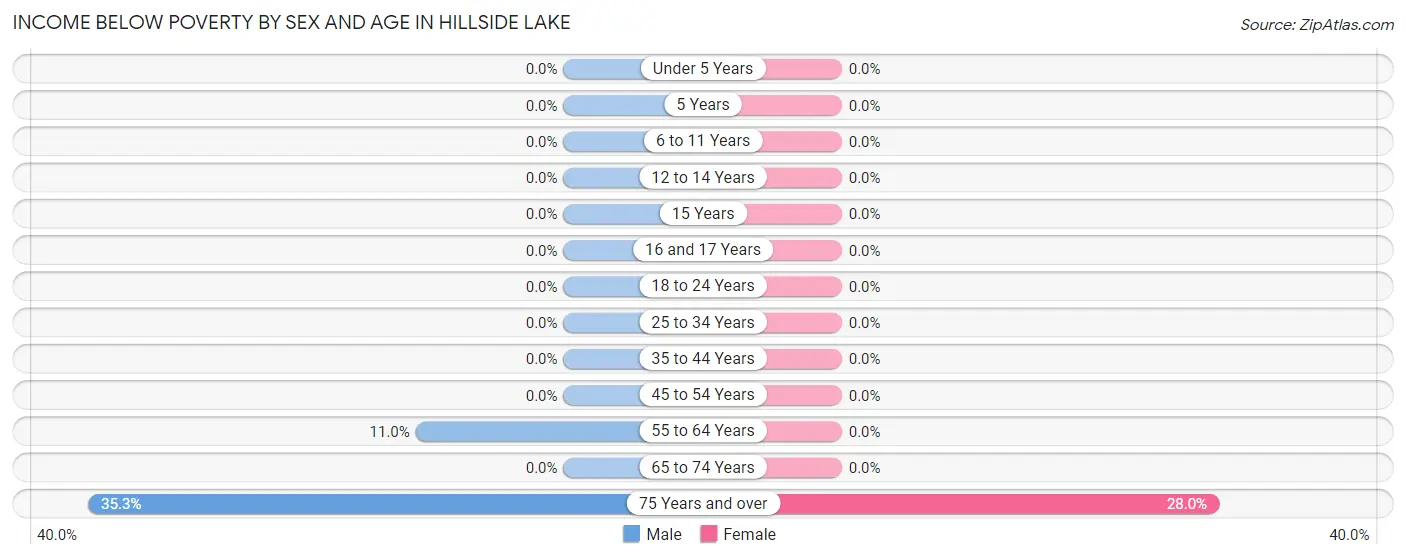
Income Below Poverty by Sex and Age in Hillside Lake
With 3.2% poverty level for males and 1.3% for females among the residents of Hillside Lake, 75 year old and over males and 75 year old and over females are the most vulnerable to poverty, with 6 males (35.3%) and 7 females (28.0%) in their respective age groups living below the poverty level.
| Age Bracket | Male | Female |
| Under 5 Years | 0 (0.0%) | 0 (0.0%) |
| 5 Years | 0 (0.0%) | 0 (0.0%) |
| 6 to 11 Years | 0 (0.0%) | 0 (0.0%) |
| 12 to 14 Years | 0 (0.0%) | 0 (0.0%) |
| 15 Years | 0 (0.0%) | 0 (0.0%) |
| 16 and 17 Years | 0 (0.0%) | 0 (0.0%) |
| 18 to 24 Years | 0 (0.0%) | 0 (0.0%) |
| 25 to 34 Years | 0 (0.0%) | 0 (0.0%) |
| 35 to 44 Years | 0 (0.0%) | 0 (0.0%) |
| 45 to 54 Years | 0 (0.0%) | 0 (0.0%) |
| 55 to 64 Years | 17 (11.0%) | 0 (0.0%) |
| 65 to 74 Years | 0 (0.0%) | 0 (0.0%) |
| 75 Years and over | 6 (35.3%) | 7 (28.0%) |
| Total | 23 (3.2%) | 7 (1.3%) |
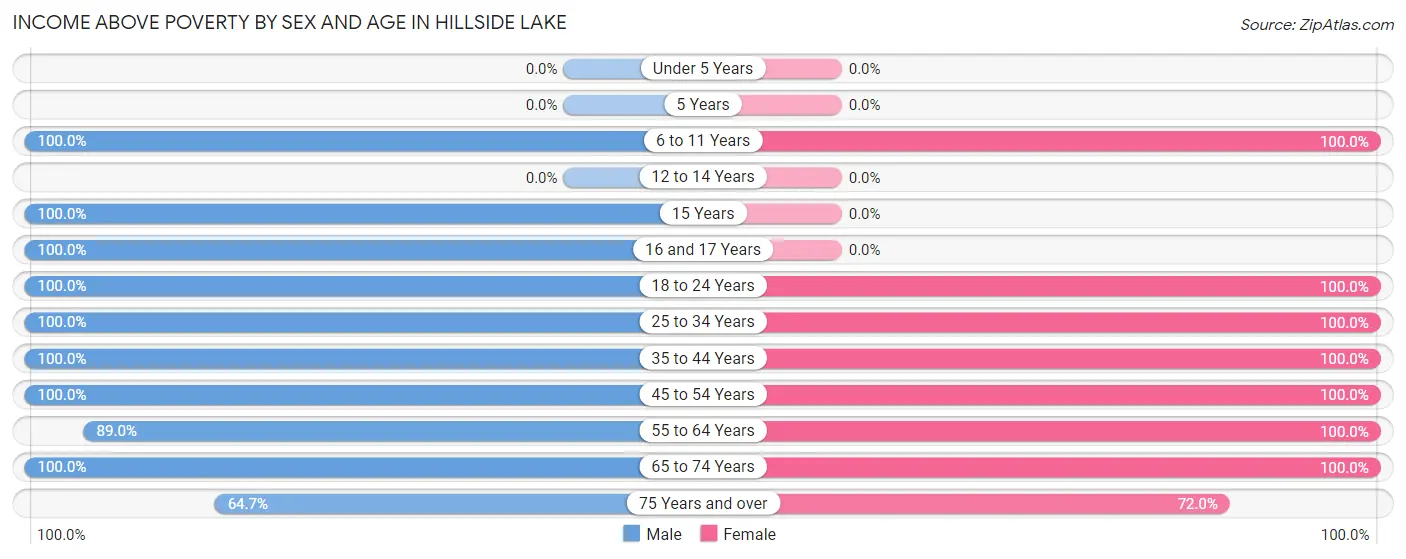
Income Above Poverty by Sex and Age in Hillside Lake
According to the poverty statistics in Hillside Lake, males aged 6 to 11 years and females aged 6 to 11 years are the age groups that are most secure financially, with 100.0% of males and 100.0% of females in these age groups living above the poverty line.
| Age Bracket | Male | Female |
| Under 5 Years | 0 (0.0%) | 0 (0.0%) |
| 5 Years | 0 (0.0%) | 0 (0.0%) |
| 6 to 11 Years | 83 (100.0%) | 44 (100.0%) |
| 12 to 14 Years | 0 (0.0%) | 0 (0.0%) |
| 15 Years | 49 (100.0%) | 0 (0.0%) |
| 16 and 17 Years | 38 (100.0%) | 0 (0.0%) |
| 18 to 24 Years | 83 (100.0%) | 83 (100.0%) |
| 25 to 34 Years | 94 (100.0%) | 66 (100.0%) |
| 35 to 44 Years | 113 (100.0%) | 90 (100.0%) |
| 45 to 54 Years | 28 (100.0%) | 74 (100.0%) |
| 55 to 64 Years | 138 (89.0%) | 53 (100.0%) |
| 65 to 74 Years | 57 (100.0%) | 104 (100.0%) |
| 75 Years and over | 11 (64.7%) | 18 (72.0%) |
| Total | 694 (96.8%) | 532 (98.7%) |
Income Below Poverty Among Married-Couple Families in Hillside Lake
The poverty statistics for married-couple families in Hillside Lake show that 2.2% or 6 of the total 267 families live below the poverty line. Families with no children have the highest poverty rate of 4.1%, comprising of 6 families. On the other hand, families with 1 or 2 children have the lowest poverty rate of 0.0%, which includes 0 families.
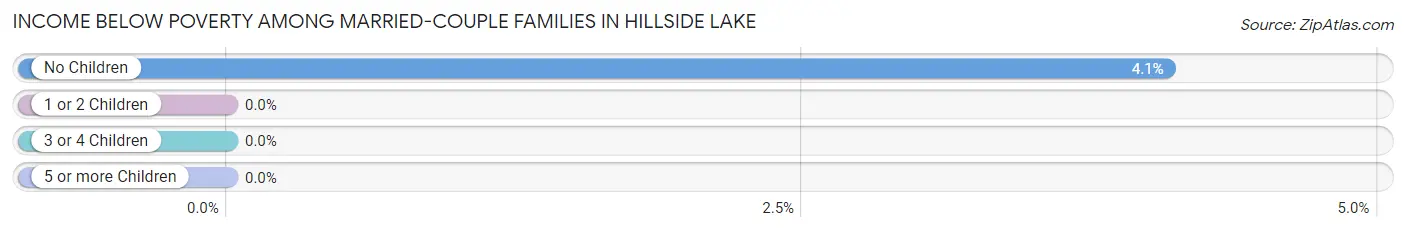
| Children | Above Poverty | Below Poverty |
| No Children | 141 (95.9%) | 6 (4.1%) |
| 1 or 2 Children | 120 (100.0%) | 0 (0.0%) |
| 3 or 4 Children | 0 (0.0%) | 0 (0.0%) |
| 5 or more Children | 0 (0.0%) | 0 (0.0%) |
| Total | 261 (97.8%) | 6 (2.2%) |
Income Below Poverty Among Single-Parent Households in Hillside Lake
| Children | Single Father | Single Mother |
| No Children | 0 (0.0%) | 0 (0.0%) |
| 1 or 2 Children | 0 (0.0%) | 0 (0.0%) |
| 3 or 4 Children | 0 (0.0%) | 0 (0.0%) |
| 5 or more Children | 0 (0.0%) | 0 (0.0%) |
| Total | 0 (0.0%) | 0 (0.0%) |
Income Below Poverty Among Married-Couple vs Single-Parent Households in Hillside Lake
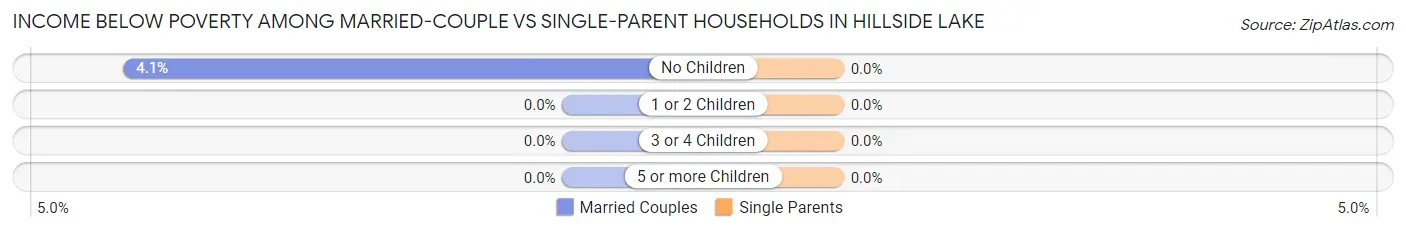
| Children | Married-Couple Families | Single-Parent Households |
| No Children | 6 (4.1%) | 0 (0.0%) |
| 1 or 2 Children | 0 (0.0%) | 0 (0.0%) |
| 3 or 4 Children | 0 (0.0%) | 0 (0.0%) |
| 5 or more Children | 0 (0.0%) | 0 (0.0%) |
| Total | 6 (2.2%) | 0 (0.0%) |
Race in Hillside Lake
The most populous races in Hillside Lake are White / Caucasian (1,256 | 100.0%), and Hispanic or Latino (17 | 1.3%).
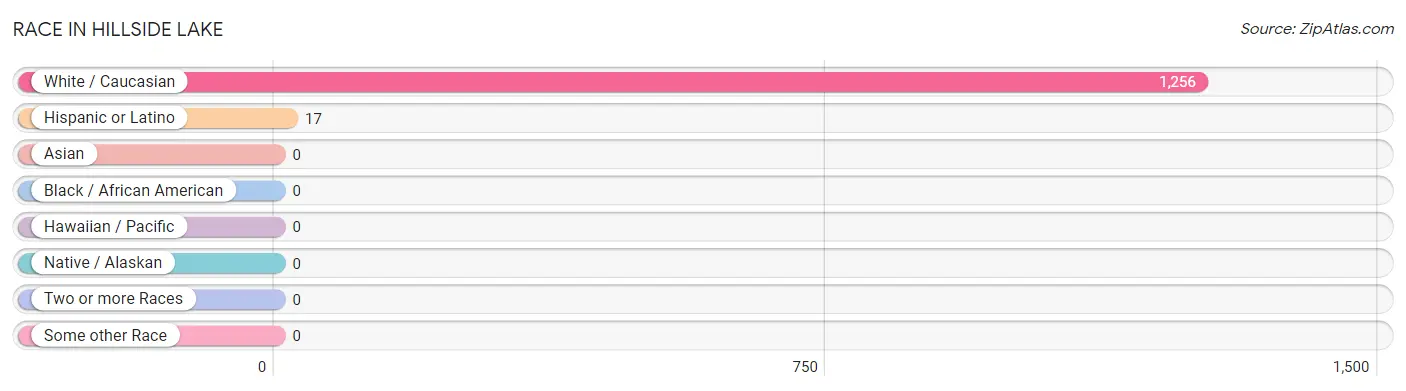
| Race | # Population | % Population |
| Asian | 0 | 0.0% |
| Black / African American | 0 | 0.0% |
| Hawaiian / Pacific | 0 | 0.0% |
| Hispanic or Latino | 17 | 1.3% |
| Native / Alaskan | 0 | 0.0% |
| White / Caucasian | 1,256 | 100.0% |
| Two or more Races | 0 | 0.0% |
| Some other Race | 0 | 0.0% |
| Total | 1,256 | 100.0% |
Ancestry in Hillside Lake
The most populous ancestries reported in Hillside Lake are Italian (565 | 45.0%), German (224 | 17.8%), Irish (218 | 17.4%), American (103 | 8.2%), and Czech (62 | 4.9%), together accounting for 93.3% of all Hillside Lake residents.
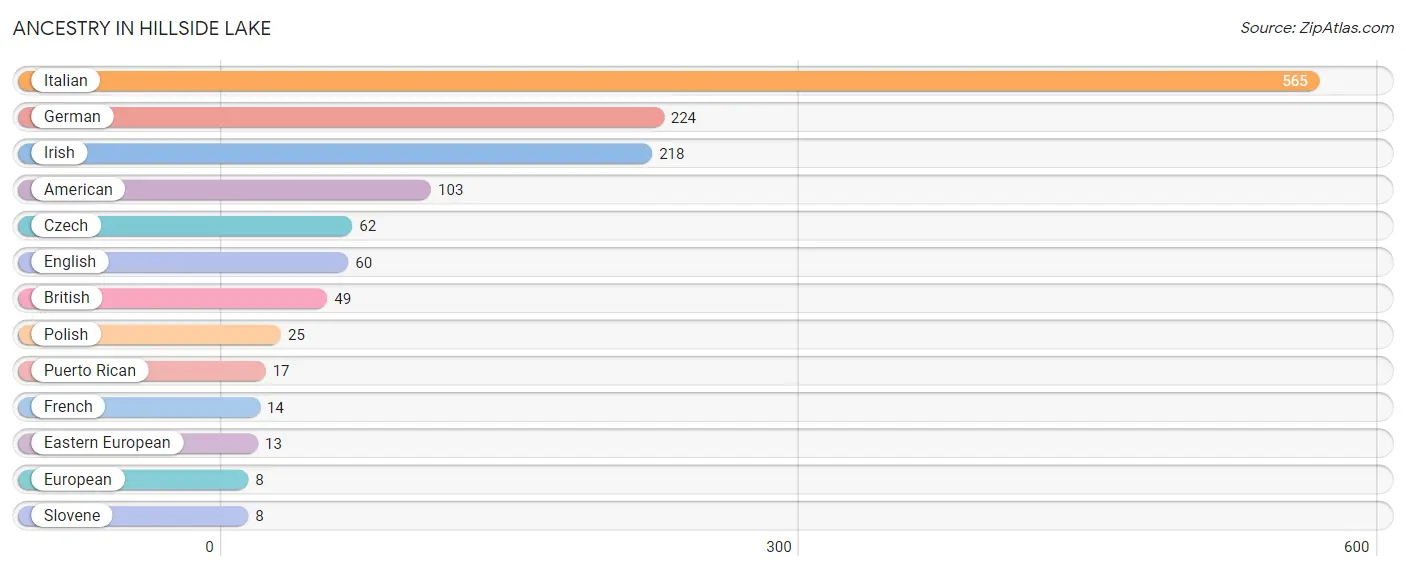
| Ancestry | # Population | % Population |
| American | 103 | 8.2% |
| British | 49 | 3.9% |
| Czech | 62 | 4.9% |
| Eastern European | 13 | 1.0% |
| English | 60 | 4.8% |
| European | 8 | 0.6% |
| French | 14 | 1.1% |
| German | 224 | 17.8% |
| Irish | 218 | 17.4% |
| Italian | 565 | 45.0% |
| Polish | 25 | 2.0% |
| Puerto Rican | 17 | 1.3% |
| Slovene | 8 | 0.6% | View All 13 Rows |
Immigrants in Hillside Lake

| Immigration Origin | # Population | % Population | View All 0 Rows |
Sex and Age in Hillside Lake
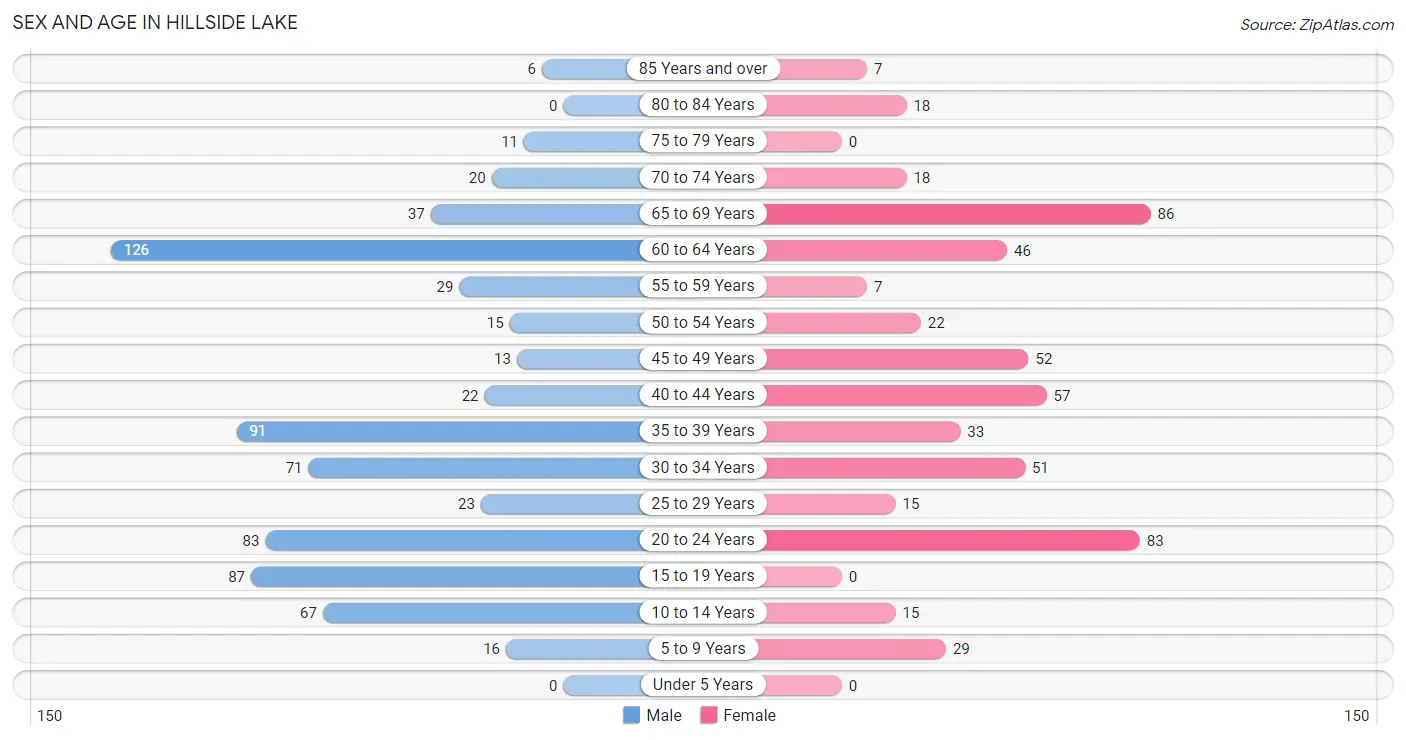
Sex and Age in Hillside Lake
The most populous age groups in Hillside Lake are 60 to 64 Years (126 | 17.6%) for men and 65 to 69 Years (86 | 16.0%) for women.
| Age Bracket | Male | Female |
| Under 5 Years | 0 (0.0%) | 0 (0.0%) |
| 5 to 9 Years | 16 (2.2%) | 29 (5.4%) |
| 10 to 14 Years | 67 (9.3%) | 15 (2.8%) |
| 15 to 19 Years | 87 (12.1%) | 0 (0.0%) |
| 20 to 24 Years | 83 (11.6%) | 83 (15.4%) |
| 25 to 29 Years | 23 (3.2%) | 15 (2.8%) |
| 30 to 34 Years | 71 (9.9%) | 51 (9.5%) |
| 35 to 39 Years | 91 (12.7%) | 33 (6.1%) |
| 40 to 44 Years | 22 (3.1%) | 57 (10.6%) |
| 45 to 49 Years | 13 (1.8%) | 52 (9.7%) |
| 50 to 54 Years | 15 (2.1%) | 22 (4.1%) |
| 55 to 59 Years | 29 (4.0%) | 7 (1.3%) |
| 60 to 64 Years | 126 (17.6%) | 46 (8.5%) |
| 65 to 69 Years | 37 (5.2%) | 86 (16.0%) |
| 70 to 74 Years | 20 (2.8%) | 18 (3.3%) |
| 75 to 79 Years | 11 (1.5%) | 0 (0.0%) |
| 80 to 84 Years | 0 (0.0%) | 18 (3.3%) |
| 85 Years and over | 6 (0.8%) | 7 (1.3%) |
| Total | 717 (100.0%) | 539 (100.0%) |
Families and Households in Hillside Lake
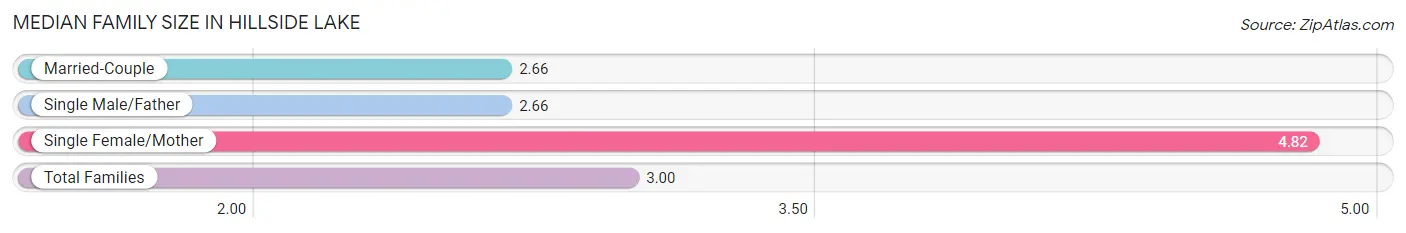
Median Family Size in Hillside Lake
The median family size in Hillside Lake is 3.00 persons per family, with single female/mother families (60 | 15.8%) accounting for the largest median family size of 4.82 persons per family. On the other hand, married-couple families (267 | 70.3%) represent the smallest median family size with 2.66 persons per family.
| Family Type | # Families | Family Size |
| Married-Couple | 267 (70.3%) | 2.66 |
| Single Male/Father | 53 (14.0%) | 2.66 |
| Single Female/Mother | 60 (15.8%) | 4.82 |
| Total Families | 380 (100.0%) | 3.00 |
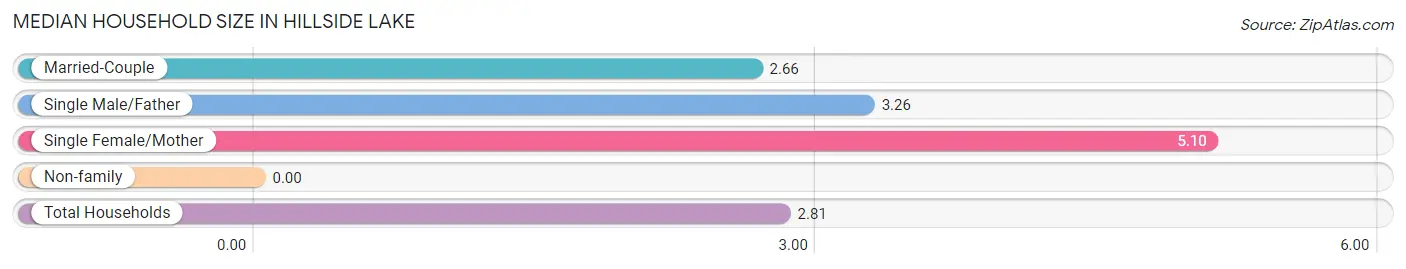
Median Household Size in Hillside Lake
| Household Type | # Households | Household Size |
| Married-Couple | 267 (59.7%) | 2.66 |
| Single Male/Father | 53 (11.9%) | 3.26 |
| Single Female/Mother | 60 (13.4%) | 5.10 |
| Non-family | 67 (15.0%) | - |
| Total Households | 447 (100.0%) | 2.81 |
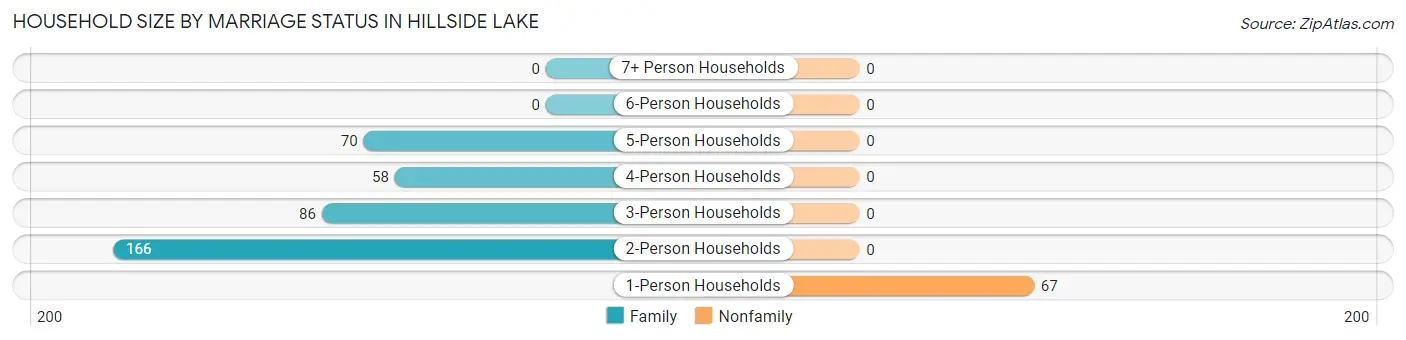
Household Size by Marriage Status in Hillside Lake
Out of a total of 447 households in Hillside Lake, 380 (85.0%) are family households, while 67 (15.0%) are nonfamily households. The most numerous type of family households are 2-person households, comprising 166, and the most common type of nonfamily households are 1-person households, comprising 67.
| Household Size | Family Households | Nonfamily Households |
| 1-Person Households | - | 67 (15.0%) |
| 2-Person Households | 166 (37.1%) | 0 (0.0%) |
| 3-Person Households | 86 (19.2%) | 0 (0.0%) |
| 4-Person Households | 58 (13.0%) | 0 (0.0%) |
| 5-Person Households | 70 (15.7%) | 0 (0.0%) |
| 6-Person Households | 0 (0.0%) | 0 (0.0%) |
| 7+ Person Households | 0 (0.0%) | 0 (0.0%) |
| Total | 380 (85.0%) | 67 (15.0%) |
Female Fertility in Hillside Lake
Fertility by Age in Hillside Lake
| Age Bracket | Women with Births | Births / 1,000 Women |
| 15 to 19 years | 0 (0.0%) | 0.0 |
| 20 to 34 years | 0 (0.0%) | 0.0 |
| 35 to 50 years | 0 (0.0%) | 0.0 |
| Total | 0 (0.0%) | 0.0 |
Fertility by Age by Marriage Status in Hillside Lake
| Age Bracket | Married | Unmarried |
| 15 to 19 years | 0 (0.0%) | 0 (0.0%) |
| 20 to 34 years | 0 (0.0%) | 0 (0.0%) |
| 35 to 50 years | 0 (0.0%) | 0 (0.0%) |
| Total | 0 (0.0%) | 0 (0.0%) |
Fertility by Education in Hillside Lake
| Educational Attainment | Women with Births | Births / 1,000 Women |
| Less than High School | 0 (0.0%) | 0.0 |
| High School Diploma | 0 (0.0%) | 0.0 |
| College or Associate's Degree | 0 (0.0%) | 0.0 |
| Bachelor's Degree | 0 (0.0%) | 0.0 |
| Graduate Degree | 0 (0.0%) | 0.0 |
| Total | 0 (0.0%) | 0.0 |
Fertility by Education by Marriage Status in Hillside Lake
| Educational Attainment | Married | Unmarried |
| Less than High School | 0 (0.0%) | 0 (0.0%) |
| High School Diploma | 0 (0.0%) | 0 (0.0%) |
| College or Associate's Degree | 0 (0.0%) | 0 (0.0%) |
| Bachelor's Degree | 0 (0.0%) | 0 (0.0%) |
| Graduate Degree | 0 (0.0%) | 0 (0.0%) |
| Total | 0 (0.0%) | 0 (0.0%) |
Employment Characteristics in Hillside Lake
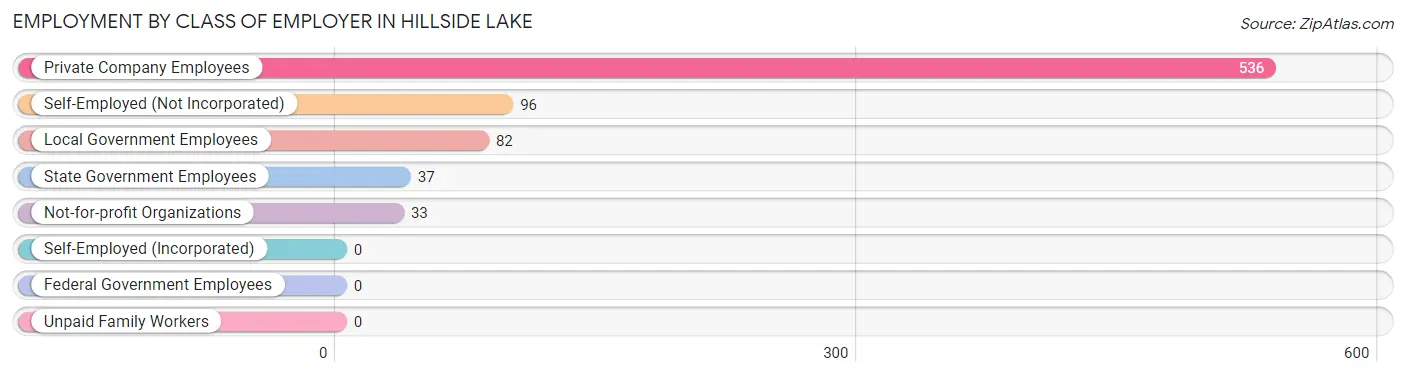
Employment by Class of Employer in Hillside Lake
Among the 784 employed individuals in Hillside Lake, private company employees (536 | 68.4%), self-employed (not incorporated) (96 | 12.2%), and local government employees (82 | 10.5%) make up the most common classes of employment.
| Employer Class | # Employees | % Employees |
| Private Company Employees | 536 | 68.4% |
| Self-Employed (Incorporated) | 0 | 0.0% |
| Self-Employed (Not Incorporated) | 96 | 12.2% |
| Not-for-profit Organizations | 33 | 4.2% |
| Local Government Employees | 82 | 10.5% |
| State Government Employees | 37 | 4.7% |
| Federal Government Employees | 0 | 0.0% |
| Unpaid Family Workers | 0 | 0.0% |
| Total | 784 | 100.0% |
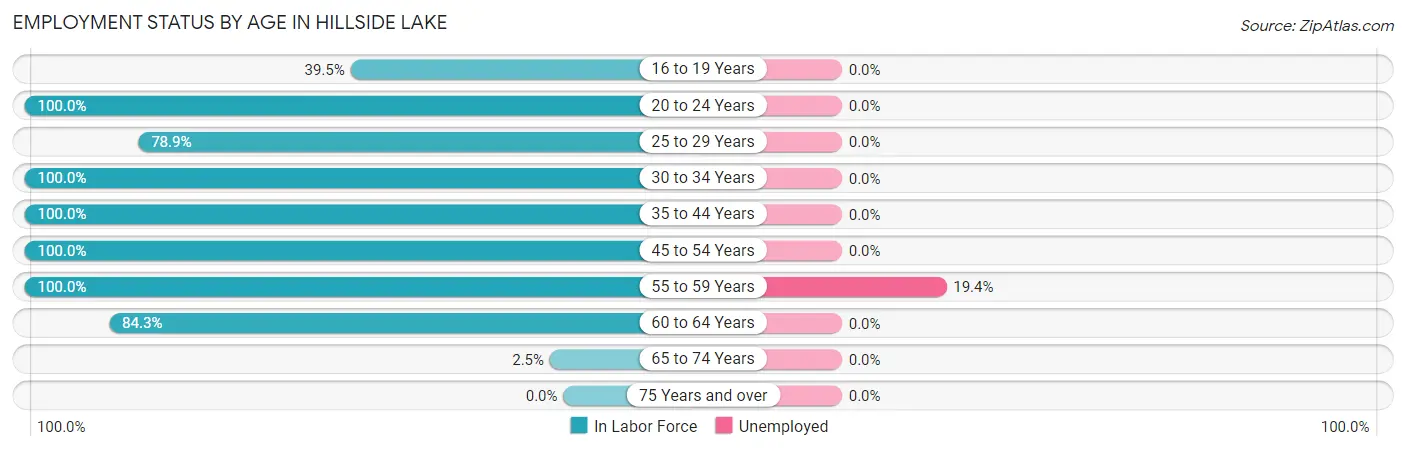
Employment Status by Age in Hillside Lake
According to the labor force statistics for Hillside Lake, out of the total population over 16 years of age (1,080), 76.2% or 823 individuals are in the labor force, with 0.9% or 7 of them unemployed. The age group with the highest labor force participation rate is 20 to 24 years, with 100.0% or 166 individuals in the labor force. Within the labor force, the 55 to 59 years age range has the highest percentage of unemployed individuals, with 19.4% or 7 of them being unemployed.
| Age Bracket | In Labor Force | Unemployed |
| 16 to 19 Years | 15 (39.5%) | 0 (0.0%) |
| 20 to 24 Years | 166 (100.0%) | 0 (0.0%) |
| 25 to 29 Years | 30 (78.9%) | 0 (0.0%) |
| 30 to 34 Years | 122 (100.0%) | 0 (0.0%) |
| 35 to 44 Years | 203 (100.0%) | 0 (0.0%) |
| 45 to 54 Years | 102 (100.0%) | 0 (0.0%) |
| 55 to 59 Years | 36 (100.0%) | 7 (19.4%) |
| 60 to 64 Years | 145 (84.3%) | 0 (0.0%) |
| 65 to 74 Years | 4 (2.5%) | 0 (0.0%) |
| 75 Years and over | 0 (0.0%) | 0 (0.0%) |
| Total | 823 (76.2%) | 7 (0.9%) |
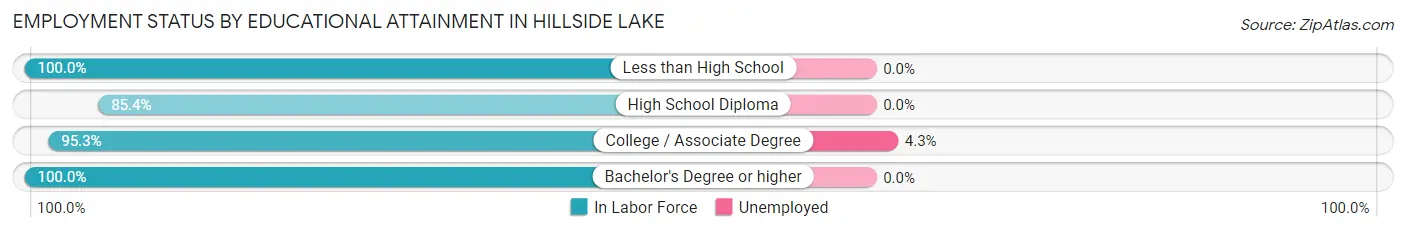
Employment Status by Educational Attainment in Hillside Lake
According to labor force statistics for Hillside Lake, 94.8% of individuals (638) out of the total population between 25 and 64 years of age (673) are in the labor force, with 1.1% or 7 of them being unemployed. The group with the highest labor force participation rate are those with the educational attainment of less than high school, with 100.0% or 19 individuals in the labor force. Within the labor force, individuals with college / associate degree education have the highest percentage of unemployment, with 4.3% or 7 of them being unemployed.
| Educational Attainment | In Labor Force | Unemployed |
| Less than High School | 19 (100.0%) | 0 (0.0%) |
| High School Diploma | 158 (85.4%) | 0 (0.0%) |
| College / Associate Degree | 161 (95.3%) | 7 (4.3%) |
| Bachelor's Degree or higher | 300 (100.0%) | 0 (0.0%) |
| Total | 638 (94.8%) | 7 (1.1%) |
Employment Occupations by Sex in Hillside Lake
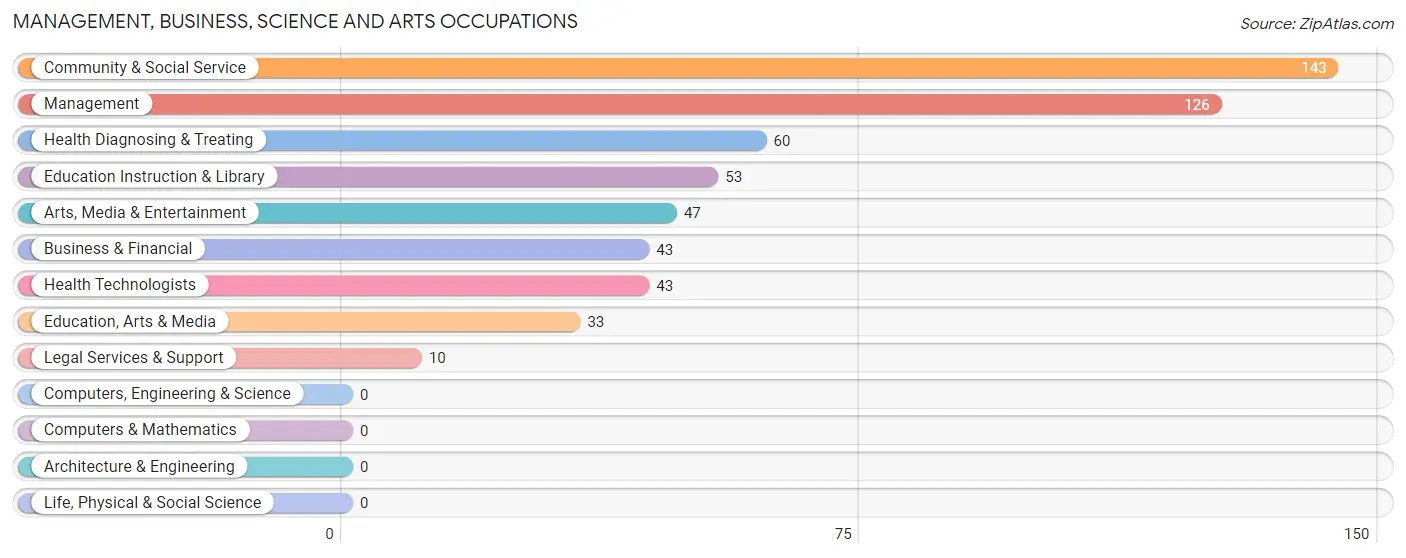
Management, Business, Science and Arts Occupations
The most common Management, Business, Science and Arts occupations in Hillside Lake are Community & Social Service (143 | 17.5%), Management (126 | 15.4%), Health Diagnosing & Treating (60 | 7.3%), Education Instruction & Library (53 | 6.5%), and Arts, Media & Entertainment (47 | 5.8%).
Management, Business, Science and Arts Occupations by Sex
Within the Management, Business, Science and Arts occupations in Hillside Lake, the most male-oriented occupations are Education, Arts & Media (100.0%), Health Technologists (83.7%), and Business & Financial (81.4%), while the most female-oriented occupations are Legal Services & Support (100.0%), Management (94.4%), and Arts, Media & Entertainment (68.1%).
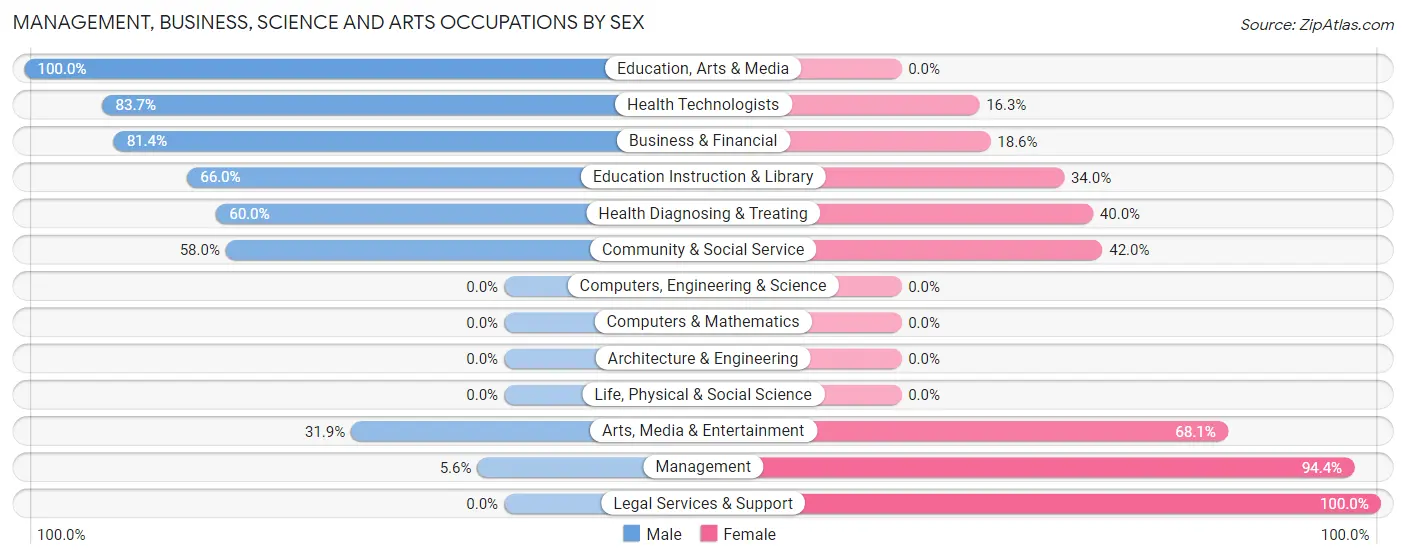
| Occupation | Male | Female |
| Management | 7 (5.6%) | 119 (94.4%) |
| Business & Financial | 35 (81.4%) | 8 (18.6%) |
| Computers, Engineering & Science | 0 (0.0%) | 0 (0.0%) |
| Computers & Mathematics | 0 (0.0%) | 0 (0.0%) |
| Architecture & Engineering | 0 (0.0%) | 0 (0.0%) |
| Life, Physical & Social Science | 0 (0.0%) | 0 (0.0%) |
| Community & Social Service | 83 (58.0%) | 60 (42.0%) |
| Education, Arts & Media | 33 (100.0%) | 0 (0.0%) |
| Legal Services & Support | 0 (0.0%) | 10 (100.0%) |
| Education Instruction & Library | 35 (66.0%) | 18 (34.0%) |
| Arts, Media & Entertainment | 15 (31.9%) | 32 (68.1%) |
| Health Diagnosing & Treating | 36 (60.0%) | 24 (40.0%) |
| Health Technologists | 36 (83.7%) | 7 (16.3%) |
| Total (Category) | 161 (43.3%) | 211 (56.7%) |
| Total (Overall) | 457 (56.0%) | 359 (44.0%) |
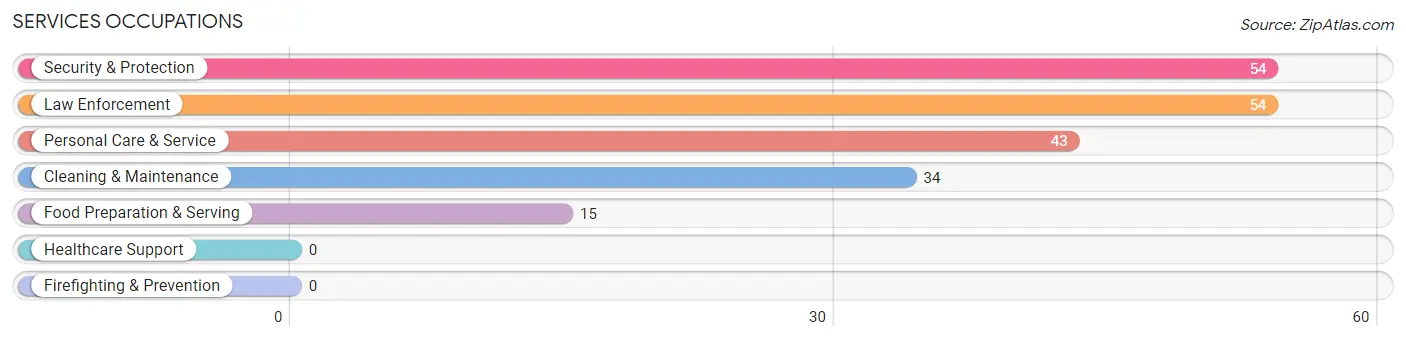
Services Occupations
The most common Services occupations in Hillside Lake are Security & Protection (54 | 6.6%), Law Enforcement (54 | 6.6%), Personal Care & Service (43 | 5.3%), Cleaning & Maintenance (34 | 4.2%), and Food Preparation & Serving (15 | 1.8%).
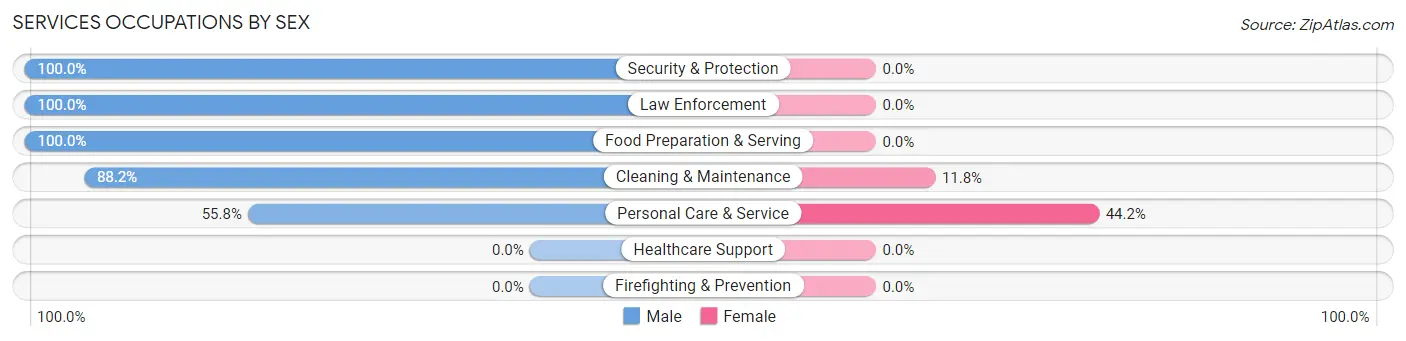
Services Occupations by Sex
Within the Services occupations in Hillside Lake, the most male-oriented occupations are Security & Protection (100.0%), Law Enforcement (100.0%), and Food Preparation & Serving (100.0%), while the most female-oriented occupations are Personal Care & Service (44.2%), and Cleaning & Maintenance (11.8%).
| Occupation | Male | Female |
| Healthcare Support | 0 (0.0%) | 0 (0.0%) |
| Security & Protection | 54 (100.0%) | 0 (0.0%) |
| Firefighting & Prevention | 0 (0.0%) | 0 (0.0%) |
| Law Enforcement | 54 (100.0%) | 0 (0.0%) |
| Food Preparation & Serving | 15 (100.0%) | 0 (0.0%) |
| Cleaning & Maintenance | 30 (88.2%) | 4 (11.8%) |
| Personal Care & Service | 24 (55.8%) | 19 (44.2%) |
| Total (Category) | 123 (84.3%) | 23 (15.8%) |
| Total (Overall) | 457 (56.0%) | 359 (44.0%) |
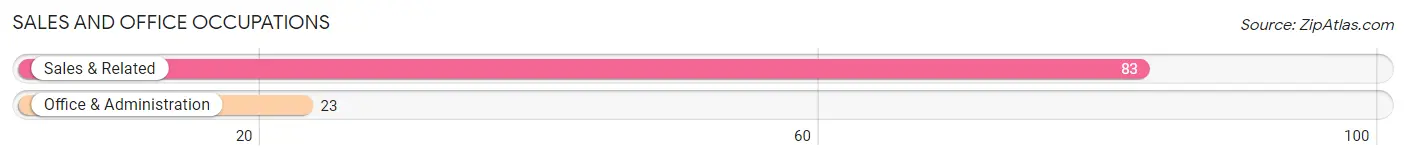
Sales and Office Occupations
The most common Sales and Office occupations in Hillside Lake are Sales & Related (83 | 10.2%), and Office & Administration (23 | 2.8%).
Sales and Office Occupations by Sex
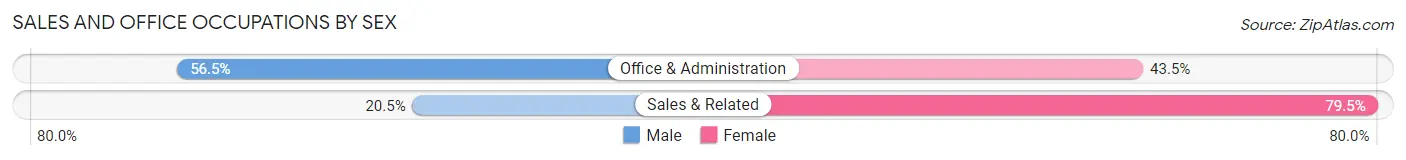
| Occupation | Male | Female |
| Sales & Related | 17 (20.5%) | 66 (79.5%) |
| Office & Administration | 13 (56.5%) | 10 (43.5%) |
| Total (Category) | 30 (28.3%) | 76 (71.7%) |
| Total (Overall) | 457 (56.0%) | 359 (44.0%) |
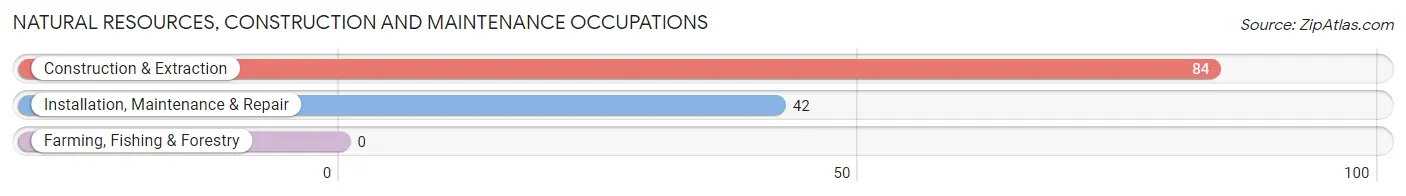
Natural Resources, Construction and Maintenance Occupations
The most common Natural Resources, Construction and Maintenance occupations in Hillside Lake are Construction & Extraction (84 | 10.3%), and Installation, Maintenance & Repair (42 | 5.1%).
Natural Resources, Construction and Maintenance Occupations by Sex
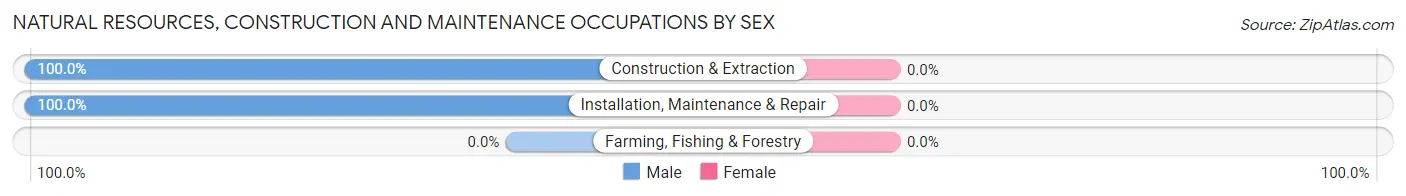
| Occupation | Male | Female |
| Farming, Fishing & Forestry | 0 (0.0%) | 0 (0.0%) |
| Construction & Extraction | 84 (100.0%) | 0 (0.0%) |
| Installation, Maintenance & Repair | 42 (100.0%) | 0 (0.0%) |
| Total (Category) | 126 (100.0%) | 0 (0.0%) |
| Total (Overall) | 457 (56.0%) | 359 (44.0%) |
Production, Transportation and Moving Occupations
The most common Production, Transportation and Moving occupations in Hillside Lake are Production (49 | 6.0%), and Transportation (17 | 2.1%).
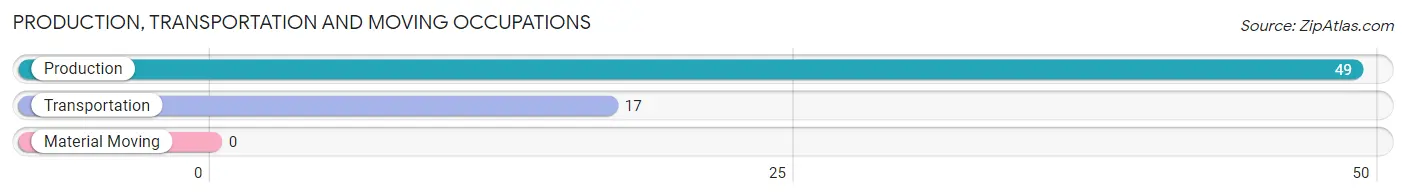
Production, Transportation and Moving Occupations by Sex
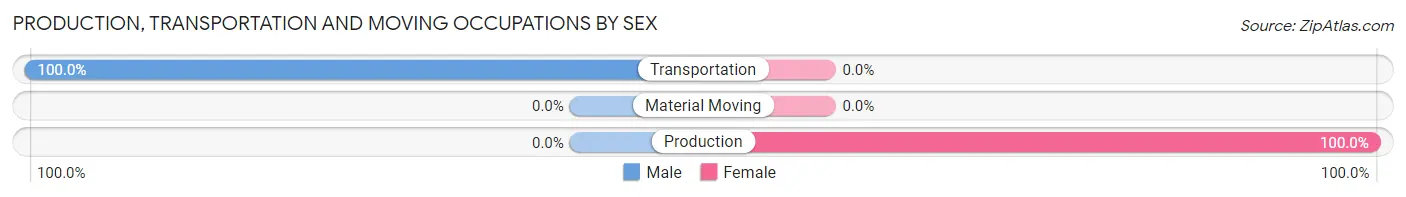
| Occupation | Male | Female |
| Production | 0 (0.0%) | 49 (100.0%) |
| Transportation | 17 (100.0%) | 0 (0.0%) |
| Material Moving | 0 (0.0%) | 0 (0.0%) |
| Total (Category) | 17 (25.8%) | 49 (74.2%) |
| Total (Overall) | 457 (56.0%) | 359 (44.0%) |
Employment Industries by Sex in Hillside Lake
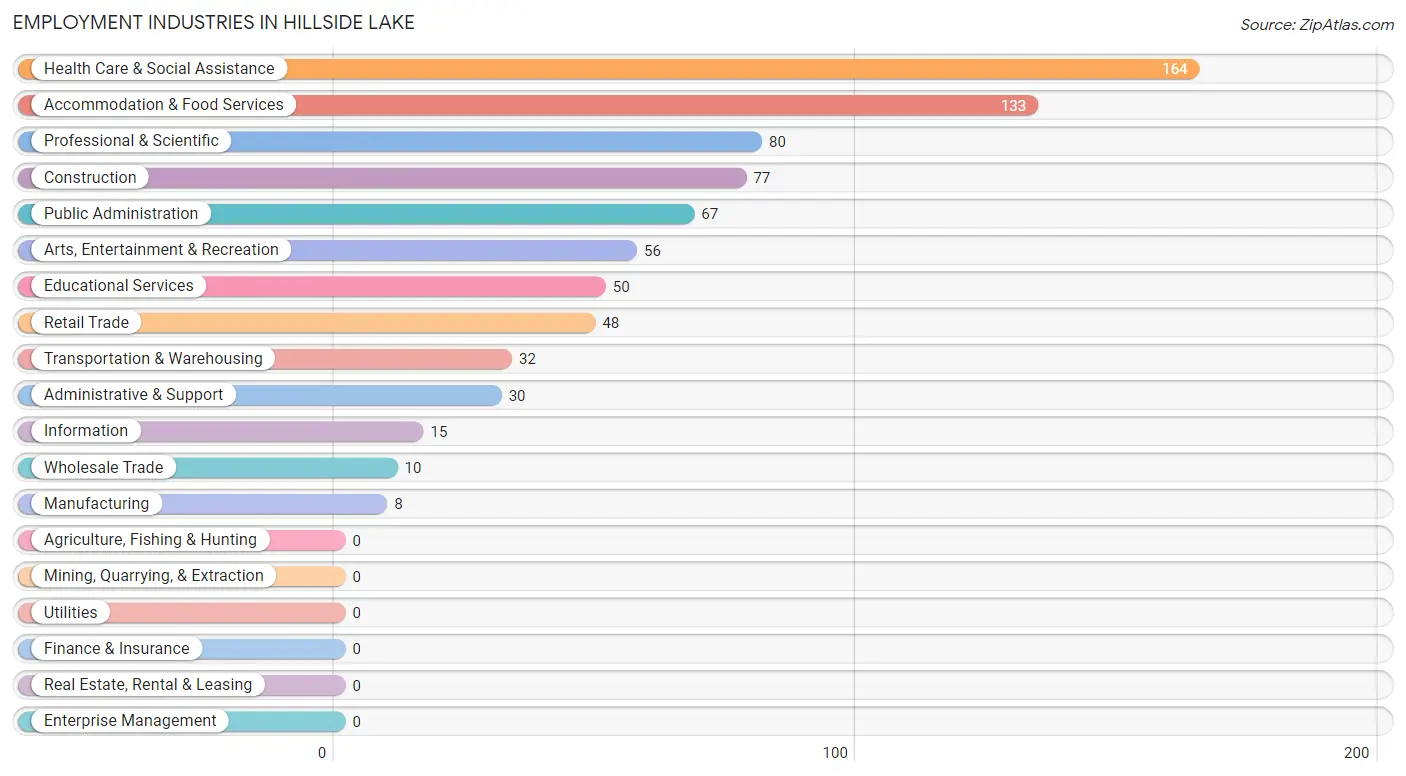
Employment Industries in Hillside Lake
The major employment industries in Hillside Lake include Health Care & Social Assistance (164 | 20.1%), Accommodation & Food Services (133 | 16.3%), Professional & Scientific (80 | 9.8%), Construction (77 | 9.4%), and Public Administration (67 | 8.2%).
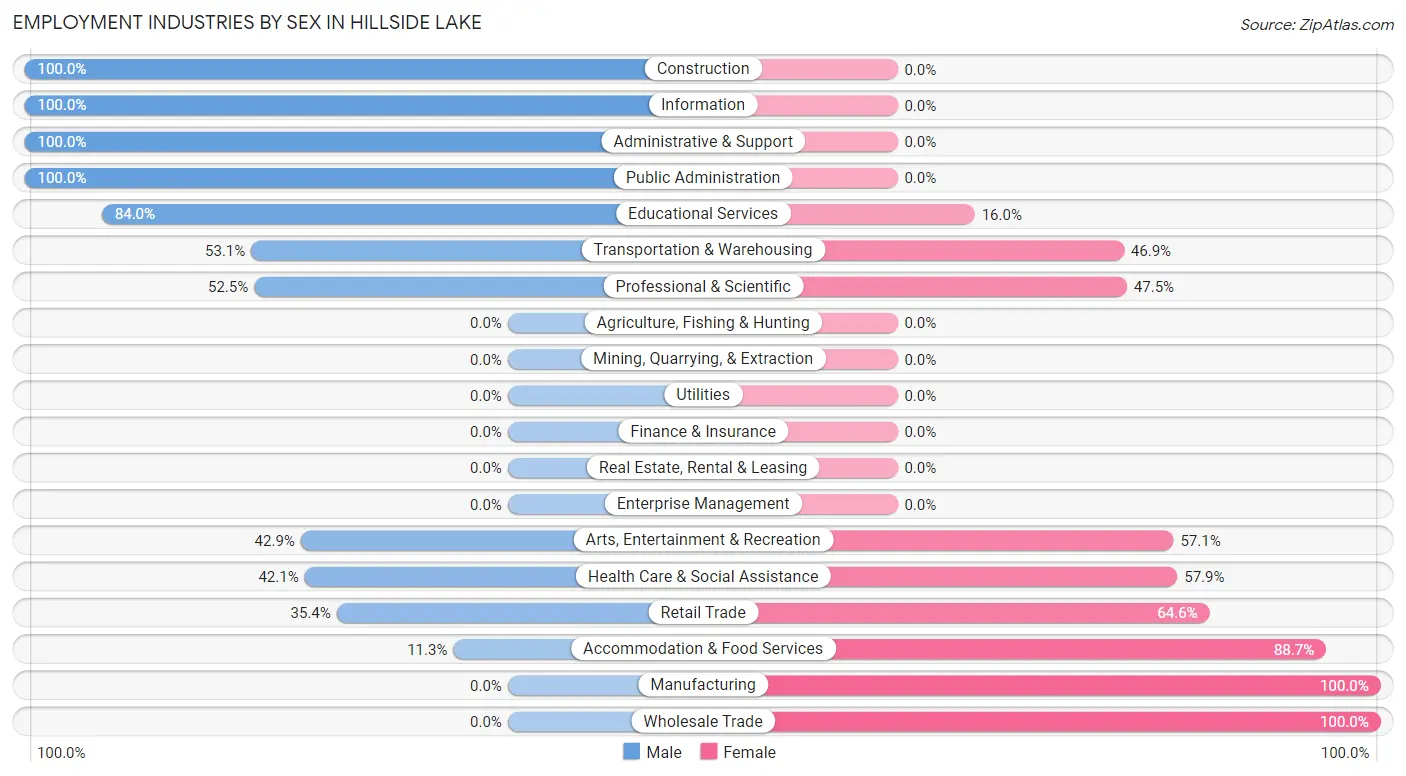
Employment Industries by Sex in Hillside Lake
The Hillside Lake industries that see more men than women are Construction (100.0%), Information (100.0%), and Administrative & Support (100.0%), whereas the industries that tend to have a higher number of women are Manufacturing (100.0%), Wholesale Trade (100.0%), and Accommodation & Food Services (88.7%).
| Industry | Male | Female |
| Agriculture, Fishing & Hunting | 0 (0.0%) | 0 (0.0%) |
| Mining, Quarrying, & Extraction | 0 (0.0%) | 0 (0.0%) |
| Construction | 77 (100.0%) | 0 (0.0%) |
| Manufacturing | 0 (0.0%) | 8 (100.0%) |
| Wholesale Trade | 0 (0.0%) | 10 (100.0%) |
| Retail Trade | 17 (35.4%) | 31 (64.6%) |
| Transportation & Warehousing | 17 (53.1%) | 15 (46.9%) |
| Utilities | 0 (0.0%) | 0 (0.0%) |
| Information | 15 (100.0%) | 0 (0.0%) |
| Finance & Insurance | 0 (0.0%) | 0 (0.0%) |
| Real Estate, Rental & Leasing | 0 (0.0%) | 0 (0.0%) |
| Professional & Scientific | 42 (52.5%) | 38 (47.5%) |
| Enterprise Management | 0 (0.0%) | 0 (0.0%) |
| Administrative & Support | 30 (100.0%) | 0 (0.0%) |
| Educational Services | 42 (84.0%) | 8 (16.0%) |
| Health Care & Social Assistance | 69 (42.1%) | 95 (57.9%) |
| Arts, Entertainment & Recreation | 24 (42.9%) | 32 (57.1%) |
| Accommodation & Food Services | 15 (11.3%) | 118 (88.7%) |
| Public Administration | 67 (100.0%) | 0 (0.0%) |
| Total | 457 (56.0%) | 359 (44.0%) |
Education in Hillside Lake
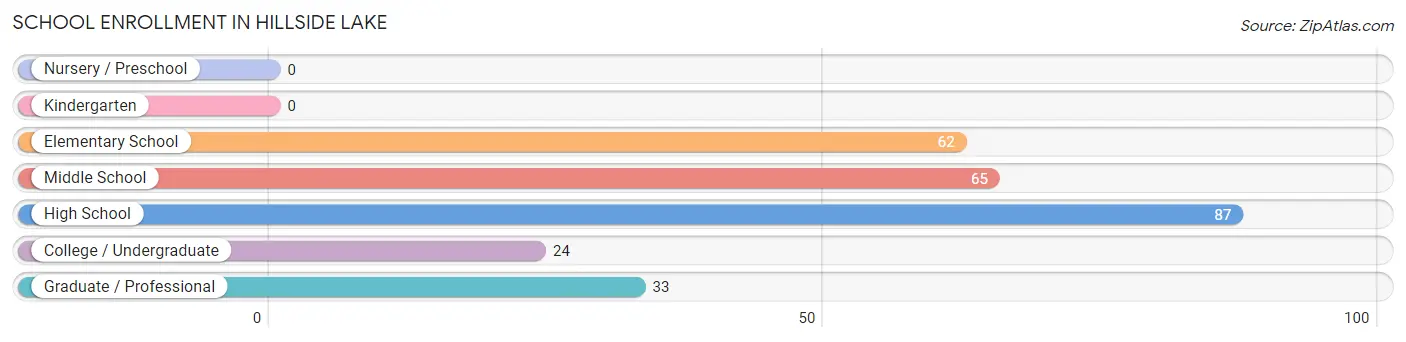
School Enrollment in Hillside Lake
The most common levels of schooling among the 271 students in Hillside Lake are high school (87 | 32.1%), middle school (65 | 24.0%), and elementary school (62 | 22.9%).
| School Level | # Students | % Students |
| Nursery / Preschool | 0 | 0.0% |
| Kindergarten | 0 | 0.0% |
| Elementary School | 62 | 22.9% |
| Middle School | 65 | 24.0% |
| High School | 87 | 32.1% |
| College / Undergraduate | 24 | 8.9% |
| Graduate / Professional | 33 | 12.2% |
| Total | 271 | 100.0% |
School Enrollment by Age by Funding Source in Hillside Lake
Out of a total of 271 students who are enrolled in schools in Hillside Lake, 24 (8.9%) attend a private institution, while the remaining 247 (91.1%) are enrolled in public schools. The age group of 20 to 24 year olds has the highest likelihood of being enrolled in private schools, with 24 (100.0% in the age bracket) enrolled. Conversely, the age group of 5 to 9 year old has the lowest likelihood of being enrolled in a private school, with 45 (100.0% in the age bracket) attending a public institution.
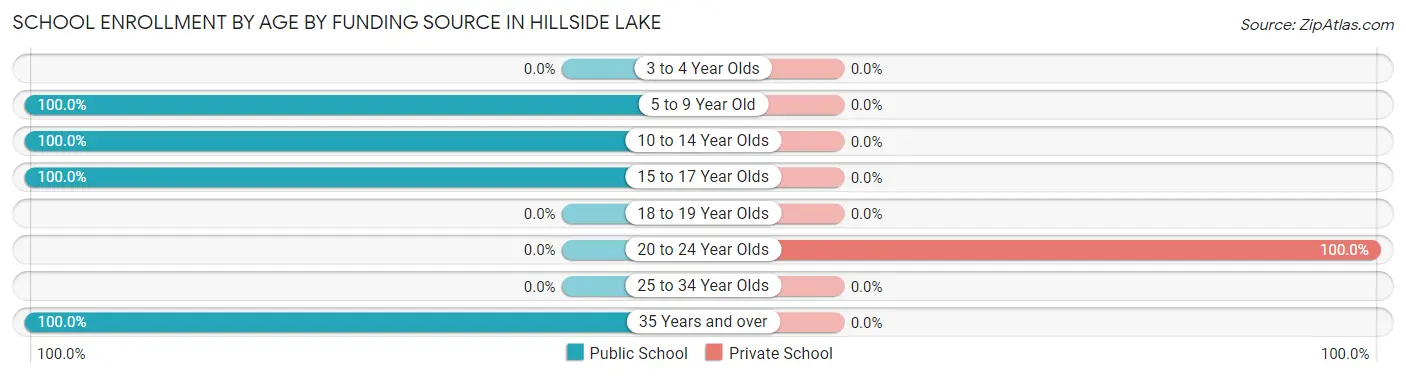
| Age Bracket | Public School | Private School |
| 3 to 4 Year Olds | 0 (0.0%) | 0 (0.0%) |
| 5 to 9 Year Old | 45 (100.0%) | 0 (0.0%) |
| 10 to 14 Year Olds | 82 (100.0%) | 0 (0.0%) |
| 15 to 17 Year Olds | 87 (100.0%) | 0 (0.0%) |
| 18 to 19 Year Olds | 0 (0.0%) | 0 (0.0%) |
| 20 to 24 Year Olds | 0 (0.0%) | 24 (100.0%) |
| 25 to 34 Year Olds | 0 (0.0%) | 0 (0.0%) |
| 35 Years and over | 33 (100.0%) | 0 (0.0%) |
| Total | 247 (91.1%) | 24 (8.9%) |
Educational Attainment by Field of Study in Hillside Lake
Visual & performing arts (77 | 22.1%), business (55 | 15.8%), science & technology (42 | 12.1%), education (40 | 11.5%), and bio, nature & agricultural (36 | 10.3%) are the most common fields of study among 348 individuals in Hillside Lake who have obtained a bachelor's degree or higher.
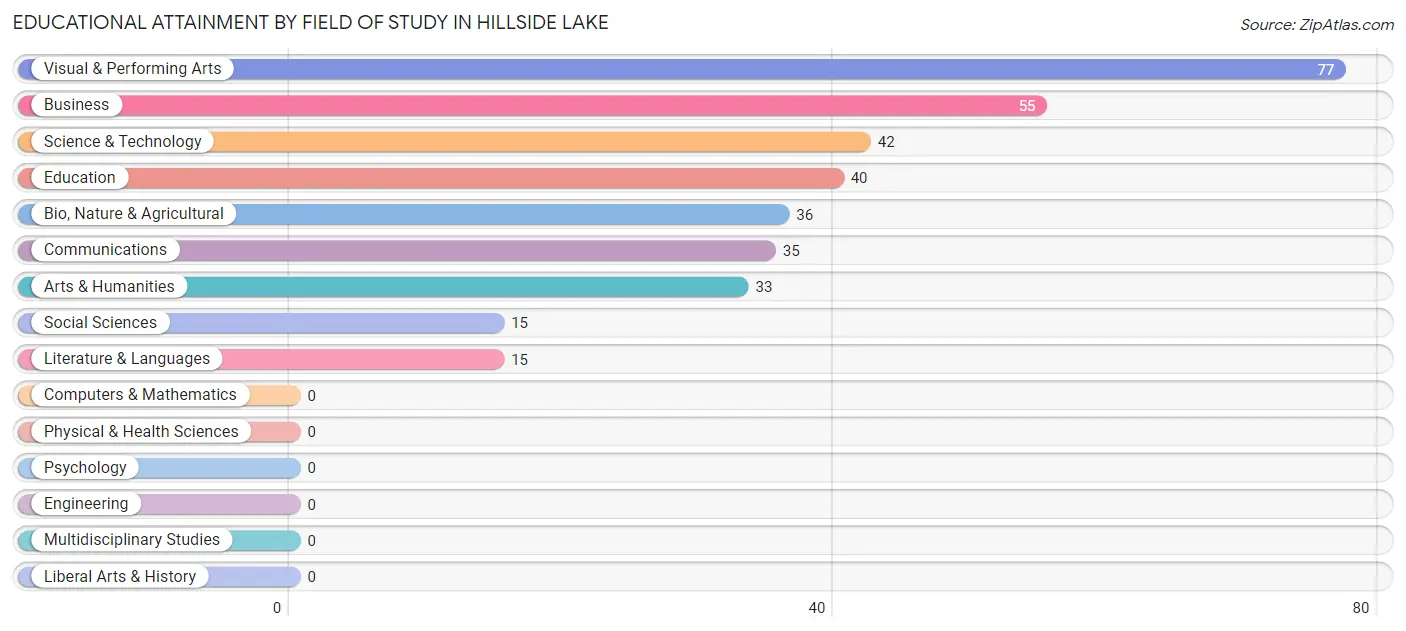
| Field of Study | # Graduates | % Graduates |
| Computers & Mathematics | 0 | 0.0% |
| Bio, Nature & Agricultural | 36 | 10.3% |
| Physical & Health Sciences | 0 | 0.0% |
| Psychology | 0 | 0.0% |
| Social Sciences | 15 | 4.3% |
| Engineering | 0 | 0.0% |
| Multidisciplinary Studies | 0 | 0.0% |
| Science & Technology | 42 | 12.1% |
| Business | 55 | 15.8% |
| Education | 40 | 11.5% |
| Literature & Languages | 15 | 4.3% |
| Liberal Arts & History | 0 | 0.0% |
| Visual & Performing Arts | 77 | 22.1% |
| Communications | 35 | 10.1% |
| Arts & Humanities | 33 | 9.5% |
| Total | 348 | 100.0% |
Transportation & Commute in Hillside Lake
Vehicle Availability by Sex in Hillside Lake
The most prevalent vehicle ownership categories in Hillside Lake are males with 3 vehicles (164, accounting for 35.9%) and females with 3 vehicles (144, making up 50.1%).
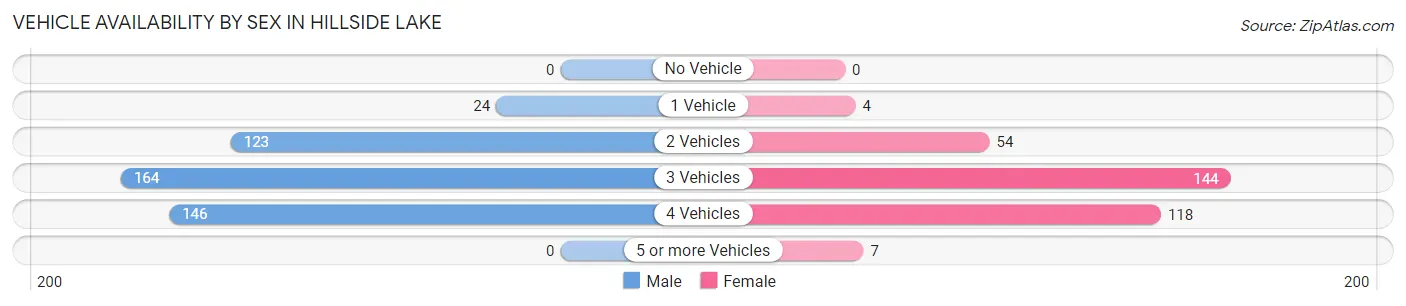
| Vehicles Available | Male | Female |
| No Vehicle | 0 (0.0%) | 0 (0.0%) |
| 1 Vehicle | 24 (5.2%) | 4 (1.2%) |
| 2 Vehicles | 123 (26.9%) | 54 (16.5%) |
| 3 Vehicles | 164 (35.9%) | 144 (44.0%) |
| 4 Vehicles | 146 (32.0%) | 118 (36.1%) |
| 5 or more Vehicles | 0 (0.0%) | 7 (2.1%) |
| Total | 457 (100.0%) | 327 (100.0%) |
Commute Time in Hillside Lake
The most frequently occuring commute durations in Hillside Lake are 30 to 34 minutes (246 commuters, 32.4%), 25 to 29 minutes (131 commuters, 17.2%), and 5 to 9 minutes (118 commuters, 15.5%).
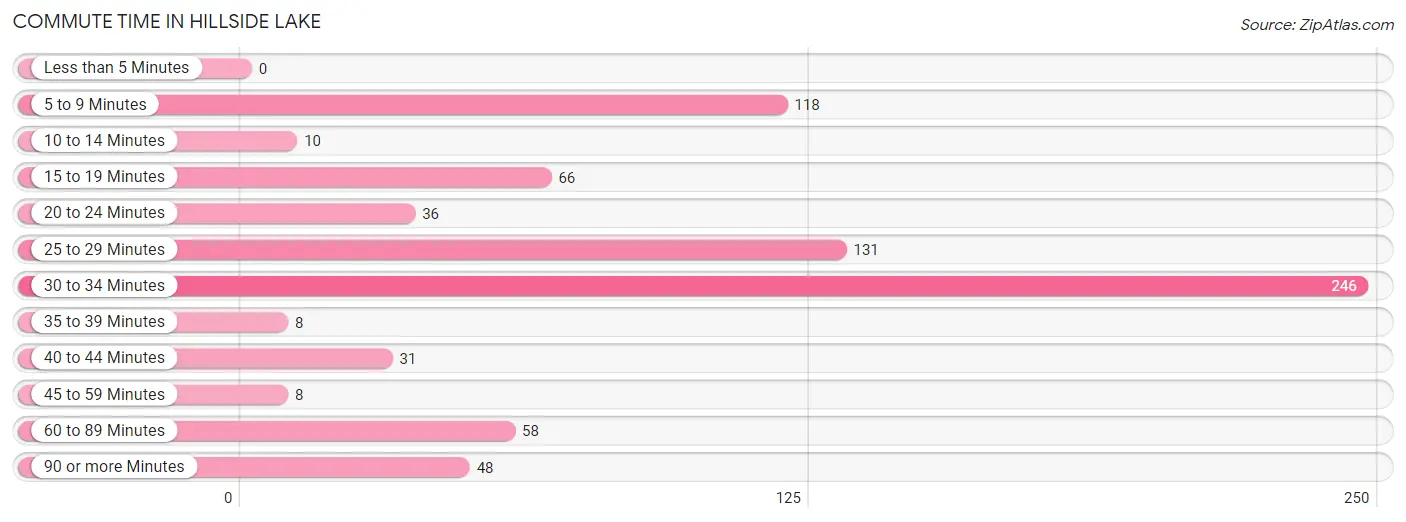
| Commute Time | # Commuters | % Commuters |
| Less than 5 Minutes | 0 | 0.0% |
| 5 to 9 Minutes | 118 | 15.5% |
| 10 to 14 Minutes | 10 | 1.3% |
| 15 to 19 Minutes | 66 | 8.7% |
| 20 to 24 Minutes | 36 | 4.7% |
| 25 to 29 Minutes | 131 | 17.2% |
| 30 to 34 Minutes | 246 | 32.4% |
| 35 to 39 Minutes | 8 | 1.1% |
| 40 to 44 Minutes | 31 | 4.1% |
| 45 to 59 Minutes | 8 | 1.1% |
| 60 to 89 Minutes | 58 | 7.6% |
| 90 or more Minutes | 48 | 6.3% |
Commute Time by Sex in Hillside Lake
The most common commute times in Hillside Lake are 30 to 34 minutes (182 commuters, 40.4%) for males and 5 to 9 minutes (118 commuters, 38.1%) for females.
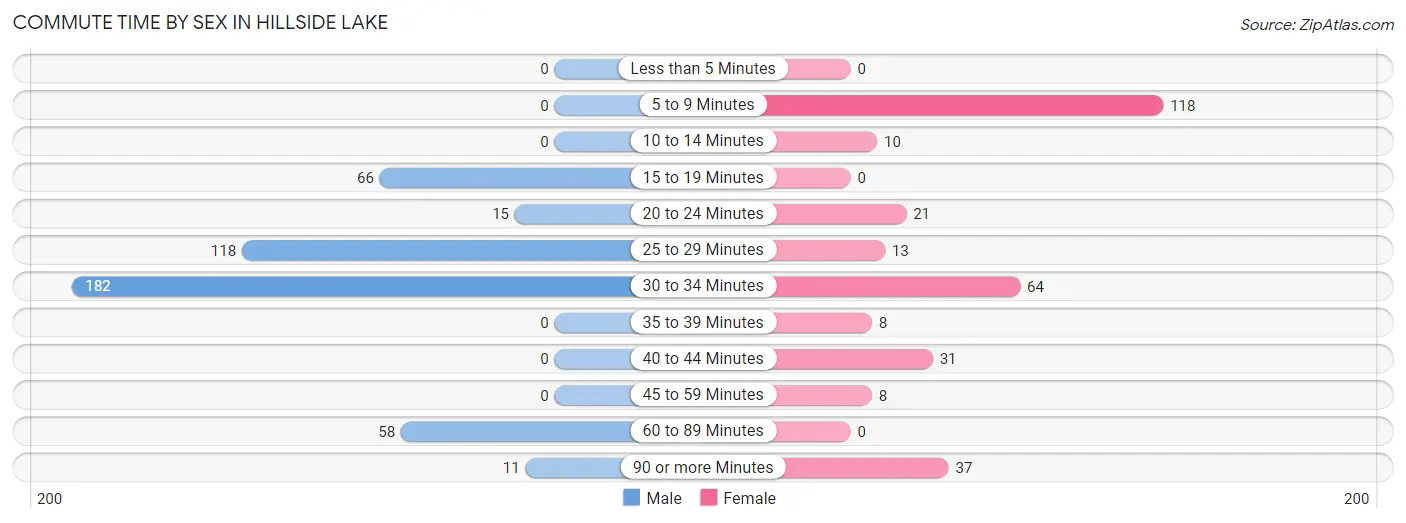
| Commute Time | Male | Female |
| Less than 5 Minutes | 0 (0.0%) | 0 (0.0%) |
| 5 to 9 Minutes | 0 (0.0%) | 118 (38.1%) |
| 10 to 14 Minutes | 0 (0.0%) | 10 (3.2%) |
| 15 to 19 Minutes | 66 (14.7%) | 0 (0.0%) |
| 20 to 24 Minutes | 15 (3.3%) | 21 (6.8%) |
| 25 to 29 Minutes | 118 (26.2%) | 13 (4.2%) |
| 30 to 34 Minutes | 182 (40.4%) | 64 (20.6%) |
| 35 to 39 Minutes | 0 (0.0%) | 8 (2.6%) |
| 40 to 44 Minutes | 0 (0.0%) | 31 (10.0%) |
| 45 to 59 Minutes | 0 (0.0%) | 8 (2.6%) |
| 60 to 89 Minutes | 58 (12.9%) | 0 (0.0%) |
| 90 or more Minutes | 11 (2.4%) | 37 (11.9%) |
Time of Departure to Work by Sex in Hillside Lake
The most frequent times of departure to work in Hillside Lake are 7:30 AM to 7:59 AM (88, 19.6%) for males and 8:30 AM to 8:59 AM (94, 30.3%) for females.
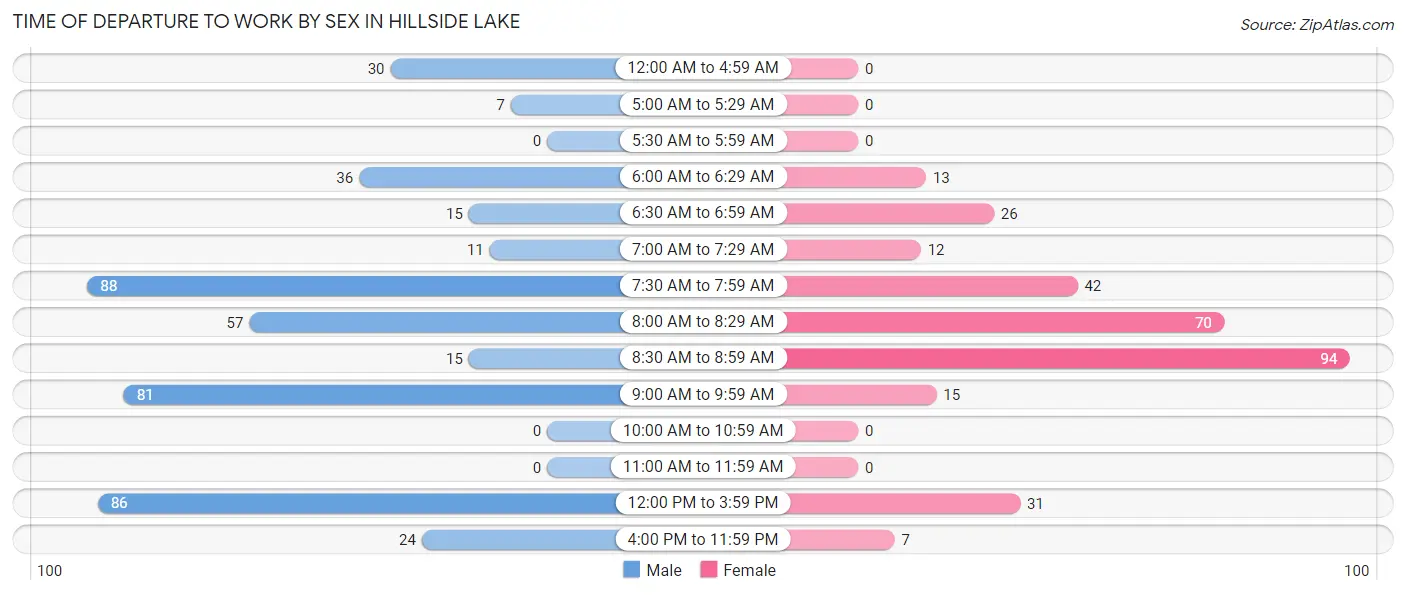
| Time of Departure | Male | Female |
| 12:00 AM to 4:59 AM | 30 (6.7%) | 0 (0.0%) |
| 5:00 AM to 5:29 AM | 7 (1.6%) | 0 (0.0%) |
| 5:30 AM to 5:59 AM | 0 (0.0%) | 0 (0.0%) |
| 6:00 AM to 6:29 AM | 36 (8.0%) | 13 (4.2%) |
| 6:30 AM to 6:59 AM | 15 (3.3%) | 26 (8.4%) |
| 7:00 AM to 7:29 AM | 11 (2.4%) | 12 (3.9%) |
| 7:30 AM to 7:59 AM | 88 (19.6%) | 42 (13.6%) |
| 8:00 AM to 8:29 AM | 57 (12.7%) | 70 (22.6%) |
| 8:30 AM to 8:59 AM | 15 (3.3%) | 94 (30.3%) |
| 9:00 AM to 9:59 AM | 81 (18.0%) | 15 (4.8%) |
| 10:00 AM to 10:59 AM | 0 (0.0%) | 0 (0.0%) |
| 11:00 AM to 11:59 AM | 0 (0.0%) | 0 (0.0%) |
| 12:00 PM to 3:59 PM | 86 (19.1%) | 31 (10.0%) |
| 4:00 PM to 11:59 PM | 24 (5.3%) | 7 (2.3%) |
| Total | 450 (100.0%) | 310 (100.0%) |
Housing Occupancy in Hillside Lake
Occupancy by Ownership in Hillside Lake
Of the total 447 dwellings in Hillside Lake, owner-occupied units account for 447 (100.0%), while renter-occupied units make up 0 (0.0%).
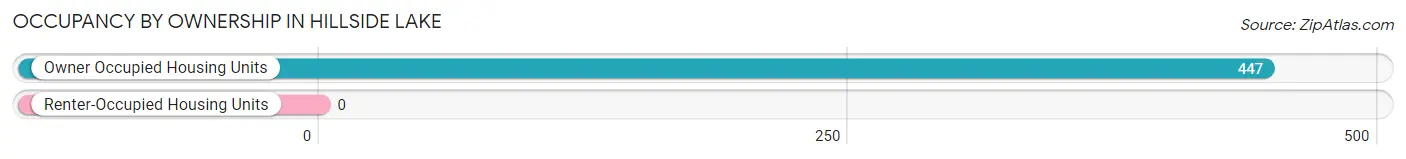
| Occupancy | # Housing Units | % Housing Units |
| Owner Occupied Housing Units | 447 | 100.0% |
| Renter-Occupied Housing Units | 0 | 0.0% |
| Total Occupied Housing Units | 447 | 100.0% |
Occupancy by Household Size in Hillside Lake
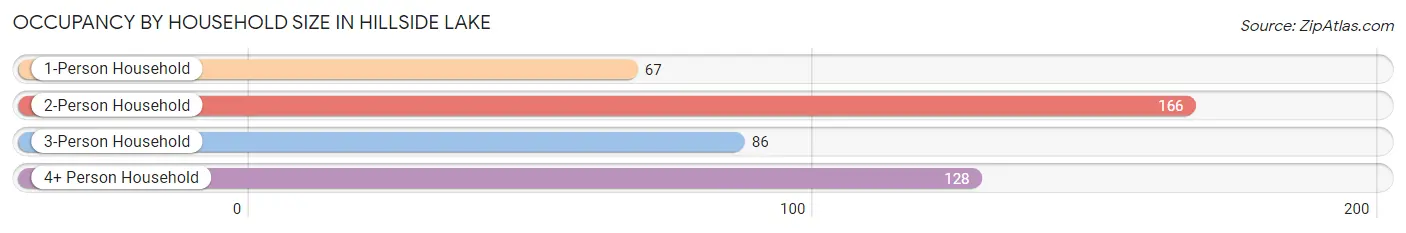
| Household Size | # Housing Units | % Housing Units |
| 1-Person Household | 67 | 15.0% |
| 2-Person Household | 166 | 37.1% |
| 3-Person Household | 86 | 19.2% |
| 4+ Person Household | 128 | 28.6% |
| Total Housing Units | 447 | 100.0% |
Occupancy by Ownership by Household Size in Hillside Lake
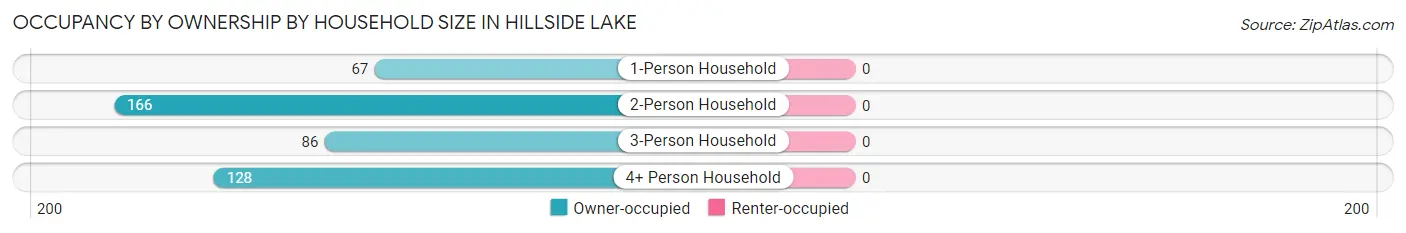
| Household Size | Owner-occupied | Renter-occupied |
| 1-Person Household | 67 (100.0%) | 0 (0.0%) |
| 2-Person Household | 166 (100.0%) | 0 (0.0%) |
| 3-Person Household | 86 (100.0%) | 0 (0.0%) |
| 4+ Person Household | 128 (100.0%) | 0 (0.0%) |
| Total Housing Units | 447 (100.0%) | 0 (0.0%) |
Occupancy by Educational Attainment in Hillside Lake
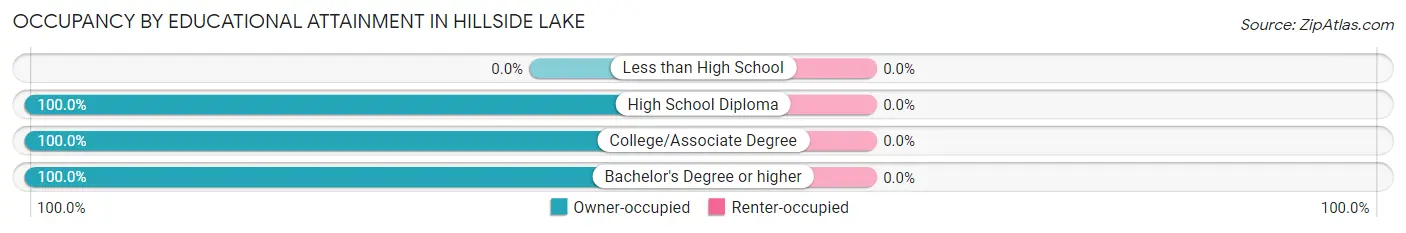
| Household Size | Owner-occupied | Renter-occupied |
| Less than High School | 0 (0.0%) | 0 (0.0%) |
| High School Diploma | 180 (100.0%) | 0 (0.0%) |
| College/Associate Degree | 136 (100.0%) | 0 (0.0%) |
| Bachelor's Degree or higher | 131 (100.0%) | 0 (0.0%) |
Occupancy by Age of Householder in Hillside Lake
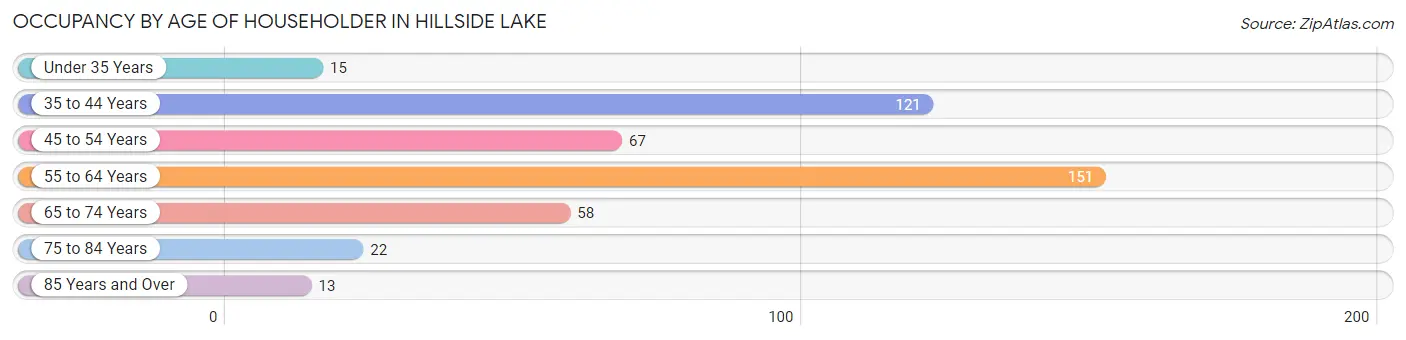
| Age Bracket | # Households | % Households |
| Under 35 Years | 15 | 3.4% |
| 35 to 44 Years | 121 | 27.1% |
| 45 to 54 Years | 67 | 15.0% |
| 55 to 64 Years | 151 | 33.8% |
| 65 to 74 Years | 58 | 13.0% |
| 75 to 84 Years | 22 | 4.9% |
| 85 Years and Over | 13 | 2.9% |
| Total | 447 | 100.0% |
Housing Finances in Hillside Lake
Median Income by Occupancy in Hillside Lake
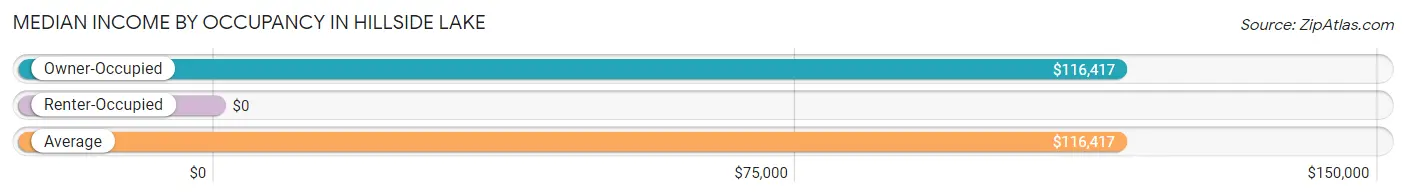
| Occupancy Type | # Households | Median Income |
| Owner-Occupied | 447 (100.0%) | $116,417 |
| Renter-Occupied | 0 (0.0%) | $0 |
| Average | 447 (100.0%) | $116,417 |
Occupancy by Householder Income Bracket in Hillside Lake
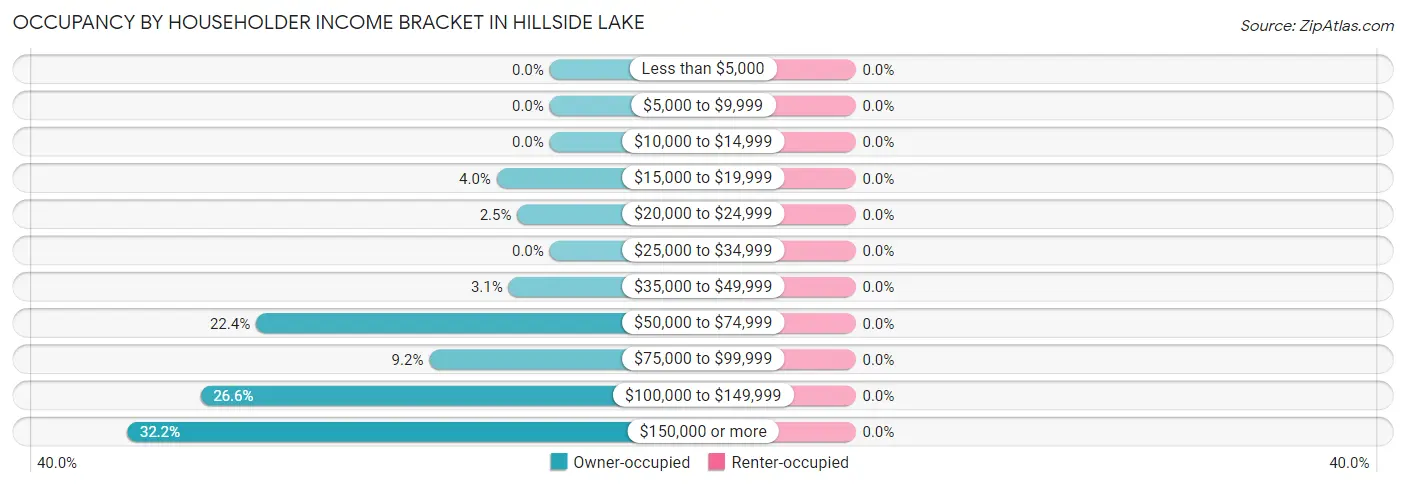
| Income Bracket | Owner-occupied | Renter-occupied |
| Less than $5,000 | 0 (0.0%) | 0 (0.0%) |
| $5,000 to $9,999 | 0 (0.0%) | 0 (0.0%) |
| $10,000 to $14,999 | 0 (0.0%) | 0 (0.0%) |
| $15,000 to $19,999 | 18 (4.0%) | 0 (0.0%) |
| $20,000 to $24,999 | 11 (2.5%) | 0 (0.0%) |
| $25,000 to $34,999 | 0 (0.0%) | 0 (0.0%) |
| $35,000 to $49,999 | 14 (3.1%) | 0 (0.0%) |
| $50,000 to $74,999 | 100 (22.4%) | 0 (0.0%) |
| $75,000 to $99,999 | 41 (9.2%) | 0 (0.0%) |
| $100,000 to $149,999 | 119 (26.6%) | 0 (0.0%) |
| $150,000 or more | 144 (32.2%) | 0 (0.0%) |
| Total | 447 (100.0%) | 0 (0.0%) |
Monthly Housing Cost Tiers in Hillside Lake
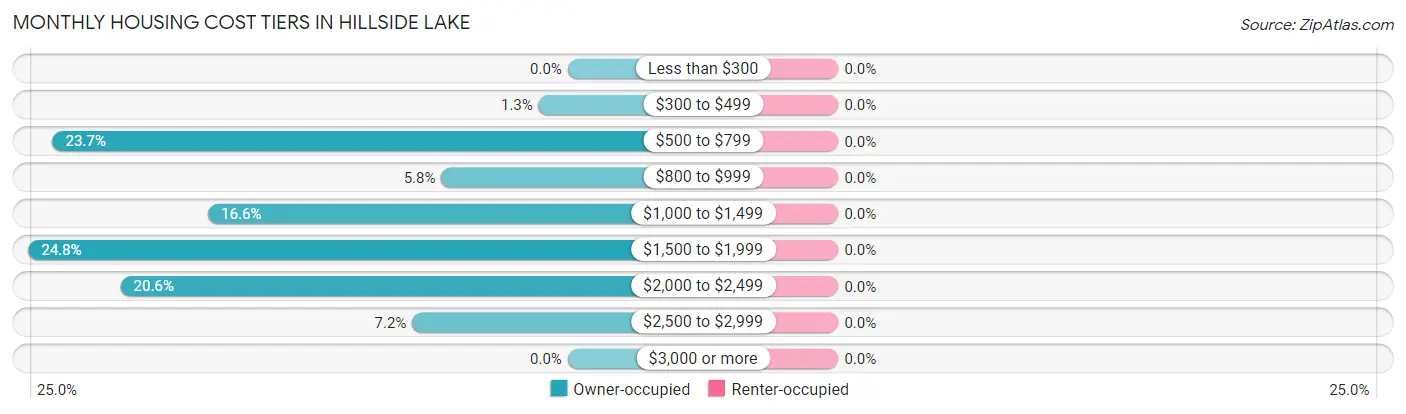
| Monthly Cost | Owner-occupied | Renter-occupied |
| Less than $300 | 0 (0.0%) | 0 (0.0%) |
| $300 to $499 | 6 (1.3%) | 0 (0.0%) |
| $500 to $799 | 106 (23.7%) | 0 (0.0%) |
| $800 to $999 | 26 (5.8%) | 0 (0.0%) |
| $1,000 to $1,499 | 74 (16.6%) | 0 (0.0%) |
| $1,500 to $1,999 | 111 (24.8%) | 0 (0.0%) |
| $2,000 to $2,499 | 92 (20.6%) | 0 (0.0%) |
| $2,500 to $2,999 | 32 (7.2%) | 0 (0.0%) |
| $3,000 or more | 0 (0.0%) | 0 (0.0%) |
| Total | 447 (100.0%) | 0 (0.0%) |
Physical Housing Characteristics in Hillside Lake
Housing Structures in Hillside Lake
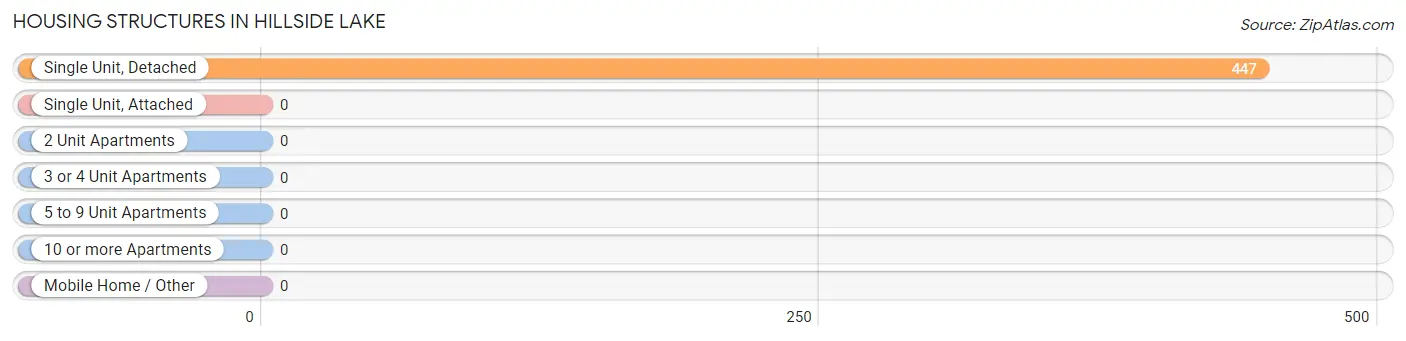
| Structure Type | # Housing Units | % Housing Units |
| Single Unit, Detached | 447 | 100.0% |
| Single Unit, Attached | 0 | 0.0% |
| 2 Unit Apartments | 0 | 0.0% |
| 3 or 4 Unit Apartments | 0 | 0.0% |
| 5 to 9 Unit Apartments | 0 | 0.0% |
| 10 or more Apartments | 0 | 0.0% |
| Mobile Home / Other | 0 | 0.0% |
| Total | 447 | 100.0% |
Housing Structures by Occupancy in Hillside Lake
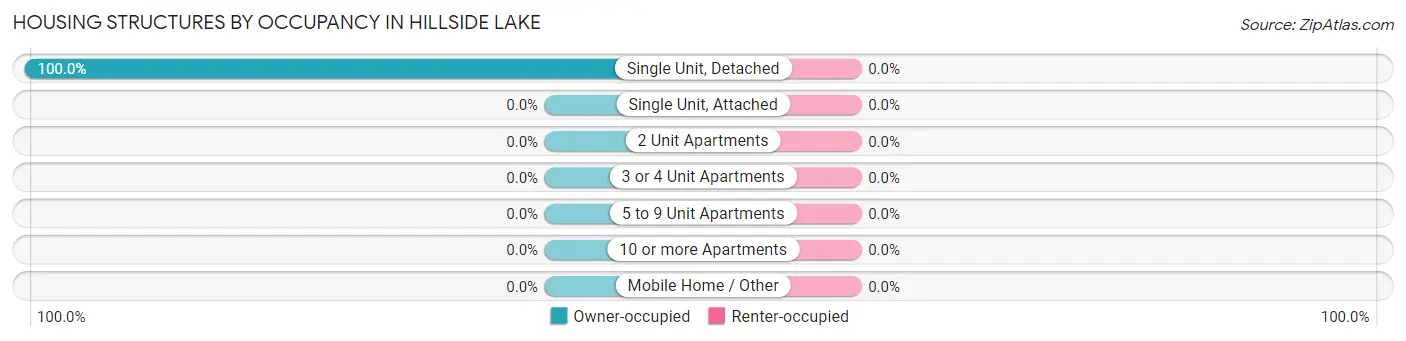
| Structure Type | Owner-occupied | Renter-occupied |
| Single Unit, Detached | 447 (100.0%) | 0 (0.0%) |
| Single Unit, Attached | 0 (0.0%) | 0 (0.0%) |
| 2 Unit Apartments | 0 (0.0%) | 0 (0.0%) |
| 3 or 4 Unit Apartments | 0 (0.0%) | 0 (0.0%) |
| 5 to 9 Unit Apartments | 0 (0.0%) | 0 (0.0%) |
| 10 or more Apartments | 0 (0.0%) | 0 (0.0%) |
| Mobile Home / Other | 0 (0.0%) | 0 (0.0%) |
| Total | 447 (100.0%) | 0 (0.0%) |
Housing Structures by Number of Rooms in Hillside Lake
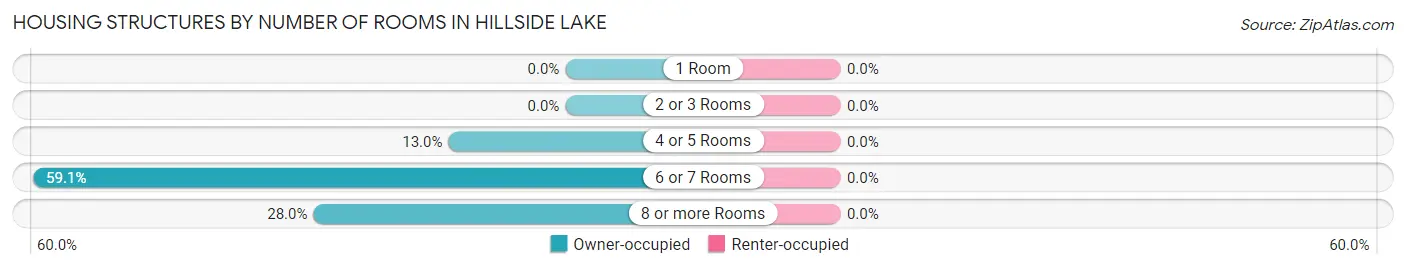
| Number of Rooms | Owner-occupied | Renter-occupied |
| 1 Room | 0 (0.0%) | 0 (0.0%) |
| 2 or 3 Rooms | 0 (0.0%) | 0 (0.0%) |
| 4 or 5 Rooms | 58 (13.0%) | 0 (0.0%) |
| 6 or 7 Rooms | 264 (59.1%) | 0 (0.0%) |
| 8 or more Rooms | 125 (28.0%) | 0 (0.0%) |
| Total | 447 (100.0%) | 0 (0.0%) |
Housing Structure by Heating Type in Hillside Lake
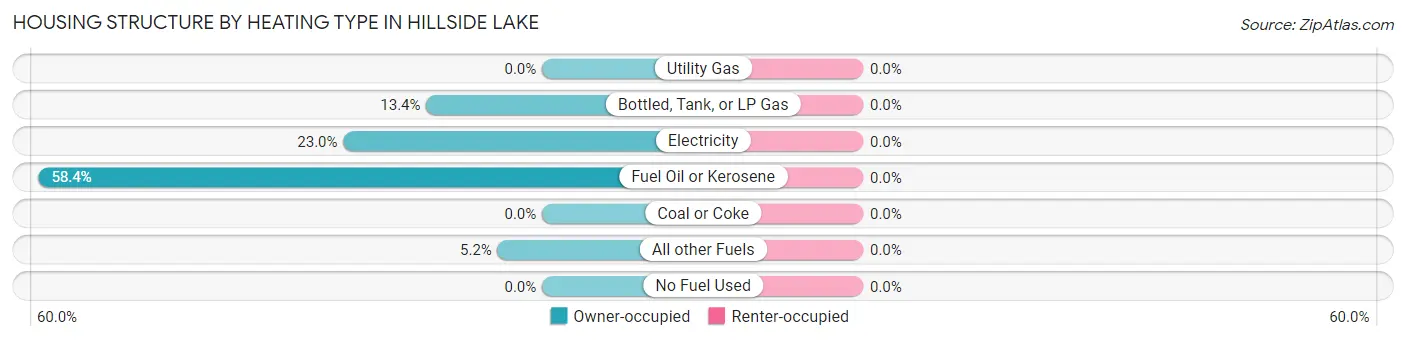
| Heating Type | Owner-occupied | Renter-occupied |
| Utility Gas | 0 (0.0%) | 0 (0.0%) |
| Bottled, Tank, or LP Gas | 60 (13.4%) | 0 (0.0%) |
| Electricity | 103 (23.0%) | 0 (0.0%) |
| Fuel Oil or Kerosene | 261 (58.4%) | 0 (0.0%) |
| Coal or Coke | 0 (0.0%) | 0 (0.0%) |
| All other Fuels | 23 (5.1%) | 0 (0.0%) |
| No Fuel Used | 0 (0.0%) | 0 (0.0%) |
| Total | 447 (100.0%) | 0 (0.0%) |
Household Vehicle Usage in Hillside Lake
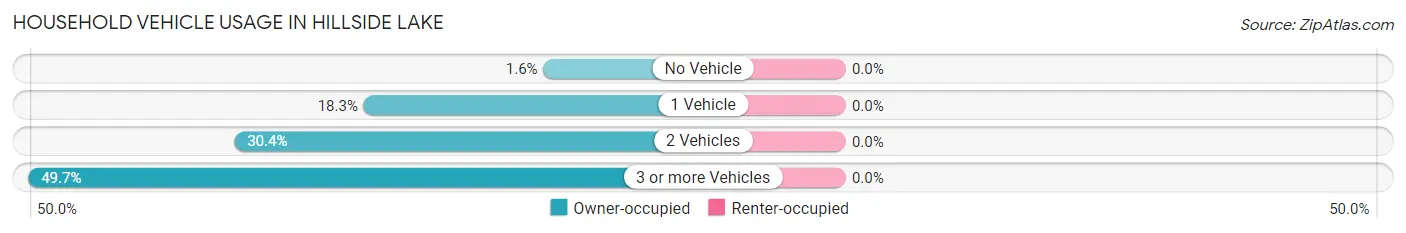
| Vehicles per Household | Owner-occupied | Renter-occupied |
| No Vehicle | 7 (1.6%) | 0 (0.0%) |
| 1 Vehicle | 82 (18.3%) | 0 (0.0%) |
| 2 Vehicles | 136 (30.4%) | 0 (0.0%) |
| 3 or more Vehicles | 222 (49.7%) | 0 (0.0%) |
| Total | 447 (100.0%) | 0 (0.0%) |
Real Estate & Mortgages in Hillside Lake
Real Estate and Mortgage Overview in Hillside Lake
| Characteristic | Without Mortgage | With Mortgage |
| Housing Units | 179 | 268 |
| Median Property Value | $324,800 | $265,900 |
| Median Household Income | $73,655 | $127 |
| Monthly Housing Costs | $695 | $0 |
| Real Estate Taxes | - | - |
Property Value by Mortgage Status in Hillside Lake
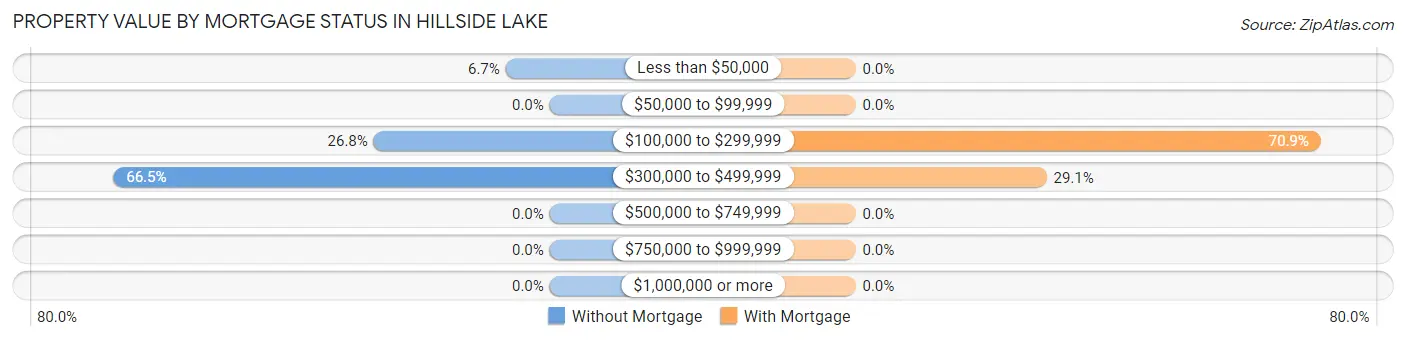
| Property Value | Without Mortgage | With Mortgage |
| Less than $50,000 | 12 (6.7%) | 0 (0.0%) |
| $50,000 to $99,999 | 0 (0.0%) | 0 (0.0%) |
| $100,000 to $299,999 | 48 (26.8%) | 190 (70.9%) |
| $300,000 to $499,999 | 119 (66.5%) | 78 (29.1%) |
| $500,000 to $749,999 | 0 (0.0%) | 0 (0.0%) |
| $750,000 to $999,999 | 0 (0.0%) | 0 (0.0%) |
| $1,000,000 or more | 0 (0.0%) | 0 (0.0%) |
| Total | 179 (100.0%) | 268 (100.0%) |
Household Income by Mortgage Status in Hillside Lake
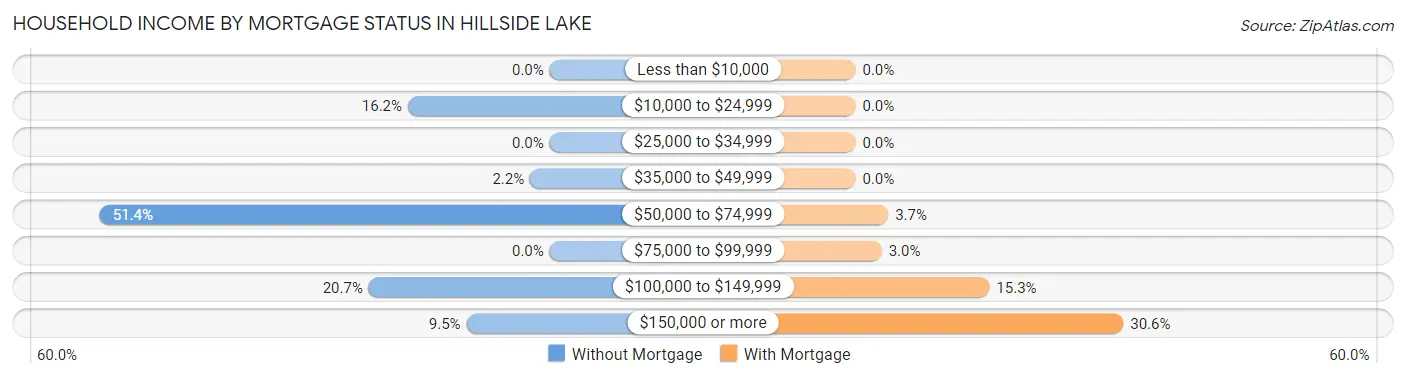
| Household Income | Without Mortgage | With Mortgage |
| Less than $10,000 | 0 (0.0%) | 0 (0.0%) |
| $10,000 to $24,999 | 29 (16.2%) | 0 (0.0%) |
| $25,000 to $34,999 | 0 (0.0%) | 0 (0.0%) |
| $35,000 to $49,999 | 4 (2.2%) | 0 (0.0%) |
| $50,000 to $74,999 | 92 (51.4%) | 10 (3.7%) |
| $75,000 to $99,999 | 0 (0.0%) | 8 (3.0%) |
| $100,000 to $149,999 | 37 (20.7%) | 41 (15.3%) |
| $150,000 or more | 17 (9.5%) | 82 (30.6%) |
| Total | 179 (100.0%) | 268 (100.0%) |
Property Value to Household Income Ratio in Hillside Lake
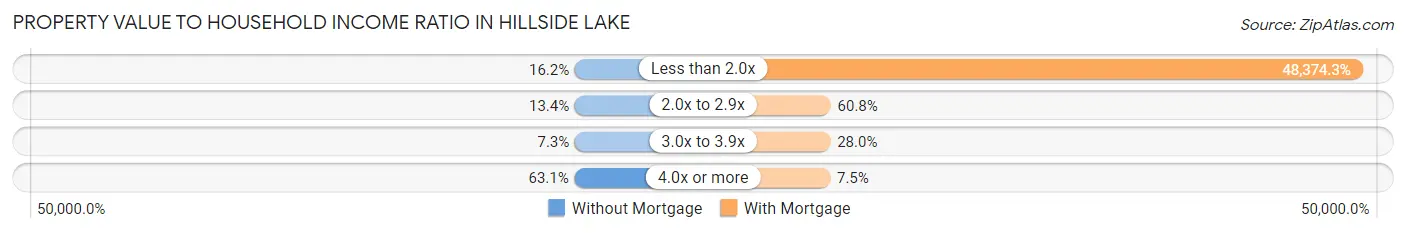
| Value-to-Income Ratio | Without Mortgage | With Mortgage |
| Less than 2.0x | 29 (16.2%) | 129,643 (48,374.3%) |
| 2.0x to 2.9x | 24 (13.4%) | 163 (60.8%) |
| 3.0x to 3.9x | 13 (7.3%) | 75 (28.0%) |
| 4.0x or more | 113 (63.1%) | 20 (7.5%) |
| Total | 179 (100.0%) | 268 (100.0%) |
Real Estate Taxes by Mortgage Status in Hillside Lake
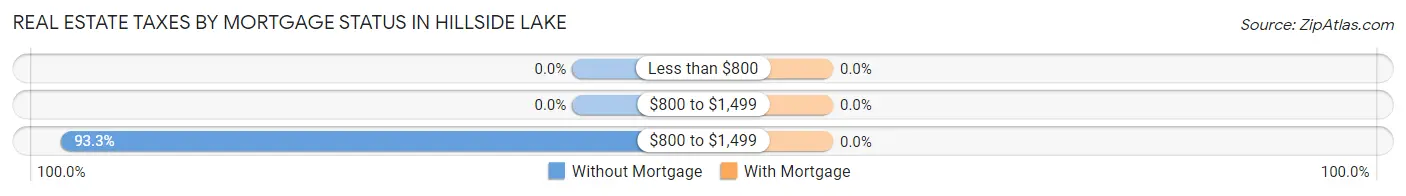
| Property Taxes | Without Mortgage | With Mortgage |
| Less than $800 | 0 (0.0%) | 0 (0.0%) |
| $800 to $1,499 | 0 (0.0%) | 0 (0.0%) |
| $800 to $1,499 | 167 (93.3%) | 0 (0.0%) |
| Total | 179 (100.0%) | 268 (100.0%) |
Health & Disability in Hillside Lake
Health Insurance Coverage by Age in Hillside Lake
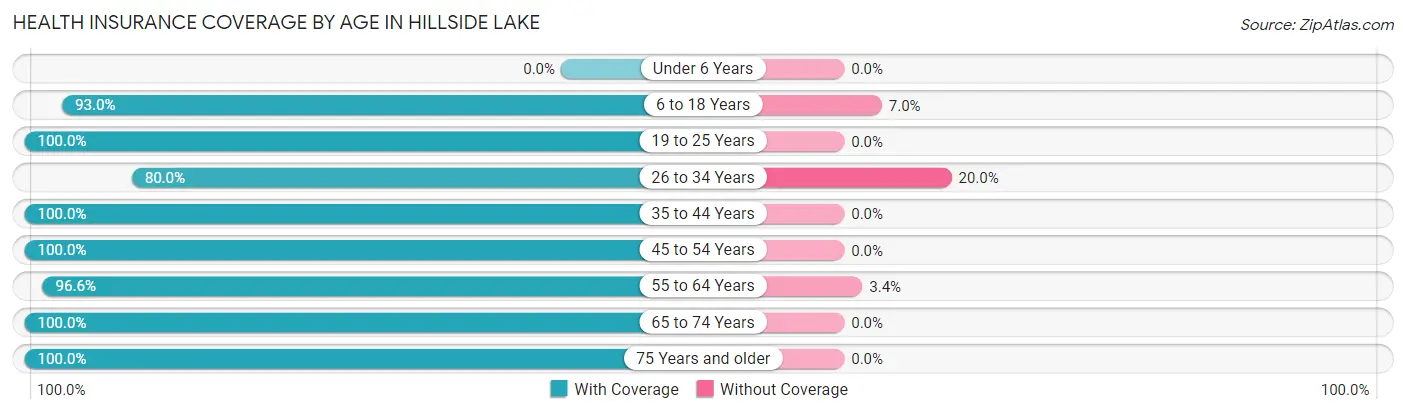
| Age Bracket | With Coverage | Without Coverage |
| Under 6 Years | 0 (0.0%) | 0 (0.0%) |
| 6 to 18 Years | 199 (93.0%) | 15 (7.0%) |
| 19 to 25 Years | 166 (100.0%) | 0 (0.0%) |
| 26 to 34 Years | 128 (80.0%) | 32 (20.0%) |
| 35 to 44 Years | 203 (100.0%) | 0 (0.0%) |
| 45 to 54 Years | 102 (100.0%) | 0 (0.0%) |
| 55 to 64 Years | 201 (96.6%) | 7 (3.4%) |
| 65 to 74 Years | 161 (100.0%) | 0 (0.0%) |
| 75 Years and older | 42 (100.0%) | 0 (0.0%) |
| Total | 1,202 (95.7%) | 54 (4.3%) |
Health Insurance Coverage by Citizenship Status in Hillside Lake
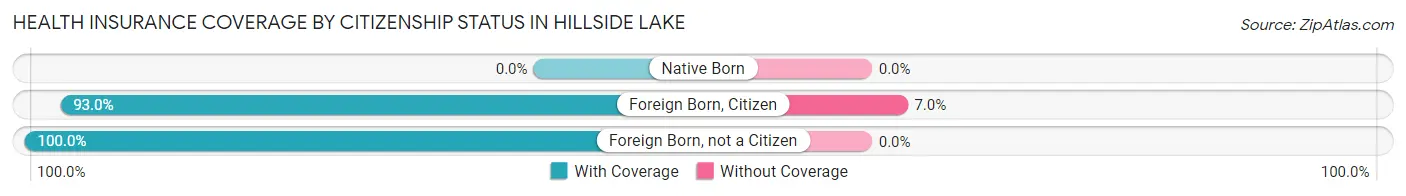
| Citizenship Status | With Coverage | Without Coverage |
| Native Born | 0 (0.0%) | 0 (0.0%) |
| Foreign Born, Citizen | 199 (93.0%) | 15 (7.0%) |
| Foreign Born, not a Citizen | 166 (100.0%) | 0 (0.0%) |
Health Insurance Coverage by Household Income in Hillside Lake
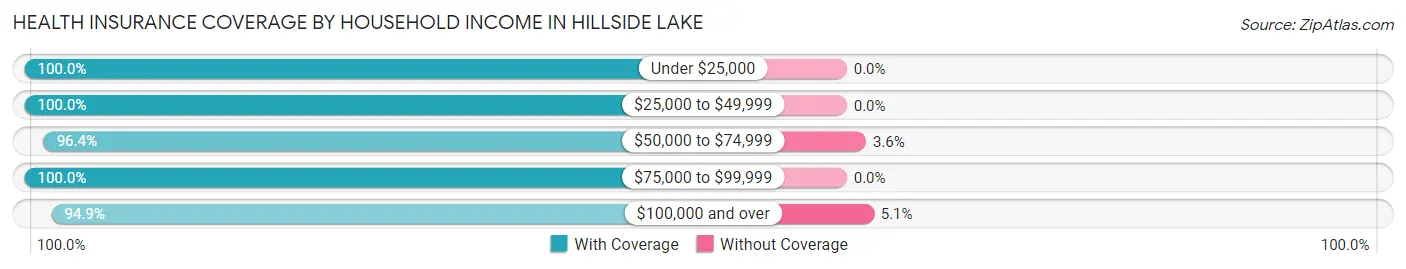
| Household Income | With Coverage | Without Coverage |
| Under $25,000 | 36 (100.0%) | 0 (0.0%) |
| $25,000 to $49,999 | 18 (100.0%) | 0 (0.0%) |
| $50,000 to $74,999 | 188 (96.4%) | 7 (3.6%) |
| $75,000 to $99,999 | 78 (100.0%) | 0 (0.0%) |
| $100,000 and over | 882 (94.9%) | 47 (5.1%) |
Public vs Private Health Insurance Coverage by Age in Hillside Lake
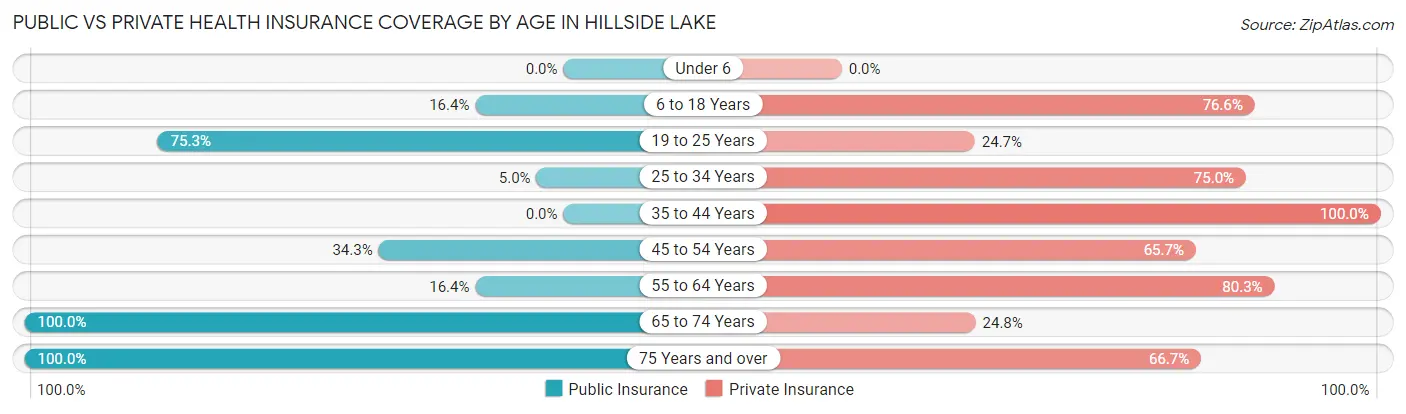
| Age Bracket | Public Insurance | Private Insurance |
| Under 6 | 0 (0.0%) | 0 (0.0%) |
| 6 to 18 Years | 35 (16.4%) | 164 (76.6%) |
| 19 to 25 Years | 125 (75.3%) | 41 (24.7%) |
| 25 to 34 Years | 8 (5.0%) | 120 (75.0%) |
| 35 to 44 Years | 0 (0.0%) | 203 (100.0%) |
| 45 to 54 Years | 35 (34.3%) | 67 (65.7%) |
| 55 to 64 Years | 34 (16.4%) | 167 (80.3%) |
| 65 to 74 Years | 161 (100.0%) | 40 (24.8%) |
| 75 Years and over | 42 (100.0%) | 28 (66.7%) |
| Total | 440 (35.0%) | 830 (66.1%) |
Disability Status by Sex by Age in Hillside Lake
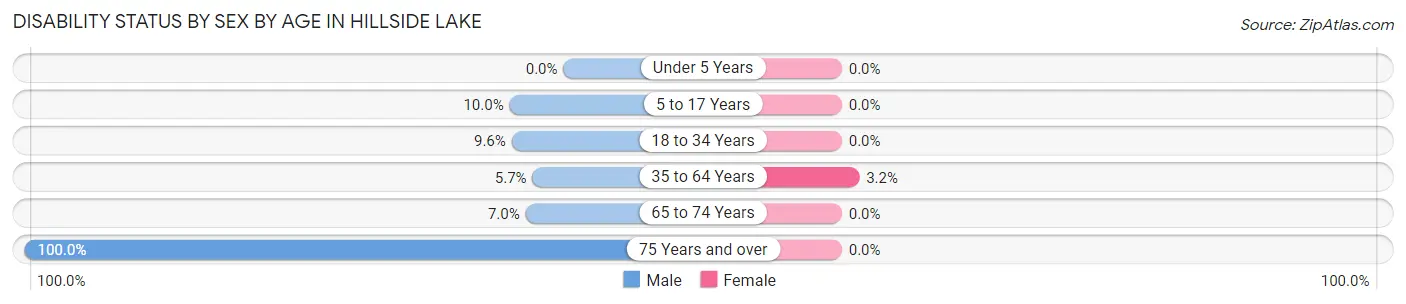
| Age Bracket | Male | Female |
| Under 5 Years | 0 (0.0%) | 0 (0.0%) |
| 5 to 17 Years | 17 (10.0%) | 0 (0.0%) |
| 18 to 34 Years | 17 (9.6%) | 0 (0.0%) |
| 35 to 64 Years | 17 (5.7%) | 7 (3.2%) |
| 65 to 74 Years | 4 (7.0%) | 0 (0.0%) |
| 75 Years and over | 17 (100.0%) | 0 (0.0%) |
Disability Class by Sex by Age in Hillside Lake
Disability Class: Hearing Difficulty
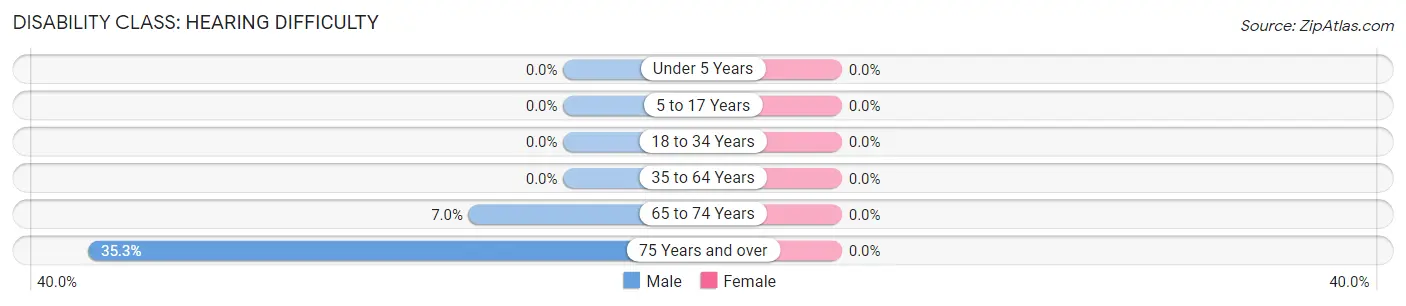
| Age Bracket | Male | Female |
| Under 5 Years | 0 (0.0%) | 0 (0.0%) |
| 5 to 17 Years | 0 (0.0%) | 0 (0.0%) |
| 18 to 34 Years | 0 (0.0%) | 0 (0.0%) |
| 35 to 64 Years | 0 (0.0%) | 0 (0.0%) |
| 65 to 74 Years | 4 (7.0%) | 0 (0.0%) |
| 75 Years and over | 6 (35.3%) | 0 (0.0%) |
Disability Class: Vision Difficulty
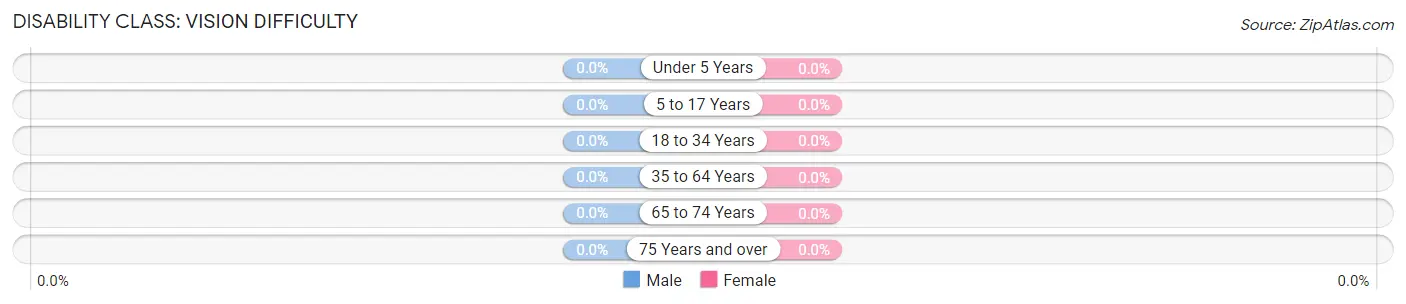
| Age Bracket | Male | Female |
| Under 5 Years | 0 (0.0%) | 0 (0.0%) |
| 5 to 17 Years | 0 (0.0%) | 0 (0.0%) |
| 18 to 34 Years | 0 (0.0%) | 0 (0.0%) |
| 35 to 64 Years | 0 (0.0%) | 0 (0.0%) |
| 65 to 74 Years | 0 (0.0%) | 0 (0.0%) |
| 75 Years and over | 0 (0.0%) | 0 (0.0%) |
Disability Class: Cognitive Difficulty
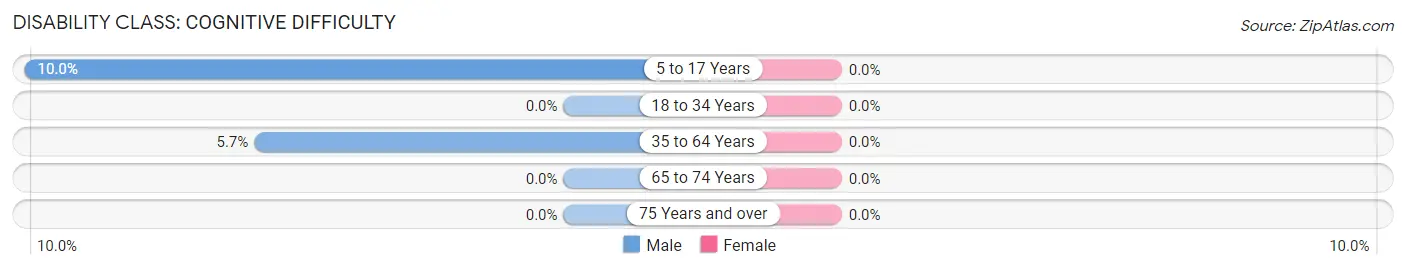
| Age Bracket | Male | Female |
| 5 to 17 Years | 17 (10.0%) | 0 (0.0%) |
| 18 to 34 Years | 0 (0.0%) | 0 (0.0%) |
| 35 to 64 Years | 17 (5.7%) | 0 (0.0%) |
| 65 to 74 Years | 0 (0.0%) | 0 (0.0%) |
| 75 Years and over | 0 (0.0%) | 0 (0.0%) |
Disability Class: Ambulatory Difficulty
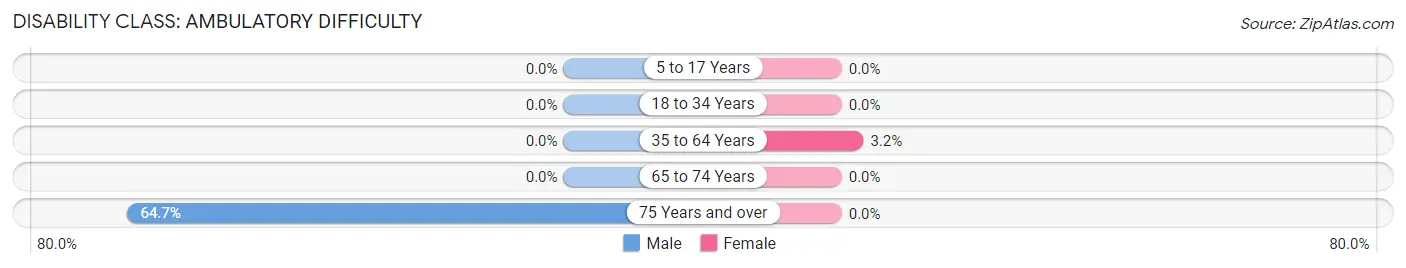
| Age Bracket | Male | Female |
| 5 to 17 Years | 0 (0.0%) | 0 (0.0%) |
| 18 to 34 Years | 0 (0.0%) | 0 (0.0%) |
| 35 to 64 Years | 0 (0.0%) | 7 (3.2%) |
| 65 to 74 Years | 0 (0.0%) | 0 (0.0%) |
| 75 Years and over | 11 (64.7%) | 0 (0.0%) |
Disability Class: Self-Care Difficulty
| Age Bracket | Male | Female |
| 5 to 17 Years | 0 (0.0%) | 0 (0.0%) |
| 18 to 34 Years | 0 (0.0%) | 0 (0.0%) |
| 35 to 64 Years | 0 (0.0%) | 0 (0.0%) |
| 65 to 74 Years | 0 (0.0%) | 0 (0.0%) |
| 75 Years and over | 0 (0.0%) | 0 (0.0%) |
Technology Access in Hillside Lake
Computing Device Access in Hillside Lake
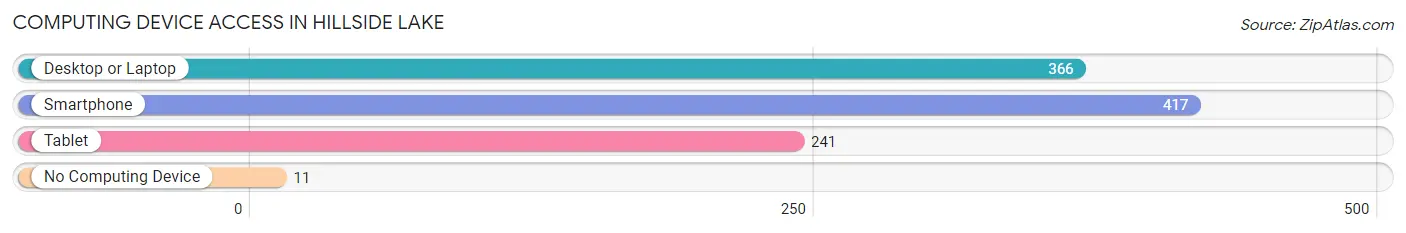
| Device Type | # Households | % Households |
| Desktop or Laptop | 366 | 81.9% |
| Smartphone | 417 | 93.3% |
| Tablet | 241 | 53.9% |
| No Computing Device | 11 | 2.5% |
| Total | 447 | 100.0% |
Internet Access in Hillside Lake
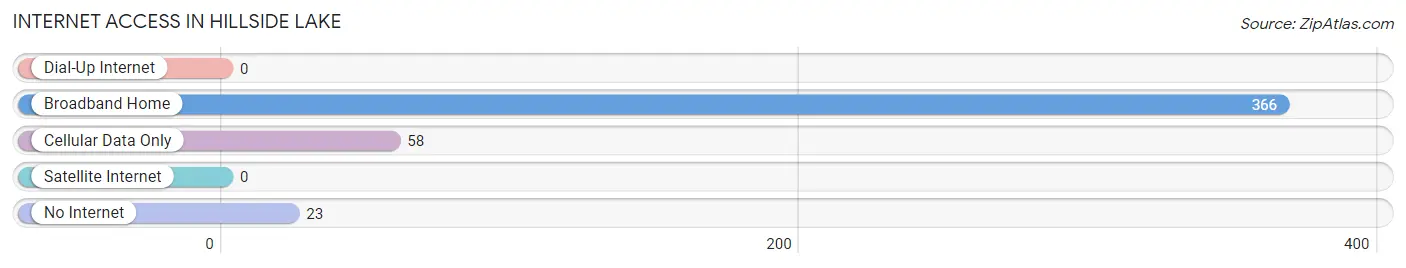
| Internet Type | # Households | % Households |
| Dial-Up Internet | 0 | 0.0% |
| Broadband Home | 366 | 81.9% |
| Cellular Data Only | 58 | 13.0% |
| Satellite Internet | 0 | 0.0% |
| No Internet | 23 | 5.1% |
| Total | 447 | 100.0% |
Hillside Lake Summary
Hillside Lake is a small hamlet located in the town of Putnam Valley in Putnam County, New York. It is situated on the east side of the Hudson River, about 40 miles north of New York City. The hamlet is home to a population of about 1,000 people, and is a popular destination for outdoor recreation and relaxation.
History
The area that is now Hillside Lake was originally inhabited by the Wappinger Indians, who lived in the area for centuries before the arrival of European settlers. The first European settlers arrived in the area in the late 1700s, and the hamlet was officially established in 1845. The hamlet was named after the nearby Hillside Lake, which was created by a dam built in the early 1800s.
The hamlet grew slowly over the years, and by the early 1900s, it had become a popular summer destination for city dwellers looking to escape the hustle and bustle of the city. The hamlet was home to several resorts, including the Hillside Lake Hotel, which was built in the late 1800s and was a popular destination for wealthy New Yorkers.
In the mid-1900s, the hamlet began to decline as more people moved away from the area. However, in the late 1990s, the hamlet began to experience a resurgence as more people moved to the area to take advantage of its natural beauty and outdoor recreation opportunities.
Geography
Hillside Lake is located in the town of Putnam Valley in Putnam County, New York. It is situated on the east side of the Hudson River, about 40 miles north of New York City. The hamlet is bordered by the towns of Kent and Patterson to the north, and the towns of Carmel and Southeast to the south.
The hamlet is home to Hillside Lake, which is a small, man-made lake created by a dam built in the early 1800s. The lake is a popular destination for fishing, swimming, and boating. The hamlet is also home to several parks, including Hillside Lake Park, which offers hiking trails, picnic areas, and a playground.
Economy
The economy of Hillside Lake is largely based on tourism and outdoor recreation. The hamlet is home to several resorts, including the Hillside Lake Hotel, which is a popular destination for city dwellers looking to escape the hustle and bustle of the city. The hamlet is also home to several restaurants, cafes, and shops, which cater to both locals and tourists.
The hamlet is also home to several businesses, including a lumber yard, a hardware store, and a gas station. The hamlet is also home to several farms, which produce a variety of fruits and vegetables.
Demographics
As of the 2010 census, the population of Hillside Lake was 1,000. The racial makeup of the hamlet was 94.2% White, 2.2% African American, 0.7% Native American, 0.7% Asian, 0.3% from other races, and 2.0% from two or more races. Hispanic or Latino of any race were 2.7% of the population.
The median household income in Hillside Lake was $50,000, and the median family income was $60,000. The per capita income in Hillside Lake was $25,000. About 8.3% of families and 10.3% of the population were below the poverty line, including 14.3% of those under age 18 and 5.3% of those age 65 or over.
Common Questions
What is Per Capita Income in Hillside Lake?
Per Capita income in Hillside Lake is $49,763.
What is the Median Family Income in Hillside Lake?
Median Family Income in Hillside Lake is $127,653.
What is the Median Household income in Hillside Lake?
Median Household Income in Hillside Lake is $116,417.
What is Income or Wage Gap in Hillside Lake?
Income or Wage Gap in Hillside Lake is 65.3%.
Women in Hillside Lake earn 34.7 cents for every dollar earned by a man.
What is Inequality or Gini Index in Hillside Lake?
Inequality or Gini Index in Hillside Lake is 0.35.
What is the Total Population of Hillside Lake?
Total Population of Hillside Lake is 1,256.
What is the Total Male Population of Hillside Lake?
Total Male Population of Hillside Lake is 717.
What is the Total Female Population of Hillside Lake?
Total Female Population of Hillside Lake is 539.
What is the Ratio of Males per 100 Females in Hillside Lake?
There are 133.02 Males per 100 Females in Hillside Lake.
What is the Ratio of Females per 100 Males in Hillside Lake?
There are 75.17 Females per 100 Males in Hillside Lake.
What is the Median Population Age in Hillside Lake?
Median Population Age in Hillside Lake is 37.5 Years.
What is the Average Family Size in Hillside Lake
Average Family Size in Hillside Lake is 3.0 People.
What is the Average Household Size in Hillside Lake
Average Household Size in Hillside Lake is 2.8 People.
How Large is the Labor Force in Hillside Lake?
There are 823 People in the Labor Forcein in Hillside Lake.
What is the Percentage of People in the Labor Force in Hillside Lake?
76.2% of People are in the Labor Force in Hillside Lake.
What is the Unemployment Rate in Hillside Lake?
Unemployment Rate in Hillside Lake is 0.9%.