Harris Hill, NY Map & Demographics
Harris Hill Map
Harris Hill Overview
$45,217
PER CAPITA INCOME
$118,984
AVG FAMILY INCOME
$95,603
AVG HOUSEHOLD INCOME
36.6%
WAGE / INCOME GAP [ % ]
63.4¢/ $1
WAGE / INCOME GAP [ $ ]
$4,305
FAMILY INCOME DEFICIT
0.41
INEQUALITY / GINI INDEX
6,107
TOTAL POPULATION
3,082
MALE POPULATION
3,025
FEMALE POPULATION
101.88
MALES / 100 FEMALES
98.15
FEMALES / 100 MALES
38.1
MEDIAN AGE
3.0
AVG FAMILY SIZE
2.4
AVG HOUSEHOLD SIZE
3,125
LABOR FORCE [ PEOPLE ]
66.9%
PERCENT IN LABOR FORCE
1.3%
UNEMPLOYMENT RATE
Income in Harris Hill
Income Overview in Harris Hill
Per Capita Income in Harris Hill is $45,217, while median incomes of families and households are $118,984 and $95,603 respectively.
| Characteristic | Number | Measure |
| Per Capita Income | 6,107 | $45,217 |
| Median Family Income | 1,655 | $118,984 |
| Mean Family Income | 1,655 | $132,269 |
| Median Household Income | 2,558 | $95,603 |
| Mean Household Income | 2,558 | $107,393 |
| Income Deficit | 1,655 | $4,305 |
| Wage / Income Gap (%) | 6,107 | 36.55% |
| Wage / Income Gap ($) | 6,107 | 63.45¢ per $1 |
| Gini / Inequality Index | 6,107 | 0.41 |
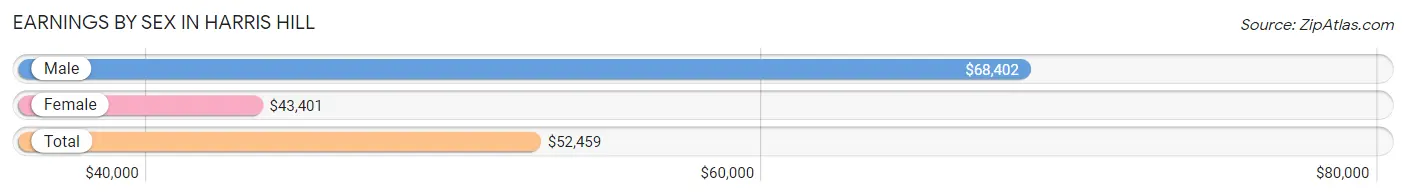
Earnings by Sex in Harris Hill
Average Earnings in Harris Hill are $52,459, $68,402 for men and $43,401 for women, a difference of 36.5%.
| Sex | Number | Average Earnings |
| Male | 1,854 (56.0%) | $68,402 |
| Female | 1,458 (44.0%) | $43,401 |
| Total | 3,312 (100.0%) | $52,459 |
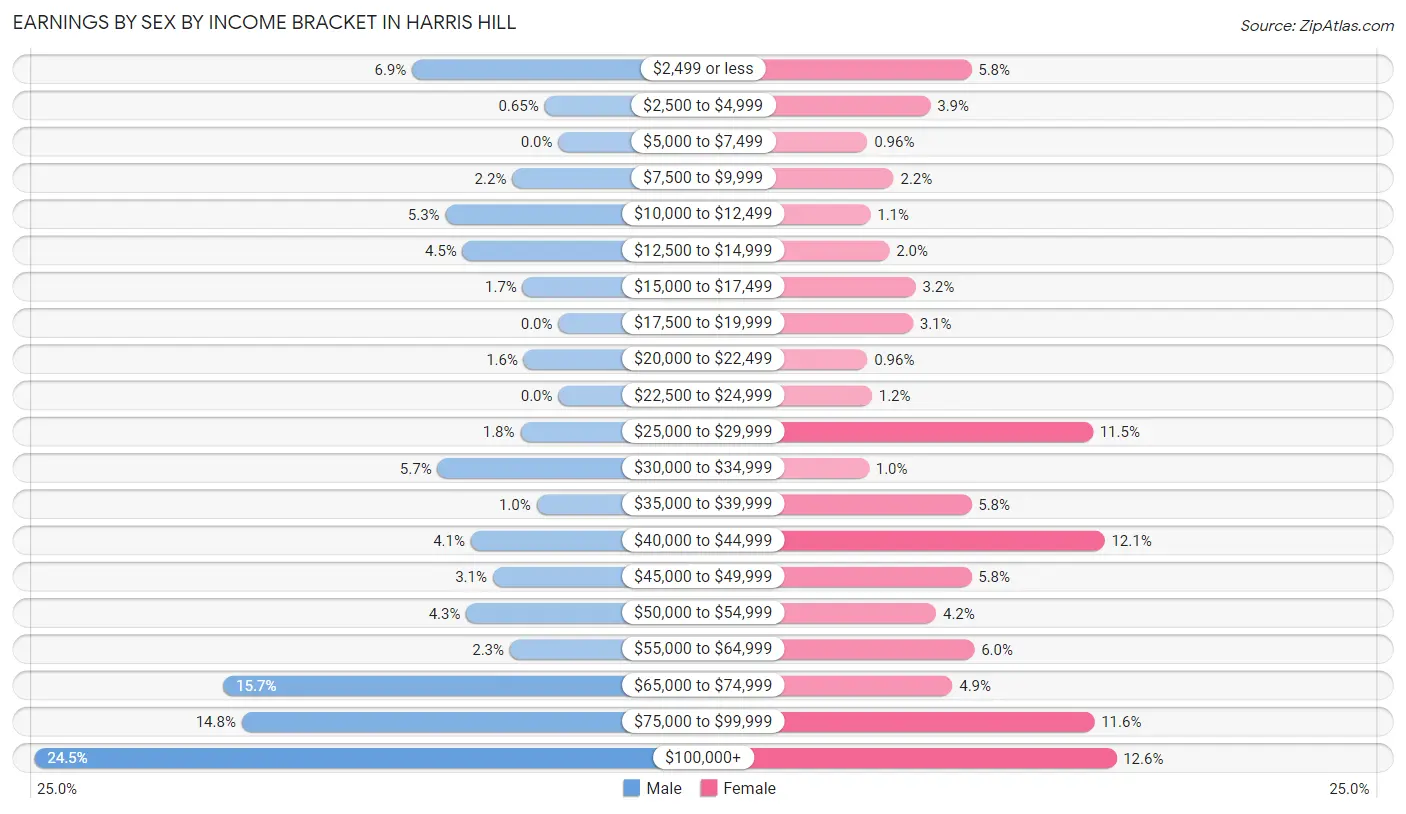
Earnings by Sex by Income Bracket in Harris Hill
The most common earnings brackets in Harris Hill are $100,000+ for men (455 | 24.5%) and $100,000+ for women (184 | 12.6%).
| Income | Male | Female |
| $2,499 or less | 127 (6.9%) | 85 (5.8%) |
| $2,500 to $4,999 | 12 (0.6%) | 57 (3.9%) |
| $5,000 to $7,499 | 0 (0.0%) | 14 (1.0%) |
| $7,500 to $9,999 | 40 (2.2%) | 32 (2.2%) |
| $10,000 to $12,499 | 98 (5.3%) | 16 (1.1%) |
| $12,500 to $14,999 | 83 (4.5%) | 29 (2.0%) |
| $15,000 to $17,499 | 31 (1.7%) | 47 (3.2%) |
| $17,500 to $19,999 | 0 (0.0%) | 45 (3.1%) |
| $20,000 to $22,499 | 30 (1.6%) | 14 (1.0%) |
| $22,500 to $24,999 | 0 (0.0%) | 17 (1.2%) |
| $25,000 to $29,999 | 33 (1.8%) | 168 (11.5%) |
| $30,000 to $34,999 | 105 (5.7%) | 15 (1.0%) |
| $35,000 to $39,999 | 19 (1.0%) | 85 (5.8%) |
| $40,000 to $44,999 | 76 (4.1%) | 176 (12.1%) |
| $45,000 to $49,999 | 57 (3.1%) | 85 (5.8%) |
| $50,000 to $54,999 | 80 (4.3%) | 61 (4.2%) |
| $55,000 to $64,999 | 42 (2.3%) | 87 (6.0%) |
| $65,000 to $74,999 | 291 (15.7%) | 72 (4.9%) |
| $75,000 to $99,999 | 275 (14.8%) | 169 (11.6%) |
| $100,000+ | 455 (24.5%) | 184 (12.6%) |
| Total | 1,854 (100.0%) | 1,458 (100.0%) |
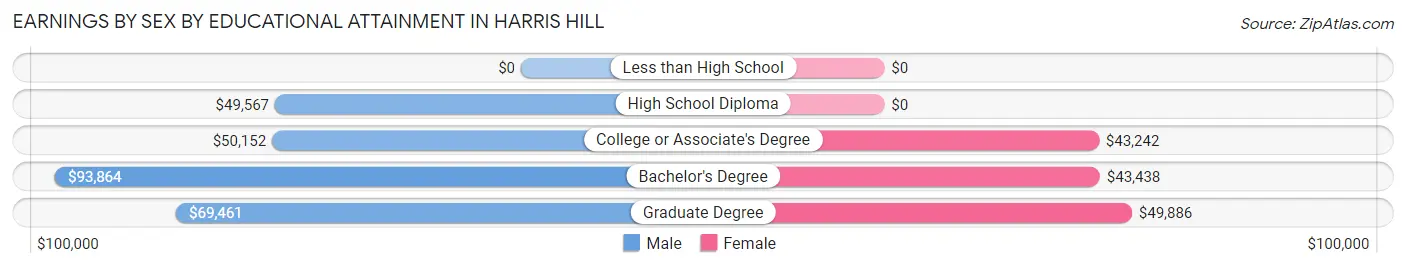
Earnings by Sex by Educational Attainment in Harris Hill
Average earnings in Harris Hill are $69,484 for men and $44,189 for women, a difference of 36.4%. Men with an educational attainment of bachelor's degree enjoy the highest average annual earnings of $93,864, while those with high school diploma education earn the least with $49,567. Women with an educational attainment of graduate degree earn the most with the average annual earnings of $49,886, while those with college or associate's degree education have the smallest earnings of $43,242.
| Educational Attainment | Male Income | Female Income |
| Less than High School | - | - |
| High School Diploma | $49,567 | $0 |
| College or Associate's Degree | $50,152 | $43,242 |
| Bachelor's Degree | $93,864 | $43,438 |
| Graduate Degree | $69,461 | $49,886 |
| Total | $69,484 | $44,189 |
Family Income in Harris Hill
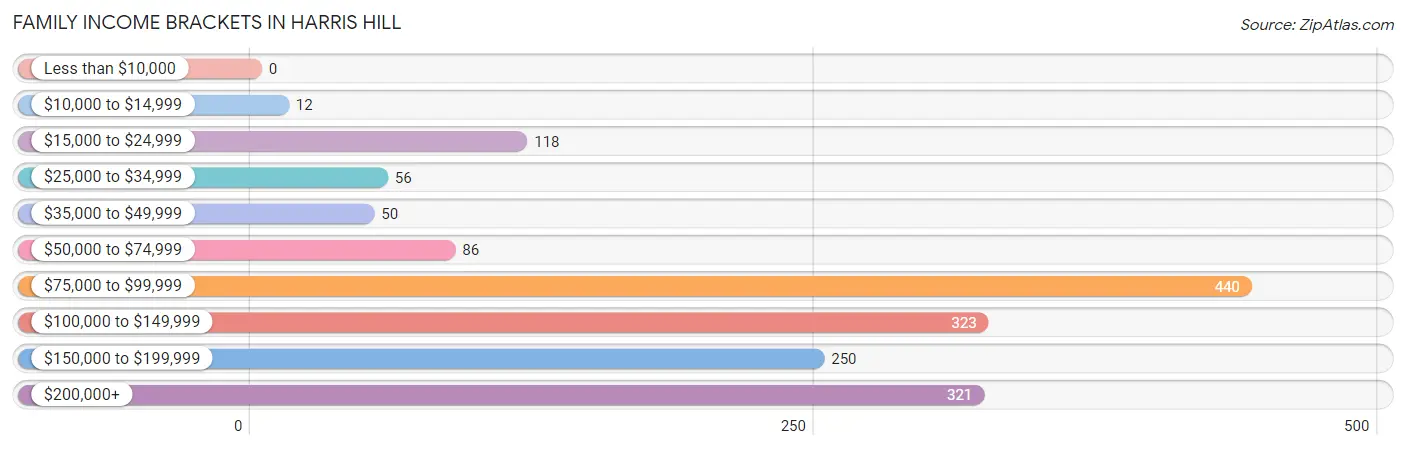
Family Income Brackets in Harris Hill
According to the Harris Hill family income data, there are 440 families falling into the $75,000 to $99,999 income range, which is the most common income bracket and makes up 26.6% of all families.
| Income Bracket | # Families | % Families |
| Less than $10,000 | 0 | 0.0% |
| $10,000 to $14,999 | 12 | 0.7% |
| $15,000 to $24,999 | 118 | 7.1% |
| $25,000 to $34,999 | 56 | 3.4% |
| $35,000 to $49,999 | 50 | 3.0% |
| $50,000 to $74,999 | 86 | 5.2% |
| $75,000 to $99,999 | 440 | 26.6% |
| $100,000 to $149,999 | 323 | 19.5% |
| $150,000 to $199,999 | 250 | 15.1% |
| $200,000+ | 321 | 19.4% |
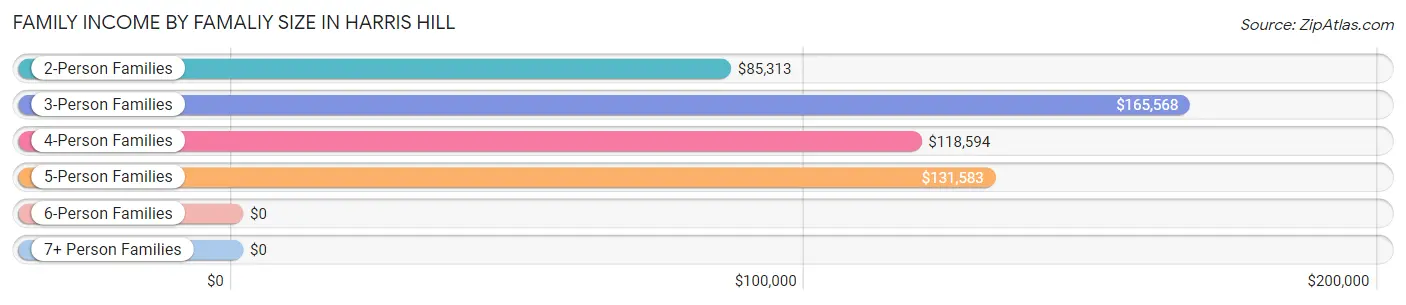
Family Income by Famaliy Size in Harris Hill
3-person families (193 | 11.7%) account for the highest median family income in Harris Hill with $165,568 per family, while 3-person families (193 | 11.7%) have the highest median income of $55,189 per family member.
| Income Bracket | # Families | Median Income |
| 2-Person Families | 792 (47.8%) | $85,313 |
| 3-Person Families | 193 (11.7%) | $165,568 |
| 4-Person Families | 492 (29.7%) | $118,594 |
| 5-Person Families | 166 (10.0%) | $131,583 |
| 6-Person Families | 12 (0.7%) | $0 |
| 7+ Person Families | 0 (0.0%) | $0 |
| Total | 1,655 (100.0%) | $118,984 |
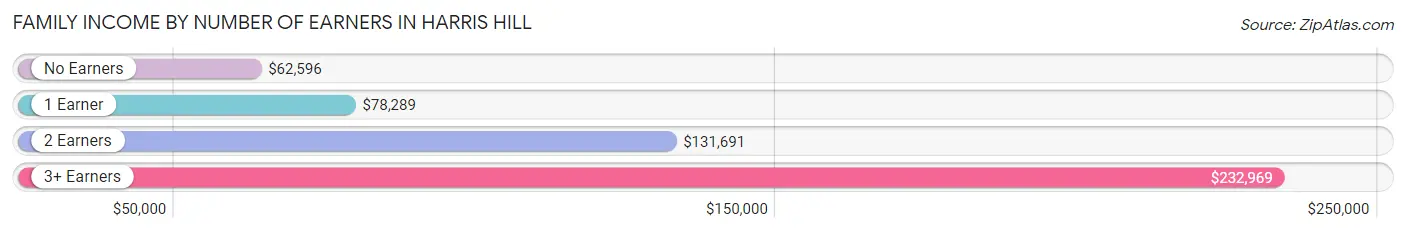
Family Income by Number of Earners in Harris Hill
The median family income in Harris Hill is $118,984, with families comprising 3+ earners (154) having the highest median family income of $232,969, while families with no earners (255) have the lowest median family income of $62,596, accounting for 9.3% and 15.4% of families, respectively.
| Number of Earners | # Families | Median Income |
| No Earners | 255 (15.4%) | $62,596 |
| 1 Earner | 333 (20.1%) | $78,289 |
| 2 Earners | 913 (55.2%) | $131,691 |
| 3+ Earners | 154 (9.3%) | $232,969 |
| Total | 1,655 (100.0%) | $118,984 |
Household Income in Harris Hill
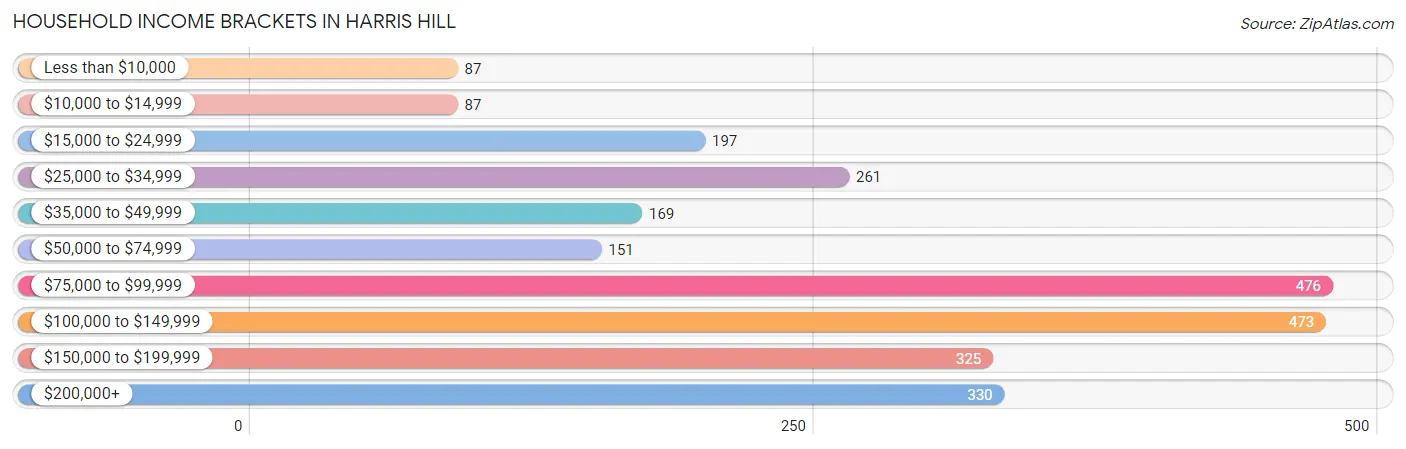
Household Income Brackets in Harris Hill
With 476 households falling in the category, the $75,000 to $99,999 income range is the most frequent in Harris Hill, accounting for 18.6% of all households. In contrast, only 87 households (3.4%) fall into the less than $10,000 income bracket, making it the least populous group.
| Income Bracket | # Households | % Households |
| Less than $10,000 | 87 | 3.4% |
| $10,000 to $14,999 | 87 | 3.4% |
| $15,000 to $24,999 | 197 | 7.7% |
| $25,000 to $34,999 | 261 | 10.2% |
| $35,000 to $49,999 | 169 | 6.6% |
| $50,000 to $74,999 | 151 | 5.9% |
| $75,000 to $99,999 | 476 | 18.6% |
| $100,000 to $149,999 | 473 | 18.5% |
| $150,000 to $199,999 | 325 | 12.7% |
| $200,000+ | 330 | 12.9% |
Household Income by Householder Age in Harris Hill
The median household income in Harris Hill is $95,603, with the highest median household income of $131,100 found in the 45 to 64 years age bracket for the primary householder. A total of 762 households (29.8%) fall into this category. Meanwhile, the 15 to 24 years age bracket for the primary householder has the lowest median household income of $0, with 19 households (0.7%) in this group.
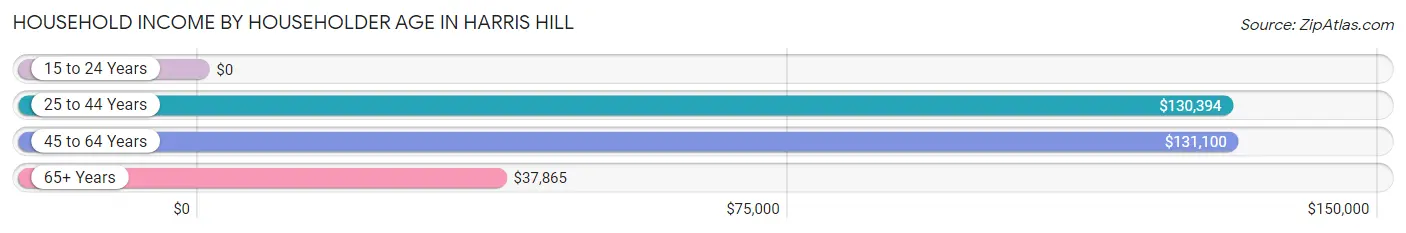
| Income Bracket | # Households | Median Income |
| 15 to 24 Years | 19 (0.7%) | $0 |
| 25 to 44 Years | 887 (34.7%) | $130,394 |
| 45 to 64 Years | 762 (29.8%) | $131,100 |
| 65+ Years | 890 (34.8%) | $37,865 |
| Total | 2,558 (100.0%) | $95,603 |
Poverty in Harris Hill
Income Below Poverty by Sex and Age in Harris Hill
With 6.7% poverty level for males and 11.7% for females among the residents of Harris Hill, 75 year old and over males and 5 year old females are the most vulnerable to poverty, with 92 males (33.6%) and 45 females (80.4%) in their respective age groups living below the poverty level.
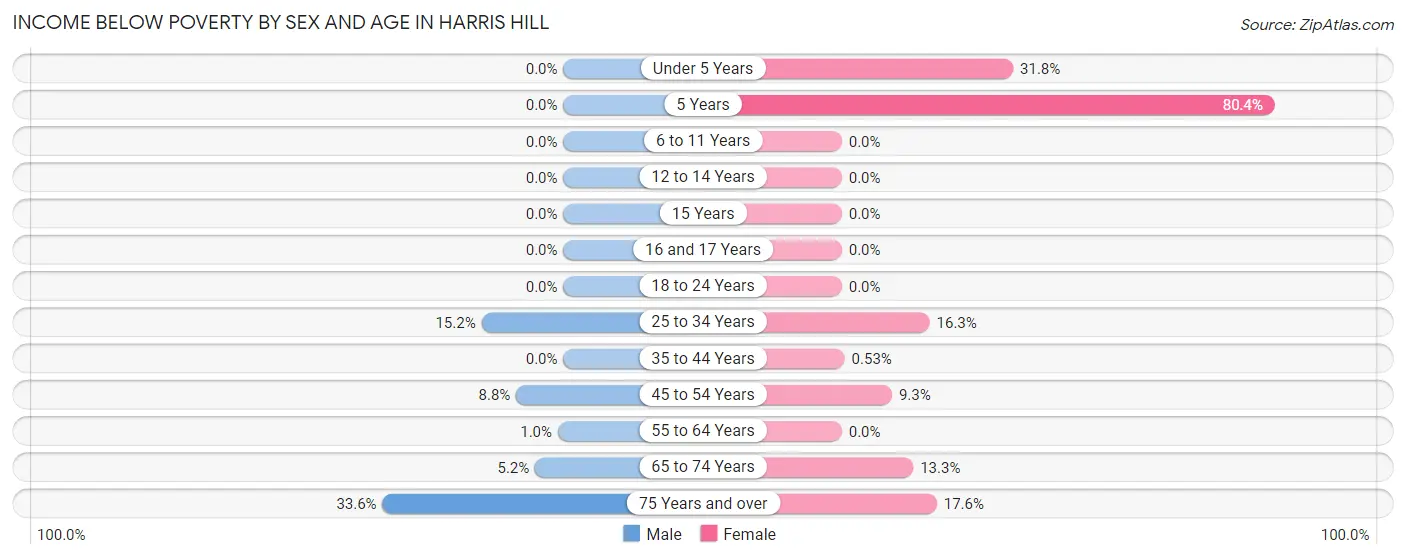
| Age Bracket | Male | Female |
| Under 5 Years | 0 (0.0%) | 90 (31.8%) |
| 5 Years | 0 (0.0%) | 45 (80.4%) |
| 6 to 11 Years | 0 (0.0%) | 0 (0.0%) |
| 12 to 14 Years | 0 (0.0%) | 0 (0.0%) |
| 15 Years | 0 (0.0%) | 0 (0.0%) |
| 16 and 17 Years | 0 (0.0%) | 0 (0.0%) |
| 18 to 24 Years | 0 (0.0%) | 0 (0.0%) |
| 25 to 34 Years | 74 (15.2%) | 67 (16.3%) |
| 35 to 44 Years | 0 (0.0%) | 2 (0.5%) |
| 45 to 54 Years | 23 (8.7%) | 37 (9.3%) |
| 55 to 64 Years | 4 (1.0%) | 0 (0.0%) |
| 65 to 74 Years | 12 (5.2%) | 37 (13.3%) |
| 75 Years and over | 92 (33.6%) | 76 (17.6%) |
| Total | 205 (6.7%) | 354 (11.7%) |
Income Above Poverty by Sex and Age in Harris Hill
According to the poverty statistics in Harris Hill, males aged under 5 years and females aged 6 to 11 years are the age groups that are most secure financially, with 100.0% of males and 100.0% of females in these age groups living above the poverty line.
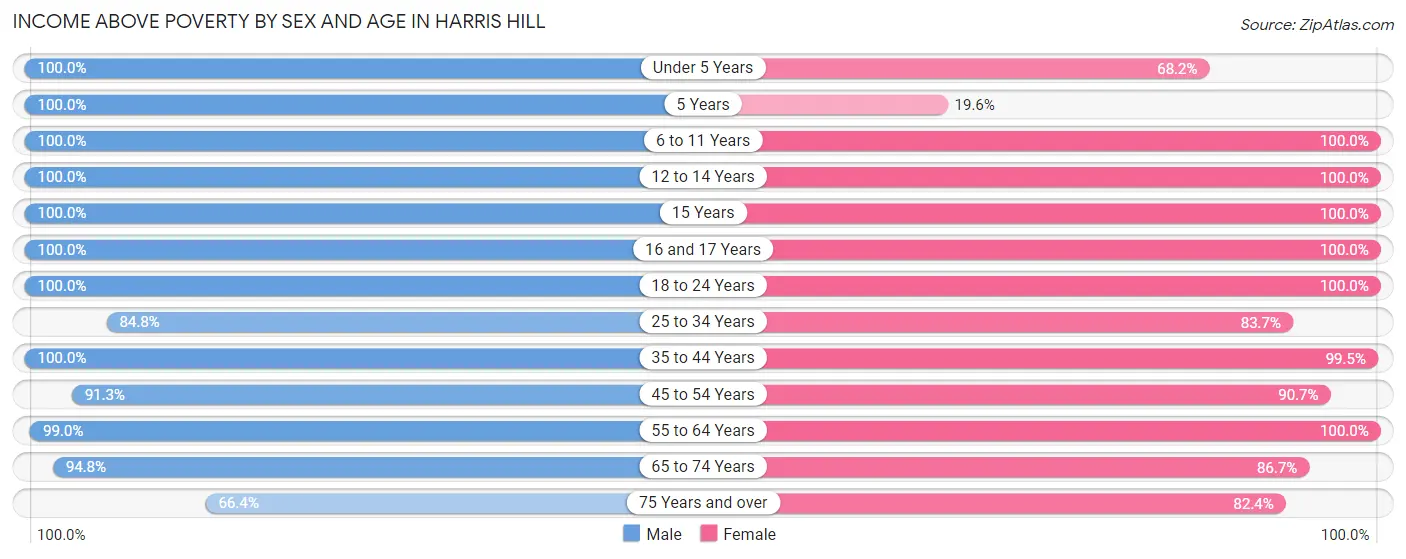
| Age Bracket | Male | Female |
| Under 5 Years | 417 (100.0%) | 193 (68.2%) |
| 5 Years | 24 (100.0%) | 11 (19.6%) |
| 6 to 11 Years | 167 (100.0%) | 267 (100.0%) |
| 12 to 14 Years | 68 (100.0%) | 77 (100.0%) |
| 15 Years | 44 (100.0%) | 33 (100.0%) |
| 16 and 17 Years | 89 (100.0%) | 9 (100.0%) |
| 18 to 24 Years | 142 (100.0%) | 99 (100.0%) |
| 25 to 34 Years | 413 (84.8%) | 344 (83.7%) |
| 35 to 44 Years | 486 (100.0%) | 377 (99.5%) |
| 45 to 54 Years | 240 (91.2%) | 360 (90.7%) |
| 55 to 64 Years | 388 (99.0%) | 304 (100.0%) |
| 65 to 74 Years | 217 (94.8%) | 242 (86.7%) |
| 75 Years and over | 182 (66.4%) | 355 (82.4%) |
| Total | 2,877 (93.3%) | 2,671 (88.3%) |
Income Below Poverty Among Married-Couple Families in Harris Hill
The poverty statistics for married-couple families in Harris Hill show that 9.0% or 129 of the total 1,435 families live below the poverty line. Families with 3 or 4 children have the highest poverty rate of 30.8%, comprising of 45 families. On the other hand, families with 1 or 2 children have the lowest poverty rate of 0.0%, which includes 0 families.
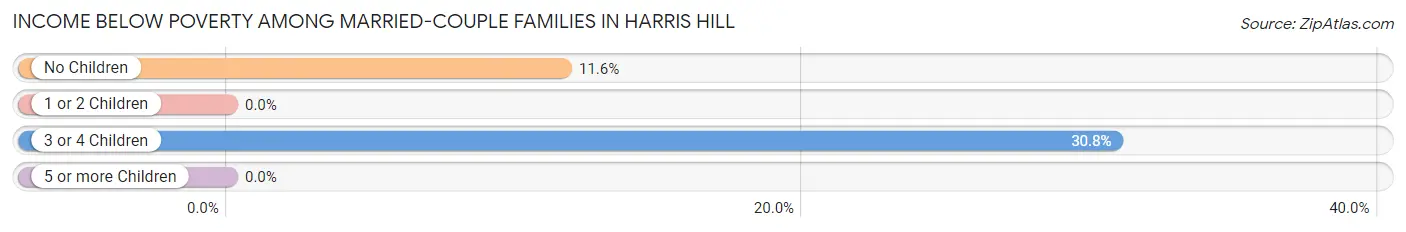
| Children | Above Poverty | Below Poverty |
| No Children | 638 (88.4%) | 84 (11.6%) |
| 1 or 2 Children | 567 (100.0%) | 0 (0.0%) |
| 3 or 4 Children | 101 (69.2%) | 45 (30.8%) |
| 5 or more Children | 0 (0.0%) | 0 (0.0%) |
| Total | 1,306 (91.0%) | 129 (9.0%) |
Income Below Poverty Among Single-Parent Households in Harris Hill
| Children | Single Father | Single Mother |
| No Children | 0 (0.0%) | 0 (0.0%) |
| 1 or 2 Children | 0 (0.0%) | 0 (0.0%) |
| 3 or 4 Children | 0 (0.0%) | 0 (0.0%) |
| 5 or more Children | 0 (0.0%) | 0 (0.0%) |
| Total | 0 (0.0%) | 0 (0.0%) |
Income Below Poverty Among Married-Couple vs Single-Parent Households in Harris Hill
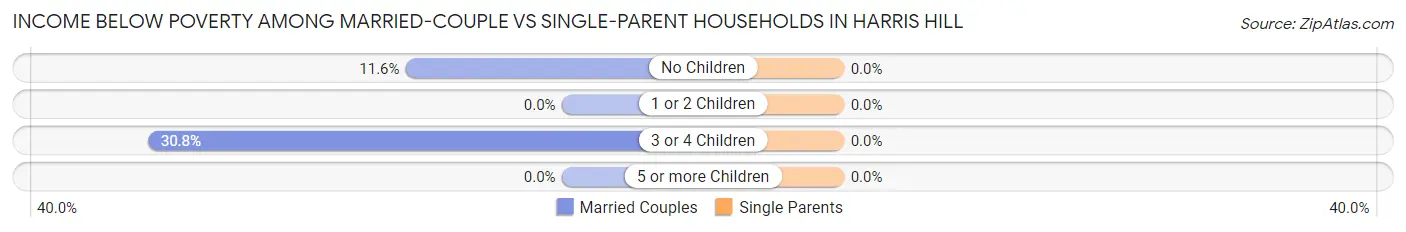
| Children | Married-Couple Families | Single-Parent Households |
| No Children | 84 (11.6%) | 0 (0.0%) |
| 1 or 2 Children | 0 (0.0%) | 0 (0.0%) |
| 3 or 4 Children | 45 (30.8%) | 0 (0.0%) |
| 5 or more Children | 0 (0.0%) | 0 (0.0%) |
| Total | 129 (9.0%) | 0 (0.0%) |
Race in Harris Hill
The most populous races in Harris Hill are White / Caucasian (5,849 | 95.8%), Asian (109 | 1.8%), and Two or more Races (85 | 1.4%).
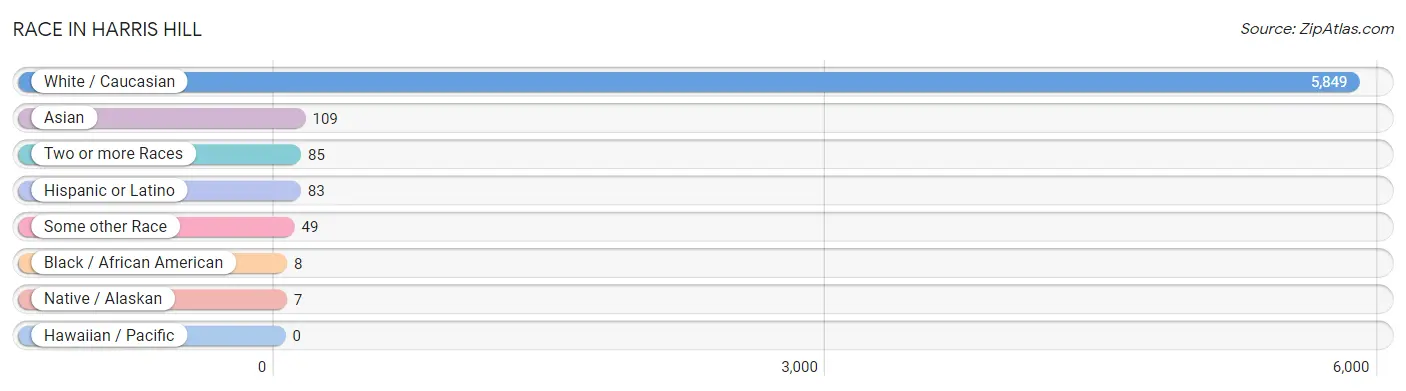
| Race | # Population | % Population |
| Asian | 109 | 1.8% |
| Black / African American | 8 | 0.1% |
| Hawaiian / Pacific | 0 | 0.0% |
| Hispanic or Latino | 83 | 1.4% |
| Native / Alaskan | 7 | 0.1% |
| White / Caucasian | 5,849 | 95.8% |
| Two or more Races | 85 | 1.4% |
| Some other Race | 49 | 0.8% |
| Total | 6,107 | 100.0% |
Ancestry in Harris Hill
The most populous ancestries reported in Harris Hill are German (2,070 | 33.9%), Irish (1,472 | 24.1%), Polish (1,387 | 22.7%), Italian (1,088 | 17.8%), and English (330 | 5.4%), together accounting for 103.9% of all Harris Hill residents.
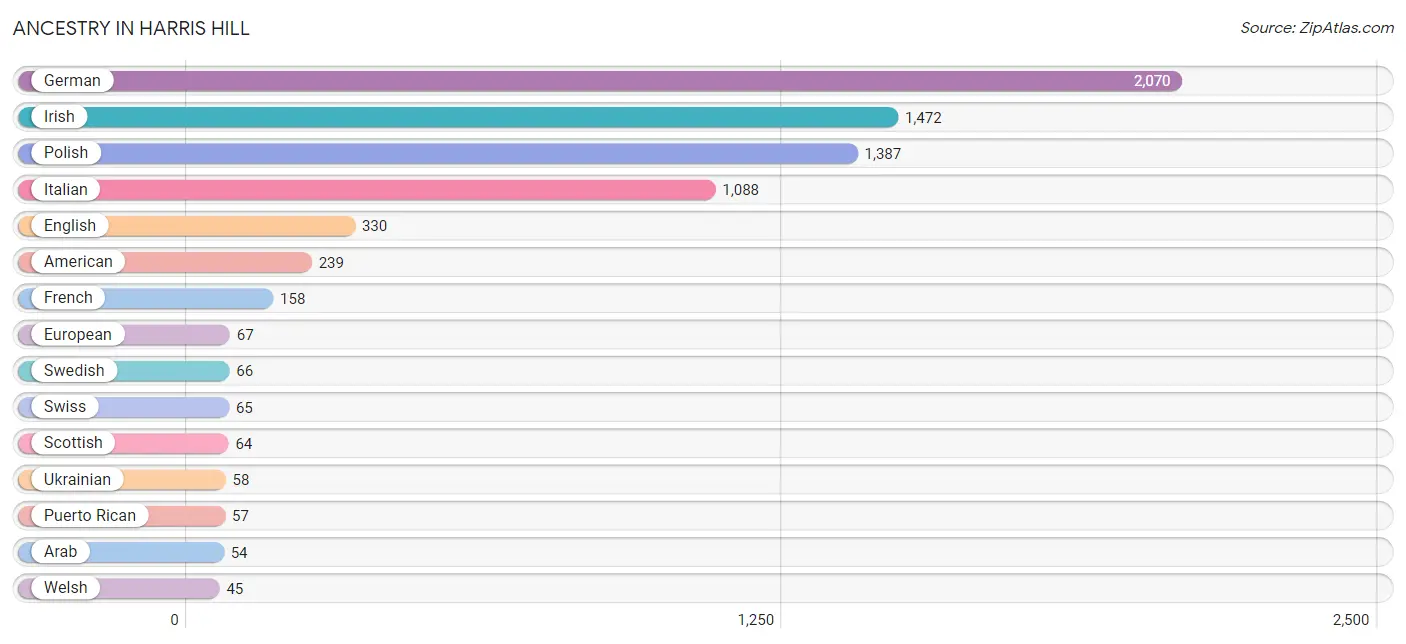
| Ancestry | # Population | % Population |
| American | 239 | 3.9% |
| Arab | 54 | 0.9% |
| Austrian | 14 | 0.2% |
| British | 14 | 0.2% |
| Burmese | 9 | 0.2% |
| Canadian | 30 | 0.5% |
| Celtic | 8 | 0.1% |
| Croatian | 17 | 0.3% |
| Dutch | 15 | 0.3% |
| Eastern European | 41 | 0.7% |
| Ecuadorian | 17 | 0.3% |
| English | 330 | 5.4% |
| European | 67 | 1.1% |
| French | 158 | 2.6% |
| French Canadian | 8 | 0.1% |
| German | 2,070 | 33.9% |
| Greek | 39 | 0.6% |
| Hungarian | 17 | 0.3% |
| Iranian | 2 | 0.0% |
| Irish | 1,472 | 24.1% |
| Italian | 1,088 | 17.8% |
| Korean | 31 | 0.5% |
| Lebanese | 6 | 0.1% |
| Mexican | 9 | 0.2% |
| Norwegian | 27 | 0.4% |
| Polish | 1,387 | 22.7% |
| Puerto Rican | 57 | 0.9% |
| Romanian | 17 | 0.3% |
| Scotch-Irish | 22 | 0.4% |
| Scottish | 64 | 1.1% |
| South American | 17 | 0.3% |
| Swedish | 66 | 1.1% |
| Swiss | 65 | 1.1% |
| Turkish | 19 | 0.3% |
| Ukrainian | 58 | 0.9% |
| Vietnamese | 26 | 0.4% |
| Welsh | 45 | 0.7% | View All 37 Rows |
Immigrants in Harris Hill
The most numerous immigrant groups reported in Harris Hill came from Asia (127 | 2.1%), South Central Asia (96 | 1.6%), Iran (50 | 0.8%), Philippines (31 | 0.5%), and South Eastern Asia (31 | 0.5%), together accounting for 5.5% of all Harris Hill residents.
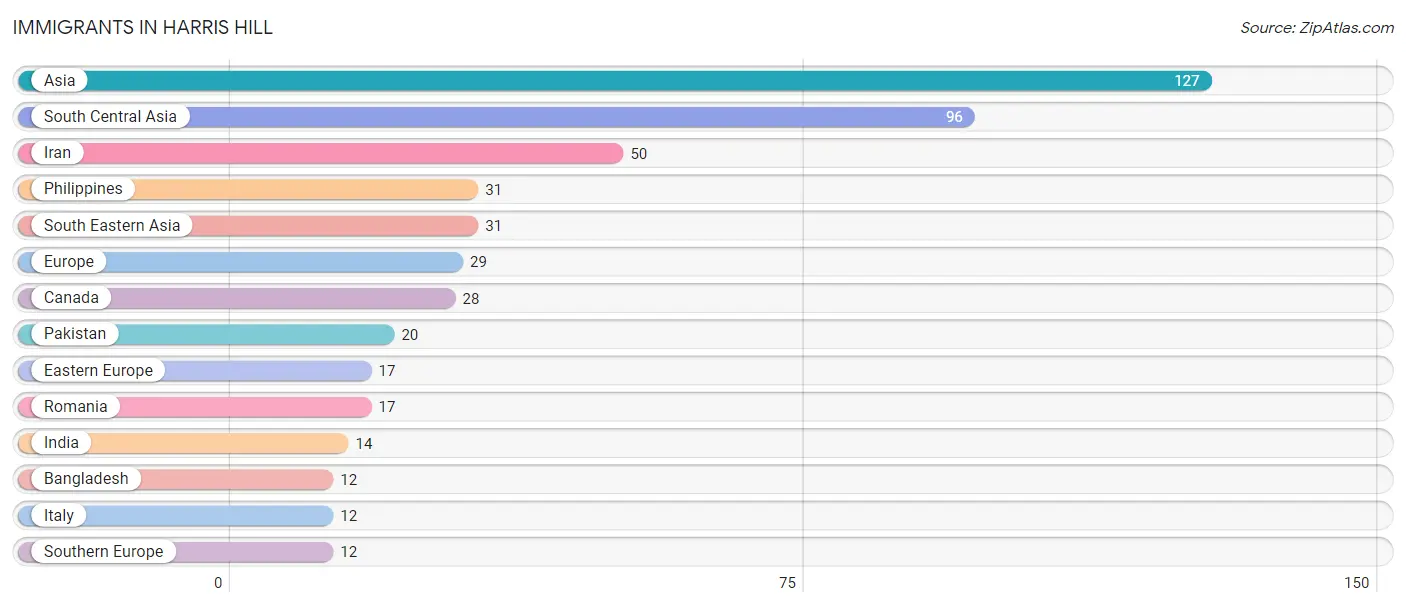
| Immigration Origin | # Population | % Population |
| Asia | 127 | 2.1% |
| Bangladesh | 12 | 0.2% |
| Canada | 28 | 0.5% |
| Eastern Europe | 17 | 0.3% |
| Europe | 29 | 0.5% |
| India | 14 | 0.2% |
| Iran | 50 | 0.8% |
| Italy | 12 | 0.2% |
| Pakistan | 20 | 0.3% |
| Philippines | 31 | 0.5% |
| Romania | 17 | 0.3% |
| South Central Asia | 96 | 1.6% |
| South Eastern Asia | 31 | 0.5% |
| Southern Europe | 12 | 0.2% | View All 14 Rows |
Sex and Age in Harris Hill
Sex and Age in Harris Hill
The most populous age groups in Harris Hill are Under 5 Years (417 | 13.5%) for men and 50 to 54 Years (292 | 9.7%) for women.
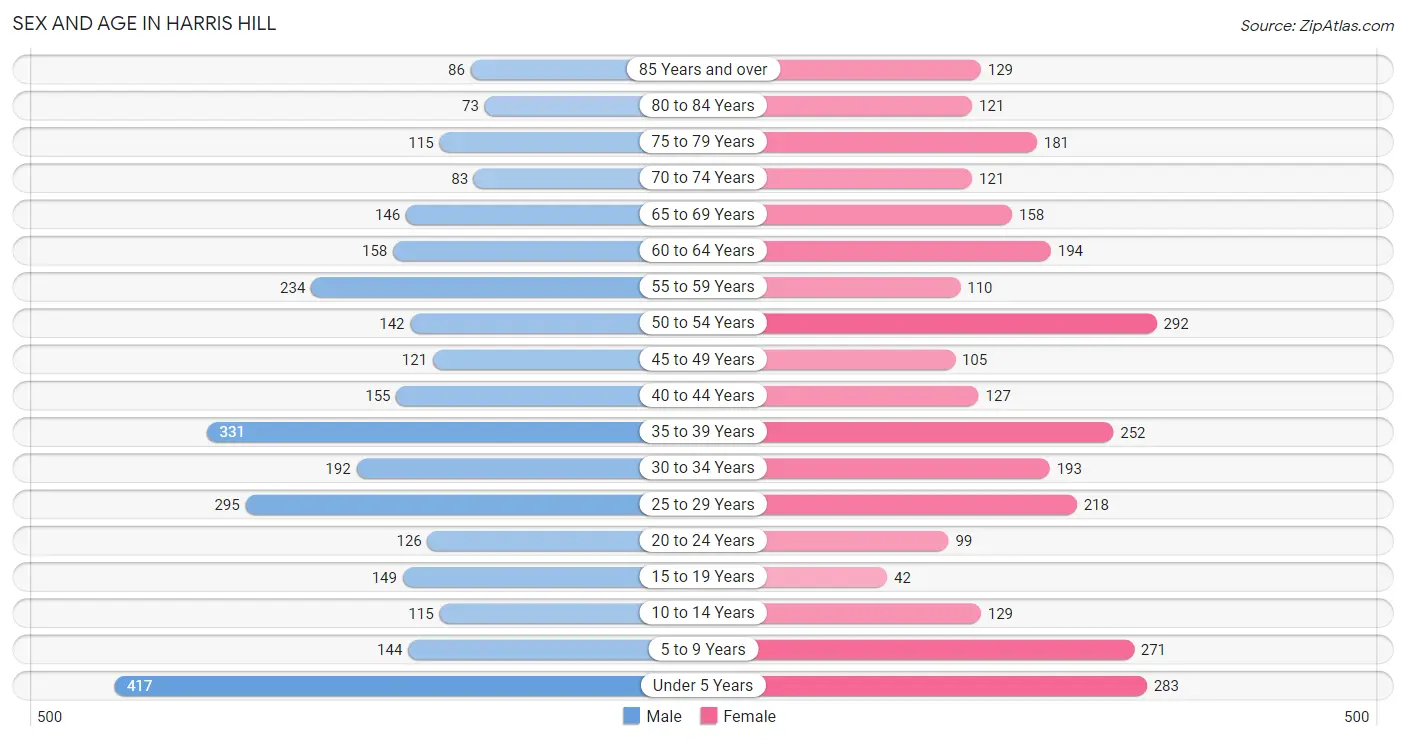
| Age Bracket | Male | Female |
| Under 5 Years | 417 (13.5%) | 283 (9.4%) |
| 5 to 9 Years | 144 (4.7%) | 271 (9.0%) |
| 10 to 14 Years | 115 (3.7%) | 129 (4.3%) |
| 15 to 19 Years | 149 (4.8%) | 42 (1.4%) |
| 20 to 24 Years | 126 (4.1%) | 99 (3.3%) |
| 25 to 29 Years | 295 (9.6%) | 218 (7.2%) |
| 30 to 34 Years | 192 (6.2%) | 193 (6.4%) |
| 35 to 39 Years | 331 (10.7%) | 252 (8.3%) |
| 40 to 44 Years | 155 (5.0%) | 127 (4.2%) |
| 45 to 49 Years | 121 (3.9%) | 105 (3.5%) |
| 50 to 54 Years | 142 (4.6%) | 292 (9.7%) |
| 55 to 59 Years | 234 (7.6%) | 110 (3.6%) |
| 60 to 64 Years | 158 (5.1%) | 194 (6.4%) |
| 65 to 69 Years | 146 (4.7%) | 158 (5.2%) |
| 70 to 74 Years | 83 (2.7%) | 121 (4.0%) |
| 75 to 79 Years | 115 (3.7%) | 181 (6.0%) |
| 80 to 84 Years | 73 (2.4%) | 121 (4.0%) |
| 85 Years and over | 86 (2.8%) | 129 (4.3%) |
| Total | 3,082 (100.0%) | 3,025 (100.0%) |
Families and Households in Harris Hill
Median Family Size in Harris Hill
The median family size in Harris Hill is 3.04 persons per family, with married-couple families (1,435 | 86.7%) accounting for the largest median family size of 3.12 persons per family. On the other hand, single male/father families (51 | 3.1%) represent the smallest median family size with 2.04 persons per family.
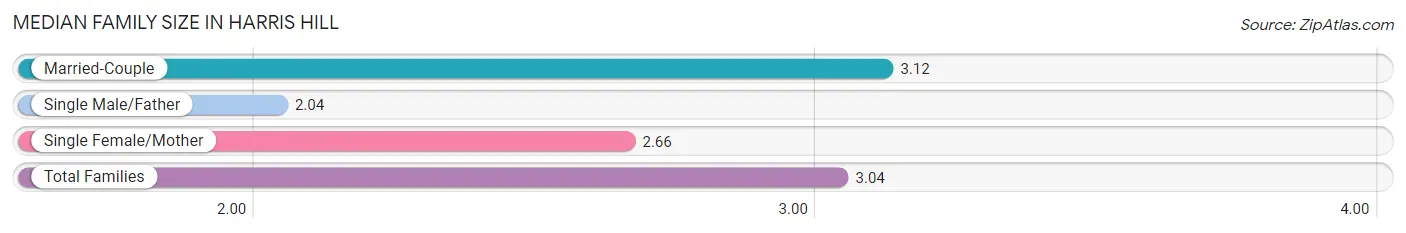
| Family Type | # Families | Family Size |
| Married-Couple | 1,435 (86.7%) | 3.12 |
| Single Male/Father | 51 (3.1%) | 2.04 |
| Single Female/Mother | 169 (10.2%) | 2.66 |
| Total Families | 1,655 (100.0%) | 3.04 |
Median Household Size in Harris Hill
The median household size in Harris Hill is 2.38 persons per household, with married-couple households (1,435 | 56.1%) accounting for the largest median household size of 3.12 persons per household. non-family households (903 | 35.3%) represent the smallest median household size with 1.13 persons per household.
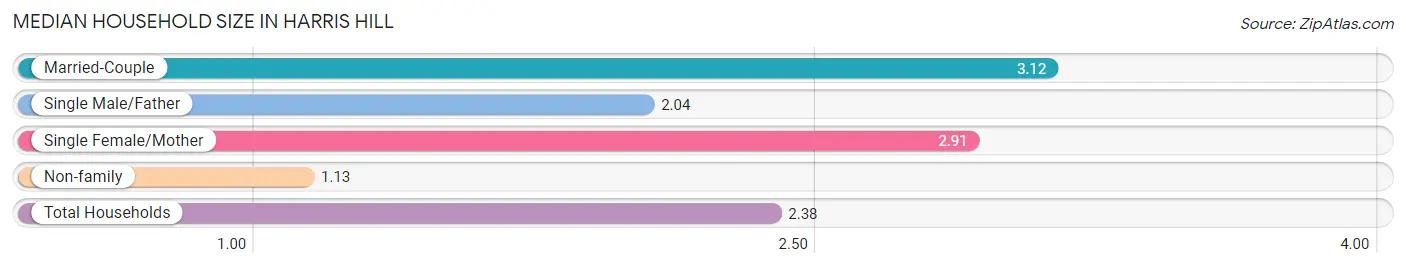
| Household Type | # Households | Household Size |
| Married-Couple | 1,435 (56.1%) | 3.12 |
| Single Male/Father | 51 (2.0%) | 2.04 |
| Single Female/Mother | 169 (6.6%) | 2.91 |
| Non-family | 903 (35.3%) | 1.13 |
| Total Households | 2,558 (100.0%) | 2.38 |
Household Size by Marriage Status in Harris Hill
Out of a total of 2,558 households in Harris Hill, 1,655 (64.7%) are family households, while 903 (35.3%) are nonfamily households. The most numerous type of family households are 2-person households, comprising 792, and the most common type of nonfamily households are 1-person households, comprising 794.
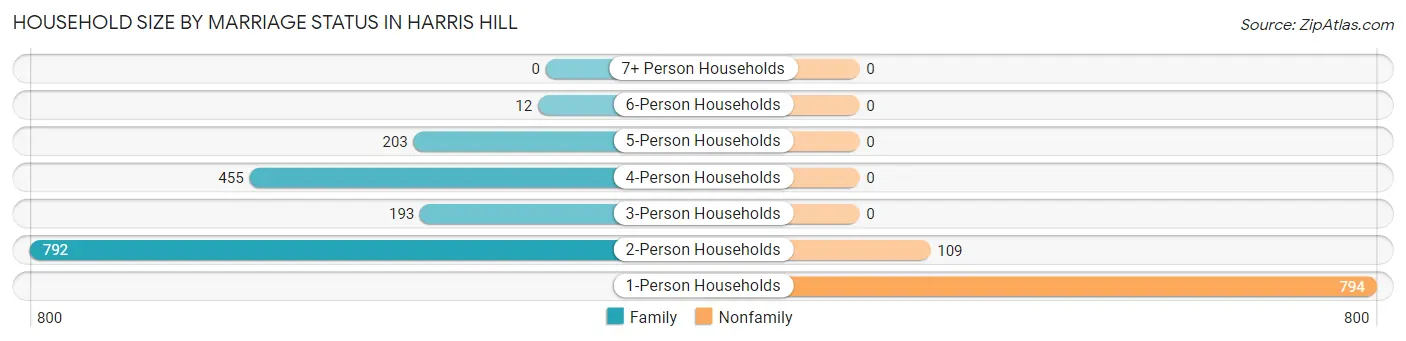
| Household Size | Family Households | Nonfamily Households |
| 1-Person Households | - | 794 (31.0%) |
| 2-Person Households | 792 (31.0%) | 109 (4.3%) |
| 3-Person Households | 193 (7.5%) | 0 (0.0%) |
| 4-Person Households | 455 (17.8%) | 0 (0.0%) |
| 5-Person Households | 203 (7.9%) | 0 (0.0%) |
| 6-Person Households | 12 (0.5%) | 0 (0.0%) |
| 7+ Person Households | 0 (0.0%) | 0 (0.0%) |
| Total | 1,655 (64.7%) | 903 (35.3%) |
Female Fertility in Harris Hill
Fertility by Age in Harris Hill
Average fertility rate in Harris Hill is 224.0 births per 1,000 women. Women in the age bracket of 20 to 34 years have the highest fertility rate with 420.0 births per 1,000 women. Women in the age bracket of 20 to 34 years acount for 83.0% of all women with births.
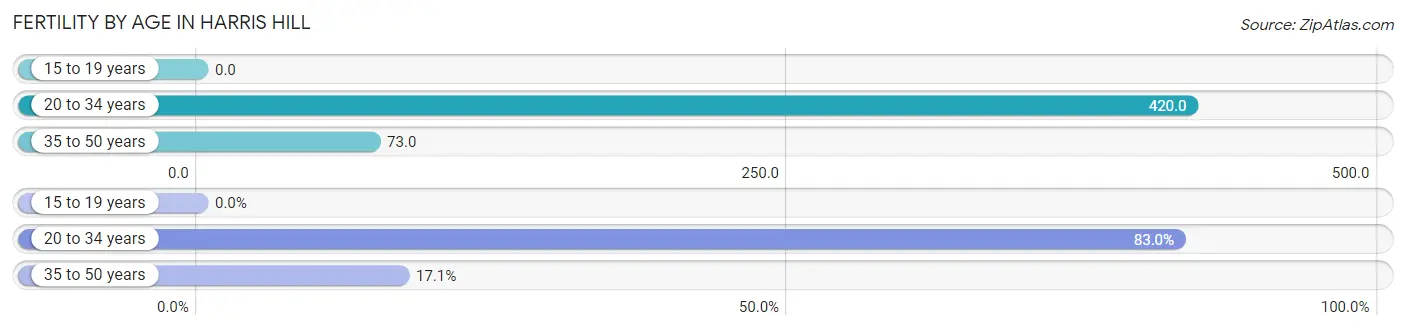
| Age Bracket | Women with Births | Births / 1,000 Women |
| 15 to 19 years | 0 (0.0%) | 0.0 |
| 20 to 34 years | 214 (83.0%) | 420.0 |
| 35 to 50 years | 44 (17.1%) | 73.0 |
| Total | 258 (100.0%) | 224.0 |
Fertility by Age by Marriage Status in Harris Hill
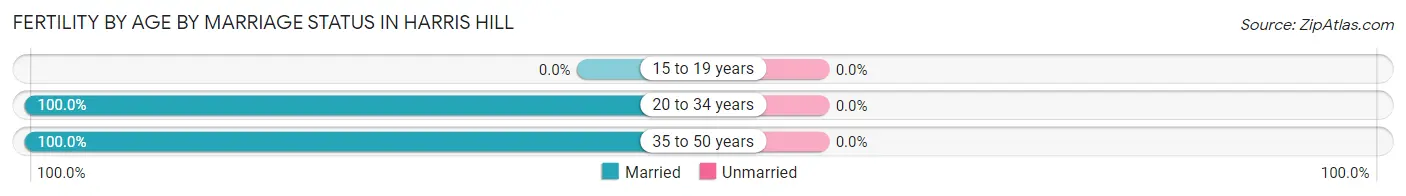
| Age Bracket | Married | Unmarried |
| 15 to 19 years | 0 (0.0%) | 0 (0.0%) |
| 20 to 34 years | 214 (100.0%) | 0 (0.0%) |
| 35 to 50 years | 44 (100.0%) | 0 (0.0%) |
| Total | 258 (100.0%) | 0 (0.0%) |
Fertility by Education in Harris Hill
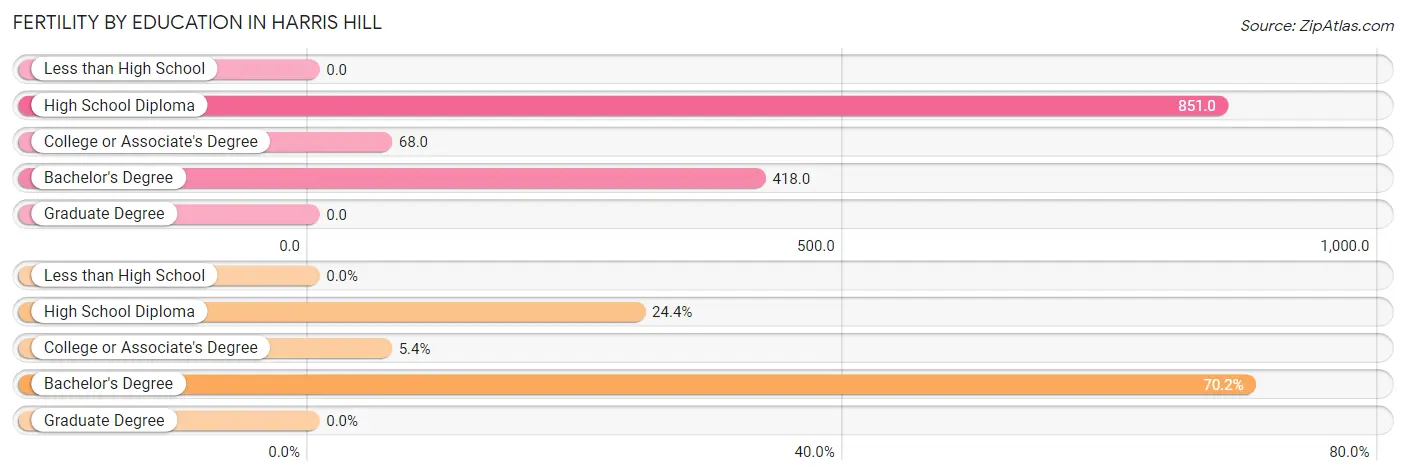
| Educational Attainment | Women with Births | Births / 1,000 Women |
| Less than High School | 0 (0.0%) | 0.0 |
| High School Diploma | 63 (24.4%) | 851.0 |
| College or Associate's Degree | 14 (5.4%) | 68.0 |
| Bachelor's Degree | 181 (70.2%) | 418.0 |
| Graduate Degree | 0 (0.0%) | 0.0 |
| Total | 258 (100.0%) | 224.0 |
Fertility by Education by Marriage Status in Harris Hill
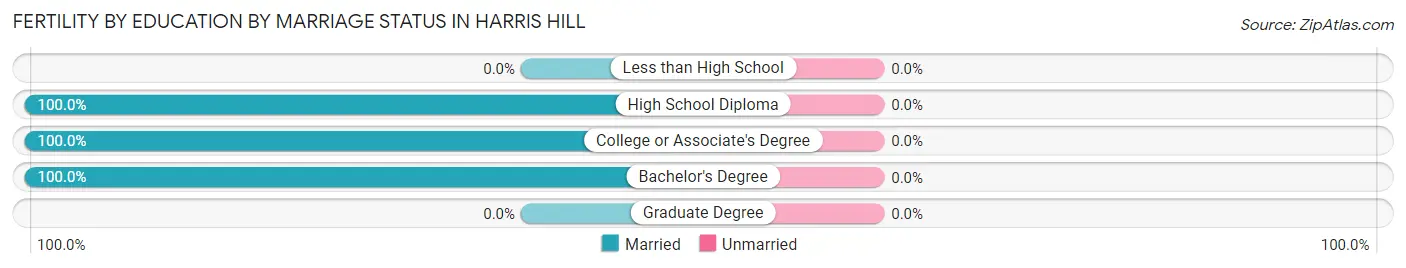
| Educational Attainment | Married | Unmarried |
| Less than High School | 0 (0.0%) | 0 (0.0%) |
| High School Diploma | 63 (100.0%) | 0 (0.0%) |
| College or Associate's Degree | 14 (100.0%) | 0 (0.0%) |
| Bachelor's Degree | 181 (100.0%) | 0 (0.0%) |
| Graduate Degree | 0 (0.0%) | 0 (0.0%) |
| Total | 258 (100.0%) | 0 (0.0%) |
Employment Characteristics in Harris Hill
Employment by Class of Employer in Harris Hill
Among the 2,917 employed individuals in Harris Hill, private company employees (1,853 | 63.5%), not-for-profit organizations (254 | 8.7%), and local government employees (249 | 8.5%) make up the most common classes of employment.
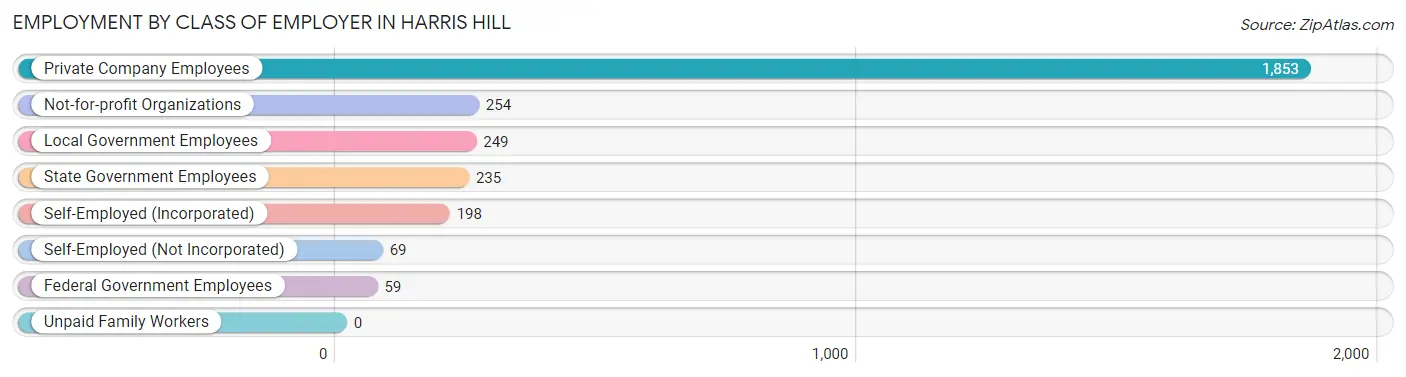
| Employer Class | # Employees | % Employees |
| Private Company Employees | 1,853 | 63.5% |
| Self-Employed (Incorporated) | 198 | 6.8% |
| Self-Employed (Not Incorporated) | 69 | 2.4% |
| Not-for-profit Organizations | 254 | 8.7% |
| Local Government Employees | 249 | 8.5% |
| State Government Employees | 235 | 8.1% |
| Federal Government Employees | 59 | 2.0% |
| Unpaid Family Workers | 0 | 0.0% |
| Total | 2,917 | 100.0% |
Employment Status by Age in Harris Hill
According to the labor force statistics for Harris Hill, out of the total population over 16 years of age (4,671), 66.9% or 3,125 individuals are in the labor force, with 1.3% or 41 of them unemployed. The age group with the highest labor force participation rate is 25 to 29 years, with 97.7% or 501 individuals in the labor force. Within the labor force, the 16 to 19 years age range has the highest percentage of unemployed individuals, with 19.3% or 16 of them being unemployed.
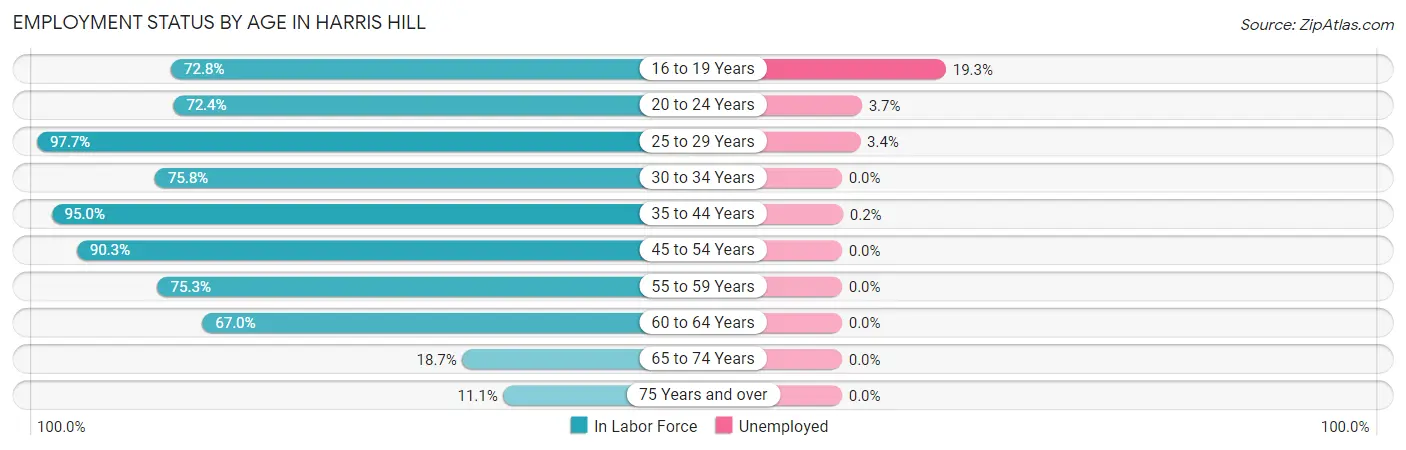
| Age Bracket | In Labor Force | Unemployed |
| 16 to 19 Years | 83 (72.8%) | 16 (19.3%) |
| 20 to 24 Years | 163 (72.4%) | 6 (3.7%) |
| 25 to 29 Years | 501 (97.7%) | 17 (3.4%) |
| 30 to 34 Years | 292 (75.8%) | 0 (0.0%) |
| 35 to 44 Years | 822 (95.0%) | 2 (0.2%) |
| 45 to 54 Years | 596 (90.3%) | 0 (0.0%) |
| 55 to 59 Years | 259 (75.3%) | 0 (0.0%) |
| 60 to 64 Years | 236 (67.0%) | 0 (0.0%) |
| 65 to 74 Years | 95 (18.7%) | 0 (0.0%) |
| 75 Years and over | 78 (11.1%) | 0 (0.0%) |
| Total | 3,125 (66.9%) | 41 (1.3%) |
Employment Status by Educational Attainment in Harris Hill
According to labor force statistics for Harris Hill, 86.8% of individuals (2,707) out of the total population between 25 and 64 years of age (3,119) are in the labor force, with 0.7% or 19 of them being unemployed. The group with the highest labor force participation rate are those with the educational attainment of bachelor's degree or higher, with 91.0% or 1,818 individuals in the labor force. Within the labor force, individuals with college / associate degree education have the highest percentage of unemployment, with 2.5% or 17 of them being unemployed.
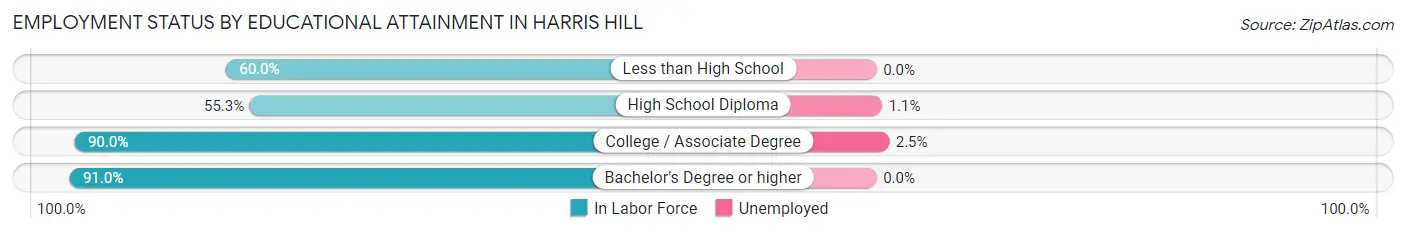
| Educational Attainment | In Labor Force | Unemployed |
| Less than High School | 6 (60.0%) | 0 (0.0%) |
| High School Diploma | 189 (55.3%) | 4 (1.1%) |
| College / Associate Degree | 692 (90.0%) | 19 (2.5%) |
| Bachelor's Degree or higher | 1,818 (91.0%) | 0 (0.0%) |
| Total | 2,707 (86.8%) | 22 (0.7%) |
Employment Occupations by Sex in Harris Hill
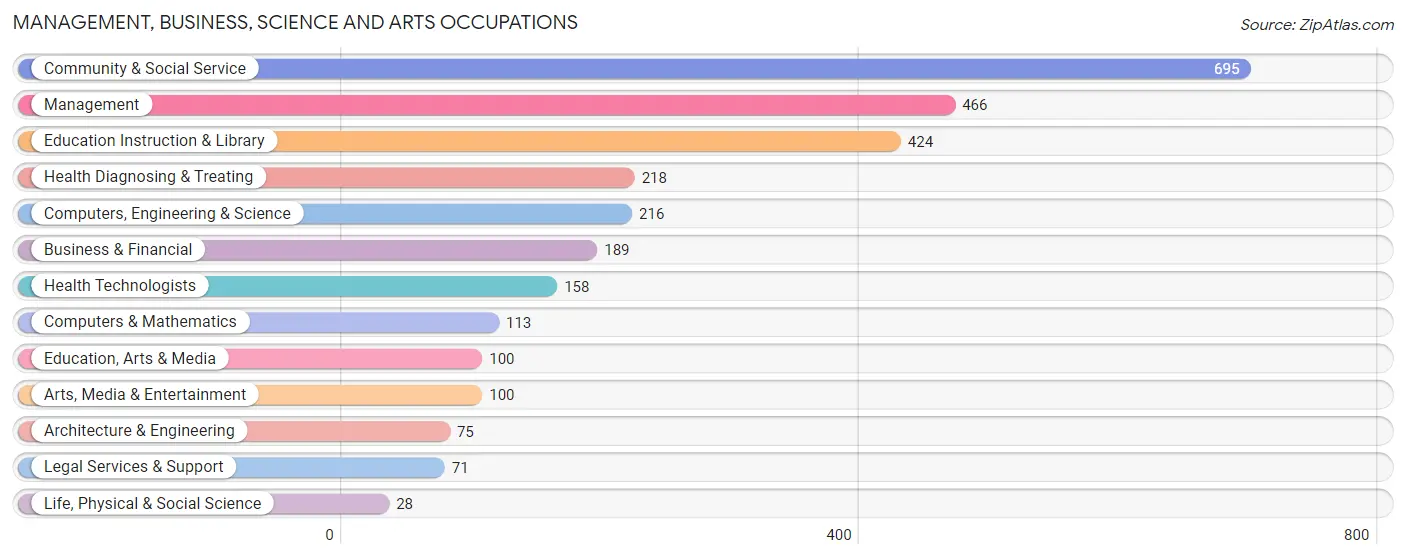
Management, Business, Science and Arts Occupations
The most common Management, Business, Science and Arts occupations in Harris Hill are Community & Social Service (695 | 22.5%), Management (466 | 15.1%), Education Instruction & Library (424 | 13.8%), Health Diagnosing & Treating (218 | 7.1%), and Computers, Engineering & Science (216 | 7.0%).
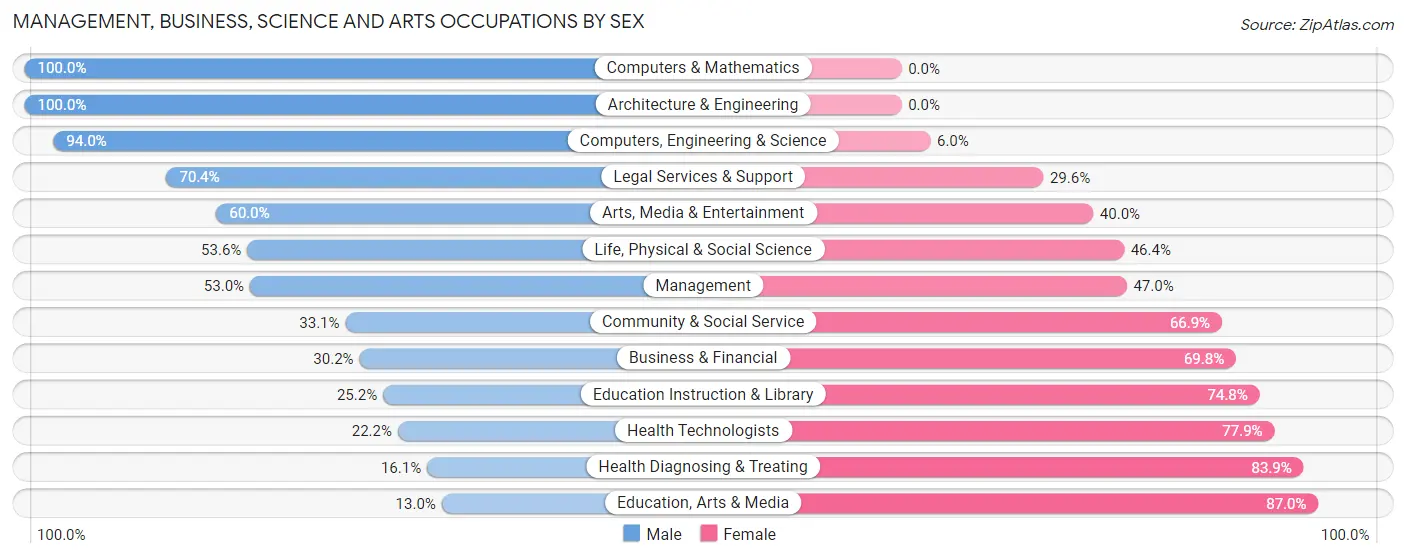
Management, Business, Science and Arts Occupations by Sex
Within the Management, Business, Science and Arts occupations in Harris Hill, the most male-oriented occupations are Computers & Mathematics (100.0%), Architecture & Engineering (100.0%), and Computers, Engineering & Science (94.0%), while the most female-oriented occupations are Education, Arts & Media (87.0%), Health Diagnosing & Treating (83.9%), and Health Technologists (77.8%).
| Occupation | Male | Female |
| Management | 247 (53.0%) | 219 (47.0%) |
| Business & Financial | 57 (30.2%) | 132 (69.8%) |
| Computers, Engineering & Science | 203 (94.0%) | 13 (6.0%) |
| Computers & Mathematics | 113 (100.0%) | 0 (0.0%) |
| Architecture & Engineering | 75 (100.0%) | 0 (0.0%) |
| Life, Physical & Social Science | 15 (53.6%) | 13 (46.4%) |
| Community & Social Service | 230 (33.1%) | 465 (66.9%) |
| Education, Arts & Media | 13 (13.0%) | 87 (87.0%) |
| Legal Services & Support | 50 (70.4%) | 21 (29.6%) |
| Education Instruction & Library | 107 (25.2%) | 317 (74.8%) |
| Arts, Media & Entertainment | 60 (60.0%) | 40 (40.0%) |
| Health Diagnosing & Treating | 35 (16.1%) | 183 (83.9%) |
| Health Technologists | 35 (22.2%) | 123 (77.8%) |
| Total (Category) | 772 (43.3%) | 1,012 (56.7%) |
| Total (Overall) | 1,696 (55.0%) | 1,388 (45.0%) |
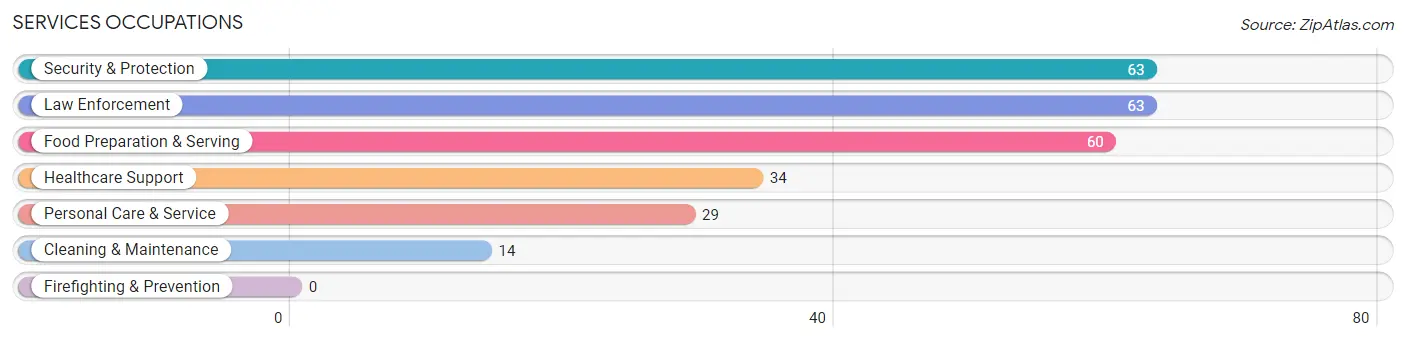
Services Occupations
The most common Services occupations in Harris Hill are Security & Protection (63 | 2.0%), Law Enforcement (63 | 2.0%), Food Preparation & Serving (60 | 1.9%), Healthcare Support (34 | 1.1%), and Personal Care & Service (29 | 0.9%).
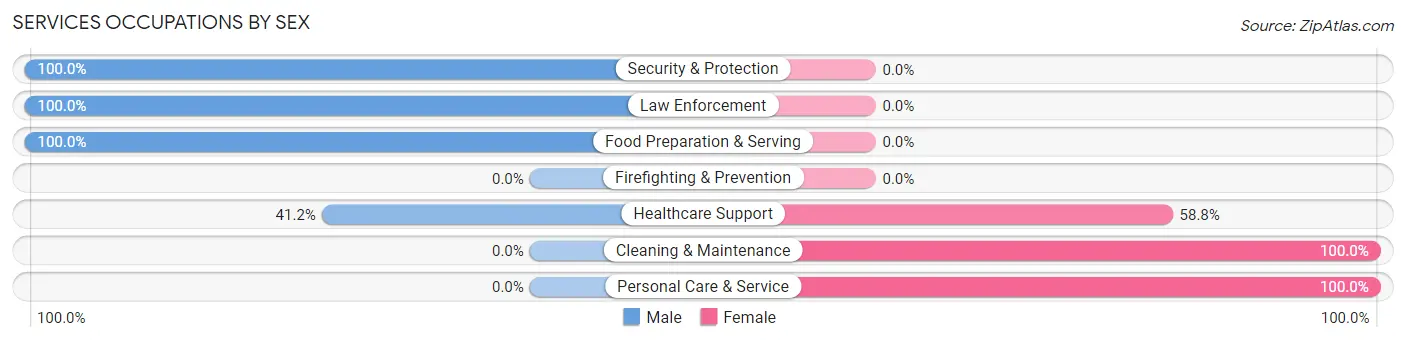
Services Occupations by Sex
Within the Services occupations in Harris Hill, the most male-oriented occupations are Security & Protection (100.0%), Law Enforcement (100.0%), and Food Preparation & Serving (100.0%), while the most female-oriented occupations are Cleaning & Maintenance (100.0%), Personal Care & Service (100.0%), and Healthcare Support (58.8%).
| Occupation | Male | Female |
| Healthcare Support | 14 (41.2%) | 20 (58.8%) |
| Security & Protection | 63 (100.0%) | 0 (0.0%) |
| Firefighting & Prevention | 0 (0.0%) | 0 (0.0%) |
| Law Enforcement | 63 (100.0%) | 0 (0.0%) |
| Food Preparation & Serving | 60 (100.0%) | 0 (0.0%) |
| Cleaning & Maintenance | 0 (0.0%) | 14 (100.0%) |
| Personal Care & Service | 0 (0.0%) | 29 (100.0%) |
| Total (Category) | 137 (68.5%) | 63 (31.5%) |
| Total (Overall) | 1,696 (55.0%) | 1,388 (45.0%) |
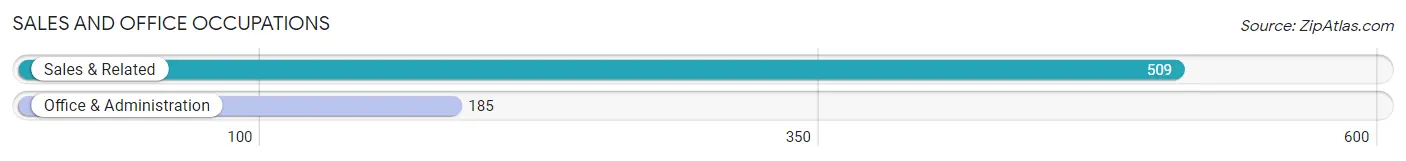
Sales and Office Occupations
The most common Sales and Office occupations in Harris Hill are Sales & Related (509 | 16.5%), and Office & Administration (185 | 6.0%).
Sales and Office Occupations by Sex
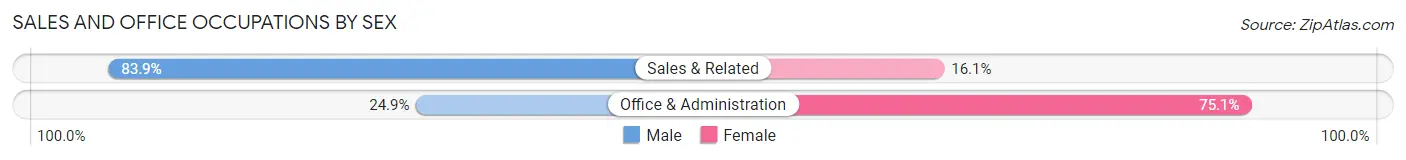
| Occupation | Male | Female |
| Sales & Related | 427 (83.9%) | 82 (16.1%) |
| Office & Administration | 46 (24.9%) | 139 (75.1%) |
| Total (Category) | 473 (68.2%) | 221 (31.8%) |
| Total (Overall) | 1,696 (55.0%) | 1,388 (45.0%) |
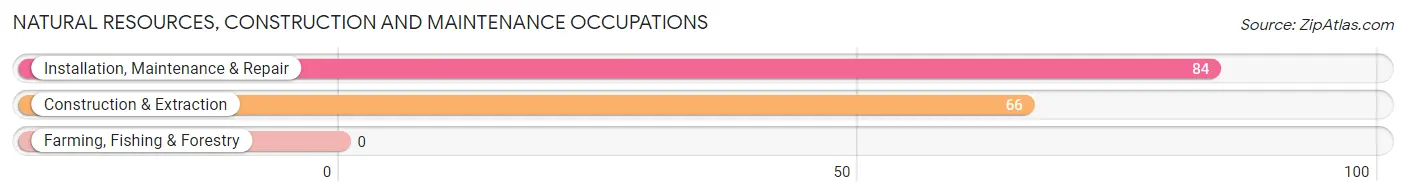
Natural Resources, Construction and Maintenance Occupations
The most common Natural Resources, Construction and Maintenance occupations in Harris Hill are Installation, Maintenance & Repair (84 | 2.7%), and Construction & Extraction (66 | 2.1%).
Natural Resources, Construction and Maintenance Occupations by Sex
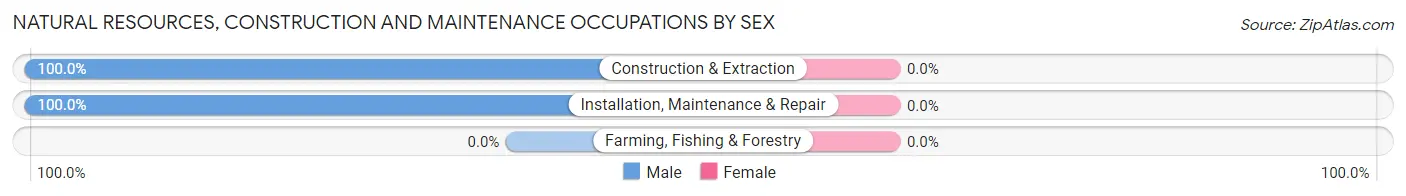
| Occupation | Male | Female |
| Farming, Fishing & Forestry | 0 (0.0%) | 0 (0.0%) |
| Construction & Extraction | 66 (100.0%) | 0 (0.0%) |
| Installation, Maintenance & Repair | 84 (100.0%) | 0 (0.0%) |
| Total (Category) | 150 (100.0%) | 0 (0.0%) |
| Total (Overall) | 1,696 (55.0%) | 1,388 (45.0%) |
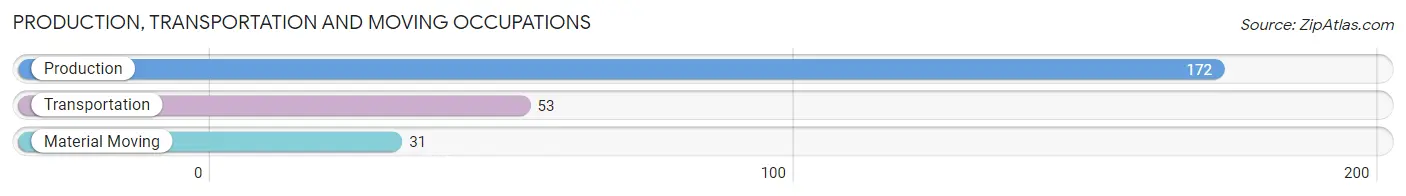
Production, Transportation and Moving Occupations
The most common Production, Transportation and Moving occupations in Harris Hill are Production (172 | 5.6%), Transportation (53 | 1.7%), and Material Moving (31 | 1.0%).
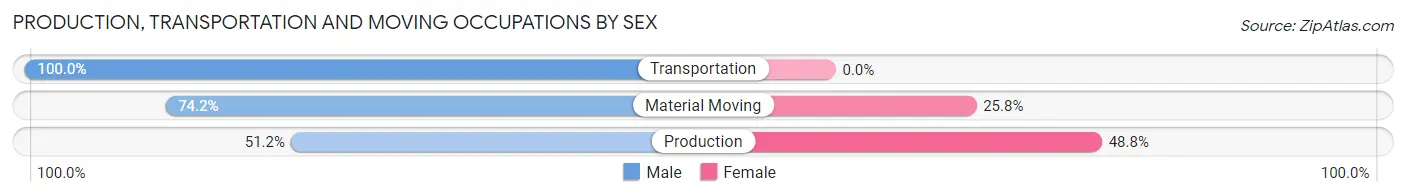
Production, Transportation and Moving Occupations by Sex
| Occupation | Male | Female |
| Production | 88 (51.2%) | 84 (48.8%) |
| Transportation | 53 (100.0%) | 0 (0.0%) |
| Material Moving | 23 (74.2%) | 8 (25.8%) |
| Total (Category) | 164 (64.1%) | 92 (35.9%) |
| Total (Overall) | 1,696 (55.0%) | 1,388 (45.0%) |
Employment Industries by Sex in Harris Hill
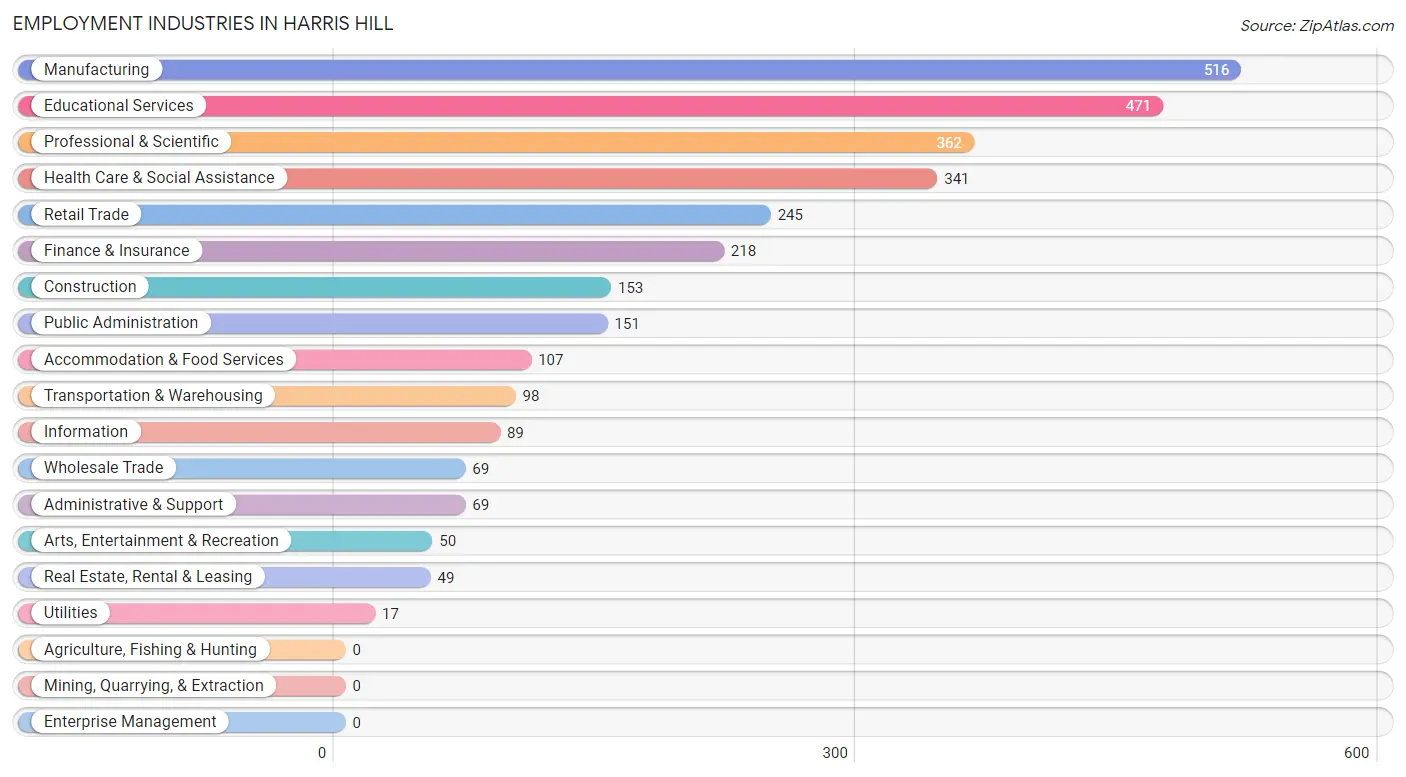
Employment Industries in Harris Hill
The major employment industries in Harris Hill include Manufacturing (516 | 16.7%), Educational Services (471 | 15.3%), Professional & Scientific (362 | 11.7%), Health Care & Social Assistance (341 | 11.1%), and Retail Trade (245 | 7.9%).
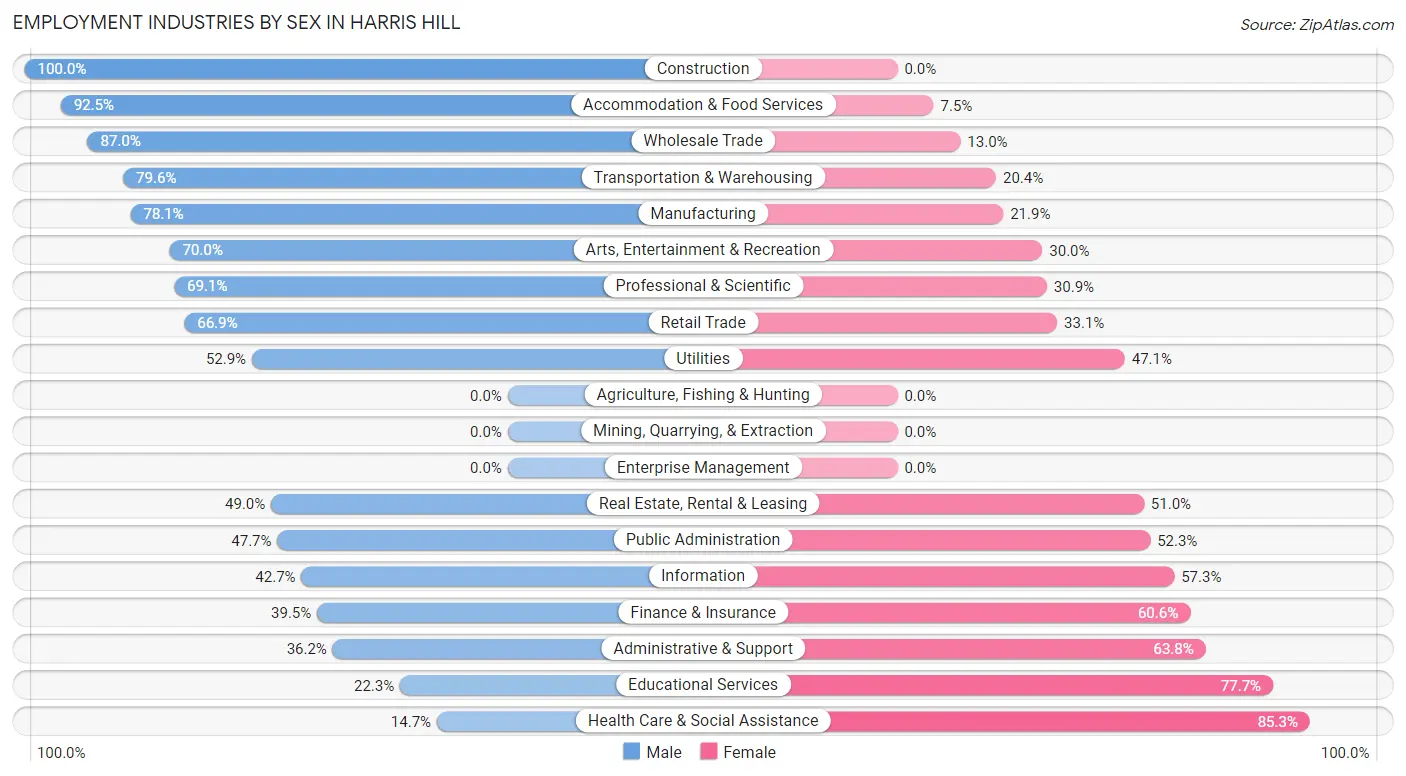
Employment Industries by Sex in Harris Hill
The Harris Hill industries that see more men than women are Construction (100.0%), Accommodation & Food Services (92.5%), and Wholesale Trade (87.0%), whereas the industries that tend to have a higher number of women are Health Care & Social Assistance (85.3%), Educational Services (77.7%), and Administrative & Support (63.8%).
| Industry | Male | Female |
| Agriculture, Fishing & Hunting | 0 (0.0%) | 0 (0.0%) |
| Mining, Quarrying, & Extraction | 0 (0.0%) | 0 (0.0%) |
| Construction | 153 (100.0%) | 0 (0.0%) |
| Manufacturing | 403 (78.1%) | 113 (21.9%) |
| Wholesale Trade | 60 (87.0%) | 9 (13.0%) |
| Retail Trade | 164 (66.9%) | 81 (33.1%) |
| Transportation & Warehousing | 78 (79.6%) | 20 (20.4%) |
| Utilities | 9 (52.9%) | 8 (47.1%) |
| Information | 38 (42.7%) | 51 (57.3%) |
| Finance & Insurance | 86 (39.5%) | 132 (60.6%) |
| Real Estate, Rental & Leasing | 24 (49.0%) | 25 (51.0%) |
| Professional & Scientific | 250 (69.1%) | 112 (30.9%) |
| Enterprise Management | 0 (0.0%) | 0 (0.0%) |
| Administrative & Support | 25 (36.2%) | 44 (63.8%) |
| Educational Services | 105 (22.3%) | 366 (77.7%) |
| Health Care & Social Assistance | 50 (14.7%) | 291 (85.3%) |
| Arts, Entertainment & Recreation | 35 (70.0%) | 15 (30.0%) |
| Accommodation & Food Services | 99 (92.5%) | 8 (7.5%) |
| Public Administration | 72 (47.7%) | 79 (52.3%) |
| Total | 1,696 (55.0%) | 1,388 (45.0%) |
Education in Harris Hill
School Enrollment in Harris Hill
The most common levels of schooling among the 1,094 students in Harris Hill are elementary school (347 | 31.7%), middle school (218 | 19.9%), and high school (184 | 16.8%).
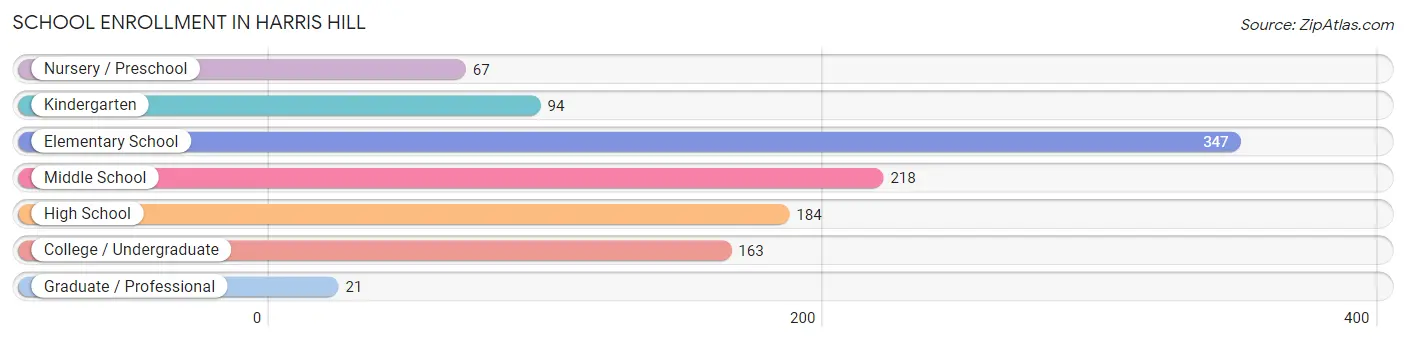
| School Level | # Students | % Students |
| Nursery / Preschool | 67 | 6.1% |
| Kindergarten | 94 | 8.6% |
| Elementary School | 347 | 31.7% |
| Middle School | 218 | 19.9% |
| High School | 184 | 16.8% |
| College / Undergraduate | 163 | 14.9% |
| Graduate / Professional | 21 | 1.9% |
| Total | 1,094 | 100.0% |
School Enrollment by Age by Funding Source in Harris Hill
Out of a total of 1,094 students who are enrolled in schools in Harris Hill, 140 (12.8%) attend a private institution, while the remaining 954 (87.2%) are enrolled in public schools. The age group of 3 to 4 year olds has the highest likelihood of being enrolled in private schools, with 67 (100.0% in the age bracket) enrolled. Conversely, the age group of 15 to 17 year olds has the lowest likelihood of being enrolled in a private school, with 175 (100.0% in the age bracket) attending a public institution.
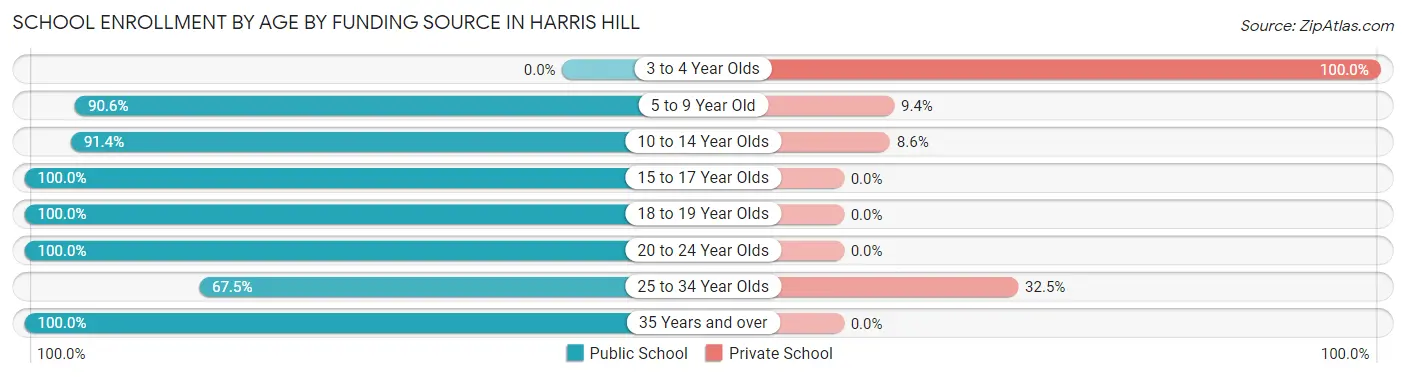
| Age Bracket | Public School | Private School |
| 3 to 4 Year Olds | 0 (0.0%) | 67 (100.0%) |
| 5 to 9 Year Old | 376 (90.6%) | 39 (9.4%) |
| 10 to 14 Year Olds | 223 (91.4%) | 21 (8.6%) |
| 15 to 17 Year Olds | 175 (100.0%) | 0 (0.0%) |
| 18 to 19 Year Olds | 16 (100.0%) | 0 (0.0%) |
| 20 to 24 Year Olds | 88 (100.0%) | 0 (0.0%) |
| 25 to 34 Year Olds | 27 (67.5%) | 13 (32.5%) |
| 35 Years and over | 49 (100.0%) | 0 (0.0%) |
| Total | 954 (87.2%) | 140 (12.8%) |
Educational Attainment by Field of Study in Harris Hill
Business (781 | 32.8%), science & technology (387 | 16.3%), education (262 | 11.0%), engineering (182 | 7.6%), and visual & performing arts (148 | 6.2%) are the most common fields of study among 2,381 individuals in Harris Hill who have obtained a bachelor's degree or higher.
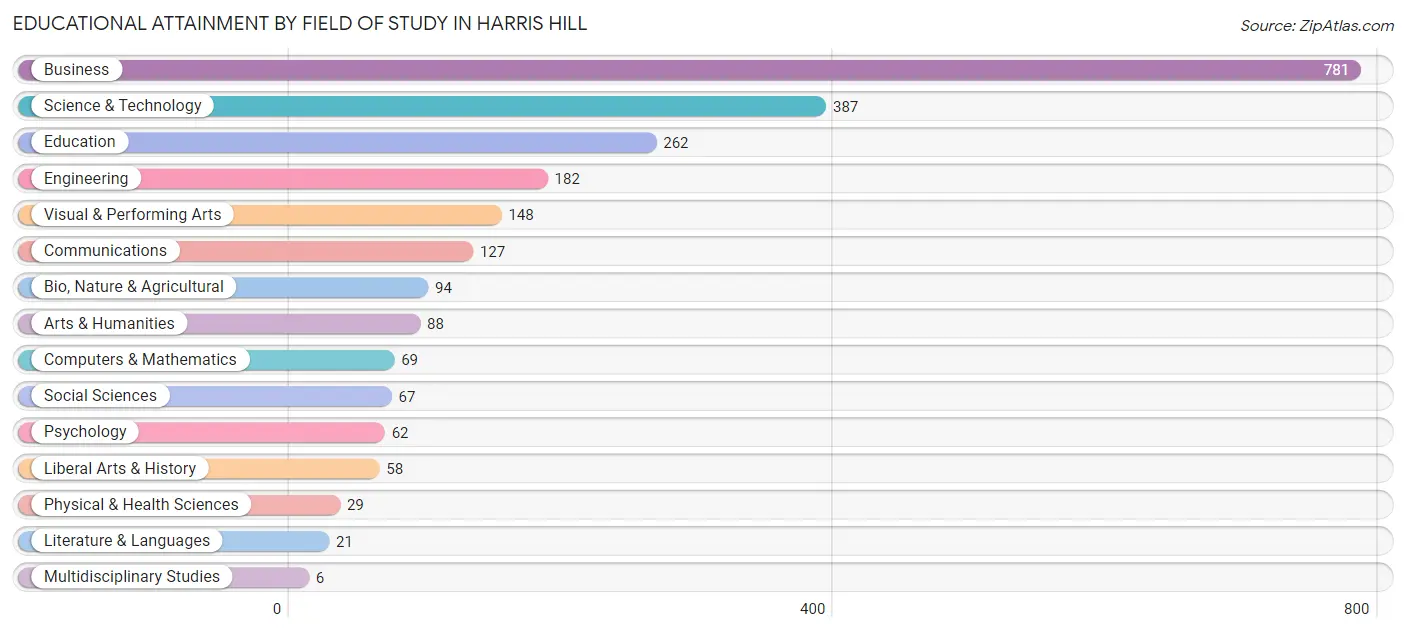
| Field of Study | # Graduates | % Graduates |
| Computers & Mathematics | 69 | 2.9% |
| Bio, Nature & Agricultural | 94 | 4.0% |
| Physical & Health Sciences | 29 | 1.2% |
| Psychology | 62 | 2.6% |
| Social Sciences | 67 | 2.8% |
| Engineering | 182 | 7.6% |
| Multidisciplinary Studies | 6 | 0.3% |
| Science & Technology | 387 | 16.3% |
| Business | 781 | 32.8% |
| Education | 262 | 11.0% |
| Literature & Languages | 21 | 0.9% |
| Liberal Arts & History | 58 | 2.4% |
| Visual & Performing Arts | 148 | 6.2% |
| Communications | 127 | 5.3% |
| Arts & Humanities | 88 | 3.7% |
| Total | 2,381 | 100.0% |
Transportation & Commute in Harris Hill
Vehicle Availability by Sex in Harris Hill
The most prevalent vehicle ownership categories in Harris Hill are males with 2 vehicles (973, accounting for 58.1%) and females with 2 vehicles (620, making up 78.6%).
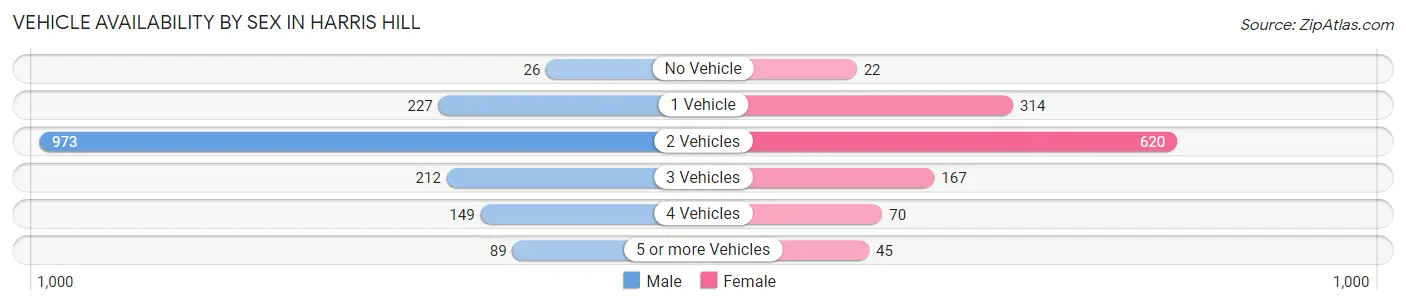
| Vehicles Available | Male | Female |
| No Vehicle | 26 (1.5%) | 22 (1.8%) |
| 1 Vehicle | 227 (13.5%) | 314 (25.4%) |
| 2 Vehicles | 973 (58.1%) | 620 (50.1%) |
| 3 Vehicles | 212 (12.7%) | 167 (13.5%) |
| 4 Vehicles | 149 (8.9%) | 70 (5.7%) |
| 5 or more Vehicles | 89 (5.3%) | 45 (3.6%) |
| Total | 1,676 (100.0%) | 1,238 (100.0%) |
Commute Time in Harris Hill
The most frequently occuring commute durations in Harris Hill are 30 to 34 minutes (433 commuters, 16.9%), 25 to 29 minutes (428 commuters, 16.7%), and 15 to 19 minutes (405 commuters, 15.8%).
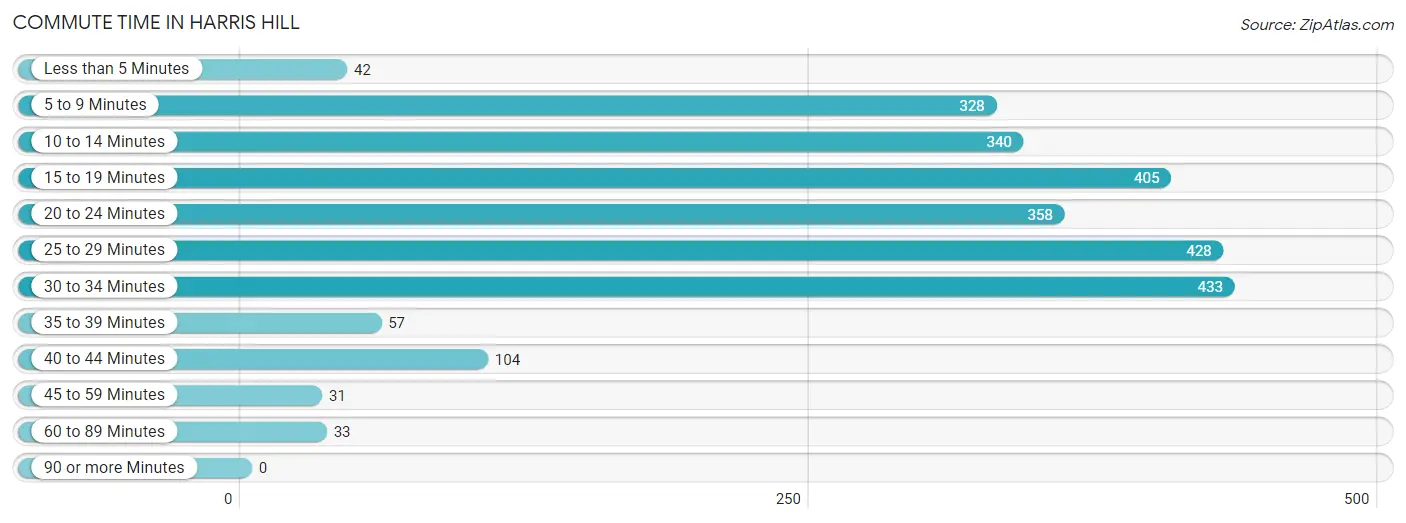
| Commute Time | # Commuters | % Commuters |
| Less than 5 Minutes | 42 | 1.6% |
| 5 to 9 Minutes | 328 | 12.8% |
| 10 to 14 Minutes | 340 | 13.3% |
| 15 to 19 Minutes | 405 | 15.8% |
| 20 to 24 Minutes | 358 | 14.0% |
| 25 to 29 Minutes | 428 | 16.7% |
| 30 to 34 Minutes | 433 | 16.9% |
| 35 to 39 Minutes | 57 | 2.2% |
| 40 to 44 Minutes | 104 | 4.1% |
| 45 to 59 Minutes | 31 | 1.2% |
| 60 to 89 Minutes | 33 | 1.3% |
| 90 or more Minutes | 0 | 0.0% |
Commute Time by Sex in Harris Hill
The most common commute times in Harris Hill are 15 to 19 minutes (255 commuters, 17.6%) for males and 30 to 34 minutes (223 commuters, 20.1%) for females.
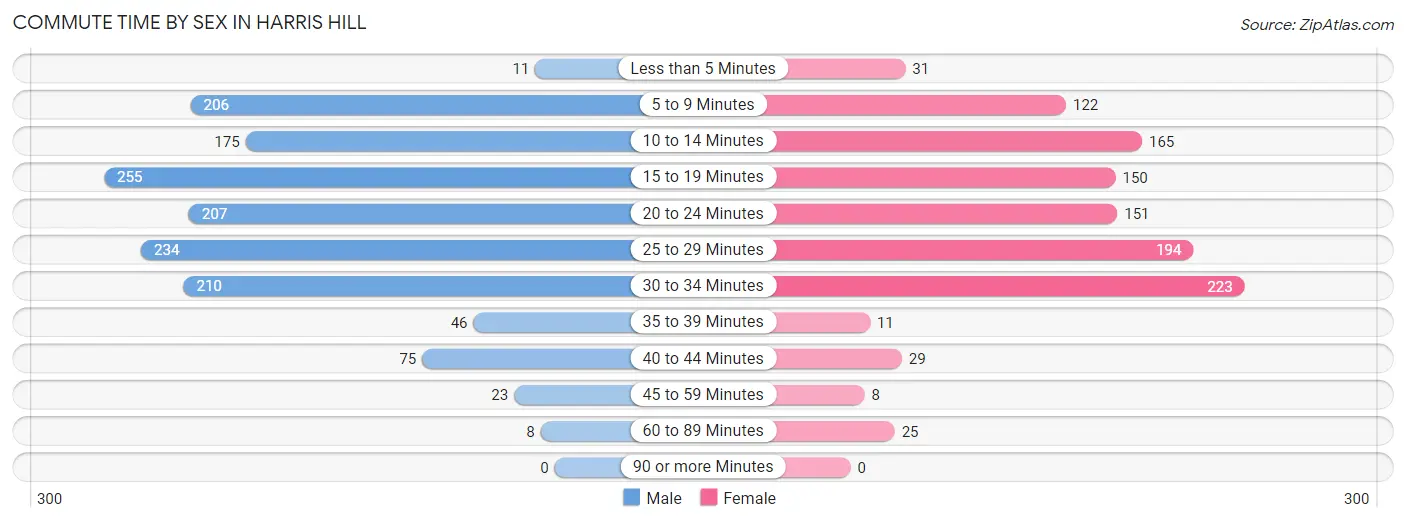
| Commute Time | Male | Female |
| Less than 5 Minutes | 11 (0.8%) | 31 (2.8%) |
| 5 to 9 Minutes | 206 (14.2%) | 122 (11.0%) |
| 10 to 14 Minutes | 175 (12.1%) | 165 (14.9%) |
| 15 to 19 Minutes | 255 (17.6%) | 150 (13.5%) |
| 20 to 24 Minutes | 207 (14.3%) | 151 (13.6%) |
| 25 to 29 Minutes | 234 (16.1%) | 194 (17.5%) |
| 30 to 34 Minutes | 210 (14.5%) | 223 (20.1%) |
| 35 to 39 Minutes | 46 (3.2%) | 11 (1.0%) |
| 40 to 44 Minutes | 75 (5.2%) | 29 (2.6%) |
| 45 to 59 Minutes | 23 (1.6%) | 8 (0.7%) |
| 60 to 89 Minutes | 8 (0.5%) | 25 (2.2%) |
| 90 or more Minutes | 0 (0.0%) | 0 (0.0%) |
Time of Departure to Work by Sex in Harris Hill
The most frequent times of departure to work in Harris Hill are 7:00 AM to 7:29 AM (350, 24.1%) for males and 8:00 AM to 8:29 AM (212, 19.1%) for females.
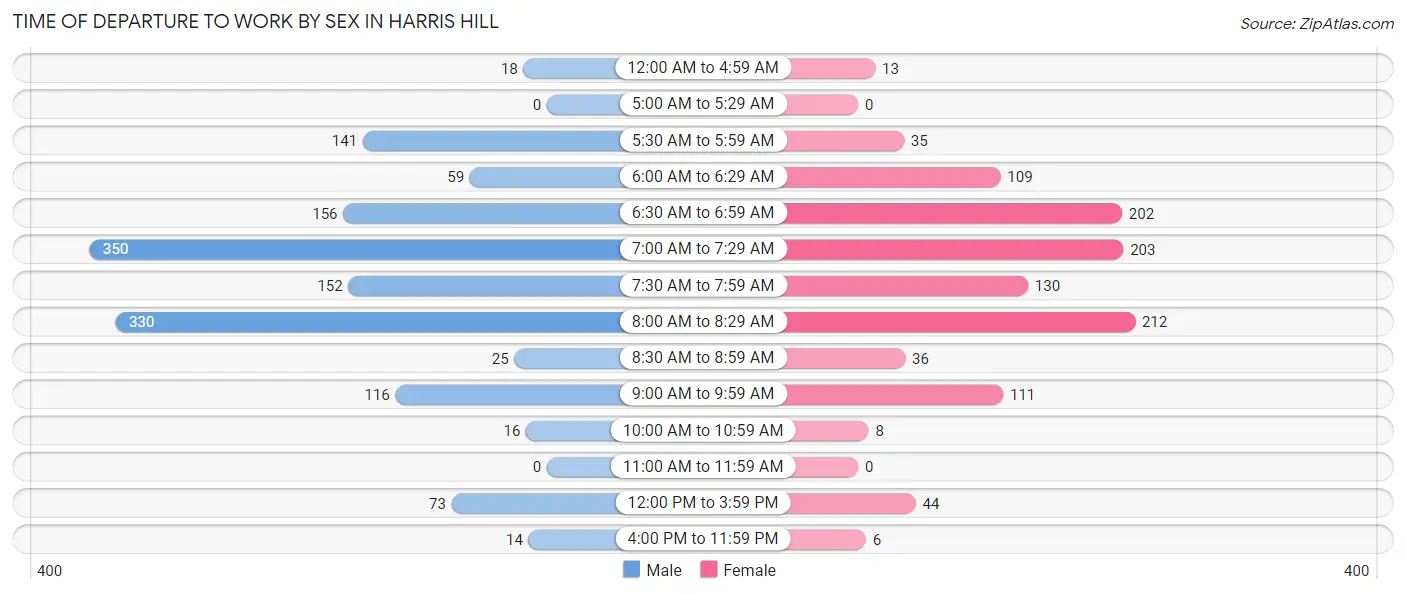
| Time of Departure | Male | Female |
| 12:00 AM to 4:59 AM | 18 (1.2%) | 13 (1.2%) |
| 5:00 AM to 5:29 AM | 0 (0.0%) | 0 (0.0%) |
| 5:30 AM to 5:59 AM | 141 (9.7%) | 35 (3.2%) |
| 6:00 AM to 6:29 AM | 59 (4.1%) | 109 (9.8%) |
| 6:30 AM to 6:59 AM | 156 (10.8%) | 202 (18.2%) |
| 7:00 AM to 7:29 AM | 350 (24.1%) | 203 (18.3%) |
| 7:30 AM to 7:59 AM | 152 (10.5%) | 130 (11.7%) |
| 8:00 AM to 8:29 AM | 330 (22.8%) | 212 (19.1%) |
| 8:30 AM to 8:59 AM | 25 (1.7%) | 36 (3.3%) |
| 9:00 AM to 9:59 AM | 116 (8.0%) | 111 (10.0%) |
| 10:00 AM to 10:59 AM | 16 (1.1%) | 8 (0.7%) |
| 11:00 AM to 11:59 AM | 0 (0.0%) | 0 (0.0%) |
| 12:00 PM to 3:59 PM | 73 (5.0%) | 44 (4.0%) |
| 4:00 PM to 11:59 PM | 14 (1.0%) | 6 (0.5%) |
| Total | 1,450 (100.0%) | 1,109 (100.0%) |
Housing Occupancy in Harris Hill
Occupancy by Ownership in Harris Hill
Of the total 2,558 dwellings in Harris Hill, owner-occupied units account for 1,936 (75.7%), while renter-occupied units make up 622 (24.3%).
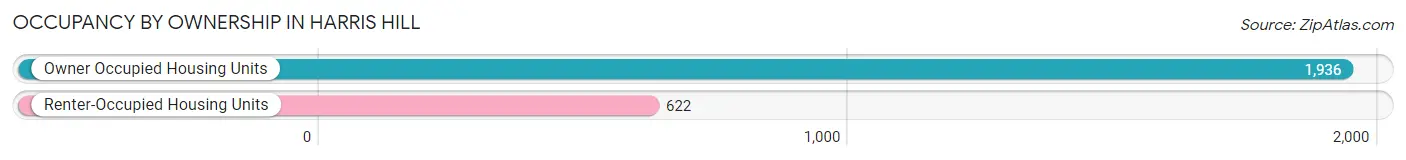
| Occupancy | # Housing Units | % Housing Units |
| Owner Occupied Housing Units | 1,936 | 75.7% |
| Renter-Occupied Housing Units | 622 | 24.3% |
| Total Occupied Housing Units | 2,558 | 100.0% |
Occupancy by Household Size in Harris Hill
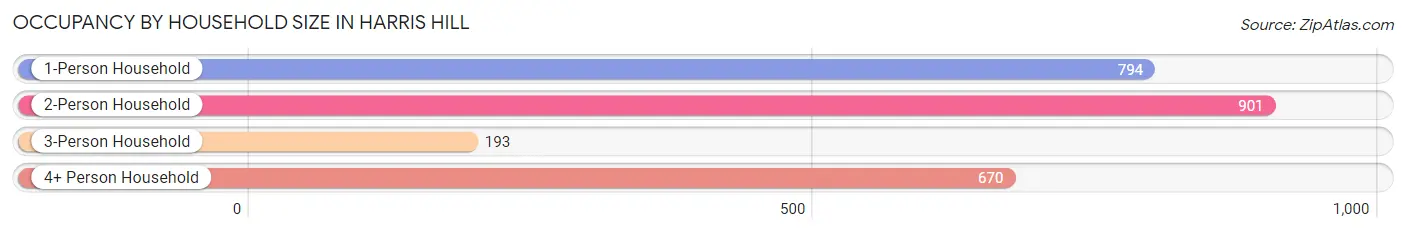
| Household Size | # Housing Units | % Housing Units |
| 1-Person Household | 794 | 31.0% |
| 2-Person Household | 901 | 35.2% |
| 3-Person Household | 193 | 7.5% |
| 4+ Person Household | 670 | 26.2% |
| Total Housing Units | 2,558 | 100.0% |
Occupancy by Ownership by Household Size in Harris Hill
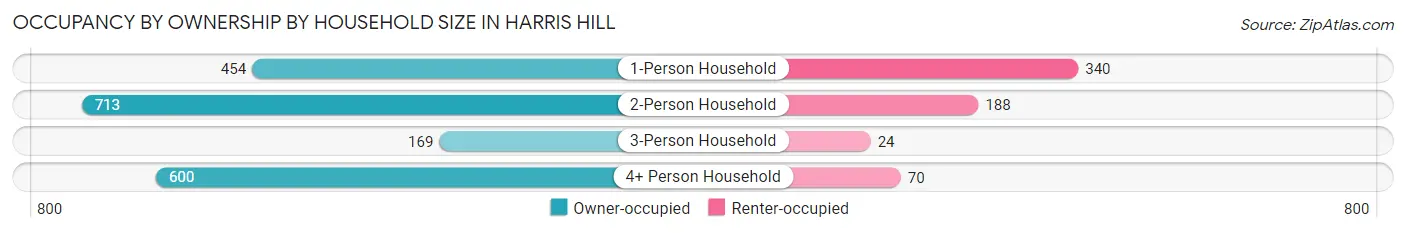
| Household Size | Owner-occupied | Renter-occupied |
| 1-Person Household | 454 (57.2%) | 340 (42.8%) |
| 2-Person Household | 713 (79.1%) | 188 (20.9%) |
| 3-Person Household | 169 (87.6%) | 24 (12.4%) |
| 4+ Person Household | 600 (89.5%) | 70 (10.4%) |
| Total Housing Units | 1,936 (75.7%) | 622 (24.3%) |
Occupancy by Educational Attainment in Harris Hill
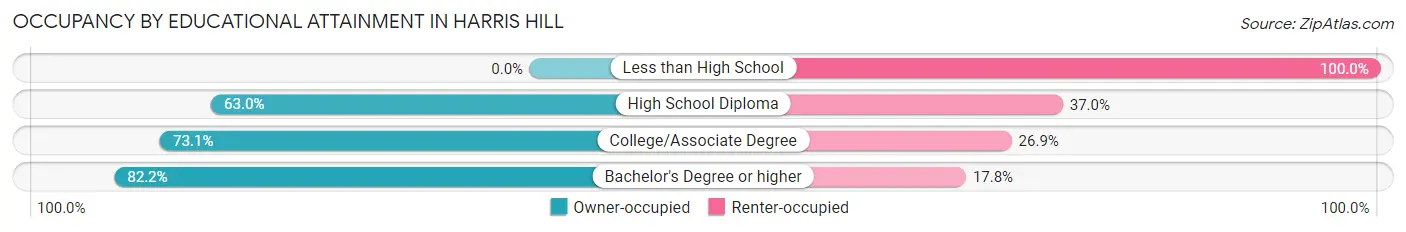
| Household Size | Owner-occupied | Renter-occupied |
| Less than High School | 0 (0.0%) | 11 (100.0%) |
| High School Diploma | 349 (63.0%) | 205 (37.0%) |
| College/Associate Degree | 414 (73.1%) | 152 (26.9%) |
| Bachelor's Degree or higher | 1,173 (82.2%) | 254 (17.8%) |
Occupancy by Age of Householder in Harris Hill
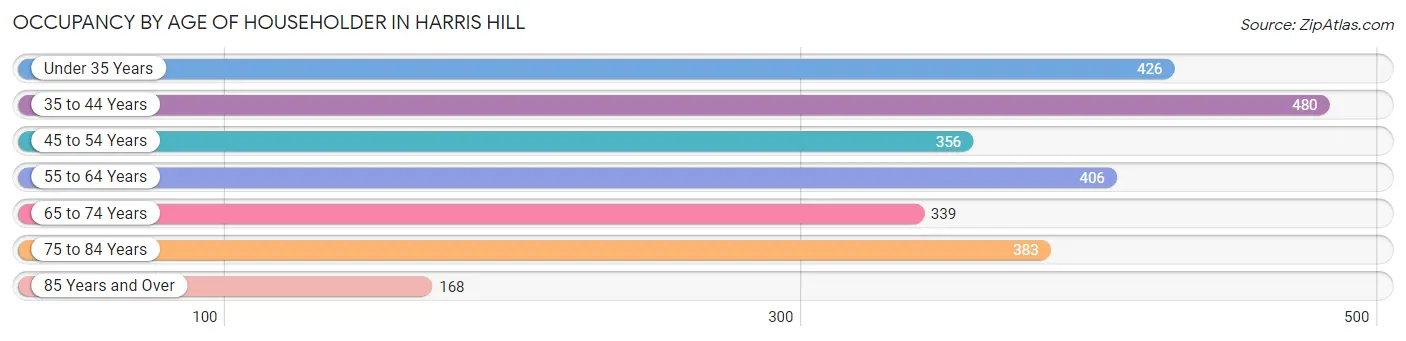
| Age Bracket | # Households | % Households |
| Under 35 Years | 426 | 16.7% |
| 35 to 44 Years | 480 | 18.8% |
| 45 to 54 Years | 356 | 13.9% |
| 55 to 64 Years | 406 | 15.9% |
| 65 to 74 Years | 339 | 13.3% |
| 75 to 84 Years | 383 | 15.0% |
| 85 Years and Over | 168 | 6.6% |
| Total | 2,558 | 100.0% |
Housing Finances in Harris Hill
Median Income by Occupancy in Harris Hill
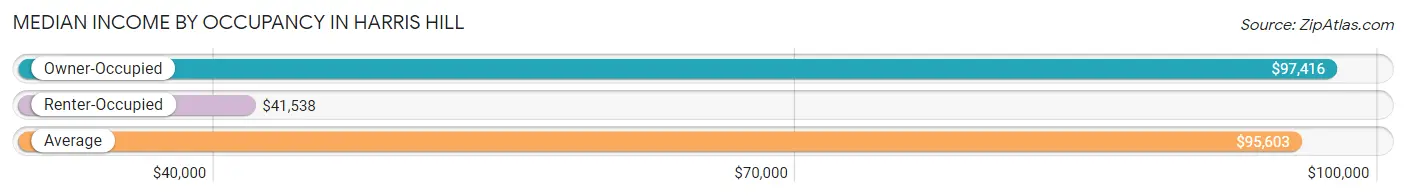
| Occupancy Type | # Households | Median Income |
| Owner-Occupied | 1,936 (75.7%) | $97,416 |
| Renter-Occupied | 622 (24.3%) | $41,538 |
| Average | 2,558 (100.0%) | $95,603 |
Occupancy by Householder Income Bracket in Harris Hill
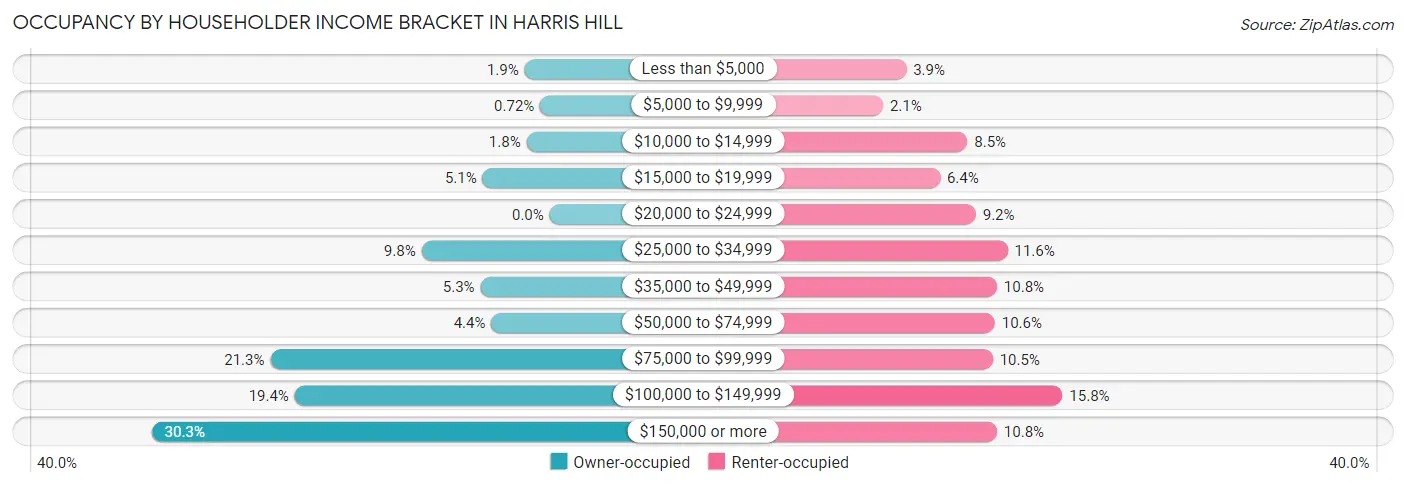
| Income Bracket | Owner-occupied | Renter-occupied |
| Less than $5,000 | 37 (1.9%) | 24 (3.9%) |
| $5,000 to $9,999 | 14 (0.7%) | 13 (2.1%) |
| $10,000 to $14,999 | 34 (1.8%) | 53 (8.5%) |
| $15,000 to $19,999 | 99 (5.1%) | 40 (6.4%) |
| $20,000 to $24,999 | 0 (0.0%) | 57 (9.2%) |
| $25,000 to $34,999 | 189 (9.8%) | 72 (11.6%) |
| $35,000 to $49,999 | 102 (5.3%) | 67 (10.8%) |
| $50,000 to $74,999 | 86 (4.4%) | 66 (10.6%) |
| $75,000 to $99,999 | 412 (21.3%) | 65 (10.4%) |
| $100,000 to $149,999 | 376 (19.4%) | 98 (15.8%) |
| $150,000 or more | 587 (30.3%) | 67 (10.8%) |
| Total | 1,936 (100.0%) | 622 (100.0%) |
Monthly Housing Cost Tiers in Harris Hill
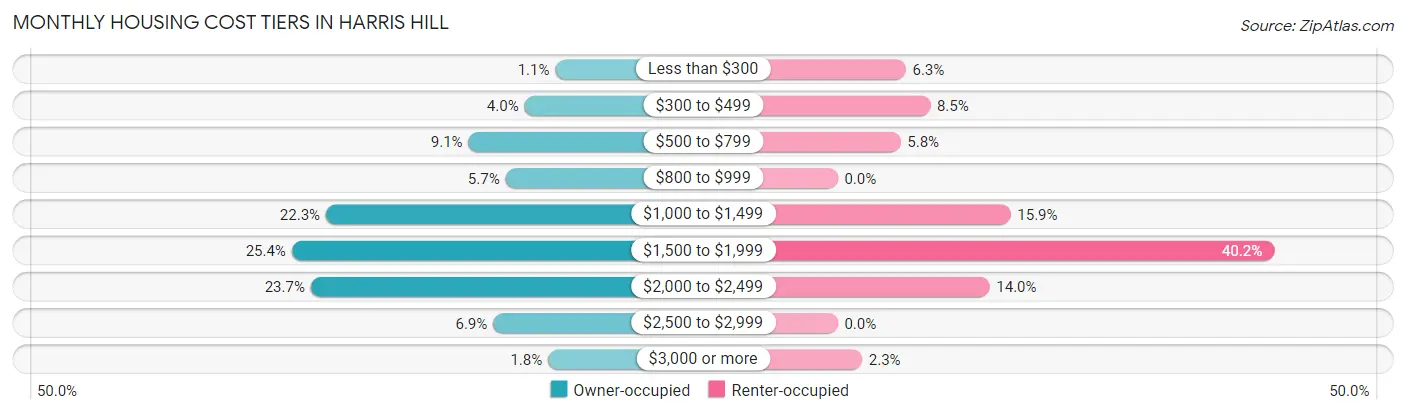
| Monthly Cost | Owner-occupied | Renter-occupied |
| Less than $300 | 22 (1.1%) | 39 (6.3%) |
| $300 to $499 | 77 (4.0%) | 53 (8.5%) |
| $500 to $799 | 177 (9.1%) | 36 (5.8%) |
| $800 to $999 | 111 (5.7%) | 0 (0.0%) |
| $1,000 to $1,499 | 431 (22.3%) | 99 (15.9%) |
| $1,500 to $1,999 | 492 (25.4%) | 250 (40.2%) |
| $2,000 to $2,499 | 458 (23.7%) | 87 (14.0%) |
| $2,500 to $2,999 | 133 (6.9%) | 0 (0.0%) |
| $3,000 or more | 35 (1.8%) | 14 (2.2%) |
| Total | 1,936 (100.0%) | 622 (100.0%) |
Physical Housing Characteristics in Harris Hill
Housing Structures in Harris Hill
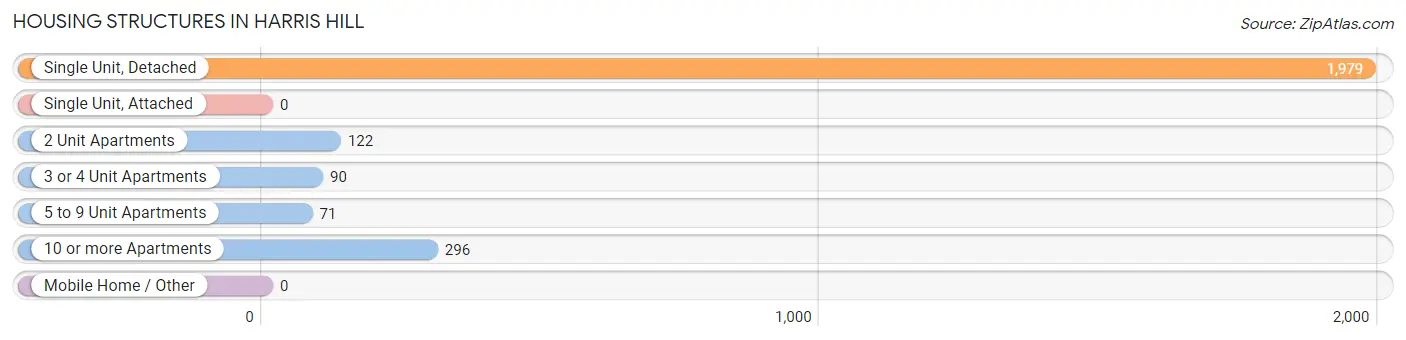
| Structure Type | # Housing Units | % Housing Units |
| Single Unit, Detached | 1,979 | 77.4% |
| Single Unit, Attached | 0 | 0.0% |
| 2 Unit Apartments | 122 | 4.8% |
| 3 or 4 Unit Apartments | 90 | 3.5% |
| 5 to 9 Unit Apartments | 71 | 2.8% |
| 10 or more Apartments | 296 | 11.6% |
| Mobile Home / Other | 0 | 0.0% |
| Total | 2,558 | 100.0% |
Housing Structures by Occupancy in Harris Hill
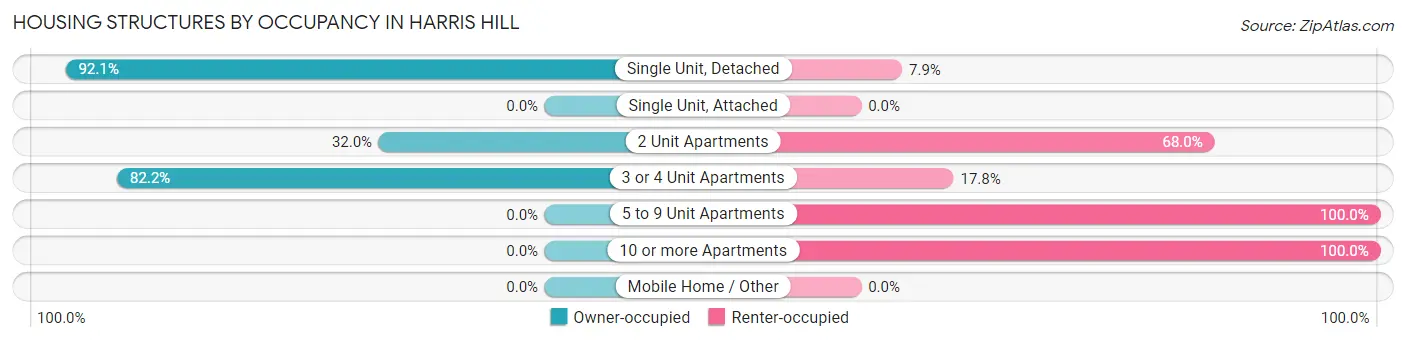
| Structure Type | Owner-occupied | Renter-occupied |
| Single Unit, Detached | 1,823 (92.1%) | 156 (7.9%) |
| Single Unit, Attached | 0 (0.0%) | 0 (0.0%) |
| 2 Unit Apartments | 39 (32.0%) | 83 (68.0%) |
| 3 or 4 Unit Apartments | 74 (82.2%) | 16 (17.8%) |
| 5 to 9 Unit Apartments | 0 (0.0%) | 71 (100.0%) |
| 10 or more Apartments | 0 (0.0%) | 296 (100.0%) |
| Mobile Home / Other | 0 (0.0%) | 0 (0.0%) |
| Total | 1,936 (75.7%) | 622 (24.3%) |
Housing Structures by Number of Rooms in Harris Hill
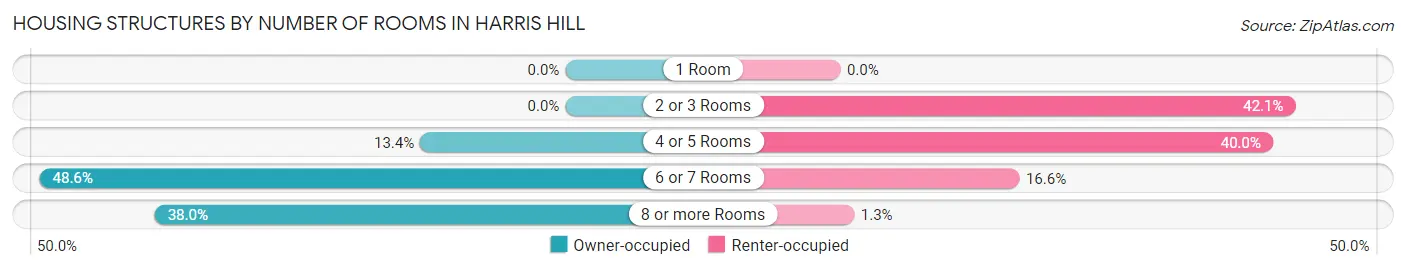
| Number of Rooms | Owner-occupied | Renter-occupied |
| 1 Room | 0 (0.0%) | 0 (0.0%) |
| 2 or 3 Rooms | 0 (0.0%) | 262 (42.1%) |
| 4 or 5 Rooms | 260 (13.4%) | 249 (40.0%) |
| 6 or 7 Rooms | 941 (48.6%) | 103 (16.6%) |
| 8 or more Rooms | 735 (38.0%) | 8 (1.3%) |
| Total | 1,936 (100.0%) | 622 (100.0%) |
Housing Structure by Heating Type in Harris Hill
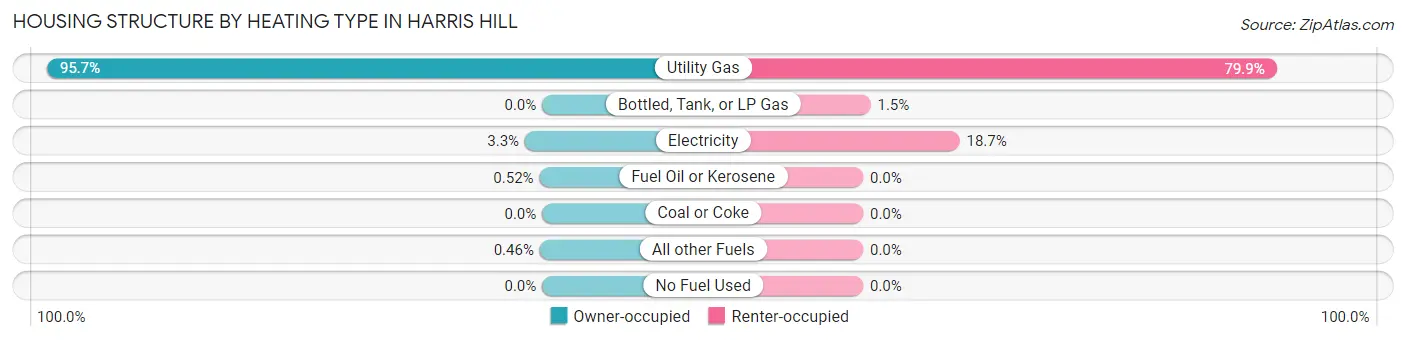
| Heating Type | Owner-occupied | Renter-occupied |
| Utility Gas | 1,853 (95.7%) | 497 (79.9%) |
| Bottled, Tank, or LP Gas | 0 (0.0%) | 9 (1.5%) |
| Electricity | 64 (3.3%) | 116 (18.6%) |
| Fuel Oil or Kerosene | 10 (0.5%) | 0 (0.0%) |
| Coal or Coke | 0 (0.0%) | 0 (0.0%) |
| All other Fuels | 9 (0.5%) | 0 (0.0%) |
| No Fuel Used | 0 (0.0%) | 0 (0.0%) |
| Total | 1,936 (100.0%) | 622 (100.0%) |
Household Vehicle Usage in Harris Hill
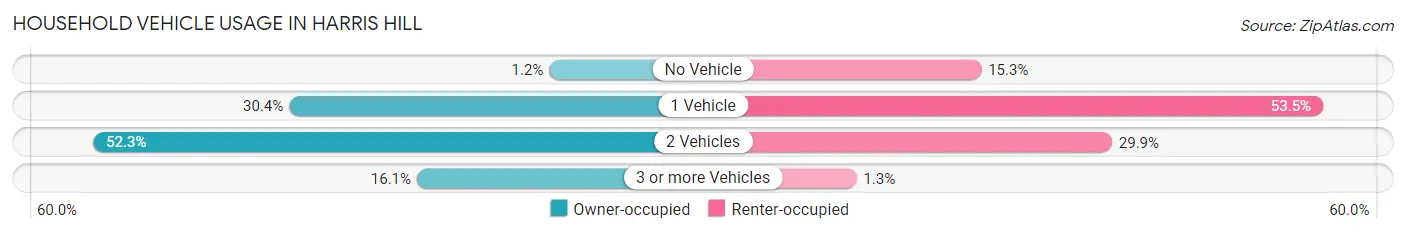
| Vehicles per Household | Owner-occupied | Renter-occupied |
| No Vehicle | 24 (1.2%) | 95 (15.3%) |
| 1 Vehicle | 588 (30.4%) | 333 (53.5%) |
| 2 Vehicles | 1,013 (52.3%) | 186 (29.9%) |
| 3 or more Vehicles | 311 (16.1%) | 8 (1.3%) |
| Total | 1,936 (100.0%) | 622 (100.0%) |
Real Estate & Mortgages in Harris Hill
Real Estate and Mortgage Overview in Harris Hill
| Characteristic | Without Mortgage | With Mortgage |
| Housing Units | 554 | 1,382 |
| Median Property Value | $252,200 | $285,400 |
| Median Household Income | $78,844 | $490 |
| Monthly Housing Costs | $818 | $35 |
| Real Estate Taxes | $6,240 | $0 |
Property Value by Mortgage Status in Harris Hill
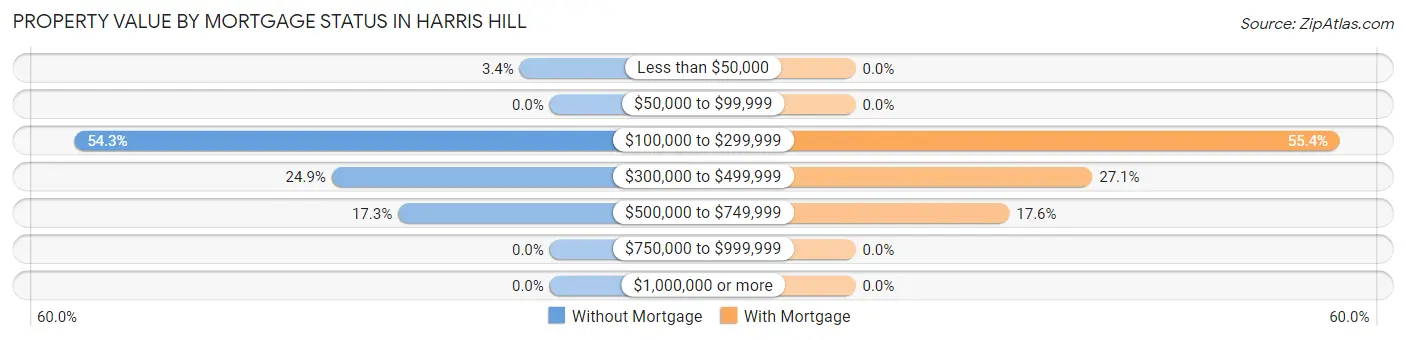
| Property Value | Without Mortgage | With Mortgage |
| Less than $50,000 | 19 (3.4%) | 0 (0.0%) |
| $50,000 to $99,999 | 0 (0.0%) | 0 (0.0%) |
| $100,000 to $299,999 | 301 (54.3%) | 765 (55.3%) |
| $300,000 to $499,999 | 138 (24.9%) | 374 (27.1%) |
| $500,000 to $749,999 | 96 (17.3%) | 243 (17.6%) |
| $750,000 to $999,999 | 0 (0.0%) | 0 (0.0%) |
| $1,000,000 or more | 0 (0.0%) | 0 (0.0%) |
| Total | 554 (100.0%) | 1,382 (100.0%) |
Household Income by Mortgage Status in Harris Hill
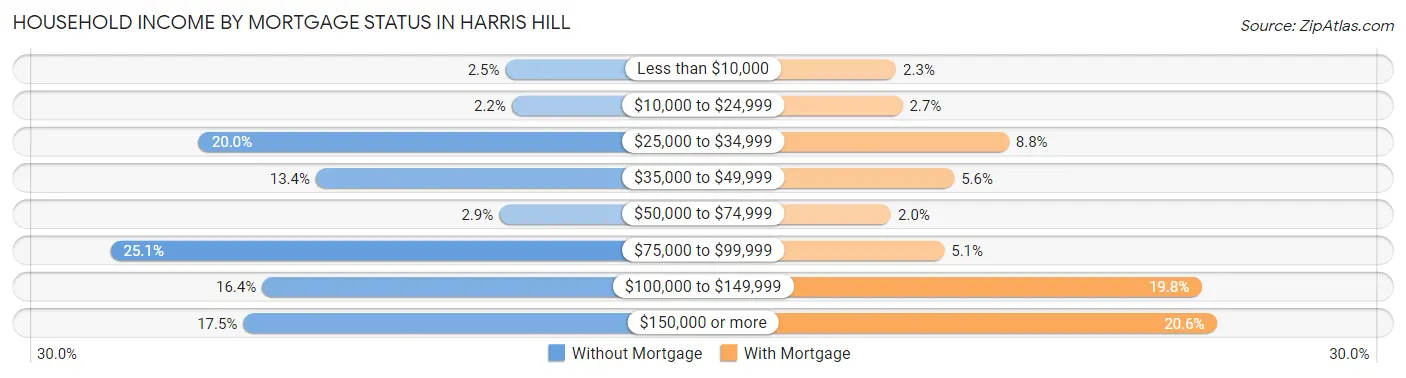
| Household Income | Without Mortgage | With Mortgage |
| Less than $10,000 | 14 (2.5%) | 32 (2.3%) |
| $10,000 to $24,999 | 12 (2.2%) | 37 (2.7%) |
| $25,000 to $34,999 | 111 (20.0%) | 121 (8.8%) |
| $35,000 to $49,999 | 74 (13.4%) | 78 (5.6%) |
| $50,000 to $74,999 | 16 (2.9%) | 28 (2.0%) |
| $75,000 to $99,999 | 139 (25.1%) | 70 (5.1%) |
| $100,000 to $149,999 | 91 (16.4%) | 273 (19.8%) |
| $150,000 or more | 97 (17.5%) | 285 (20.6%) |
| Total | 554 (100.0%) | 1,382 (100.0%) |
Property Value to Household Income Ratio in Harris Hill
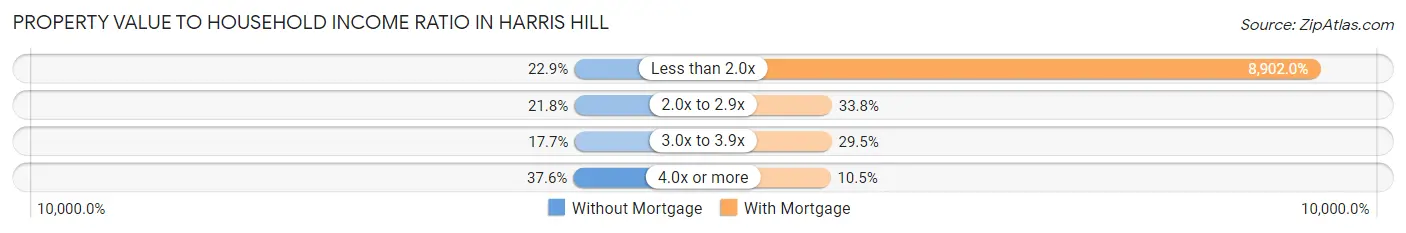
| Value-to-Income Ratio | Without Mortgage | With Mortgage |
| Less than 2.0x | 127 (22.9%) | 123,026 (8,902.0%) |
| 2.0x to 2.9x | 121 (21.8%) | 467 (33.8%) |
| 3.0x to 3.9x | 98 (17.7%) | 407 (29.4%) |
| 4.0x or more | 208 (37.6%) | 145 (10.5%) |
| Total | 554 (100.0%) | 1,382 (100.0%) |
Real Estate Taxes by Mortgage Status in Harris Hill
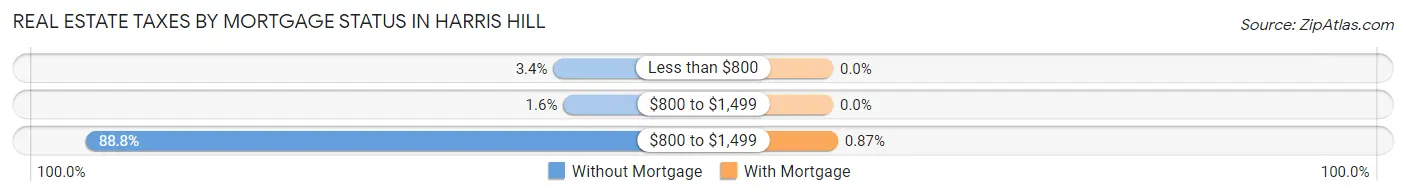
| Property Taxes | Without Mortgage | With Mortgage |
| Less than $800 | 19 (3.4%) | 0 (0.0%) |
| $800 to $1,499 | 9 (1.6%) | 0 (0.0%) |
| $800 to $1,499 | 492 (88.8%) | 12 (0.9%) |
| Total | 554 (100.0%) | 1,382 (100.0%) |
Health & Disability in Harris Hill
Health Insurance Coverage by Age in Harris Hill
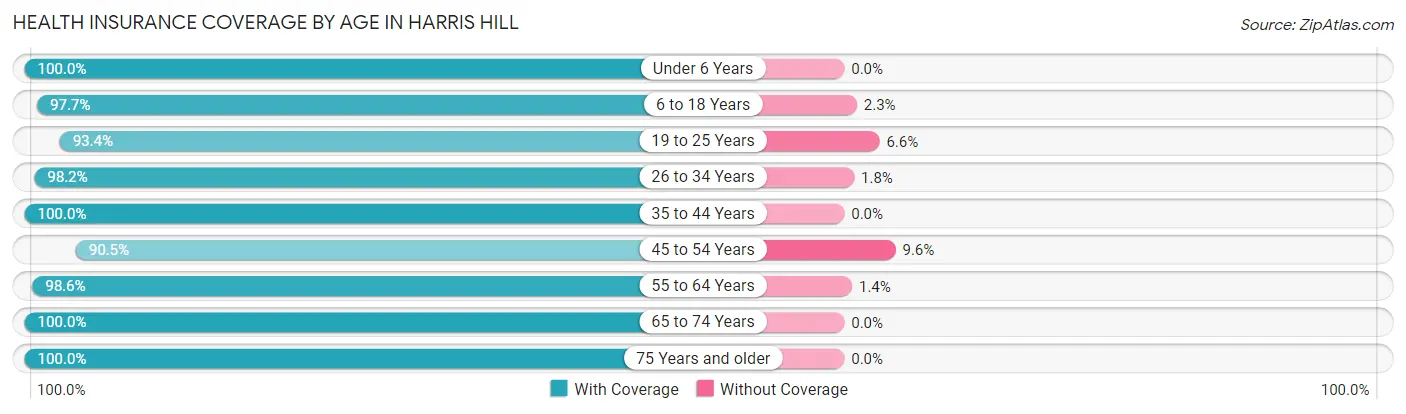
| Age Bracket | With Coverage | Without Coverage |
| Under 6 Years | 780 (100.0%) | 0 (0.0%) |
| 6 to 18 Years | 752 (97.7%) | 18 (2.3%) |
| 19 to 25 Years | 285 (93.4%) | 20 (6.6%) |
| 26 to 34 Years | 803 (98.2%) | 15 (1.8%) |
| 35 to 44 Years | 865 (100.0%) | 0 (0.0%) |
| 45 to 54 Years | 597 (90.4%) | 63 (9.6%) |
| 55 to 64 Years | 686 (98.6%) | 10 (1.4%) |
| 65 to 74 Years | 508 (100.0%) | 0 (0.0%) |
| 75 Years and older | 705 (100.0%) | 0 (0.0%) |
| Total | 5,981 (97.9%) | 126 (2.1%) |
Health Insurance Coverage by Citizenship Status in Harris Hill
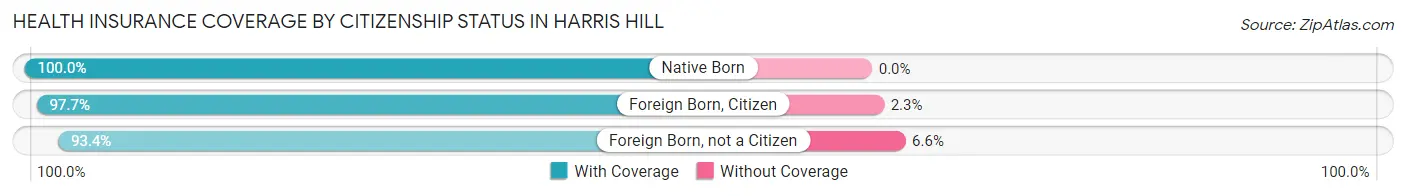
| Citizenship Status | With Coverage | Without Coverage |
| Native Born | 780 (100.0%) | 0 (0.0%) |
| Foreign Born, Citizen | 752 (97.7%) | 18 (2.3%) |
| Foreign Born, not a Citizen | 285 (93.4%) | 20 (6.6%) |
Health Insurance Coverage by Household Income in Harris Hill
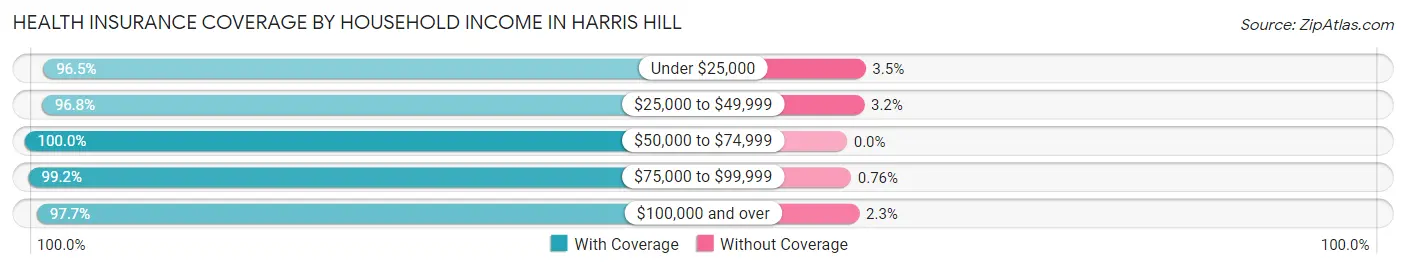
| Household Income | With Coverage | Without Coverage |
| Under $25,000 | 609 (96.5%) | 22 (3.5%) |
| $25,000 to $49,999 | 539 (96.8%) | 18 (3.2%) |
| $50,000 to $74,999 | 280 (100.0%) | 0 (0.0%) |
| $75,000 to $99,999 | 1,305 (99.2%) | 10 (0.8%) |
| $100,000 and over | 3,233 (97.7%) | 76 (2.3%) |
Public vs Private Health Insurance Coverage by Age in Harris Hill
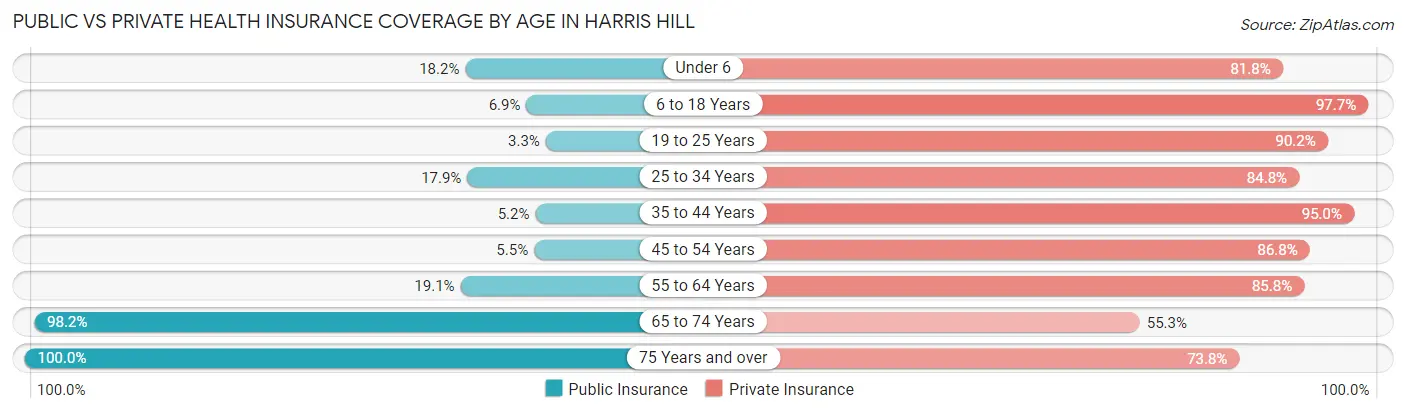
| Age Bracket | Public Insurance | Private Insurance |
| Under 6 | 142 (18.2%) | 638 (81.8%) |
| 6 to 18 Years | 53 (6.9%) | 752 (97.7%) |
| 19 to 25 Years | 10 (3.3%) | 275 (90.2%) |
| 25 to 34 Years | 146 (17.8%) | 694 (84.8%) |
| 35 to 44 Years | 45 (5.2%) | 822 (95.0%) |
| 45 to 54 Years | 36 (5.4%) | 573 (86.8%) |
| 55 to 64 Years | 133 (19.1%) | 597 (85.8%) |
| 65 to 74 Years | 499 (98.2%) | 281 (55.3%) |
| 75 Years and over | 705 (100.0%) | 520 (73.8%) |
| Total | 1,769 (29.0%) | 5,152 (84.4%) |
Disability Status by Sex by Age in Harris Hill
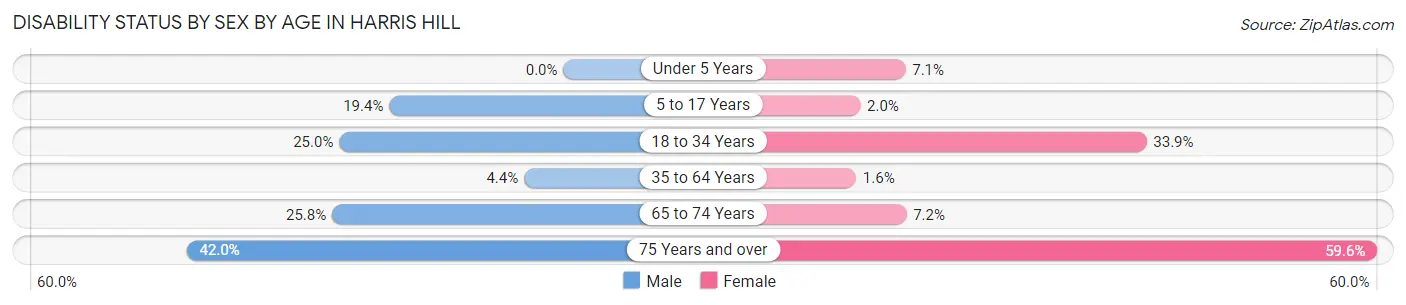
| Age Bracket | Male | Female |
| Under 5 Years | 0 (0.0%) | 20 (7.1%) |
| 5 to 17 Years | 76 (19.4%) | 9 (2.0%) |
| 18 to 34 Years | 157 (25.0%) | 173 (33.9%) |
| 35 to 64 Years | 50 (4.4%) | 17 (1.6%) |
| 65 to 74 Years | 59 (25.8%) | 20 (7.2%) |
| 75 Years and over | 115 (42.0%) | 257 (59.6%) |
Disability Class by Sex by Age in Harris Hill
Disability Class: Hearing Difficulty
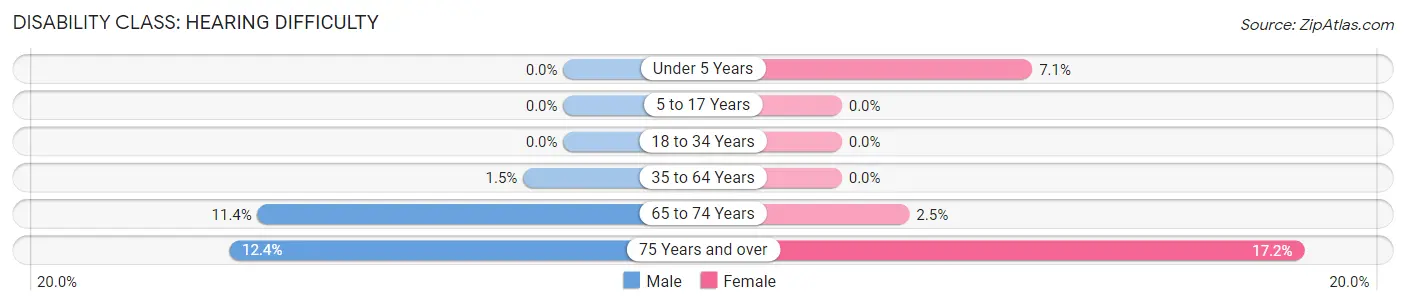
| Age Bracket | Male | Female |
| Under 5 Years | 0 (0.0%) | 20 (7.1%) |
| 5 to 17 Years | 0 (0.0%) | 0 (0.0%) |
| 18 to 34 Years | 0 (0.0%) | 0 (0.0%) |
| 35 to 64 Years | 17 (1.5%) | 0 (0.0%) |
| 65 to 74 Years | 26 (11.4%) | 7 (2.5%) |
| 75 Years and over | 34 (12.4%) | 74 (17.2%) |
Disability Class: Vision Difficulty
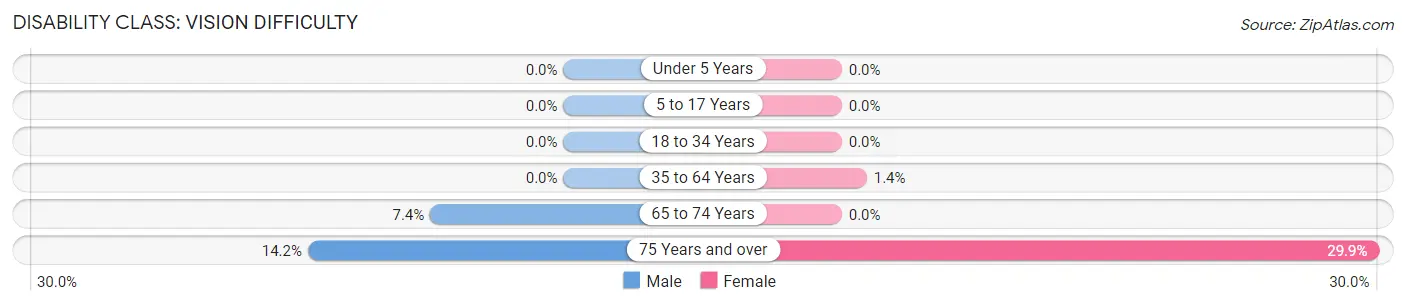
| Age Bracket | Male | Female |
| Under 5 Years | 0 (0.0%) | 0 (0.0%) |
| 5 to 17 Years | 0 (0.0%) | 0 (0.0%) |
| 18 to 34 Years | 0 (0.0%) | 0 (0.0%) |
| 35 to 64 Years | 0 (0.0%) | 15 (1.4%) |
| 65 to 74 Years | 17 (7.4%) | 0 (0.0%) |
| 75 Years and over | 39 (14.2%) | 129 (29.9%) |
Disability Class: Cognitive Difficulty
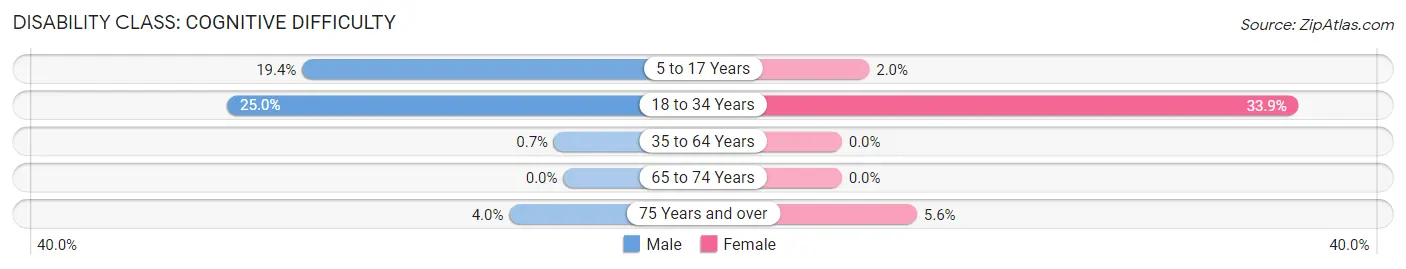
| Age Bracket | Male | Female |
| 5 to 17 Years | 76 (19.4%) | 9 (2.0%) |
| 18 to 34 Years | 157 (25.0%) | 173 (33.9%) |
| 35 to 64 Years | 8 (0.7%) | 0 (0.0%) |
| 65 to 74 Years | 0 (0.0%) | 0 (0.0%) |
| 75 Years and over | 11 (4.0%) | 24 (5.6%) |
Disability Class: Ambulatory Difficulty
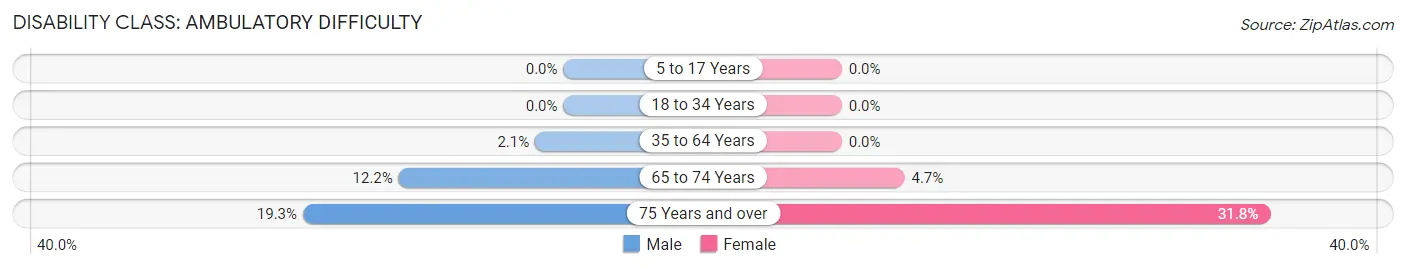
| Age Bracket | Male | Female |
| 5 to 17 Years | 0 (0.0%) | 0 (0.0%) |
| 18 to 34 Years | 0 (0.0%) | 0 (0.0%) |
| 35 to 64 Years | 24 (2.1%) | 0 (0.0%) |
| 65 to 74 Years | 28 (12.2%) | 13 (4.7%) |
| 75 Years and over | 53 (19.3%) | 137 (31.8%) |
Disability Class: Self-Care Difficulty
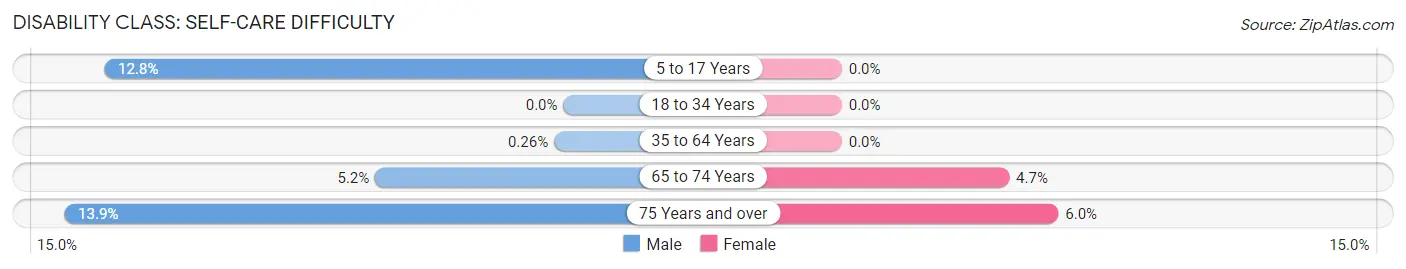
| Age Bracket | Male | Female |
| 5 to 17 Years | 50 (12.8%) | 0 (0.0%) |
| 18 to 34 Years | 0 (0.0%) | 0 (0.0%) |
| 35 to 64 Years | 3 (0.3%) | 0 (0.0%) |
| 65 to 74 Years | 12 (5.2%) | 13 (4.7%) |
| 75 Years and over | 38 (13.9%) | 26 (6.0%) |
Technology Access in Harris Hill
Computing Device Access in Harris Hill
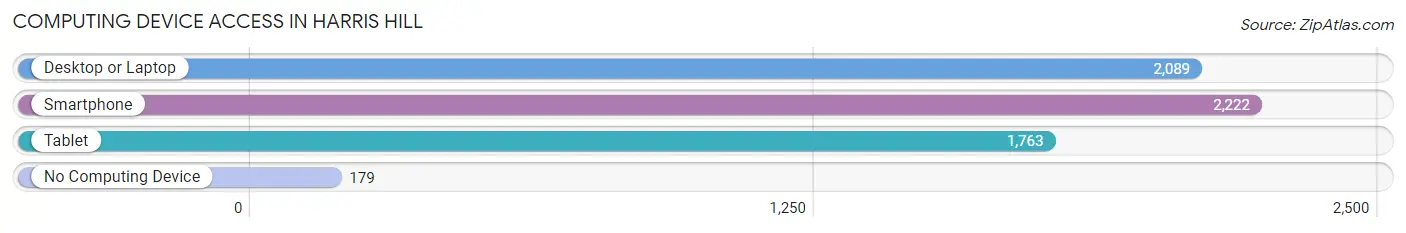
| Device Type | # Households | % Households |
| Desktop or Laptop | 2,089 | 81.7% |
| Smartphone | 2,222 | 86.9% |
| Tablet | 1,763 | 68.9% |
| No Computing Device | 179 | 7.0% |
| Total | 2,558 | 100.0% |
Internet Access in Harris Hill
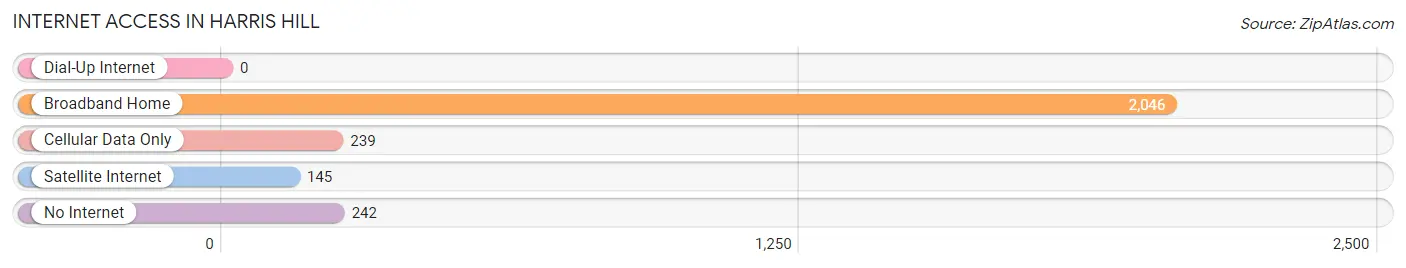
| Internet Type | # Households | % Households |
| Dial-Up Internet | 0 | 0.0% |
| Broadband Home | 2,046 | 80.0% |
| Cellular Data Only | 239 | 9.3% |
| Satellite Internet | 145 | 5.7% |
| No Internet | 242 | 9.5% |
| Total | 2,558 | 100.0% |
Harris Hill Summary
Hill, NY is a small town located in the Catskill Mountains of New York State. It is situated in the town of Hunter, Greene County, and is part of the Catskill Park. The town was founded in 1790 and has a population of approximately 1,000 people.
History
The town of Hill, NY was founded in 1790 by a group of settlers from Connecticut. The settlers were looking for a place to settle and start a new life. They chose the area because of its natural beauty and the abundance of resources. The settlers built a small village and named it Hill, after the hill that overlooked the village.
The town grew slowly over the years, but it was not until the late 19th century that it began to experience significant growth. This was due to the development of the railroad, which allowed for easier access to the town. The railroad also brought in new businesses and industries, which helped to spur the growth of the town.
In the early 20th century, the town experienced a period of decline. This was due to the decline of the railroad and the lack of economic opportunities. However, in the late 20th century, the town experienced a resurgence. This was due to the development of tourism and the growth of the local economy.
Geography
Hill, NY is located in the Catskill Mountains of New York State. It is situated in the town of Hunter, Greene County, and is part of the Catskill Park. The town is located at an elevation of 1,000 feet and is surrounded by mountains and forests. The town is located near the Hudson River and is close to the cities of Albany and New York City.
The town is home to several parks and recreational areas, including the Hunter Mountain Ski Resort, the Hunter Mountain State Park, and the Hunter Mountain Wildlife Management Area. The town is also home to several lakes, including Lake George, Lake Champlain, and Lake Ontario.
Economy
The economy of Hill, NY is largely based on tourism and the service industry. The town is home to several resorts and hotels, as well as restaurants and other businesses that cater to tourists. The town is also home to several small businesses, including retail stores, art galleries, and antique shops.
The town is also home to several manufacturing companies, including a paper mill and a furniture factory. The town is also home to several farms, which produce a variety of crops, including apples, corn, and hay.
Demographics
As of the 2010 census, the population of Hill, NY was 1,000 people. The town is predominantly white, with a small percentage of African Americans, Hispanics, and Native Americans. The median household income in the town is $45,000, and the median home value is $150,000. The town has a low unemployment rate and a high rate of homeownership.
Conclusion
Hill, NY is a small town located in the Catskill Mountains of New York State. It was founded in 1790 and has a population of approximately 1,000 people. The town is largely based on tourism and the service industry, and is home to several resorts and hotels, as well as restaurants and other businesses that cater to tourists. The town is also home to several small businesses, including retail stores, art galleries, and antique shops. The town is predominantly white, with a small percentage of African Americans, Hispanics, and Native Americans. The median household income in the town is $45,000, and the median home value is $150,000. The town has a low unemployment rate and a high rate of homeownership.
Common Questions
What is Per Capita Income in Harris Hill?
Per Capita income in Harris Hill is $45,217.
What is the Median Family Income in Harris Hill?
Median Family Income in Harris Hill is $118,984.
What is the Median Household income in Harris Hill?
Median Household Income in Harris Hill is $95,603.
What is Income or Wage Gap in Harris Hill?
Income or Wage Gap in Harris Hill is 36.6%.
Women in Harris Hill earn 63.4 cents for every dollar earned by a man.
What is Family Income Deficit in Harris Hill?
Family Income Deficit in Harris Hill is $4,305.
Families that are below poverty line in Harris Hill earn $4,305 less on average than the poverty threshold level.
What is Inequality or Gini Index in Harris Hill?
Inequality or Gini Index in Harris Hill is 0.41.
What is the Total Population of Harris Hill?
Total Population of Harris Hill is 6,107.
What is the Total Male Population of Harris Hill?
Total Male Population of Harris Hill is 3,082.
What is the Total Female Population of Harris Hill?
Total Female Population of Harris Hill is 3,025.
What is the Ratio of Males per 100 Females in Harris Hill?
There are 101.88 Males per 100 Females in Harris Hill.
What is the Ratio of Females per 100 Males in Harris Hill?
There are 98.15 Females per 100 Males in Harris Hill.
What is the Median Population Age in Harris Hill?
Median Population Age in Harris Hill is 38.1 Years.
What is the Average Family Size in Harris Hill
Average Family Size in Harris Hill is 3.0 People.
What is the Average Household Size in Harris Hill
Average Household Size in Harris Hill is 2.4 People.
How Large is the Labor Force in Harris Hill?
There are 3,125 People in the Labor Forcein in Harris Hill.
What is the Percentage of People in the Labor Force in Harris Hill?
66.9% of People are in the Labor Force in Harris Hill.
What is the Unemployment Rate in Harris Hill?
Unemployment Rate in Harris Hill is 1.3%.