Cities with the Highest Percentage of Cape Verdean Population in Massachusetts
RELATED REPORTS & OPTIONS
Cape Verdean
Massachusetts
Compare Cities
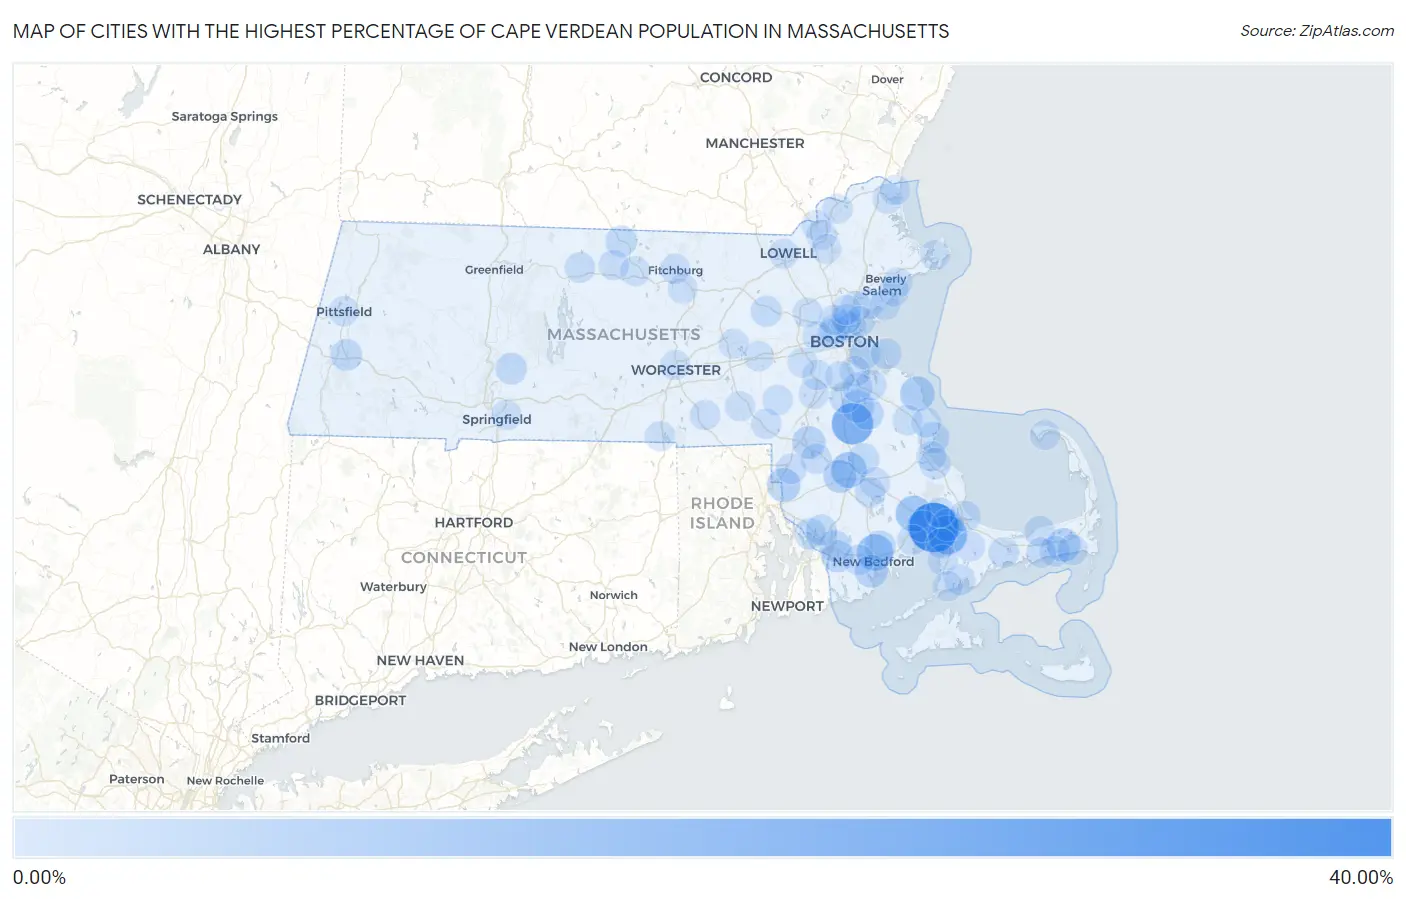
Map of Cities with the Highest Percentage of Cape Verdean Population in Massachusetts
0.00%
40.00%
Cities with the Highest Percentage of Cape Verdean Population in Massachusetts
| City | Cape Verdean | vs State | vs National | |
| 1. | Onset | 30.02% | 0.95%(+29.1)#1 | 0.032%(+30.0)#1 |
| 2. | Brockton | 17.34% | 0.95%(+16.4)#2 | 0.032%(+17.3)#2 |
| 3. | Monument Beach | 13.43% | 0.95%(+12.5)#3 | 0.032%(+13.4)#3 |
| 4. | New Bedford | 9.75% | 0.95%(+8.80)#4 | 0.032%(+9.72)#6 |
| 5. | West Wareham | 8.98% | 0.95%(+8.04)#5 | 0.032%(+8.95)#7 |
| 6. | Raynham Center | 8.34% | 0.95%(+7.39)#6 | 0.032%(+8.30)#8 |
| 7. | Scituate | 6.71% | 0.95%(+5.76)#7 | 0.032%(+6.67)#9 |
| 8. | North Seekonk | 5.28% | 0.95%(+4.34)#8 | 0.032%(+5.25)#11 |
| 9. | Northwest Harwich | 5.27% | 0.95%(+4.33)#9 | 0.032%(+5.24)#12 |
| 10. | Taunton | 4.73% | 0.95%(+3.78)#10 | 0.032%(+4.70)#13 |
| 11. | Mansfield Center | 4.34% | 0.95%(+3.40)#11 | 0.032%(+4.31)#14 |
| 12. | Bliss Corner | 4.04% | 0.95%(+3.10)#12 | 0.032%(+4.01)#16 |
| 13. | Holbrook | 3.77% | 0.95%(+2.83)#13 | 0.032%(+3.74)#17 |
| 14. | North Westport | 3.15% | 0.95%(+2.21)#14 | 0.032%(+3.12)#18 |
| 15. | Abington | 3.15% | 0.95%(+2.20)#15 | 0.032%(+3.11)#19 |
| 16. | Buzzards Bay | 3.07% | 0.95%(+2.13)#16 | 0.032%(+3.04)#20 |
| 17. | Fall River | 2.66% | 0.95%(+1.71)#17 | 0.032%(+2.63)#22 |
| 18. | Wareham Center | 2.45% | 0.95%(+1.50)#18 | 0.032%(+2.42)#23 |
| 19. | Lee | 2.39% | 0.95%(+1.44)#19 | 0.032%(+2.36)#24 |
| 20. | Acushnet Center | 2.31% | 0.95%(+1.36)#20 | 0.032%(+2.27)#25 |
| 21. | Granby | 2.30% | 0.95%(+1.35)#21 | 0.032%(+2.26)#26 |
| 22. | Ocean Grove | 2.16% | 0.95%(+1.21)#22 | 0.032%(+2.12)#30 |
| 23. | Duxbury | 2.04% | 0.95%(+1.10)#23 | 0.032%(+2.01)#31 |
| 24. | Winchendon | 1.91% | 0.95%(+0.958)#24 | 0.032%(+1.87)#32 |
| 25. | Boston | 1.88% | 0.95%(+0.932)#25 | 0.032%(+1.85)#33 |
| 26. | Plymouth | 1.80% | 0.95%(+0.857)#26 | 0.032%(+1.77)#34 |
| 27. | Bridgewater Town | 1.78% | 0.95%(+0.830)#27 | 0.032%(+1.74)#35 |
| 28. | Somerset | 1.70% | 0.95%(+0.750)#28 | 0.032%(+1.66)#37 |
| 29. | Sagamore | 1.66% | 0.95%(+0.717)#29 | 0.032%(+1.63)#38 |
| 30. | West Concord | 1.44% | 0.95%(+0.495)#30 | 0.032%(+1.41)#42 |
| 31. | Randolph Town | 1.33% | 0.95%(+0.385)#31 | 0.032%(+1.30)#44 |
| 32. | Barnstable Town | 1.24% | 0.95%(+0.292)#32 | 0.032%(+1.21)#47 |
| 33. | East Falmouth | 1.24% | 0.95%(+0.288)#33 | 0.032%(+1.20)#48 |
| 34. | Smith Mills | 1.16% | 0.95%(+0.216)#34 | 0.032%(+1.13)#49 |
| 35. | Dennis | 1.11% | 0.95%(+0.159)#35 | 0.032%(+1.07)#51 |
| 36. | Hull | 0.93% | 0.95%(-0.018)#36 | 0.032%(+0.897)#54 |
| 37. | Norton Center | 0.89% | 0.95%(-0.056)#37 | 0.032%(+0.859)#57 |
| 38. | Athol | 0.86% | 0.95%(-0.084)#38 | 0.032%(+0.831)#58 |
| 39. | Weymouth Town | 0.82% | 0.95%(-0.125)#39 | 0.032%(+0.790)#63 |
| 40. | Dennis Port | 0.82% | 0.95%(-0.129)#40 | 0.032%(+0.786)#64 |
| 41. | Harwich Port | 0.80% | 0.95%(-0.148)#41 | 0.032%(+0.767)#66 |
| 42. | Attleboro | 0.74% | 0.95%(-0.208)#42 | 0.032%(+0.707)#68 |
| 43. | Middleborough Center | 0.73% | 0.95%(-0.217)#43 | 0.032%(+0.698)#69 |
| 44. | Marion Center | 0.71% | 0.95%(-0.233)#44 | 0.032%(+0.682)#71 |
| 45. | Millis Clicquot | 0.70% | 0.95%(-0.248)#45 | 0.032%(+0.667)#72 |
| 46. | North Lakeville | 0.69% | 0.95%(-0.259)#46 | 0.032%(+0.655)#75 |
| 47. | Quincy | 0.67% | 0.95%(-0.282)#47 | 0.032%(+0.633)#76 |
| 48. | Salem | 0.62% | 0.95%(-0.332)#48 | 0.032%(+0.583)#80 |
| 49. | North Pembroke | 0.58% | 0.95%(-0.365)#49 | 0.032%(+0.549)#84 |
| 50. | North Falmouth | 0.56% | 0.95%(-0.386)#50 | 0.032%(+0.529)#87 |
| 51. | Franklin Town | 0.55% | 0.95%(-0.398)#51 | 0.032%(+0.517)#88 |
| 52. | Pocasset | 0.53% | 0.95%(-0.414)#52 | 0.032%(+0.501)#90 |
| 53. | South Yarmouth | 0.53% | 0.95%(-0.422)#53 | 0.032%(+0.493)#91 |
| 54. | Baldwinville | 0.52% | 0.95%(-0.422)#54 | 0.032%(+0.493)#92 |
| 55. | Norwood | 0.51% | 0.95%(-0.440)#55 | 0.032%(+0.475)#97 |
| 56. | Forestdale | 0.41% | 0.95%(-0.538)#56 | 0.032%(+0.377)#107 |
| 57. | Fitchburg | 0.39% | 0.95%(-0.558)#57 | 0.032%(+0.357)#109 |
| 58. | Braintree Town | 0.39% | 0.95%(-0.560)#58 | 0.032%(+0.355)#110 |
| 59. | Whitinsville | 0.38% | 0.95%(-0.562)#59 | 0.032%(+0.353)#111 |
| 60. | Amherst | 0.36% | 0.95%(-0.585)#60 | 0.032%(+0.330)#118 |
| 61. | Dedham | 0.36% | 0.95%(-0.585)#61 | 0.032%(+0.330)#119 |
| 62. | Everett | 0.34% | 0.95%(-0.604)#62 | 0.032%(+0.311)#121 |
| 63. | Lynn | 0.31% | 0.95%(-0.633)#63 | 0.032%(+0.282)#125 |
| 64. | Saugus | 0.28% | 0.95%(-0.664)#64 | 0.032%(+0.251)#138 |
| 65. | Falmouth | 0.28% | 0.95%(-0.664)#65 | 0.032%(+0.251)#139 |
| 66. | North Plymouth | 0.27% | 0.95%(-0.675)#66 | 0.032%(+0.239)#141 |
| 67. | Chelsea | 0.26% | 0.95%(-0.684)#67 | 0.032%(+0.231)#142 |
| 68. | Framingham | 0.23% | 0.95%(-0.713)#68 | 0.032%(+0.202)#150 |
| 69. | North Attleborough | 0.23% | 0.95%(-0.716)#69 | 0.032%(+0.199)#151 |
| 70. | Newburyport | 0.22% | 0.95%(-0.724)#70 | 0.032%(+0.191)#154 |
| 71. | Springfield | 0.22% | 0.95%(-0.724)#71 | 0.032%(+0.191)#155 |
| 72. | Revere | 0.22% | 0.95%(-0.728)#72 | 0.032%(+0.187)#158 |
| 73. | Milford | 0.21% | 0.95%(-0.733)#73 | 0.032%(+0.182)#163 |
| 74. | Lawrence | 0.21% | 0.95%(-0.734)#74 | 0.032%(+0.181)#164 |
| 75. | Cambridge | 0.20% | 0.95%(-0.744)#75 | 0.032%(+0.170)#170 |
| 76. | Webster | 0.20% | 0.95%(-0.751)#76 | 0.032%(+0.163)#172 |
| 77. | Salisbury | 0.19% | 0.95%(-0.757)#77 | 0.032%(+0.158)#176 |
| 78. | Beverly | 0.18% | 0.95%(-0.763)#78 | 0.032%(+0.152)#180 |
| 79. | Needham | 0.18% | 0.95%(-0.766)#79 | 0.032%(+0.149)#181 |
| 80. | White Island Shores | 0.18% | 0.95%(-0.767)#80 | 0.032%(+0.148)#184 |
| 81. | Lowell | 0.18% | 0.95%(-0.769)#81 | 0.032%(+0.146)#187 |
| 82. | Somerville | 0.18% | 0.95%(-0.769)#82 | 0.032%(+0.145)#188 |
| 83. | Worcester | 0.15% | 0.95%(-0.798)#83 | 0.032%(+0.117)#205 |
| 84. | Methuen Town | 0.14% | 0.95%(-0.803)#84 | 0.032%(+0.112)#208 |
| 85. | Leominster | 0.13% | 0.95%(-0.816)#85 | 0.032%(+0.098)#218 |
| 86. | Malden | 0.13% | 0.95%(-0.820)#86 | 0.032%(+0.095)#223 |
| 87. | Watertown Town | 0.12% | 0.95%(-0.828)#87 | 0.032%(+0.087)#228 |
| 88. | Gloucester | 0.11% | 0.95%(-0.833)#88 | 0.032%(+0.082)#235 |
| 89. | Haverhill | 0.10% | 0.95%(-0.843)#89 | 0.032%(+0.072)#242 |
| 90. | Marshfield | 0.10% | 0.95%(-0.844)#90 | 0.032%(+0.070)#246 |
| 91. | Marlborough | 0.10% | 0.95%(-0.846)#91 | 0.032%(+0.069)#247 |
| 92. | Milton | 0.095% | 0.95%(-0.852)#92 | 0.032%(+0.063)#252 |
| 93. | Pittsfield | 0.089% | 0.95%(-0.858)#93 | 0.032%(+0.057)#258 |
| 94. | Medford | 0.087% | 0.95%(-0.860)#94 | 0.032%(+0.055)#260 |
| 95. | Gardner | 0.081% | 0.95%(-0.866)#95 | 0.032%(+0.048)#272 |
| 96. | Andover | 0.074% | 0.95%(-0.873)#96 | 0.032%(+0.042)#287 |
| 97. | Melrose | 0.064% | 0.95%(-0.883)#97 | 0.032%(+0.032)#299 |
| 98. | Lexington | 0.061% | 0.95%(-0.886)#98 | 0.032%(+0.029)#307 |
| 99. | Swampscott | 0.060% | 0.95%(-0.888)#99 | 0.032%(+0.027)#309 |
| 100. | Provincetown | 0.058% | 0.95%(-0.889)#100 | 0.032%(+0.026)#310 |
Common Questions
What are the Top 10 Cities with the Highest Percentage of Cape Verdean Population in Massachusetts?
Top 10 Cities with the Highest Percentage of Cape Verdean Population in Massachusetts are:
#1
30.02%
#2
17.34%
#3
13.43%
#4
9.75%
#5
8.98%
#6
8.34%
#7
6.71%
#8
5.28%
#9
5.27%
#10
4.73%
What city has the Highest Percentage of Cape Verdean Population in Massachusetts?
Onset has the Highest Percentage of Cape Verdean Population in Massachusetts with 30.02%.
What is the Percentage of Cape Verdean Population in the State of Massachusetts?
Percentage of Cape Verdean Population in Massachusetts is 0.95%.
What is the Percentage of Cape Verdean Population in the United States?
Percentage of Cape Verdean Population in the United States is 0.032%.