Barnstable Town, MA Map & Demographics
Barnstable Town Map
Barnstable Town Overview
$51,061
PER CAPITA INCOME
$118,726
AVG FAMILY INCOME
$94,387
AVG HOUSEHOLD INCOME
26.0%
WAGE / INCOME GAP [ % ]
74.0¢/ $1
WAGE / INCOME GAP [ $ ]
0.45
INEQUALITY / GINI INDEX
48,922
TOTAL POPULATION
23,992
MALE POPULATION
24,930
FEMALE POPULATION
96.24
MALES / 100 FEMALES
103.91
FEMALES / 100 MALES
47.1
MEDIAN AGE
3.0
AVG FAMILY SIZE
2.5
AVG HOUSEHOLD SIZE
28,070
LABOR FORCE [ PEOPLE ]
67.6%
PERCENT IN LABOR FORCE
3.1%
UNEMPLOYMENT RATE
Income in Barnstable Town
Income Overview in Barnstable Town
Per Capita Income in Barnstable Town is $51,061, while median incomes of families and households are $118,726 and $94,387 respectively.
| Characteristic | Number | Measure |
| Per Capita Income | 48,922 | $51,061 |
| Median Family Income | 12,806 | $118,726 |
| Mean Family Income | 12,806 | $141,443 |
| Median Household Income | 19,574 | $94,387 |
| Mean Household Income | 19,574 | $123,887 |
| Income Deficit | 12,806 | $0 |
| Wage / Income Gap (%) | 48,922 | 25.96% |
| Wage / Income Gap ($) | 48,922 | 74.04¢ per $1 |
| Gini / Inequality Index | 48,922 | 0.45 |
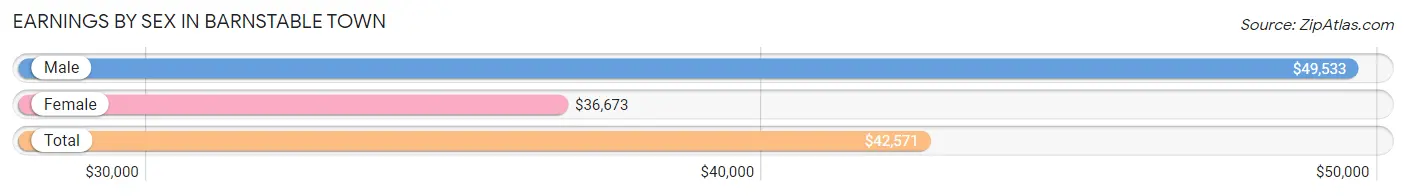
Earnings by Sex in Barnstable Town
Average Earnings in Barnstable Town are $42,571, $49,533 for men and $36,673 for women, a difference of 26.0%.
| Sex | Number | Average Earnings |
| Male | 14,910 (50.4%) | $49,533 |
| Female | 14,647 (49.6%) | $36,673 |
| Total | 29,557 (100.0%) | $42,571 |
Earnings by Sex by Income Bracket in Barnstable Town
The most common earnings brackets in Barnstable Town are $100,000+ for men (3,075 | 20.6%) and $100,000+ for women (1,631 | 11.1%).
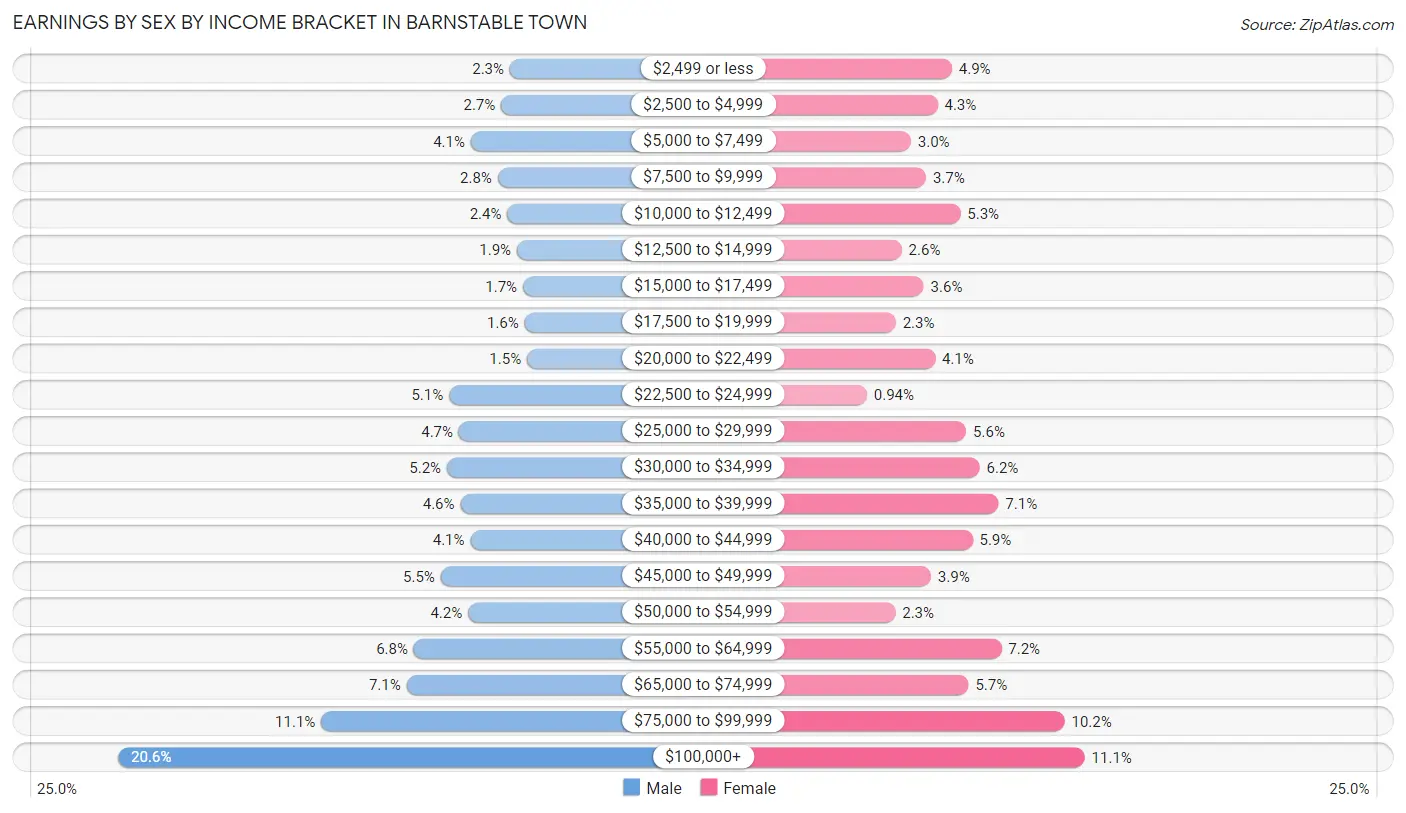
| Income | Male | Female |
| $2,499 or less | 338 (2.3%) | 720 (4.9%) |
| $2,500 to $4,999 | 400 (2.7%) | 623 (4.3%) |
| $5,000 to $7,499 | 612 (4.1%) | 439 (3.0%) |
| $7,500 to $9,999 | 423 (2.8%) | 543 (3.7%) |
| $10,000 to $12,499 | 357 (2.4%) | 779 (5.3%) |
| $12,500 to $14,999 | 289 (1.9%) | 376 (2.6%) |
| $15,000 to $17,499 | 248 (1.7%) | 527 (3.6%) |
| $17,500 to $19,999 | 235 (1.6%) | 336 (2.3%) |
| $20,000 to $22,499 | 219 (1.5%) | 605 (4.1%) |
| $22,500 to $24,999 | 764 (5.1%) | 137 (0.9%) |
| $25,000 to $29,999 | 695 (4.7%) | 819 (5.6%) |
| $30,000 to $34,999 | 778 (5.2%) | 911 (6.2%) |
| $35,000 to $39,999 | 684 (4.6%) | 1,040 (7.1%) |
| $40,000 to $44,999 | 614 (4.1%) | 862 (5.9%) |
| $45,000 to $49,999 | 822 (5.5%) | 577 (3.9%) |
| $50,000 to $54,999 | 631 (4.2%) | 332 (2.3%) |
| $55,000 to $64,999 | 1,009 (6.8%) | 1,061 (7.2%) |
| $65,000 to $74,999 | 1,060 (7.1%) | 835 (5.7%) |
| $75,000 to $99,999 | 1,657 (11.1%) | 1,494 (10.2%) |
| $100,000+ | 3,075 (20.6%) | 1,631 (11.1%) |
| Total | 14,910 (100.0%) | 14,647 (100.0%) |
Earnings by Sex by Educational Attainment in Barnstable Town
Average earnings in Barnstable Town are $56,717 for men and $41,018 for women, a difference of 27.7%. Men with an educational attainment of graduate degree enjoy the highest average annual earnings of $108,077, while those with less than high school education earn the least with $34,325. Women with an educational attainment of graduate degree earn the most with the average annual earnings of $72,361, while those with less than high school education have the smallest earnings of $20,417.
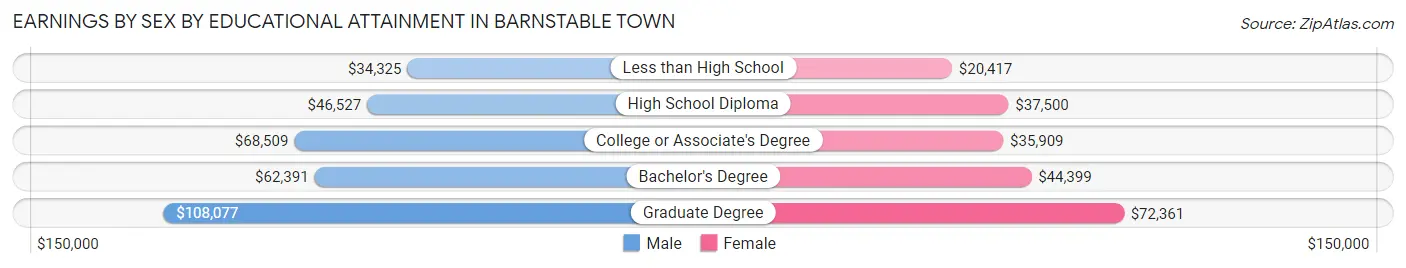
| Educational Attainment | Male Income | Female Income |
| Less than High School | $34,325 | $20,417 |
| High School Diploma | $46,527 | $37,500 |
| College or Associate's Degree | $68,509 | $35,909 |
| Bachelor's Degree | $62,391 | $44,399 |
| Graduate Degree | $108,077 | $72,361 |
| Total | $56,717 | $41,018 |
Family Income in Barnstable Town
Family Income Brackets in Barnstable Town
According to the Barnstable Town family income data, there are 2,945 families falling into the $100,000 to $149,999 income range, which is the most common income bracket and makes up 23.0% of all families. Conversely, the $10,000 to $14,999 income bracket is the least frequent group with only 90 families (0.7%) belonging to this category.

| Income Bracket | # Families | % Families |
| Less than $10,000 | 243 | 1.9% |
| $10,000 to $14,999 | 90 | 0.7% |
| $15,000 to $24,999 | 423 | 3.3% |
| $25,000 to $34,999 | 448 | 3.5% |
| $35,000 to $49,999 | 973 | 7.6% |
| $50,000 to $74,999 | 1,754 | 13.7% |
| $75,000 to $99,999 | 1,409 | 11.0% |
| $100,000 to $149,999 | 2,945 | 23.0% |
| $150,000 to $199,999 | 2,433 | 19.0% |
| $200,000+ | 2,100 | 16.4% |
Family Income by Famaliy Size in Barnstable Town
6-person families (163 | 1.3%) account for the highest median family income in Barnstable Town with $250,001 per family, while 2-person families (6,773 | 52.9%) have the highest median income of $54,485 per family member.
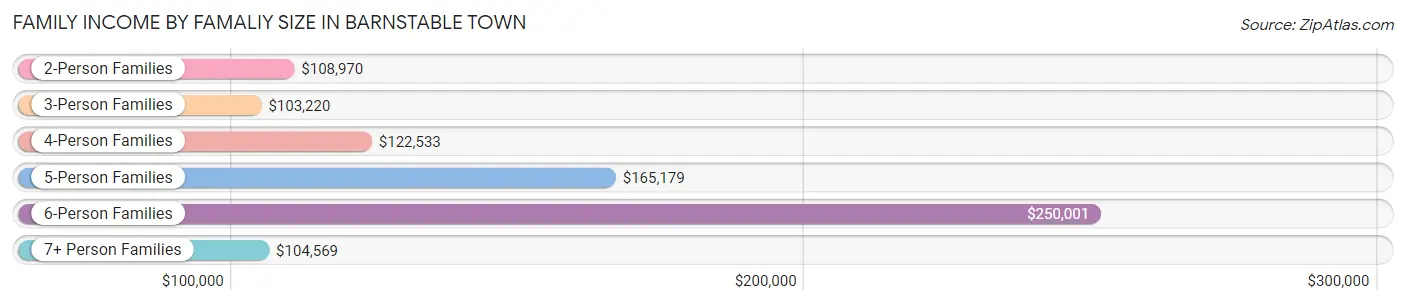
| Income Bracket | # Families | Median Income |
| 2-Person Families | 6,773 (52.9%) | $108,970 |
| 3-Person Families | 2,725 (21.3%) | $103,220 |
| 4-Person Families | 2,121 (16.6%) | $122,533 |
| 5-Person Families | 826 (6.5%) | $165,179 |
| 6-Person Families | 163 (1.3%) | $250,001 |
| 7+ Person Families | 198 (1.5%) | $104,569 |
| Total | 12,806 (100.0%) | $118,726 |
Family Income by Number of Earners in Barnstable Town
The median family income in Barnstable Town is $118,726, with families comprising 3+ earners (2,033) having the highest median family income of $156,573, while families with no earners (1,899) have the lowest median family income of $74,856, accounting for 15.9% and 14.8% of families, respectively.
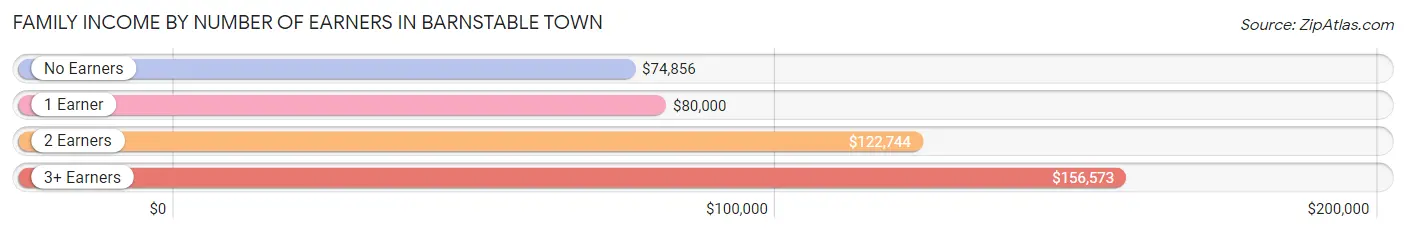
| Number of Earners | # Families | Median Income |
| No Earners | 1,899 (14.8%) | $74,856 |
| 1 Earner | 3,394 (26.5%) | $80,000 |
| 2 Earners | 5,480 (42.8%) | $122,744 |
| 3+ Earners | 2,033 (15.9%) | $156,573 |
| Total | 12,806 (100.0%) | $118,726 |
Household Income in Barnstable Town
Household Income Brackets in Barnstable Town
With 3,739 households falling in the category, the $100,000 to $149,999 income range is the most frequent in Barnstable Town, accounting for 19.1% of all households. In contrast, only 450 households (2.3%) fall into the $10,000 to $14,999 income bracket, making it the least populous group.
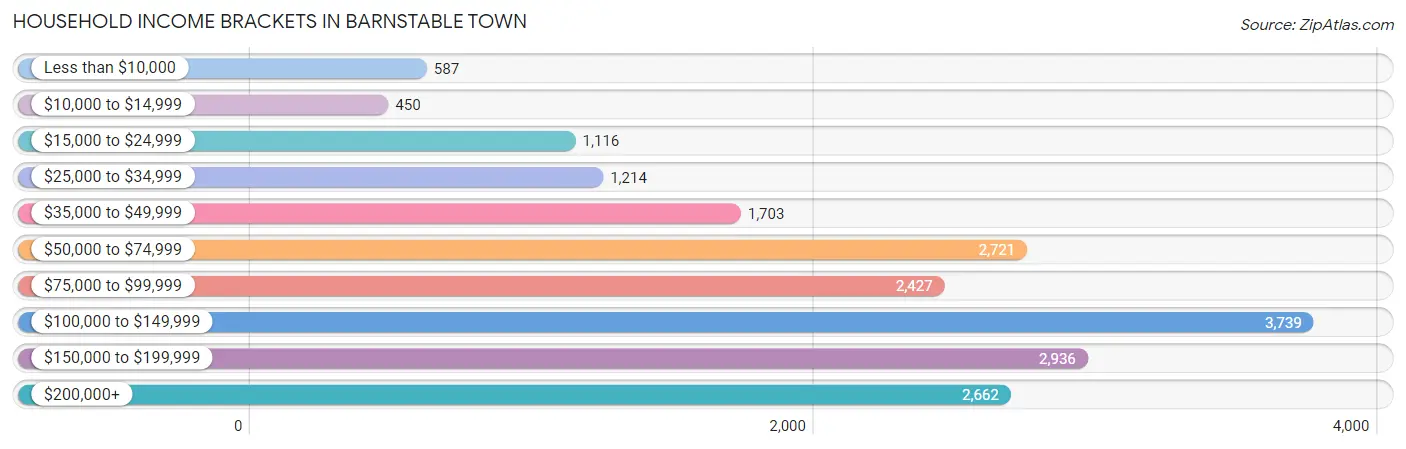
| Income Bracket | # Households | % Households |
| Less than $10,000 | 587 | 3.0% |
| $10,000 to $14,999 | 450 | 2.3% |
| $15,000 to $24,999 | 1,116 | 5.7% |
| $25,000 to $34,999 | 1,214 | 6.2% |
| $35,000 to $49,999 | 1,703 | 8.7% |
| $50,000 to $74,999 | 2,721 | 13.9% |
| $75,000 to $99,999 | 2,427 | 12.4% |
| $100,000 to $149,999 | 3,739 | 19.1% |
| $150,000 to $199,999 | 2,936 | 15.0% |
| $200,000+ | 2,662 | 13.6% |
Household Income by Householder Age in Barnstable Town
The median household income in Barnstable Town is $94,387, with the highest median household income of $122,341 found in the 45 to 64 years age bracket for the primary householder. A total of 7,647 households (39.1%) fall into this category. Meanwhile, the 15 to 24 years age bracket for the primary householder has the lowest median household income of $48,625, with 286 households (1.5%) in this group.
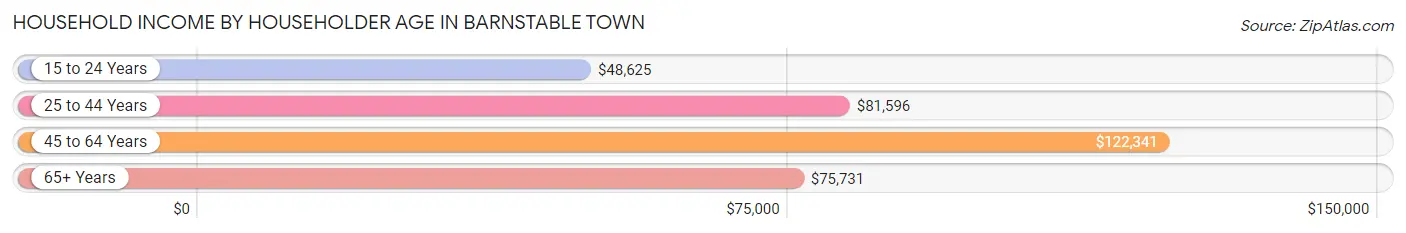
| Income Bracket | # Households | Median Income |
| 15 to 24 Years | 286 (1.5%) | $48,625 |
| 25 to 44 Years | 4,595 (23.5%) | $81,596 |
| 45 to 64 Years | 7,647 (39.1%) | $122,341 |
| 65+ Years | 7,046 (36.0%) | $75,731 |
| Total | 19,574 (100.0%) | $94,387 |
Poverty in Barnstable Town
Income Below Poverty by Sex and Age in Barnstable Town
With 6.3% poverty level for males and 7.4% for females among the residents of Barnstable Town, under 5 year old males and 15 year old females are the most vulnerable to poverty, with 202 males (17.5%) and 35 females (21.7%) in their respective age groups living below the poverty level.
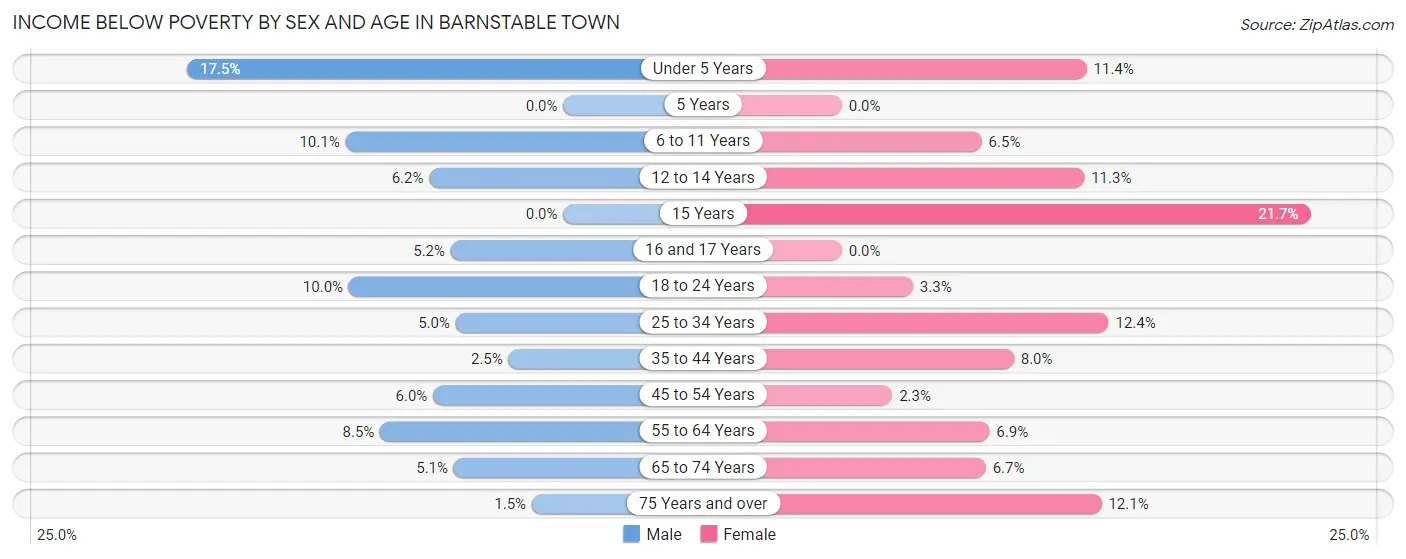
| Age Bracket | Male | Female |
| Under 5 Years | 202 (17.5%) | 98 (11.4%) |
| 5 Years | 0 (0.0%) | 0 (0.0%) |
| 6 to 11 Years | 149 (10.1%) | 93 (6.5%) |
| 12 to 14 Years | 46 (6.2%) | 87 (11.3%) |
| 15 Years | 0 (0.0%) | 35 (21.7%) |
| 16 and 17 Years | 30 (5.2%) | 0 (0.0%) |
| 18 to 24 Years | 180 (10.0%) | 69 (3.3%) |
| 25 to 34 Years | 131 (5.0%) | 350 (12.4%) |
| 35 to 44 Years | 75 (2.5%) | 225 (8.0%) |
| 45 to 54 Years | 166 (6.0%) | 73 (2.3%) |
| 55 to 64 Years | 331 (8.5%) | 284 (6.9%) |
| 65 to 74 Years | 160 (5.1%) | 236 (6.7%) |
| 75 Years and over | 33 (1.5%) | 287 (12.0%) |
| Total | 1,503 (6.3%) | 1,837 (7.4%) |
Income Above Poverty by Sex and Age in Barnstable Town
According to the poverty statistics in Barnstable Town, males aged 5 years and females aged 5 years are the age groups that are most secure financially, with 100.0% of males and 100.0% of females in these age groups living above the poverty line.
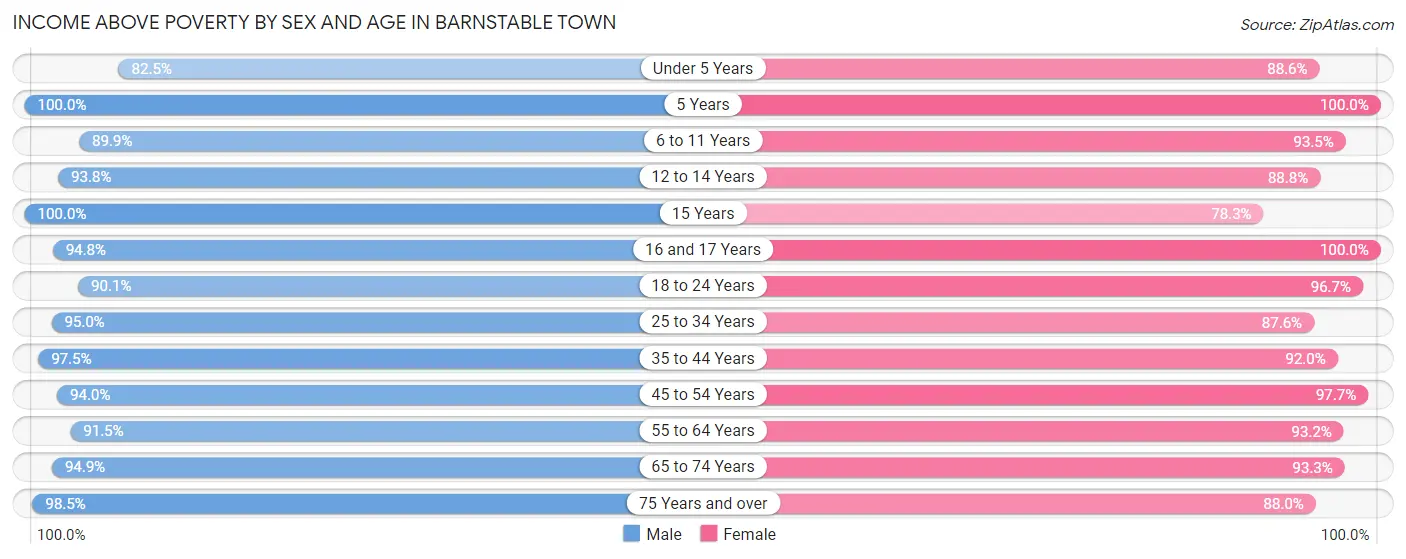
| Age Bracket | Male | Female |
| Under 5 Years | 955 (82.5%) | 765 (88.6%) |
| 5 Years | 309 (100.0%) | 144 (100.0%) |
| 6 to 11 Years | 1,325 (89.9%) | 1,339 (93.5%) |
| 12 to 14 Years | 693 (93.8%) | 686 (88.7%) |
| 15 Years | 180 (100.0%) | 126 (78.3%) |
| 16 and 17 Years | 545 (94.8%) | 424 (100.0%) |
| 18 to 24 Years | 1,629 (90.0%) | 2,019 (96.7%) |
| 25 to 34 Years | 2,496 (95.0%) | 2,477 (87.6%) |
| 35 to 44 Years | 2,878 (97.5%) | 2,596 (92.0%) |
| 45 to 54 Years | 2,584 (94.0%) | 3,053 (97.7%) |
| 55 to 64 Years | 3,564 (91.5%) | 3,862 (93.1%) |
| 65 to 74 Years | 2,989 (94.9%) | 3,299 (93.3%) |
| 75 Years and over | 2,233 (98.5%) | 2,094 (87.9%) |
| Total | 22,380 (93.7%) | 22,884 (92.6%) |
Income Below Poverty Among Married-Couple Families in Barnstable Town
The poverty statistics for married-couple families in Barnstable Town show that 2.4% or 239 of the total 10,088 families live below the poverty line. Families with 1 or 2 children have the highest poverty rate of 4.7%, comprising of 135 families. On the other hand, families with 3 or 4 children have the lowest poverty rate of 0.0%, which includes 0 families.
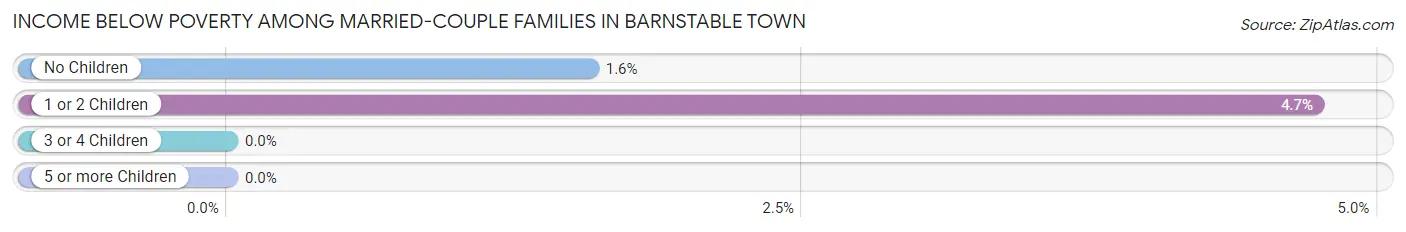
| Children | Above Poverty | Below Poverty |
| No Children | 6,521 (98.4%) | 104 (1.6%) |
| 1 or 2 Children | 2,721 (95.3%) | 135 (4.7%) |
| 3 or 4 Children | 578 (100.0%) | 0 (0.0%) |
| 5 or more Children | 29 (100.0%) | 0 (0.0%) |
| Total | 9,849 (97.6%) | 239 (2.4%) |
Income Below Poverty Among Single-Parent Households in Barnstable Town
According to the poverty data in Barnstable Town, 1.1% or 9 single-father households and 17.1% or 322 single-mother households are living below the poverty line. Among single-father households, those with 1 or 2 children have the highest poverty rate, with 9 households (1.7%) experiencing poverty. Likewise, among single-mother households, those with 3 or 4 children have the highest poverty rate, with 27 households (52.9%) falling below the poverty line.
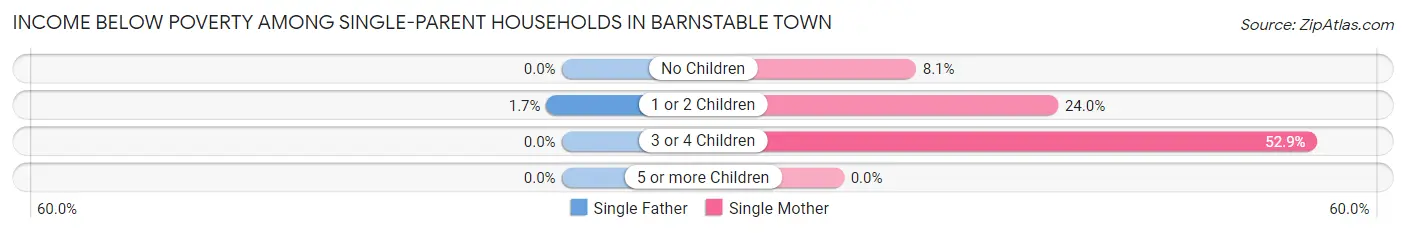
| Children | Single Father | Single Mother |
| No Children | 0 (0.0%) | 73 (8.1%) |
| 1 or 2 Children | 9 (1.7%) | 222 (23.9%) |
| 3 or 4 Children | 0 (0.0%) | 27 (52.9%) |
| 5 or more Children | 0 (0.0%) | 0 (0.0%) |
| Total | 9 (1.1%) | 322 (17.1%) |
Income Below Poverty Among Married-Couple vs Single-Parent Households in Barnstable Town
The poverty data for Barnstable Town shows that 239 of the married-couple family households (2.4%) and 331 of the single-parent households (12.2%) are living below the poverty level. Within the married-couple family households, those with 1 or 2 children have the highest poverty rate, with 135 households (4.7%) falling below the poverty line. Among the single-parent households, those with 3 or 4 children have the highest poverty rate, with 27 household (52.9%) living below poverty.
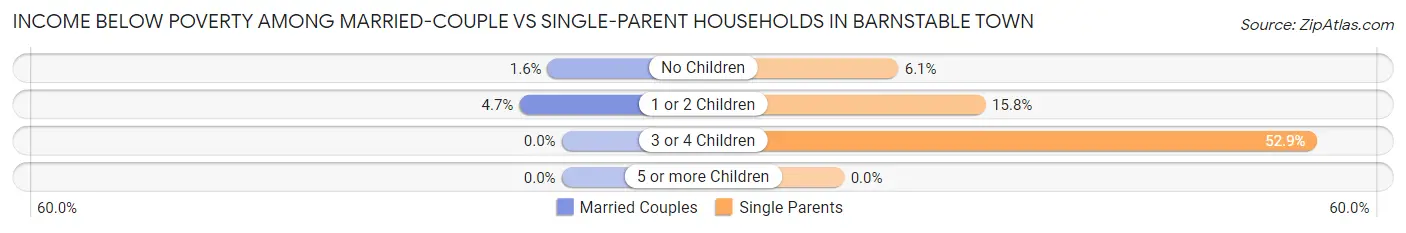
| Children | Married-Couple Families | Single-Parent Households |
| No Children | 104 (1.6%) | 73 (6.0%) |
| 1 or 2 Children | 135 (4.7%) | 231 (15.8%) |
| 3 or 4 Children | 0 (0.0%) | 27 (52.9%) |
| 5 or more Children | 0 (0.0%) | 0 (0.0%) |
| Total | 239 (2.4%) | 331 (12.2%) |
Race in Barnstable Town
The most populous races in Barnstable Town are White / Caucasian (39,635 | 81.0%), Two or more Races (3,612 | 7.4%), and Hispanic or Latino (3,387 | 6.9%).
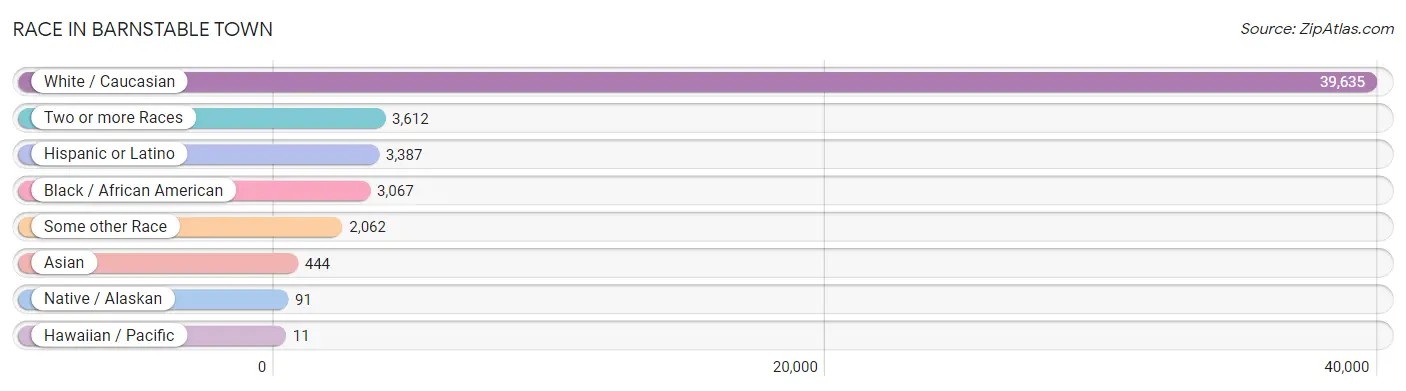
| Race | # Population | % Population |
| Asian | 444 | 0.9% |
| Black / African American | 3,067 | 6.3% |
| Hawaiian / Pacific | 11 | 0.0% |
| Hispanic or Latino | 3,387 | 6.9% |
| Native / Alaskan | 91 | 0.2% |
| White / Caucasian | 39,635 | 81.0% |
| Two or more Races | 3,612 | 7.4% |
| Some other Race | 2,062 | 4.2% |
| Total | 48,922 | 100.0% |
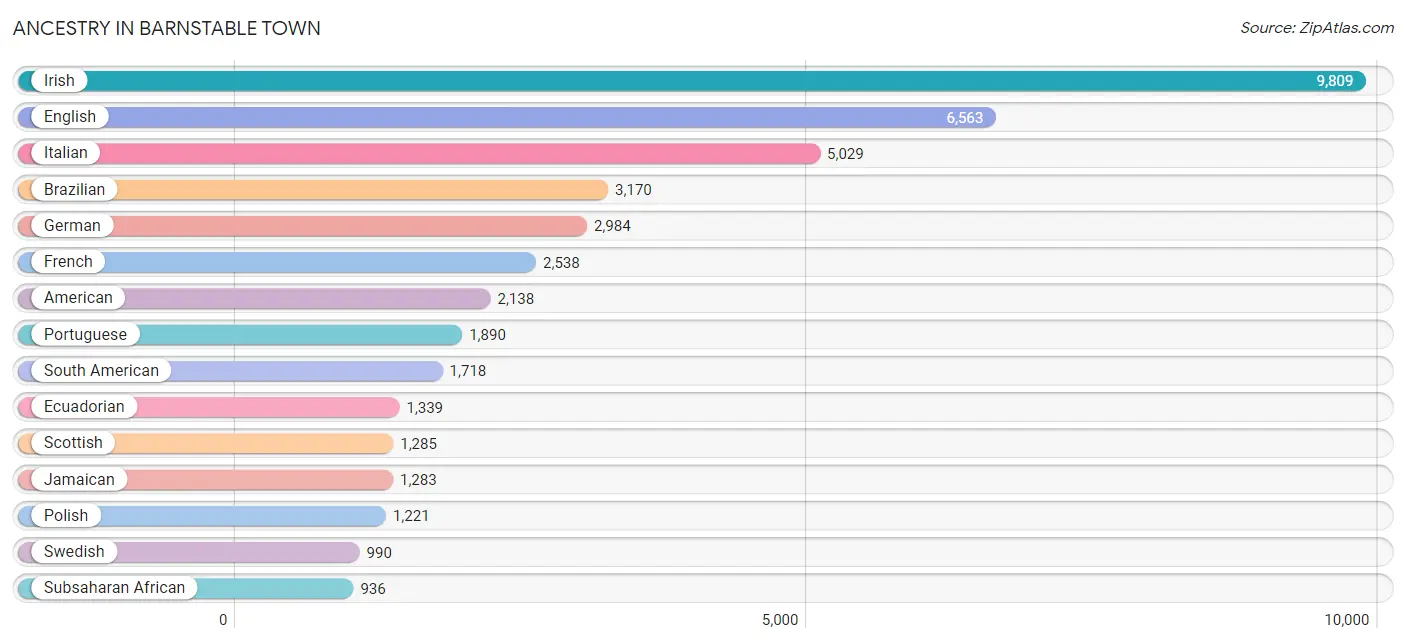
Ancestry in Barnstable Town
The most populous ancestries reported in Barnstable Town are Irish (9,809 | 20.1%), English (6,563 | 13.4%), Italian (5,029 | 10.3%), Brazilian (3,170 | 6.5%), and German (2,984 | 6.1%), together accounting for 56.3% of all Barnstable Town residents.
| Ancestry | # Population | % Population |
| African | 279 | 0.6% |
| Albanian | 88 | 0.2% |
| American | 2,138 | 4.4% |
| Arab | 149 | 0.3% |
| Argentinean | 38 | 0.1% |
| Armenian | 68 | 0.1% |
| Austrian | 106 | 0.2% |
| Bhutanese | 20 | 0.0% |
| Brazilian | 3,170 | 6.5% |
| British | 192 | 0.4% |
| British West Indian | 20 | 0.0% |
| Bulgarian | 132 | 0.3% |
| Burmese | 10 | 0.0% |
| Canadian | 322 | 0.7% |
| Cape Verdean | 606 | 1.2% |
| Central American | 148 | 0.3% |
| Cherokee | 10 | 0.0% |
| Chilean | 33 | 0.1% |
| Chippewa | 19 | 0.0% |
| Colombian | 12 | 0.0% |
| Costa Rican | 12 | 0.0% |
| Croatian | 118 | 0.2% |
| Cuban | 15 | 0.0% |
| Czech | 137 | 0.3% |
| Czechoslovakian | 17 | 0.0% |
| Danish | 98 | 0.2% |
| Delaware | 19 | 0.0% |
| Dominican | 223 | 0.5% |
| Dutch | 181 | 0.4% |
| Eastern European | 230 | 0.5% |
| Ecuadorian | 1,339 | 2.7% |
| English | 6,563 | 13.4% |
| Ethiopian | 51 | 0.1% |
| European | 450 | 0.9% |
| Finnish | 408 | 0.8% |
| French | 2,538 | 5.2% |
| French Canadian | 795 | 1.6% |
| German | 2,984 | 6.1% |
| Greek | 280 | 0.6% |
| Guyanese | 33 | 0.1% |
| Haitian | 396 | 0.8% |
| Hungarian | 67 | 0.1% |
| Indian (Asian) | 280 | 0.6% |
| Iranian | 9 | 0.0% |
| Irish | 9,809 | 20.1% |
| Iroquois | 9 | 0.0% |
| Italian | 5,029 | 10.3% |
| Jamaican | 1,283 | 2.6% |
| Jordanian | 8 | 0.0% |
| Korean | 13 | 0.0% |
| Latvian | 8 | 0.0% |
| Lebanese | 67 | 0.1% |
| Lithuanian | 329 | 0.7% |
| Malaysian | 14 | 0.0% |
| Mexican | 295 | 0.6% |
| Mexican American Indian | 9 | 0.0% |
| Native Hawaiian | 11 | 0.0% |
| Northern European | 49 | 0.1% |
| Norwegian | 463 | 0.9% |
| Pakistani | 68 | 0.1% |
| Pennsylvania German | 22 | 0.0% |
| Peruvian | 277 | 0.6% |
| Polish | 1,221 | 2.5% |
| Portuguese | 1,890 | 3.9% |
| Puerto Rican | 356 | 0.7% |
| Romanian | 17 | 0.0% |
| Russian | 453 | 0.9% |
| Salvadoran | 136 | 0.3% |
| Scandinavian | 87 | 0.2% |
| Scotch-Irish | 285 | 0.6% |
| Scottish | 1,285 | 2.6% |
| Serbian | 533 | 1.1% |
| Slovak | 39 | 0.1% |
| South American | 1,718 | 3.5% |
| Spaniard | 86 | 0.2% |
| Spanish | 15 | 0.0% |
| Spanish American Indian | 9 | 0.0% |
| Sri Lankan | 65 | 0.1% |
| Subsaharan African | 936 | 1.9% |
| Swedish | 990 | 2.0% |
| Swiss | 96 | 0.2% |
| Syrian | 20 | 0.0% |
| Thai | 124 | 0.3% |
| Turkish | 41 | 0.1% |
| Ukrainian | 38 | 0.1% |
| Venezuelan | 19 | 0.0% |
| Welsh | 146 | 0.3% |
| West Indian | 36 | 0.1% | View All 88 Rows |
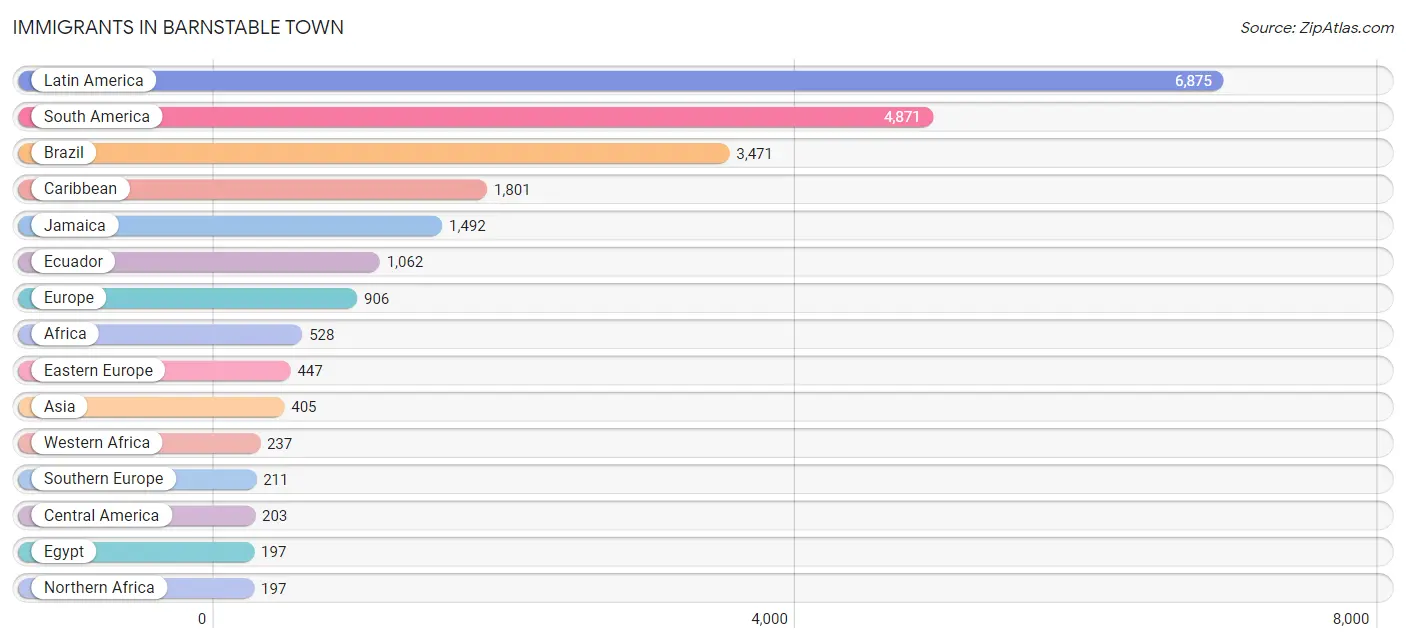
Immigrants in Barnstable Town
The most numerous immigrant groups reported in Barnstable Town came from Latin America (6,875 | 14.1%), South America (4,871 | 10.0%), Brazil (3,471 | 7.1%), Caribbean (1,801 | 3.7%), and Jamaica (1,492 | 3.0%), together accounting for 37.8% of all Barnstable Town residents.
| Immigration Origin | # Population | % Population |
| Africa | 528 | 1.1% |
| Albania | 24 | 0.1% |
| Argentina | 38 | 0.1% |
| Asia | 405 | 0.8% |
| Australia | 35 | 0.1% |
| Azores | 75 | 0.2% |
| Bangladesh | 9 | 0.0% |
| Belarus | 20 | 0.0% |
| Bosnia and Herzegovina | 68 | 0.1% |
| Brazil | 3,471 | 7.1% |
| Bulgaria | 98 | 0.2% |
| Cabo Verde | 42 | 0.1% |
| Canada | 163 | 0.3% |
| Caribbean | 1,801 | 3.7% |
| Central America | 203 | 0.4% |
| Chile | 66 | 0.1% |
| China | 158 | 0.3% |
| Colombia | 12 | 0.0% |
| Czechoslovakia | 19 | 0.0% |
| Denmark | 28 | 0.1% |
| Dominican Republic | 125 | 0.3% |
| Eastern Africa | 67 | 0.1% |
| Eastern Asia | 158 | 0.3% |
| Eastern Europe | 447 | 0.9% |
| Ecuador | 1,062 | 2.2% |
| Egypt | 197 | 0.4% |
| El Salvador | 101 | 0.2% |
| England | 73 | 0.2% |
| Ethiopia | 51 | 0.1% |
| Europe | 906 | 1.8% |
| France | 32 | 0.1% |
| Germany | 58 | 0.1% |
| Ghana | 195 | 0.4% |
| Greece | 21 | 0.0% |
| Guyana | 60 | 0.1% |
| Haiti | 164 | 0.3% |
| Hong Kong | 1 | 0.0% |
| India | 22 | 0.0% |
| Iran | 9 | 0.0% |
| Ireland | 39 | 0.1% |
| Italy | 100 | 0.2% |
| Jamaica | 1,492 | 3.0% |
| Laos | 14 | 0.0% |
| Latin America | 6,875 | 14.1% |
| Latvia | 8 | 0.0% |
| Lebanon | 53 | 0.1% |
| Lithuania | 26 | 0.1% |
| Mexico | 102 | 0.2% |
| Northern Africa | 197 | 0.4% |
| Northern Europe | 158 | 0.3% |
| Oceania | 35 | 0.1% |
| Peru | 162 | 0.3% |
| Poland | 30 | 0.1% |
| Portugal | 90 | 0.2% |
| Russia | 21 | 0.0% |
| Serbia | 109 | 0.2% |
| South Africa | 27 | 0.1% |
| South America | 4,871 | 10.0% |
| South Central Asia | 40 | 0.1% |
| South Eastern Asia | 94 | 0.2% |
| Southern Europe | 211 | 0.4% |
| St. Vincent and the Grenadines | 9 | 0.0% |
| Sweden | 18 | 0.0% |
| Syria | 36 | 0.1% |
| Thailand | 43 | 0.1% |
| Ukraine | 18 | 0.0% |
| Vietnam | 37 | 0.1% |
| Western Africa | 237 | 0.5% |
| Western Asia | 113 | 0.2% |
| Western Europe | 90 | 0.2% | View All 70 Rows |
Sex and Age in Barnstable Town
Sex and Age in Barnstable Town
The most populous age groups in Barnstable Town are 55 to 59 Years (2,049 | 8.5%) for men and 60 to 64 Years (2,110 | 8.5%) for women.
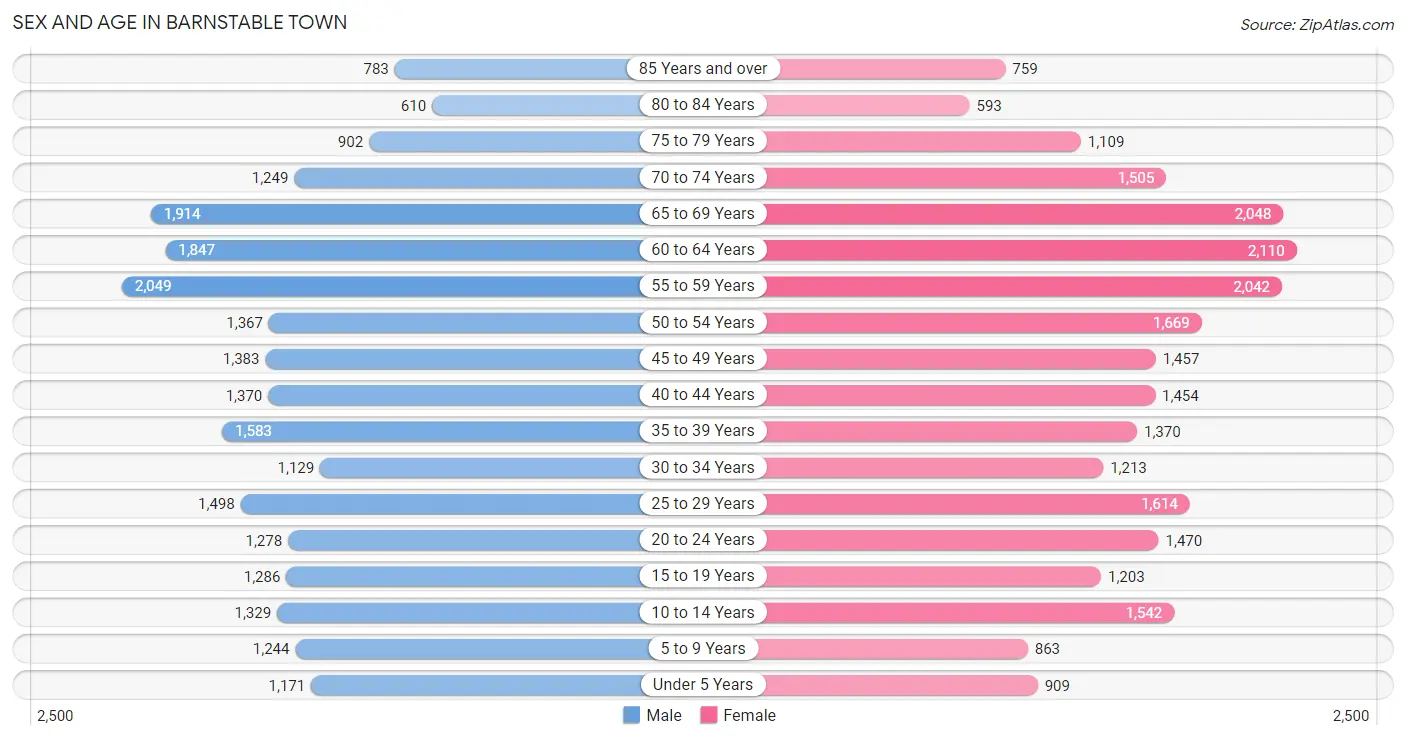
| Age Bracket | Male | Female |
| Under 5 Years | 1,171 (4.9%) | 909 (3.6%) |
| 5 to 9 Years | 1,244 (5.2%) | 863 (3.5%) |
| 10 to 14 Years | 1,329 (5.5%) | 1,542 (6.2%) |
| 15 to 19 Years | 1,286 (5.4%) | 1,203 (4.8%) |
| 20 to 24 Years | 1,278 (5.3%) | 1,470 (5.9%) |
| 25 to 29 Years | 1,498 (6.2%) | 1,614 (6.5%) |
| 30 to 34 Years | 1,129 (4.7%) | 1,213 (4.9%) |
| 35 to 39 Years | 1,583 (6.6%) | 1,370 (5.5%) |
| 40 to 44 Years | 1,370 (5.7%) | 1,454 (5.8%) |
| 45 to 49 Years | 1,383 (5.8%) | 1,457 (5.8%) |
| 50 to 54 Years | 1,367 (5.7%) | 1,669 (6.7%) |
| 55 to 59 Years | 2,049 (8.5%) | 2,042 (8.2%) |
| 60 to 64 Years | 1,847 (7.7%) | 2,110 (8.5%) |
| 65 to 69 Years | 1,914 (8.0%) | 2,048 (8.2%) |
| 70 to 74 Years | 1,249 (5.2%) | 1,505 (6.0%) |
| 75 to 79 Years | 902 (3.8%) | 1,109 (4.4%) |
| 80 to 84 Years | 610 (2.5%) | 593 (2.4%) |
| 85 Years and over | 783 (3.3%) | 759 (3.0%) |
| Total | 23,992 (100.0%) | 24,930 (100.0%) |
Families and Households in Barnstable Town
Median Family Size in Barnstable Town
The median family size in Barnstable Town is 2.99 persons per family, with single female/mother families (1,884 | 14.7%) accounting for the largest median family size of 3.06 persons per family. On the other hand, single male/father families (834 | 6.5%) represent the smallest median family size with 2.69 persons per family.
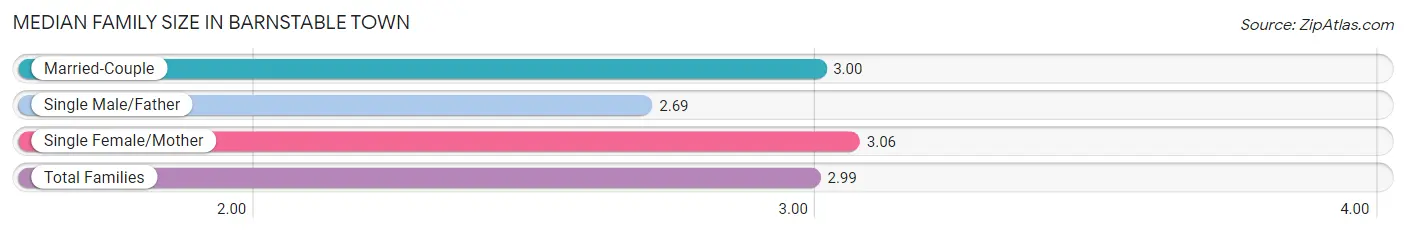
| Family Type | # Families | Family Size |
| Married-Couple | 10,088 (78.8%) | 3.00 |
| Single Male/Father | 834 (6.5%) | 2.69 |
| Single Female/Mother | 1,884 (14.7%) | 3.06 |
| Total Families | 12,806 (100.0%) | 2.99 |
Median Household Size in Barnstable Town
The median household size in Barnstable Town is 2.47 persons per household, with single female/mother households (1,884 | 9.6%) accounting for the largest median household size of 3.25 persons per household. non-family households (6,768 | 34.6%) represent the smallest median household size with 1.31 persons per household.
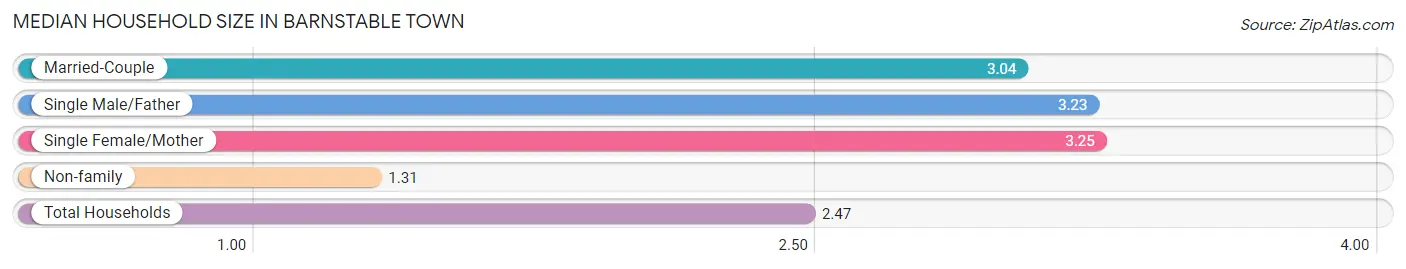
| Household Type | # Households | Household Size |
| Married-Couple | 10,088 (51.5%) | 3.04 |
| Single Male/Father | 834 (4.3%) | 3.23 |
| Single Female/Mother | 1,884 (9.6%) | 3.25 |
| Non-family | 6,768 (34.6%) | 1.31 |
| Total Households | 19,574 (100.0%) | 2.47 |
Household Size by Marriage Status in Barnstable Town
Out of a total of 19,574 households in Barnstable Town, 12,806 (65.4%) are family households, while 6,768 (34.6%) are nonfamily households. The most numerous type of family households are 2-person households, comprising 6,517, and the most common type of nonfamily households are 1-person households, comprising 5,365.
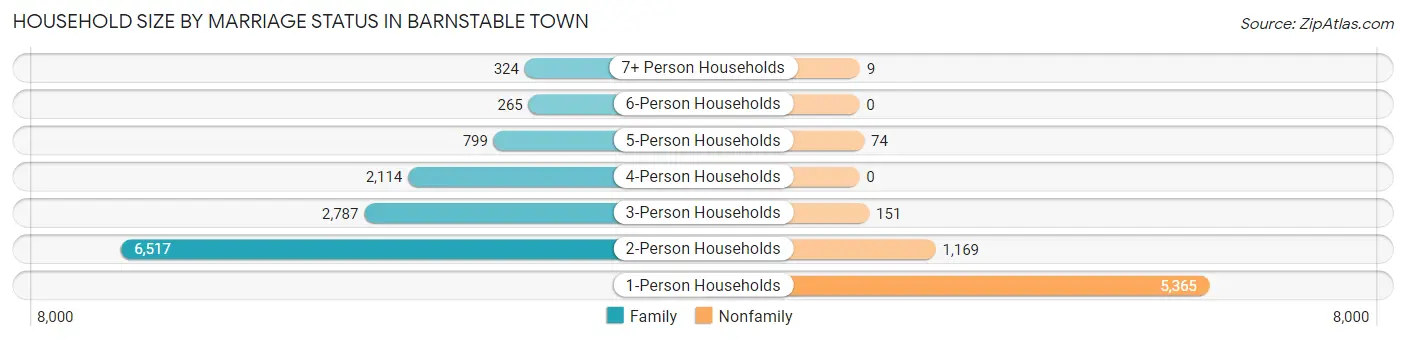
| Household Size | Family Households | Nonfamily Households |
| 1-Person Households | - | 5,365 (27.4%) |
| 2-Person Households | 6,517 (33.3%) | 1,169 (6.0%) |
| 3-Person Households | 2,787 (14.2%) | 151 (0.8%) |
| 4-Person Households | 2,114 (10.8%) | 0 (0.0%) |
| 5-Person Households | 799 (4.1%) | 74 (0.4%) |
| 6-Person Households | 265 (1.3%) | 0 (0.0%) |
| 7+ Person Households | 324 (1.7%) | 9 (0.1%) |
| Total | 12,806 (65.4%) | 6,768 (34.6%) |
Female Fertility in Barnstable Town
Fertility by Age in Barnstable Town
Average fertility rate in Barnstable Town is 49.0 births per 1,000 women. Women in the age bracket of 20 to 34 years have the highest fertility rate with 82.0 births per 1,000 women. Women in the age bracket of 20 to 34 years acount for 71.0% of all women with births.
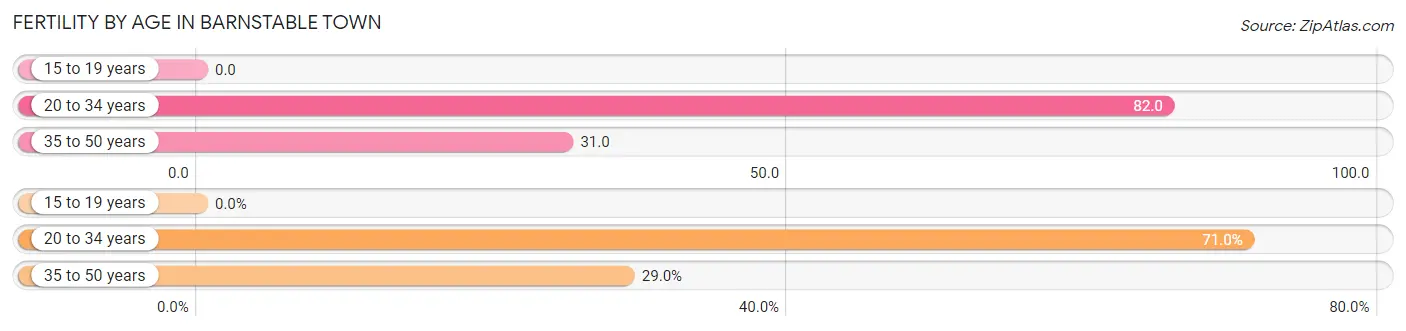
| Age Bracket | Women with Births | Births / 1,000 Women |
| 15 to 19 years | 0 (0.0%) | 0.0 |
| 20 to 34 years | 353 (71.0%) | 82.0 |
| 35 to 50 years | 144 (29.0%) | 31.0 |
| Total | 497 (100.0%) | 49.0 |
Fertility by Age by Marriage Status in Barnstable Town
79.5% of women with births (497) in Barnstable Town are married. The highest percentage of unmarried women with births falls into 20 to 34 years age bracket with 26.1% of them unmarried at the time of birth, while the lowest percentage of unmarried women with births belong to 35 to 50 years age bracket with 6.9% of them unmarried.
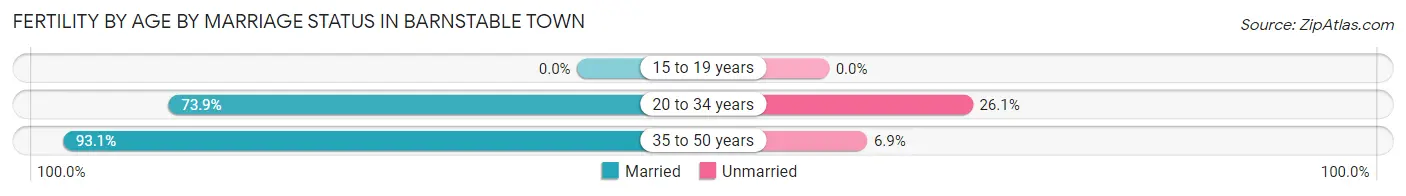
| Age Bracket | Married | Unmarried |
| 15 to 19 years | 0 (0.0%) | 0 (0.0%) |
| 20 to 34 years | 261 (73.9%) | 92 (26.1%) |
| 35 to 50 years | 134 (93.1%) | 10 (6.9%) |
| Total | 395 (79.5%) | 102 (20.5%) |
Fertility by Education in Barnstable Town
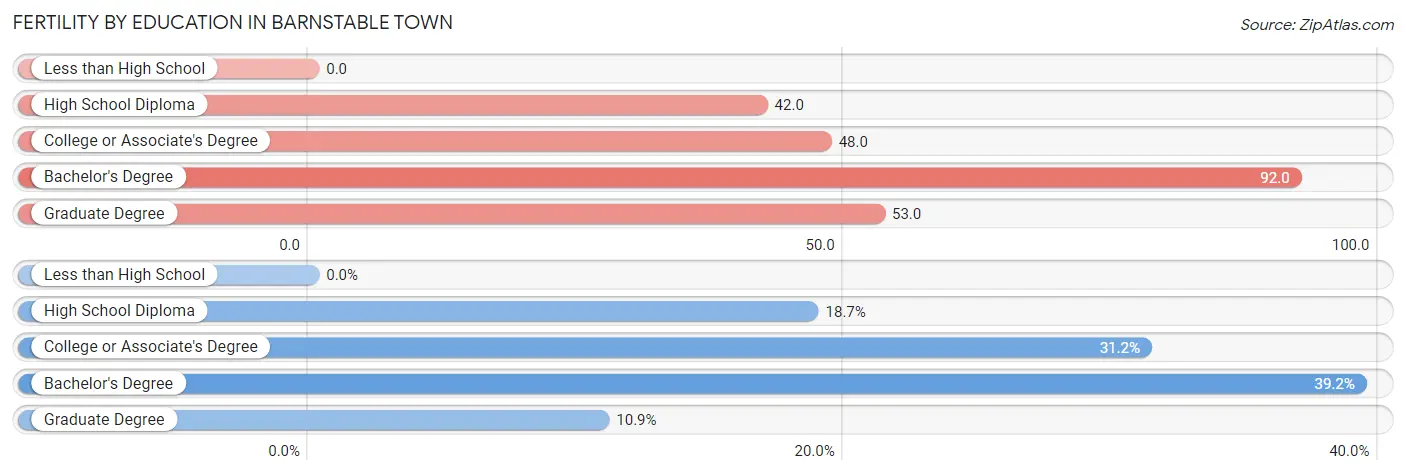
| Educational Attainment | Women with Births | Births / 1,000 Women |
| Less than High School | 0 (0.0%) | 0.0 |
| High School Diploma | 93 (18.7%) | 42.0 |
| College or Associate's Degree | 155 (31.2%) | 48.0 |
| Bachelor's Degree | 195 (39.2%) | 92.0 |
| Graduate Degree | 54 (10.9%) | 53.0 |
| Total | 497 (100.0%) | 49.0 |
Fertility by Education by Marriage Status in Barnstable Town
20.5% of women with births in Barnstable Town are unmarried. Women with the educational attainment of graduate degree are most likely to be married with 100.0% of them married at childbirth, while women with the educational attainment of bachelor's degree are least likely to be married with 34.9% of them unmarried at childbirth.
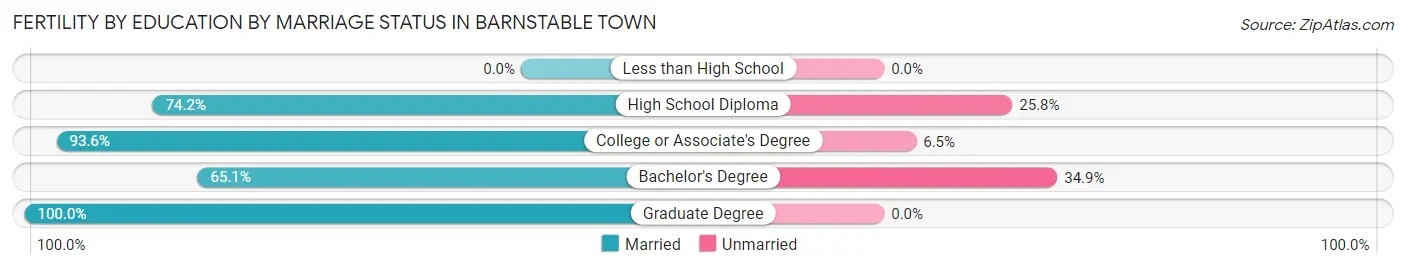
| Educational Attainment | Married | Unmarried |
| Less than High School | 0 (0.0%) | 0 (0.0%) |
| High School Diploma | 69 (74.2%) | 24 (25.8%) |
| College or Associate's Degree | 145 (93.5%) | 10 (6.5%) |
| Bachelor's Degree | 127 (65.1%) | 68 (34.9%) |
| Graduate Degree | 54 (100.0%) | 0 (0.0%) |
| Total | 395 (79.5%) | 102 (20.5%) |
Employment Characteristics in Barnstable Town
Employment by Class of Employer in Barnstable Town
Among the 26,306 employed individuals in Barnstable Town, private company employees (16,673 | 63.4%), not-for-profit organizations (3,351 | 12.7%), and local government employees (1,983 | 7.5%) make up the most common classes of employment.
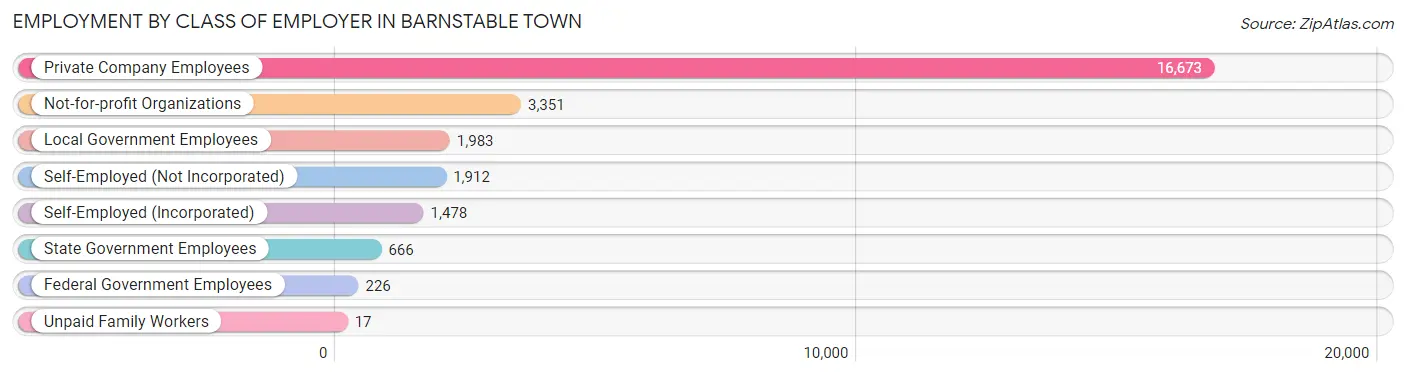
| Employer Class | # Employees | % Employees |
| Private Company Employees | 16,673 | 63.4% |
| Self-Employed (Incorporated) | 1,478 | 5.6% |
| Self-Employed (Not Incorporated) | 1,912 | 7.3% |
| Not-for-profit Organizations | 3,351 | 12.7% |
| Local Government Employees | 1,983 | 7.5% |
| State Government Employees | 666 | 2.5% |
| Federal Government Employees | 226 | 0.9% |
| Unpaid Family Workers | 17 | 0.1% |
| Total | 26,306 | 100.0% |
Employment Status by Age in Barnstable Town
According to the labor force statistics for Barnstable Town, out of the total population over 16 years of age (41,523), 67.6% or 28,070 individuals are in the labor force, with 3.1% or 870 of them unemployed. The age group with the highest labor force participation rate is 25 to 29 years, with 90.9% or 2,829 individuals in the labor force. Within the labor force, the 16 to 19 years age range has the highest percentage of unemployed individuals, with 8.1% or 63 of them being unemployed.
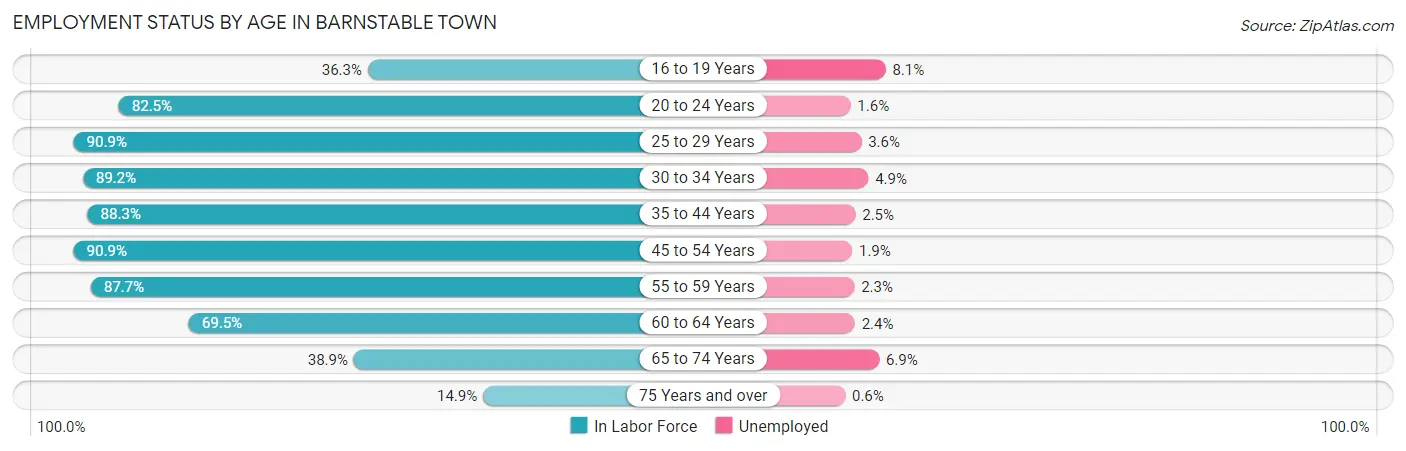
| Age Bracket | In Labor Force | Unemployed |
| 16 to 19 Years | 780 (36.3%) | 63 (8.1%) |
| 20 to 24 Years | 2,267 (82.5%) | 36 (1.6%) |
| 25 to 29 Years | 2,829 (90.9%) | 102 (3.6%) |
| 30 to 34 Years | 2,089 (89.2%) | 102 (4.9%) |
| 35 to 44 Years | 5,101 (88.3%) | 128 (2.5%) |
| 45 to 54 Years | 5,341 (90.9%) | 101 (1.9%) |
| 55 to 59 Years | 3,588 (87.7%) | 83 (2.3%) |
| 60 to 64 Years | 2,750 (69.5%) | 66 (2.4%) |
| 65 to 74 Years | 2,613 (38.9%) | 180 (6.9%) |
| 75 Years and over | 709 (14.9%) | 4 (0.6%) |
| Total | 28,070 (67.6%) | 870 (3.1%) |
Employment Status by Educational Attainment in Barnstable Town
According to labor force statistics for Barnstable Town, 86.2% of individuals (21,684) out of the total population between 25 and 64 years of age (25,155) are in the labor force, with 2.7% or 585 of them being unemployed. The group with the highest labor force participation rate are those with the educational attainment of bachelor's degree or higher, with 89.7% or 8,286 individuals in the labor force. Within the labor force, individuals with college / associate degree education have the highest percentage of unemployment, with 4.0% or 252 of them being unemployed.
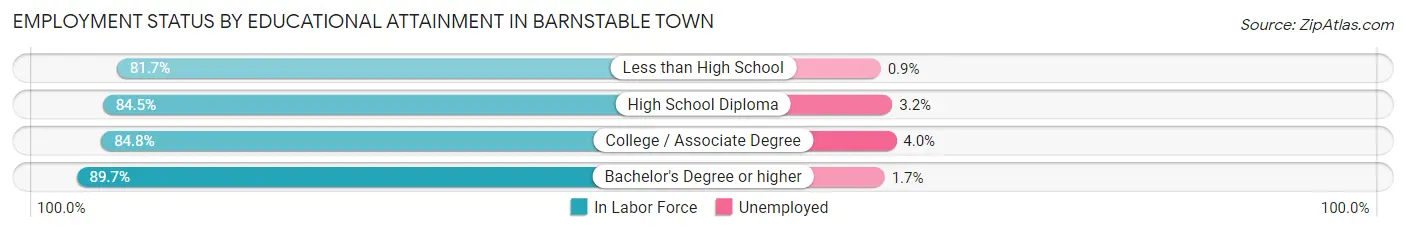
| Educational Attainment | In Labor Force | Unemployed |
| Less than High School | 1,739 (81.7%) | 19 (0.9%) |
| High School Diploma | 5,362 (84.5%) | 203 (3.2%) |
| College / Associate Degree | 6,312 (84.8%) | 298 (4.0%) |
| Bachelor's Degree or higher | 8,286 (89.7%) | 157 (1.7%) |
| Total | 21,684 (86.2%) | 679 (2.7%) |
Employment Occupations by Sex in Barnstable Town
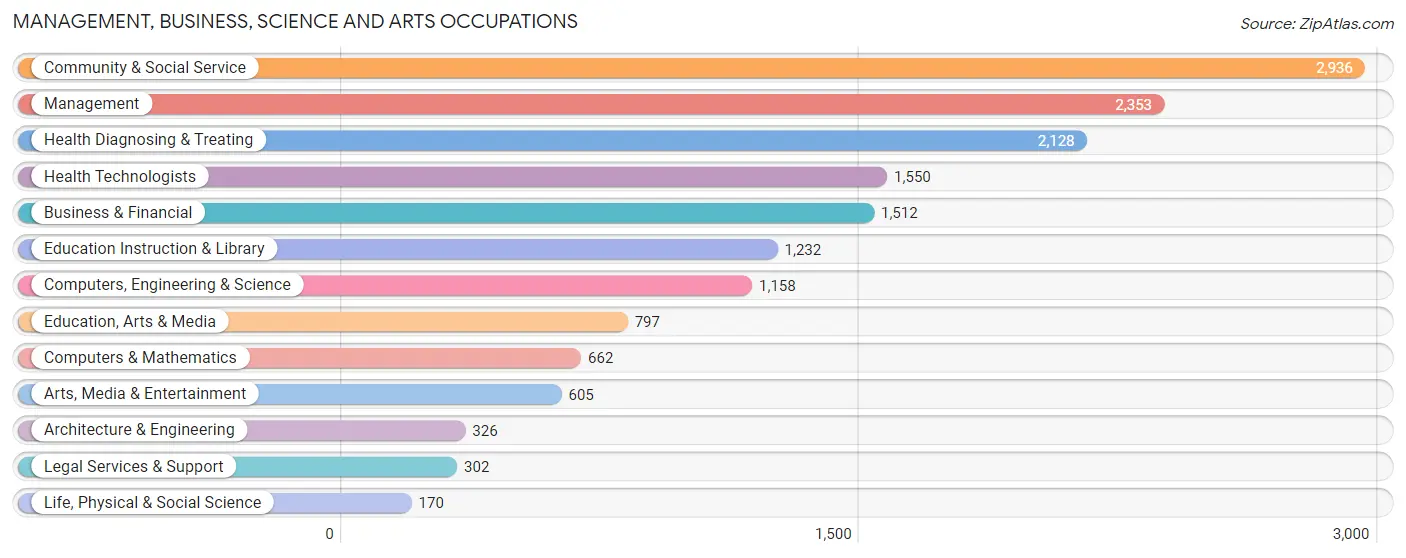
Management, Business, Science and Arts Occupations
The most common Management, Business, Science and Arts occupations in Barnstable Town are Community & Social Service (2,936 | 10.8%), Management (2,353 | 8.7%), Health Diagnosing & Treating (2,128 | 7.8%), Health Technologists (1,550 | 5.7%), and Business & Financial (1,512 | 5.6%).
Management, Business, Science and Arts Occupations by Sex
Within the Management, Business, Science and Arts occupations in Barnstable Town, the most male-oriented occupations are Architecture & Engineering (89.3%), Computers, Engineering & Science (81.3%), and Life, Physical & Social Science (80.0%), while the most female-oriented occupations are Health Technologists (83.6%), Health Diagnosing & Treating (76.1%), and Education Instruction & Library (67.9%).
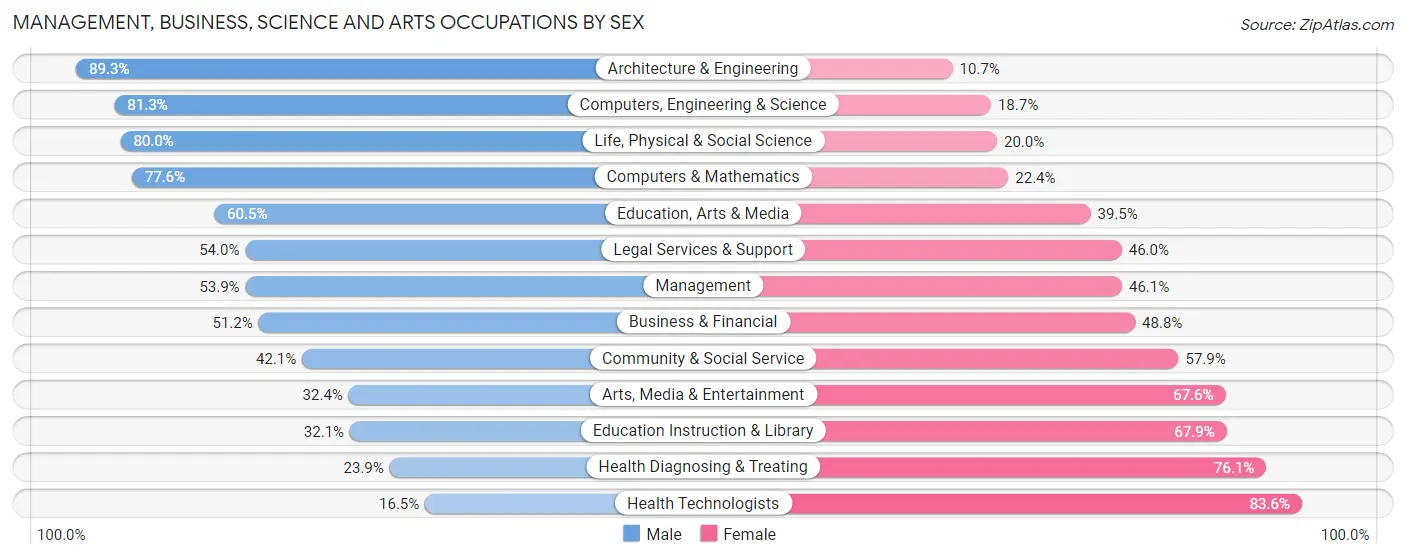
| Occupation | Male | Female |
| Management | 1,269 (53.9%) | 1,084 (46.1%) |
| Business & Financial | 774 (51.2%) | 738 (48.8%) |
| Computers, Engineering & Science | 941 (81.3%) | 217 (18.7%) |
| Computers & Mathematics | 514 (77.6%) | 148 (22.4%) |
| Architecture & Engineering | 291 (89.3%) | 35 (10.7%) |
| Life, Physical & Social Science | 136 (80.0%) | 34 (20.0%) |
| Community & Social Service | 1,237 (42.1%) | 1,699 (57.9%) |
| Education, Arts & Media | 482 (60.5%) | 315 (39.5%) |
| Legal Services & Support | 163 (54.0%) | 139 (46.0%) |
| Education Instruction & Library | 396 (32.1%) | 836 (67.9%) |
| Arts, Media & Entertainment | 196 (32.4%) | 409 (67.6%) |
| Health Diagnosing & Treating | 508 (23.9%) | 1,620 (76.1%) |
| Health Technologists | 255 (16.5%) | 1,295 (83.6%) |
| Total (Category) | 4,729 (46.9%) | 5,358 (53.1%) |
| Total (Overall) | 13,845 (51.0%) | 13,319 (49.0%) |
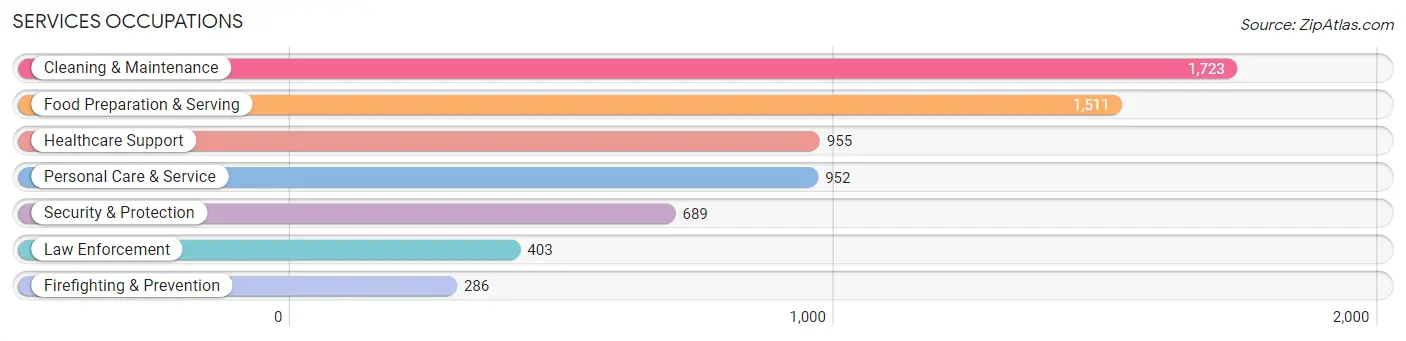
Services Occupations
The most common Services occupations in Barnstable Town are Cleaning & Maintenance (1,723 | 6.3%), Food Preparation & Serving (1,511 | 5.6%), Healthcare Support (955 | 3.5%), Personal Care & Service (952 | 3.5%), and Security & Protection (689 | 2.5%).
Services Occupations by Sex
Within the Services occupations in Barnstable Town, the most male-oriented occupations are Law Enforcement (89.3%), Security & Protection (84.5%), and Firefighting & Prevention (77.6%), while the most female-oriented occupations are Healthcare Support (94.1%), Personal Care & Service (67.2%), and Cleaning & Maintenance (47.4%).
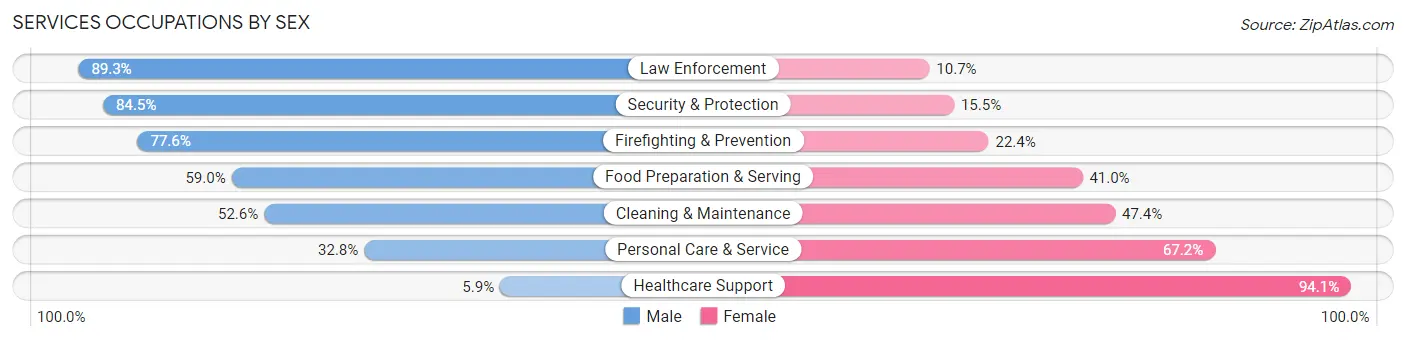
| Occupation | Male | Female |
| Healthcare Support | 56 (5.9%) | 899 (94.1%) |
| Security & Protection | 582 (84.5%) | 107 (15.5%) |
| Firefighting & Prevention | 222 (77.6%) | 64 (22.4%) |
| Law Enforcement | 360 (89.3%) | 43 (10.7%) |
| Food Preparation & Serving | 892 (59.0%) | 619 (41.0%) |
| Cleaning & Maintenance | 906 (52.6%) | 817 (47.4%) |
| Personal Care & Service | 312 (32.8%) | 640 (67.2%) |
| Total (Category) | 2,748 (47.1%) | 3,082 (52.9%) |
| Total (Overall) | 13,845 (51.0%) | 13,319 (49.0%) |
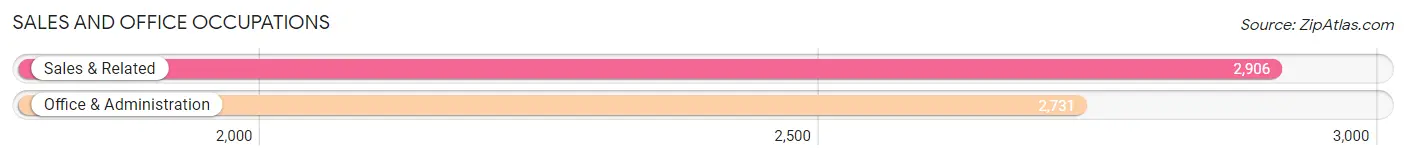
Sales and Office Occupations
The most common Sales and Office occupations in Barnstable Town are Sales & Related (2,906 | 10.7%), and Office & Administration (2,731 | 10.1%).
Sales and Office Occupations by Sex
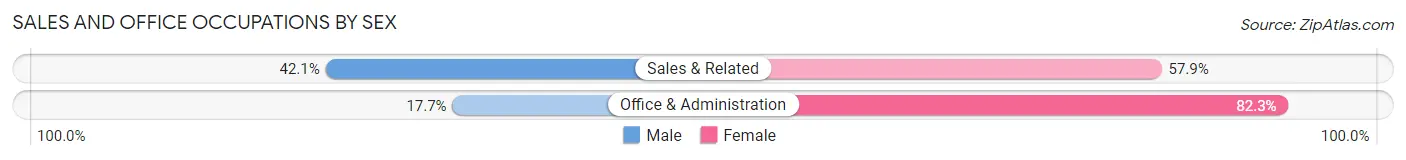
| Occupation | Male | Female |
| Sales & Related | 1,224 (42.1%) | 1,682 (57.9%) |
| Office & Administration | 484 (17.7%) | 2,247 (82.3%) |
| Total (Category) | 1,708 (30.3%) | 3,929 (69.7%) |
| Total (Overall) | 13,845 (51.0%) | 13,319 (49.0%) |
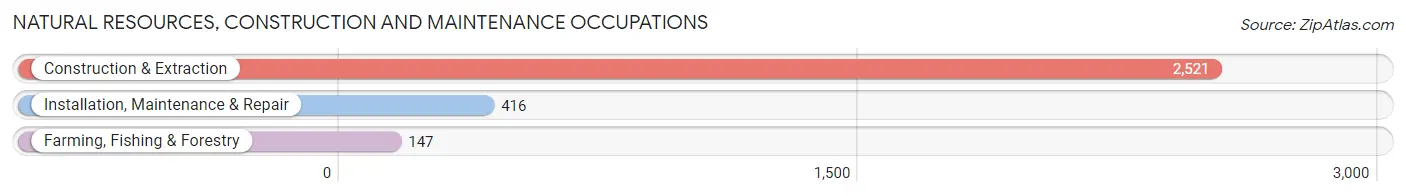
Natural Resources, Construction and Maintenance Occupations
The most common Natural Resources, Construction and Maintenance occupations in Barnstable Town are Construction & Extraction (2,521 | 9.3%), Installation, Maintenance & Repair (416 | 1.5%), and Farming, Fishing & Forestry (147 | 0.5%).
Natural Resources, Construction and Maintenance Occupations by Sex
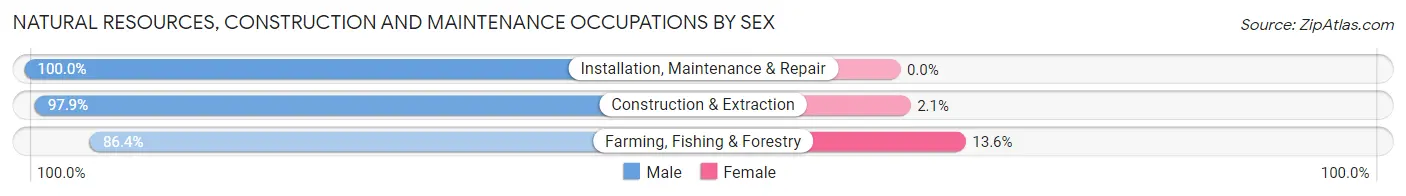
| Occupation | Male | Female |
| Farming, Fishing & Forestry | 127 (86.4%) | 20 (13.6%) |
| Construction & Extraction | 2,467 (97.9%) | 54 (2.1%) |
| Installation, Maintenance & Repair | 416 (100.0%) | 0 (0.0%) |
| Total (Category) | 3,010 (97.6%) | 74 (2.4%) |
| Total (Overall) | 13,845 (51.0%) | 13,319 (49.0%) |
Production, Transportation and Moving Occupations
The most common Production, Transportation and Moving occupations in Barnstable Town are Production (1,044 | 3.8%), Transportation (832 | 3.1%), and Material Moving (650 | 2.4%).
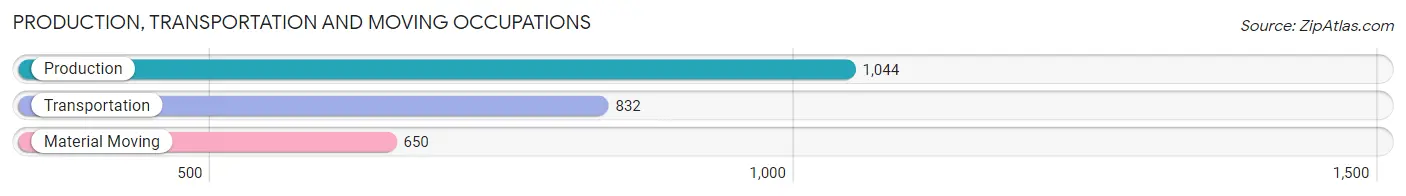
Production, Transportation and Moving Occupations by Sex
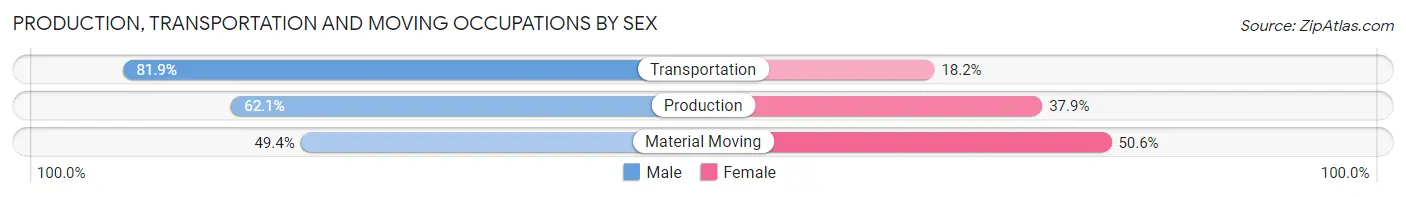
| Occupation | Male | Female |
| Production | 648 (62.1%) | 396 (37.9%) |
| Transportation | 681 (81.9%) | 151 (18.1%) |
| Material Moving | 321 (49.4%) | 329 (50.6%) |
| Total (Category) | 1,650 (65.3%) | 876 (34.7%) |
| Total (Overall) | 13,845 (51.0%) | 13,319 (49.0%) |
Employment Industries by Sex in Barnstable Town
Employment Industries in Barnstable Town
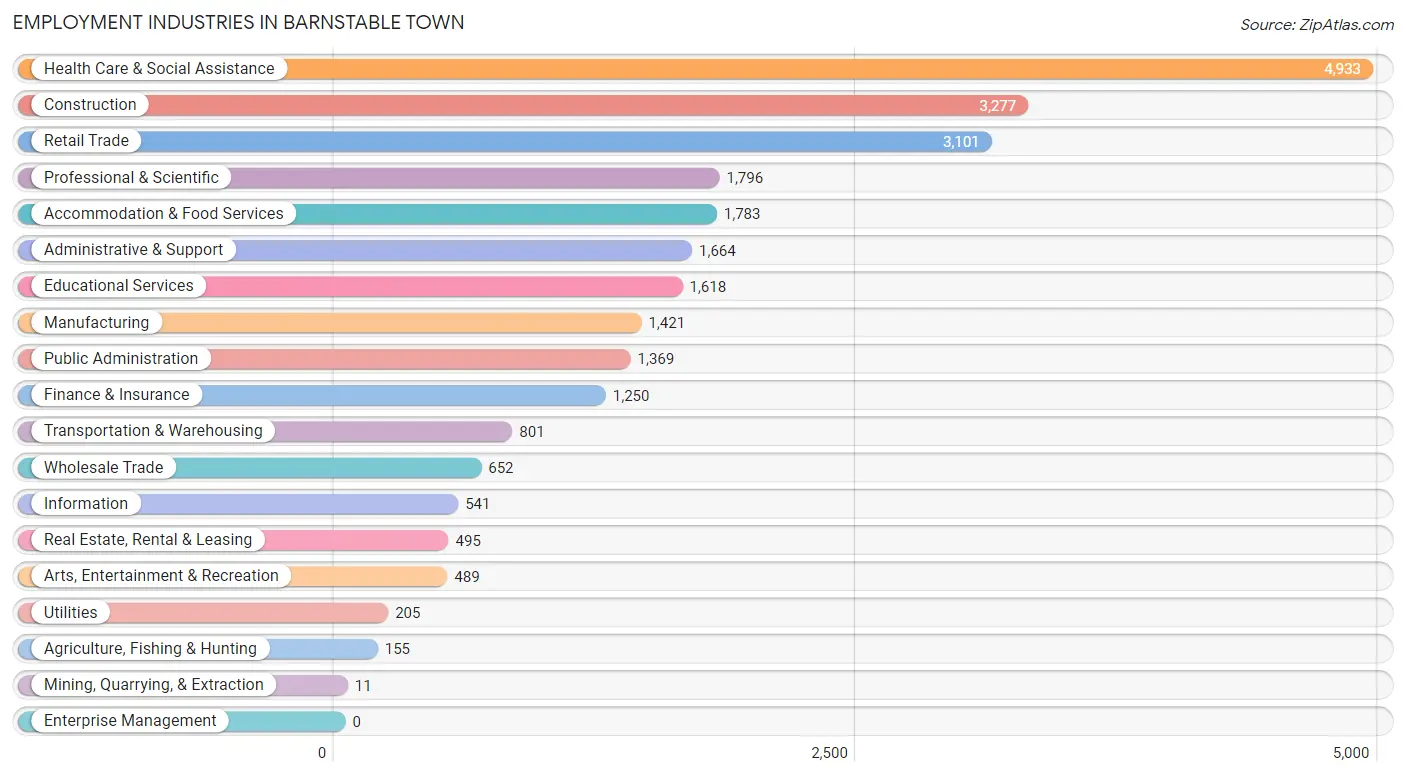
The major employment industries in Barnstable Town include Health Care & Social Assistance (4,933 | 18.2%), Construction (3,277 | 12.1%), Retail Trade (3,101 | 11.4%), Professional & Scientific (1,796 | 6.6%), and Accommodation & Food Services (1,783 | 6.6%).
Employment Industries by Sex in Barnstable Town
The Barnstable Town industries that see more men than women are Mining, Quarrying, & Extraction (100.0%), Utilities (100.0%), and Construction (86.2%), whereas the industries that tend to have a higher number of women are Real Estate, Rental & Leasing (77.4%), Health Care & Social Assistance (76.2%), and Educational Services (64.3%).
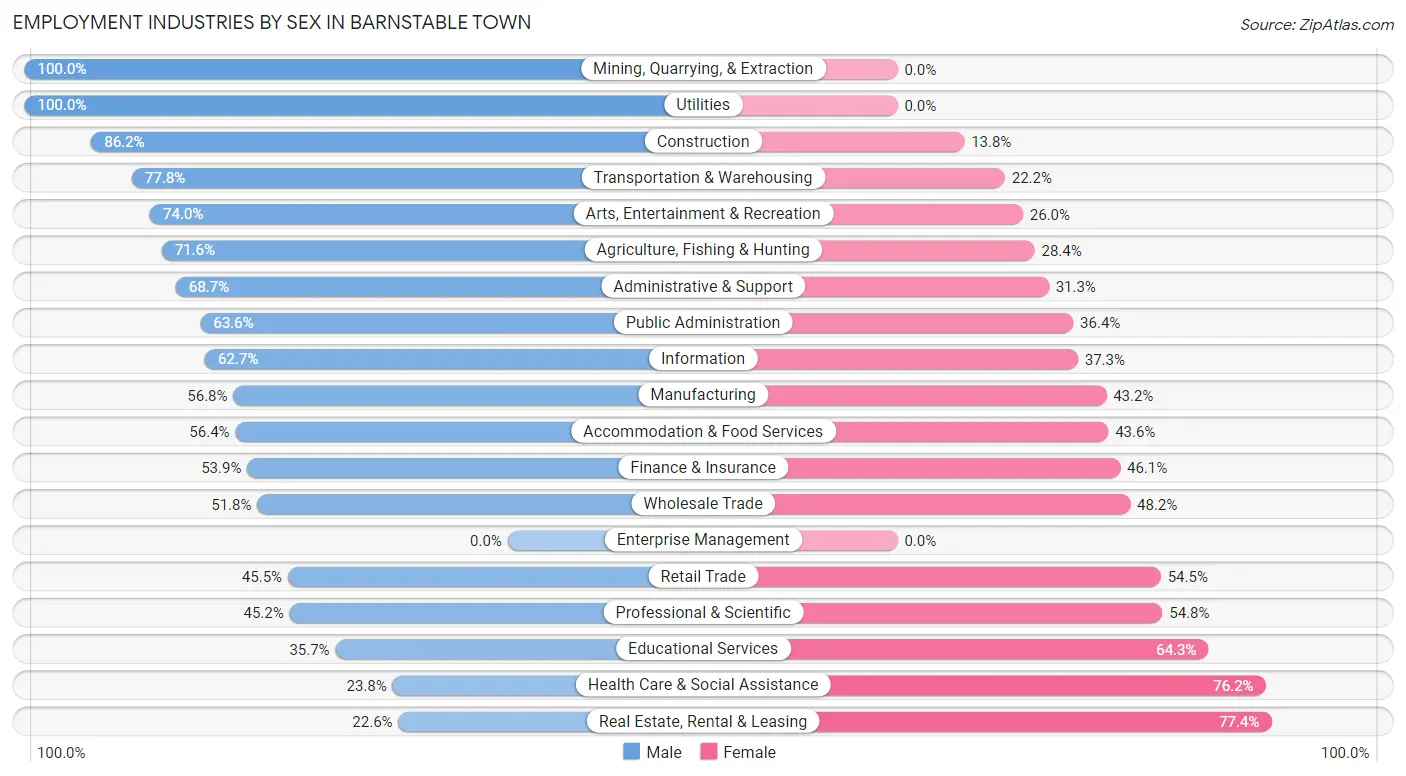
| Industry | Male | Female |
| Agriculture, Fishing & Hunting | 111 (71.6%) | 44 (28.4%) |
| Mining, Quarrying, & Extraction | 11 (100.0%) | 0 (0.0%) |
| Construction | 2,824 (86.2%) | 453 (13.8%) |
| Manufacturing | 807 (56.8%) | 614 (43.2%) |
| Wholesale Trade | 338 (51.8%) | 314 (48.2%) |
| Retail Trade | 1,411 (45.5%) | 1,690 (54.5%) |
| Transportation & Warehousing | 623 (77.8%) | 178 (22.2%) |
| Utilities | 205 (100.0%) | 0 (0.0%) |
| Information | 339 (62.7%) | 202 (37.3%) |
| Finance & Insurance | 674 (53.9%) | 576 (46.1%) |
| Real Estate, Rental & Leasing | 112 (22.6%) | 383 (77.4%) |
| Professional & Scientific | 811 (45.2%) | 985 (54.8%) |
| Enterprise Management | 0 (0.0%) | 0 (0.0%) |
| Administrative & Support | 1,143 (68.7%) | 521 (31.3%) |
| Educational Services | 577 (35.7%) | 1,041 (64.3%) |
| Health Care & Social Assistance | 1,176 (23.8%) | 3,757 (76.2%) |
| Arts, Entertainment & Recreation | 362 (74.0%) | 127 (26.0%) |
| Accommodation & Food Services | 1,005 (56.4%) | 778 (43.6%) |
| Public Administration | 871 (63.6%) | 498 (36.4%) |
| Total | 13,845 (51.0%) | 13,319 (49.0%) |
Education in Barnstable Town
School Enrollment in Barnstable Town
The most common levels of schooling among the 9,440 students in Barnstable Town are middle school (2,152 | 22.8%), high school (2,118 | 22.4%), and college / undergraduate (1,970 | 20.9%).
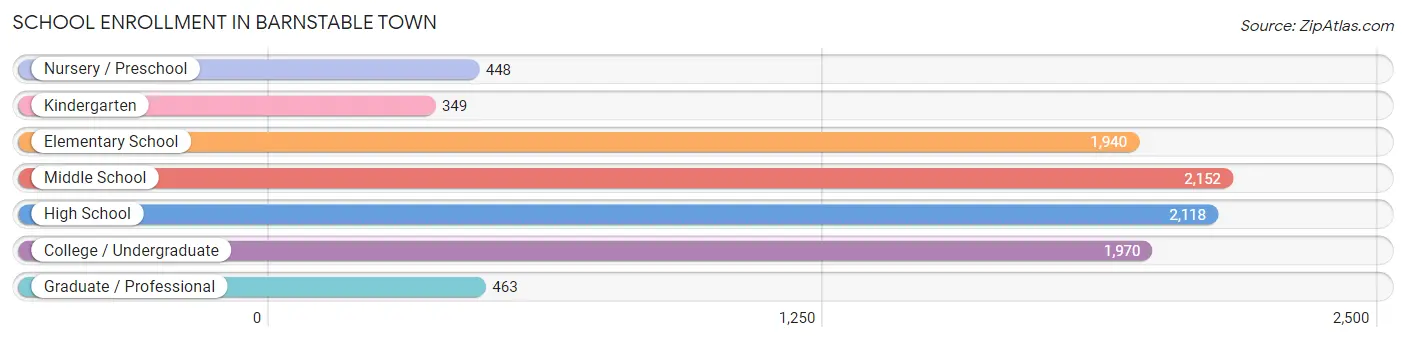
| School Level | # Students | % Students |
| Nursery / Preschool | 448 | 4.8% |
| Kindergarten | 349 | 3.7% |
| Elementary School | 1,940 | 20.5% |
| Middle School | 2,152 | 22.8% |
| High School | 2,118 | 22.4% |
| College / Undergraduate | 1,970 | 20.9% |
| Graduate / Professional | 463 | 4.9% |
| Total | 9,440 | 100.0% |
School Enrollment by Age by Funding Source in Barnstable Town
Out of a total of 9,440 students who are enrolled in schools in Barnstable Town, 1,624 (17.2%) attend a private institution, while the remaining 7,816 (82.8%) are enrolled in public schools. The age group of 20 to 24 year olds has the highest likelihood of being enrolled in private schools, with 212 (23.6% in the age bracket) enrolled. Conversely, the age group of 5 to 9 year old has the lowest likelihood of being enrolled in a private school, with 1,699 (91.2% in the age bracket) attending a public institution.
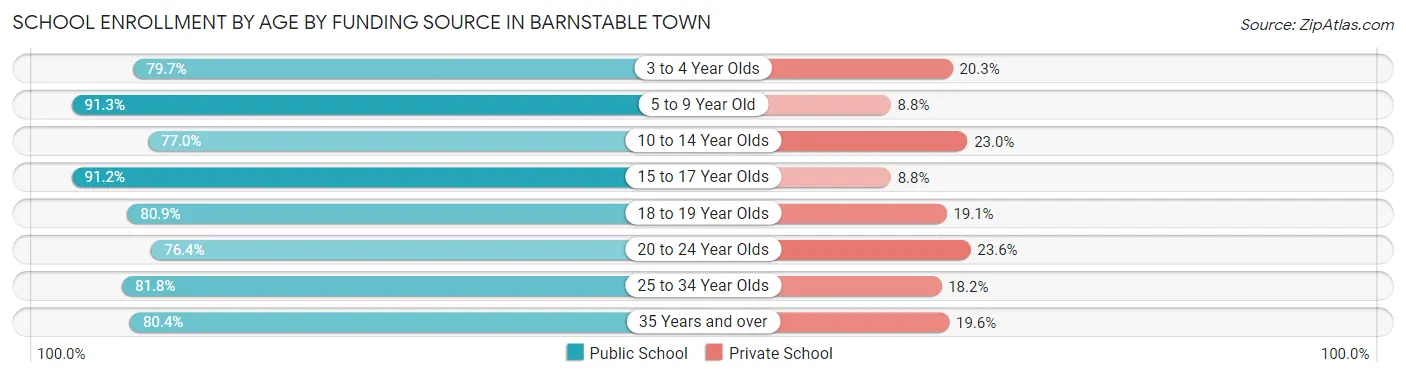
| Age Bracket | Public School | Private School |
| 3 to 4 Year Olds | 295 (79.7%) | 75 (20.3%) |
| 5 to 9 Year Old | 1,699 (91.2%) | 163 (8.7%) |
| 10 to 14 Year Olds | 2,158 (77.0%) | 645 (23.0%) |
| 15 to 17 Year Olds | 1,206 (91.2%) | 116 (8.8%) |
| 18 to 19 Year Olds | 642 (80.9%) | 152 (19.1%) |
| 20 to 24 Year Olds | 686 (76.4%) | 212 (23.6%) |
| 25 to 34 Year Olds | 563 (81.8%) | 125 (18.2%) |
| 35 Years and over | 565 (80.4%) | 138 (19.6%) |
| Total | 7,816 (82.8%) | 1,624 (17.2%) |
Educational Attainment by Field of Study in Barnstable Town
Business (2,350 | 15.0%), education (1,849 | 11.8%), science & technology (1,710 | 10.9%), social sciences (1,687 | 10.7%), and arts & humanities (1,146 | 7.3%) are the most common fields of study among 15,706 individuals in Barnstable Town who have obtained a bachelor's degree or higher.
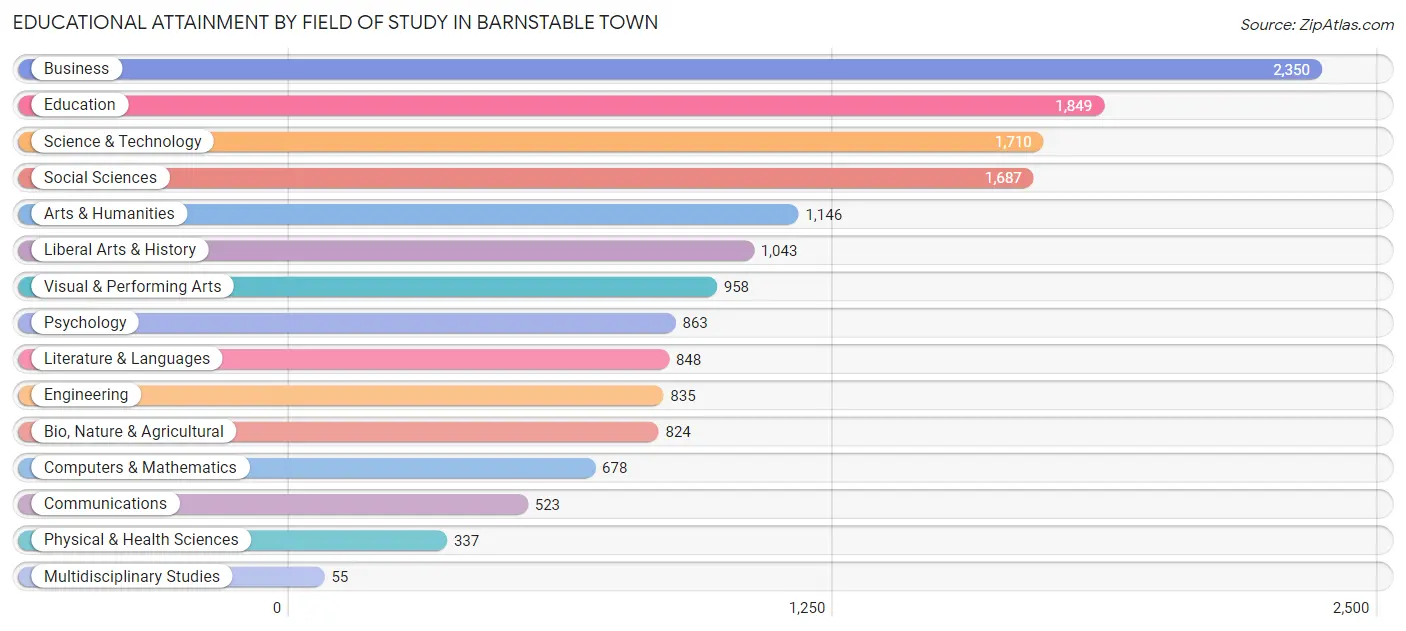
| Field of Study | # Graduates | % Graduates |
| Computers & Mathematics | 678 | 4.3% |
| Bio, Nature & Agricultural | 824 | 5.2% |
| Physical & Health Sciences | 337 | 2.1% |
| Psychology | 863 | 5.5% |
| Social Sciences | 1,687 | 10.7% |
| Engineering | 835 | 5.3% |
| Multidisciplinary Studies | 55 | 0.4% |
| Science & Technology | 1,710 | 10.9% |
| Business | 2,350 | 15.0% |
| Education | 1,849 | 11.8% |
| Literature & Languages | 848 | 5.4% |
| Liberal Arts & History | 1,043 | 6.6% |
| Visual & Performing Arts | 958 | 6.1% |
| Communications | 523 | 3.3% |
| Arts & Humanities | 1,146 | 7.3% |
| Total | 15,706 | 100.0% |
Transportation & Commute in Barnstable Town
Vehicle Availability by Sex in Barnstable Town
The most prevalent vehicle ownership categories in Barnstable Town are males with 2 vehicles (5,293, accounting for 39.4%) and females with 2 vehicles (4,449, making up 41.8%).
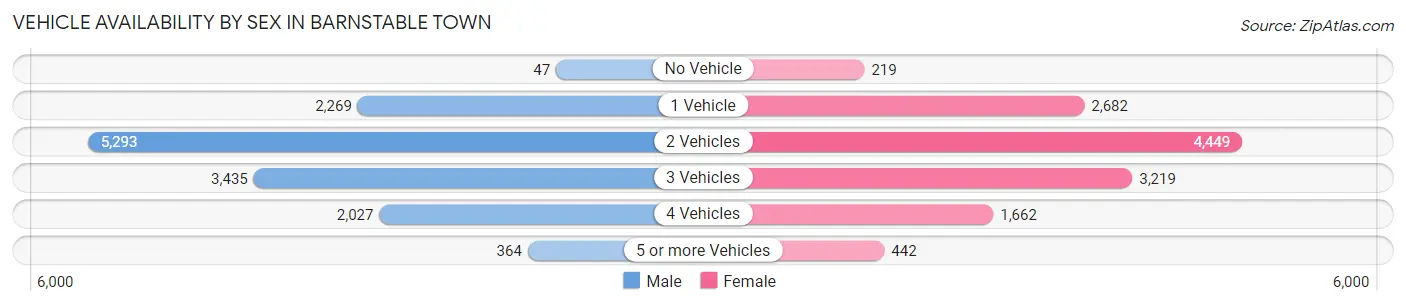
| Vehicles Available | Male | Female |
| No Vehicle | 47 (0.4%) | 219 (1.7%) |
| 1 Vehicle | 2,269 (16.9%) | 2,682 (21.2%) |
| 2 Vehicles | 5,293 (39.4%) | 4,449 (35.1%) |
| 3 Vehicles | 3,435 (25.6%) | 3,219 (25.4%) |
| 4 Vehicles | 2,027 (15.1%) | 1,662 (13.1%) |
| 5 or more Vehicles | 364 (2.7%) | 442 (3.5%) |
| Total | 13,435 (100.0%) | 12,673 (100.0%) |
Commute Time in Barnstable Town
The most frequently occuring commute durations in Barnstable Town are 15 to 19 minutes (4,536 commuters, 19.2%), 10 to 14 minutes (4,037 commuters, 17.1%), and 5 to 9 minutes (3,573 commuters, 15.1%).
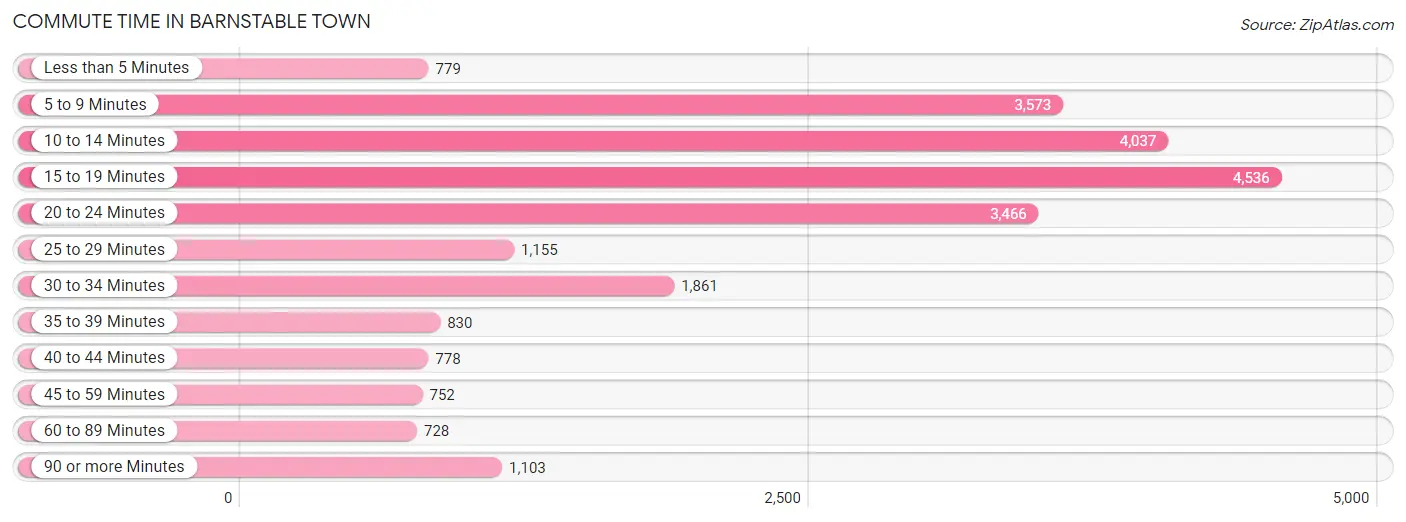
| Commute Time | # Commuters | % Commuters |
| Less than 5 Minutes | 779 | 3.3% |
| 5 to 9 Minutes | 3,573 | 15.1% |
| 10 to 14 Minutes | 4,037 | 17.1% |
| 15 to 19 Minutes | 4,536 | 19.2% |
| 20 to 24 Minutes | 3,466 | 14.7% |
| 25 to 29 Minutes | 1,155 | 4.9% |
| 30 to 34 Minutes | 1,861 | 7.9% |
| 35 to 39 Minutes | 830 | 3.5% |
| 40 to 44 Minutes | 778 | 3.3% |
| 45 to 59 Minutes | 752 | 3.2% |
| 60 to 89 Minutes | 728 | 3.1% |
| 90 or more Minutes | 1,103 | 4.7% |
Commute Time by Sex in Barnstable Town
The most common commute times in Barnstable Town are 15 to 19 minutes (2,320 commuters, 18.6%) for males and 15 to 19 minutes (2,216 commuters, 19.9%) for females.
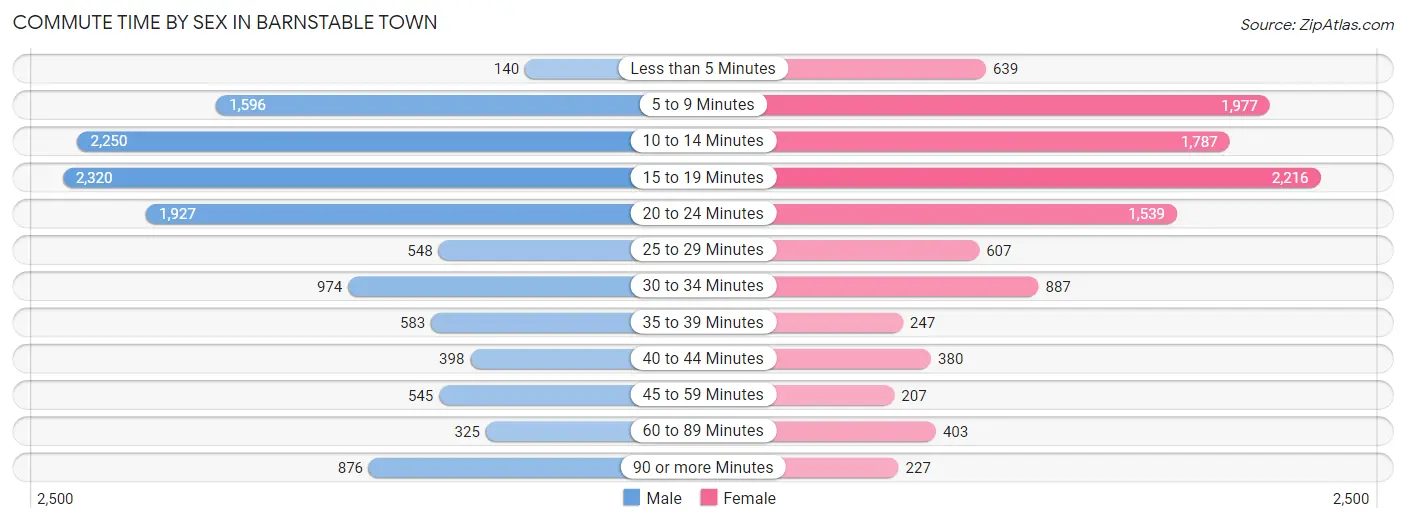
| Commute Time | Male | Female |
| Less than 5 Minutes | 140 (1.1%) | 639 (5.8%) |
| 5 to 9 Minutes | 1,596 (12.8%) | 1,977 (17.8%) |
| 10 to 14 Minutes | 2,250 (18.0%) | 1,787 (16.1%) |
| 15 to 19 Minutes | 2,320 (18.6%) | 2,216 (19.9%) |
| 20 to 24 Minutes | 1,927 (15.4%) | 1,539 (13.8%) |
| 25 to 29 Minutes | 548 (4.4%) | 607 (5.5%) |
| 30 to 34 Minutes | 974 (7.8%) | 887 (8.0%) |
| 35 to 39 Minutes | 583 (4.7%) | 247 (2.2%) |
| 40 to 44 Minutes | 398 (3.2%) | 380 (3.4%) |
| 45 to 59 Minutes | 545 (4.4%) | 207 (1.9%) |
| 60 to 89 Minutes | 325 (2.6%) | 403 (3.6%) |
| 90 or more Minutes | 876 (7.0%) | 227 (2.0%) |
Time of Departure to Work by Sex in Barnstable Town
The most frequent times of departure to work in Barnstable Town are 7:00 AM to 7:29 AM (2,192, 17.6%) for males and 8:00 AM to 8:29 AM (2,213, 19.9%) for females.
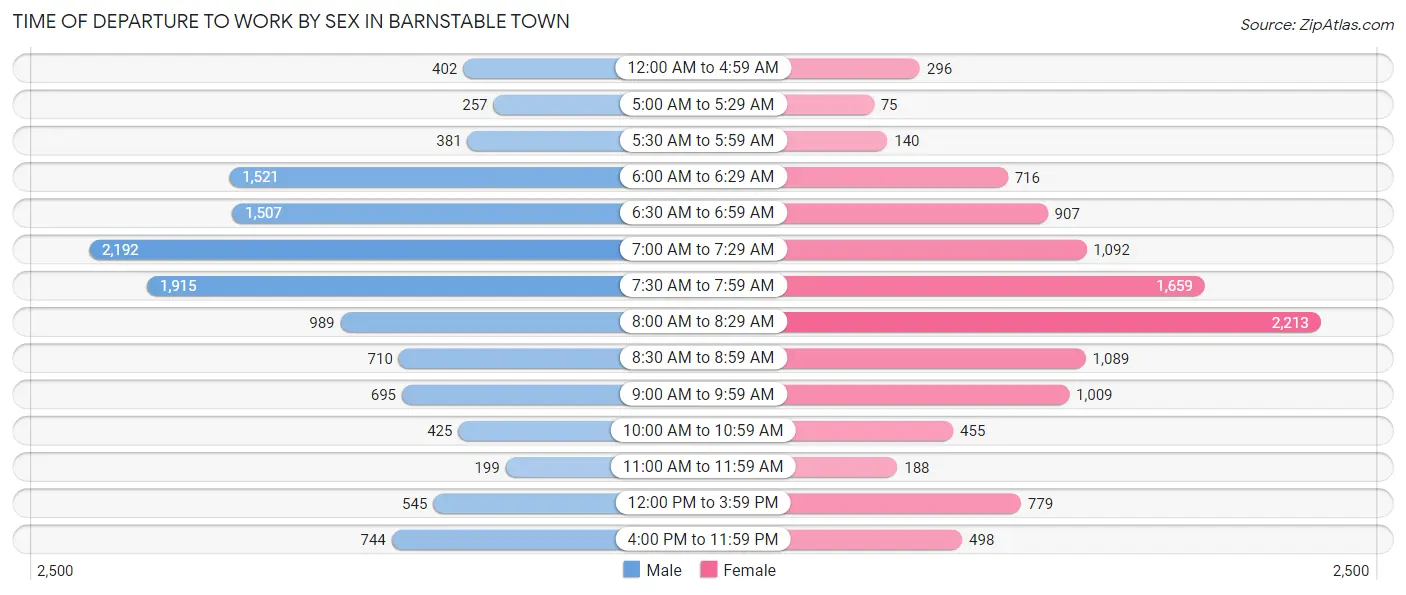
| Time of Departure | Male | Female |
| 12:00 AM to 4:59 AM | 402 (3.2%) | 296 (2.7%) |
| 5:00 AM to 5:29 AM | 257 (2.1%) | 75 (0.7%) |
| 5:30 AM to 5:59 AM | 381 (3.0%) | 140 (1.3%) |
| 6:00 AM to 6:29 AM | 1,521 (12.2%) | 716 (6.4%) |
| 6:30 AM to 6:59 AM | 1,507 (12.1%) | 907 (8.2%) |
| 7:00 AM to 7:29 AM | 2,192 (17.6%) | 1,092 (9.8%) |
| 7:30 AM to 7:59 AM | 1,915 (15.3%) | 1,659 (14.9%) |
| 8:00 AM to 8:29 AM | 989 (7.9%) | 2,213 (19.9%) |
| 8:30 AM to 8:59 AM | 710 (5.7%) | 1,089 (9.8%) |
| 9:00 AM to 9:59 AM | 695 (5.6%) | 1,009 (9.1%) |
| 10:00 AM to 10:59 AM | 425 (3.4%) | 455 (4.1%) |
| 11:00 AM to 11:59 AM | 199 (1.6%) | 188 (1.7%) |
| 12:00 PM to 3:59 PM | 545 (4.4%) | 779 (7.0%) |
| 4:00 PM to 11:59 PM | 744 (6.0%) | 498 (4.5%) |
| Total | 12,482 (100.0%) | 11,116 (100.0%) |
Housing Occupancy in Barnstable Town
Occupancy by Ownership in Barnstable Town
Of the total 19,574 dwellings in Barnstable Town, owner-occupied units account for 14,801 (75.6%), while renter-occupied units make up 4,773 (24.4%).
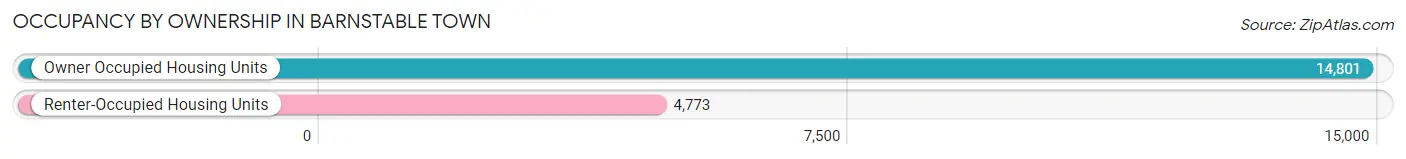
| Occupancy | # Housing Units | % Housing Units |
| Owner Occupied Housing Units | 14,801 | 75.6% |
| Renter-Occupied Housing Units | 4,773 | 24.4% |
| Total Occupied Housing Units | 19,574 | 100.0% |
Occupancy by Household Size in Barnstable Town
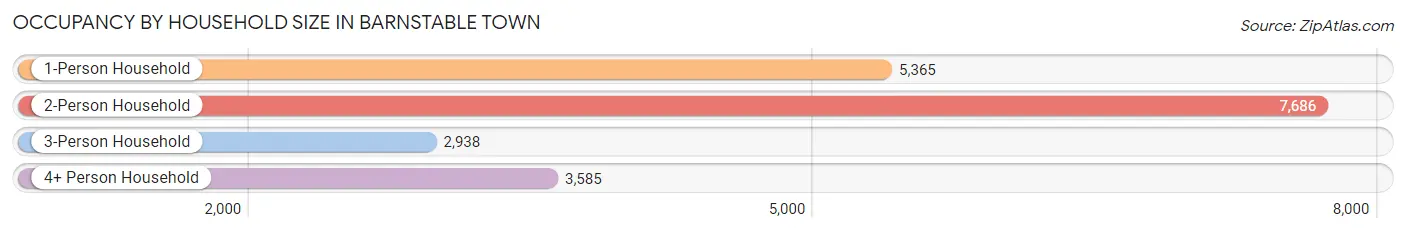
| Household Size | # Housing Units | % Housing Units |
| 1-Person Household | 5,365 | 27.4% |
| 2-Person Household | 7,686 | 39.3% |
| 3-Person Household | 2,938 | 15.0% |
| 4+ Person Household | 3,585 | 18.3% |
| Total Housing Units | 19,574 | 100.0% |
Occupancy by Ownership by Household Size in Barnstable Town
| Household Size | Owner-occupied | Renter-occupied |
| 1-Person Household | 3,815 (71.1%) | 1,550 (28.9%) |
| 2-Person Household | 6,375 (82.9%) | 1,311 (17.1%) |
| 3-Person Household | 2,021 (68.8%) | 917 (31.2%) |
| 4+ Person Household | 2,590 (72.3%) | 995 (27.8%) |
| Total Housing Units | 14,801 (75.6%) | 4,773 (24.4%) |
Occupancy by Educational Attainment in Barnstable Town
| Household Size | Owner-occupied | Renter-occupied |
| Less than High School | 283 (36.9%) | 483 (63.0%) |
| High School Diploma | 2,557 (62.2%) | 1,552 (37.8%) |
| College/Associate Degree | 4,495 (71.6%) | 1,781 (28.4%) |
| Bachelor's Degree or higher | 7,466 (88.6%) | 957 (11.4%) |
Occupancy by Age of Householder in Barnstable Town
| Age Bracket | # Households | % Households |
| Under 35 Years | 2,079 | 10.6% |
| 35 to 44 Years | 2,802 | 14.3% |
| 45 to 54 Years | 3,148 | 16.1% |
| 55 to 64 Years | 4,499 | 23.0% |
| 65 to 74 Years | 4,165 | 21.3% |
| 75 to 84 Years | 1,781 | 9.1% |
| 85 Years and Over | 1,100 | 5.6% |
| Total | 19,574 | 100.0% |
Housing Finances in Barnstable Town
Median Income by Occupancy in Barnstable Town
| Occupancy Type | # Households | Median Income |
| Owner-Occupied | 14,801 (75.6%) | $112,031 |
| Renter-Occupied | 4,773 (24.4%) | $50,352 |
| Average | 19,574 (100.0%) | $94,387 |
Occupancy by Householder Income Bracket in Barnstable Town
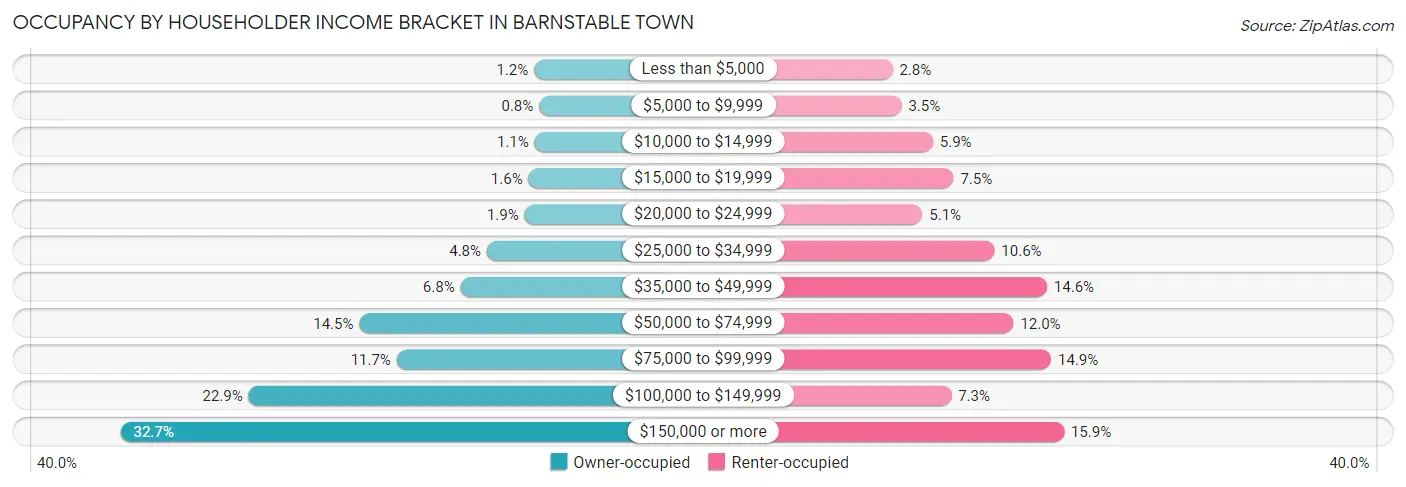
| Income Bracket | Owner-occupied | Renter-occupied |
| Less than $5,000 | 175 (1.2%) | 134 (2.8%) |
| $5,000 to $9,999 | 118 (0.8%) | 167 (3.5%) |
| $10,000 to $14,999 | 169 (1.1%) | 281 (5.9%) |
| $15,000 to $19,999 | 238 (1.6%) | 356 (7.5%) |
| $20,000 to $24,999 | 282 (1.9%) | 243 (5.1%) |
| $25,000 to $34,999 | 708 (4.8%) | 505 (10.6%) |
| $35,000 to $49,999 | 1,005 (6.8%) | 696 (14.6%) |
| $50,000 to $74,999 | 2,146 (14.5%) | 574 (12.0%) |
| $75,000 to $99,999 | 1,725 (11.7%) | 711 (14.9%) |
| $100,000 to $149,999 | 3,396 (22.9%) | 348 (7.3%) |
| $150,000 or more | 4,839 (32.7%) | 758 (15.9%) |
| Total | 14,801 (100.0%) | 4,773 (100.0%) |
Monthly Housing Cost Tiers in Barnstable Town
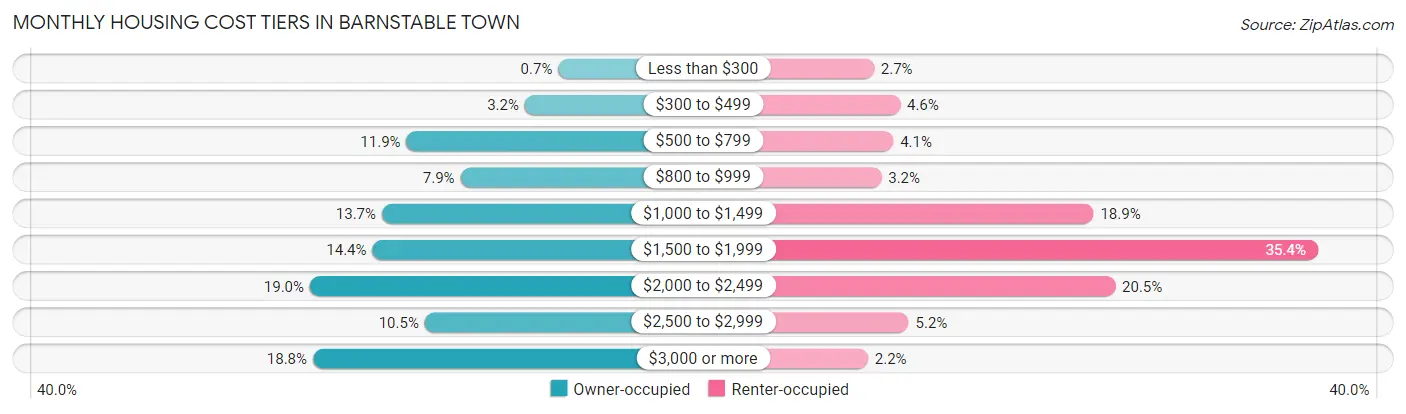
| Monthly Cost | Owner-occupied | Renter-occupied |
| Less than $300 | 103 (0.7%) | 128 (2.7%) |
| $300 to $499 | 468 (3.2%) | 220 (4.6%) |
| $500 to $799 | 1,758 (11.9%) | 196 (4.1%) |
| $800 to $999 | 1,169 (7.9%) | 154 (3.2%) |
| $1,000 to $1,499 | 2,026 (13.7%) | 900 (18.9%) |
| $1,500 to $1,999 | 2,130 (14.4%) | 1,688 (35.4%) |
| $2,000 to $2,499 | 2,811 (19.0%) | 976 (20.4%) |
| $2,500 to $2,999 | 1,558 (10.5%) | 250 (5.2%) |
| $3,000 or more | 2,778 (18.8%) | 107 (2.2%) |
| Total | 14,801 (100.0%) | 4,773 (100.0%) |
Physical Housing Characteristics in Barnstable Town
Housing Structures in Barnstable Town
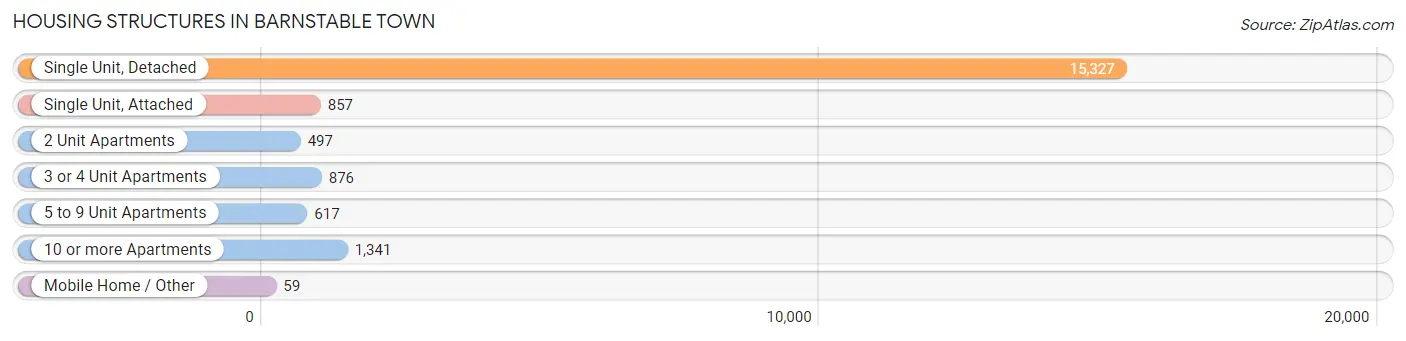
| Structure Type | # Housing Units | % Housing Units |
| Single Unit, Detached | 15,327 | 78.3% |
| Single Unit, Attached | 857 | 4.4% |
| 2 Unit Apartments | 497 | 2.5% |
| 3 or 4 Unit Apartments | 876 | 4.5% |
| 5 to 9 Unit Apartments | 617 | 3.2% |
| 10 or more Apartments | 1,341 | 6.9% |
| Mobile Home / Other | 59 | 0.3% |
| Total | 19,574 | 100.0% |
Housing Structures by Occupancy in Barnstable Town
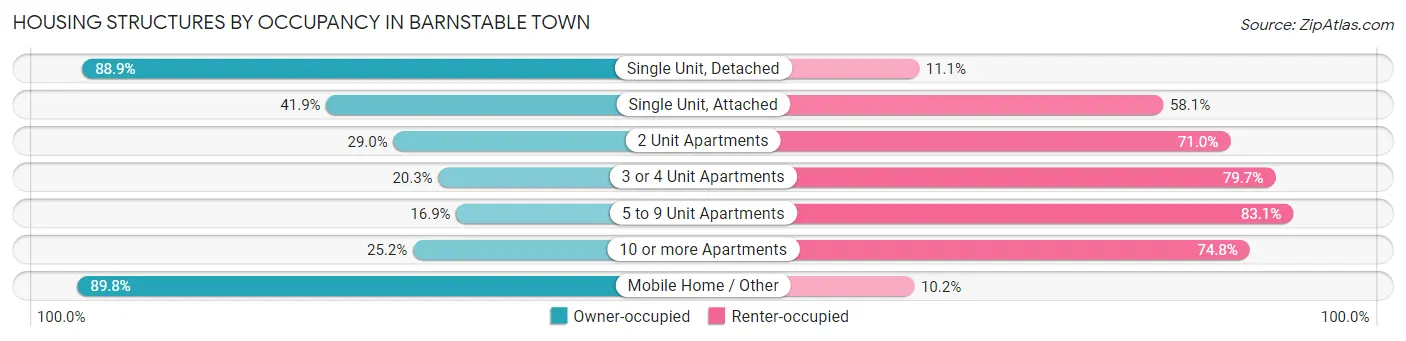
| Structure Type | Owner-occupied | Renter-occupied |
| Single Unit, Detached | 13,625 (88.9%) | 1,702 (11.1%) |
| Single Unit, Attached | 359 (41.9%) | 498 (58.1%) |
| 2 Unit Apartments | 144 (29.0%) | 353 (71.0%) |
| 3 or 4 Unit Apartments | 178 (20.3%) | 698 (79.7%) |
| 5 to 9 Unit Apartments | 104 (16.9%) | 513 (83.1%) |
| 10 or more Apartments | 338 (25.2%) | 1,003 (74.8%) |
| Mobile Home / Other | 53 (89.8%) | 6 (10.2%) |
| Total | 14,801 (75.6%) | 4,773 (24.4%) |
Housing Structures by Number of Rooms in Barnstable Town
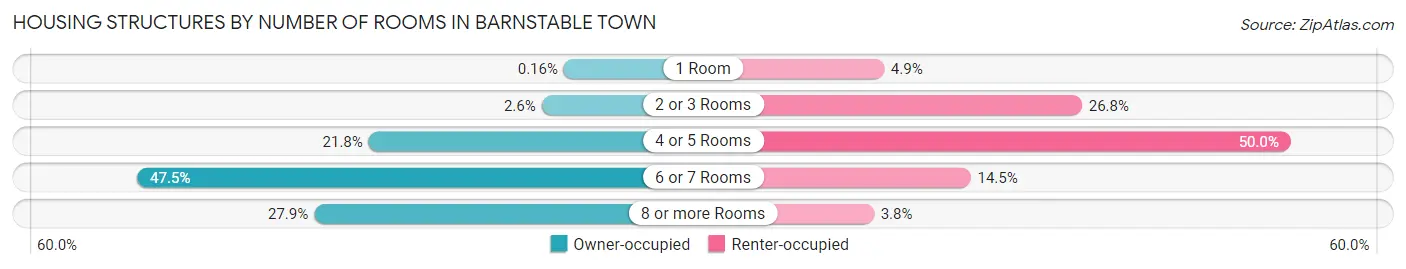
| Number of Rooms | Owner-occupied | Renter-occupied |
| 1 Room | 24 (0.2%) | 233 (4.9%) |
| 2 or 3 Rooms | 389 (2.6%) | 1,281 (26.8%) |
| 4 or 5 Rooms | 3,229 (21.8%) | 2,388 (50.0%) |
| 6 or 7 Rooms | 7,033 (47.5%) | 692 (14.5%) |
| 8 or more Rooms | 4,126 (27.9%) | 179 (3.7%) |
| Total | 14,801 (100.0%) | 4,773 (100.0%) |
Housing Structure by Heating Type in Barnstable Town
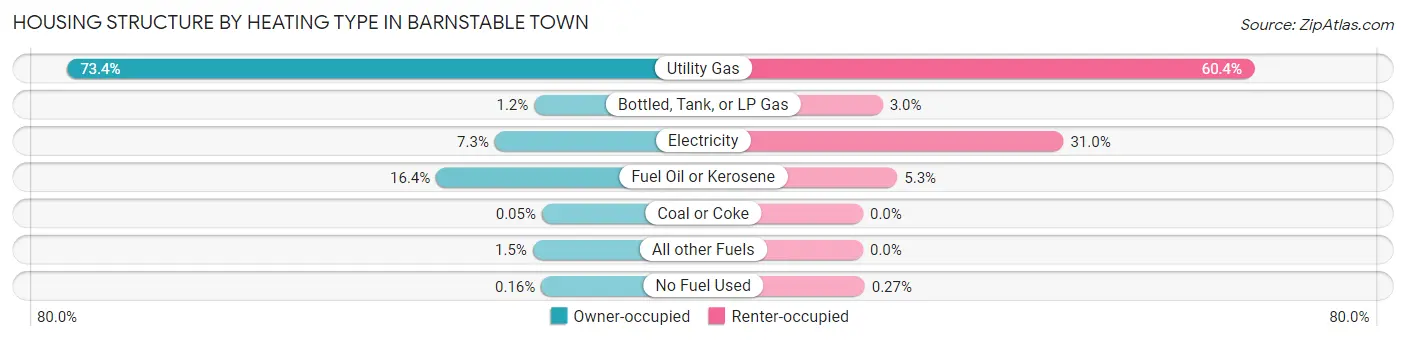
| Heating Type | Owner-occupied | Renter-occupied |
| Utility Gas | 10,865 (73.4%) | 2,883 (60.4%) |
| Bottled, Tank, or LP Gas | 182 (1.2%) | 145 (3.0%) |
| Electricity | 1,084 (7.3%) | 1,479 (31.0%) |
| Fuel Oil or Kerosene | 2,425 (16.4%) | 253 (5.3%) |
| Coal or Coke | 7 (0.1%) | 0 (0.0%) |
| All other Fuels | 214 (1.5%) | 0 (0.0%) |
| No Fuel Used | 24 (0.2%) | 13 (0.3%) |
| Total | 14,801 (100.0%) | 4,773 (100.0%) |
Household Vehicle Usage in Barnstable Town
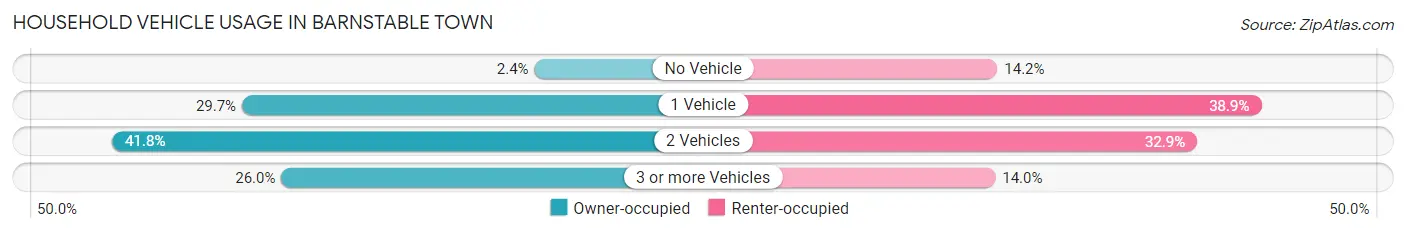
| Vehicles per Household | Owner-occupied | Renter-occupied |
| No Vehicle | 357 (2.4%) | 679 (14.2%) |
| 1 Vehicle | 4,397 (29.7%) | 1,855 (38.9%) |
| 2 Vehicles | 6,193 (41.8%) | 1,569 (32.9%) |
| 3 or more Vehicles | 3,854 (26.0%) | 670 (14.0%) |
| Total | 14,801 (100.0%) | 4,773 (100.0%) |
Real Estate & Mortgages in Barnstable Town
Real Estate and Mortgage Overview in Barnstable Town
| Characteristic | Without Mortgage | With Mortgage |
| Housing Units | 4,696 | 10,105 |
| Median Property Value | $515,200 | $494,600 |
| Median Household Income | $77,823 | $3,579 |
| Monthly Housing Costs | $817 | $2,723 |
| Real Estate Taxes | $3,830 | $26 |
Property Value by Mortgage Status in Barnstable Town
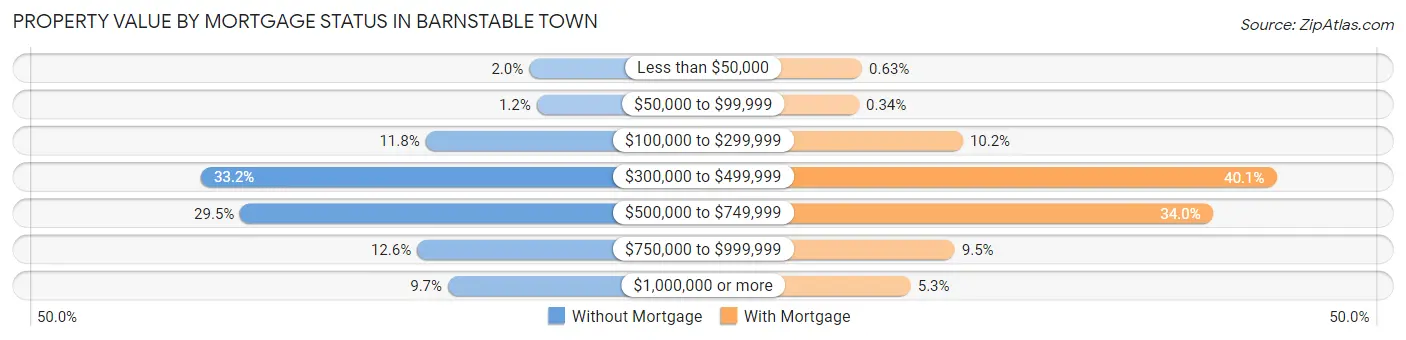
| Property Value | Without Mortgage | With Mortgage |
| Less than $50,000 | 92 (2.0%) | 64 (0.6%) |
| $50,000 to $99,999 | 58 (1.2%) | 34 (0.3%) |
| $100,000 to $299,999 | 555 (11.8%) | 1,034 (10.2%) |
| $300,000 to $499,999 | 1,559 (33.2%) | 4,049 (40.1%) |
| $500,000 to $749,999 | 1,384 (29.5%) | 3,436 (34.0%) |
| $750,000 to $999,999 | 593 (12.6%) | 956 (9.5%) |
| $1,000,000 or more | 455 (9.7%) | 532 (5.3%) |
| Total | 4,696 (100.0%) | 10,105 (100.0%) |
Household Income by Mortgage Status in Barnstable Town
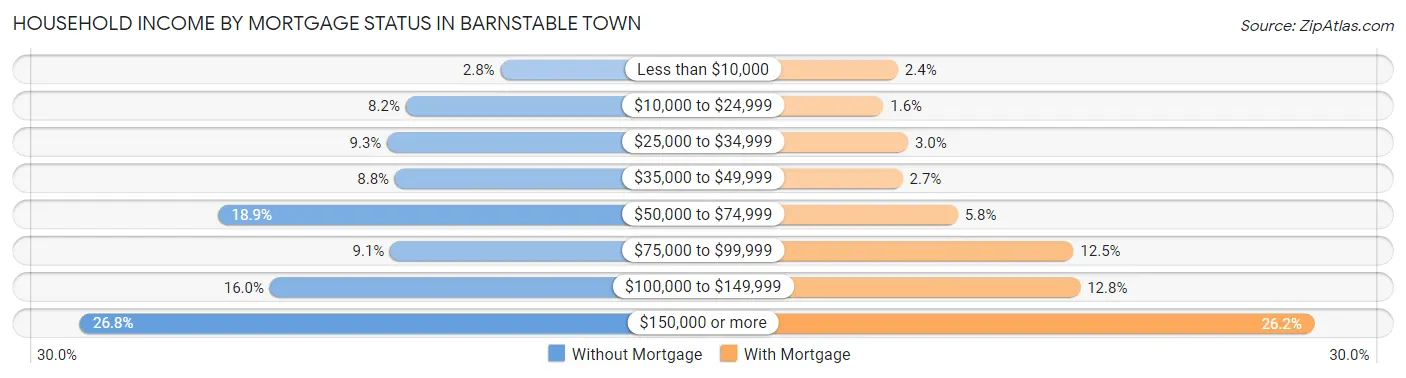
| Household Income | Without Mortgage | With Mortgage |
| Less than $10,000 | 132 (2.8%) | 245 (2.4%) |
| $10,000 to $24,999 | 386 (8.2%) | 161 (1.6%) |
| $25,000 to $34,999 | 436 (9.3%) | 303 (3.0%) |
| $35,000 to $49,999 | 415 (8.8%) | 272 (2.7%) |
| $50,000 to $74,999 | 888 (18.9%) | 590 (5.8%) |
| $75,000 to $99,999 | 428 (9.1%) | 1,258 (12.4%) |
| $100,000 to $149,999 | 751 (16.0%) | 1,297 (12.8%) |
| $150,000 or more | 1,260 (26.8%) | 2,645 (26.2%) |
| Total | 4,696 (100.0%) | 10,105 (100.0%) |
Property Value to Household Income Ratio in Barnstable Town
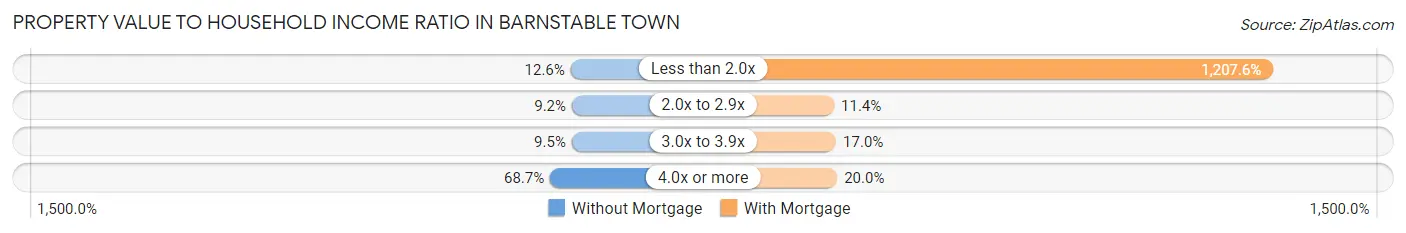
| Value-to-Income Ratio | Without Mortgage | With Mortgage |
| Less than 2.0x | 593 (12.6%) | 122,030 (1,207.6%) |
| 2.0x to 2.9x | 430 (9.2%) | 1,147 (11.4%) |
| 3.0x to 3.9x | 448 (9.5%) | 1,719 (17.0%) |
| 4.0x or more | 3,225 (68.7%) | 2,020 (20.0%) |
| Total | 4,696 (100.0%) | 10,105 (100.0%) |
Real Estate Taxes by Mortgage Status in Barnstable Town
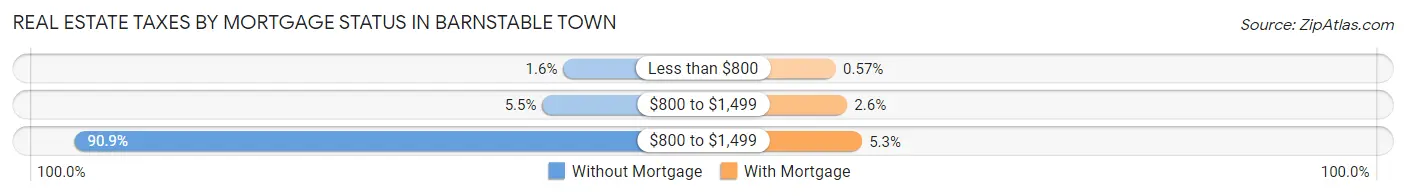
| Property Taxes | Without Mortgage | With Mortgage |
| Less than $800 | 76 (1.6%) | 58 (0.6%) |
| $800 to $1,499 | 256 (5.4%) | 265 (2.6%) |
| $800 to $1,499 | 4,267 (90.9%) | 539 (5.3%) |
| Total | 4,696 (100.0%) | 10,105 (100.0%) |
Health & Disability in Barnstable Town
Health Insurance Coverage by Age in Barnstable Town
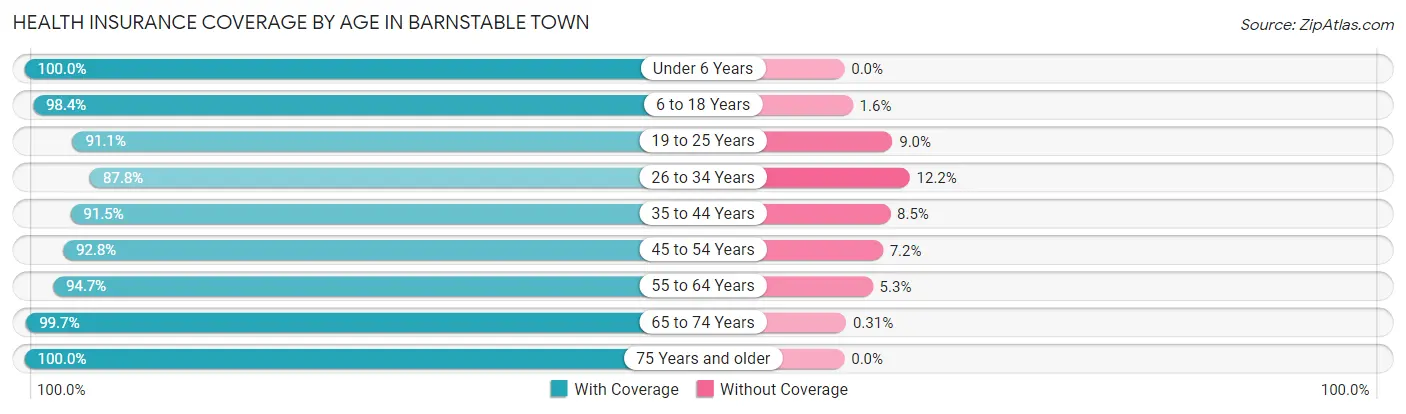
| Age Bracket | With Coverage | Without Coverage |
| Under 6 Years | 2,533 (100.0%) | 0 (0.0%) |
| 6 to 18 Years | 6,519 (98.4%) | 103 (1.6%) |
| 19 to 25 Years | 3,572 (91.0%) | 351 (8.9%) |
| 26 to 34 Years | 4,095 (87.8%) | 568 (12.2%) |
| 35 to 44 Years | 5,257 (91.5%) | 491 (8.5%) |
| 45 to 54 Years | 5,455 (92.8%) | 421 (7.2%) |
| 55 to 64 Years | 7,616 (94.7%) | 425 (5.3%) |
| 65 to 74 Years | 6,663 (99.7%) | 21 (0.3%) |
| 75 Years and older | 4,647 (100.0%) | 0 (0.0%) |
| Total | 46,357 (95.1%) | 2,380 (4.9%) |
Health Insurance Coverage by Citizenship Status in Barnstable Town
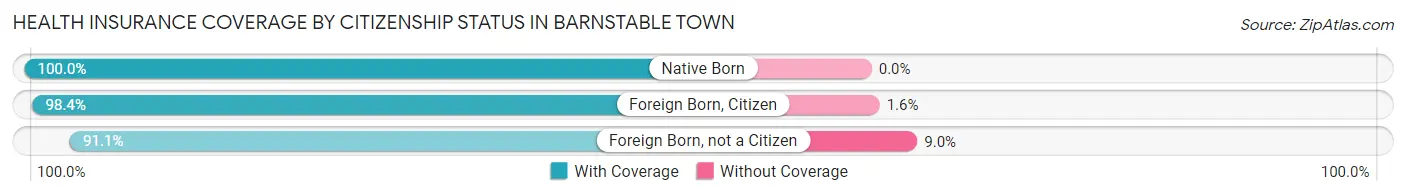
| Citizenship Status | With Coverage | Without Coverage |
| Native Born | 2,533 (100.0%) | 0 (0.0%) |
| Foreign Born, Citizen | 6,519 (98.4%) | 103 (1.6%) |
| Foreign Born, not a Citizen | 3,572 (91.0%) | 351 (8.9%) |
Health Insurance Coverage by Household Income in Barnstable Town
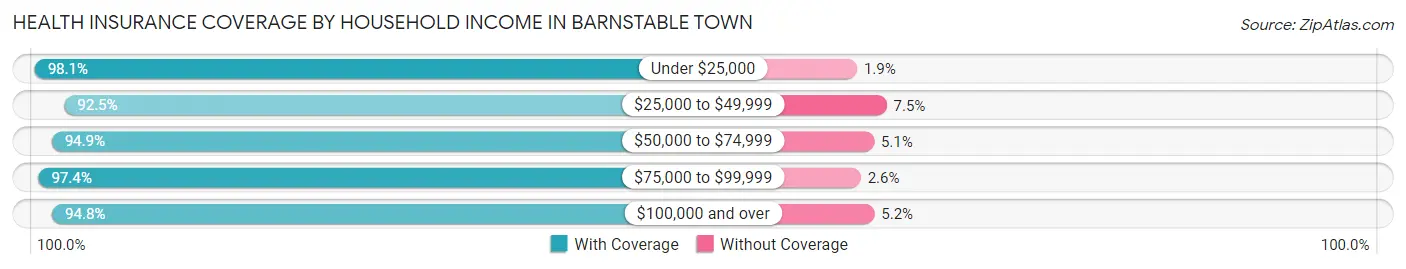
| Household Income | With Coverage | Without Coverage |
| Under $25,000 | 3,204 (98.1%) | 62 (1.9%) |
| $25,000 to $49,999 | 4,935 (92.5%) | 398 (7.5%) |
| $50,000 to $74,999 | 5,909 (94.9%) | 317 (5.1%) |
| $75,000 to $99,999 | 5,264 (97.4%) | 141 (2.6%) |
| $100,000 and over | 26,647 (94.8%) | 1,452 (5.2%) |
Public vs Private Health Insurance Coverage by Age in Barnstable Town
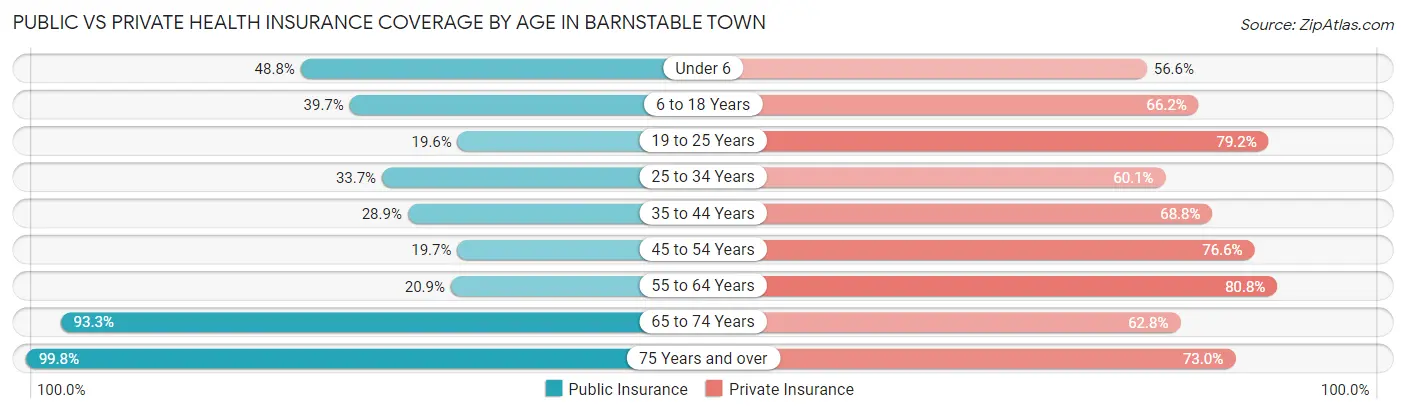
| Age Bracket | Public Insurance | Private Insurance |
| Under 6 | 1,235 (48.8%) | 1,434 (56.6%) |
| 6 to 18 Years | 2,627 (39.7%) | 4,386 (66.2%) |
| 19 to 25 Years | 770 (19.6%) | 3,107 (79.2%) |
| 25 to 34 Years | 1,570 (33.7%) | 2,801 (60.1%) |
| 35 to 44 Years | 1,660 (28.9%) | 3,953 (68.8%) |
| 45 to 54 Years | 1,157 (19.7%) | 4,500 (76.6%) |
| 55 to 64 Years | 1,680 (20.9%) | 6,498 (80.8%) |
| 65 to 74 Years | 6,236 (93.3%) | 4,198 (62.8%) |
| 75 Years and over | 4,637 (99.8%) | 3,391 (73.0%) |
| Total | 21,572 (44.3%) | 34,268 (70.3%) |
Disability Status by Sex by Age in Barnstable Town
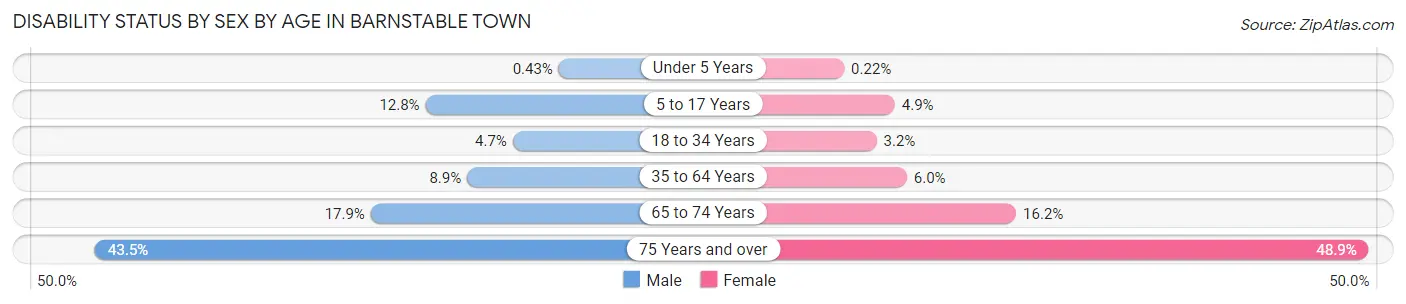
| Age Bracket | Male | Female |
| Under 5 Years | 5 (0.4%) | 2 (0.2%) |
| 5 to 17 Years | 426 (12.8%) | 147 (4.9%) |
| 18 to 34 Years | 208 (4.7%) | 159 (3.2%) |
| 35 to 64 Years | 856 (8.9%) | 610 (6.0%) |
| 65 to 74 Years | 563 (17.9%) | 572 (16.2%) |
| 75 Years and over | 985 (43.5%) | 1,164 (48.9%) |
Disability Class by Sex by Age in Barnstable Town
Disability Class: Hearing Difficulty
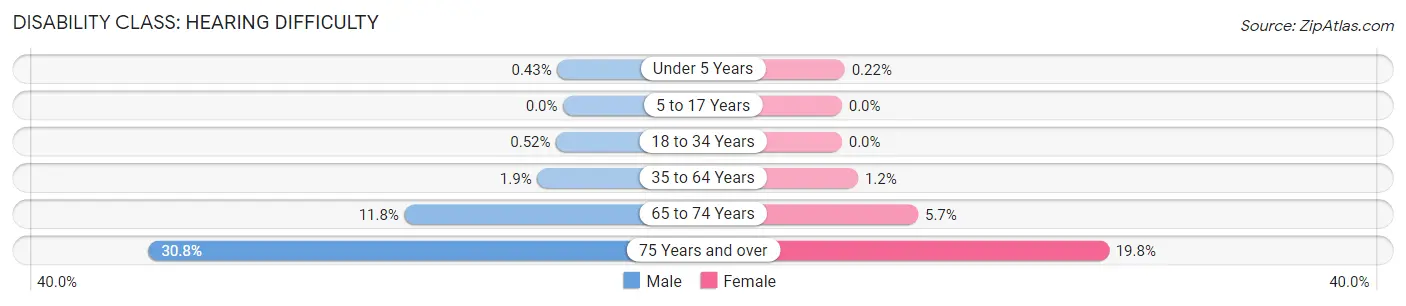
| Age Bracket | Male | Female |
| Under 5 Years | 5 (0.4%) | 2 (0.2%) |
| 5 to 17 Years | 0 (0.0%) | 0 (0.0%) |
| 18 to 34 Years | 23 (0.5%) | 0 (0.0%) |
| 35 to 64 Years | 184 (1.9%) | 121 (1.2%) |
| 65 to 74 Years | 371 (11.8%) | 200 (5.7%) |
| 75 Years and over | 698 (30.8%) | 472 (19.8%) |
Disability Class: Vision Difficulty
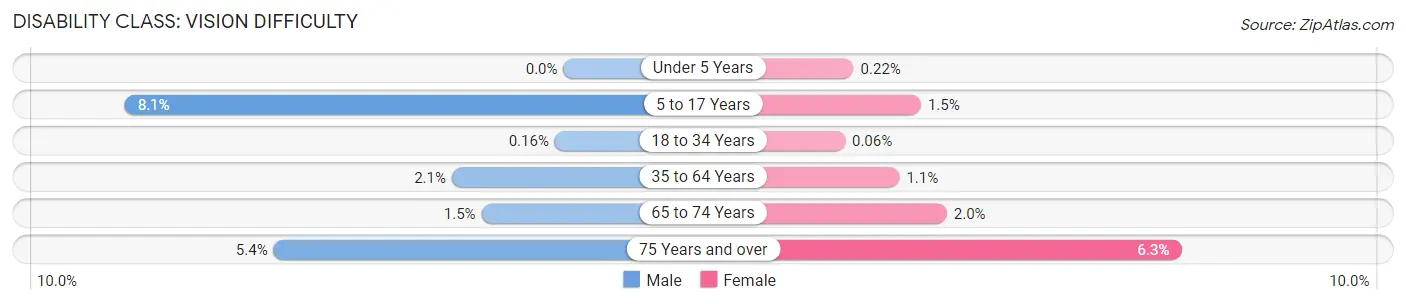
| Age Bracket | Male | Female |
| Under 5 Years | 0 (0.0%) | 2 (0.2%) |
| 5 to 17 Years | 271 (8.1%) | 44 (1.5%) |
| 18 to 34 Years | 7 (0.2%) | 3 (0.1%) |
| 35 to 64 Years | 198 (2.1%) | 108 (1.1%) |
| 65 to 74 Years | 48 (1.5%) | 69 (1.9%) |
| 75 Years and over | 122 (5.4%) | 150 (6.3%) |
Disability Class: Cognitive Difficulty
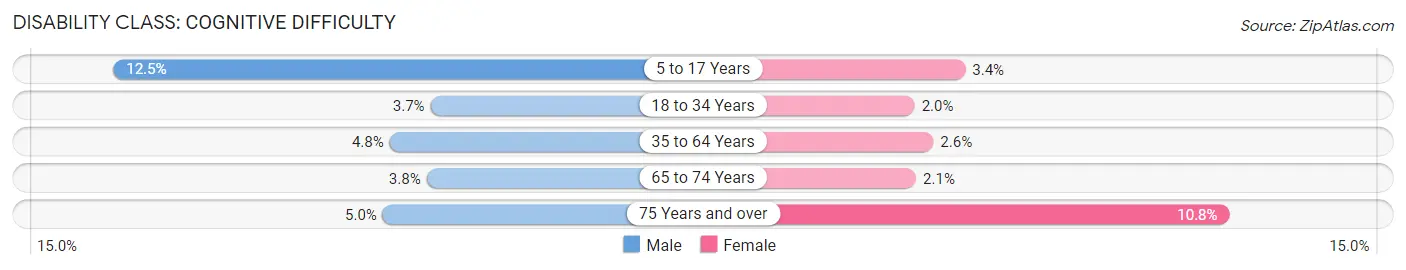
| Age Bracket | Male | Female |
| 5 to 17 Years | 417 (12.5%) | 103 (3.4%) |
| 18 to 34 Years | 164 (3.7%) | 100 (2.0%) |
| 35 to 64 Years | 463 (4.8%) | 257 (2.5%) |
| 65 to 74 Years | 120 (3.8%) | 73 (2.1%) |
| 75 Years and over | 114 (5.0%) | 257 (10.8%) |
Disability Class: Ambulatory Difficulty
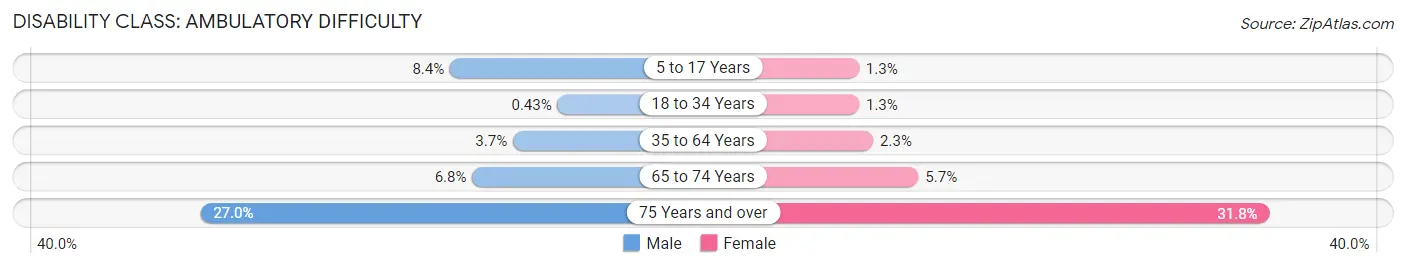
| Age Bracket | Male | Female |
| 5 to 17 Years | 280 (8.4%) | 38 (1.3%) |
| 18 to 34 Years | 19 (0.4%) | 63 (1.3%) |
| 35 to 64 Years | 358 (3.7%) | 235 (2.3%) |
| 65 to 74 Years | 213 (6.8%) | 201 (5.7%) |
| 75 Years and over | 611 (27.0%) | 756 (31.8%) |
Disability Class: Self-Care Difficulty
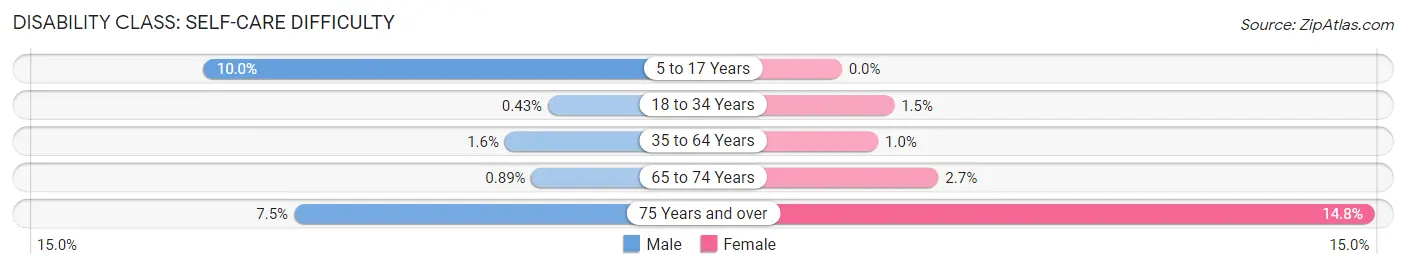
| Age Bracket | Male | Female |
| 5 to 17 Years | 333 (10.0%) | 0 (0.0%) |
| 18 to 34 Years | 19 (0.4%) | 72 (1.5%) |
| 35 to 64 Years | 156 (1.6%) | 102 (1.0%) |
| 65 to 74 Years | 28 (0.9%) | 95 (2.7%) |
| 75 Years and over | 170 (7.5%) | 353 (14.8%) |
Technology Access in Barnstable Town
Computing Device Access in Barnstable Town
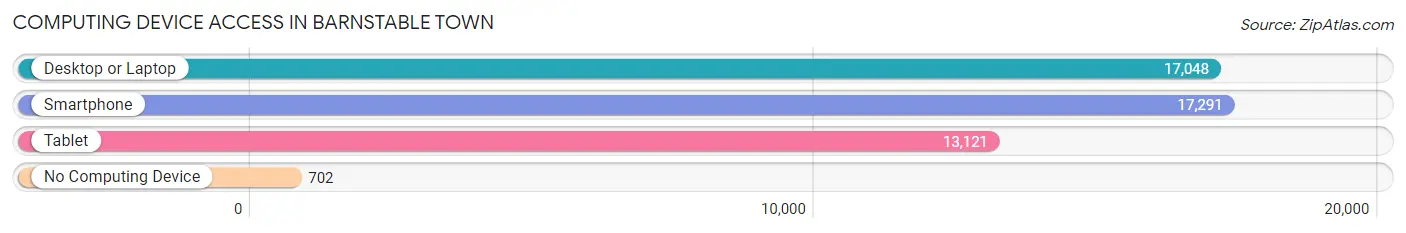
| Device Type | # Households | % Households |
| Desktop or Laptop | 17,048 | 87.1% |
| Smartphone | 17,291 | 88.3% |
| Tablet | 13,121 | 67.0% |
| No Computing Device | 702 | 3.6% |
| Total | 19,574 | 100.0% |
Internet Access in Barnstable Town
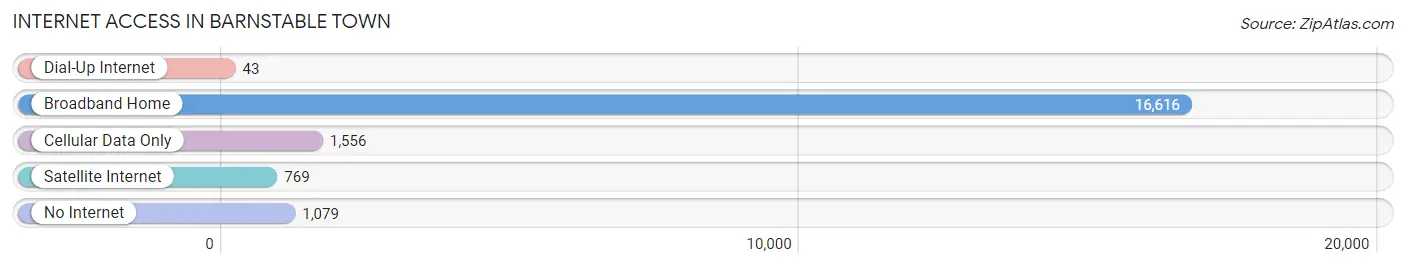
| Internet Type | # Households | % Households |
| Dial-Up Internet | 43 | 0.2% |
| Broadband Home | 16,616 | 84.9% |
| Cellular Data Only | 1,556 | 8.0% |
| Satellite Internet | 769 | 3.9% |
| No Internet | 1,079 | 5.5% |
| Total | 19,574 | 100.0% |
Barnstable Town Summary
Barnstable Town, MA is a town located in Barnstable County, Massachusetts. It is the county seat of Barnstable County and is the largest community on Cape Cod. The town is located on the south side of the Cape, and is bordered by the towns of Sandwich, Mashpee, Yarmouth, and Dennis. The town has a population of 45,193 as of the 2010 census, making it the second most populous town in the county.
History
Barnstable Town was first settled in 1639 by a group of English settlers led by Thomas Hinckley. The town was originally known as Mattacheese, and was part of the Plymouth Colony. In 1644, the town was incorporated as Barnstable, named after Barnstaple, England. The town was the site of the first court of the Plymouth Colony, and was the county seat of Barnstable County from its formation in 1685 until the county government was abolished in 1998.
Geography
Barnstable Town is located on the south side of Cape Cod, and is bordered by the towns of Sandwich, Mashpee, Yarmouth, and Dennis. The town is located on the western shore of Cape Cod Bay, and is approximately 40 miles southeast of Boston. The town is divided into seven villages: Barnstable, Centerville, Cotuit, Hyannis, Marstons Mills, Osterville, and West Barnstable. The town covers a total area of 58.3 square miles, of which 56.2 square miles is land and 2.1 square miles is water.
Economy
Barnstable Town is a major tourist destination, and the town’s economy is largely based on tourism. The town is home to several popular beaches, including Kalmus Beach, Sandy Neck Beach, and Craigville Beach. The town is also home to the John F. Kennedy Hyannis Museum, the Cape Cod Maritime Museum, and the Cape Cod Museum of Natural History. The town is also home to several major employers, including Cape Cod Hospital, Cape Cod Times, and Cape Cod Five Cents Savings Bank.
Demographics
As of the 2010 census, there were 45,193 people, 19,845 households, and 11,845 families residing in the town. The population density was 803.3 people per square mile. The racial makeup of the town was 94.2% White, 2.2% African American, 0.5% Native American, 1.2% Asian, 0.1% Pacific Islander, 0.7% from other races, and 1.1% from two or more races. Hispanic or Latino of any race were 2.2% of the population.
The median income for a household in the town was $54,817, and the median income for a family was $64,945. The per capita income for the town was $30,845. About 5.2% of families and 8.2% of the population were below the poverty line, including 10.2% of those under age 18 and 5.2% of those age 65 or over.
Common Questions
What is Per Capita Income in Barnstable Town?
Per Capita income in Barnstable Town is $51,061.
What is the Median Family Income in Barnstable Town?
Median Family Income in Barnstable Town is $118,726.
What is the Median Household income in Barnstable Town?
Median Household Income in Barnstable Town is $94,387.
What is Income or Wage Gap in Barnstable Town?
Income or Wage Gap in Barnstable Town is 26.0%.
Women in Barnstable Town earn 74.0 cents for every dollar earned by a man.
What is Inequality or Gini Index in Barnstable Town?
Inequality or Gini Index in Barnstable Town is 0.45.
What is the Total Population of Barnstable Town?
Total Population of Barnstable Town is 48,922.
What is the Total Male Population of Barnstable Town?
Total Male Population of Barnstable Town is 23,992.
What is the Total Female Population of Barnstable Town?
Total Female Population of Barnstable Town is 24,930.
What is the Ratio of Males per 100 Females in Barnstable Town?
There are 96.24 Males per 100 Females in Barnstable Town.
What is the Ratio of Females per 100 Males in Barnstable Town?
There are 103.91 Females per 100 Males in Barnstable Town.
What is the Median Population Age in Barnstable Town?
Median Population Age in Barnstable Town is 47.1 Years.
What is the Average Family Size in Barnstable Town
Average Family Size in Barnstable Town is 3.0 People.
What is the Average Household Size in Barnstable Town
Average Household Size in Barnstable Town is 2.5 People.
How Large is the Labor Force in Barnstable Town?
There are 28,070 People in the Labor Forcein in Barnstable Town.
What is the Percentage of People in the Labor Force in Barnstable Town?
67.6% of People are in the Labor Force in Barnstable Town.
What is the Unemployment Rate in Barnstable Town?
Unemployment Rate in Barnstable Town is 3.1%.