Cities with the Highest Percentage of Population Employed in Retail Trade in Massachusetts
RELATED REPORTS & OPTIONS
Retail Trade
Massachusetts
Compare Cities
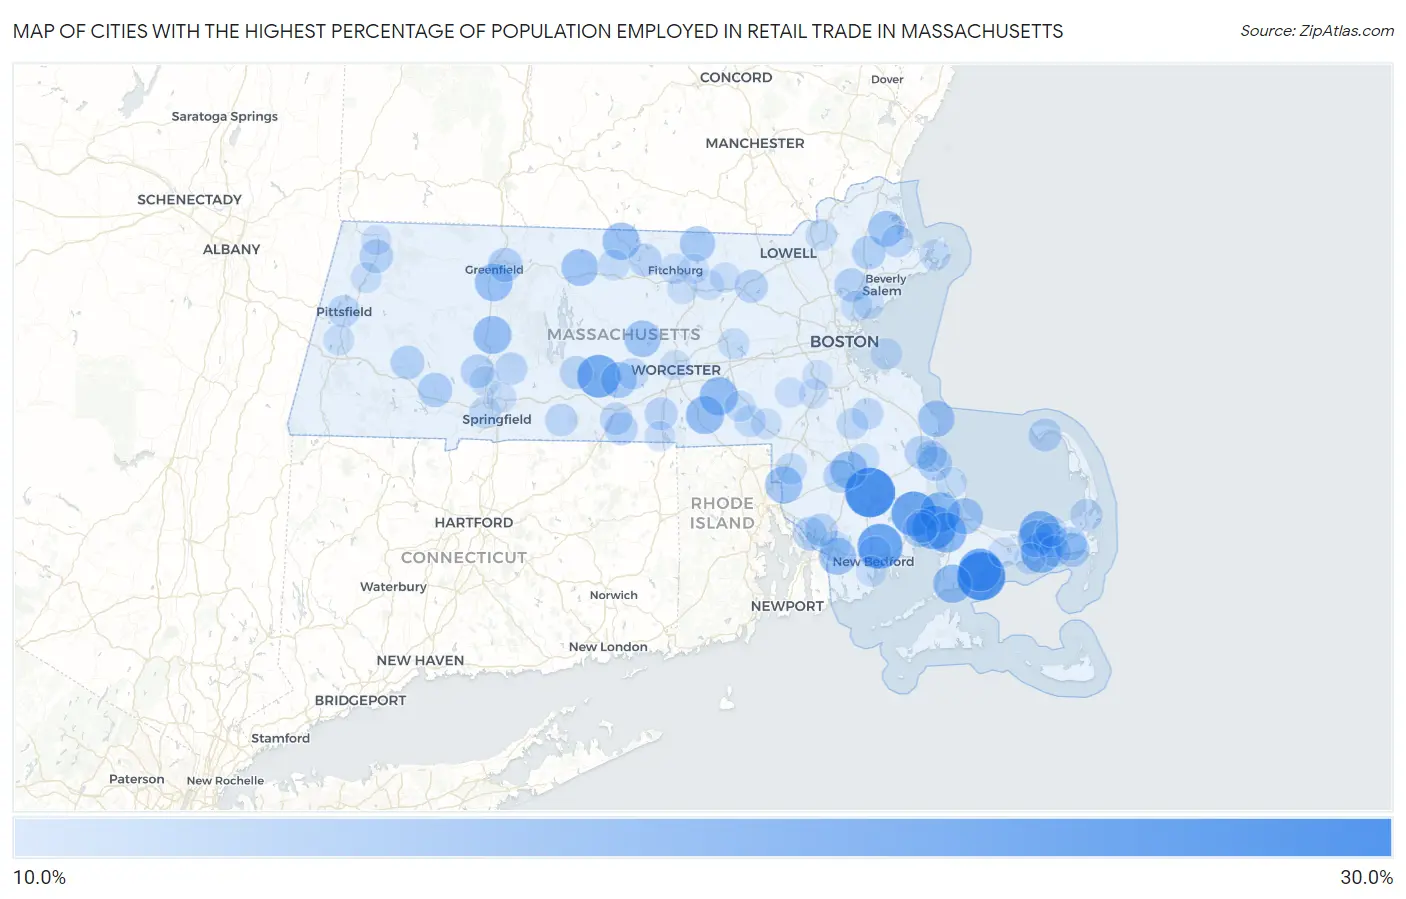
Map of Cities with the Highest Percentage of Population Employed in Retail Trade in Massachusetts
0.0%
30.0%
Cities with the Highest Percentage of Population Employed in Retail Trade in Massachusetts
| City | % Employed | vs State | vs National | |
| 1. | North Lakeville | 29.5% | 9.9%(+19.6)#1 | 11.0%(+18.5)#1,113 |
| 2. | West Warren | 28.3% | 9.9%(+18.3)#2 | 11.0%(+17.3)#1,251 |
| 3. | Popponesset Island | 28.2% | 9.9%(+18.3)#3 | 11.0%(+17.2)#1,263 |
| 4. | Acushnet Center | 25.0% | 9.9%(+15.0)#4 | 11.0%(+14.0)#1,773 |
| 5. | West Wareham | 24.8% | 9.9%(+14.8)#5 | 11.0%(+13.8)#1,797 |
| 6. | Onset | 23.8% | 9.9%(+13.9)#6 | 11.0%(+12.8)#2,001 |
| 7. | West Brookfield | 23.1% | 9.9%(+13.2)#7 | 11.0%(+12.2)#2,181 |
| 8. | Mashpee Neck | 23.0% | 9.9%(+13.1)#8 | 11.0%(+12.1)#2,208 |
| 9. | Dennis | 21.1% | 9.9%(+11.1)#9 | 11.0%(+10.1)#2,804 |
| 10. | South Yarmouth | 21.1% | 9.9%(+11.1)#10 | 11.0%(+10.1)#2,806 |
| 11. | White Island Shores | 20.6% | 9.9%(+10.7)#11 | 11.0%(+9.65)#2,974 |
| 12. | Bourne | 20.5% | 9.9%(+10.6)#12 | 11.0%(+9.54)#3,027 |
| 13. | Teaticket | 19.0% | 9.9%(+9.03)#13 | 11.0%(+7.98)#3,782 |
| 14. | Upton | 18.9% | 9.9%(+8.95)#14 | 11.0%(+7.90)#3,833 |
| 15. | Whitinsville | 18.6% | 9.9%(+8.71)#15 | 11.0%(+7.66)#3,967 |
| 16. | Hatfield | 18.5% | 9.9%(+8.53)#16 | 11.0%(+7.47)#4,083 |
| 17. | Deerfield | 18.1% | 9.9%(+8.18)#17 | 11.0%(+7.13)#4,296 |
| 18. | Winchendon | 17.8% | 9.9%(+7.88)#18 | 11.0%(+6.83)#4,504 |
| 19. | Raynham Center | 17.8% | 9.9%(+7.85)#19 | 11.0%(+6.80)#4,524 |
| 20. | North Seekonk | 17.7% | 9.9%(+7.81)#20 | 11.0%(+6.76)#4,551 |
| 21. | North Westport | 17.6% | 9.9%(+7.71)#21 | 11.0%(+6.65)#4,636 |
| 22. | Yarmouth Port | 17.6% | 9.9%(+7.64)#22 | 11.0%(+6.59)#4,687 |
| 23. | Athol | 17.4% | 9.9%(+7.52)#23 | 11.0%(+6.46)#4,793 |
| 24. | Ocean Bluff Brant Rock | 17.1% | 9.9%(+7.16)#24 | 11.0%(+6.11)#5,075 |
| 25. | Rutland | 17.1% | 9.9%(+7.15)#25 | 11.0%(+6.10)#5,082 |
| 26. | Sagamore | 16.9% | 9.9%(+6.95)#26 | 11.0%(+5.89)#5,233 |
| 27. | East Brookfield | 16.5% | 9.9%(+6.55)#27 | 11.0%(+5.50)#5,575 |
| 28. | Rowley | 16.4% | 9.9%(+6.47)#28 | 11.0%(+5.42)#5,650 |
| 29. | Townsend | 15.9% | 9.9%(+5.95)#29 | 11.0%(+4.90)#6,146 |
| 30. | South Dennis | 15.4% | 9.9%(+5.43)#30 | 11.0%(+4.38)#6,713 |
| 31. | Weweantic | 15.3% | 9.9%(+5.41)#31 | 11.0%(+4.36)#6,729 |
| 32. | Russell | 15.2% | 9.9%(+5.26)#32 | 11.0%(+4.21)#6,902 |
| 33. | Plymouth | 15.1% | 9.9%(+5.21)#33 | 11.0%(+4.16)#6,966 |
| 34. | Turners Falls | 15.0% | 9.9%(+5.11)#34 | 11.0%(+4.06)#7,095 |
| 35. | Harwich Port | 14.9% | 9.9%(+4.98)#35 | 11.0%(+3.92)#7,246 |
| 36. | Topsfield | 14.7% | 9.9%(+4.72)#36 | 11.0%(+3.67)#7,579 |
| 37. | Ocean Grove | 14.5% | 9.9%(+4.60)#37 | 11.0%(+3.55)#7,760 |
| 38. | Chester | 14.5% | 9.9%(+4.59)#38 | 11.0%(+3.54)#7,775 |
| 39. | Harwich Center | 14.5% | 9.9%(+4.52)#39 | 11.0%(+3.47)#7,884 |
| 40. | Easthampton Town | 14.4% | 9.9%(+4.51)#40 | 11.0%(+3.45)#7,903 |
| 41. | Adams | 14.4% | 9.9%(+4.42)#41 | 11.0%(+3.37)#8,014 |
| 42. | Lynnfield | 14.2% | 9.9%(+4.31)#42 | 11.0%(+3.25)#8,225 |
| 43. | Kingston | 14.2% | 9.9%(+4.27)#43 | 11.0%(+3.22)#8,283 |
| 44. | Wareham Center | 14.2% | 9.9%(+4.25)#44 | 11.0%(+3.20)#8,312 |
| 45. | Taunton | 14.2% | 9.9%(+4.22)#45 | 11.0%(+3.16)#8,356 |
| 46. | Littleton Common | 14.1% | 9.9%(+4.19)#46 | 11.0%(+3.14)#8,400 |
| 47. | Somerset | 14.1% | 9.9%(+4.12)#47 | 11.0%(+3.06)#8,516 |
| 48. | Ware | 14.0% | 9.9%(+4.12)#48 | 11.0%(+3.06)#8,521 |
| 49. | Provincetown | 13.9% | 9.9%(+3.96)#49 | 11.0%(+2.90)#8,760 |
| 50. | Southbridge Town | 13.8% | 9.9%(+3.89)#50 | 11.0%(+2.83)#8,862 |
| 51. | Oxford | 13.8% | 9.9%(+3.86)#51 | 11.0%(+2.81)#8,894 |
| 52. | South Ashburnham | 13.7% | 9.9%(+3.79)#52 | 11.0%(+2.73)#9,025 |
| 53. | New Bedford | 13.6% | 9.9%(+3.62)#53 | 11.0%(+2.57)#9,248 |
| 54. | Sturbridge | 13.5% | 9.9%(+3.59)#54 | 11.0%(+2.53)#9,308 |
| 55. | Monson Center | 13.4% | 9.9%(+3.47)#55 | 11.0%(+2.42)#9,508 |
| 56. | Granby | 13.2% | 9.9%(+3.30)#56 | 11.0%(+2.24)#9,831 |
| 57. | Orleans | 13.2% | 9.9%(+3.23)#57 | 11.0%(+2.18)#9,962 |
| 58. | Ipswich | 13.0% | 9.9%(+3.11)#58 | 11.0%(+2.06)#10,163 |
| 59. | Pittsfield | 13.0% | 9.9%(+3.08)#59 | 11.0%(+2.03)#10,220 |
| 60. | Dennis Port | 12.8% | 9.9%(+2.86)#60 | 11.0%(+1.81)#10,601 |
| 61. | Greenfield | 12.8% | 9.9%(+2.85)#61 | 11.0%(+1.79)#10,622 |
| 62. | North Plymouth | 12.8% | 9.9%(+2.84)#62 | 11.0%(+1.78)#10,644 |
| 63. | West Springfield Town | 12.7% | 9.9%(+2.79)#63 | 11.0%(+1.74)#10,734 |
| 64. | Abington | 12.7% | 9.9%(+2.75)#64 | 11.0%(+1.70)#10,802 |
| 65. | Spencer | 12.7% | 9.9%(+2.75)#65 | 11.0%(+1.70)#10,805 |
| 66. | Brockton | 12.6% | 9.9%(+2.71)#66 | 11.0%(+1.65)#10,890 |
| 67. | Lawrence | 12.6% | 9.9%(+2.65)#67 | 11.0%(+1.59)#10,992 |
| 68. | Hull | 12.6% | 9.9%(+2.62)#68 | 11.0%(+1.57)#11,045 |
| 69. | Bellingham | 12.5% | 9.9%(+2.60)#69 | 11.0%(+1.54)#11,085 |
| 70. | Attleboro | 12.5% | 9.9%(+2.57)#70 | 11.0%(+1.52)#11,134 |
| 71. | Fall River | 12.3% | 9.9%(+2.33)#71 | 11.0%(+1.28)#11,695 |
| 72. | Marlborough | 12.3% | 9.9%(+2.33)#72 | 11.0%(+1.27)#11,699 |
| 73. | Saugus | 12.2% | 9.9%(+2.31)#73 | 11.0%(+1.25)#11,738 |
| 74. | The Pinehills | 12.2% | 9.9%(+2.29)#74 | 11.0%(+1.23)#11,779 |
| 75. | Gloucester | 12.2% | 9.9%(+2.27)#75 | 11.0%(+1.22)#11,812 |
| 76. | West Yarmouth | 12.1% | 9.9%(+2.20)#76 | 11.0%(+1.14)#11,965 |
| 77. | Bridgewater Town | 12.1% | 9.9%(+2.17)#77 | 11.0%(+1.11)#12,025 |
| 78. | East Dennis | 12.1% | 9.9%(+2.16)#78 | 11.0%(+1.11)#12,040 |
| 79. | Milford | 12.1% | 9.9%(+2.14)#79 | 11.0%(+1.08)#12,089 |
| 80. | Baldwinville | 12.0% | 9.9%(+2.09)#80 | 11.0%(+1.03)#12,195 |
| 81. | Bliss Corner | 11.9% | 9.9%(+2.01)#81 | 11.0%(+0.958)#12,351 |
| 82. | Franklin Town | 11.9% | 9.9%(+1.97)#82 | 11.0%(+0.913)#12,437 |
| 83. | Lenox | 11.9% | 9.9%(+1.97)#83 | 11.0%(+0.912)#12,441 |
| 84. | Cheshire | 11.9% | 9.9%(+1.93)#84 | 11.0%(+0.875)#12,525 |
| 85. | Lynn | 11.8% | 9.9%(+1.90)#85 | 11.0%(+0.845)#12,583 |
| 86. | Shirley | 11.8% | 9.9%(+1.82)#86 | 11.0%(+0.761)#12,753 |
| 87. | Leominster | 11.7% | 9.9%(+1.79)#87 | 11.0%(+0.731)#12,819 |
| 88. | Fitchburg | 11.7% | 9.9%(+1.77)#88 | 11.0%(+0.720)#12,846 |
| 89. | North Attleborough | 11.6% | 9.9%(+1.70)#89 | 11.0%(+0.643)#13,020 |
| 90. | Holyoke | 11.6% | 9.9%(+1.69)#90 | 11.0%(+0.633)#13,043 |
| 91. | Webster | 11.6% | 9.9%(+1.66)#91 | 11.0%(+0.601)#13,116 |
| 92. | North Adams | 11.6% | 9.9%(+1.63)#92 | 11.0%(+0.576)#13,176 |
| 93. | Ayer | 11.5% | 9.9%(+1.61)#93 | 11.0%(+0.552)#13,228 |
| 94. | Worcester | 11.5% | 9.9%(+1.59)#94 | 11.0%(+0.538)#13,275 |
| 95. | Chicopee | 11.5% | 9.9%(+1.54)#95 | 11.0%(+0.484)#13,379 |
| 96. | Medfield | 11.5% | 9.9%(+1.53)#96 | 11.0%(+0.472)#13,409 |
| 97. | Norwood | 11.5% | 9.9%(+1.52)#97 | 11.0%(+0.464)#13,429 |
| 98. | Barnstable Town | 11.4% | 9.9%(+1.48)#98 | 11.0%(+0.427)#13,516 |
| 99. | Dedham | 11.3% | 9.9%(+1.39)#99 | 11.0%(+0.330)#13,742 |
| 100. | Lunenburg | 11.2% | 9.9%(+1.31)#100 | 11.0%(+0.258)#13,899 |
Common Questions
What are the Top 10 Cities with the Highest Percentage of Population Employed in Retail Trade in Massachusetts?
Top 10 Cities with the Highest Percentage of Population Employed in Retail Trade in Massachusetts are:
#1
29.5%
#2
28.2%
#3
25.0%
#4
24.8%
#5
23.8%
#6
23.1%
#7
23.0%
#8
21.1%
#9
21.1%
#10
20.6%
What city has the Highest Percentage of Population Employed in Retail Trade in Massachusetts?
North Lakeville has the Highest Percentage of Population Employed in Retail Trade in Massachusetts with 29.5%.
What is the Percentage of Population Employed in Retail Trade in the State of Massachusetts?
Percentage of Population Employed in Retail Trade in Massachusetts is 9.9%.
What is the Percentage of Population Employed in Retail Trade in the United States?
Percentage of Population Employed in Retail Trade in the United States is 11.0%.