Granby, MA Map & Demographics
Granby Map
Granby Overview
$50,555
PER CAPITA INCOME
$135,724
AVG FAMILY INCOME
$94,663
AVG HOUSEHOLD INCOME
42.2%
WAGE / INCOME GAP [ % ]
57.8¢/ $1
WAGE / INCOME GAP [ $ ]
0.38
INEQUALITY / GINI INDEX
1,176
TOTAL POPULATION
531
MALE POPULATION
645
FEMALE POPULATION
82.33
MALES / 100 FEMALES
121.47
FEMALES / 100 MALES
46.1
MEDIAN AGE
2.8
AVG FAMILY SIZE
2.4
AVG HOUSEHOLD SIZE
783
LABOR FORCE [ PEOPLE ]
79.9%
PERCENT IN LABOR FORCE
4.3%
UNEMPLOYMENT RATE
Granby Zip Codes
Granby Area Codes
Income in Granby
Income Overview in Granby
Per Capita Income in Granby is $50,555, while median incomes of families and households are $135,724 and $94,663 respectively.
| Characteristic | Number | Measure |
| Per Capita Income | 1,176 | $50,555 |
| Median Family Income | 333 | $135,724 |
| Mean Family Income | 333 | $145,417 |
| Median Household Income | 494 | $94,663 |
| Mean Household Income | 494 | $122,147 |
| Income Deficit | 333 | $0 |
| Wage / Income Gap (%) | 1,176 | 42.17% |
| Wage / Income Gap ($) | 1,176 | 57.83¢ per $1 |
| Gini / Inequality Index | 1,176 | 0.38 |
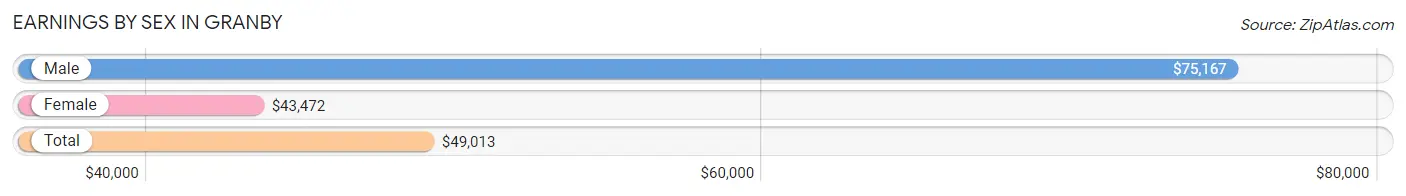
Earnings by Sex in Granby
Average Earnings in Granby are $49,013, $75,167 for men and $43,472 for women, a difference of 42.2%.
| Sex | Number | Average Earnings |
| Male | 360 (45.9%) | $75,167 |
| Female | 425 (54.1%) | $43,472 |
| Total | 785 (100.0%) | $49,013 |
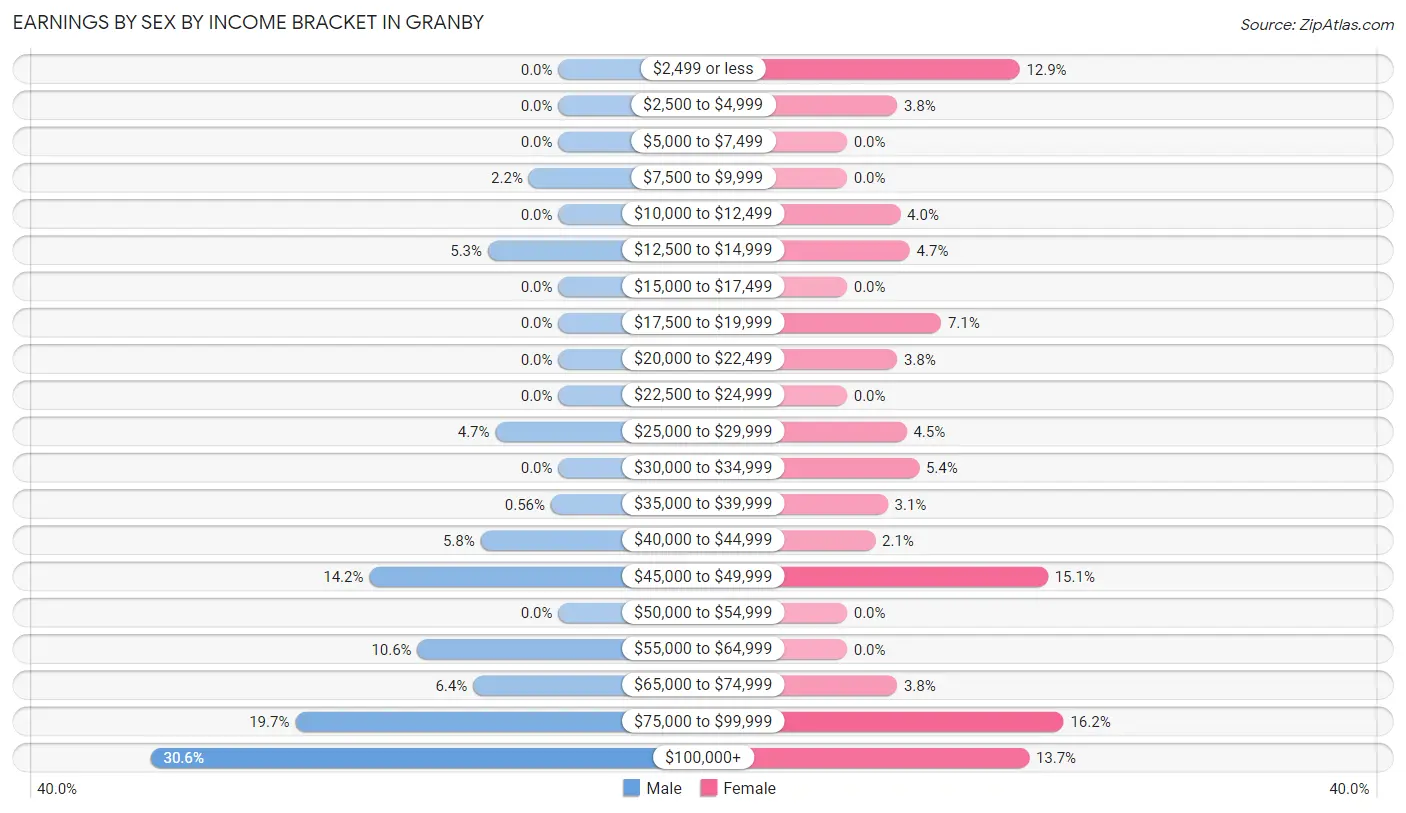
Earnings by Sex by Income Bracket in Granby
The most common earnings brackets in Granby are $100,000+ for men (110 | 30.6%) and $75,000 to $99,999 for women (69 | 16.2%).
| Income | Male | Female |
| $2,499 or less | 0 (0.0%) | 55 (12.9%) |
| $2,500 to $4,999 | 0 (0.0%) | 16 (3.8%) |
| $5,000 to $7,499 | 0 (0.0%) | 0 (0.0%) |
| $7,500 to $9,999 | 8 (2.2%) | 0 (0.0%) |
| $10,000 to $12,499 | 0 (0.0%) | 17 (4.0%) |
| $12,500 to $14,999 | 19 (5.3%) | 20 (4.7%) |
| $15,000 to $17,499 | 0 (0.0%) | 0 (0.0%) |
| $17,500 to $19,999 | 0 (0.0%) | 30 (7.1%) |
| $20,000 to $22,499 | 0 (0.0%) | 16 (3.8%) |
| $22,500 to $24,999 | 0 (0.0%) | 0 (0.0%) |
| $25,000 to $29,999 | 17 (4.7%) | 19 (4.5%) |
| $30,000 to $34,999 | 0 (0.0%) | 23 (5.4%) |
| $35,000 to $39,999 | 2 (0.6%) | 13 (3.1%) |
| $40,000 to $44,999 | 21 (5.8%) | 9 (2.1%) |
| $45,000 to $49,999 | 51 (14.2%) | 64 (15.1%) |
| $50,000 to $54,999 | 0 (0.0%) | 0 (0.0%) |
| $55,000 to $64,999 | 38 (10.6%) | 0 (0.0%) |
| $65,000 to $74,999 | 23 (6.4%) | 16 (3.8%) |
| $75,000 to $99,999 | 71 (19.7%) | 69 (16.2%) |
| $100,000+ | 110 (30.6%) | 58 (13.7%) |
| Total | 360 (100.0%) | 425 (100.0%) |
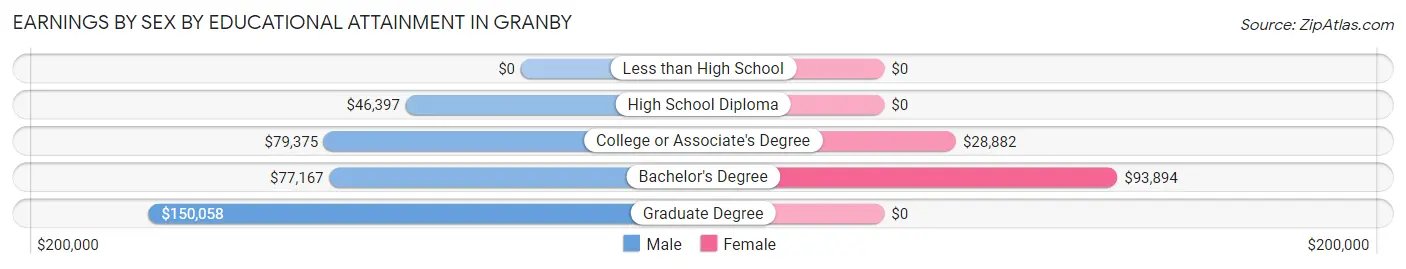
Earnings by Sex by Educational Attainment in Granby
Average earnings in Granby are $76,917 for men and $47,361 for women, a difference of 38.4%. Men with an educational attainment of graduate degree enjoy the highest average annual earnings of $150,058, while those with high school diploma education earn the least with $46,397. Women with an educational attainment of bachelor's degree earn the most with the average annual earnings of $93,894, while those with college or associate's degree education have the smallest earnings of $28,882.
| Educational Attainment | Male Income | Female Income |
| Less than High School | - | - |
| High School Diploma | $46,397 | $0 |
| College or Associate's Degree | $79,375 | $28,882 |
| Bachelor's Degree | $77,167 | $93,894 |
| Graduate Degree | $150,058 | $0 |
| Total | $76,917 | $47,361 |
Family Income in Granby
Family Income Brackets in Granby
According to the Granby family income data, there are 113 families falling into the $100,000 to $149,999 income range, which is the most common income bracket and makes up 33.9% of all families.
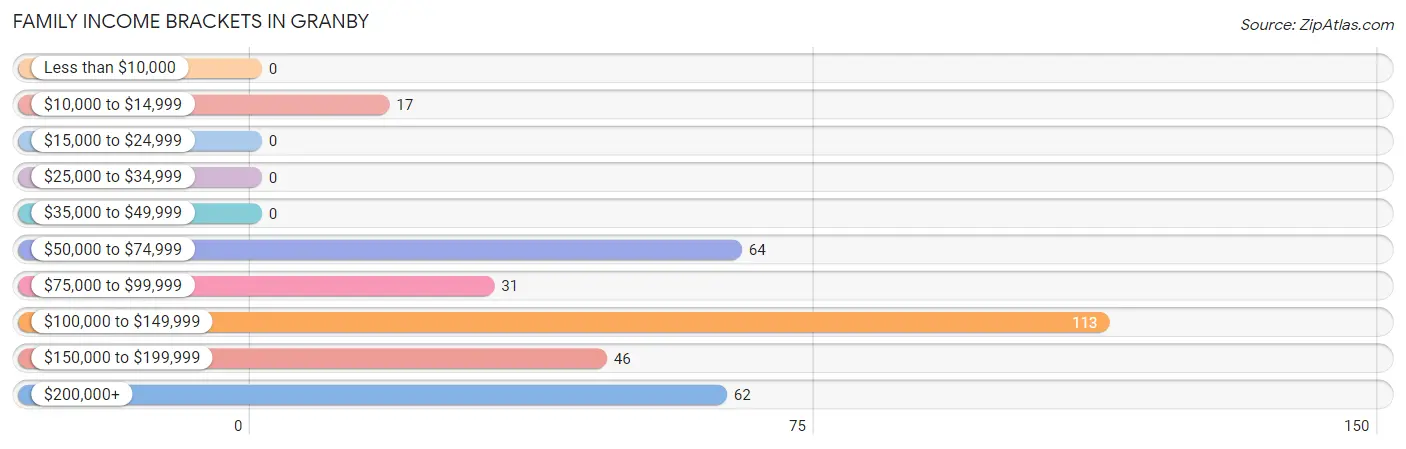
| Income Bracket | # Families | % Families |
| Less than $10,000 | 0 | 0.0% |
| $10,000 to $14,999 | 17 | 5.1% |
| $15,000 to $24,999 | 0 | 0.0% |
| $25,000 to $34,999 | 0 | 0.0% |
| $35,000 to $49,999 | 0 | 0.0% |
| $50,000 to $74,999 | 64 | 19.2% |
| $75,000 to $99,999 | 31 | 9.3% |
| $100,000 to $149,999 | 113 | 33.9% |
| $150,000 to $199,999 | 46 | 13.8% |
| $200,000+ | 62 | 18.6% |
Family Income by Famaliy Size in Granby
4-person families (132 | 39.6%) account for the highest median family income in Granby with $194,412 per family, while 4-person families (132 | 39.6%) have the highest median income of $48,603 per family member.
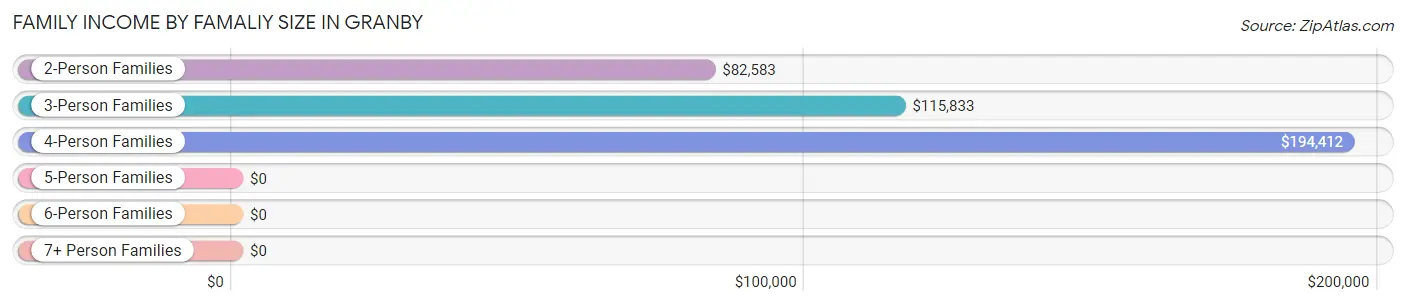
| Income Bracket | # Families | Median Income |
| 2-Person Families | 163 (48.9%) | $82,583 |
| 3-Person Families | 38 (11.4%) | $115,833 |
| 4-Person Families | 132 (39.6%) | $194,412 |
| 5-Person Families | 0 (0.0%) | $0 |
| 6-Person Families | 0 (0.0%) | $0 |
| 7+ Person Families | 0 (0.0%) | $0 |
| Total | 333 (100.0%) | $135,724 |
Family Income by Number of Earners in Granby
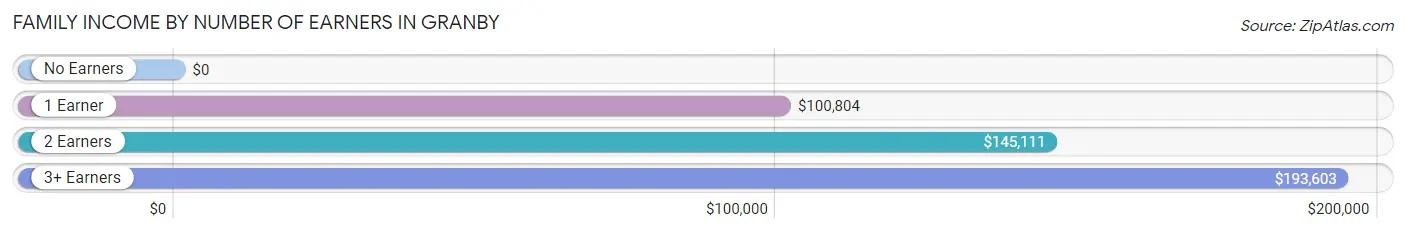
| Number of Earners | # Families | Median Income |
| No Earners | 15 (4.5%) | $0 |
| 1 Earner | 73 (21.9%) | $100,804 |
| 2 Earners | 188 (56.5%) | $145,111 |
| 3+ Earners | 57 (17.1%) | $193,603 |
| Total | 333 (100.0%) | $135,724 |
Household Income in Granby
Household Income Brackets in Granby
With 132 households falling in the category, the $100,000 to $149,999 income range is the most frequent in Granby, accounting for 26.7% of all households.
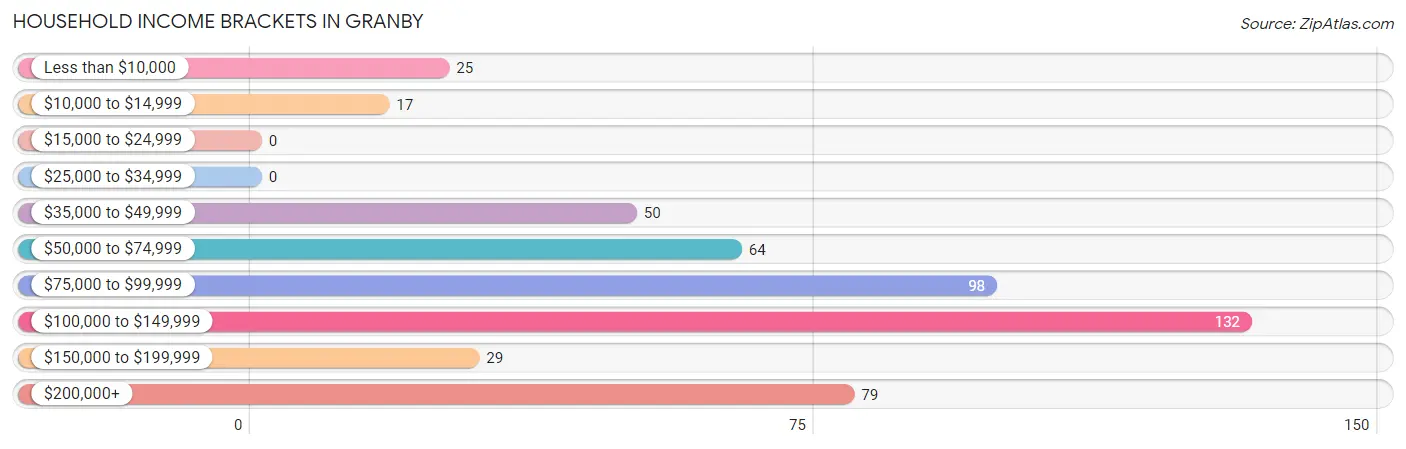
| Income Bracket | # Households | % Households |
| Less than $10,000 | 25 | 5.1% |
| $10,000 to $14,999 | 17 | 3.4% |
| $15,000 to $24,999 | 0 | 0.0% |
| $25,000 to $34,999 | 0 | 0.0% |
| $35,000 to $49,999 | 50 | 10.1% |
| $50,000 to $74,999 | 64 | 13.0% |
| $75,000 to $99,999 | 98 | 19.8% |
| $100,000 to $149,999 | 132 | 26.7% |
| $150,000 to $199,999 | 29 | 5.9% |
| $200,000+ | 79 | 16.0% |
Household Income by Householder Age in Granby
The median household income in Granby is $94,663, with the highest median household income of $145,333 found in the 25 to 44 years age bracket for the primary householder. A total of 78 households (15.8%) fall into this category. Meanwhile, the 15 to 24 years age bracket for the primary householder has the lowest median household income of $0, with 30 households (6.1%) in this group.
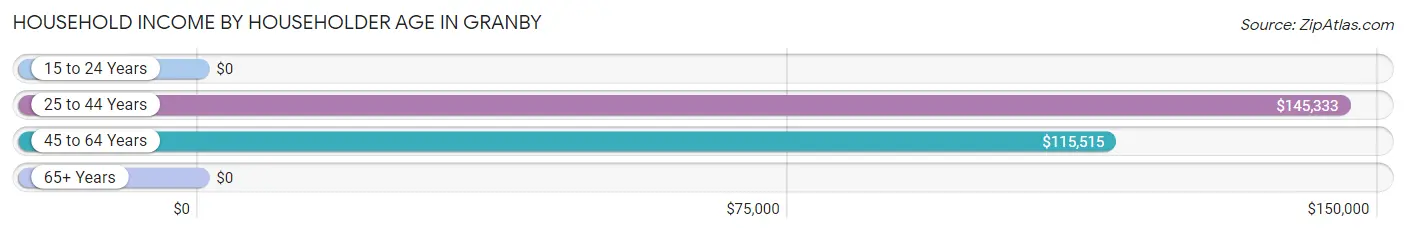
| Income Bracket | # Households | Median Income |
| 15 to 24 Years | 30 (6.1%) | $0 |
| 25 to 44 Years | 78 (15.8%) | $145,333 |
| 45 to 64 Years | 243 (49.2%) | $115,515 |
| 65+ Years | 143 (28.9%) | $0 |
| Total | 494 (100.0%) | $94,663 |
Poverty in Granby
Income Below Poverty by Sex and Age in Granby
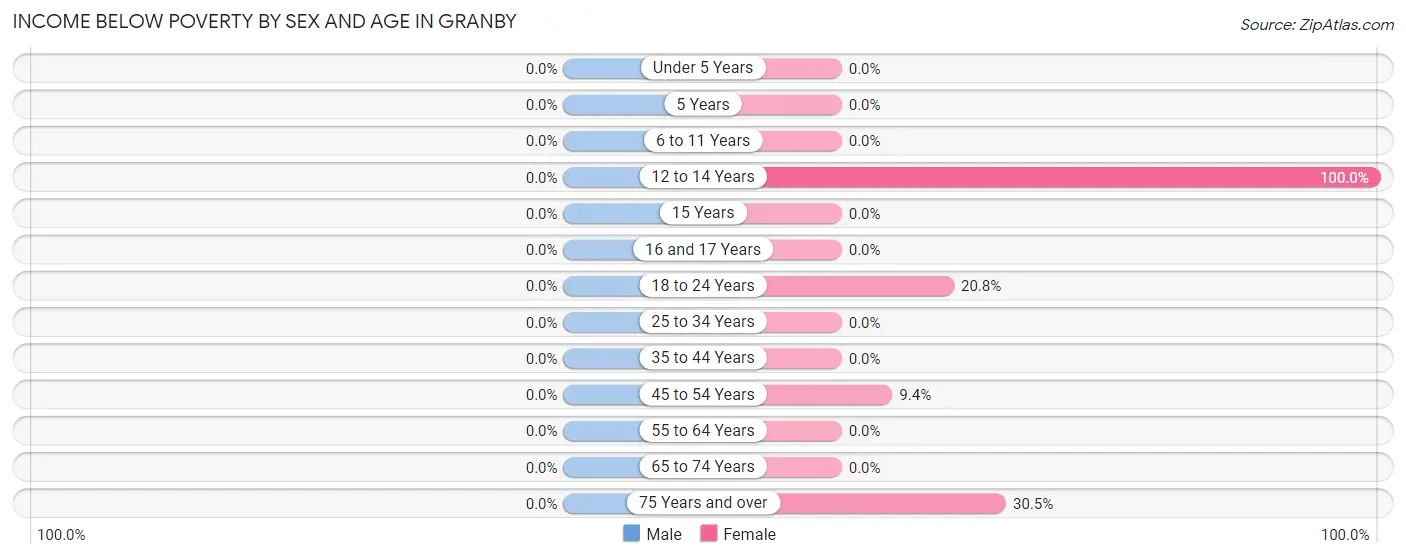
| Age Bracket | Male | Female |
| Under 5 Years | 0 (0.0%) | 0 (0.0%) |
| 5 Years | 0 (0.0%) | 0 (0.0%) |
| 6 to 11 Years | 0 (0.0%) | 0 (0.0%) |
| 12 to 14 Years | 0 (0.0%) | 18 (100.0%) |
| 15 Years | 0 (0.0%) | 0 (0.0%) |
| 16 and 17 Years | 0 (0.0%) | 0 (0.0%) |
| 18 to 24 Years | 0 (0.0%) | 20 (20.8%) |
| 25 to 34 Years | 0 (0.0%) | 0 (0.0%) |
| 35 to 44 Years | 0 (0.0%) | 0 (0.0%) |
| 45 to 54 Years | 0 (0.0%) | 17 (9.4%) |
| 55 to 64 Years | 0 (0.0%) | 0 (0.0%) |
| 65 to 74 Years | 0 (0.0%) | 0 (0.0%) |
| 75 Years and over | 0 (0.0%) | 25 (30.5%) |
| Total | 0 (0.0%) | 80 (12.4%) |
Income Above Poverty by Sex and Age in Granby
According to the poverty statistics in Granby, males aged 6 to 11 years and females aged 6 to 11 years are the age groups that are most secure financially, with 100.0% of males and 100.0% of females in these age groups living above the poverty line.
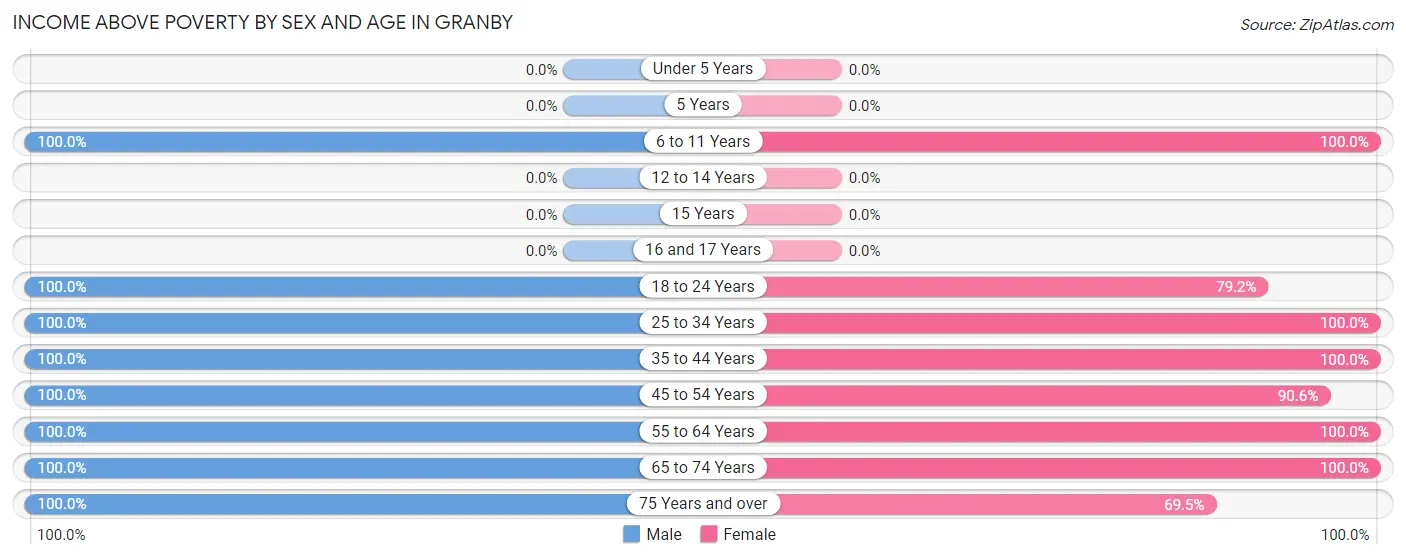
| Age Bracket | Male | Female |
| Under 5 Years | 0 (0.0%) | 0 (0.0%) |
| 5 Years | 0 (0.0%) | 0 (0.0%) |
| 6 to 11 Years | 124 (100.0%) | 54 (100.0%) |
| 12 to 14 Years | 0 (0.0%) | 0 (0.0%) |
| 15 Years | 0 (0.0%) | 0 (0.0%) |
| 16 and 17 Years | 0 (0.0%) | 0 (0.0%) |
| 18 to 24 Years | 21 (100.0%) | 76 (79.2%) |
| 25 to 34 Years | 55 (100.0%) | 7 (100.0%) |
| 35 to 44 Years | 59 (100.0%) | 64 (100.0%) |
| 45 to 54 Years | 121 (100.0%) | 164 (90.6%) |
| 55 to 64 Years | 103 (100.0%) | 52 (100.0%) |
| 65 to 74 Years | 14 (100.0%) | 91 (100.0%) |
| 75 Years and over | 34 (100.0%) | 57 (69.5%) |
| Total | 531 (100.0%) | 565 (87.6%) |
Income Below Poverty Among Married-Couple Families in Granby
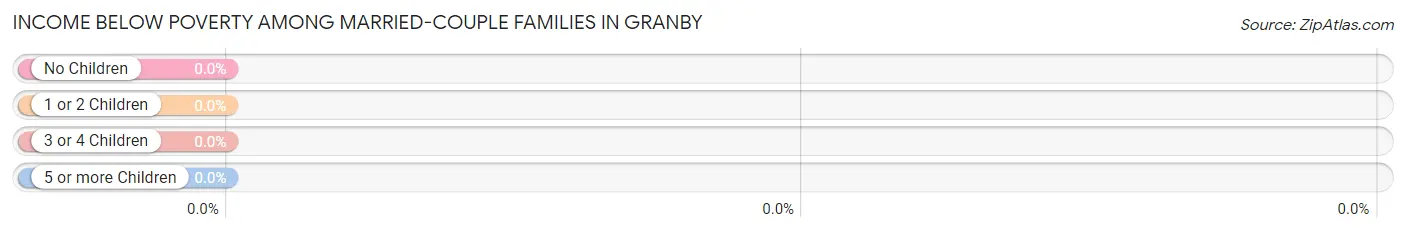
| Children | Above Poverty | Below Poverty |
| No Children | 174 (100.0%) | 0 (0.0%) |
| 1 or 2 Children | 88 (100.0%) | 0 (0.0%) |
| 3 or 4 Children | 0 (0.0%) | 0 (0.0%) |
| 5 or more Children | 0 (0.0%) | 0 (0.0%) |
| Total | 262 (100.0%) | 0 (0.0%) |
Income Below Poverty Among Single-Parent Households in Granby

| Children | Single Father | Single Mother |
| No Children | 0 (0.0%) | 0 (0.0%) |
| 1 or 2 Children | 0 (0.0%) | 17 (100.0%) |
| 3 or 4 Children | 0 (0.0%) | 0 (0.0%) |
| 5 or more Children | 0 (0.0%) | 0 (0.0%) |
| Total | 0 (0.0%) | 17 (34.7%) |
Income Below Poverty Among Married-Couple vs Single-Parent Households in Granby
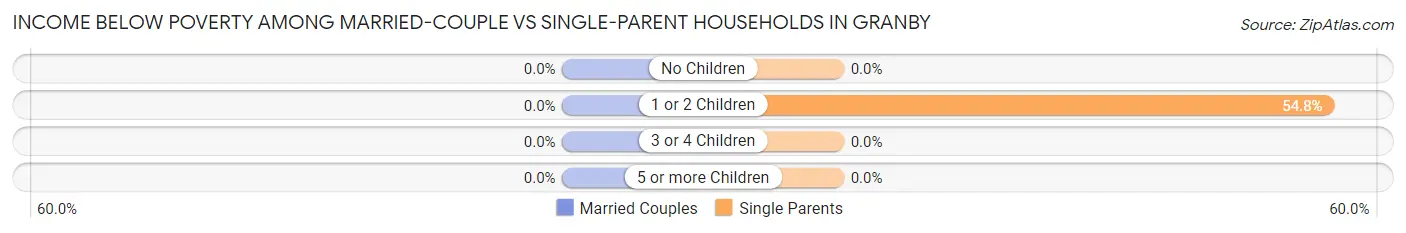
| Children | Married-Couple Families | Single-Parent Households |
| No Children | 0 (0.0%) | 0 (0.0%) |
| 1 or 2 Children | 0 (0.0%) | 17 (54.8%) |
| 3 or 4 Children | 0 (0.0%) | 0 (0.0%) |
| 5 or more Children | 0 (0.0%) | 0 (0.0%) |
| Total | 0 (0.0%) | 17 (23.9%) |
Race in Granby
The most populous races in Granby are White / Caucasian (1,117 | 95.0%), Hispanic or Latino (76 | 6.5%), and Two or more Races (59 | 5.0%).
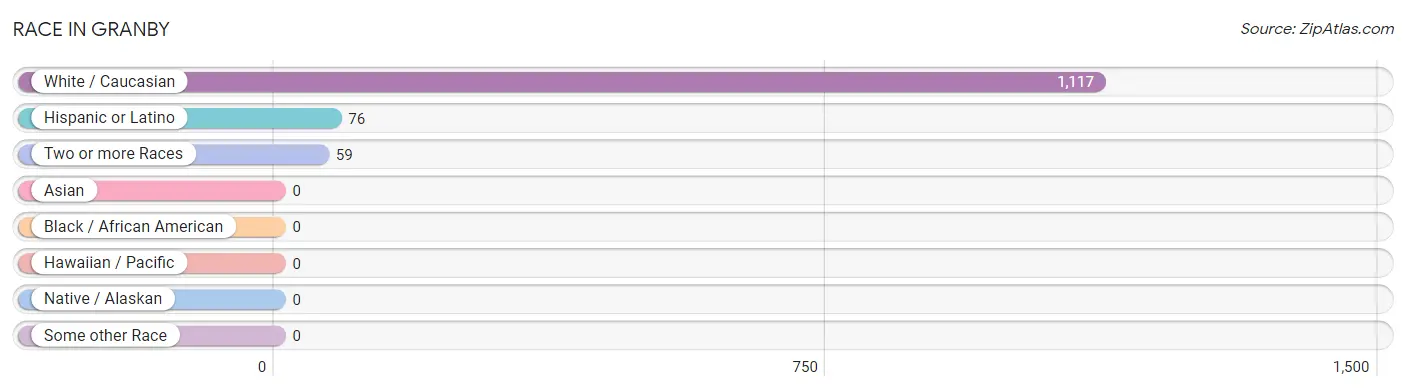
| Race | # Population | % Population |
| Asian | 0 | 0.0% |
| Black / African American | 0 | 0.0% |
| Hawaiian / Pacific | 0 | 0.0% |
| Hispanic or Latino | 76 | 6.5% |
| Native / Alaskan | 0 | 0.0% |
| White / Caucasian | 1,117 | 95.0% |
| Two or more Races | 59 | 5.0% |
| Some other Race | 0 | 0.0% |
| Total | 1,176 | 100.0% |
Ancestry in Granby
The most populous ancestries reported in Granby are Irish (244 | 20.7%), French (181 | 15.4%), American (165 | 14.0%), French Canadian (130 | 11.1%), and English (127 | 10.8%), together accounting for 72.0% of all Granby residents.
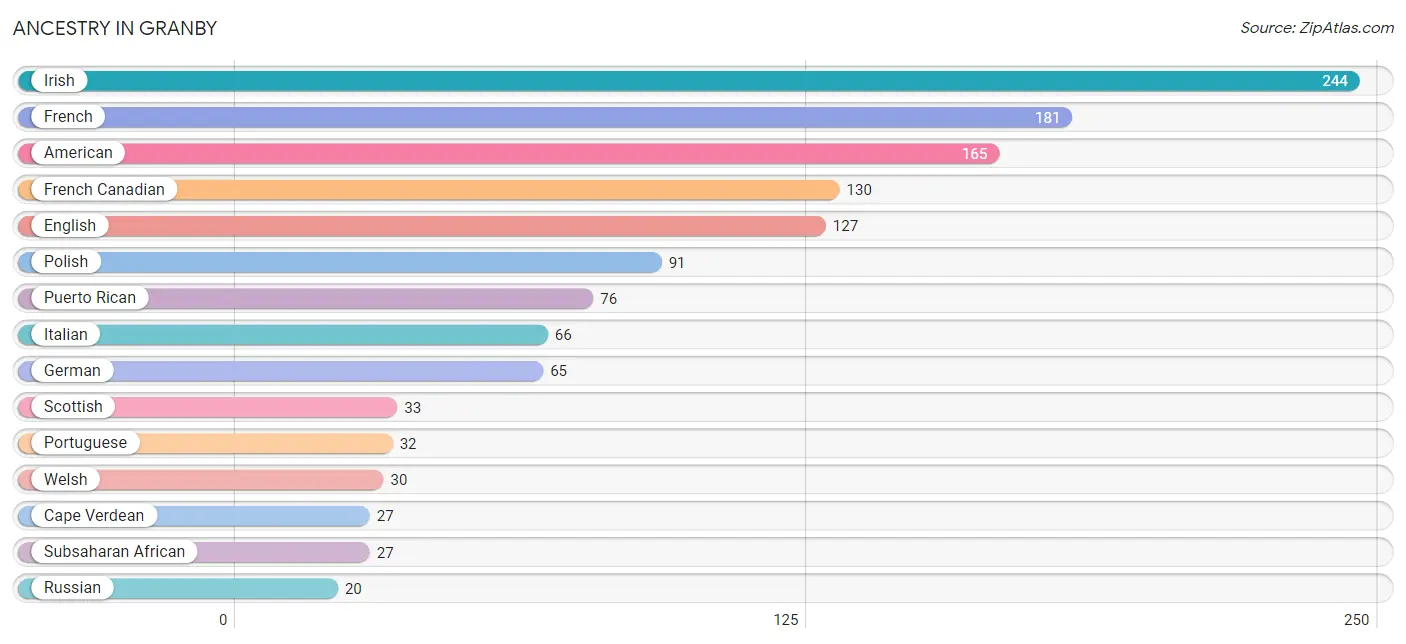
| Ancestry | # Population | % Population |
| American | 165 | 14.0% |
| British | 19 | 1.6% |
| Cape Verdean | 27 | 2.3% |
| Eastern European | 15 | 1.3% |
| English | 127 | 10.8% |
| French | 181 | 15.4% |
| French Canadian | 130 | 11.1% |
| German | 65 | 5.5% |
| Greek | 16 | 1.4% |
| Irish | 244 | 20.7% |
| Italian | 66 | 5.6% |
| Polish | 91 | 7.7% |
| Portuguese | 32 | 2.7% |
| Puerto Rican | 76 | 6.5% |
| Russian | 20 | 1.7% |
| Scottish | 33 | 2.8% |
| Subsaharan African | 27 | 2.3% |
| Welsh | 30 | 2.5% | View All 18 Rows |
Immigrants in Granby
The most numerous immigrant groups reported in Granby came from Europe (45 | 3.8%), Germany (25 | 2.1%), Western Europe (25 | 2.1%), Italy (20 | 1.7%), and Southern Europe (20 | 1.7%), together accounting for 11.5% of all Granby residents.
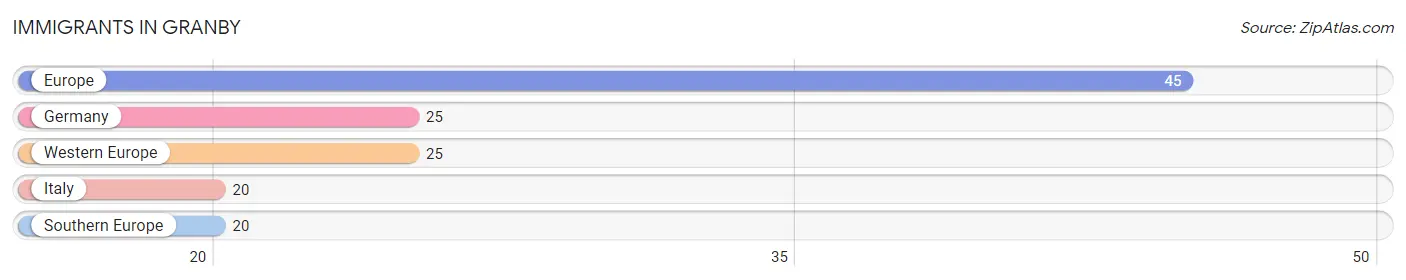
| Immigration Origin | # Population | % Population |
| Europe | 45 | 3.8% |
| Germany | 25 | 2.1% |
| Italy | 20 | 1.7% |
| Southern Europe | 20 | 1.7% |
| Western Europe | 25 | 2.1% | View All 5 Rows |
Sex and Age in Granby
Sex and Age in Granby
The most populous age groups in Granby are 5 to 9 Years (124 | 23.4%) for men and 45 to 49 Years (137 | 21.2%) for women.
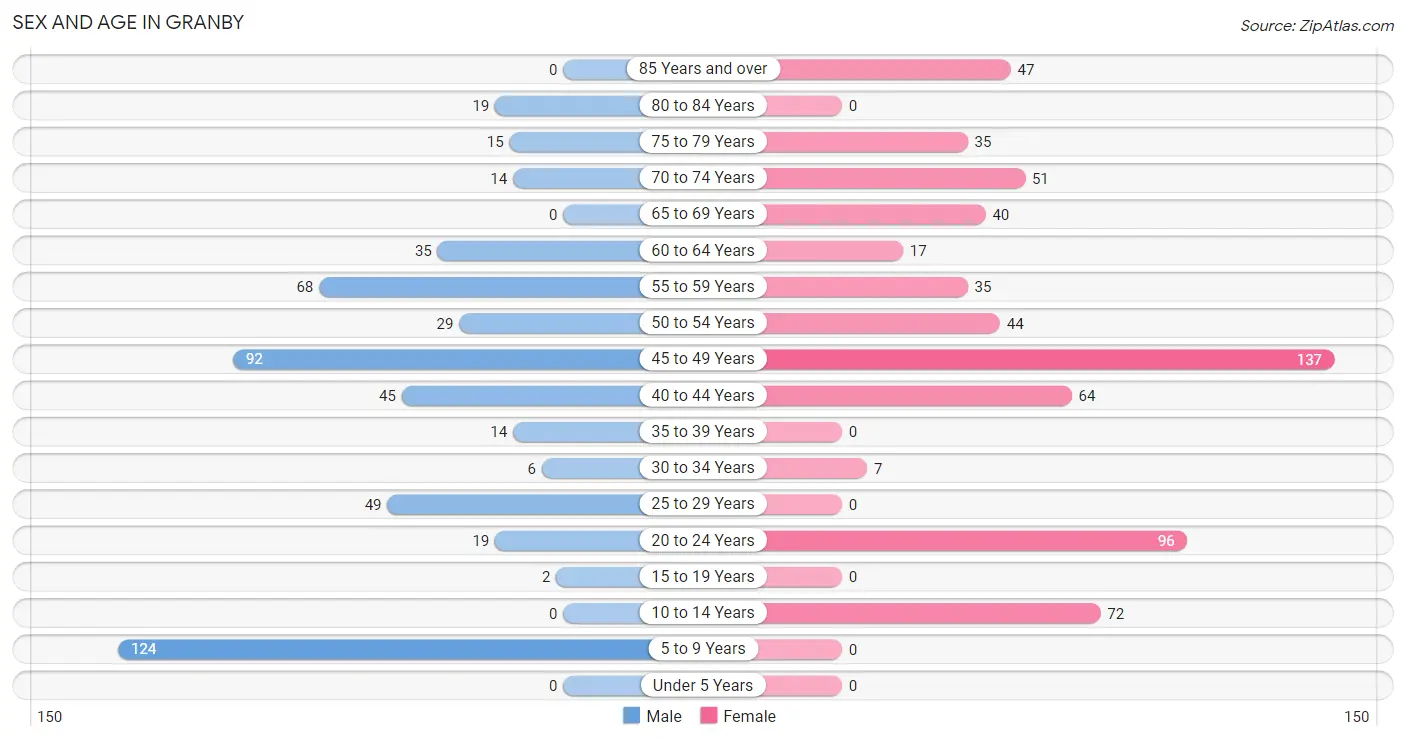
| Age Bracket | Male | Female |
| Under 5 Years | 0 (0.0%) | 0 (0.0%) |
| 5 to 9 Years | 124 (23.4%) | 0 (0.0%) |
| 10 to 14 Years | 0 (0.0%) | 72 (11.2%) |
| 15 to 19 Years | 2 (0.4%) | 0 (0.0%) |
| 20 to 24 Years | 19 (3.6%) | 96 (14.9%) |
| 25 to 29 Years | 49 (9.2%) | 0 (0.0%) |
| 30 to 34 Years | 6 (1.1%) | 7 (1.1%) |
| 35 to 39 Years | 14 (2.6%) | 0 (0.0%) |
| 40 to 44 Years | 45 (8.5%) | 64 (9.9%) |
| 45 to 49 Years | 92 (17.3%) | 137 (21.2%) |
| 50 to 54 Years | 29 (5.5%) | 44 (6.8%) |
| 55 to 59 Years | 68 (12.8%) | 35 (5.4%) |
| 60 to 64 Years | 35 (6.6%) | 17 (2.6%) |
| 65 to 69 Years | 0 (0.0%) | 40 (6.2%) |
| 70 to 74 Years | 14 (2.6%) | 51 (7.9%) |
| 75 to 79 Years | 15 (2.8%) | 35 (5.4%) |
| 80 to 84 Years | 19 (3.6%) | 0 (0.0%) |
| 85 Years and over | 0 (0.0%) | 47 (7.3%) |
| Total | 531 (100.0%) | 645 (100.0%) |
Families and Households in Granby
Median Family Size in Granby
The median family size in Granby is 2.83 persons per family, with married-couple families (262 | 78.7%) accounting for the largest median family size of 2.93 persons per family. On the other hand, single male/father families (22 | 6.6%) represent the smallest median family size with 1.86 persons per family.
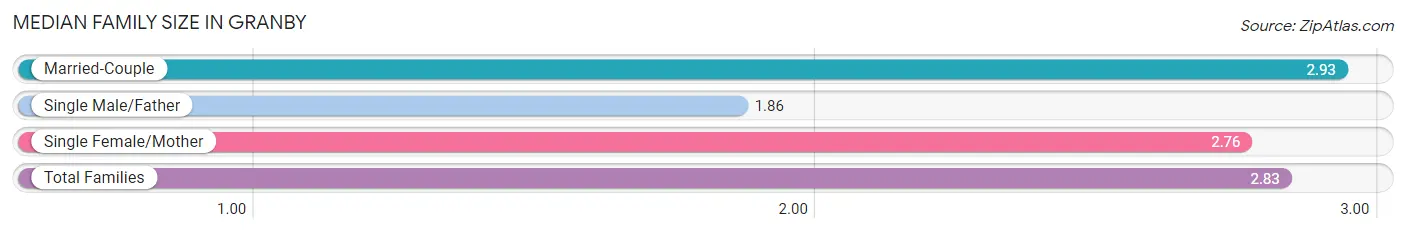
| Family Type | # Families | Family Size |
| Married-Couple | 262 (78.7%) | 2.93 |
| Single Male/Father | 22 (6.6%) | 1.86 |
| Single Female/Mother | 49 (14.7%) | 2.76 |
| Total Families | 333 (100.0%) | 2.83 |
Median Household Size in Granby
The median household size in Granby is 2.38 persons per household, with single female/mother households (49 | 9.9%) accounting for the largest median household size of 3.18 persons per household. non-family households (161 | 32.6%) represent the smallest median household size with 1.09 persons per household.
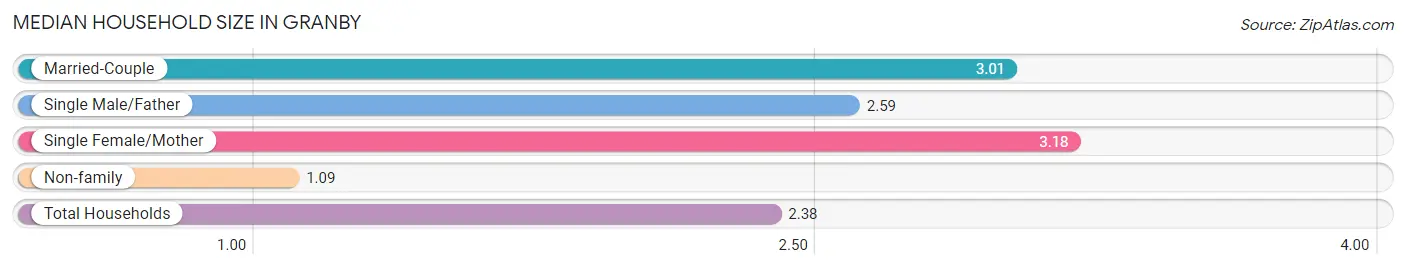
| Household Type | # Households | Household Size |
| Married-Couple | 262 (53.0%) | 3.01 |
| Single Male/Father | 22 (4.4%) | 2.59 |
| Single Female/Mother | 49 (9.9%) | 3.18 |
| Non-family | 161 (32.6%) | 1.09 |
| Total Households | 494 (100.0%) | 2.38 |
Household Size by Marriage Status in Granby
Out of a total of 494 households in Granby, 333 (67.4%) are family households, while 161 (32.6%) are nonfamily households. The most numerous type of family households are 2-person households, comprising 149, and the most common type of nonfamily households are 1-person households, comprising 142.
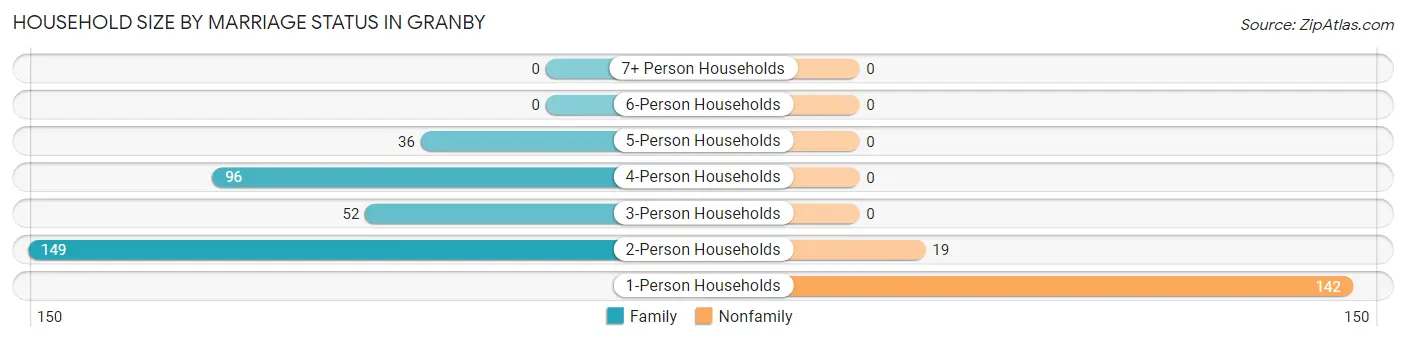
| Household Size | Family Households | Nonfamily Households |
| 1-Person Households | - | 142 (28.7%) |
| 2-Person Households | 149 (30.2%) | 19 (3.8%) |
| 3-Person Households | 52 (10.5%) | 0 (0.0%) |
| 4-Person Households | 96 (19.4%) | 0 (0.0%) |
| 5-Person Households | 36 (7.3%) | 0 (0.0%) |
| 6-Person Households | 0 (0.0%) | 0 (0.0%) |
| 7+ Person Households | 0 (0.0%) | 0 (0.0%) |
| Total | 333 (67.4%) | 161 (32.6%) |
Female Fertility in Granby
Fertility by Age in Granby
| Age Bracket | Women with Births | Births / 1,000 Women |
| 15 to 19 years | 0 (0.0%) | 0.0 |
| 20 to 34 years | 0 (0.0%) | 0.0 |
| 35 to 50 years | 0 (0.0%) | 0.0 |
| Total | 0 (0.0%) | 0.0 |
Fertility by Age by Marriage Status in Granby
| Age Bracket | Married | Unmarried |
| 15 to 19 years | 0 (0.0%) | 0 (0.0%) |
| 20 to 34 years | 0 (0.0%) | 0 (0.0%) |
| 35 to 50 years | 0 (0.0%) | 0 (0.0%) |
| Total | 0 (0.0%) | 0 (0.0%) |
Fertility by Education in Granby
| Educational Attainment | Women with Births | Births / 1,000 Women |
| Less than High School | 0 (0.0%) | 0.0 |
| High School Diploma | 0 (0.0%) | 0.0 |
| College or Associate's Degree | 0 (0.0%) | 0.0 |
| Bachelor's Degree | 0 (0.0%) | 0.0 |
| Graduate Degree | 0 (0.0%) | 0.0 |
| Total | 0 (0.0%) | 0.0 |
Fertility by Education by Marriage Status in Granby
| Educational Attainment | Married | Unmarried |
| Less than High School | 0 (0.0%) | 0 (0.0%) |
| High School Diploma | 0 (0.0%) | 0 (0.0%) |
| College or Associate's Degree | 0 (0.0%) | 0 (0.0%) |
| Bachelor's Degree | 0 (0.0%) | 0 (0.0%) |
| Graduate Degree | 0 (0.0%) | 0 (0.0%) |
| Total | 0 (0.0%) | 0 (0.0%) |
Employment Characteristics in Granby
Employment by Class of Employer in Granby
Among the 711 employed individuals in Granby, private company employees (402 | 56.5%), local government employees (115 | 16.2%), and state government employees (101 | 14.2%) make up the most common classes of employment.
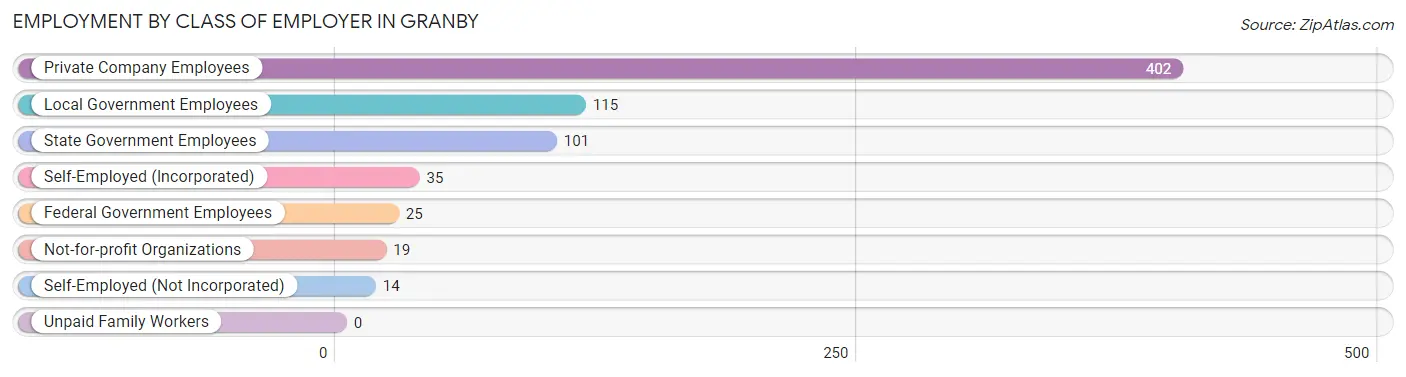
| Employer Class | # Employees | % Employees |
| Private Company Employees | 402 | 56.5% |
| Self-Employed (Incorporated) | 35 | 4.9% |
| Self-Employed (Not Incorporated) | 14 | 2.0% |
| Not-for-profit Organizations | 19 | 2.7% |
| Local Government Employees | 115 | 16.2% |
| State Government Employees | 101 | 14.2% |
| Federal Government Employees | 25 | 3.5% |
| Unpaid Family Workers | 0 | 0.0% |
| Total | 711 | 100.0% |
Employment Status by Age in Granby
According to the labor force statistics for Granby, out of the total population over 16 years of age (980), 79.9% or 783 individuals are in the labor force, with 4.3% or 34 of them unemployed. The age group with the highest labor force participation rate is 16 to 19 years, with 100.0% or 2 individuals in the labor force. Within the labor force, the 65 to 74 years age range has the highest percentage of unemployed individuals, with 25.5% or 14 of them being unemployed.
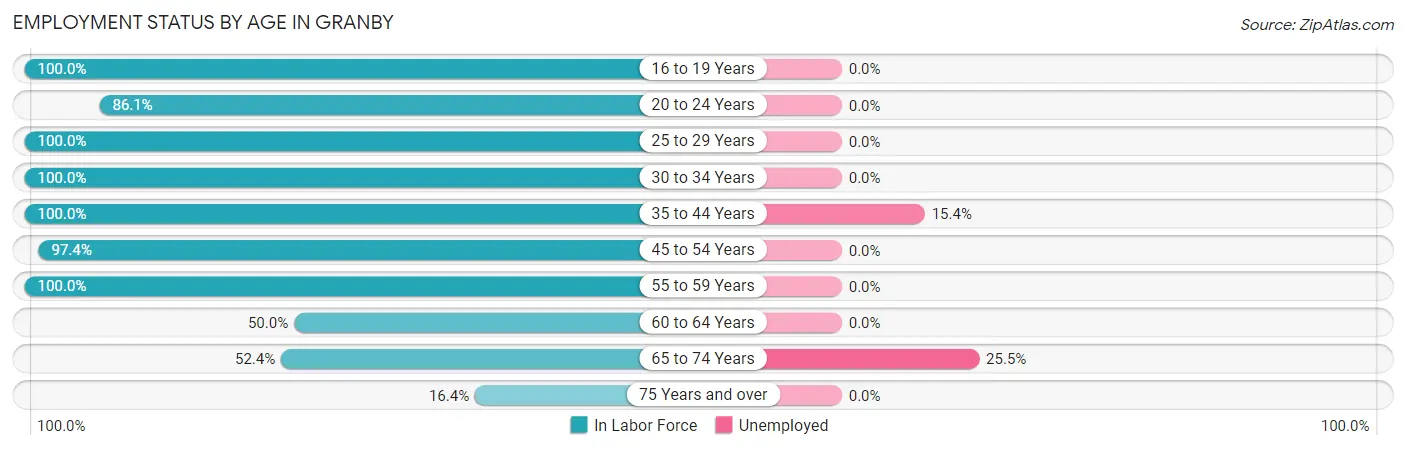
| Age Bracket | In Labor Force | Unemployed |
| 16 to 19 Years | 2 (100.0%) | 0 (0.0%) |
| 20 to 24 Years | 99 (86.1%) | 0 (0.0%) |
| 25 to 29 Years | 49 (100.0%) | 0 (0.0%) |
| 30 to 34 Years | 13 (100.0%) | 0 (0.0%) |
| 35 to 44 Years | 123 (100.0%) | 19 (15.4%) |
| 45 to 54 Years | 294 (97.4%) | 0 (0.0%) |
| 55 to 59 Years | 103 (100.0%) | 0 (0.0%) |
| 60 to 64 Years | 26 (50.0%) | 0 (0.0%) |
| 65 to 74 Years | 55 (52.4%) | 14 (25.5%) |
| 75 Years and over | 19 (16.4%) | 0 (0.0%) |
| Total | 783 (79.9%) | 34 (4.3%) |
Employment Status by Educational Attainment in Granby
According to labor force statistics for Granby, 94.7% of individuals (608) out of the total population between 25 and 64 years of age (642) are in the labor force, with 3.2% or 19 of them being unemployed. The group with the highest labor force participation rate are those with the educational attainment of bachelor's degree or higher, with 100.0% or 373 individuals in the labor force. Within the labor force, individuals with college / associate degree education have the highest percentage of unemployment, with 18.4% or 22 of them being unemployed.
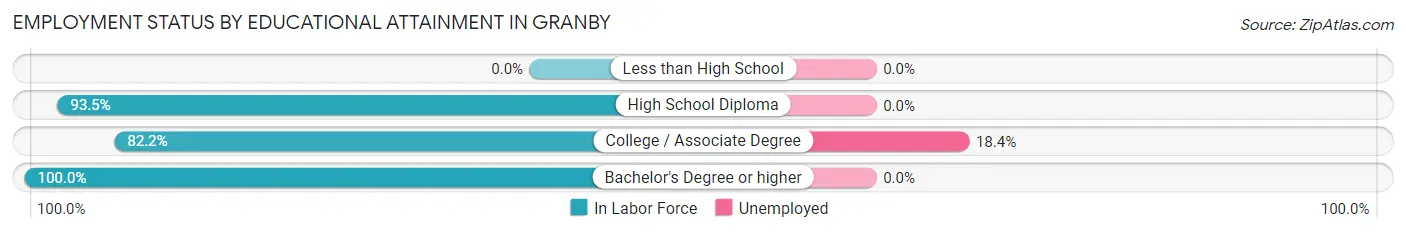
| Educational Attainment | In Labor Force | Unemployed |
| Less than High School | 0 (0.0%) | 0 (0.0%) |
| High School Diploma | 115 (93.5%) | 0 (0.0%) |
| College / Associate Degree | 120 (82.2%) | 27 (18.4%) |
| Bachelor's Degree or higher | 373 (100.0%) | 0 (0.0%) |
| Total | 608 (94.7%) | 21 (3.2%) |
Employment Occupations by Sex in Granby
Management, Business, Science and Arts Occupations
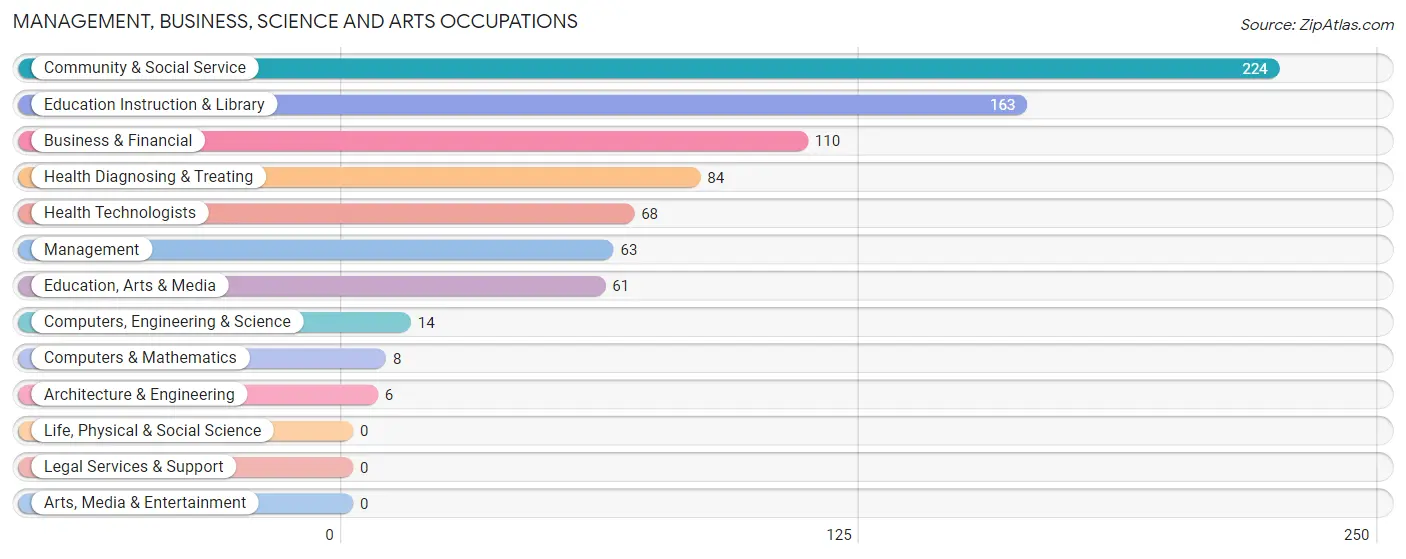
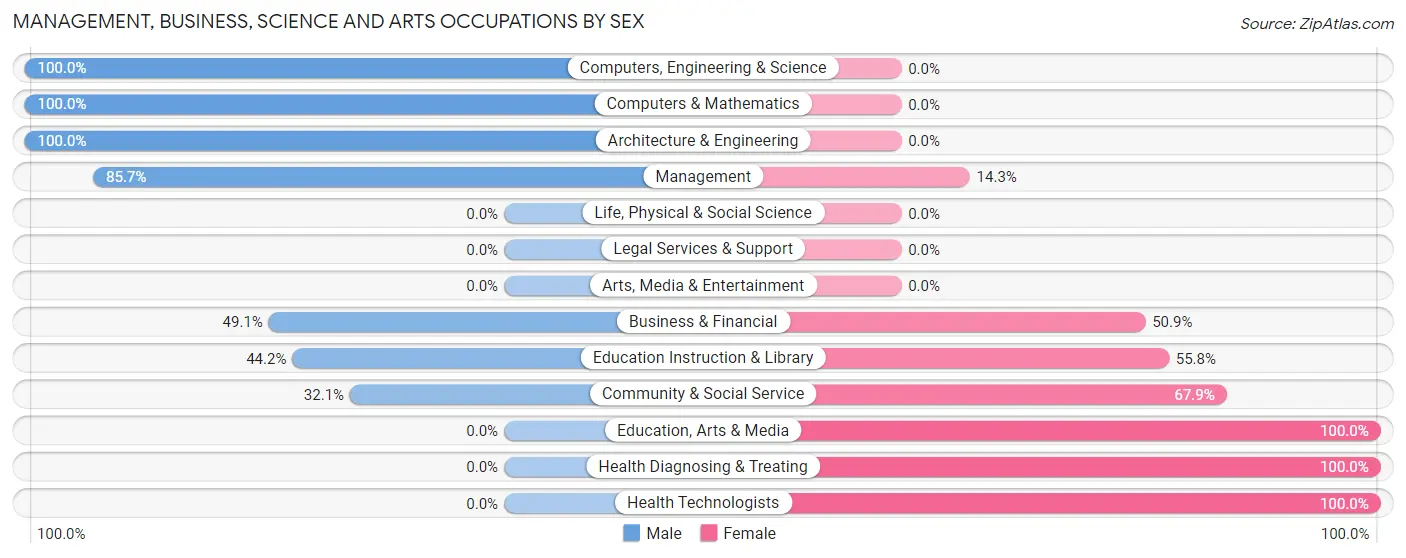
The most common Management, Business, Science and Arts occupations in Granby are Community & Social Service (224 | 30.6%), Education Instruction & Library (163 | 22.2%), Business & Financial (110 | 15.0%), Health Diagnosing & Treating (84 | 11.5%), and Health Technologists (68 | 9.3%).
Management, Business, Science and Arts Occupations by Sex
Within the Management, Business, Science and Arts occupations in Granby, the most male-oriented occupations are Computers, Engineering & Science (100.0%), Computers & Mathematics (100.0%), and Architecture & Engineering (100.0%), while the most female-oriented occupations are Education, Arts & Media (100.0%), Health Diagnosing & Treating (100.0%), and Health Technologists (100.0%).
| Occupation | Male | Female |
| Management | 54 (85.7%) | 9 (14.3%) |
| Business & Financial | 54 (49.1%) | 56 (50.9%) |
| Computers, Engineering & Science | 14 (100.0%) | 0 (0.0%) |
| Computers & Mathematics | 8 (100.0%) | 0 (0.0%) |
| Architecture & Engineering | 6 (100.0%) | 0 (0.0%) |
| Life, Physical & Social Science | 0 (0.0%) | 0 (0.0%) |
| Community & Social Service | 72 (32.1%) | 152 (67.9%) |
| Education, Arts & Media | 0 (0.0%) | 61 (100.0%) |
| Legal Services & Support | 0 (0.0%) | 0 (0.0%) |
| Education Instruction & Library | 72 (44.2%) | 91 (55.8%) |
| Arts, Media & Entertainment | 0 (0.0%) | 0 (0.0%) |
| Health Diagnosing & Treating | 0 (0.0%) | 84 (100.0%) |
| Health Technologists | 0 (0.0%) | 68 (100.0%) |
| Total (Category) | 194 (39.2%) | 301 (60.8%) |
| Total (Overall) | 343 (46.8%) | 390 (53.2%) |
Services Occupations
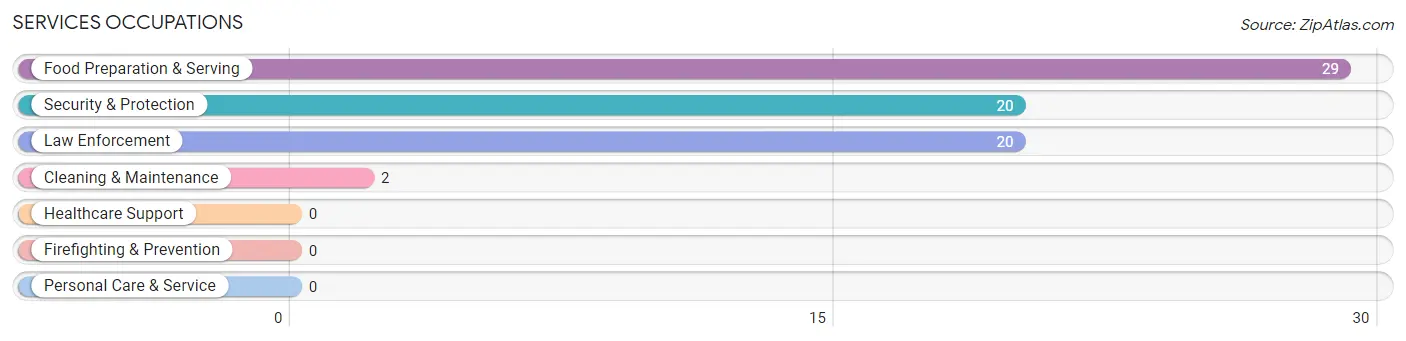
The most common Services occupations in Granby are Food Preparation & Serving (29 | 4.0%), Security & Protection (20 | 2.7%), Law Enforcement (20 | 2.7%), and Cleaning & Maintenance (2 | 0.3%).
Services Occupations by Sex
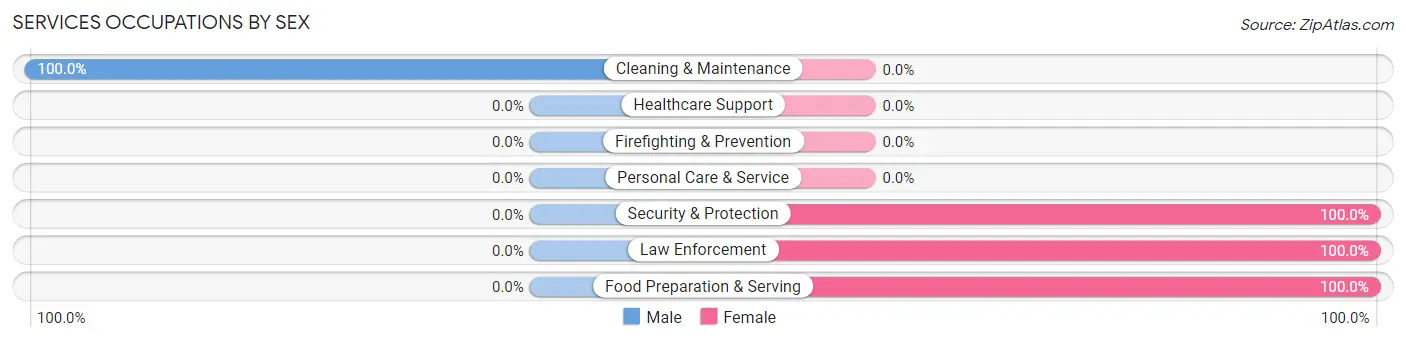
| Occupation | Male | Female |
| Healthcare Support | 0 (0.0%) | 0 (0.0%) |
| Security & Protection | 0 (0.0%) | 20 (100.0%) |
| Firefighting & Prevention | 0 (0.0%) | 0 (0.0%) |
| Law Enforcement | 0 (0.0%) | 20 (100.0%) |
| Food Preparation & Serving | 0 (0.0%) | 29 (100.0%) |
| Cleaning & Maintenance | 2 (100.0%) | 0 (0.0%) |
| Personal Care & Service | 0 (0.0%) | 0 (0.0%) |
| Total (Category) | 2 (3.9%) | 49 (96.1%) |
| Total (Overall) | 343 (46.8%) | 390 (53.2%) |
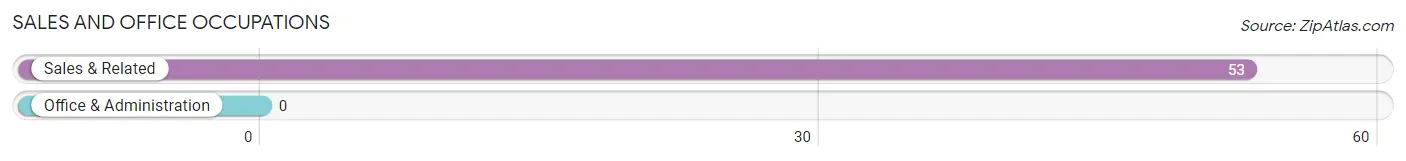
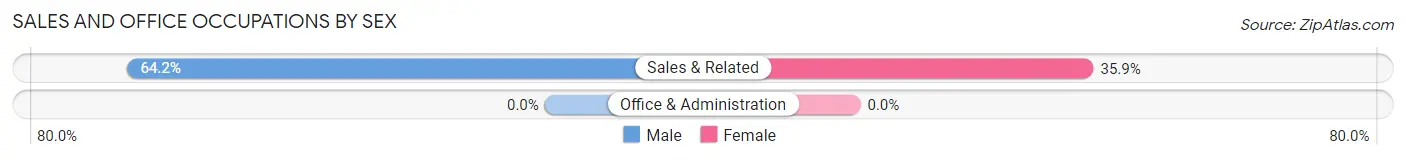
Sales and Office Occupations
The most common Sales and Office occupations in Granby are , and Sales & Related (53 | 7.2%).
Sales and Office Occupations by Sex
| Occupation | Male | Female |
| Sales & Related | 34 (64.1%) | 19 (35.8%) |
| Office & Administration | 0 (0.0%) | 0 (0.0%) |
| Total (Category) | 34 (64.1%) | 19 (35.8%) |
| Total (Overall) | 343 (46.8%) | 390 (53.2%) |
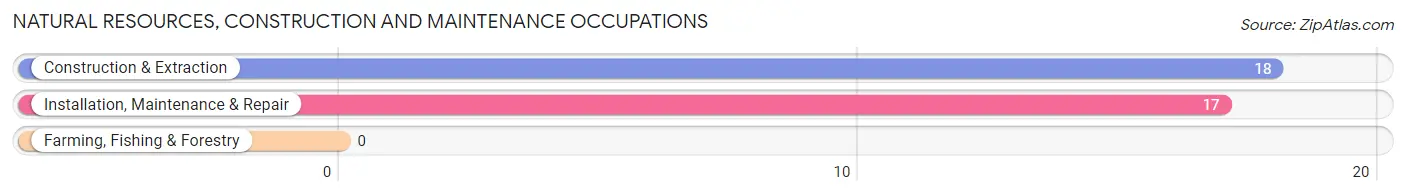
Natural Resources, Construction and Maintenance Occupations
The most common Natural Resources, Construction and Maintenance occupations in Granby are Construction & Extraction (18 | 2.5%), and Installation, Maintenance & Repair (17 | 2.3%).
Natural Resources, Construction and Maintenance Occupations by Sex
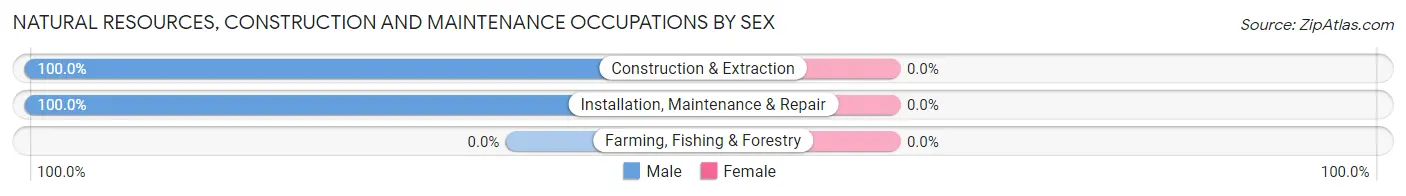
| Occupation | Male | Female |
| Farming, Fishing & Forestry | 0 (0.0%) | 0 (0.0%) |
| Construction & Extraction | 18 (100.0%) | 0 (0.0%) |
| Installation, Maintenance & Repair | 17 (100.0%) | 0 (0.0%) |
| Total (Category) | 35 (100.0%) | 0 (0.0%) |
| Total (Overall) | 343 (46.8%) | 390 (53.2%) |
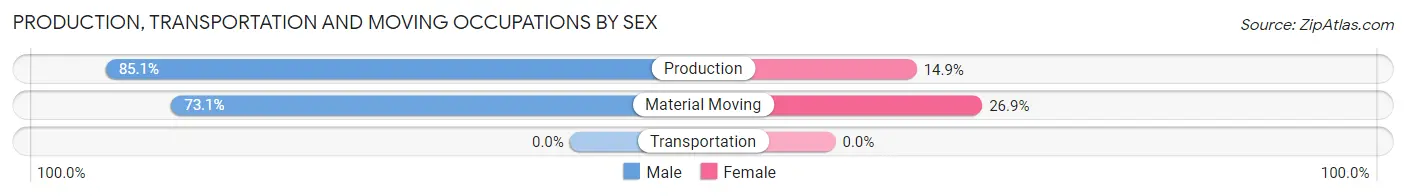
Production, Transportation and Moving Occupations
The most common Production, Transportation and Moving occupations in Granby are Material Moving (52 | 7.1%), and Production (47 | 6.4%).
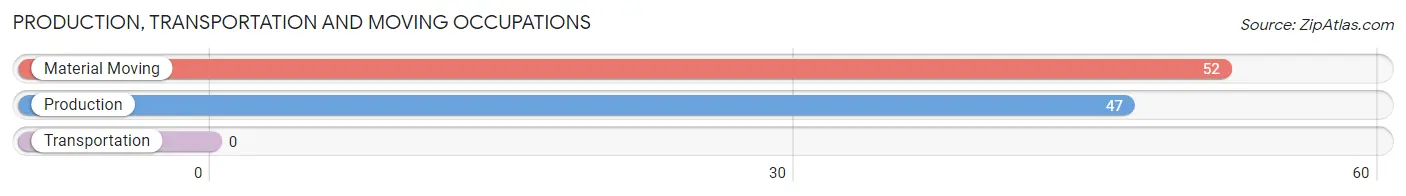
Production, Transportation and Moving Occupations by Sex
| Occupation | Male | Female |
| Production | 40 (85.1%) | 7 (14.9%) |
| Transportation | 0 (0.0%) | 0 (0.0%) |
| Material Moving | 38 (73.1%) | 14 (26.9%) |
| Total (Category) | 78 (78.8%) | 21 (21.2%) |
| Total (Overall) | 343 (46.8%) | 390 (53.2%) |
Employment Industries by Sex in Granby
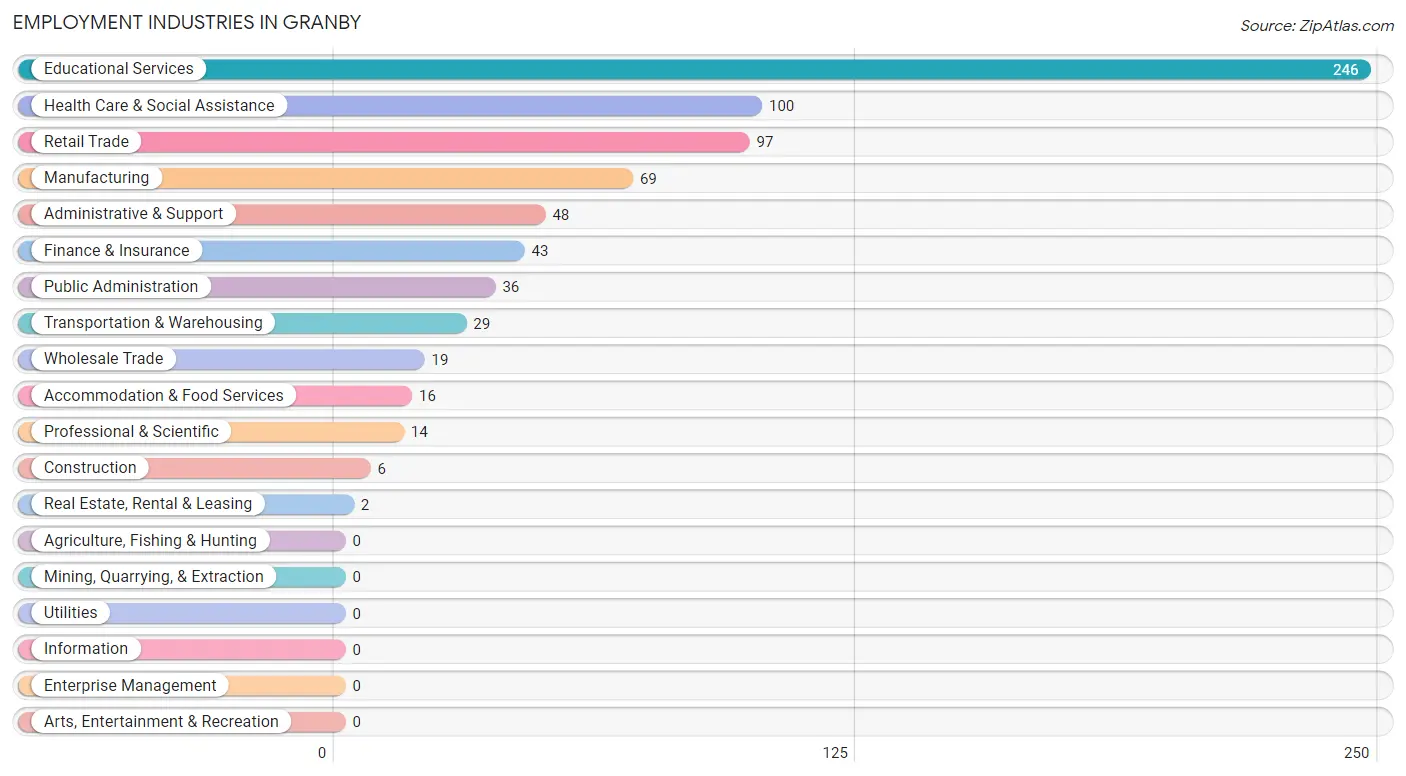
Employment Industries in Granby
The major employment industries in Granby include Educational Services (246 | 33.6%), Health Care & Social Assistance (100 | 13.6%), Retail Trade (97 | 13.2%), Manufacturing (69 | 9.4%), and Administrative & Support (48 | 6.6%).
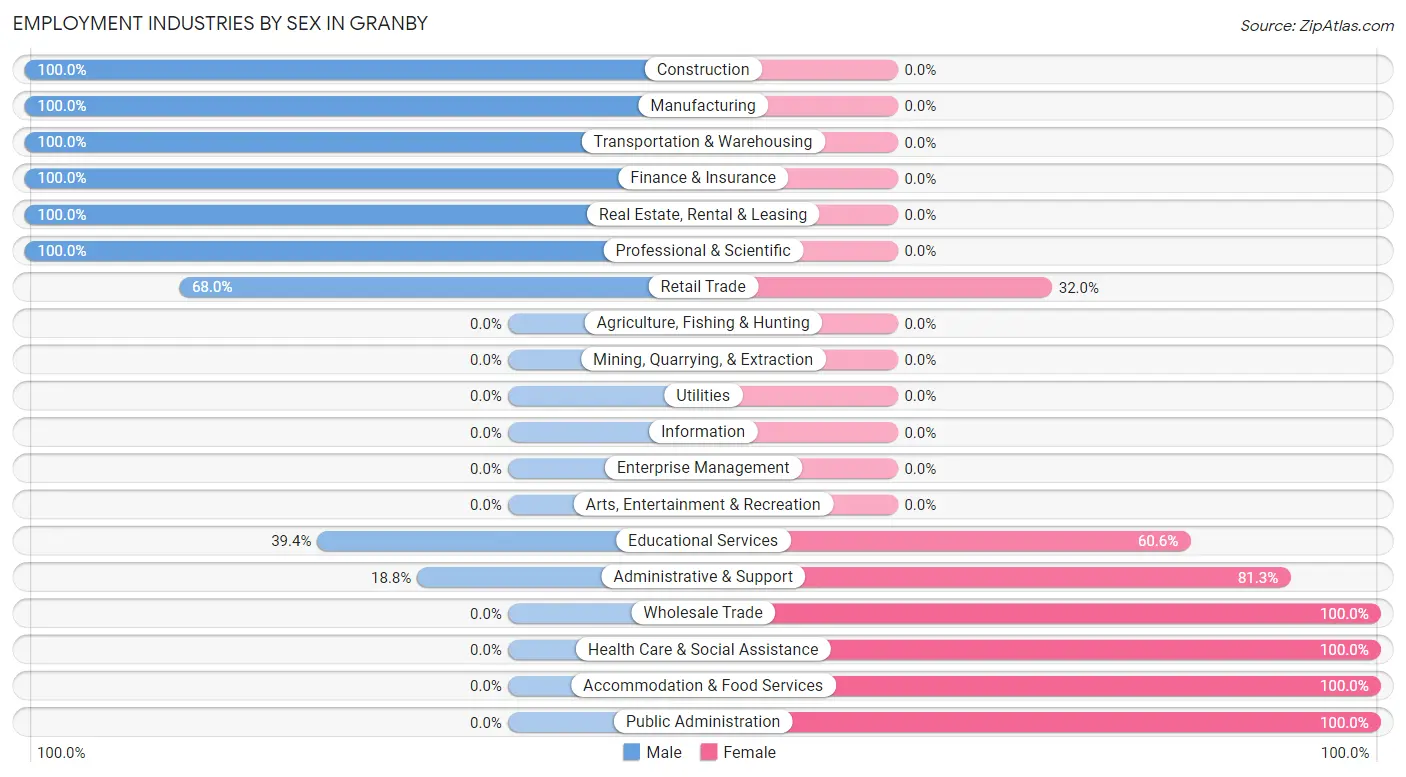
Employment Industries by Sex in Granby
The Granby industries that see more men than women are Construction (100.0%), Manufacturing (100.0%), and Transportation & Warehousing (100.0%), whereas the industries that tend to have a higher number of women are Wholesale Trade (100.0%), Health Care & Social Assistance (100.0%), and Accommodation & Food Services (100.0%).
| Industry | Male | Female |
| Agriculture, Fishing & Hunting | 0 (0.0%) | 0 (0.0%) |
| Mining, Quarrying, & Extraction | 0 (0.0%) | 0 (0.0%) |
| Construction | 6 (100.0%) | 0 (0.0%) |
| Manufacturing | 69 (100.0%) | 0 (0.0%) |
| Wholesale Trade | 0 (0.0%) | 19 (100.0%) |
| Retail Trade | 66 (68.0%) | 31 (32.0%) |
| Transportation & Warehousing | 29 (100.0%) | 0 (0.0%) |
| Utilities | 0 (0.0%) | 0 (0.0%) |
| Information | 0 (0.0%) | 0 (0.0%) |
| Finance & Insurance | 43 (100.0%) | 0 (0.0%) |
| Real Estate, Rental & Leasing | 2 (100.0%) | 0 (0.0%) |
| Professional & Scientific | 14 (100.0%) | 0 (0.0%) |
| Enterprise Management | 0 (0.0%) | 0 (0.0%) |
| Administrative & Support | 9 (18.8%) | 39 (81.2%) |
| Educational Services | 97 (39.4%) | 149 (60.6%) |
| Health Care & Social Assistance | 0 (0.0%) | 100 (100.0%) |
| Arts, Entertainment & Recreation | 0 (0.0%) | 0 (0.0%) |
| Accommodation & Food Services | 0 (0.0%) | 16 (100.0%) |
| Public Administration | 0 (0.0%) | 36 (100.0%) |
| Total | 343 (46.8%) | 390 (53.2%) |
Education in Granby
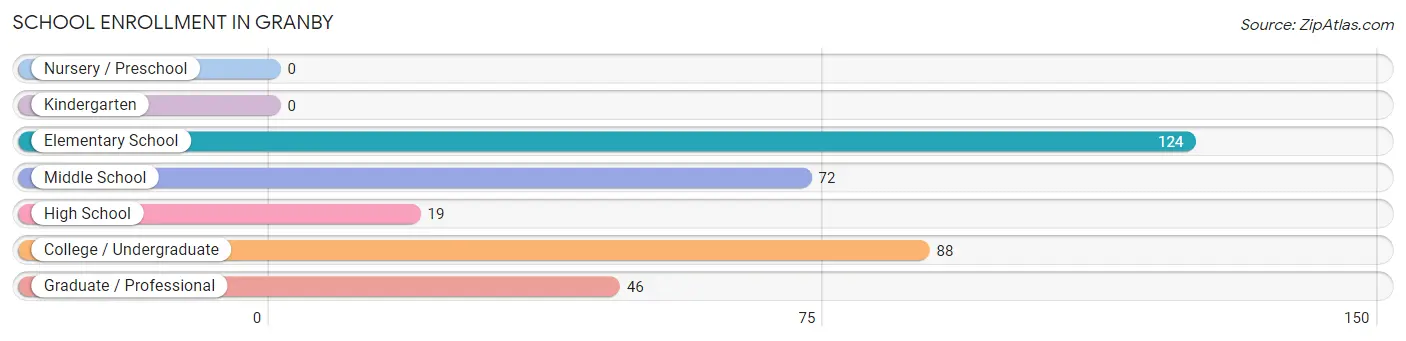
School Enrollment in Granby
The most common levels of schooling among the 349 students in Granby are elementary school (124 | 35.5%), college / undergraduate (88 | 25.2%), and middle school (72 | 20.6%).
| School Level | # Students | % Students |
| Nursery / Preschool | 0 | 0.0% |
| Kindergarten | 0 | 0.0% |
| Elementary School | 124 | 35.5% |
| Middle School | 72 | 20.6% |
| High School | 19 | 5.4% |
| College / Undergraduate | 88 | 25.2% |
| Graduate / Professional | 46 | 13.2% |
| Total | 349 | 100.0% |
School Enrollment by Age by Funding Source in Granby
Out of a total of 349 students who are enrolled in schools in Granby, 119 (34.1%) attend a private institution, while the remaining 230 (65.9%) are enrolled in public schools. The age group of 20 to 24 year olds has the highest likelihood of being enrolled in private schools, with 82 (71.3% in the age bracket) enrolled. Conversely, the age group of 5 to 9 year old has the lowest likelihood of being enrolled in a private school, with 124 (100.0% in the age bracket) attending a public institution.
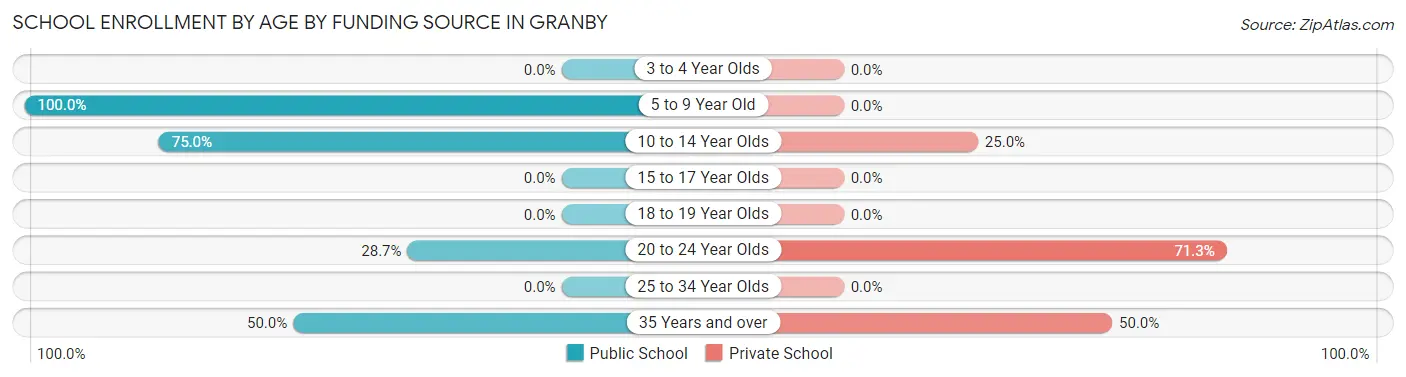
| Age Bracket | Public School | Private School |
| 3 to 4 Year Olds | 0 (0.0%) | 0 (0.0%) |
| 5 to 9 Year Old | 124 (100.0%) | 0 (0.0%) |
| 10 to 14 Year Olds | 54 (75.0%) | 18 (25.0%) |
| 15 to 17 Year Olds | 0 (0.0%) | 0 (0.0%) |
| 18 to 19 Year Olds | 0 (0.0%) | 0 (0.0%) |
| 20 to 24 Year Olds | 33 (28.7%) | 82 (71.3%) |
| 25 to 34 Year Olds | 0 (0.0%) | 0 (0.0%) |
| 35 Years and over | 19 (50.0%) | 19 (50.0%) |
| Total | 230 (65.9%) | 119 (34.1%) |
Educational Attainment by Field of Study in Granby
Education (130 | 25.1%), business (101 | 19.5%), science & technology (69 | 13.3%), social sciences (55 | 10.6%), and liberal arts & history (45 | 8.7%) are the most common fields of study among 518 individuals in Granby who have obtained a bachelor's degree or higher.
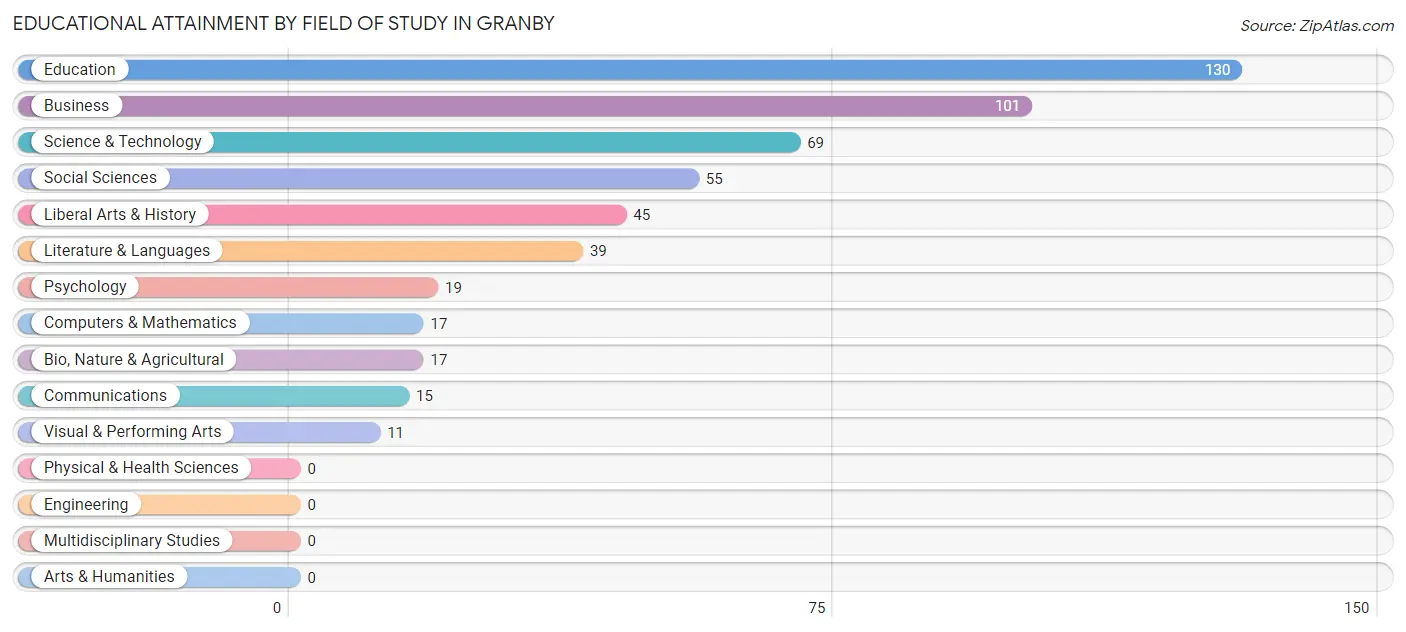
| Field of Study | # Graduates | % Graduates |
| Computers & Mathematics | 17 | 3.3% |
| Bio, Nature & Agricultural | 17 | 3.3% |
| Physical & Health Sciences | 0 | 0.0% |
| Psychology | 19 | 3.7% |
| Social Sciences | 55 | 10.6% |
| Engineering | 0 | 0.0% |
| Multidisciplinary Studies | 0 | 0.0% |
| Science & Technology | 69 | 13.3% |
| Business | 101 | 19.5% |
| Education | 130 | 25.1% |
| Literature & Languages | 39 | 7.5% |
| Liberal Arts & History | 45 | 8.7% |
| Visual & Performing Arts | 11 | 2.1% |
| Communications | 15 | 2.9% |
| Arts & Humanities | 0 | 0.0% |
| Total | 518 | 100.0% |
Transportation & Commute in Granby
Vehicle Availability by Sex in Granby
The most prevalent vehicle ownership categories in Granby are males with 2 vehicles (157, accounting for 43.6%) and females with 2 vehicles (152, making up 44.7%).
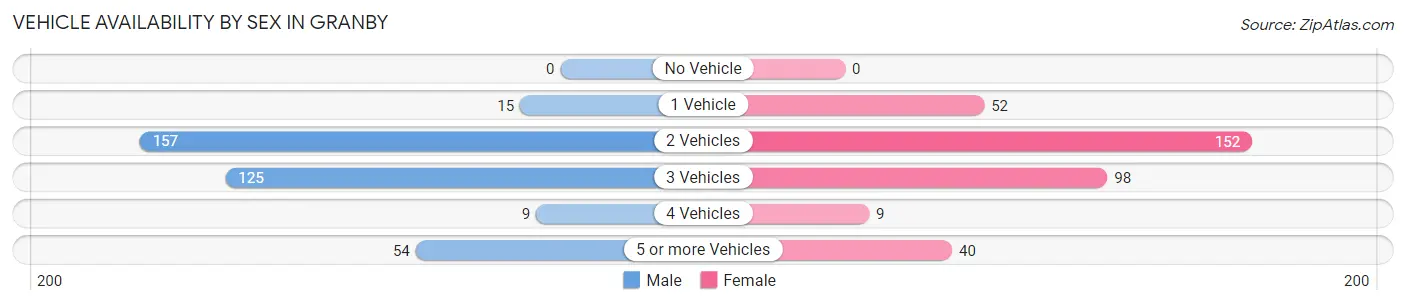
| Vehicles Available | Male | Female |
| No Vehicle | 0 (0.0%) | 0 (0.0%) |
| 1 Vehicle | 15 (4.2%) | 52 (14.8%) |
| 2 Vehicles | 157 (43.6%) | 152 (43.3%) |
| 3 Vehicles | 125 (34.7%) | 98 (27.9%) |
| 4 Vehicles | 9 (2.5%) | 9 (2.6%) |
| 5 or more Vehicles | 54 (15.0%) | 40 (11.4%) |
| Total | 360 (100.0%) | 351 (100.0%) |
Commute Time in Granby
The most frequently occuring commute durations in Granby are 40 to 44 minutes (183 commuters, 27.7%), 30 to 34 minutes (145 commuters, 22.0%), and 10 to 14 minutes (74 commuters, 11.2%).
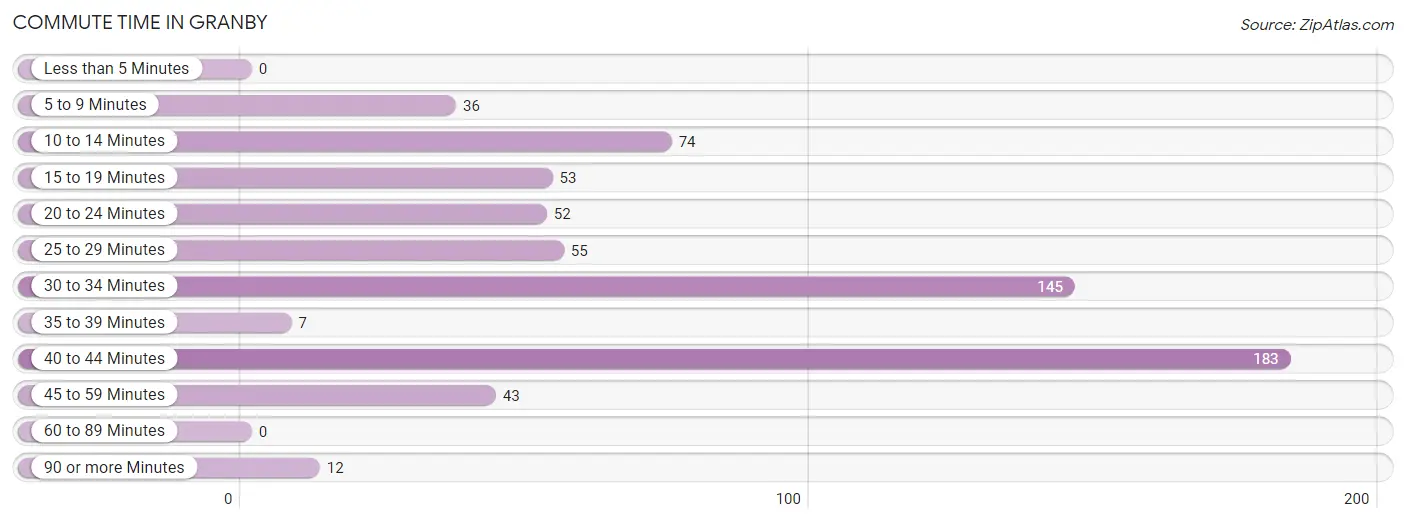
| Commute Time | # Commuters | % Commuters |
| Less than 5 Minutes | 0 | 0.0% |
| 5 to 9 Minutes | 36 | 5.4% |
| 10 to 14 Minutes | 74 | 11.2% |
| 15 to 19 Minutes | 53 | 8.0% |
| 20 to 24 Minutes | 52 | 7.9% |
| 25 to 29 Minutes | 55 | 8.3% |
| 30 to 34 Minutes | 145 | 22.0% |
| 35 to 39 Minutes | 7 | 1.1% |
| 40 to 44 Minutes | 183 | 27.7% |
| 45 to 59 Minutes | 43 | 6.5% |
| 60 to 89 Minutes | 0 | 0.0% |
| 90 or more Minutes | 12 | 1.8% |
Commute Time by Sex in Granby
The most common commute times in Granby are 40 to 44 minutes (112 commuters, 34.5%) for males and 30 to 34 minutes (85 commuters, 25.4%) for females.
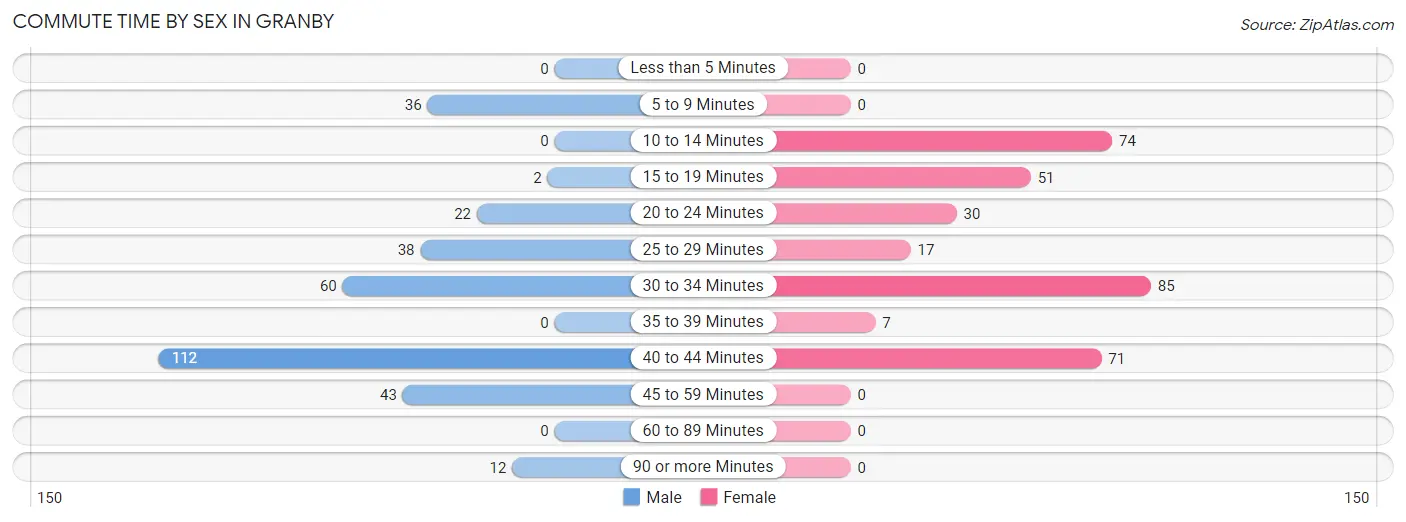
| Commute Time | Male | Female |
| Less than 5 Minutes | 0 (0.0%) | 0 (0.0%) |
| 5 to 9 Minutes | 36 (11.1%) | 0 (0.0%) |
| 10 to 14 Minutes | 0 (0.0%) | 74 (22.1%) |
| 15 to 19 Minutes | 2 (0.6%) | 51 (15.2%) |
| 20 to 24 Minutes | 22 (6.8%) | 30 (9.0%) |
| 25 to 29 Minutes | 38 (11.7%) | 17 (5.1%) |
| 30 to 34 Minutes | 60 (18.5%) | 85 (25.4%) |
| 35 to 39 Minutes | 0 (0.0%) | 7 (2.1%) |
| 40 to 44 Minutes | 112 (34.5%) | 71 (21.2%) |
| 45 to 59 Minutes | 43 (13.2%) | 0 (0.0%) |
| 60 to 89 Minutes | 0 (0.0%) | 0 (0.0%) |
| 90 or more Minutes | 12 (3.7%) | 0 (0.0%) |
Time of Departure to Work by Sex in Granby
The most frequent times of departure to work in Granby are 7:30 AM to 7:59 AM (93, 28.6%) for males and 6:30 AM to 6:59 AM (87, 26.0%) for females.
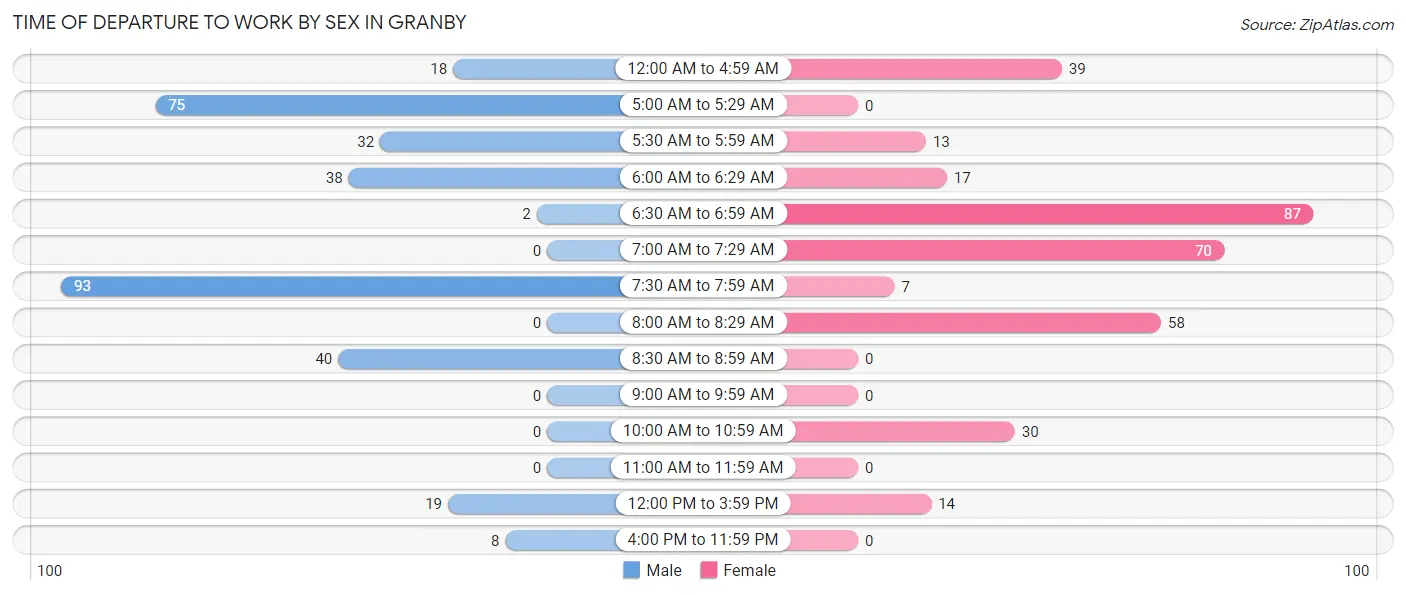
| Time of Departure | Male | Female |
| 12:00 AM to 4:59 AM | 18 (5.5%) | 39 (11.6%) |
| 5:00 AM to 5:29 AM | 75 (23.1%) | 0 (0.0%) |
| 5:30 AM to 5:59 AM | 32 (9.9%) | 13 (3.9%) |
| 6:00 AM to 6:29 AM | 38 (11.7%) | 17 (5.1%) |
| 6:30 AM to 6:59 AM | 2 (0.6%) | 87 (26.0%) |
| 7:00 AM to 7:29 AM | 0 (0.0%) | 70 (20.9%) |
| 7:30 AM to 7:59 AM | 93 (28.6%) | 7 (2.1%) |
| 8:00 AM to 8:29 AM | 0 (0.0%) | 58 (17.3%) |
| 8:30 AM to 8:59 AM | 40 (12.3%) | 0 (0.0%) |
| 9:00 AM to 9:59 AM | 0 (0.0%) | 0 (0.0%) |
| 10:00 AM to 10:59 AM | 0 (0.0%) | 30 (9.0%) |
| 11:00 AM to 11:59 AM | 0 (0.0%) | 0 (0.0%) |
| 12:00 PM to 3:59 PM | 19 (5.9%) | 14 (4.2%) |
| 4:00 PM to 11:59 PM | 8 (2.5%) | 0 (0.0%) |
| Total | 325 (100.0%) | 335 (100.0%) |
Housing Occupancy in Granby
Occupancy by Ownership in Granby
Of the total 494 dwellings in Granby, owner-occupied units account for 397 (80.4%), while renter-occupied units make up 97 (19.6%).
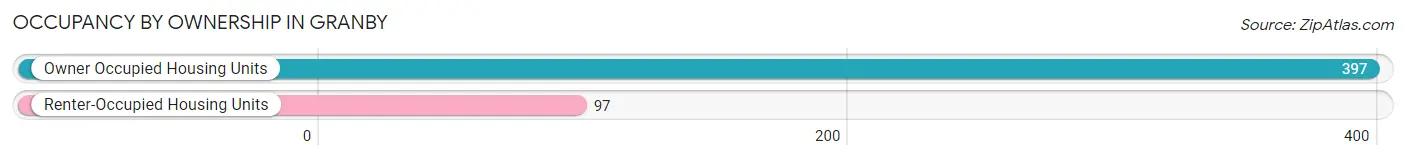
| Occupancy | # Housing Units | % Housing Units |
| Owner Occupied Housing Units | 397 | 80.4% |
| Renter-Occupied Housing Units | 97 | 19.6% |
| Total Occupied Housing Units | 494 | 100.0% |
Occupancy by Household Size in Granby
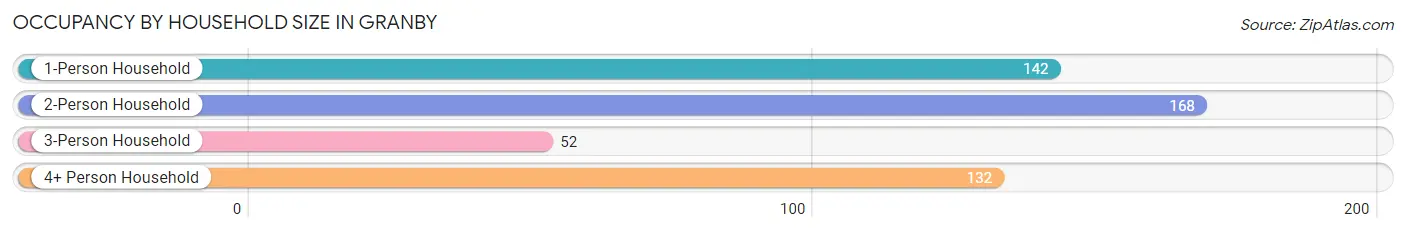
| Household Size | # Housing Units | % Housing Units |
| 1-Person Household | 142 | 28.7% |
| 2-Person Household | 168 | 34.0% |
| 3-Person Household | 52 | 10.5% |
| 4+ Person Household | 132 | 26.7% |
| Total Housing Units | 494 | 100.0% |
Occupancy by Ownership by Household Size in Granby
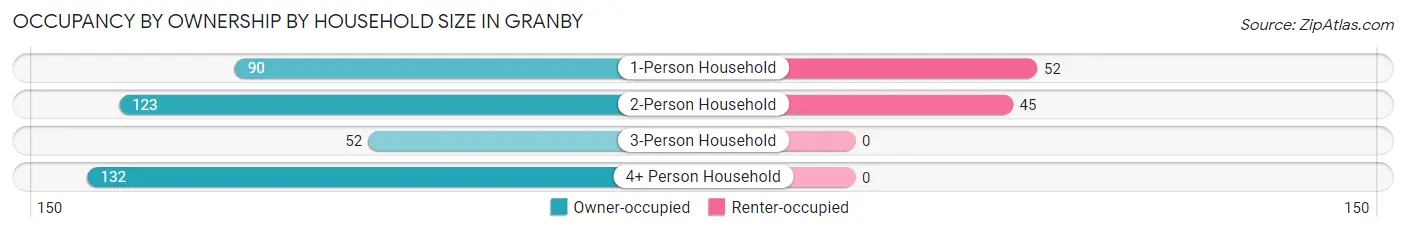
| Household Size | Owner-occupied | Renter-occupied |
| 1-Person Household | 90 (63.4%) | 52 (36.6%) |
| 2-Person Household | 123 (73.2%) | 45 (26.8%) |
| 3-Person Household | 52 (100.0%) | 0 (0.0%) |
| 4+ Person Household | 132 (100.0%) | 0 (0.0%) |
| Total Housing Units | 397 (80.4%) | 97 (19.6%) |
Occupancy by Educational Attainment in Granby
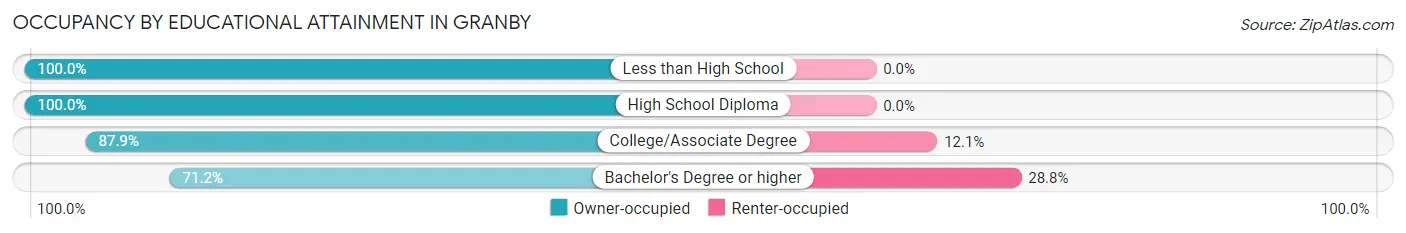
| Household Size | Owner-occupied | Renter-occupied |
| Less than High School | 25 (100.0%) | 0 (0.0%) |
| High School Diploma | 60 (100.0%) | 0 (0.0%) |
| College/Associate Degree | 109 (87.9%) | 15 (12.1%) |
| Bachelor's Degree or higher | 203 (71.2%) | 82 (28.8%) |
Occupancy by Age of Householder in Granby
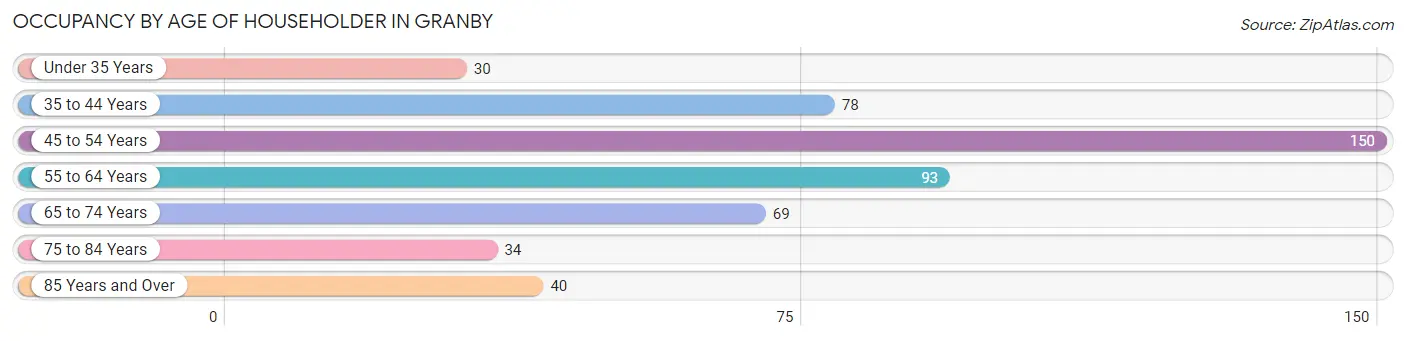
| Age Bracket | # Households | % Households |
| Under 35 Years | 30 | 6.1% |
| 35 to 44 Years | 78 | 15.8% |
| 45 to 54 Years | 150 | 30.4% |
| 55 to 64 Years | 93 | 18.8% |
| 65 to 74 Years | 69 | 14.0% |
| 75 to 84 Years | 34 | 6.9% |
| 85 Years and Over | 40 | 8.1% |
| Total | 494 | 100.0% |
Housing Finances in Granby
Median Income by Occupancy in Granby
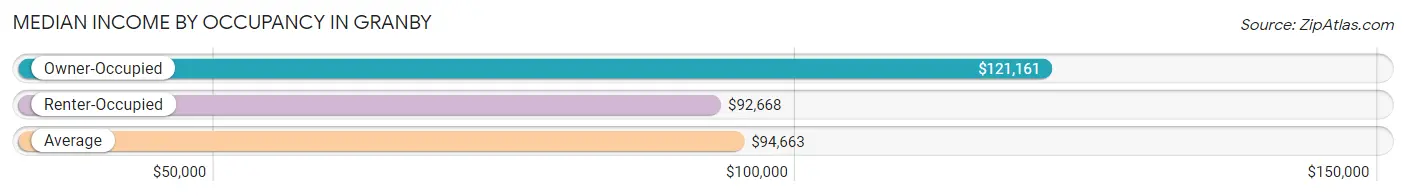
| Occupancy Type | # Households | Median Income |
| Owner-Occupied | 397 (80.4%) | $121,161 |
| Renter-Occupied | 97 (19.6%) | $92,668 |
| Average | 494 (100.0%) | $94,663 |
Occupancy by Householder Income Bracket in Granby
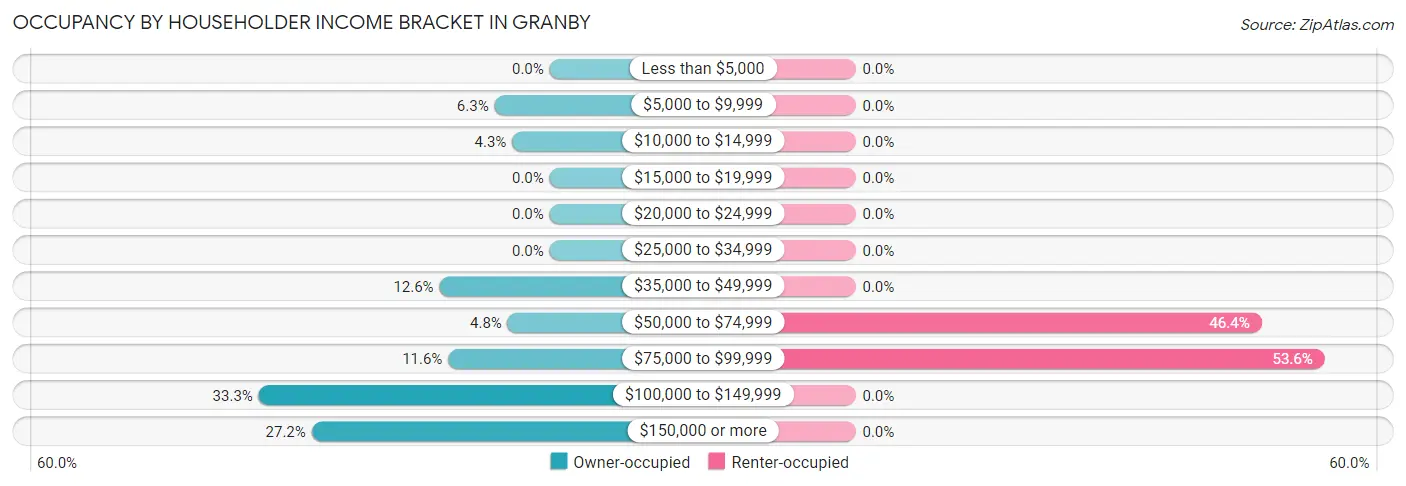
| Income Bracket | Owner-occupied | Renter-occupied |
| Less than $5,000 | 0 (0.0%) | 0 (0.0%) |
| $5,000 to $9,999 | 25 (6.3%) | 0 (0.0%) |
| $10,000 to $14,999 | 17 (4.3%) | 0 (0.0%) |
| $15,000 to $19,999 | 0 (0.0%) | 0 (0.0%) |
| $20,000 to $24,999 | 0 (0.0%) | 0 (0.0%) |
| $25,000 to $34,999 | 0 (0.0%) | 0 (0.0%) |
| $35,000 to $49,999 | 50 (12.6%) | 0 (0.0%) |
| $50,000 to $74,999 | 19 (4.8%) | 45 (46.4%) |
| $75,000 to $99,999 | 46 (11.6%) | 52 (53.6%) |
| $100,000 to $149,999 | 132 (33.3%) | 0 (0.0%) |
| $150,000 or more | 108 (27.2%) | 0 (0.0%) |
| Total | 397 (100.0%) | 97 (100.0%) |
Monthly Housing Cost Tiers in Granby
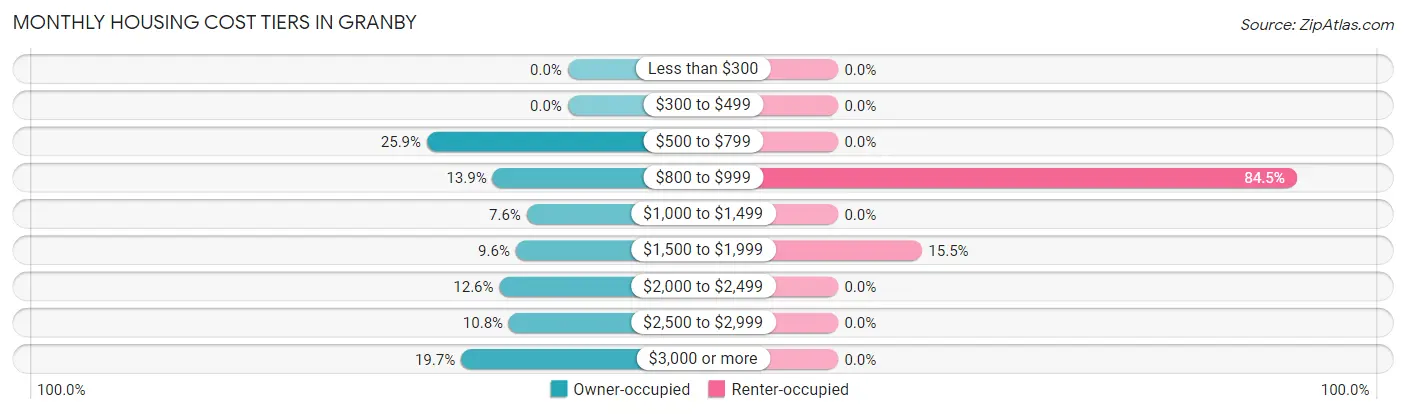
| Monthly Cost | Owner-occupied | Renter-occupied |
| Less than $300 | 0 (0.0%) | 0 (0.0%) |
| $300 to $499 | 0 (0.0%) | 0 (0.0%) |
| $500 to $799 | 103 (25.9%) | 0 (0.0%) |
| $800 to $999 | 55 (13.9%) | 82 (84.5%) |
| $1,000 to $1,499 | 30 (7.6%) | 0 (0.0%) |
| $1,500 to $1,999 | 38 (9.6%) | 15 (15.5%) |
| $2,000 to $2,499 | 50 (12.6%) | 0 (0.0%) |
| $2,500 to $2,999 | 43 (10.8%) | 0 (0.0%) |
| $3,000 or more | 78 (19.7%) | 0 (0.0%) |
| Total | 397 (100.0%) | 97 (100.0%) |
Physical Housing Characteristics in Granby
Housing Structures in Granby
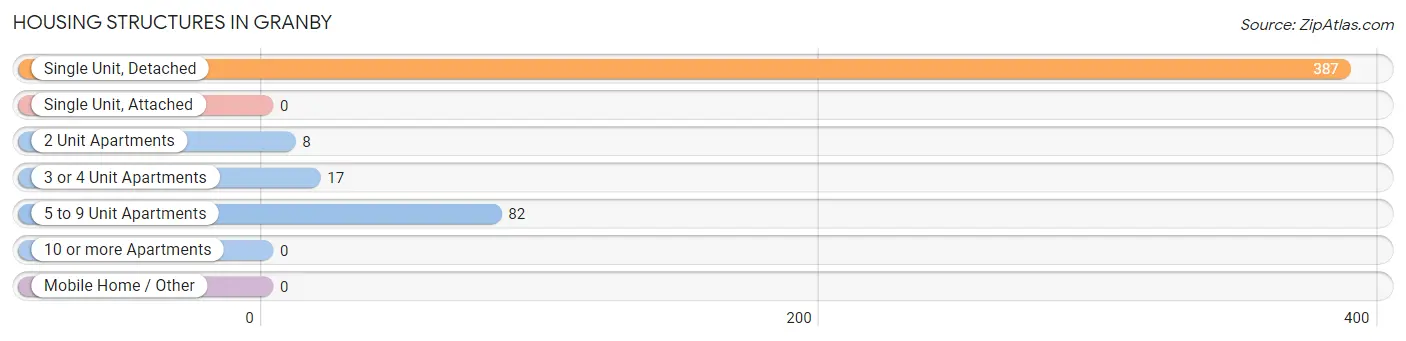
| Structure Type | # Housing Units | % Housing Units |
| Single Unit, Detached | 387 | 78.3% |
| Single Unit, Attached | 0 | 0.0% |
| 2 Unit Apartments | 8 | 1.6% |
| 3 or 4 Unit Apartments | 17 | 3.4% |
| 5 to 9 Unit Apartments | 82 | 16.6% |
| 10 or more Apartments | 0 | 0.0% |
| Mobile Home / Other | 0 | 0.0% |
| Total | 494 | 100.0% |
Housing Structures by Occupancy in Granby
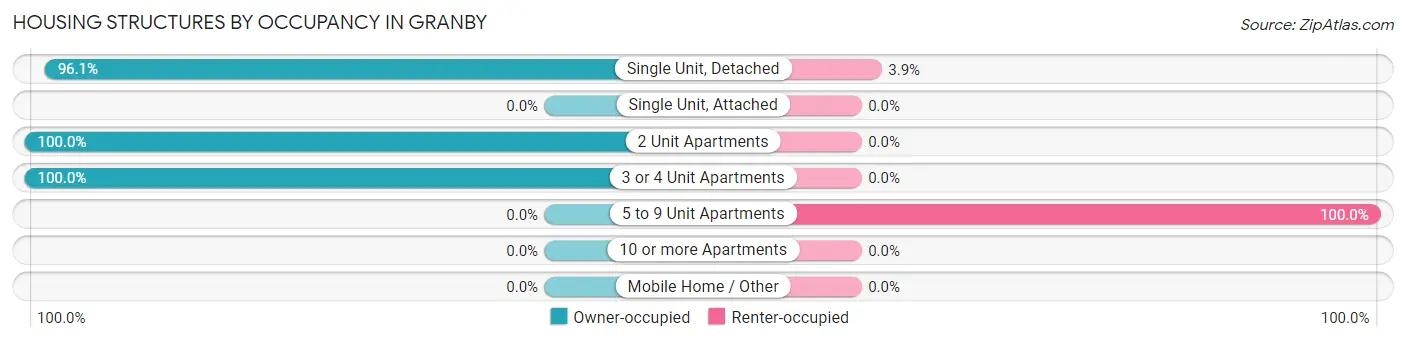
| Structure Type | Owner-occupied | Renter-occupied |
| Single Unit, Detached | 372 (96.1%) | 15 (3.9%) |
| Single Unit, Attached | 0 (0.0%) | 0 (0.0%) |
| 2 Unit Apartments | 8 (100.0%) | 0 (0.0%) |
| 3 or 4 Unit Apartments | 17 (100.0%) | 0 (0.0%) |
| 5 to 9 Unit Apartments | 0 (0.0%) | 82 (100.0%) |
| 10 or more Apartments | 0 (0.0%) | 0 (0.0%) |
| Mobile Home / Other | 0 (0.0%) | 0 (0.0%) |
| Total | 397 (80.4%) | 97 (19.6%) |
Housing Structures by Number of Rooms in Granby
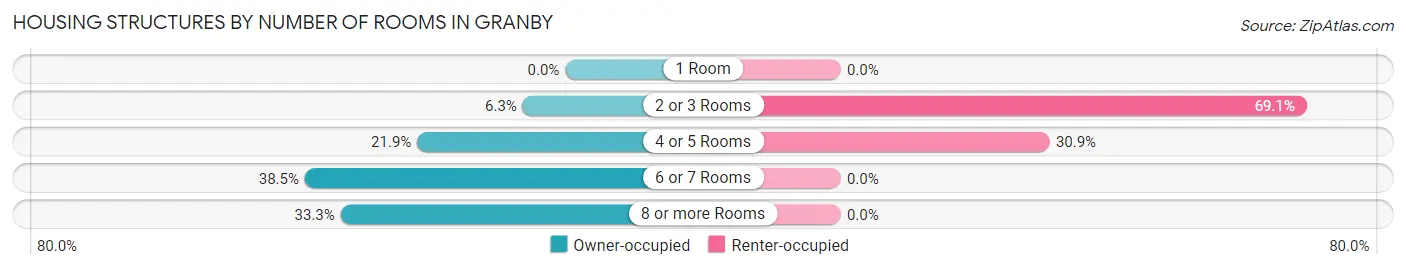
| Number of Rooms | Owner-occupied | Renter-occupied |
| 1 Room | 0 (0.0%) | 0 (0.0%) |
| 2 or 3 Rooms | 25 (6.3%) | 67 (69.1%) |
| 4 or 5 Rooms | 87 (21.9%) | 30 (30.9%) |
| 6 or 7 Rooms | 153 (38.5%) | 0 (0.0%) |
| 8 or more Rooms | 132 (33.3%) | 0 (0.0%) |
| Total | 397 (100.0%) | 97 (100.0%) |
Housing Structure by Heating Type in Granby
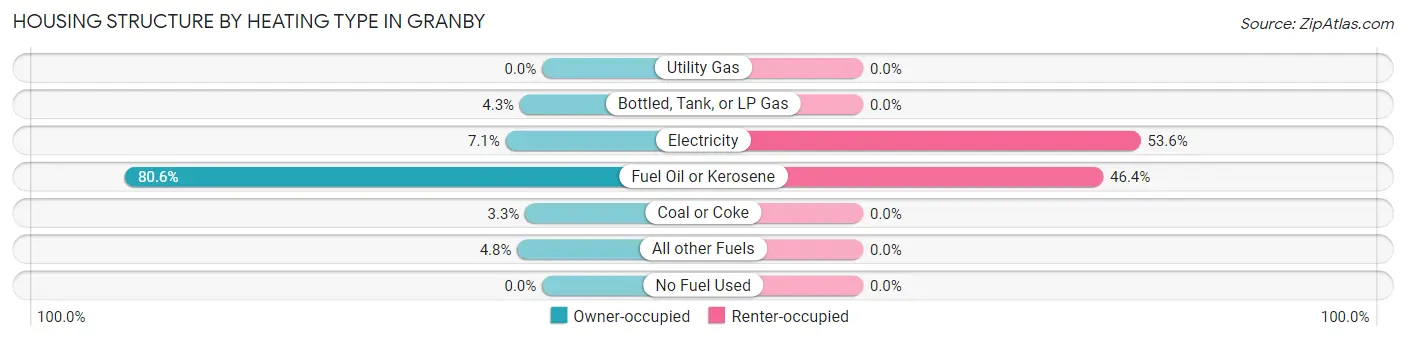
| Heating Type | Owner-occupied | Renter-occupied |
| Utility Gas | 0 (0.0%) | 0 (0.0%) |
| Bottled, Tank, or LP Gas | 17 (4.3%) | 0 (0.0%) |
| Electricity | 28 (7.0%) | 52 (53.6%) |
| Fuel Oil or Kerosene | 320 (80.6%) | 45 (46.4%) |
| Coal or Coke | 13 (3.3%) | 0 (0.0%) |
| All other Fuels | 19 (4.8%) | 0 (0.0%) |
| No Fuel Used | 0 (0.0%) | 0 (0.0%) |
| Total | 397 (100.0%) | 97 (100.0%) |
Household Vehicle Usage in Granby
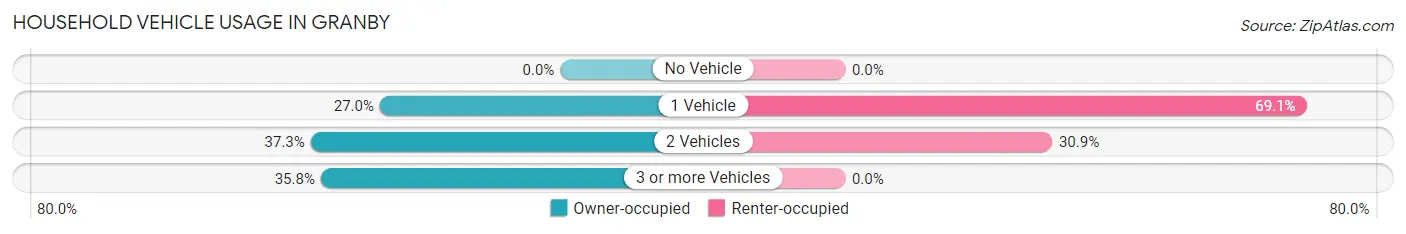
| Vehicles per Household | Owner-occupied | Renter-occupied |
| No Vehicle | 0 (0.0%) | 0 (0.0%) |
| 1 Vehicle | 107 (27.0%) | 67 (69.1%) |
| 2 Vehicles | 148 (37.3%) | 30 (30.9%) |
| 3 or more Vehicles | 142 (35.8%) | 0 (0.0%) |
| Total | 397 (100.0%) | 97 (100.0%) |
Real Estate & Mortgages in Granby
Real Estate and Mortgage Overview in Granby
| Characteristic | Without Mortgage | With Mortgage |
| Housing Units | 142 | 255 |
| Median Property Value | $275,400 | $441,700 |
| Median Household Income | $115,625 | $81 |
| Monthly Housing Costs | $772 | $78 |
| Real Estate Taxes | $4,719 | $18 |
Property Value by Mortgage Status in Granby
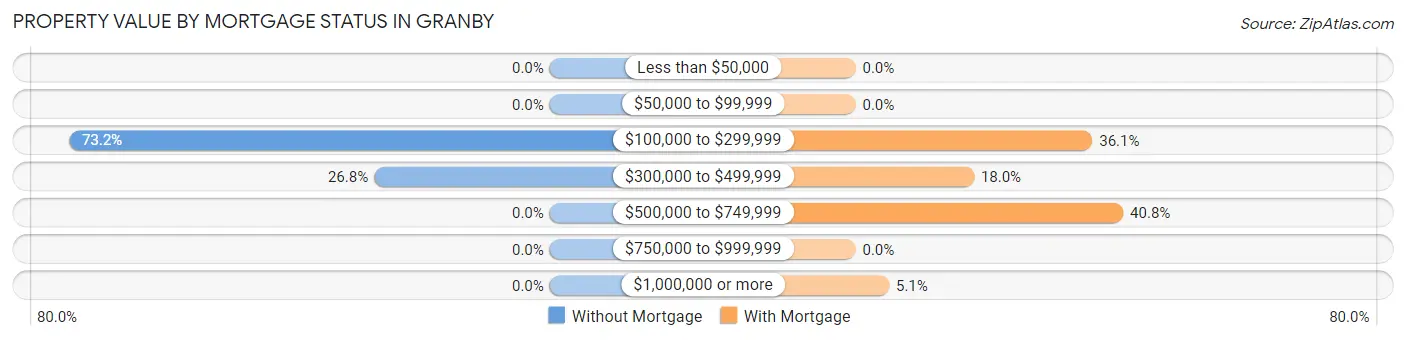
| Property Value | Without Mortgage | With Mortgage |
| Less than $50,000 | 0 (0.0%) | 0 (0.0%) |
| $50,000 to $99,999 | 0 (0.0%) | 0 (0.0%) |
| $100,000 to $299,999 | 104 (73.2%) | 92 (36.1%) |
| $300,000 to $499,999 | 38 (26.8%) | 46 (18.0%) |
| $500,000 to $749,999 | 0 (0.0%) | 104 (40.8%) |
| $750,000 to $999,999 | 0 (0.0%) | 0 (0.0%) |
| $1,000,000 or more | 0 (0.0%) | 13 (5.1%) |
| Total | 142 (100.0%) | 255 (100.0%) |
Household Income by Mortgage Status in Granby
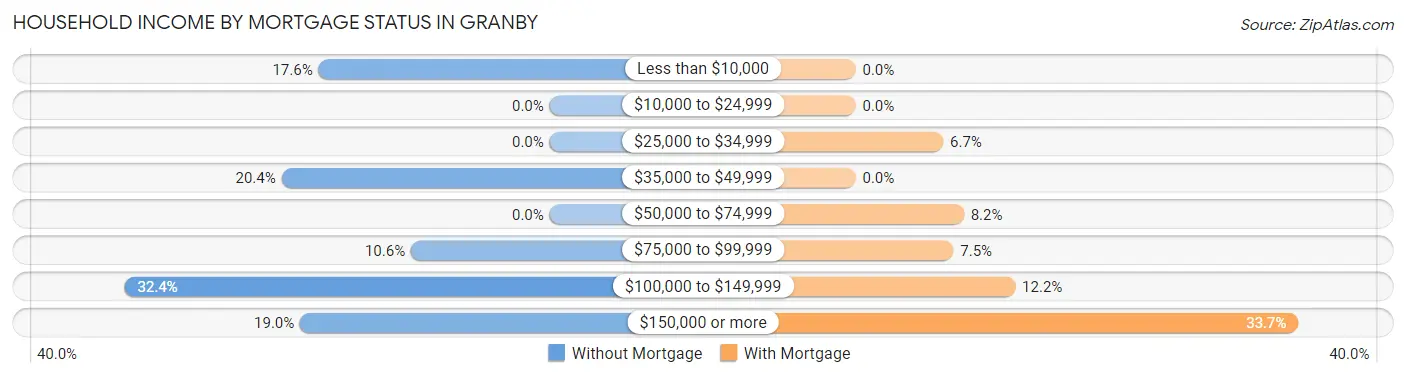
| Household Income | Without Mortgage | With Mortgage |
| Less than $10,000 | 25 (17.6%) | 0 (0.0%) |
| $10,000 to $24,999 | 0 (0.0%) | 0 (0.0%) |
| $25,000 to $34,999 | 0 (0.0%) | 17 (6.7%) |
| $35,000 to $49,999 | 29 (20.4%) | 0 (0.0%) |
| $50,000 to $74,999 | 0 (0.0%) | 21 (8.2%) |
| $75,000 to $99,999 | 15 (10.6%) | 19 (7.4%) |
| $100,000 to $149,999 | 46 (32.4%) | 31 (12.2%) |
| $150,000 or more | 27 (19.0%) | 86 (33.7%) |
| Total | 142 (100.0%) | 255 (100.0%) |
Property Value to Household Income Ratio in Granby
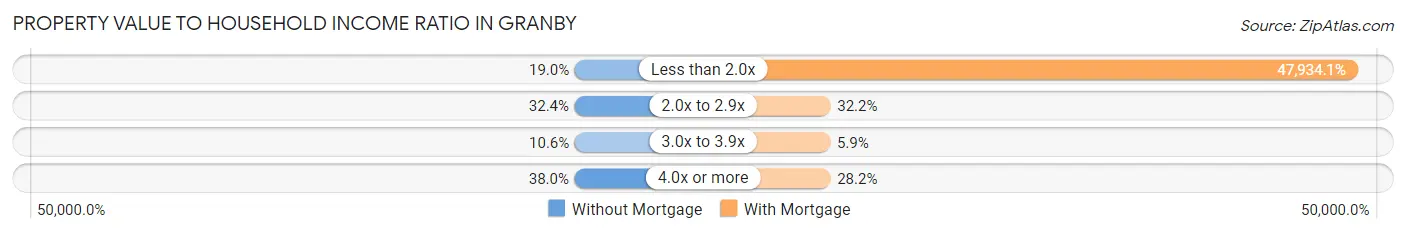
| Value-to-Income Ratio | Without Mortgage | With Mortgage |
| Less than 2.0x | 27 (19.0%) | 122,232 (47,934.1%) |
| 2.0x to 2.9x | 46 (32.4%) | 82 (32.2%) |
| 3.0x to 3.9x | 15 (10.6%) | 15 (5.9%) |
| 4.0x or more | 54 (38.0%) | 72 (28.2%) |
| Total | 142 (100.0%) | 255 (100.0%) |
Real Estate Taxes by Mortgage Status in Granby
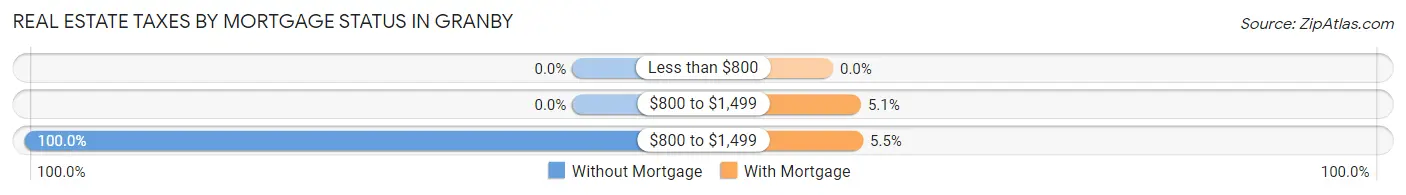
| Property Taxes | Without Mortgage | With Mortgage |
| Less than $800 | 0 (0.0%) | 0 (0.0%) |
| $800 to $1,499 | 0 (0.0%) | 13 (5.1%) |
| $800 to $1,499 | 142 (100.0%) | 14 (5.5%) |
| Total | 142 (100.0%) | 255 (100.0%) |
Health & Disability in Granby
Health Insurance Coverage by Age in Granby
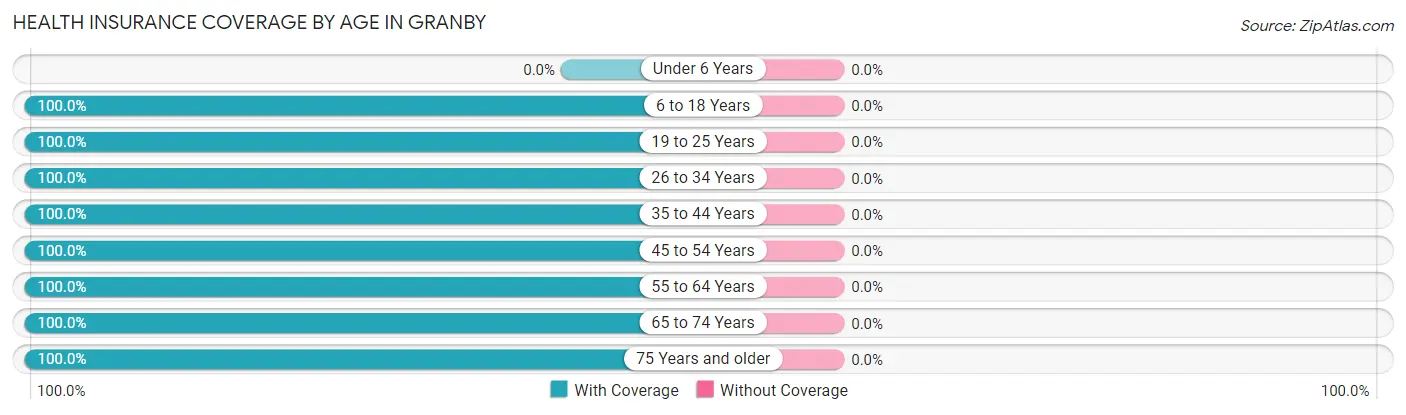
| Age Bracket | With Coverage | Without Coverage |
| Under 6 Years | 0 (0.0%) | 0 (0.0%) |
| 6 to 18 Years | 196 (100.0%) | 0 (0.0%) |
| 19 to 25 Years | 149 (100.0%) | 0 (0.0%) |
| 26 to 34 Years | 30 (100.0%) | 0 (0.0%) |
| 35 to 44 Years | 123 (100.0%) | 0 (0.0%) |
| 45 to 54 Years | 285 (100.0%) | 0 (0.0%) |
| 55 to 64 Years | 155 (100.0%) | 0 (0.0%) |
| 65 to 74 Years | 105 (100.0%) | 0 (0.0%) |
| 75 Years and older | 116 (100.0%) | 0 (0.0%) |
| Total | 1,159 (100.0%) | 0 (0.0%) |
Health Insurance Coverage by Citizenship Status in Granby
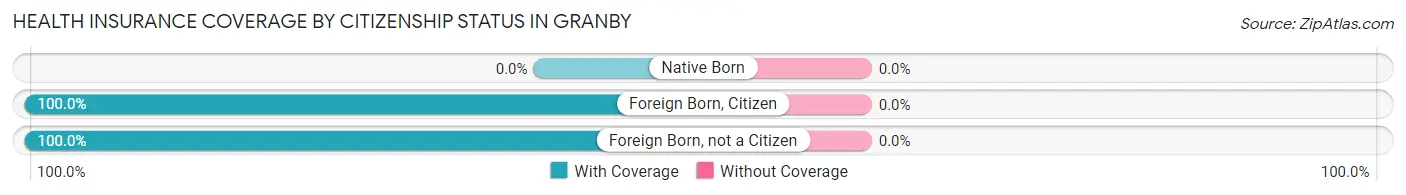
| Citizenship Status | With Coverage | Without Coverage |
| Native Born | 0 (0.0%) | 0 (0.0%) |
| Foreign Born, Citizen | 196 (100.0%) | 0 (0.0%) |
| Foreign Born, not a Citizen | 149 (100.0%) | 0 (0.0%) |
Health Insurance Coverage by Household Income in Granby
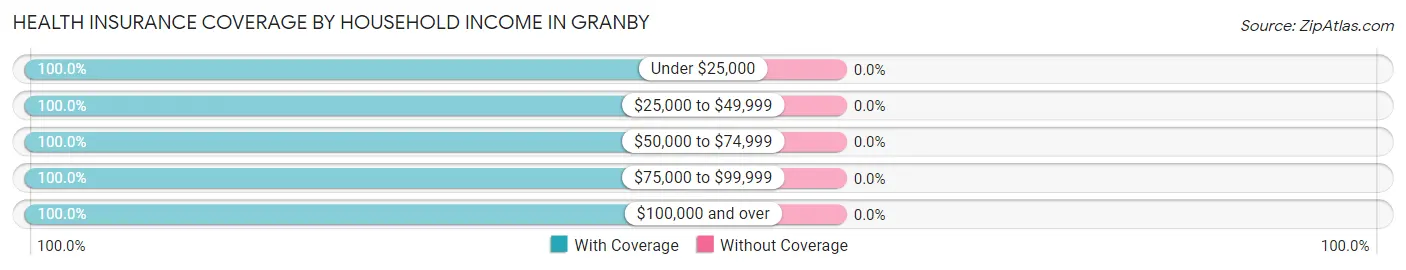
| Household Income | With Coverage | Without Coverage |
| Under $25,000 | 60 (100.0%) | 0 (0.0%) |
| $25,000 to $49,999 | 50 (100.0%) | 0 (0.0%) |
| $50,000 to $74,999 | 111 (100.0%) | 0 (0.0%) |
| $75,000 to $99,999 | 144 (100.0%) | 0 (0.0%) |
| $100,000 and over | 794 (100.0%) | 0 (0.0%) |
Public vs Private Health Insurance Coverage by Age in Granby
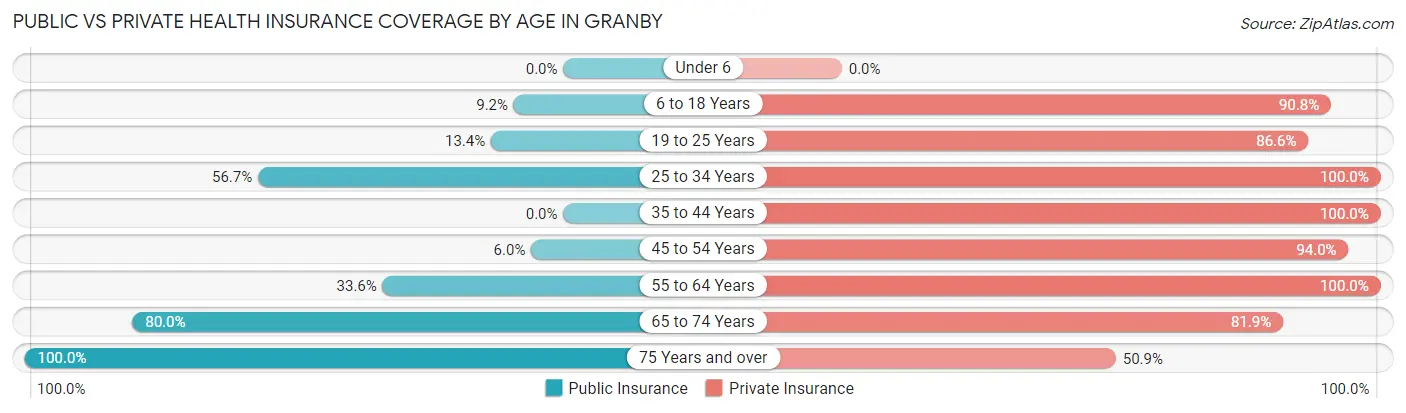
| Age Bracket | Public Insurance | Private Insurance |
| Under 6 | 0 (0.0%) | 0 (0.0%) |
| 6 to 18 Years | 18 (9.2%) | 178 (90.8%) |
| 19 to 25 Years | 20 (13.4%) | 129 (86.6%) |
| 25 to 34 Years | 17 (56.7%) | 30 (100.0%) |
| 35 to 44 Years | 0 (0.0%) | 123 (100.0%) |
| 45 to 54 Years | 17 (6.0%) | 268 (94.0%) |
| 55 to 64 Years | 52 (33.6%) | 155 (100.0%) |
| 65 to 74 Years | 84 (80.0%) | 86 (81.9%) |
| 75 Years and over | 116 (100.0%) | 59 (50.9%) |
| Total | 324 (28.0%) | 1,028 (88.7%) |
Disability Status by Sex by Age in Granby
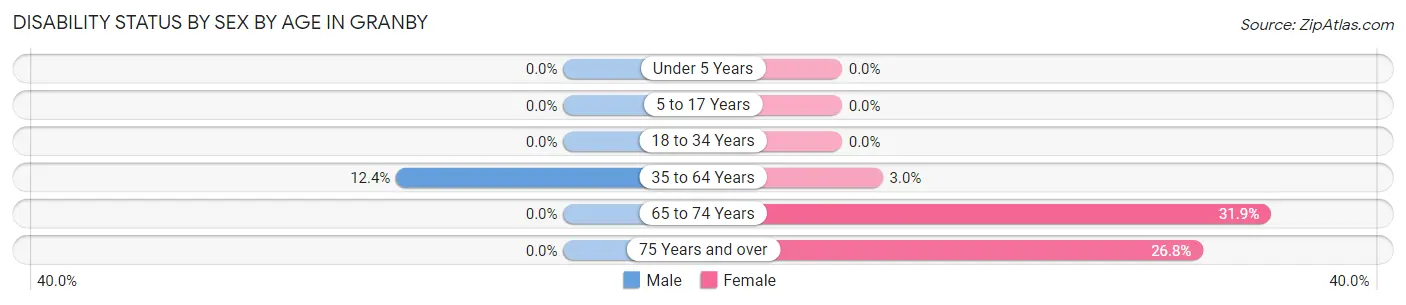
| Age Bracket | Male | Female |
| Under 5 Years | 0 (0.0%) | 0 (0.0%) |
| 5 to 17 Years | 0 (0.0%) | 0 (0.0%) |
| 18 to 34 Years | 0 (0.0%) | 0 (0.0%) |
| 35 to 64 Years | 33 (12.4%) | 9 (3.0%) |
| 65 to 74 Years | 0 (0.0%) | 29 (31.9%) |
| 75 Years and over | 0 (0.0%) | 22 (26.8%) |
Disability Class by Sex by Age in Granby
Disability Class: Hearing Difficulty
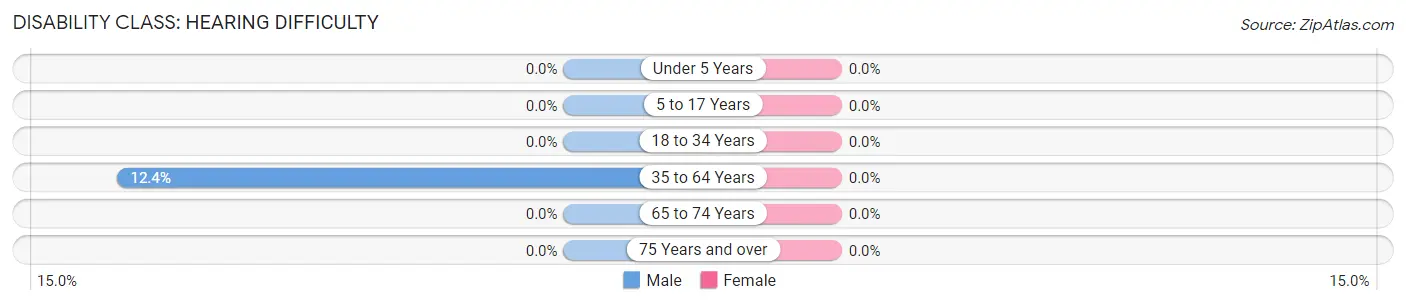
| Age Bracket | Male | Female |
| Under 5 Years | 0 (0.0%) | 0 (0.0%) |
| 5 to 17 Years | 0 (0.0%) | 0 (0.0%) |
| 18 to 34 Years | 0 (0.0%) | 0 (0.0%) |
| 35 to 64 Years | 33 (12.4%) | 0 (0.0%) |
| 65 to 74 Years | 0 (0.0%) | 0 (0.0%) |
| 75 Years and over | 0 (0.0%) | 0 (0.0%) |
Disability Class: Vision Difficulty
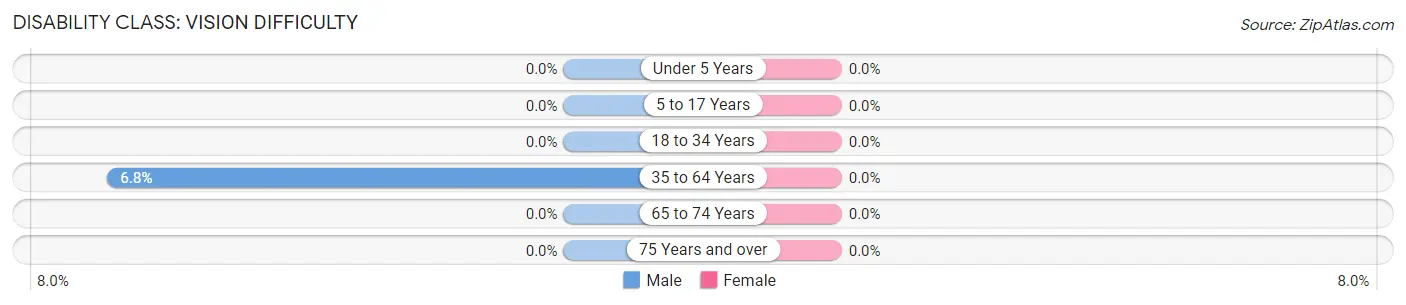
| Age Bracket | Male | Female |
| Under 5 Years | 0 (0.0%) | 0 (0.0%) |
| 5 to 17 Years | 0 (0.0%) | 0 (0.0%) |
| 18 to 34 Years | 0 (0.0%) | 0 (0.0%) |
| 35 to 64 Years | 18 (6.8%) | 0 (0.0%) |
| 65 to 74 Years | 0 (0.0%) | 0 (0.0%) |
| 75 Years and over | 0 (0.0%) | 0 (0.0%) |
Disability Class: Cognitive Difficulty
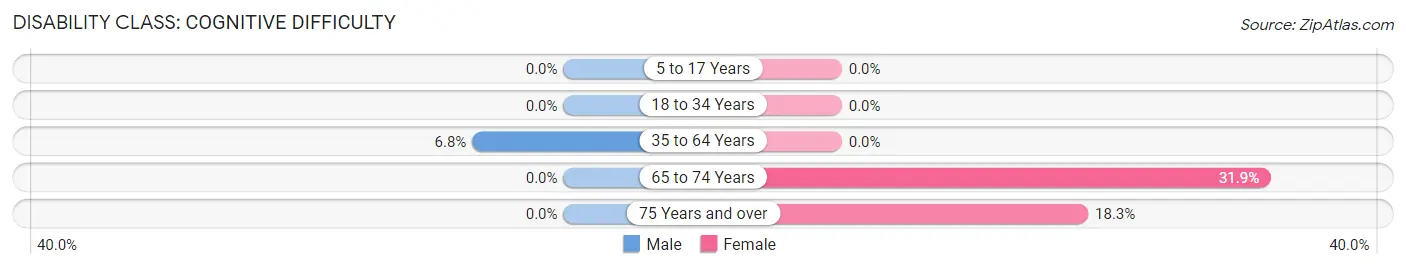
| Age Bracket | Male | Female |
| 5 to 17 Years | 0 (0.0%) | 0 (0.0%) |
| 18 to 34 Years | 0 (0.0%) | 0 (0.0%) |
| 35 to 64 Years | 18 (6.8%) | 0 (0.0%) |
| 65 to 74 Years | 0 (0.0%) | 29 (31.9%) |
| 75 Years and over | 0 (0.0%) | 15 (18.3%) |
Disability Class: Ambulatory Difficulty
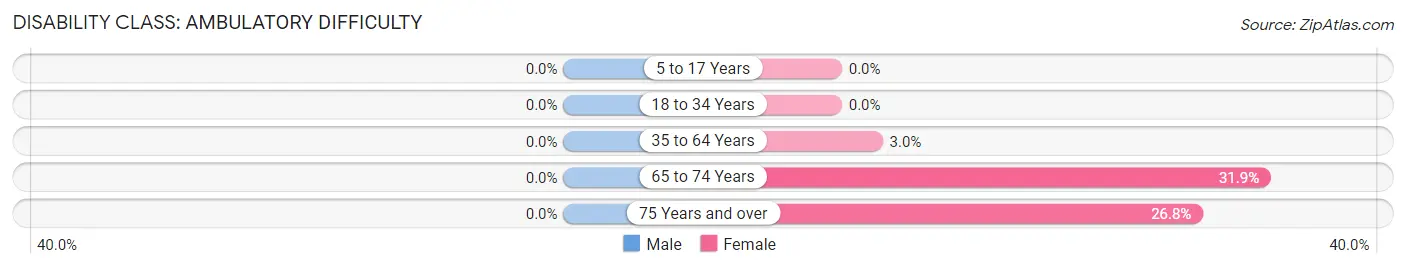
| Age Bracket | Male | Female |
| 5 to 17 Years | 0 (0.0%) | 0 (0.0%) |
| 18 to 34 Years | 0 (0.0%) | 0 (0.0%) |
| 35 to 64 Years | 0 (0.0%) | 9 (3.0%) |
| 65 to 74 Years | 0 (0.0%) | 29 (31.9%) |
| 75 Years and over | 0 (0.0%) | 22 (26.8%) |
Disability Class: Self-Care Difficulty
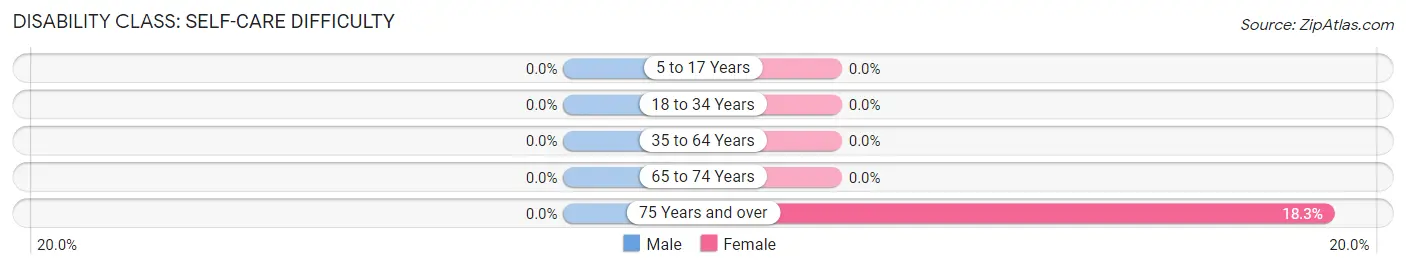
| Age Bracket | Male | Female |
| 5 to 17 Years | 0 (0.0%) | 0 (0.0%) |
| 18 to 34 Years | 0 (0.0%) | 0 (0.0%) |
| 35 to 64 Years | 0 (0.0%) | 0 (0.0%) |
| 65 to 74 Years | 0 (0.0%) | 0 (0.0%) |
| 75 Years and over | 0 (0.0%) | 15 (18.3%) |
Technology Access in Granby
Computing Device Access in Granby
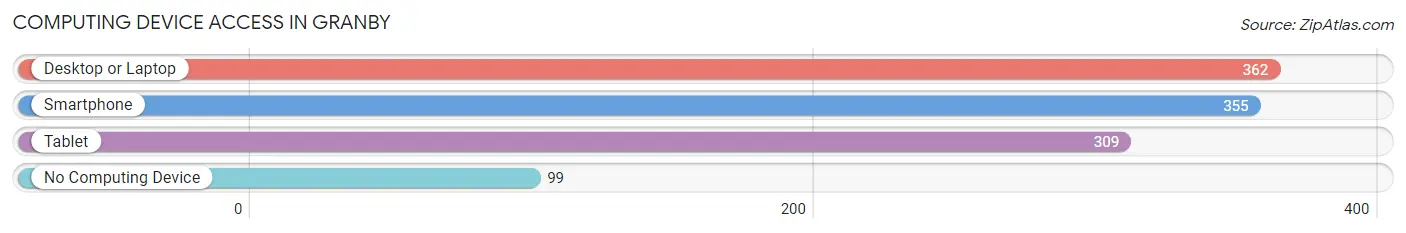
| Device Type | # Households | % Households |
| Desktop or Laptop | 362 | 73.3% |
| Smartphone | 355 | 71.9% |
| Tablet | 309 | 62.5% |
| No Computing Device | 99 | 20.0% |
| Total | 494 | 100.0% |
Internet Access in Granby
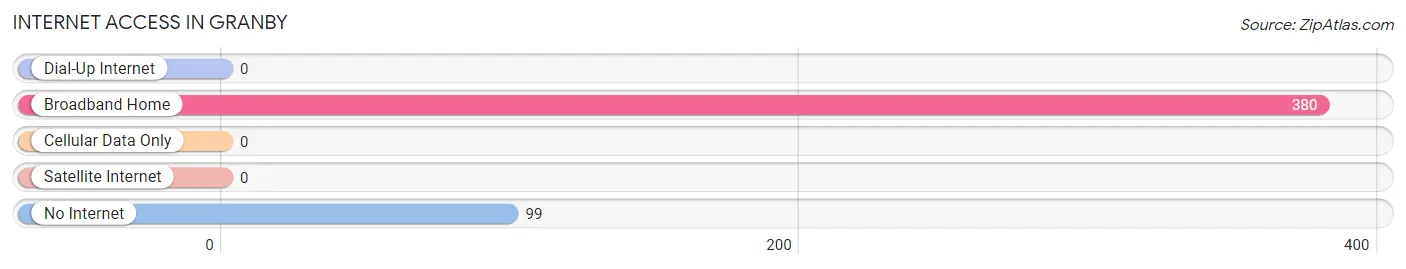
| Internet Type | # Households | % Households |
| Dial-Up Internet | 0 | 0.0% |
| Broadband Home | 380 | 76.9% |
| Cellular Data Only | 0 | 0.0% |
| Satellite Internet | 0 | 0.0% |
| No Internet | 99 | 20.0% |
| Total | 494 | 100.0% |
Granby Summary
Granby, Massachusetts is a small town located in the Pioneer Valley region of the state. It is situated in the eastern part of Hampden County, and is bordered by the towns of South Hadley, Amherst, Belchertown, and Ludlow. The town has a population of approximately 6,500 people, and is home to a variety of businesses, schools, and recreational activities.
Geography
Granby is located in the Pioneer Valley region of Massachusetts, and is situated in the eastern part of Hampden County. The town is bordered by the towns of South Hadley, Amherst, Belchertown, and Ludlow. The town is located on the banks of the Chicopee River, and is home to several small lakes and ponds, including Lake Congamond, which is the largest lake in the area. The town is also home to several hills and mountains, including Mount Tom, which is the highest point in the town.
Economy
Granby is home to a variety of businesses, including manufacturing, retail, and service industries. The town is home to several large employers, including the Granby Industries, which manufactures a variety of products, including automotive parts, and the Granby Mills, which produces a variety of paper products. The town is also home to several small businesses, including restaurants, retail stores, and professional services.
Demographics
As of the 2010 census, Granby had a population of 6,500 people. The town is predominantly white, with approximately 90% of the population identifying as such. The town also has a large Hispanic population, with approximately 10% of the population identifying as Hispanic or Latino. The median household income in Granby is approximately $60,000, and the median home value is approximately $250,000.
Conclusion
Granby, Massachusetts is a small town located in the Pioneer Valley region of the state. It is situated in the eastern part of Hampden County, and is bordered by the towns of South Hadley, Amherst, Belchertown, and Ludlow. The town has a population of approximately 6,500 people, and is home to a variety of businesses, schools, and recreational activities. The town is predominantly white, with a large Hispanic population, and has a median household income of approximately $60,000. Granby is home to several large employers, including the Granby Industries and the Granby Mills, as well as several small businesses. The town is also home to several hills and mountains, including Mount Tom, which is the highest point in the town.
Common Questions
What is Per Capita Income in Granby?
Per Capita income in Granby is $50,555.
What is the Median Family Income in Granby?
Median Family Income in Granby is $135,724.
What is the Median Household income in Granby?
Median Household Income in Granby is $94,663.
What is Income or Wage Gap in Granby?
Income or Wage Gap in Granby is 42.2%.
Women in Granby earn 57.8 cents for every dollar earned by a man.
What is Inequality or Gini Index in Granby?
Inequality or Gini Index in Granby is 0.38.
What is the Total Population of Granby?
Total Population of Granby is 1,176.
What is the Total Male Population of Granby?
Total Male Population of Granby is 531.
What is the Total Female Population of Granby?
Total Female Population of Granby is 645.
What is the Ratio of Males per 100 Females in Granby?
There are 82.33 Males per 100 Females in Granby.
What is the Ratio of Females per 100 Males in Granby?
There are 121.47 Females per 100 Males in Granby.
What is the Median Population Age in Granby?
Median Population Age in Granby is 46.1 Years.
What is the Average Family Size in Granby
Average Family Size in Granby is 2.8 People.
What is the Average Household Size in Granby
Average Household Size in Granby is 2.4 People.
How Large is the Labor Force in Granby?
There are 783 People in the Labor Forcein in Granby.
What is the Percentage of People in the Labor Force in Granby?
79.9% of People are in the Labor Force in Granby.
What is the Unemployment Rate in Granby?
Unemployment Rate in Granby is 4.3%.