Marshfield Hills, MA Map & Demographics
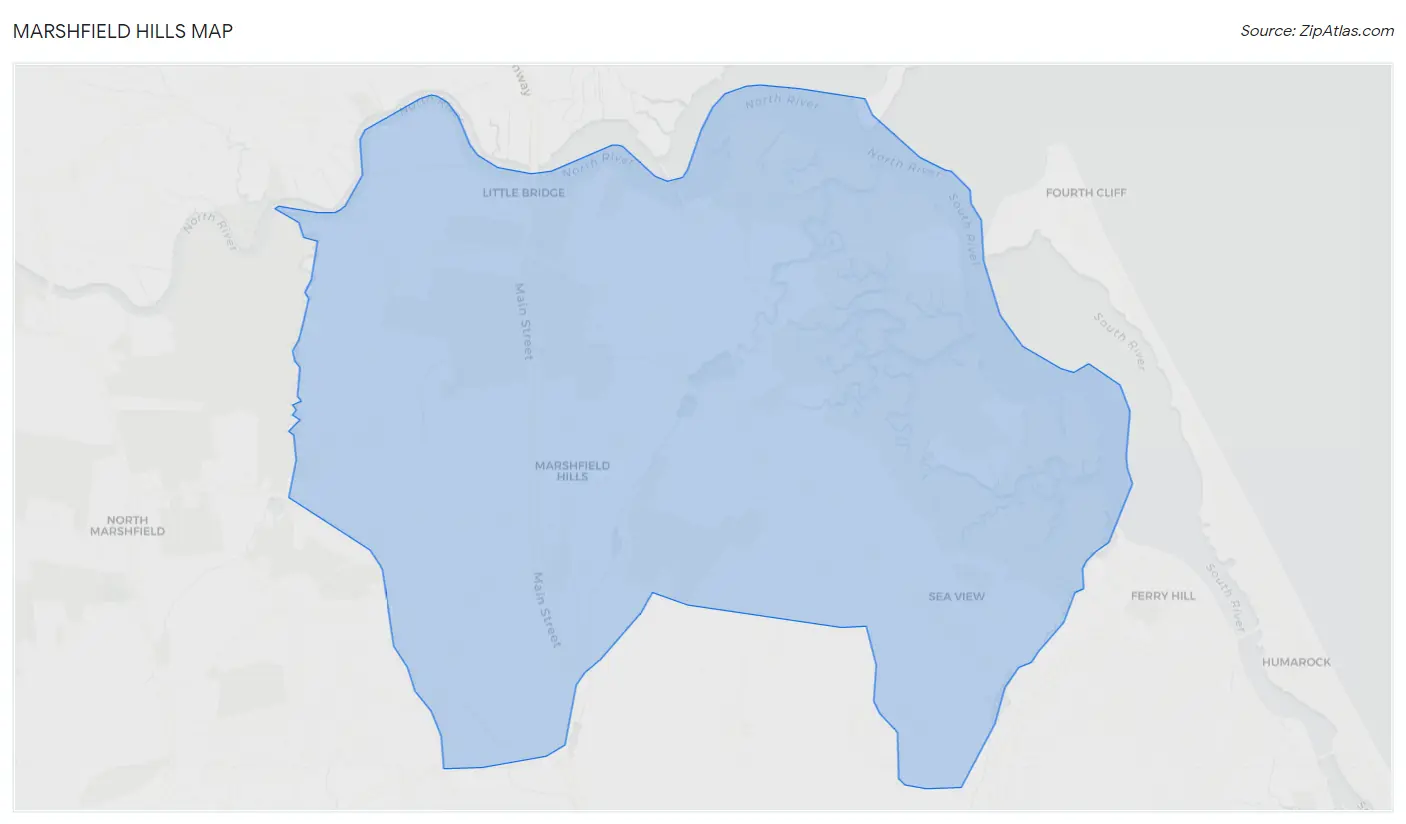
Marshfield Hills Map
Marshfield Hills Overview
$76,373
PER CAPITA INCOME
$184,607
AVG FAMILY INCOME
$164,571
AVG HOUSEHOLD INCOME
32.4%
WAGE / INCOME GAP [ % ]
67.6¢/ $1
WAGE / INCOME GAP [ $ ]
0.44
INEQUALITY / GINI INDEX
2,458
TOTAL POPULATION
1,136
MALE POPULATION
1,322
FEMALE POPULATION
85.93
MALES / 100 FEMALES
116.37
FEMALES / 100 MALES
47.2
MEDIAN AGE
3.0
AVG FAMILY SIZE
2.6
AVG HOUSEHOLD SIZE
1,361
LABOR FORCE [ PEOPLE ]
64.1%
PERCENT IN LABOR FORCE
Income in Marshfield Hills
Income Overview in Marshfield Hills
Per Capita Income in Marshfield Hills is $76,373, while median incomes of families and households are $184,607 and $164,571 respectively.
| Characteristic | Number | Measure |
| Per Capita Income | 2,458 | $76,373 |
| Median Family Income | 750 | $184,607 |
| Mean Family Income | 750 | $220,577 |
| Median Household Income | 937 | $164,571 |
| Mean Household Income | 937 | $195,454 |
| Income Deficit | 750 | $0 |
| Wage / Income Gap (%) | 2,458 | 32.42% |
| Wage / Income Gap ($) | 2,458 | 67.58¢ per $1 |
| Gini / Inequality Index | 2,458 | 0.44 |
Earnings by Sex in Marshfield Hills
Average Earnings in Marshfield Hills are $79,450, $91,250 for men and $61,667 for women, a difference of 32.4%.
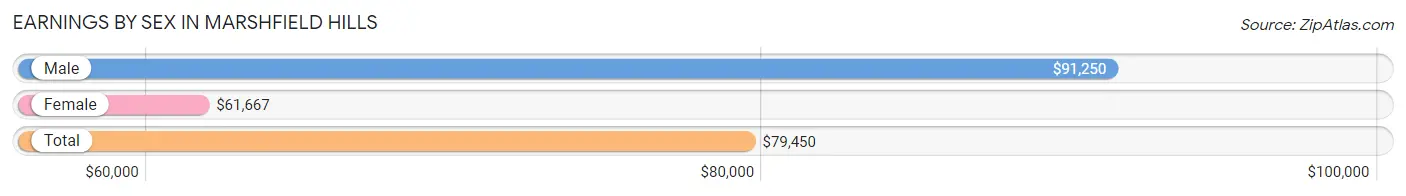
| Sex | Number | Average Earnings |
| Male | 745 (53.4%) | $91,250 |
| Female | 650 (46.6%) | $61,667 |
| Total | 1,395 (100.0%) | $79,450 |
Earnings by Sex by Income Bracket in Marshfield Hills
The most common earnings brackets in Marshfield Hills are $100,000+ for men (366 | 49.1%) and $100,000+ for women (230 | 35.4%).
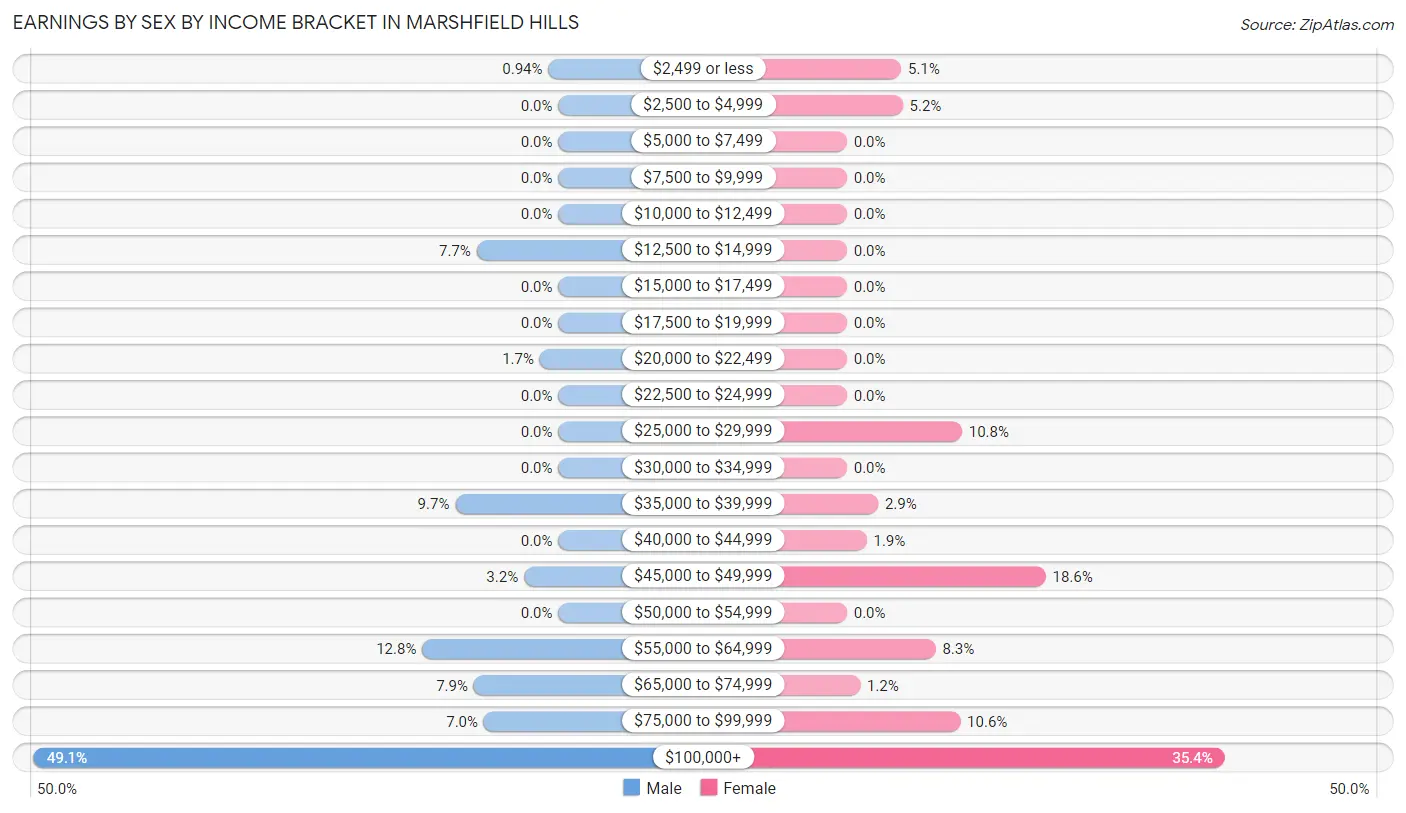
| Income | Male | Female |
| $2,499 or less | 7 (0.9%) | 33 (5.1%) |
| $2,500 to $4,999 | 0 (0.0%) | 34 (5.2%) |
| $5,000 to $7,499 | 0 (0.0%) | 0 (0.0%) |
| $7,500 to $9,999 | 0 (0.0%) | 0 (0.0%) |
| $10,000 to $12,499 | 0 (0.0%) | 0 (0.0%) |
| $12,500 to $14,999 | 57 (7.6%) | 0 (0.0%) |
| $15,000 to $17,499 | 0 (0.0%) | 0 (0.0%) |
| $17,500 to $19,999 | 0 (0.0%) | 0 (0.0%) |
| $20,000 to $22,499 | 13 (1.7%) | 0 (0.0%) |
| $22,500 to $24,999 | 0 (0.0%) | 0 (0.0%) |
| $25,000 to $29,999 | 0 (0.0%) | 70 (10.8%) |
| $30,000 to $34,999 | 0 (0.0%) | 0 (0.0%) |
| $35,000 to $39,999 | 72 (9.7%) | 19 (2.9%) |
| $40,000 to $44,999 | 0 (0.0%) | 12 (1.8%) |
| $45,000 to $49,999 | 24 (3.2%) | 121 (18.6%) |
| $50,000 to $54,999 | 0 (0.0%) | 0 (0.0%) |
| $55,000 to $64,999 | 95 (12.8%) | 54 (8.3%) |
| $65,000 to $74,999 | 59 (7.9%) | 8 (1.2%) |
| $75,000 to $99,999 | 52 (7.0%) | 69 (10.6%) |
| $100,000+ | 366 (49.1%) | 230 (35.4%) |
| Total | 745 (100.0%) | 650 (100.0%) |
Earnings by Sex by Educational Attainment in Marshfield Hills
Average earnings in Marshfield Hills are $103,750 for men and $62,222 for women, a difference of 40.0%. Men with an educational attainment of graduate degree enjoy the highest average annual earnings of $191,250, while those with bachelor's degree education earn the least with $83,472. Women with an educational attainment of bachelor's degree earn the most with the average annual earnings of $103,207, while those with college or associate's degree education have the smallest earnings of $61,505.
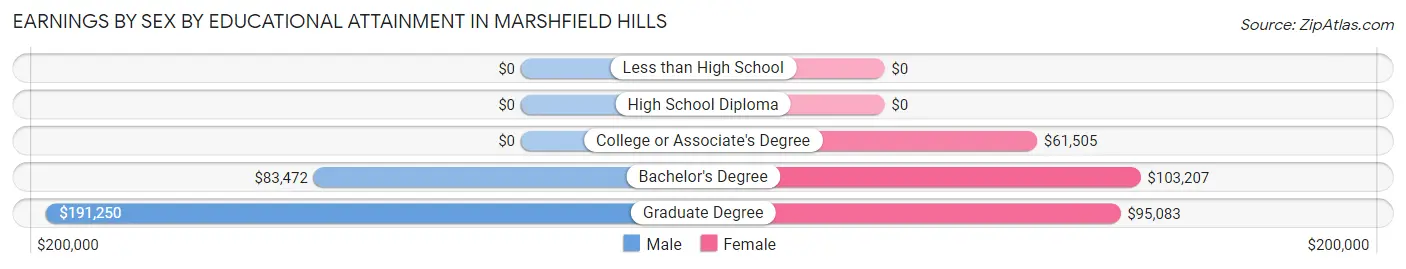
| Educational Attainment | Male Income | Female Income |
| Less than High School | - | - |
| High School Diploma | - | - |
| College or Associate's Degree | - | - |
| Bachelor's Degree | $83,472 | $103,207 |
| Graduate Degree | $191,250 | $95,083 |
| Total | $103,750 | $62,222 |
Family Income in Marshfield Hills
Family Income Brackets in Marshfield Hills
According to the Marshfield Hills family income data, there are 348 families falling into the $200,000+ income range, which is the most common income bracket and makes up 46.4% of all families.
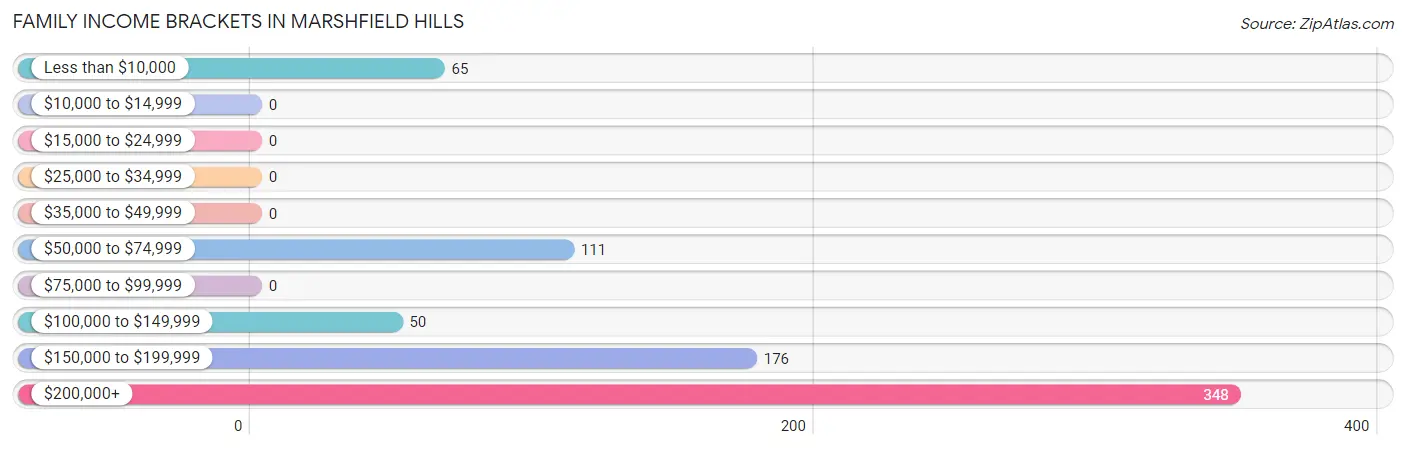
| Income Bracket | # Families | % Families |
| Less than $10,000 | 65 | 8.7% |
| $10,000 to $14,999 | 0 | 0.0% |
| $15,000 to $24,999 | 0 | 0.0% |
| $25,000 to $34,999 | 0 | 0.0% |
| $35,000 to $49,999 | 0 | 0.0% |
| $50,000 to $74,999 | 111 | 14.8% |
| $75,000 to $99,999 | 0 | 0.0% |
| $100,000 to $149,999 | 50 | 6.7% |
| $150,000 to $199,999 | 176 | 23.5% |
| $200,000+ | 348 | 46.4% |
Family Income by Famaliy Size in Marshfield Hills
4-person families (280 | 37.3%) account for the highest median family income in Marshfield Hills with $184,357 per family, while 2-person families (369 | 49.2%) have the highest median income of $82,304 per family member.
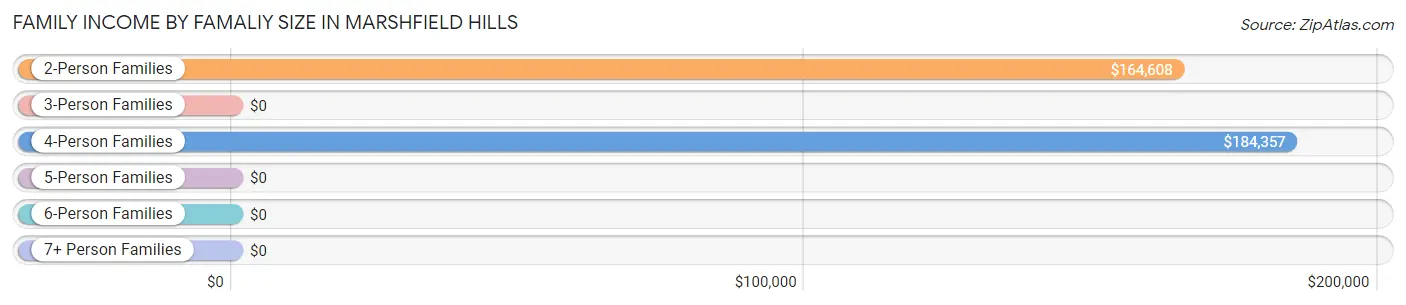
| Income Bracket | # Families | Median Income |
| 2-Person Families | 369 (49.2%) | $164,608 |
| 3-Person Families | 75 (10.0%) | $0 |
| 4-Person Families | 280 (37.3%) | $184,357 |
| 5-Person Families | 26 (3.5%) | $0 |
| 6-Person Families | 0 (0.0%) | $0 |
| 7+ Person Families | 0 (0.0%) | $0 |
| Total | 750 (100.0%) | $184,607 |
Family Income by Number of Earners in Marshfield Hills
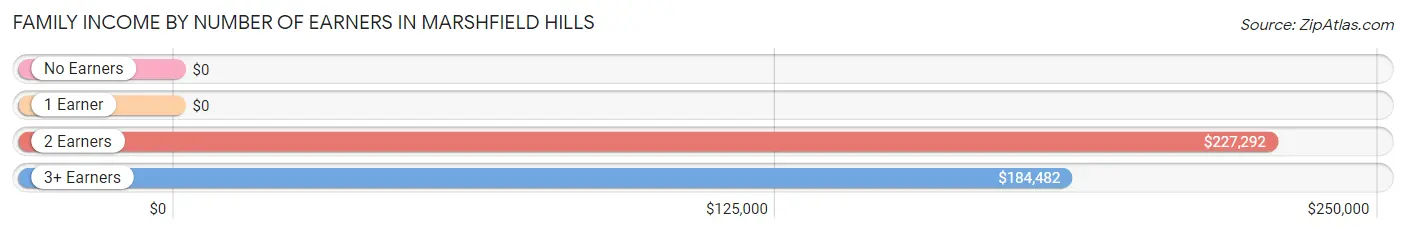
| Number of Earners | # Families | Median Income |
| No Earners | 140 (18.7%) | $0 |
| 1 Earner | 155 (20.7%) | $0 |
| 2 Earners | 344 (45.9%) | $227,292 |
| 3+ Earners | 111 (14.8%) | $184,482 |
| Total | 750 (100.0%) | $184,607 |
Household Income in Marshfield Hills
Household Income Brackets in Marshfield Hills
With 376 households falling in the category, the $200,000+ income range is the most frequent in Marshfield Hills, accounting for 40.1% of all households.
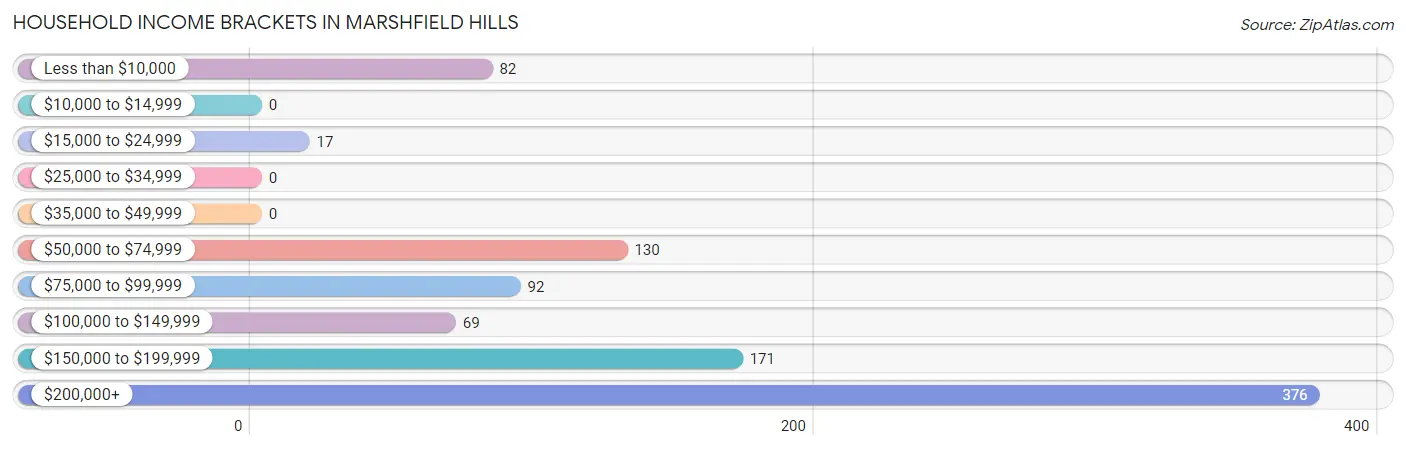
| Income Bracket | # Households | % Households |
| Less than $10,000 | 82 | 8.8% |
| $10,000 to $14,999 | 0 | 0.0% |
| $15,000 to $24,999 | 17 | 1.8% |
| $25,000 to $34,999 | 0 | 0.0% |
| $35,000 to $49,999 | 0 | 0.0% |
| $50,000 to $74,999 | 130 | 13.9% |
| $75,000 to $99,999 | 92 | 9.8% |
| $100,000 to $149,999 | 69 | 7.4% |
| $150,000 to $199,999 | 171 | 18.2% |
| $200,000+ | 376 | 40.1% |
Household Income by Householder Age in Marshfield Hills
The median household income in Marshfield Hills is $164,571, with the highest median household income of $221,250 found in the 25 to 44 years age bracket for the primary householder. A total of 146 households (15.6%) fall into this category.
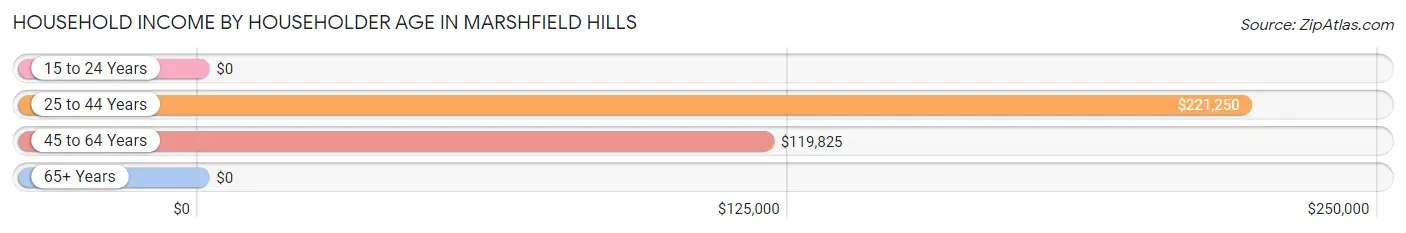
| Income Bracket | # Households | Median Income |
| 15 to 24 Years | 0 (0.0%) | $0 |
| 25 to 44 Years | 146 (15.6%) | $221,250 |
| 45 to 64 Years | 523 (55.8%) | $119,825 |
| 65+ Years | 268 (28.6%) | $0 |
| Total | 937 (100.0%) | $164,571 |
Poverty in Marshfield Hills
Income Below Poverty by Sex and Age in Marshfield Hills
With 12.8% poverty level for males and 9.7% for females among the residents of Marshfield Hills, 16 and 17 year old males and 16 and 17 year old females are the most vulnerable to poverty, with 63 males (90.0%) and 67 females (41.9%) in their respective age groups living below the poverty level.
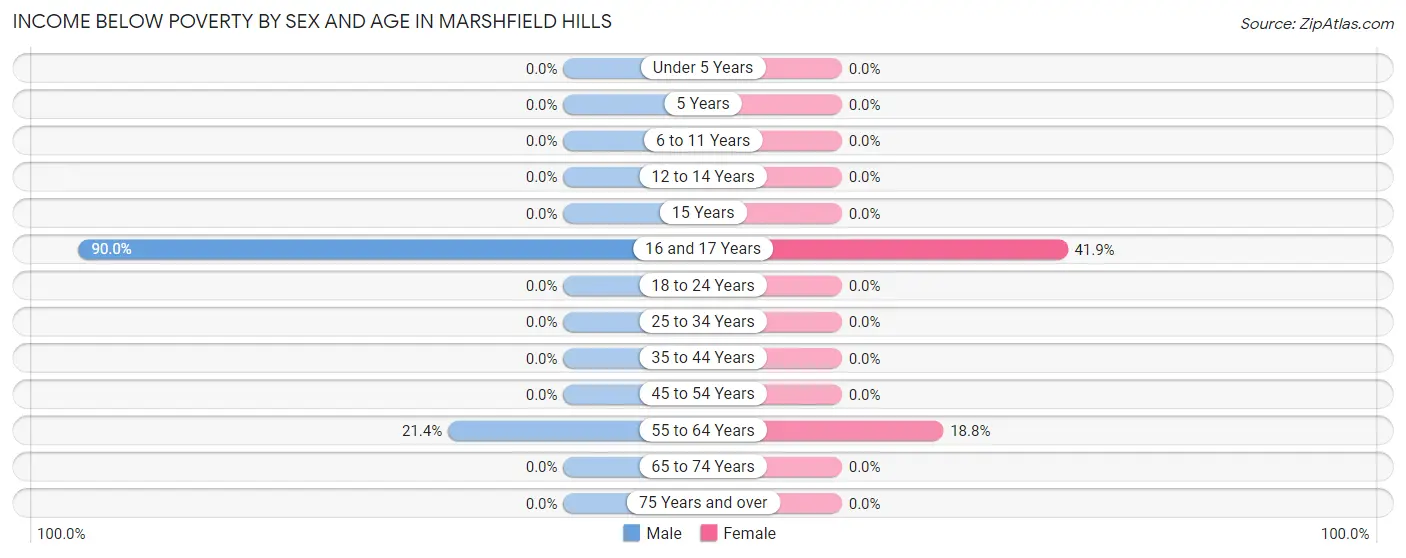
| Age Bracket | Male | Female |
| Under 5 Years | 0 (0.0%) | 0 (0.0%) |
| 5 Years | 0 (0.0%) | 0 (0.0%) |
| 6 to 11 Years | 0 (0.0%) | 0 (0.0%) |
| 12 to 14 Years | 0 (0.0%) | 0 (0.0%) |
| 15 Years | 0 (0.0%) | 0 (0.0%) |
| 16 and 17 Years | 63 (90.0%) | 67 (41.9%) |
| 18 to 24 Years | 0 (0.0%) | 0 (0.0%) |
| 25 to 34 Years | 0 (0.0%) | 0 (0.0%) |
| 35 to 44 Years | 0 (0.0%) | 0 (0.0%) |
| 45 to 54 Years | 0 (0.0%) | 0 (0.0%) |
| 55 to 64 Years | 82 (21.4%) | 61 (18.8%) |
| 65 to 74 Years | 0 (0.0%) | 0 (0.0%) |
| 75 Years and over | 0 (0.0%) | 0 (0.0%) |
| Total | 145 (12.8%) | 128 (9.7%) |
Income Above Poverty by Sex and Age in Marshfield Hills
According to the poverty statistics in Marshfield Hills, males aged under 5 years and females aged under 5 years are the age groups that are most secure financially, with 100.0% of males and 100.0% of females in these age groups living above the poverty line.
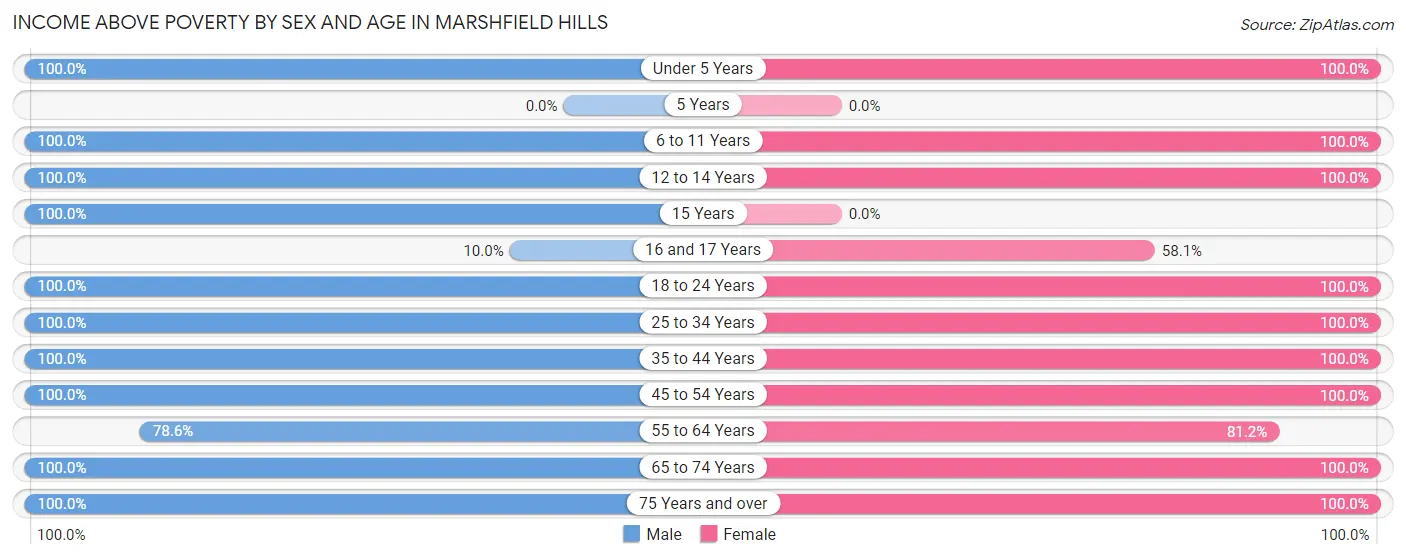
| Age Bracket | Male | Female |
| Under 5 Years | 21 (100.0%) | 103 (100.0%) |
| 5 Years | 0 (0.0%) | 0 (0.0%) |
| 6 to 11 Years | 52 (100.0%) | 98 (100.0%) |
| 12 to 14 Years | 39 (100.0%) | 15 (100.0%) |
| 15 Years | 7 (100.0%) | 0 (0.0%) |
| 16 and 17 Years | 7 (10.0%) | 93 (58.1%) |
| 18 to 24 Years | 26 (100.0%) | 9 (100.0%) |
| 25 to 34 Years | 135 (100.0%) | 61 (100.0%) |
| 35 to 44 Years | 194 (100.0%) | 184 (100.0%) |
| 45 to 54 Years | 92 (100.0%) | 126 (100.0%) |
| 55 to 64 Years | 301 (78.6%) | 263 (81.2%) |
| 65 to 74 Years | 46 (100.0%) | 99 (100.0%) |
| 75 Years and over | 71 (100.0%) | 143 (100.0%) |
| Total | 991 (87.2%) | 1,194 (90.3%) |
Income Below Poverty Among Married-Couple Families in Marshfield Hills
The poverty statistics for married-couple families in Marshfield Hills show that 10.7% or 65 of the total 610 families live below the poverty line. Families with 1 or 2 children have the highest poverty rate of 28.8%, comprising of 65 families. On the other hand, families with no children have the lowest poverty rate of 0.0%, which includes 0 families.
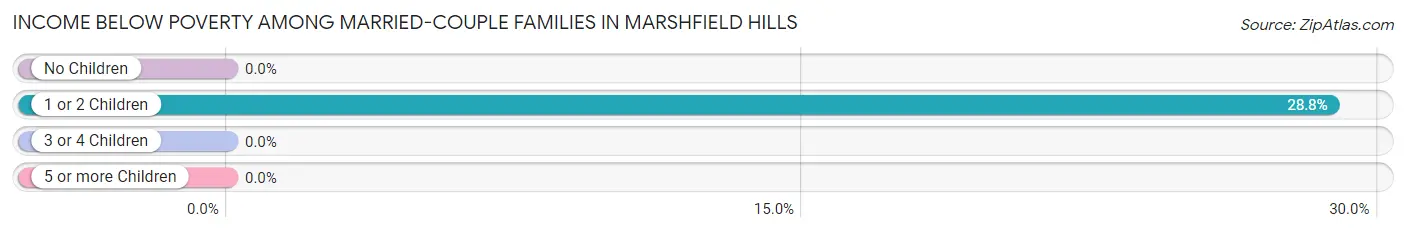
| Children | Above Poverty | Below Poverty |
| No Children | 366 (100.0%) | 0 (0.0%) |
| 1 or 2 Children | 161 (71.2%) | 65 (28.8%) |
| 3 or 4 Children | 18 (100.0%) | 0 (0.0%) |
| 5 or more Children | 0 (0.0%) | 0 (0.0%) |
| Total | 545 (89.3%) | 65 (10.7%) |
Income Below Poverty Among Single-Parent Households in Marshfield Hills
| Children | Single Father | Single Mother |
| No Children | 0 (0.0%) | 0 (0.0%) |
| 1 or 2 Children | 0 (0.0%) | 0 (0.0%) |
| 3 or 4 Children | 0 (0.0%) | 0 (0.0%) |
| 5 or more Children | 0 (0.0%) | 0 (0.0%) |
| Total | 0 (0.0%) | 0 (0.0%) |
Income Below Poverty Among Married-Couple vs Single-Parent Households in Marshfield Hills
| Children | Married-Couple Families | Single-Parent Households |
| No Children | 0 (0.0%) | 0 (0.0%) |
| 1 or 2 Children | 65 (28.8%) | 0 (0.0%) |
| 3 or 4 Children | 0 (0.0%) | 0 (0.0%) |
| 5 or more Children | 0 (0.0%) | 0 (0.0%) |
| Total | 65 (10.7%) | 0 (0.0%) |
Race in Marshfield Hills
The most populous races in Marshfield Hills are White / Caucasian (2,392 | 97.3%), Hispanic or Latino (66 | 2.7%), and Two or more Races (40 | 1.6%).
| Race | # Population | % Population |
| Asian | 0 | 0.0% |
| Black / African American | 0 | 0.0% |
| Hawaiian / Pacific | 0 | 0.0% |
| Hispanic or Latino | 66 | 2.7% |
| Native / Alaskan | 0 | 0.0% |
| White / Caucasian | 2,392 | 97.3% |
| Two or more Races | 40 | 1.6% |
| Some other Race | 26 | 1.1% |
| Total | 2,458 | 100.0% |
Ancestry in Marshfield Hills
The most populous ancestries reported in Marshfield Hills are Irish (1,162 | 47.3%), English (537 | 21.8%), Italian (397 | 16.2%), Portuguese (193 | 7.9%), and French (153 | 6.2%), together accounting for 99.3% of all Marshfield Hills residents.
| Ancestry | # Population | % Population |
| Austrian | 34 | 1.4% |
| Belgian | 23 | 0.9% |
| Central American | 66 | 2.7% |
| Dutch | 15 | 0.6% |
| Eastern European | 27 | 1.1% |
| English | 537 | 21.8% |
| French | 153 | 6.2% |
| German | 64 | 2.6% |
| Greek | 41 | 1.7% |
| Irish | 1,162 | 47.3% |
| Italian | 397 | 16.2% |
| Polish | 115 | 4.7% |
| Portuguese | 193 | 7.9% |
| Russian | 13 | 0.5% |
| Salvadoran | 66 | 2.7% |
| Scandinavian | 10 | 0.4% |
| Scottish | 44 | 1.8% |
| Slovene | 12 | 0.5% |
| Swedish | 60 | 2.4% |
| Welsh | 15 | 0.6% | View All 20 Rows |
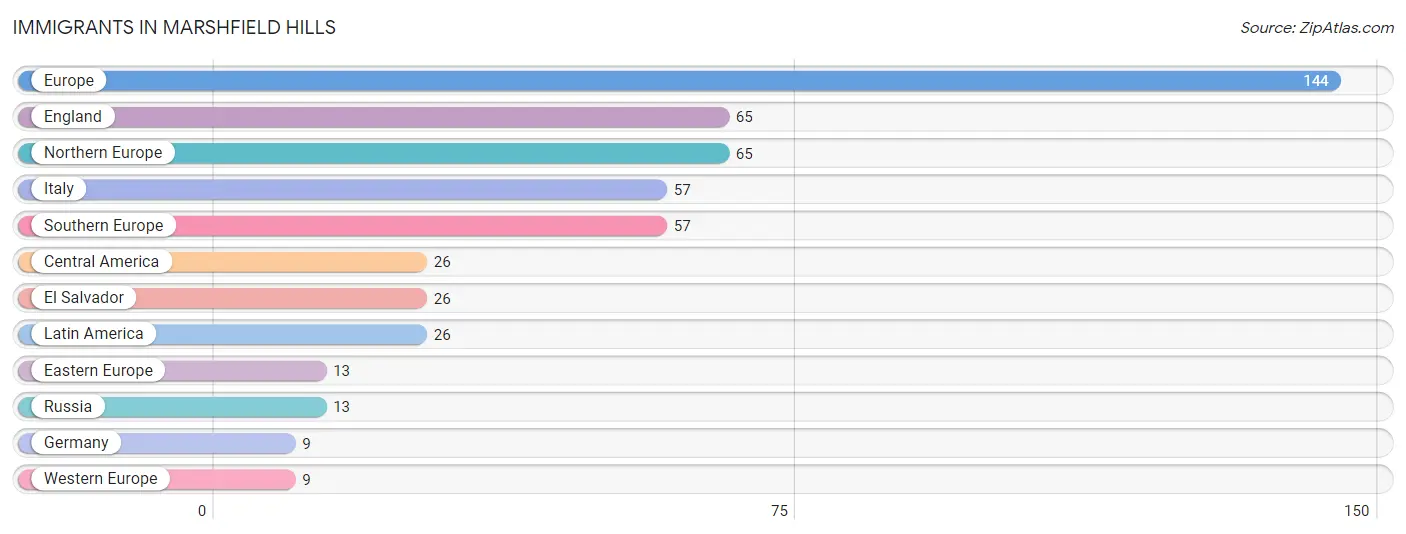
Immigrants in Marshfield Hills
The most numerous immigrant groups reported in Marshfield Hills came from Europe (144 | 5.9%), England (65 | 2.6%), Northern Europe (65 | 2.6%), Italy (57 | 2.3%), and Southern Europe (57 | 2.3%), together accounting for 15.8% of all Marshfield Hills residents.
| Immigration Origin | # Population | % Population |
| Central America | 26 | 1.1% |
| Eastern Europe | 13 | 0.5% |
| El Salvador | 26 | 1.1% |
| England | 65 | 2.6% |
| Europe | 144 | 5.9% |
| Germany | 9 | 0.4% |
| Italy | 57 | 2.3% |
| Latin America | 26 | 1.1% |
| Northern Europe | 65 | 2.6% |
| Russia | 13 | 0.5% |
| Southern Europe | 57 | 2.3% |
| Western Europe | 9 | 0.4% | View All 12 Rows |
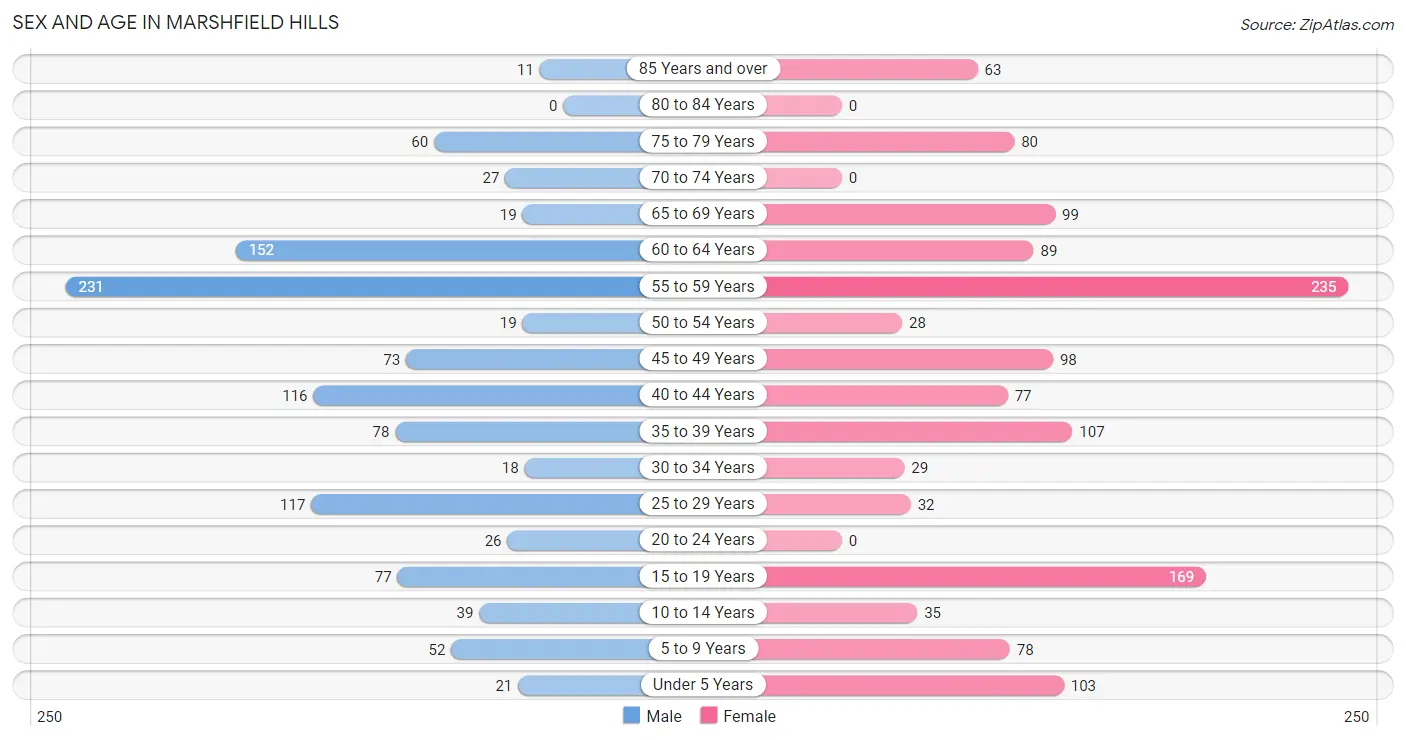
Sex and Age in Marshfield Hills
Sex and Age in Marshfield Hills
The most populous age groups in Marshfield Hills are 55 to 59 Years (231 | 20.3%) for men and 55 to 59 Years (235 | 17.8%) for women.
| Age Bracket | Male | Female |
| Under 5 Years | 21 (1.8%) | 103 (7.8%) |
| 5 to 9 Years | 52 (4.6%) | 78 (5.9%) |
| 10 to 14 Years | 39 (3.4%) | 35 (2.6%) |
| 15 to 19 Years | 77 (6.8%) | 169 (12.8%) |
| 20 to 24 Years | 26 (2.3%) | 0 (0.0%) |
| 25 to 29 Years | 117 (10.3%) | 32 (2.4%) |
| 30 to 34 Years | 18 (1.6%) | 29 (2.2%) |
| 35 to 39 Years | 78 (6.9%) | 107 (8.1%) |
| 40 to 44 Years | 116 (10.2%) | 77 (5.8%) |
| 45 to 49 Years | 73 (6.4%) | 98 (7.4%) |
| 50 to 54 Years | 19 (1.7%) | 28 (2.1%) |
| 55 to 59 Years | 231 (20.3%) | 235 (17.8%) |
| 60 to 64 Years | 152 (13.4%) | 89 (6.7%) |
| 65 to 69 Years | 19 (1.7%) | 99 (7.5%) |
| 70 to 74 Years | 27 (2.4%) | 0 (0.0%) |
| 75 to 79 Years | 60 (5.3%) | 80 (6.0%) |
| 80 to 84 Years | 0 (0.0%) | 0 (0.0%) |
| 85 Years and over | 11 (1.0%) | 63 (4.8%) |
| Total | 1,136 (100.0%) | 1,322 (100.0%) |
Families and Households in Marshfield Hills
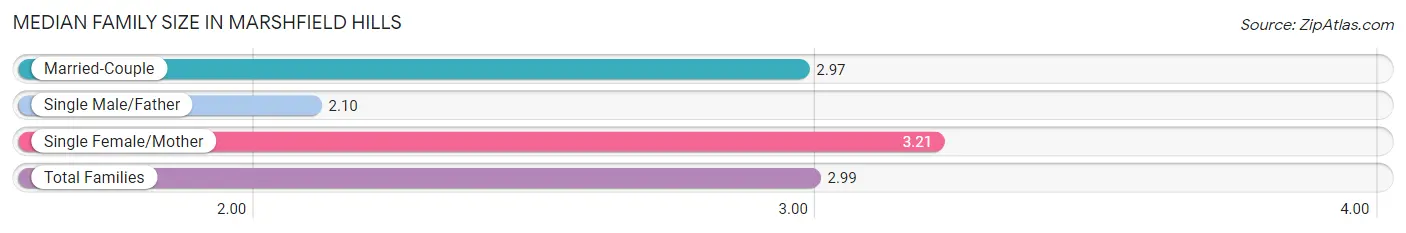
Median Family Size in Marshfield Hills
The median family size in Marshfield Hills is 2.99 persons per family, with single female/mother families (120 | 16.0%) accounting for the largest median family size of 3.21 persons per family. On the other hand, single male/father families (20 | 2.7%) represent the smallest median family size with 2.10 persons per family.
| Family Type | # Families | Family Size |
| Married-Couple | 610 (81.3%) | 2.97 |
| Single Male/Father | 20 (2.7%) | 2.10 |
| Single Female/Mother | 120 (16.0%) | 3.21 |
| Total Families | 750 (100.0%) | 2.99 |
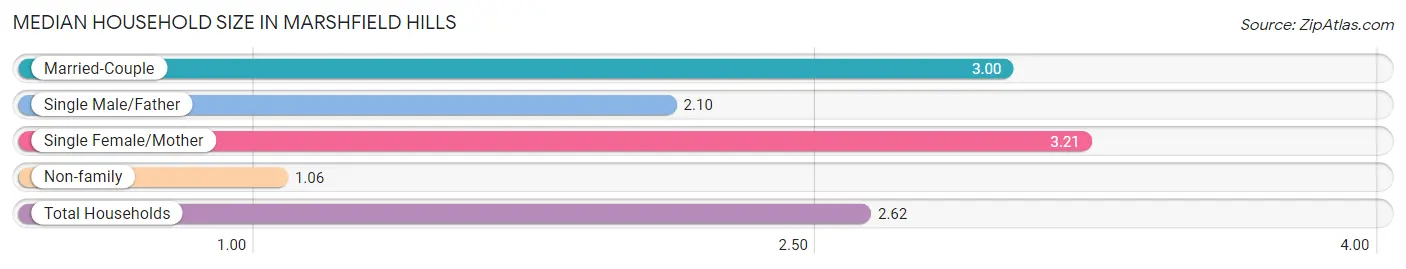
Median Household Size in Marshfield Hills
The median household size in Marshfield Hills is 2.62 persons per household, with single female/mother households (120 | 12.8%) accounting for the largest median household size of 3.21 persons per household. non-family households (187 | 20.0%) represent the smallest median household size with 1.06 persons per household.
| Household Type | # Households | Household Size |
| Married-Couple | 610 (65.1%) | 3.00 |
| Single Male/Father | 20 (2.1%) | 2.10 |
| Single Female/Mother | 120 (12.8%) | 3.21 |
| Non-family | 187 (20.0%) | 1.06 |
| Total Households | 937 (100.0%) | 2.62 |
Household Size by Marriage Status in Marshfield Hills
Out of a total of 937 households in Marshfield Hills, 750 (80.0%) are family households, while 187 (20.0%) are nonfamily households. The most numerous type of family households are 2-person households, comprising 369, and the most common type of nonfamily households are 1-person households, comprising 175.
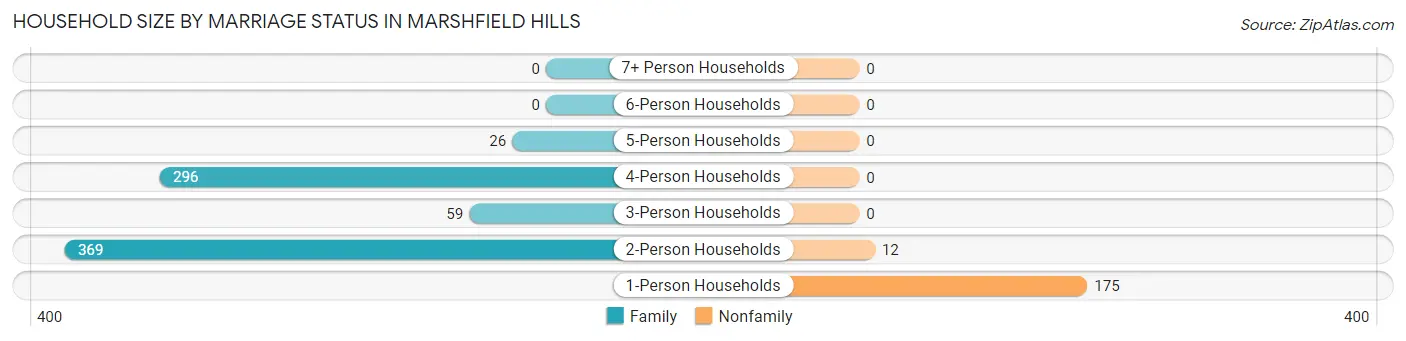
| Household Size | Family Households | Nonfamily Households |
| 1-Person Households | - | 175 (18.7%) |
| 2-Person Households | 369 (39.4%) | 12 (1.3%) |
| 3-Person Households | 59 (6.3%) | 0 (0.0%) |
| 4-Person Households | 296 (31.6%) | 0 (0.0%) |
| 5-Person Households | 26 (2.8%) | 0 (0.0%) |
| 6-Person Households | 0 (0.0%) | 0 (0.0%) |
| 7+ Person Households | 0 (0.0%) | 0 (0.0%) |
| Total | 750 (80.0%) | 187 (20.0%) |
Female Fertility in Marshfield Hills
Fertility by Age in Marshfield Hills
Average fertility rate in Marshfield Hills is 209.0 births per 1,000 women. Women in the age bracket of 35 to 50 years have the highest fertility rate with 326.0 births per 1,000 women. Women in the age bracket of 35 to 50 years acount for 86.0% of all women with births.
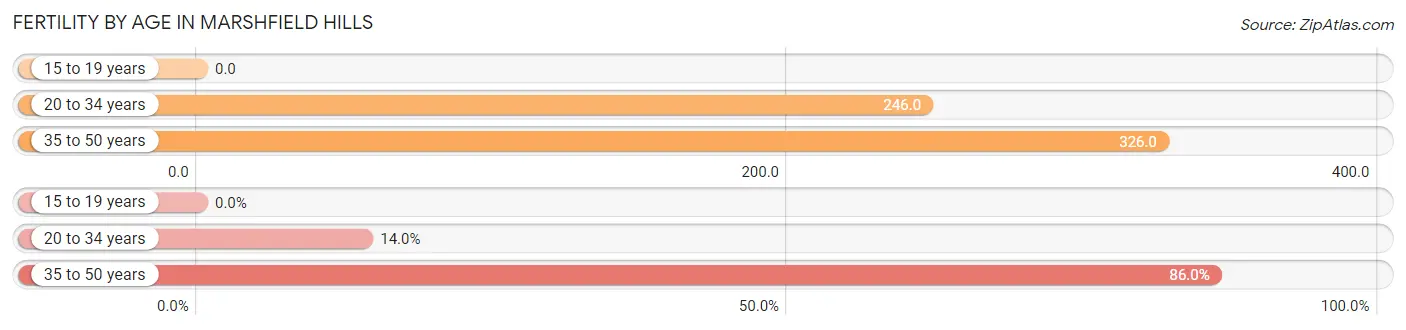
| Age Bracket | Women with Births | Births / 1,000 Women |
| 15 to 19 years | 0 (0.0%) | 0.0 |
| 20 to 34 years | 15 (14.0%) | 246.0 |
| 35 to 50 years | 92 (86.0%) | 326.0 |
| Total | 107 (100.0%) | 209.0 |
Fertility by Age by Marriage Status in Marshfield Hills
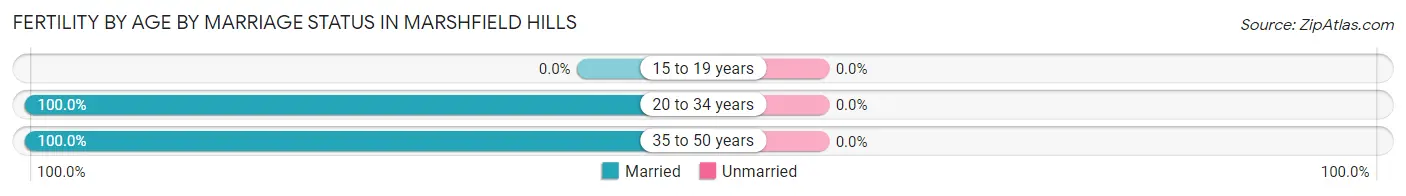
| Age Bracket | Married | Unmarried |
| 15 to 19 years | 0 (0.0%) | 0 (0.0%) |
| 20 to 34 years | 15 (100.0%) | 0 (0.0%) |
| 35 to 50 years | 92 (100.0%) | 0 (0.0%) |
| Total | 107 (100.0%) | 0 (0.0%) |
Fertility by Education in Marshfield Hills
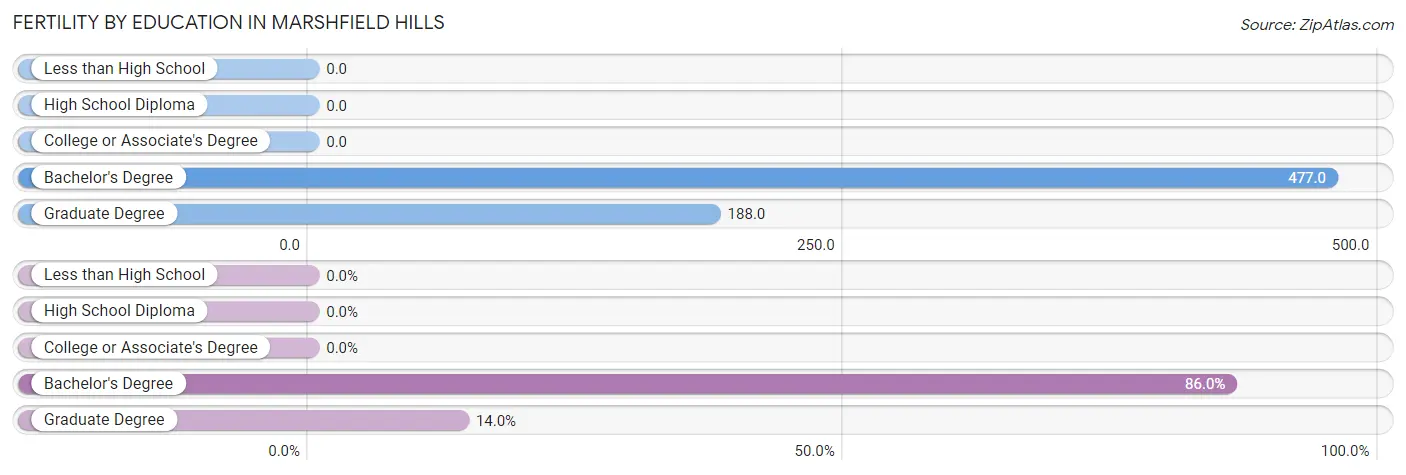
| Educational Attainment | Women with Births | Births / 1,000 Women |
| Less than High School | 0 (0.0%) | 0.0 |
| High School Diploma | 0 (0.0%) | 0.0 |
| College or Associate's Degree | 0 (0.0%) | 0.0 |
| Bachelor's Degree | 92 (86.0%) | 477.0 |
| Graduate Degree | 15 (14.0%) | 188.0 |
| Total | 107 (100.0%) | 209.0 |
Fertility by Education by Marriage Status in Marshfield Hills
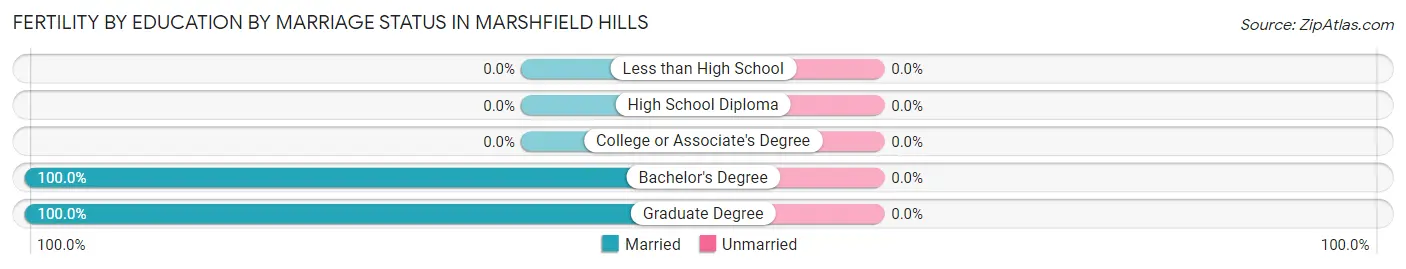
| Educational Attainment | Married | Unmarried |
| Less than High School | 0 (0.0%) | 0 (0.0%) |
| High School Diploma | 0 (0.0%) | 0 (0.0%) |
| College or Associate's Degree | 0 (0.0%) | 0 (0.0%) |
| Bachelor's Degree | 92 (100.0%) | 0 (0.0%) |
| Graduate Degree | 15 (100.0%) | 0 (0.0%) |
| Total | 107 (100.0%) | 0 (0.0%) |
Employment Characteristics in Marshfield Hills
Employment by Class of Employer in Marshfield Hills
Among the 1,361 employed individuals in Marshfield Hills, private company employees (783 | 57.5%), local government employees (211 | 15.5%), and not-for-profit organizations (176 | 12.9%) make up the most common classes of employment.
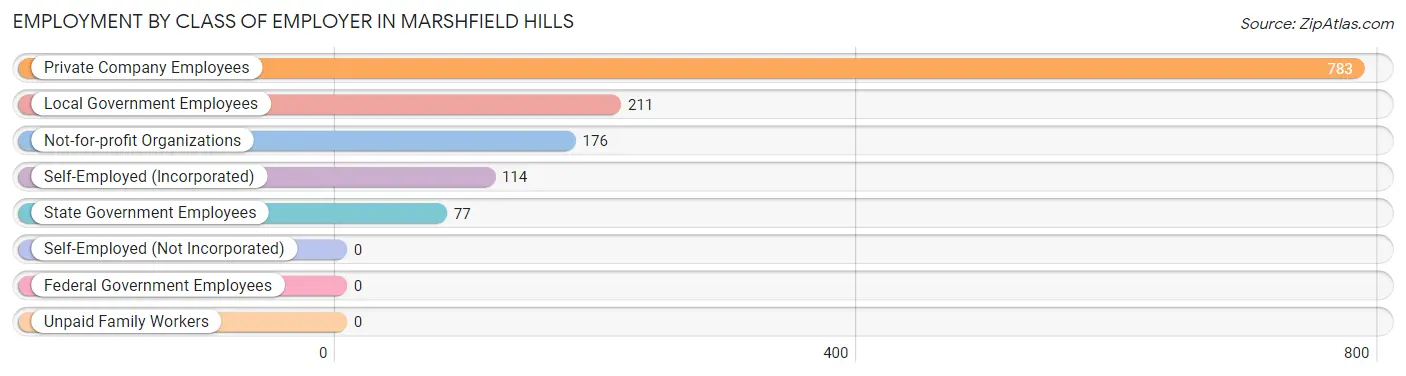
| Employer Class | # Employees | % Employees |
| Private Company Employees | 783 | 57.5% |
| Self-Employed (Incorporated) | 114 | 8.4% |
| Self-Employed (Not Incorporated) | 0 | 0.0% |
| Not-for-profit Organizations | 176 | 12.9% |
| Local Government Employees | 211 | 15.5% |
| State Government Employees | 77 | 5.7% |
| Federal Government Employees | 0 | 0.0% |
| Unpaid Family Workers | 0 | 0.0% |
| Total | 1,361 | 100.0% |
Employment Status by Age in Marshfield Hills
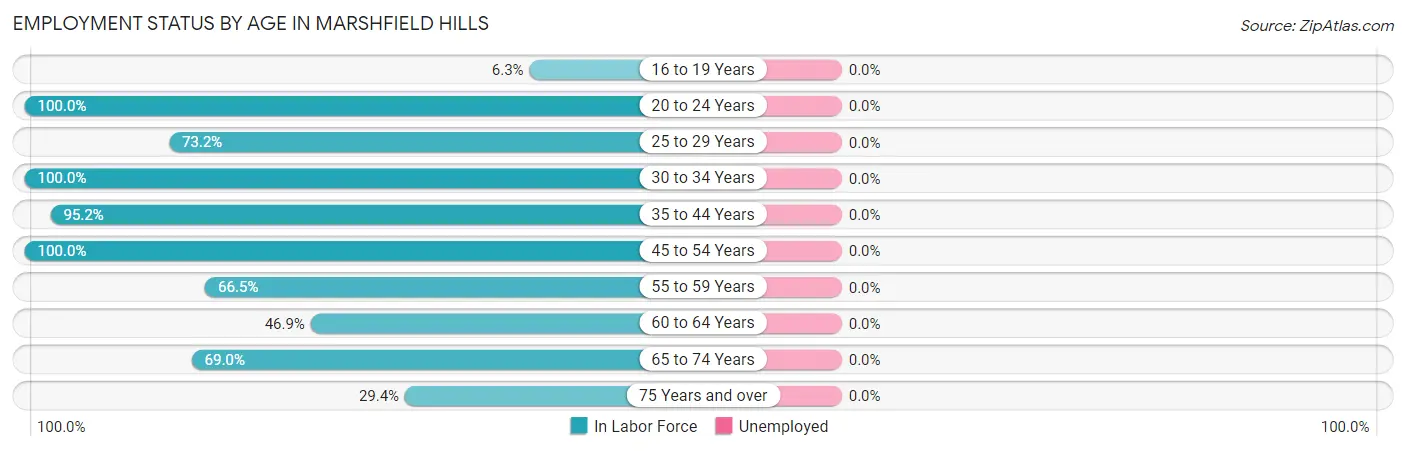
| Age Bracket | In Labor Force | Unemployed |
| 16 to 19 Years | 15 (6.3%) | 0 (0.0%) |
| 20 to 24 Years | 26 (100.0%) | 0 (0.0%) |
| 25 to 29 Years | 109 (73.2%) | 0 (0.0%) |
| 30 to 34 Years | 47 (100.0%) | 0 (0.0%) |
| 35 to 44 Years | 360 (95.2%) | 0 (0.0%) |
| 45 to 54 Years | 218 (100.0%) | 0 (0.0%) |
| 55 to 59 Years | 310 (66.5%) | 0 (0.0%) |
| 60 to 64 Years | 113 (46.9%) | 0 (0.0%) |
| 65 to 74 Years | 100 (69.0%) | 0 (0.0%) |
| 75 Years and over | 63 (29.4%) | 0 (0.0%) |
| Total | 1,361 (64.1%) | 0 (0.0%) |
Employment Status by Educational Attainment in Marshfield Hills
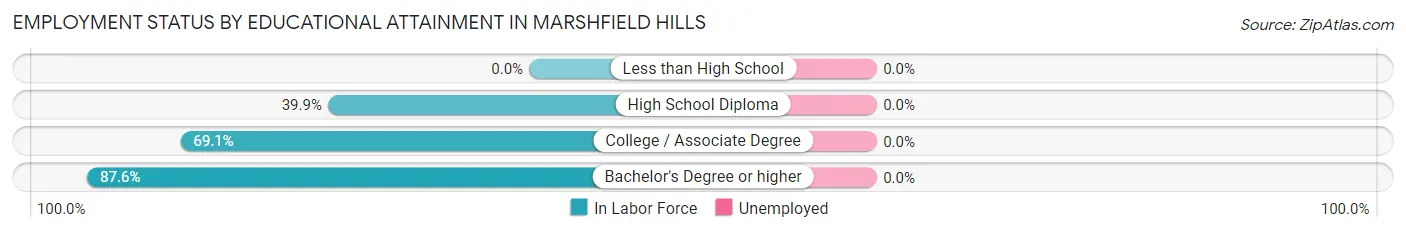
| Educational Attainment | In Labor Force | Unemployed |
| Less than High School | 0 (0.0%) | 0 (0.0%) |
| High School Diploma | 67 (39.9%) | 0 (0.0%) |
| College / Associate Degree | 284 (69.1%) | 0 (0.0%) |
| Bachelor's Degree or higher | 806 (87.6%) | 0 (0.0%) |
| Total | 1,157 (77.2%) | 0 (0.0%) |
Employment Occupations by Sex in Marshfield Hills
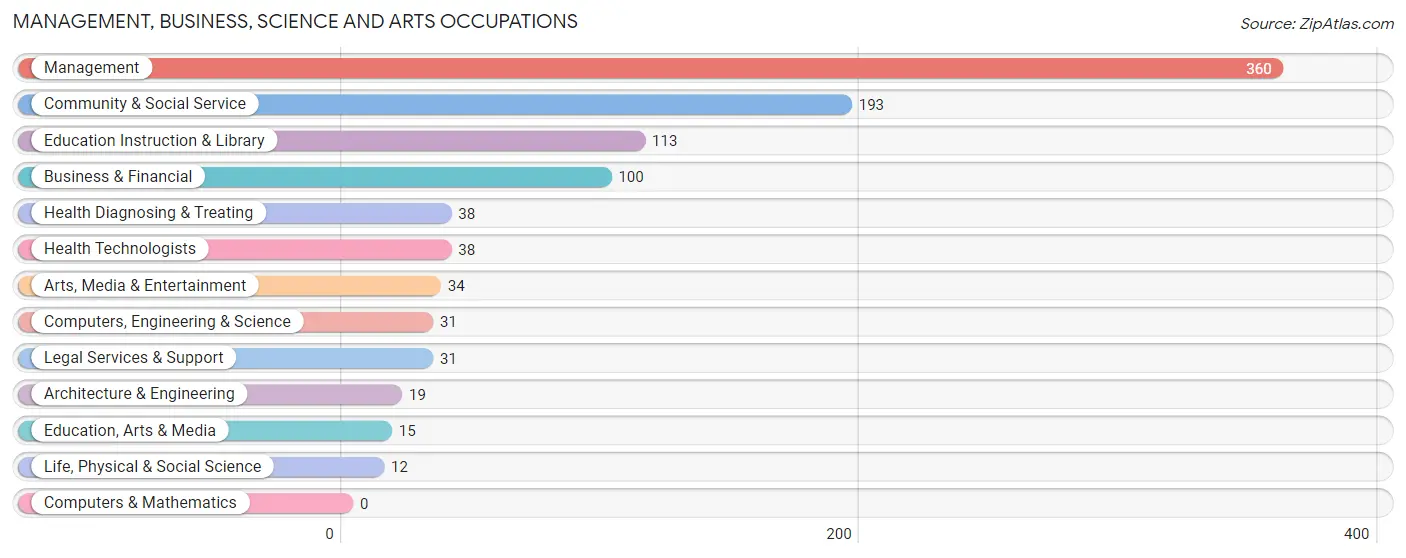
Management, Business, Science and Arts Occupations
The most common Management, Business, Science and Arts occupations in Marshfield Hills are Management (360 | 26.5%), Community & Social Service (193 | 14.2%), Education Instruction & Library (113 | 8.3%), Business & Financial (100 | 7.3%), and Health Diagnosing & Treating (38 | 2.8%).
Management, Business, Science and Arts Occupations by Sex
Within the Management, Business, Science and Arts occupations in Marshfield Hills, the most male-oriented occupations are Architecture & Engineering (100.0%), Management (86.7%), and Business & Financial (75.0%), while the most female-oriented occupations are Life, Physical & Social Science (100.0%), Education, Arts & Media (100.0%), and Education Instruction & Library (100.0%).
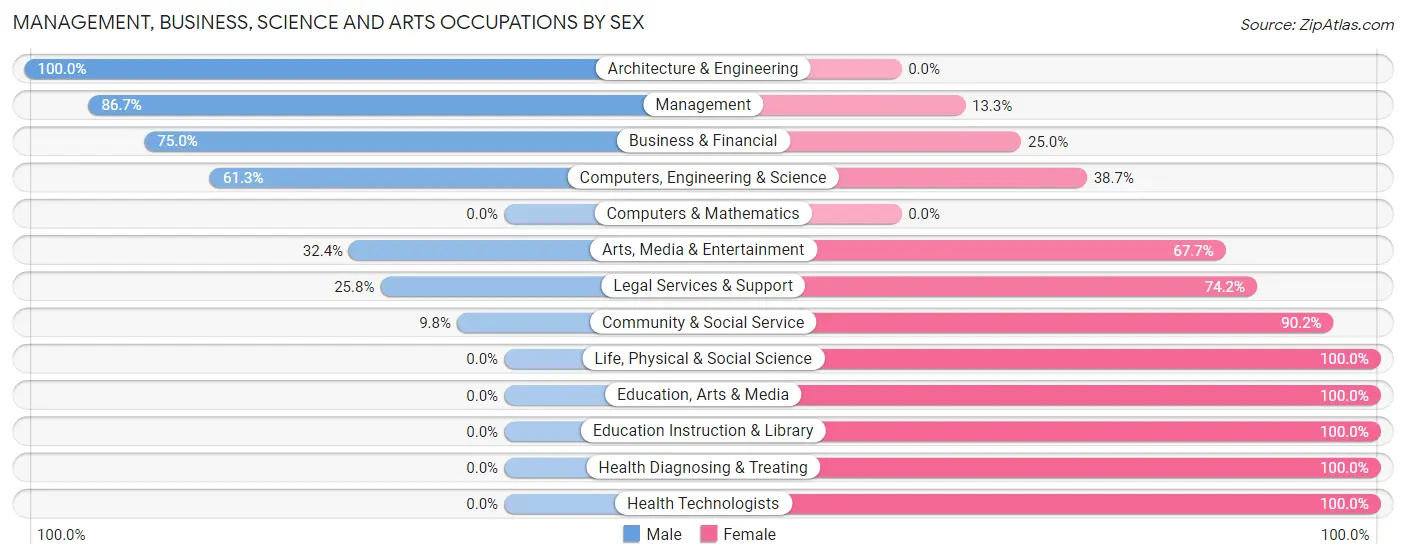
| Occupation | Male | Female |
| Management | 312 (86.7%) | 48 (13.3%) |
| Business & Financial | 75 (75.0%) | 25 (25.0%) |
| Computers, Engineering & Science | 19 (61.3%) | 12 (38.7%) |
| Computers & Mathematics | 0 (0.0%) | 0 (0.0%) |
| Architecture & Engineering | 19 (100.0%) | 0 (0.0%) |
| Life, Physical & Social Science | 0 (0.0%) | 12 (100.0%) |
| Community & Social Service | 19 (9.8%) | 174 (90.2%) |
| Education, Arts & Media | 0 (0.0%) | 15 (100.0%) |
| Legal Services & Support | 8 (25.8%) | 23 (74.2%) |
| Education Instruction & Library | 0 (0.0%) | 113 (100.0%) |
| Arts, Media & Entertainment | 11 (32.4%) | 23 (67.6%) |
| Health Diagnosing & Treating | 0 (0.0%) | 38 (100.0%) |
| Health Technologists | 0 (0.0%) | 38 (100.0%) |
| Total (Category) | 425 (58.9%) | 297 (41.1%) |
| Total (Overall) | 738 (54.2%) | 623 (45.8%) |
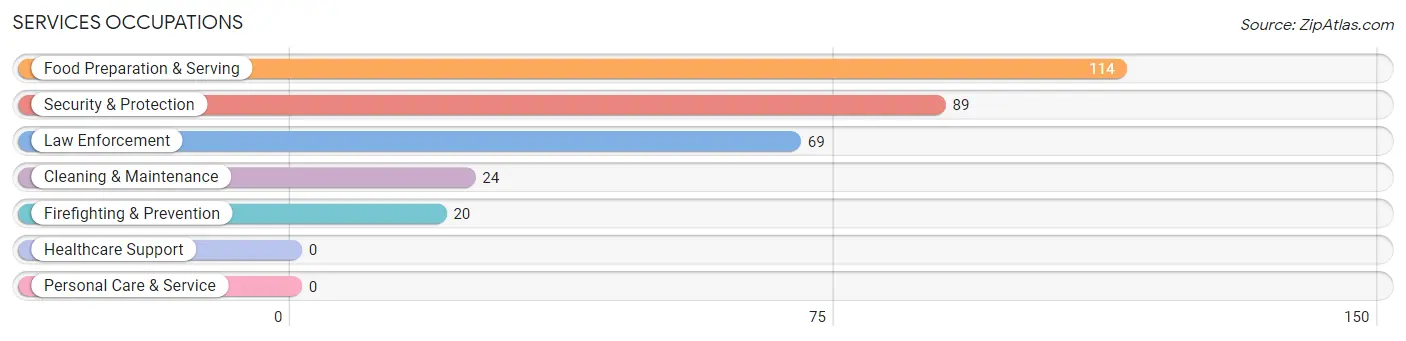
Services Occupations
The most common Services occupations in Marshfield Hills are Food Preparation & Serving (114 | 8.4%), Security & Protection (89 | 6.5%), Law Enforcement (69 | 5.1%), Cleaning & Maintenance (24 | 1.8%), and Firefighting & Prevention (20 | 1.5%).
Services Occupations by Sex
Within the Services occupations in Marshfield Hills, the most male-oriented occupations are Firefighting & Prevention (100.0%), Food Preparation & Serving (100.0%), and Cleaning & Maintenance (100.0%), while the most female-oriented occupations are Law Enforcement (100.0%), and Security & Protection (77.5%).
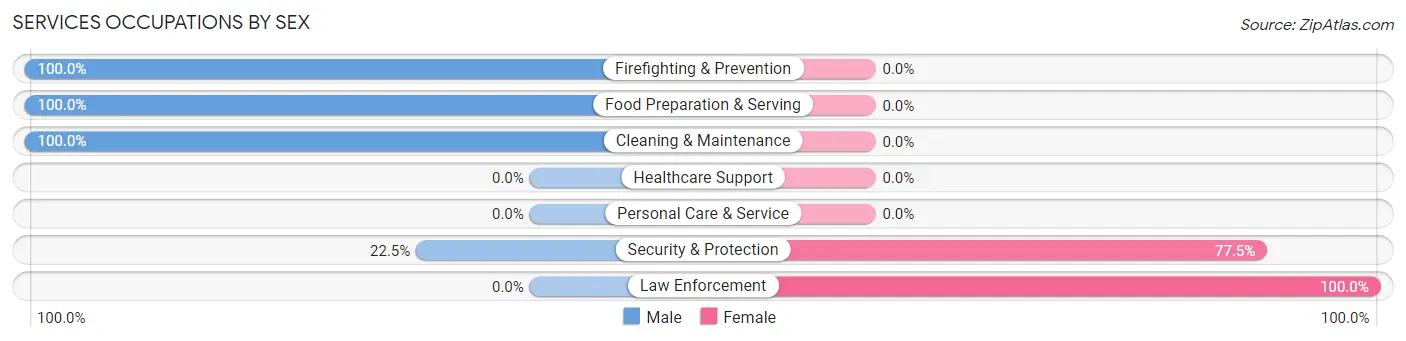
| Occupation | Male | Female |
| Healthcare Support | 0 (0.0%) | 0 (0.0%) |
| Security & Protection | 20 (22.5%) | 69 (77.5%) |
| Firefighting & Prevention | 20 (100.0%) | 0 (0.0%) |
| Law Enforcement | 0 (0.0%) | 69 (100.0%) |
| Food Preparation & Serving | 114 (100.0%) | 0 (0.0%) |
| Cleaning & Maintenance | 24 (100.0%) | 0 (0.0%) |
| Personal Care & Service | 0 (0.0%) | 0 (0.0%) |
| Total (Category) | 158 (69.6%) | 69 (30.4%) |
| Total (Overall) | 738 (54.2%) | 623 (45.8%) |
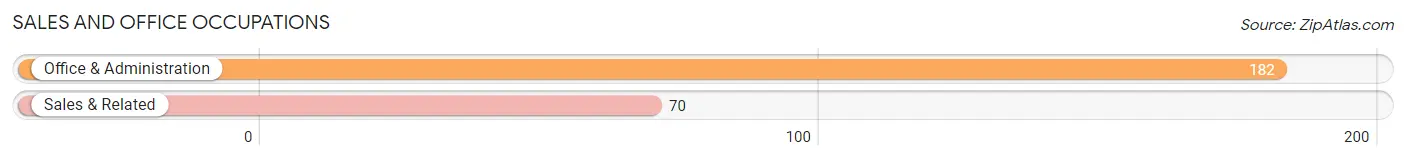
Sales and Office Occupations
The most common Sales and Office occupations in Marshfield Hills are Office & Administration (182 | 13.4%), and Sales & Related (70 | 5.1%).
Sales and Office Occupations by Sex
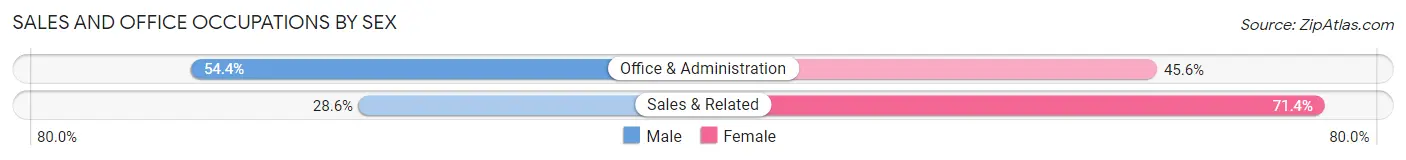
| Occupation | Male | Female |
| Sales & Related | 20 (28.6%) | 50 (71.4%) |
| Office & Administration | 99 (54.4%) | 83 (45.6%) |
| Total (Category) | 119 (47.2%) | 133 (52.8%) |
| Total (Overall) | 738 (54.2%) | 623 (45.8%) |
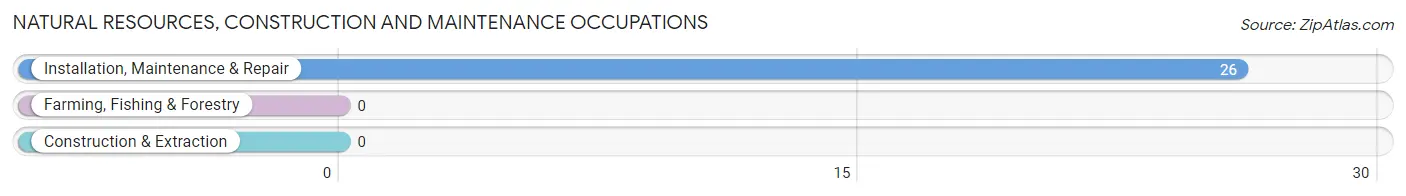
Natural Resources, Construction and Maintenance Occupations
The most common Natural Resources, Construction and Maintenance occupations in Marshfield Hills are , and Installation, Maintenance & Repair (26 | 1.9%).
Natural Resources, Construction and Maintenance Occupations by Sex
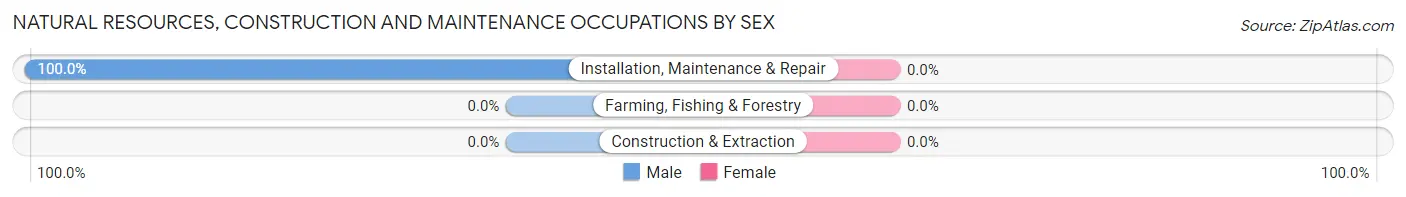
| Occupation | Male | Female |
| Farming, Fishing & Forestry | 0 (0.0%) | 0 (0.0%) |
| Construction & Extraction | 0 (0.0%) | 0 (0.0%) |
| Installation, Maintenance & Repair | 26 (100.0%) | 0 (0.0%) |
| Total (Category) | 26 (100.0%) | 0 (0.0%) |
| Total (Overall) | 738 (54.2%) | 623 (45.8%) |
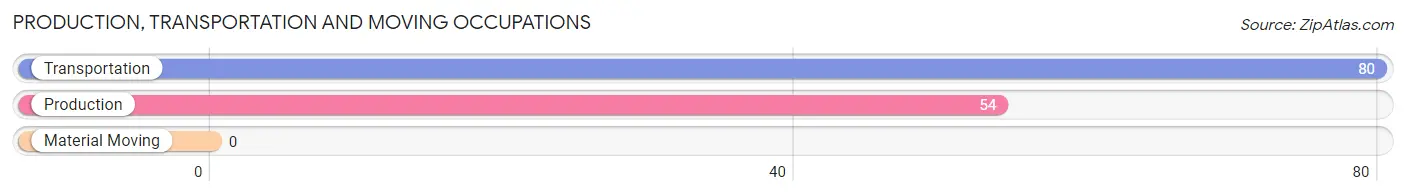
Production, Transportation and Moving Occupations
The most common Production, Transportation and Moving occupations in Marshfield Hills are Transportation (80 | 5.9%), and Production (54 | 4.0%).
Production, Transportation and Moving Occupations by Sex
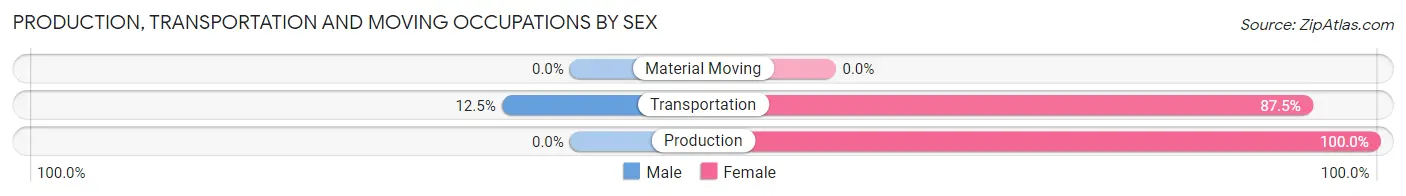
| Occupation | Male | Female |
| Production | 0 (0.0%) | 54 (100.0%) |
| Transportation | 10 (12.5%) | 70 (87.5%) |
| Material Moving | 0 (0.0%) | 0 (0.0%) |
| Total (Category) | 10 (7.5%) | 124 (92.5%) |
| Total (Overall) | 738 (54.2%) | 623 (45.8%) |
Employment Industries by Sex in Marshfield Hills
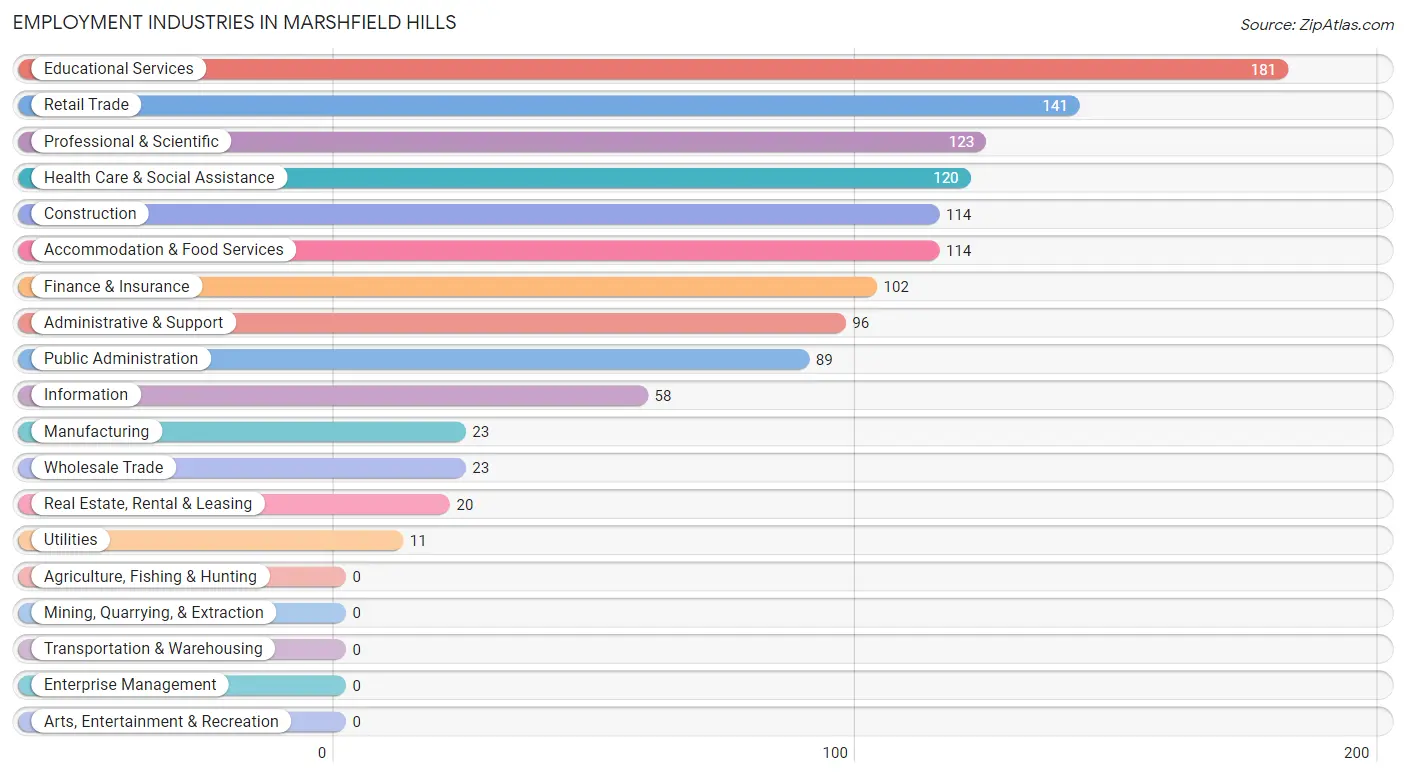
Employment Industries in Marshfield Hills
The major employment industries in Marshfield Hills include Educational Services (181 | 13.3%), Retail Trade (141 | 10.4%), Professional & Scientific (123 | 9.0%), Health Care & Social Assistance (120 | 8.8%), and Construction (114 | 8.4%).
Employment Industries by Sex in Marshfield Hills
The Marshfield Hills industries that see more men than women are Construction (100.0%), Wholesale Trade (100.0%), and Utilities (100.0%), whereas the industries that tend to have a higher number of women are Manufacturing (100.0%), Real Estate, Rental & Leasing (100.0%), and Educational Services (100.0%).
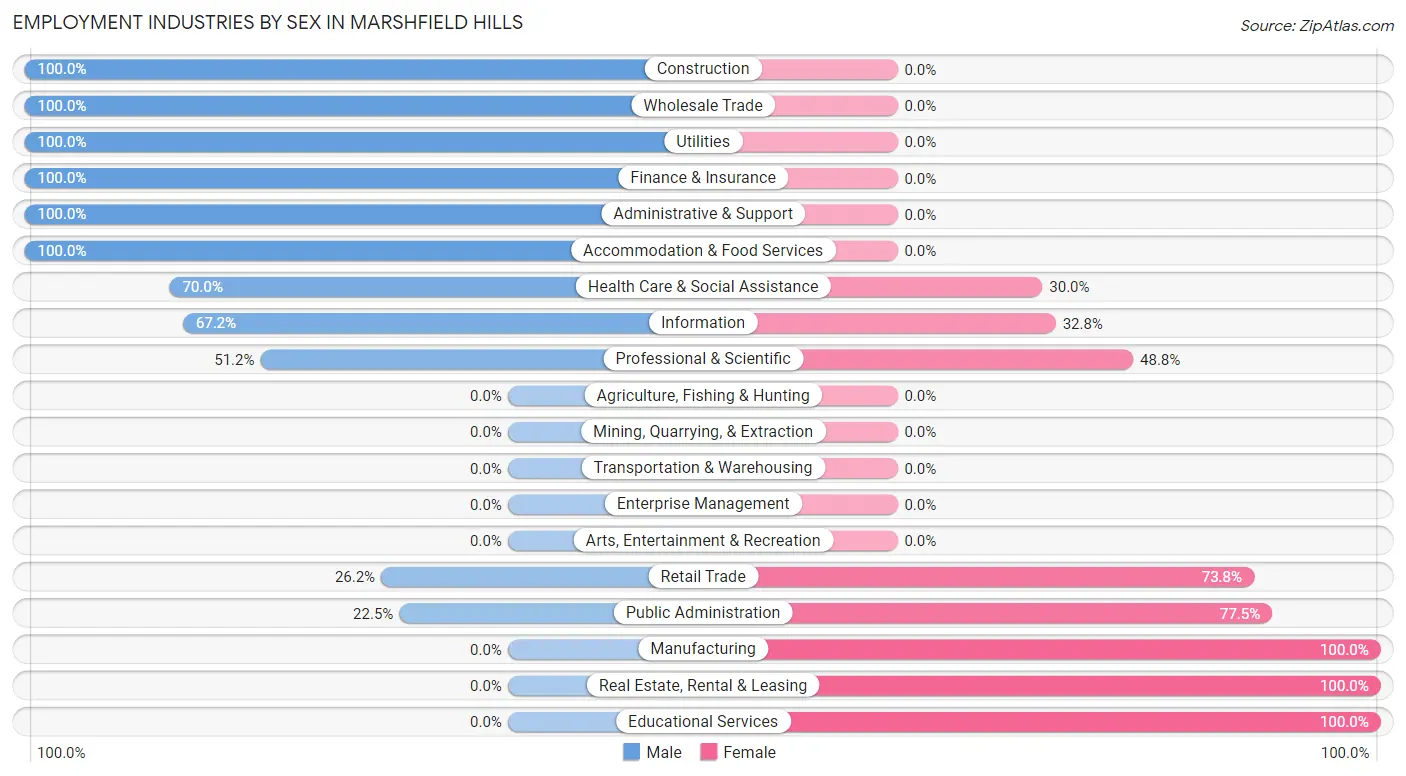
| Industry | Male | Female |
| Agriculture, Fishing & Hunting | 0 (0.0%) | 0 (0.0%) |
| Mining, Quarrying, & Extraction | 0 (0.0%) | 0 (0.0%) |
| Construction | 114 (100.0%) | 0 (0.0%) |
| Manufacturing | 0 (0.0%) | 23 (100.0%) |
| Wholesale Trade | 23 (100.0%) | 0 (0.0%) |
| Retail Trade | 37 (26.2%) | 104 (73.8%) |
| Transportation & Warehousing | 0 (0.0%) | 0 (0.0%) |
| Utilities | 11 (100.0%) | 0 (0.0%) |
| Information | 39 (67.2%) | 19 (32.8%) |
| Finance & Insurance | 102 (100.0%) | 0 (0.0%) |
| Real Estate, Rental & Leasing | 0 (0.0%) | 20 (100.0%) |
| Professional & Scientific | 63 (51.2%) | 60 (48.8%) |
| Enterprise Management | 0 (0.0%) | 0 (0.0%) |
| Administrative & Support | 96 (100.0%) | 0 (0.0%) |
| Educational Services | 0 (0.0%) | 181 (100.0%) |
| Health Care & Social Assistance | 84 (70.0%) | 36 (30.0%) |
| Arts, Entertainment & Recreation | 0 (0.0%) | 0 (0.0%) |
| Accommodation & Food Services | 114 (100.0%) | 0 (0.0%) |
| Public Administration | 20 (22.5%) | 69 (77.5%) |
| Total | 738 (54.2%) | 623 (45.8%) |
Education in Marshfield Hills
School Enrollment in Marshfield Hills
The most common levels of schooling among the 495 students in Marshfield Hills are high school (256 | 51.7%), elementary school (97 | 19.6%), and middle school (55 | 11.1%).
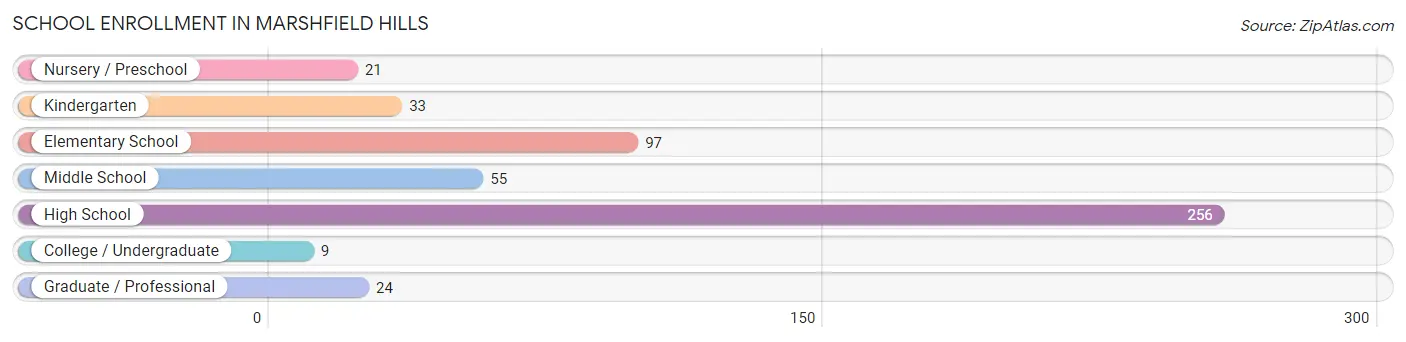
| School Level | # Students | % Students |
| Nursery / Preschool | 21 | 4.2% |
| Kindergarten | 33 | 6.7% |
| Elementary School | 97 | 19.6% |
| Middle School | 55 | 11.1% |
| High School | 256 | 51.7% |
| College / Undergraduate | 9 | 1.8% |
| Graduate / Professional | 24 | 4.9% |
| Total | 495 | 100.0% |
School Enrollment by Age by Funding Source in Marshfield Hills
Out of a total of 495 students who are enrolled in schools in Marshfield Hills, 180 (36.4%) attend a private institution, while the remaining 315 (63.6%) are enrolled in public schools. The age group of 3 to 4 year olds has the highest likelihood of being enrolled in private schools, with 21 (100.0% in the age bracket) enrolled. Conversely, the age group of 18 to 19 year olds has the lowest likelihood of being enrolled in a private school, with 9 (100.0% in the age bracket) attending a public institution.
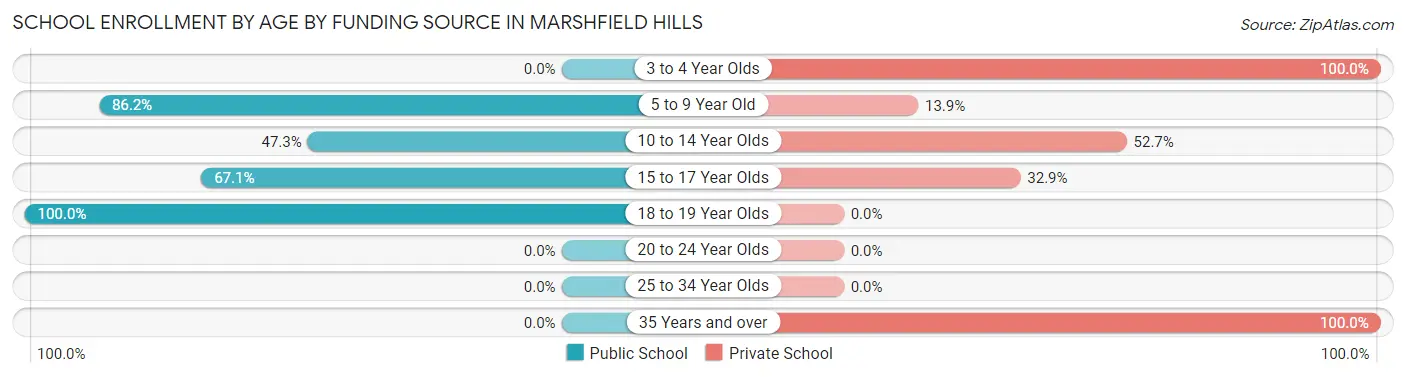
| Age Bracket | Public School | Private School |
| 3 to 4 Year Olds | 0 (0.0%) | 21 (100.0%) |
| 5 to 9 Year Old | 112 (86.2%) | 18 (13.9%) |
| 10 to 14 Year Olds | 35 (47.3%) | 39 (52.7%) |
| 15 to 17 Year Olds | 159 (67.1%) | 78 (32.9%) |
| 18 to 19 Year Olds | 9 (100.0%) | 0 (0.0%) |
| 20 to 24 Year Olds | 0 (0.0%) | 0 (0.0%) |
| 25 to 34 Year Olds | 0 (0.0%) | 0 (0.0%) |
| 35 Years and over | 0 (0.0%) | 24 (100.0%) |
| Total | 315 (63.6%) | 180 (36.4%) |
Educational Attainment by Field of Study in Marshfield Hills
Business (336 | 28.9%), engineering (162 | 13.9%), literature & languages (112 | 9.6%), visual & performing arts (110 | 9.5%), and psychology (93 | 8.0%) are the most common fields of study among 1,163 individuals in Marshfield Hills who have obtained a bachelor's degree or higher.
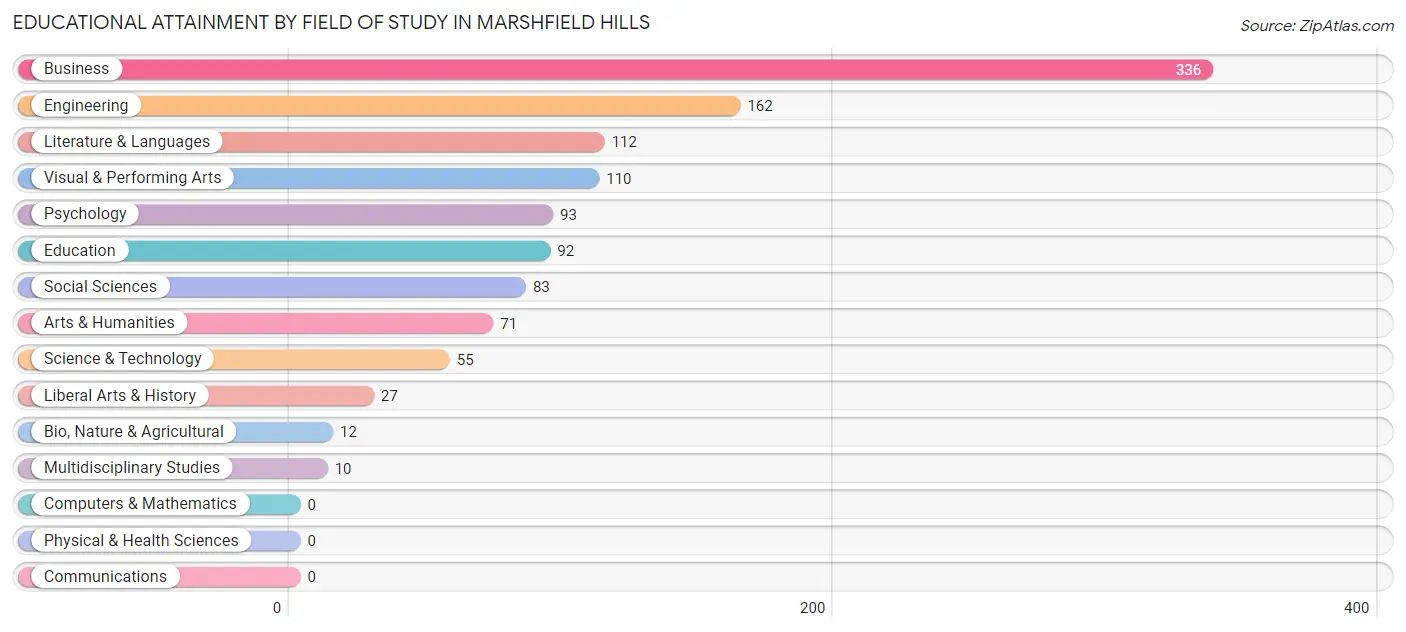
| Field of Study | # Graduates | % Graduates |
| Computers & Mathematics | 0 | 0.0% |
| Bio, Nature & Agricultural | 12 | 1.0% |
| Physical & Health Sciences | 0 | 0.0% |
| Psychology | 93 | 8.0% |
| Social Sciences | 83 | 7.1% |
| Engineering | 162 | 13.9% |
| Multidisciplinary Studies | 10 | 0.9% |
| Science & Technology | 55 | 4.7% |
| Business | 336 | 28.9% |
| Education | 92 | 7.9% |
| Literature & Languages | 112 | 9.6% |
| Liberal Arts & History | 27 | 2.3% |
| Visual & Performing Arts | 110 | 9.5% |
| Communications | 0 | 0.0% |
| Arts & Humanities | 71 | 6.1% |
| Total | 1,163 | 100.0% |
Transportation & Commute in Marshfield Hills
Vehicle Availability by Sex in Marshfield Hills
The most prevalent vehicle ownership categories in Marshfield Hills are males with 2 vehicles (391, accounting for 53.0%) and females with 2 vehicles (255, making up 62.8%).

| Vehicles Available | Male | Female |
| No Vehicle | 0 (0.0%) | 0 (0.0%) |
| 1 Vehicle | 50 (6.8%) | 63 (10.1%) |
| 2 Vehicles | 391 (53.0%) | 255 (40.9%) |
| 3 Vehicles | 206 (27.9%) | 240 (38.5%) |
| 4 Vehicles | 71 (9.6%) | 30 (4.8%) |
| 5 or more Vehicles | 20 (2.7%) | 35 (5.6%) |
| Total | 738 (100.0%) | 623 (100.0%) |
Commute Time in Marshfield Hills
The most frequently occuring commute durations in Marshfield Hills are 60 to 89 minutes (276 commuters, 23.3%), 90 or more minutes (191 commuters, 16.2%), and 35 to 39 minutes (129 commuters, 10.9%).
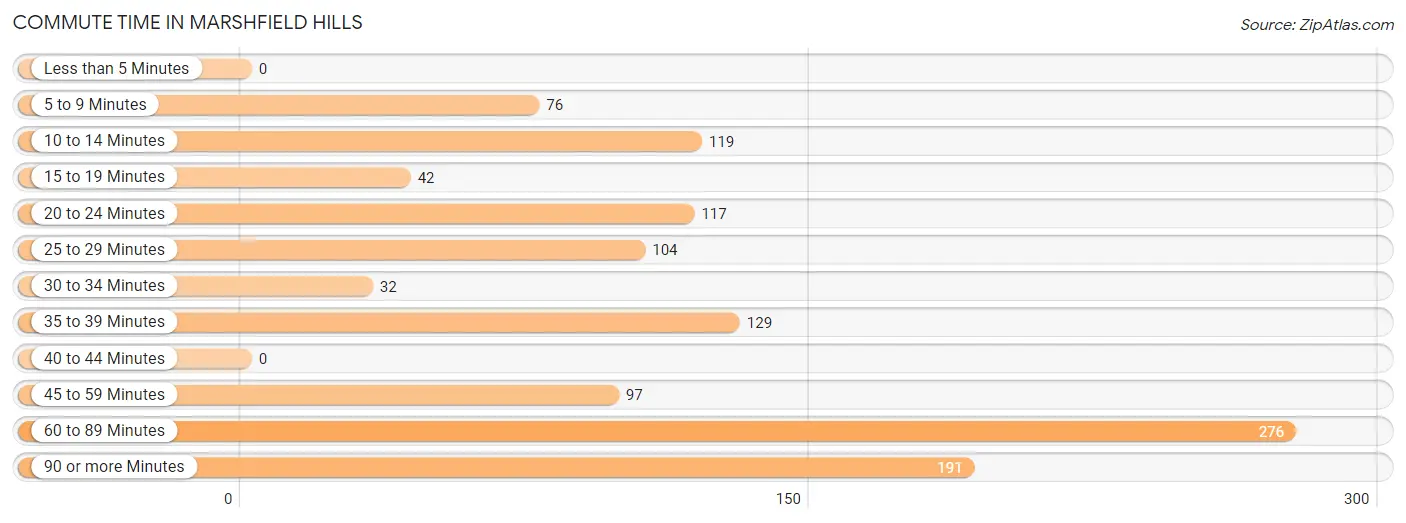
| Commute Time | # Commuters | % Commuters |
| Less than 5 Minutes | 0 | 0.0% |
| 5 to 9 Minutes | 76 | 6.4% |
| 10 to 14 Minutes | 119 | 10.1% |
| 15 to 19 Minutes | 42 | 3.5% |
| 20 to 24 Minutes | 117 | 9.9% |
| 25 to 29 Minutes | 104 | 8.8% |
| 30 to 34 Minutes | 32 | 2.7% |
| 35 to 39 Minutes | 129 | 10.9% |
| 40 to 44 Minutes | 0 | 0.0% |
| 45 to 59 Minutes | 97 | 8.2% |
| 60 to 89 Minutes | 276 | 23.3% |
| 90 or more Minutes | 191 | 16.2% |
Commute Time by Sex in Marshfield Hills
The most common commute times in Marshfield Hills are 60 to 89 minutes (228 commuters, 39.0%) for males and 90 or more minutes (191 commuters, 31.9%) for females.
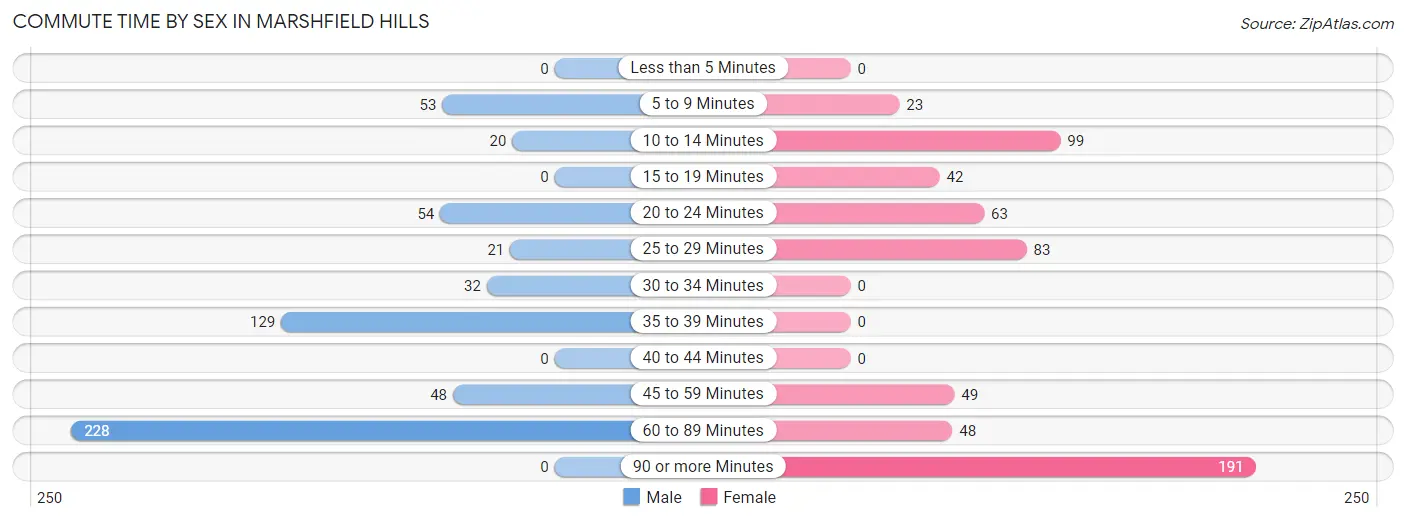
| Commute Time | Male | Female |
| Less than 5 Minutes | 0 (0.0%) | 0 (0.0%) |
| 5 to 9 Minutes | 53 (9.1%) | 23 (3.8%) |
| 10 to 14 Minutes | 20 (3.4%) | 99 (16.6%) |
| 15 to 19 Minutes | 0 (0.0%) | 42 (7.0%) |
| 20 to 24 Minutes | 54 (9.2%) | 63 (10.5%) |
| 25 to 29 Minutes | 21 (3.6%) | 83 (13.9%) |
| 30 to 34 Minutes | 32 (5.5%) | 0 (0.0%) |
| 35 to 39 Minutes | 129 (22.1%) | 0 (0.0%) |
| 40 to 44 Minutes | 0 (0.0%) | 0 (0.0%) |
| 45 to 59 Minutes | 48 (8.2%) | 49 (8.2%) |
| 60 to 89 Minutes | 228 (39.0%) | 48 (8.0%) |
| 90 or more Minutes | 0 (0.0%) | 191 (31.9%) |
Time of Departure to Work by Sex in Marshfield Hills
The most frequent times of departure to work in Marshfield Hills are 12:00 AM to 4:59 AM (150, 25.6%) for males and 6:00 AM to 6:29 AM (120, 20.1%) for females.
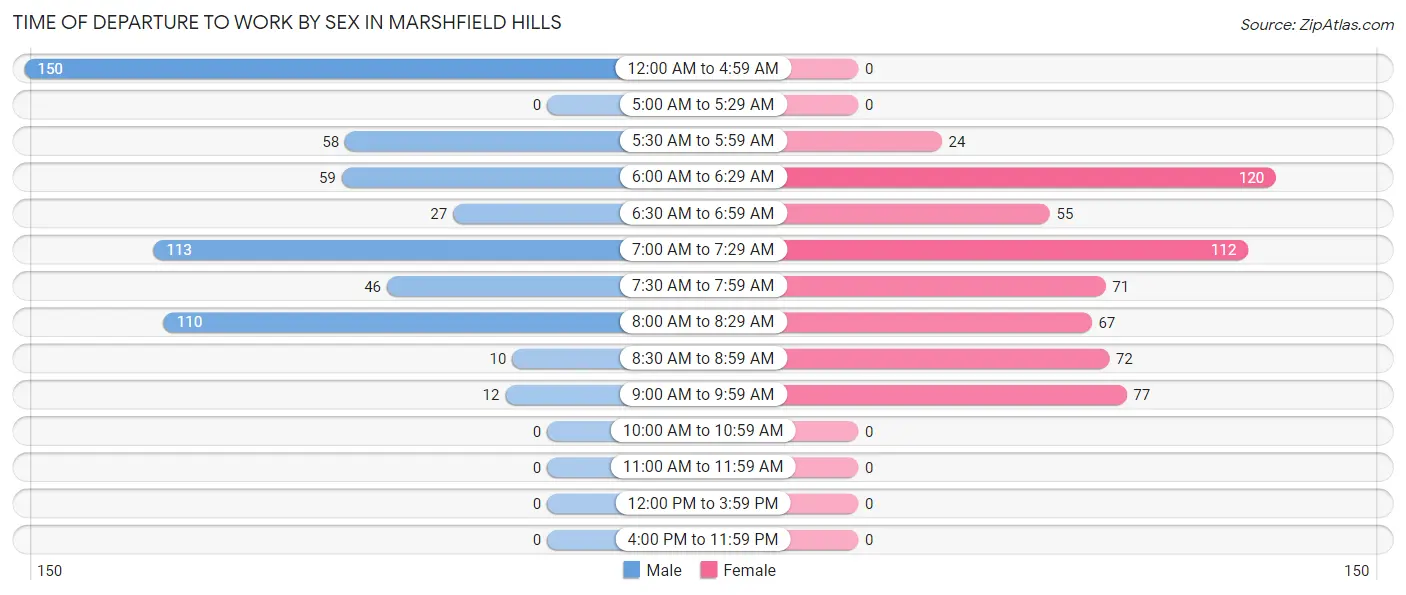
| Time of Departure | Male | Female |
| 12:00 AM to 4:59 AM | 150 (25.6%) | 0 (0.0%) |
| 5:00 AM to 5:29 AM | 0 (0.0%) | 0 (0.0%) |
| 5:30 AM to 5:59 AM | 58 (9.9%) | 24 (4.0%) |
| 6:00 AM to 6:29 AM | 59 (10.1%) | 120 (20.1%) |
| 6:30 AM to 6:59 AM | 27 (4.6%) | 55 (9.2%) |
| 7:00 AM to 7:29 AM | 113 (19.3%) | 112 (18.7%) |
| 7:30 AM to 7:59 AM | 46 (7.9%) | 71 (11.9%) |
| 8:00 AM to 8:29 AM | 110 (18.8%) | 67 (11.2%) |
| 8:30 AM to 8:59 AM | 10 (1.7%) | 72 (12.0%) |
| 9:00 AM to 9:59 AM | 12 (2.1%) | 77 (12.9%) |
| 10:00 AM to 10:59 AM | 0 (0.0%) | 0 (0.0%) |
| 11:00 AM to 11:59 AM | 0 (0.0%) | 0 (0.0%) |
| 12:00 PM to 3:59 PM | 0 (0.0%) | 0 (0.0%) |
| 4:00 PM to 11:59 PM | 0 (0.0%) | 0 (0.0%) |
| Total | 585 (100.0%) | 598 (100.0%) |
Housing Occupancy in Marshfield Hills
Occupancy by Ownership in Marshfield Hills
Of the total 937 dwellings in Marshfield Hills, owner-occupied units account for 937 (100.0%), while renter-occupied units make up 0 (0.0%).
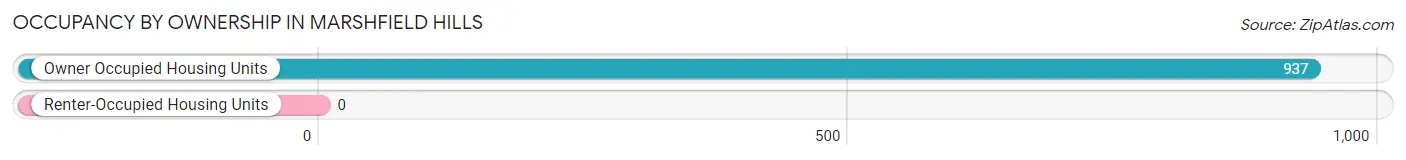
| Occupancy | # Housing Units | % Housing Units |
| Owner Occupied Housing Units | 937 | 100.0% |
| Renter-Occupied Housing Units | 0 | 0.0% |
| Total Occupied Housing Units | 937 | 100.0% |
Occupancy by Household Size in Marshfield Hills
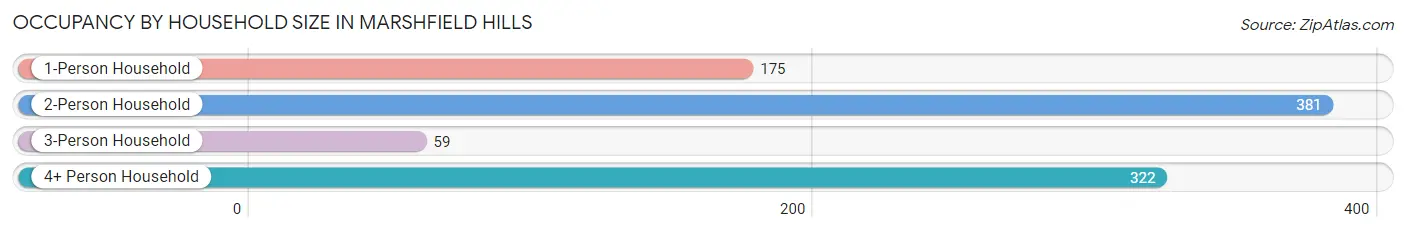
| Household Size | # Housing Units | % Housing Units |
| 1-Person Household | 175 | 18.7% |
| 2-Person Household | 381 | 40.7% |
| 3-Person Household | 59 | 6.3% |
| 4+ Person Household | 322 | 34.4% |
| Total Housing Units | 937 | 100.0% |
Occupancy by Ownership by Household Size in Marshfield Hills
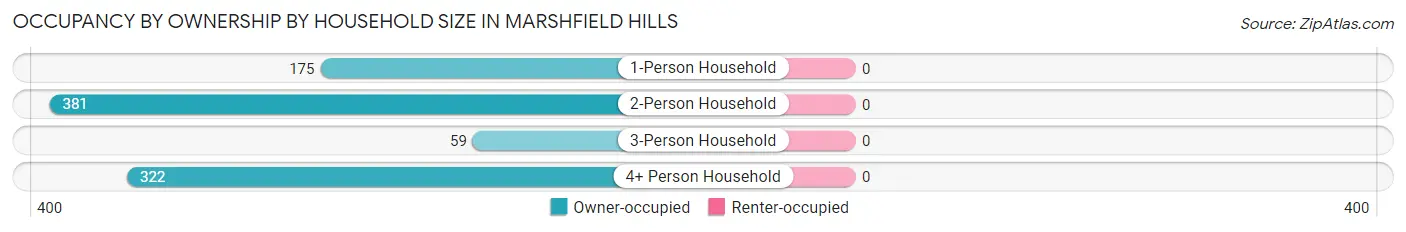
| Household Size | Owner-occupied | Renter-occupied |
| 1-Person Household | 175 (100.0%) | 0 (0.0%) |
| 2-Person Household | 381 (100.0%) | 0 (0.0%) |
| 3-Person Household | 59 (100.0%) | 0 (0.0%) |
| 4+ Person Household | 322 (100.0%) | 0 (0.0%) |
| Total Housing Units | 937 (100.0%) | 0 (0.0%) |
Occupancy by Educational Attainment in Marshfield Hills
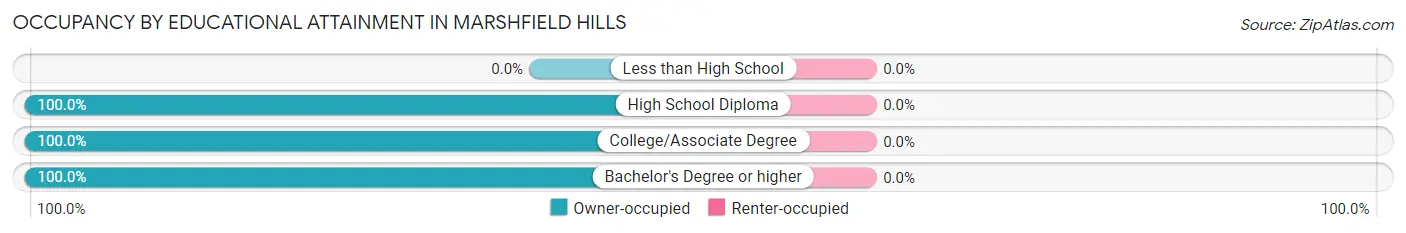
| Household Size | Owner-occupied | Renter-occupied |
| Less than High School | 0 (0.0%) | 0 (0.0%) |
| High School Diploma | 133 (100.0%) | 0 (0.0%) |
| College/Associate Degree | 319 (100.0%) | 0 (0.0%) |
| Bachelor's Degree or higher | 485 (100.0%) | 0 (0.0%) |
Occupancy by Age of Householder in Marshfield Hills
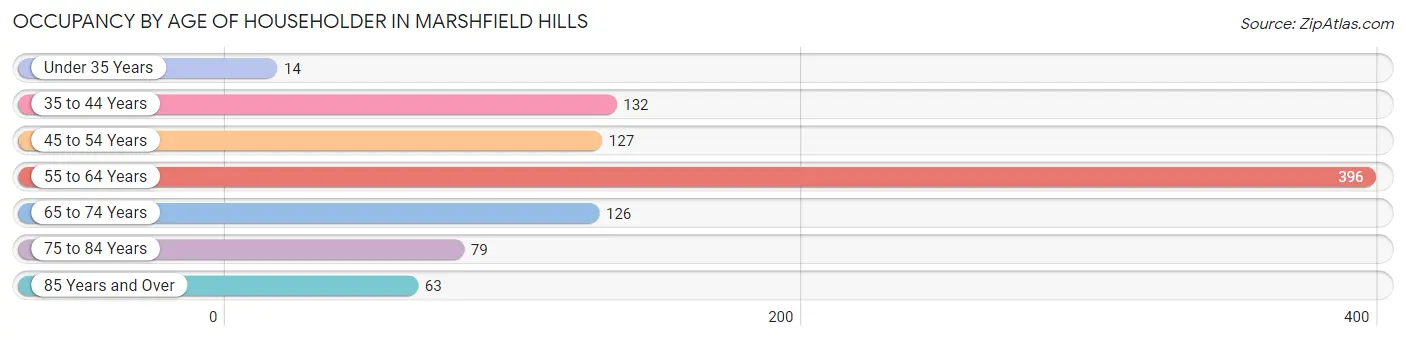
| Age Bracket | # Households | % Households |
| Under 35 Years | 14 | 1.5% |
| 35 to 44 Years | 132 | 14.1% |
| 45 to 54 Years | 127 | 13.6% |
| 55 to 64 Years | 396 | 42.3% |
| 65 to 74 Years | 126 | 13.5% |
| 75 to 84 Years | 79 | 8.4% |
| 85 Years and Over | 63 | 6.7% |
| Total | 937 | 100.0% |
Housing Finances in Marshfield Hills
Median Income by Occupancy in Marshfield Hills
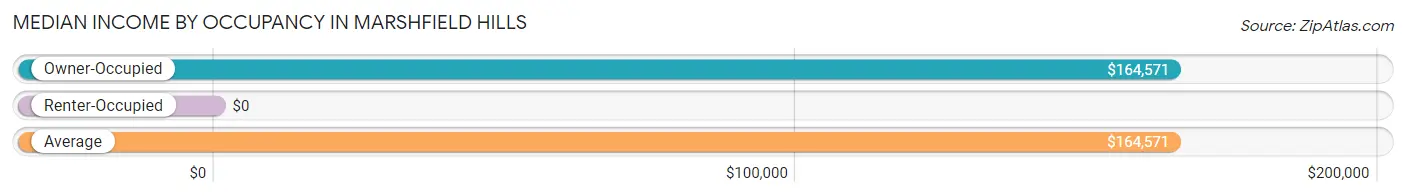
| Occupancy Type | # Households | Median Income |
| Owner-Occupied | 937 (100.0%) | $164,571 |
| Renter-Occupied | 0 (0.0%) | $0 |
| Average | 937 (100.0%) | $164,571 |
Occupancy by Householder Income Bracket in Marshfield Hills
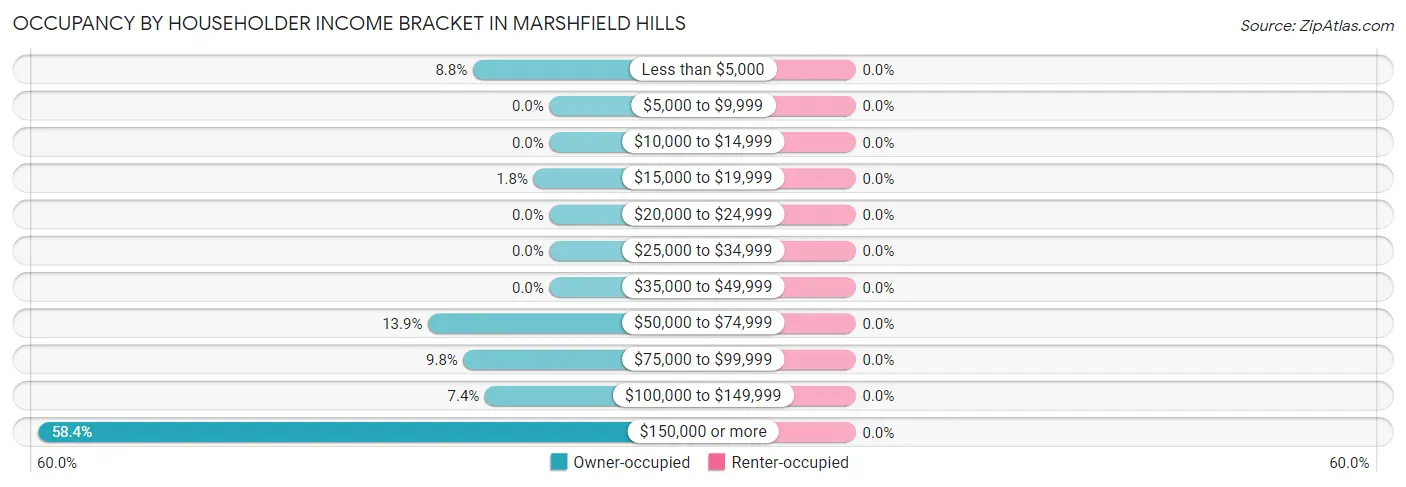
| Income Bracket | Owner-occupied | Renter-occupied |
| Less than $5,000 | 82 (8.7%) | 0 (0.0%) |
| $5,000 to $9,999 | 0 (0.0%) | 0 (0.0%) |
| $10,000 to $14,999 | 0 (0.0%) | 0 (0.0%) |
| $15,000 to $19,999 | 17 (1.8%) | 0 (0.0%) |
| $20,000 to $24,999 | 0 (0.0%) | 0 (0.0%) |
| $25,000 to $34,999 | 0 (0.0%) | 0 (0.0%) |
| $35,000 to $49,999 | 0 (0.0%) | 0 (0.0%) |
| $50,000 to $74,999 | 130 (13.9%) | 0 (0.0%) |
| $75,000 to $99,999 | 92 (9.8%) | 0 (0.0%) |
| $100,000 to $149,999 | 69 (7.4%) | 0 (0.0%) |
| $150,000 or more | 547 (58.4%) | 0 (0.0%) |
| Total | 937 (100.0%) | 0 (0.0%) |
Monthly Housing Cost Tiers in Marshfield Hills
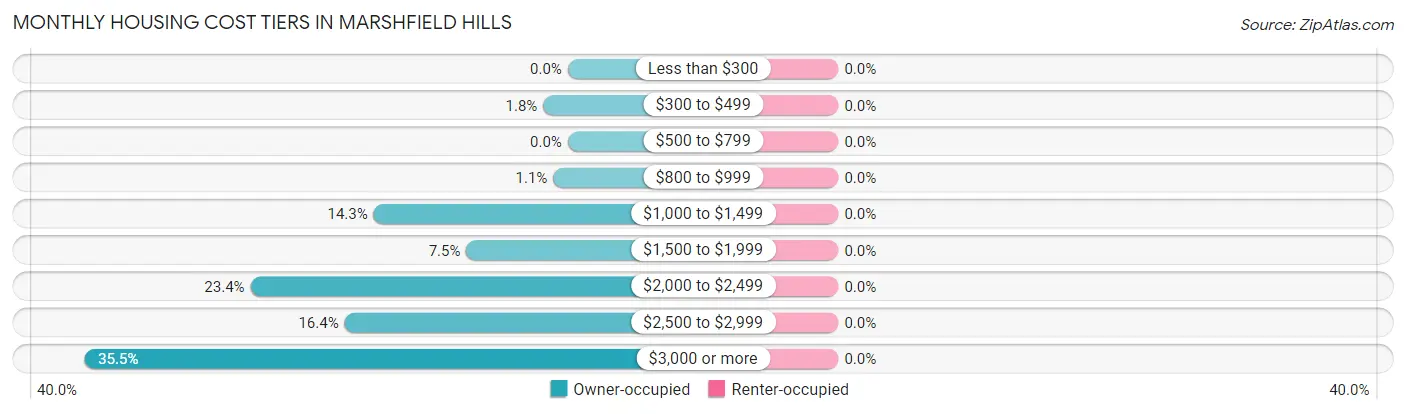
| Monthly Cost | Owner-occupied | Renter-occupied |
| Less than $300 | 0 (0.0%) | 0 (0.0%) |
| $300 to $499 | 17 (1.8%) | 0 (0.0%) |
| $500 to $799 | 0 (0.0%) | 0 (0.0%) |
| $800 to $999 | 10 (1.1%) | 0 (0.0%) |
| $1,000 to $1,499 | 134 (14.3%) | 0 (0.0%) |
| $1,500 to $1,999 | 70 (7.5%) | 0 (0.0%) |
| $2,000 to $2,499 | 219 (23.4%) | 0 (0.0%) |
| $2,500 to $2,999 | 154 (16.4%) | 0 (0.0%) |
| $3,000 or more | 333 (35.5%) | 0 (0.0%) |
| Total | 937 (100.0%) | 0 (0.0%) |
Physical Housing Characteristics in Marshfield Hills
Housing Structures in Marshfield Hills
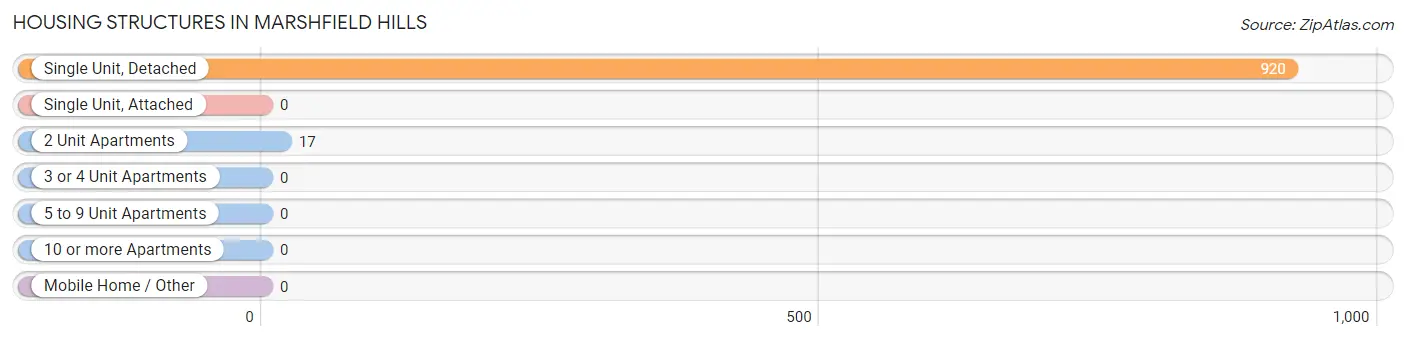
| Structure Type | # Housing Units | % Housing Units |
| Single Unit, Detached | 920 | 98.2% |
| Single Unit, Attached | 0 | 0.0% |
| 2 Unit Apartments | 17 | 1.8% |
| 3 or 4 Unit Apartments | 0 | 0.0% |
| 5 to 9 Unit Apartments | 0 | 0.0% |
| 10 or more Apartments | 0 | 0.0% |
| Mobile Home / Other | 0 | 0.0% |
| Total | 937 | 100.0% |
Housing Structures by Occupancy in Marshfield Hills
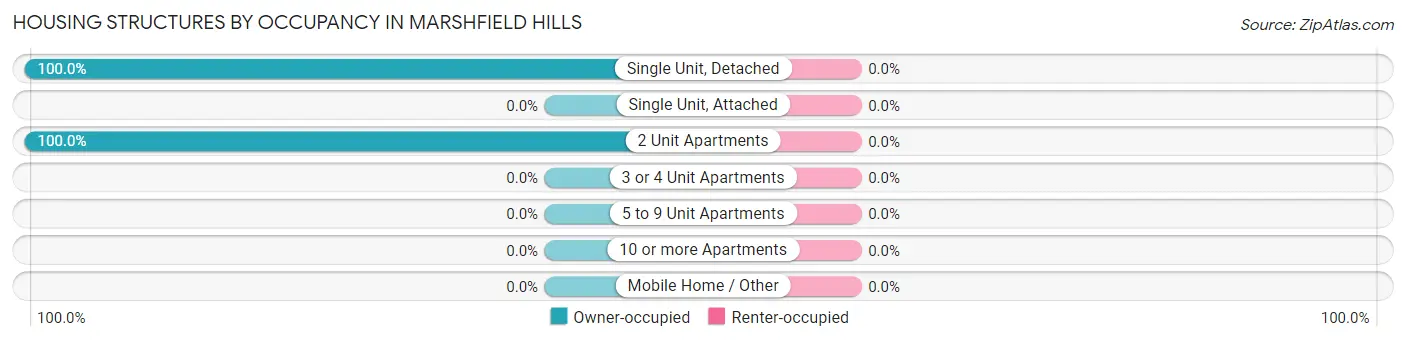
| Structure Type | Owner-occupied | Renter-occupied |
| Single Unit, Detached | 920 (100.0%) | 0 (0.0%) |
| Single Unit, Attached | 0 (0.0%) | 0 (0.0%) |
| 2 Unit Apartments | 17 (100.0%) | 0 (0.0%) |
| 3 or 4 Unit Apartments | 0 (0.0%) | 0 (0.0%) |
| 5 to 9 Unit Apartments | 0 (0.0%) | 0 (0.0%) |
| 10 or more Apartments | 0 (0.0%) | 0 (0.0%) |
| Mobile Home / Other | 0 (0.0%) | 0 (0.0%) |
| Total | 937 (100.0%) | 0 (0.0%) |
Housing Structures by Number of Rooms in Marshfield Hills
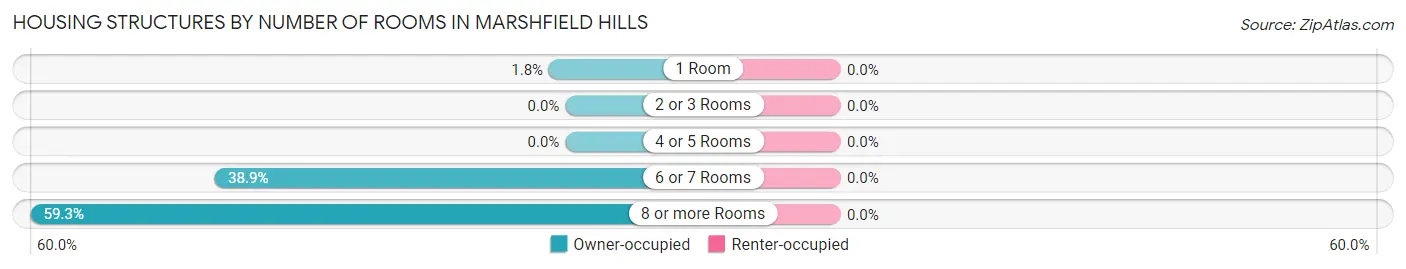
| Number of Rooms | Owner-occupied | Renter-occupied |
| 1 Room | 17 (1.8%) | 0 (0.0%) |
| 2 or 3 Rooms | 0 (0.0%) | 0 (0.0%) |
| 4 or 5 Rooms | 0 (0.0%) | 0 (0.0%) |
| 6 or 7 Rooms | 364 (38.9%) | 0 (0.0%) |
| 8 or more Rooms | 556 (59.3%) | 0 (0.0%) |
| Total | 937 (100.0%) | 0 (0.0%) |
Housing Structure by Heating Type in Marshfield Hills
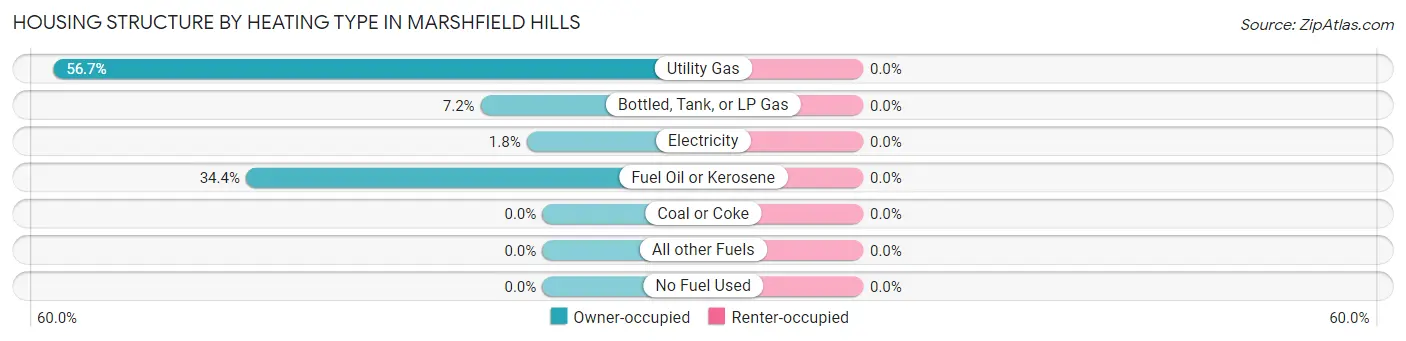
| Heating Type | Owner-occupied | Renter-occupied |
| Utility Gas | 531 (56.7%) | 0 (0.0%) |
| Bottled, Tank, or LP Gas | 67 (7.1%) | 0 (0.0%) |
| Electricity | 17 (1.8%) | 0 (0.0%) |
| Fuel Oil or Kerosene | 322 (34.4%) | 0 (0.0%) |
| Coal or Coke | 0 (0.0%) | 0 (0.0%) |
| All other Fuels | 0 (0.0%) | 0 (0.0%) |
| No Fuel Used | 0 (0.0%) | 0 (0.0%) |
| Total | 937 (100.0%) | 0 (0.0%) |
Household Vehicle Usage in Marshfield Hills
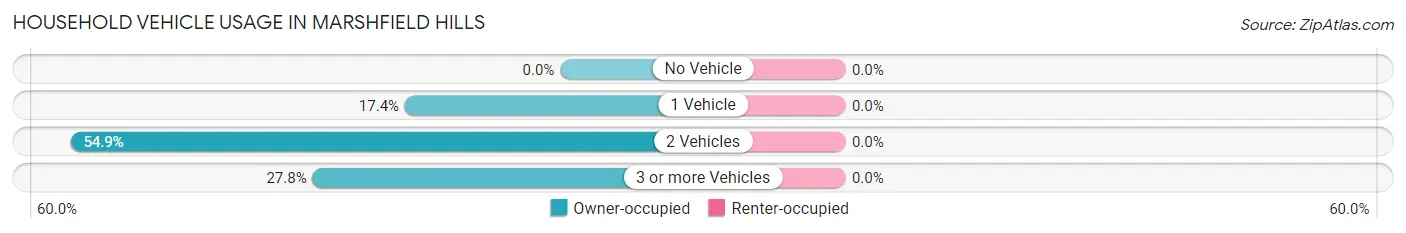
| Vehicles per Household | Owner-occupied | Renter-occupied |
| No Vehicle | 0 (0.0%) | 0 (0.0%) |
| 1 Vehicle | 163 (17.4%) | 0 (0.0%) |
| 2 Vehicles | 514 (54.9%) | 0 (0.0%) |
| 3 or more Vehicles | 260 (27.8%) | 0 (0.0%) |
| Total | 937 (100.0%) | 0 (0.0%) |
Real Estate & Mortgages in Marshfield Hills
Real Estate and Mortgage Overview in Marshfield Hills
| Characteristic | Without Mortgage | With Mortgage |
| Housing Units | 296 | 641 |
| Median Property Value | $839,700 | $674,600 |
| Median Household Income | - | - |
| Monthly Housing Costs | $1,501 | $333 |
| Real Estate Taxes | $8,384 | $0 |
Property Value by Mortgage Status in Marshfield Hills
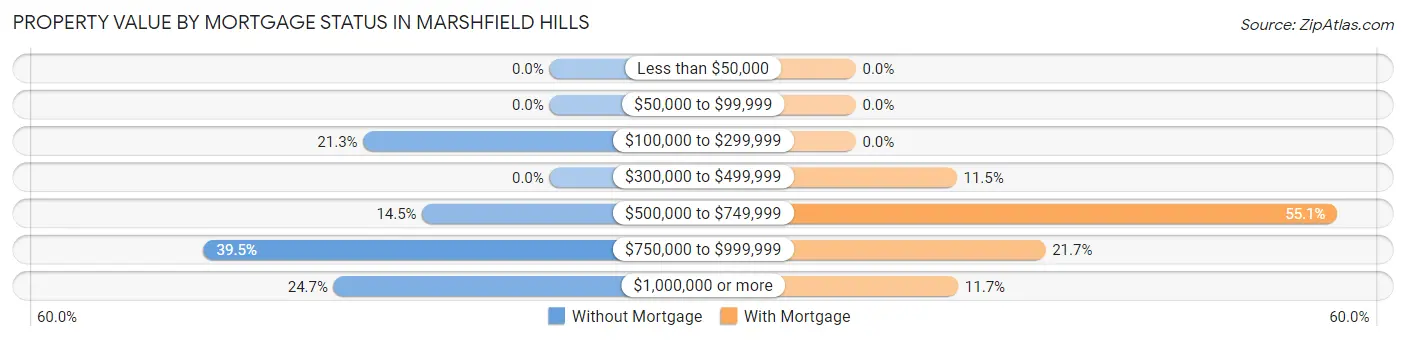
| Property Value | Without Mortgage | With Mortgage |
| Less than $50,000 | 0 (0.0%) | 0 (0.0%) |
| $50,000 to $99,999 | 0 (0.0%) | 0 (0.0%) |
| $100,000 to $299,999 | 63 (21.3%) | 0 (0.0%) |
| $300,000 to $499,999 | 0 (0.0%) | 74 (11.5%) |
| $500,000 to $749,999 | 43 (14.5%) | 353 (55.1%) |
| $750,000 to $999,999 | 117 (39.5%) | 139 (21.7%) |
| $1,000,000 or more | 73 (24.7%) | 75 (11.7%) |
| Total | 296 (100.0%) | 641 (100.0%) |
Household Income by Mortgage Status in Marshfield Hills
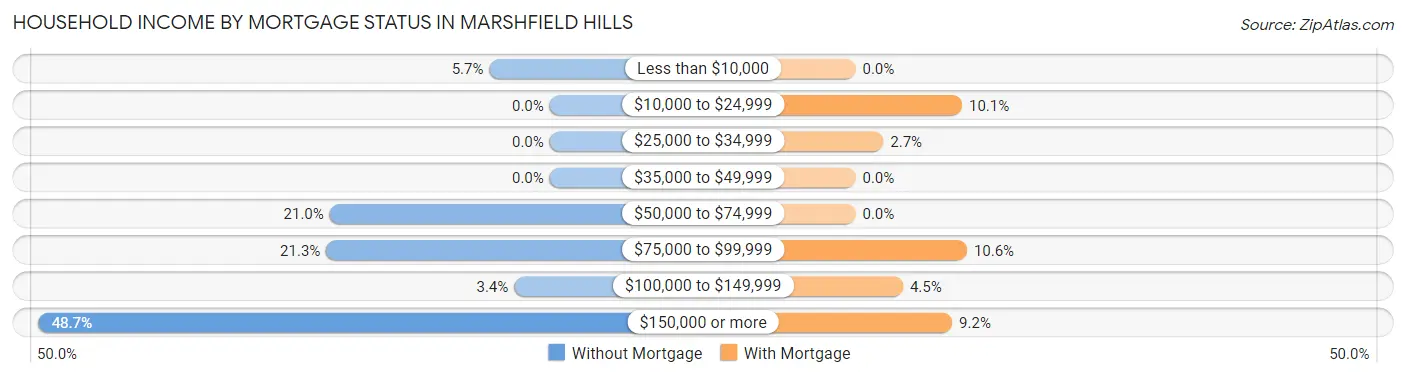
| Household Income | Without Mortgage | With Mortgage |
| Less than $10,000 | 17 (5.7%) | 0 (0.0%) |
| $10,000 to $24,999 | 0 (0.0%) | 65 (10.1%) |
| $25,000 to $34,999 | 0 (0.0%) | 17 (2.6%) |
| $35,000 to $49,999 | 0 (0.0%) | 0 (0.0%) |
| $50,000 to $74,999 | 62 (20.9%) | 0 (0.0%) |
| $75,000 to $99,999 | 63 (21.3%) | 68 (10.6%) |
| $100,000 to $149,999 | 10 (3.4%) | 29 (4.5%) |
| $150,000 or more | 144 (48.6%) | 59 (9.2%) |
| Total | 296 (100.0%) | 641 (100.0%) |
Property Value to Household Income Ratio in Marshfield Hills
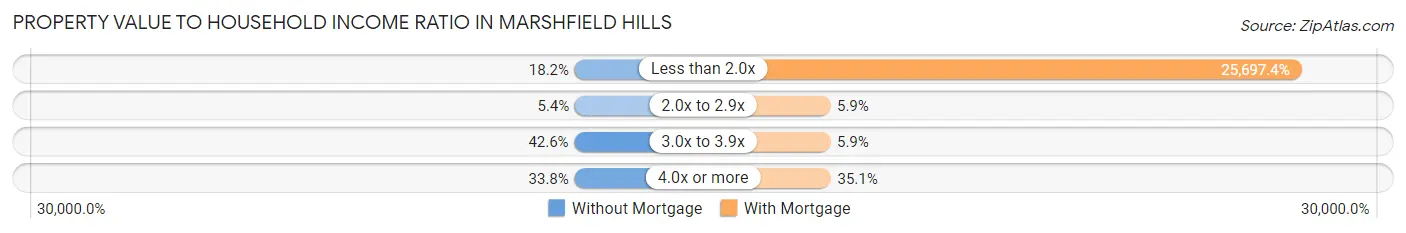
| Value-to-Income Ratio | Without Mortgage | With Mortgage |
| Less than 2.0x | 54 (18.2%) | 164,720 (25,697.4%) |
| 2.0x to 2.9x | 16 (5.4%) | 38 (5.9%) |
| 3.0x to 3.9x | 126 (42.6%) | 38 (5.9%) |
| 4.0x or more | 100 (33.8%) | 225 (35.1%) |
| Total | 296 (100.0%) | 641 (100.0%) |
Real Estate Taxes by Mortgage Status in Marshfield Hills
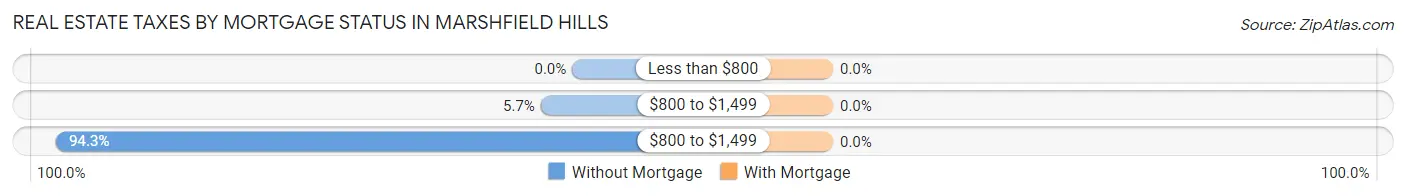
| Property Taxes | Without Mortgage | With Mortgage |
| Less than $800 | 0 (0.0%) | 0 (0.0%) |
| $800 to $1,499 | 17 (5.7%) | 0 (0.0%) |
| $800 to $1,499 | 279 (94.3%) | 0 (0.0%) |
| Total | 296 (100.0%) | 641 (100.0%) |
Health & Disability in Marshfield Hills
Health Insurance Coverage by Age in Marshfield Hills
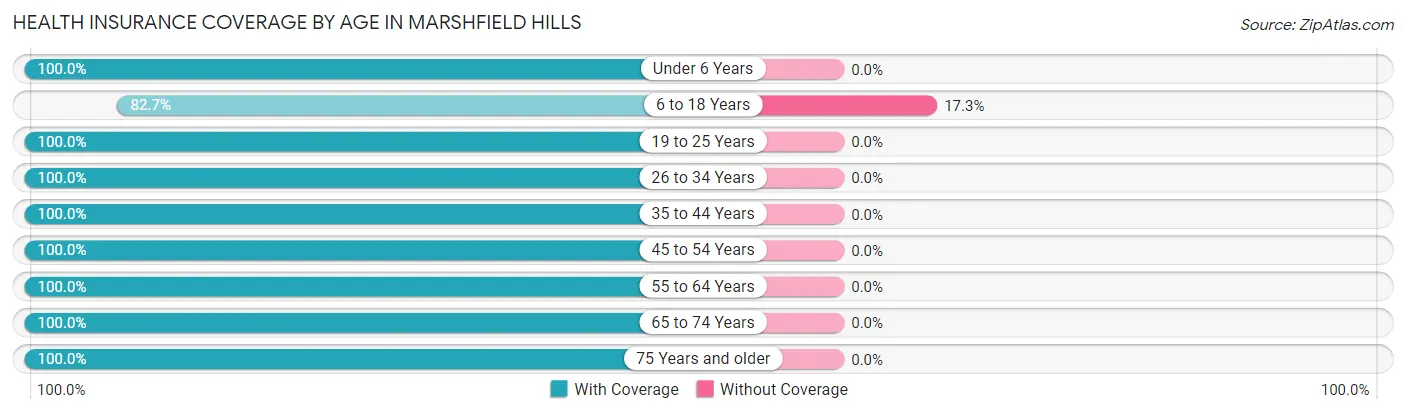
| Age Bracket | With Coverage | Without Coverage |
| Under 6 Years | 124 (100.0%) | 0 (0.0%) |
| 6 to 18 Years | 372 (82.7%) | 78 (17.3%) |
| 19 to 25 Years | 38 (100.0%) | 0 (0.0%) |
| 26 to 34 Years | 184 (100.0%) | 0 (0.0%) |
| 35 to 44 Years | 378 (100.0%) | 0 (0.0%) |
| 45 to 54 Years | 218 (100.0%) | 0 (0.0%) |
| 55 to 64 Years | 707 (100.0%) | 0 (0.0%) |
| 65 to 74 Years | 145 (100.0%) | 0 (0.0%) |
| 75 Years and older | 214 (100.0%) | 0 (0.0%) |
| Total | 2,380 (96.8%) | 78 (3.2%) |
Health Insurance Coverage by Citizenship Status in Marshfield Hills
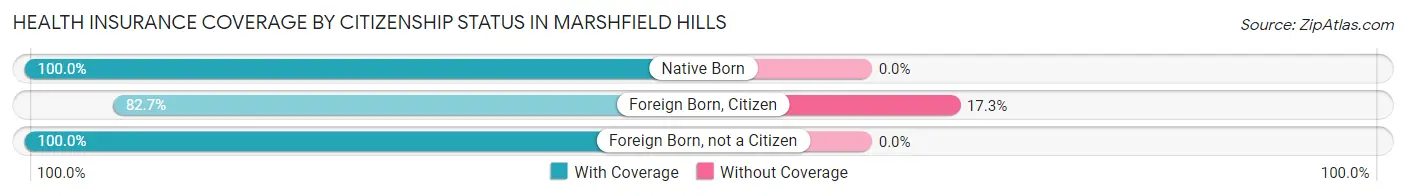
| Citizenship Status | With Coverage | Without Coverage |
| Native Born | 124 (100.0%) | 0 (0.0%) |
| Foreign Born, Citizen | 372 (82.7%) | 78 (17.3%) |
| Foreign Born, not a Citizen | 38 (100.0%) | 0 (0.0%) |
Health Insurance Coverage by Household Income in Marshfield Hills
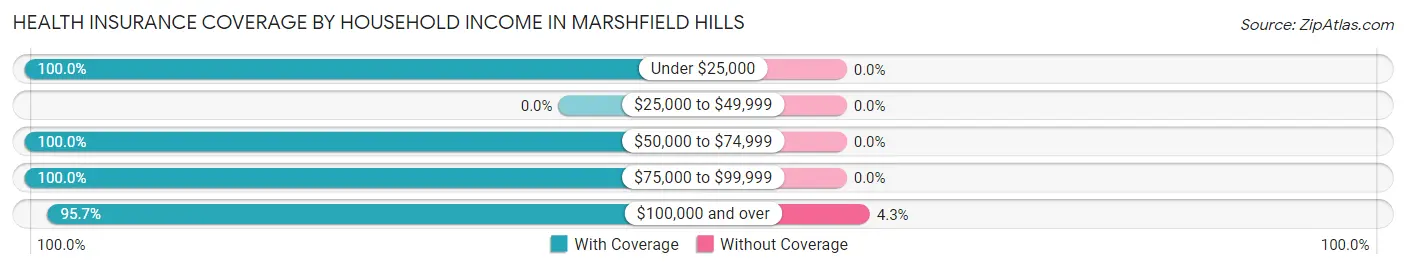
| Household Income | With Coverage | Without Coverage |
| Under $25,000 | 290 (100.0%) | 0 (0.0%) |
| $25,000 to $49,999 | 0 (0.0%) | 0 (0.0%) |
| $50,000 to $74,999 | 271 (100.0%) | 0 (0.0%) |
| $75,000 to $99,999 | 92 (100.0%) | 0 (0.0%) |
| $100,000 and over | 1,727 (95.7%) | 78 (4.3%) |
Public vs Private Health Insurance Coverage by Age in Marshfield Hills
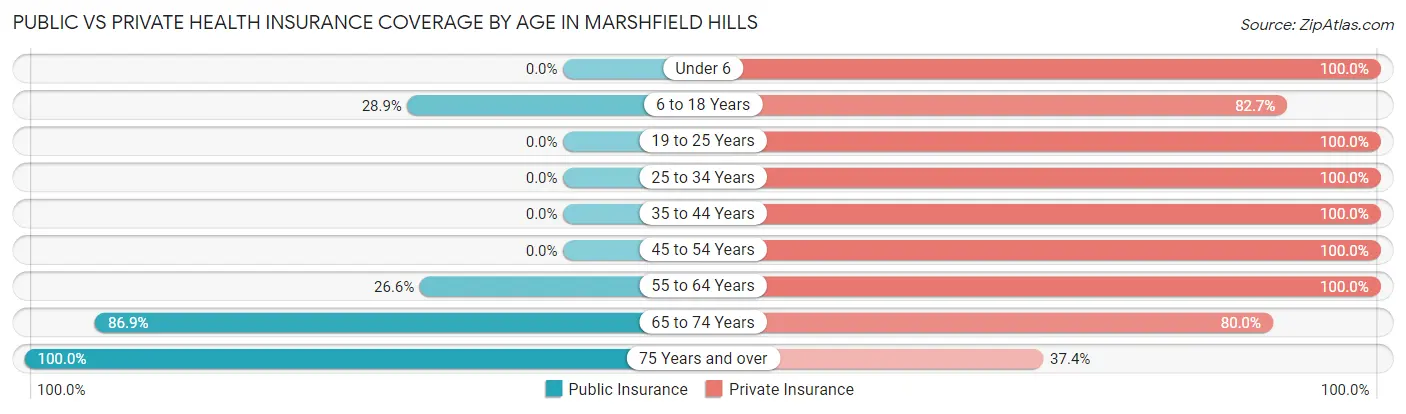
| Age Bracket | Public Insurance | Private Insurance |
| Under 6 | 0 (0.0%) | 124 (100.0%) |
| 6 to 18 Years | 130 (28.9%) | 372 (82.7%) |
| 19 to 25 Years | 0 (0.0%) | 38 (100.0%) |
| 25 to 34 Years | 0 (0.0%) | 184 (100.0%) |
| 35 to 44 Years | 0 (0.0%) | 378 (100.0%) |
| 45 to 54 Years | 0 (0.0%) | 218 (100.0%) |
| 55 to 64 Years | 188 (26.6%) | 707 (100.0%) |
| 65 to 74 Years | 126 (86.9%) | 116 (80.0%) |
| 75 Years and over | 214 (100.0%) | 80 (37.4%) |
| Total | 658 (26.8%) | 2,217 (90.2%) |
Disability Status by Sex by Age in Marshfield Hills
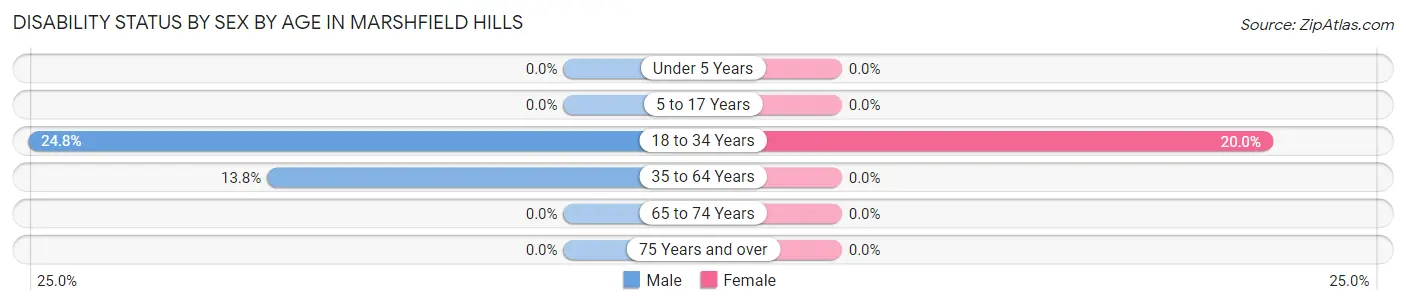
| Age Bracket | Male | Female |
| Under 5 Years | 0 (0.0%) | 0 (0.0%) |
| 5 to 17 Years | 0 (0.0%) | 0 (0.0%) |
| 18 to 34 Years | 40 (24.8%) | 14 (20.0%) |
| 35 to 64 Years | 92 (13.8%) | 0 (0.0%) |
| 65 to 74 Years | 0 (0.0%) | 0 (0.0%) |
| 75 Years and over | 0 (0.0%) | 0 (0.0%) |
Disability Class by Sex by Age in Marshfield Hills
Disability Class: Hearing Difficulty
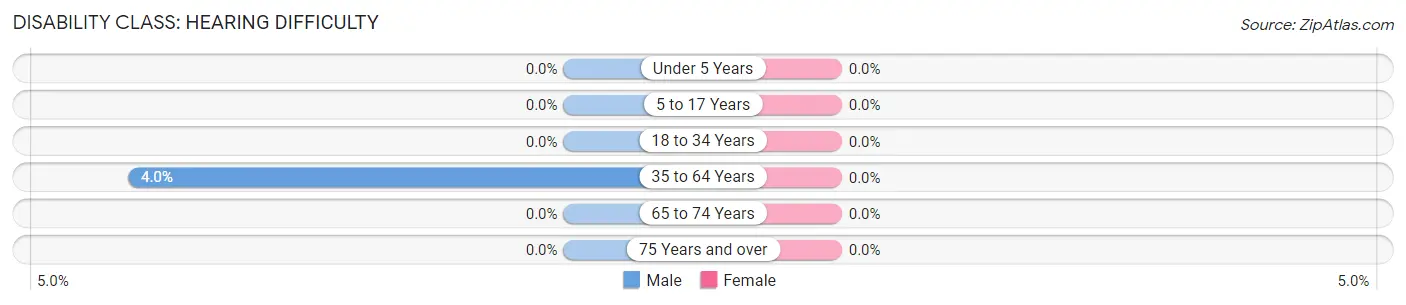
| Age Bracket | Male | Female |
| Under 5 Years | 0 (0.0%) | 0 (0.0%) |
| 5 to 17 Years | 0 (0.0%) | 0 (0.0%) |
| 18 to 34 Years | 0 (0.0%) | 0 (0.0%) |
| 35 to 64 Years | 27 (4.0%) | 0 (0.0%) |
| 65 to 74 Years | 0 (0.0%) | 0 (0.0%) |
| 75 Years and over | 0 (0.0%) | 0 (0.0%) |
Disability Class: Vision Difficulty
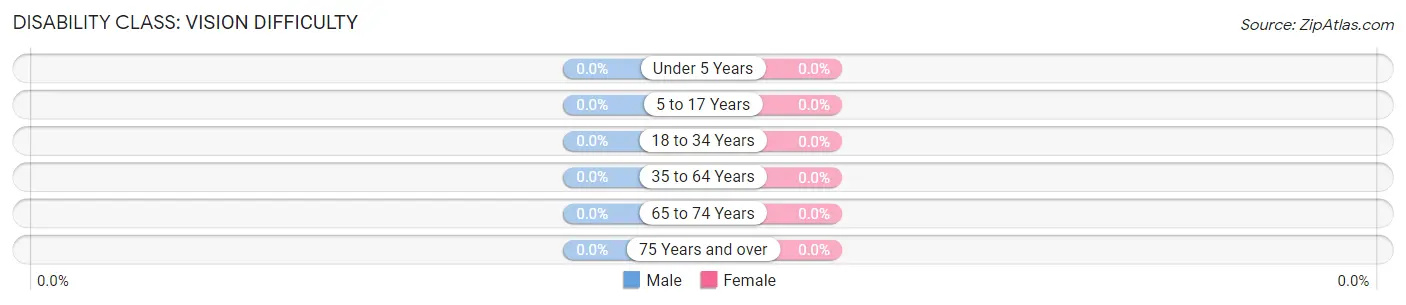
| Age Bracket | Male | Female |
| Under 5 Years | 0 (0.0%) | 0 (0.0%) |
| 5 to 17 Years | 0 (0.0%) | 0 (0.0%) |
| 18 to 34 Years | 0 (0.0%) | 0 (0.0%) |
| 35 to 64 Years | 0 (0.0%) | 0 (0.0%) |
| 65 to 74 Years | 0 (0.0%) | 0 (0.0%) |
| 75 Years and over | 0 (0.0%) | 0 (0.0%) |
Disability Class: Cognitive Difficulty
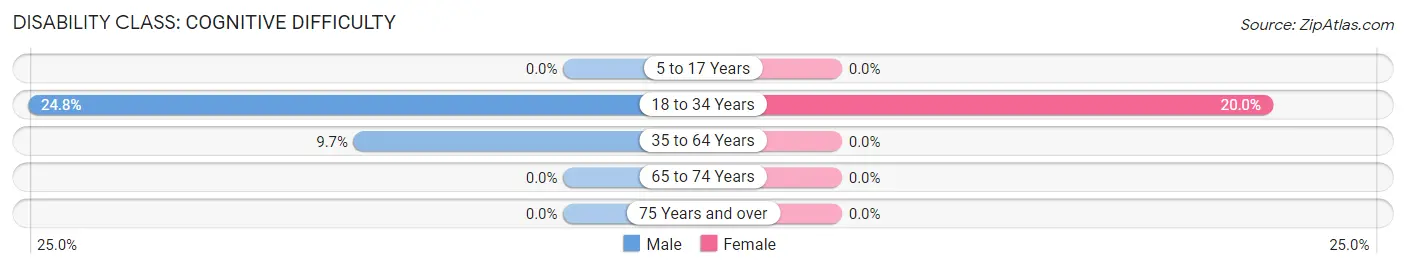
| Age Bracket | Male | Female |
| 5 to 17 Years | 0 (0.0%) | 0 (0.0%) |
| 18 to 34 Years | 40 (24.8%) | 14 (20.0%) |
| 35 to 64 Years | 65 (9.7%) | 0 (0.0%) |
| 65 to 74 Years | 0 (0.0%) | 0 (0.0%) |
| 75 Years and over | 0 (0.0%) | 0 (0.0%) |
Disability Class: Ambulatory Difficulty
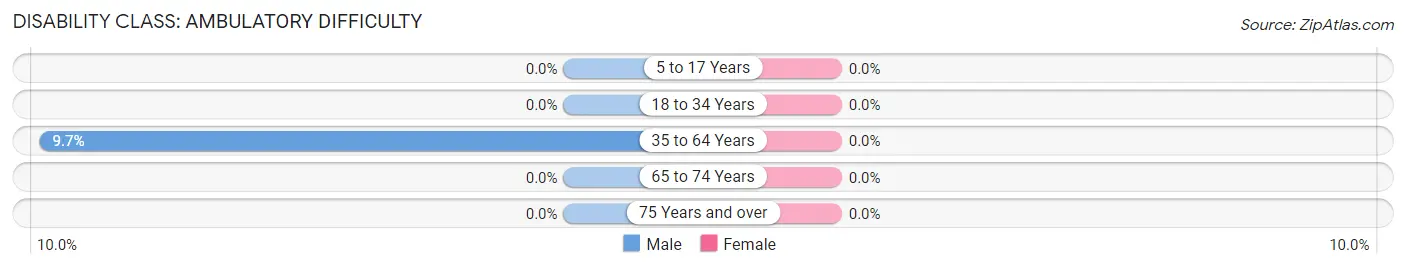
| Age Bracket | Male | Female |
| 5 to 17 Years | 0 (0.0%) | 0 (0.0%) |
| 18 to 34 Years | 0 (0.0%) | 0 (0.0%) |
| 35 to 64 Years | 65 (9.7%) | 0 (0.0%) |
| 65 to 74 Years | 0 (0.0%) | 0 (0.0%) |
| 75 Years and over | 0 (0.0%) | 0 (0.0%) |
Disability Class: Self-Care Difficulty
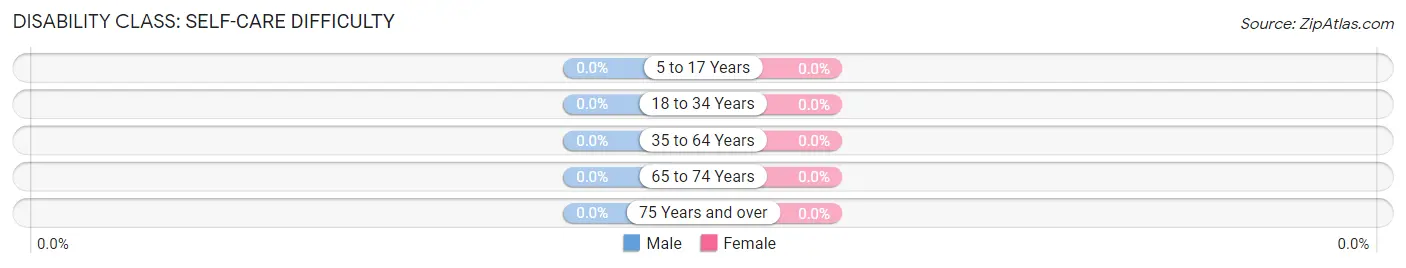
| Age Bracket | Male | Female |
| 5 to 17 Years | 0 (0.0%) | 0 (0.0%) |
| 18 to 34 Years | 0 (0.0%) | 0 (0.0%) |
| 35 to 64 Years | 0 (0.0%) | 0 (0.0%) |
| 65 to 74 Years | 0 (0.0%) | 0 (0.0%) |
| 75 Years and over | 0 (0.0%) | 0 (0.0%) |
Technology Access in Marshfield Hills
Computing Device Access in Marshfield Hills
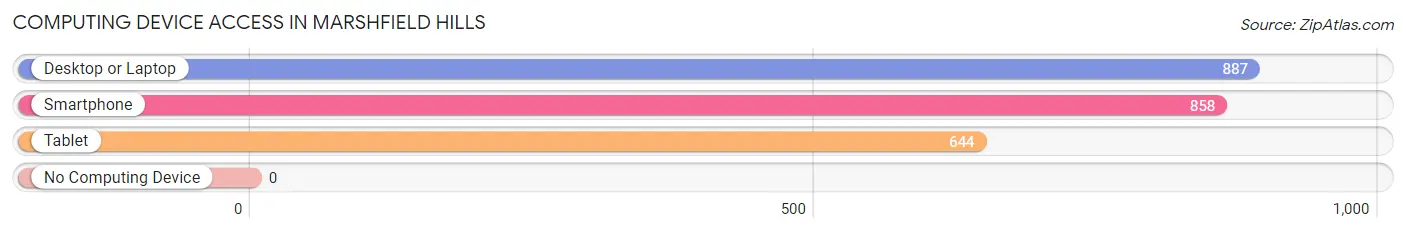
| Device Type | # Households | % Households |
| Desktop or Laptop | 887 | 94.7% |
| Smartphone | 858 | 91.6% |
| Tablet | 644 | 68.7% |
| No Computing Device | 0 | 0.0% |
| Total | 937 | 100.0% |
Internet Access in Marshfield Hills
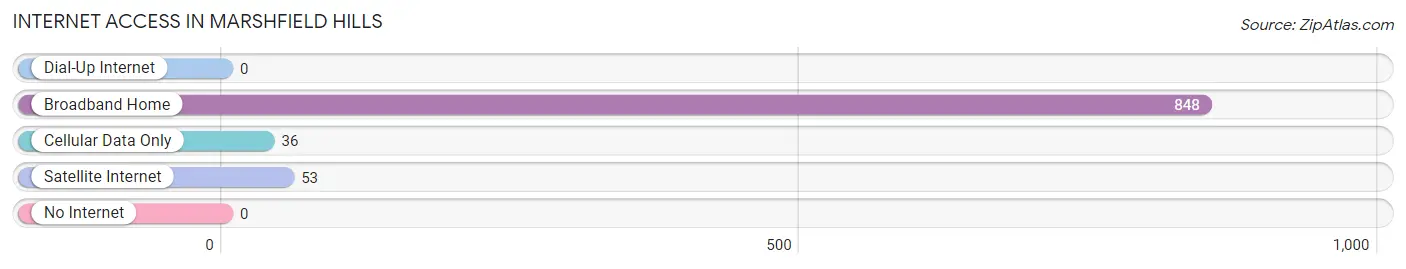
| Internet Type | # Households | % Households |
| Dial-Up Internet | 0 | 0.0% |
| Broadband Home | 848 | 90.5% |
| Cellular Data Only | 36 | 3.8% |
| Satellite Internet | 53 | 5.7% |
| No Internet | 0 | 0.0% |
| Total | 937 | 100.0% |
Marshfield Hills Summary
Marshfield Hills is a small village located in Plymouth County, Massachusetts. It is situated on the South Shore of Massachusetts, approximately 25 miles south of Boston. The village is bordered by the towns of Marshfield, Duxbury, and Pembroke. The population of Marshfield Hills was 1,845 at the 2010 census.
History
Marshfield Hills was first settled in 1632 by a group of English settlers from the Plymouth Colony. The area was originally known as “The Hills” and was part of the town of Marshfield. In 1793, the area was officially incorporated as the town of Marshfield Hills. The town was named after the nearby town of Marshfield, which was named after the marshy area near the town.
In the 19th century, Marshfield Hills was a popular summer resort destination for wealthy Bostonians. The town was known for its beautiful beaches, scenic views, and luxurious hotels. In the late 19th century, the town was also home to a number of large estates owned by wealthy families.
Geography
Marshfield Hills is located in Plymouth County, Massachusetts. It is situated on the South Shore of Massachusetts, approximately 25 miles south of Boston. The town is bordered by the towns of Marshfield, Duxbury, and Pembroke. The town is located on a peninsula that juts out into the Atlantic Ocean. The town is surrounded by several bodies of water, including the North River, the South River, and the Humarock River.
The town has a total area of 4.2 square miles, of which 4.1 square miles is land and 0.1 square miles is water. The town is mostly flat, with some rolling hills in the northern part of town. The highest point in the town is located at an elevation of 80 feet.
Economy
The economy of Marshfield Hills is largely based on tourism and retail. The town is home to several small businesses, including restaurants, shops, and galleries. The town is also home to a number of summer resorts, which attract visitors from all over the world.
The town is also home to a number of large employers, including the Marshfield Hills Medical Center, the Marshfield Hills Country Club, and the Marshfield Hills Golf Course.
Demographics
As of the 2010 census, the population of Marshfield Hills was 1,845. The racial makeup of the town was 97.2% White, 0.7% African American, 0.3% Native American, 0.4% Asian, 0.1% Pacific Islander, 0.3% from other races, and 1.0% from two or more races. Hispanic or Latino of any race were 1.2% of the population.
The median income for a household in the town was $68,750, and the median income for a family was $76,250. The per capita income for the town was $31,945. About 4.2% of families and 5.2% of the population were below the poverty line, including 6.2% of those under age 18 and 4.2% of those age 65 or over.
Common Questions
What is Per Capita Income in Marshfield Hills?
Per Capita income in Marshfield Hills is $76,373.
What is the Median Family Income in Marshfield Hills?
Median Family Income in Marshfield Hills is $184,607.
What is the Median Household income in Marshfield Hills?
Median Household Income in Marshfield Hills is $164,571.
What is Income or Wage Gap in Marshfield Hills?
Income or Wage Gap in Marshfield Hills is 32.4%.
Women in Marshfield Hills earn 67.6 cents for every dollar earned by a man.
What is Inequality or Gini Index in Marshfield Hills?
Inequality or Gini Index in Marshfield Hills is 0.44.
What is the Total Population of Marshfield Hills?
Total Population of Marshfield Hills is 2,458.
What is the Total Male Population of Marshfield Hills?
Total Male Population of Marshfield Hills is 1,136.
What is the Total Female Population of Marshfield Hills?
Total Female Population of Marshfield Hills is 1,322.
What is the Ratio of Males per 100 Females in Marshfield Hills?
There are 85.93 Males per 100 Females in Marshfield Hills.
What is the Ratio of Females per 100 Males in Marshfield Hills?
There are 116.37 Females per 100 Males in Marshfield Hills.
What is the Median Population Age in Marshfield Hills?
Median Population Age in Marshfield Hills is 47.2 Years.
What is the Average Family Size in Marshfield Hills
Average Family Size in Marshfield Hills is 3.0 People.
What is the Average Household Size in Marshfield Hills
Average Household Size in Marshfield Hills is 2.6 People.
How Large is the Labor Force in Marshfield Hills?
There are 1,361 People in the Labor Forcein in Marshfield Hills.
What is the Percentage of People in the Labor Force in Marshfield Hills?
64.1% of People are in the Labor Force in Marshfield Hills.