Boston, MA Map & Demographics
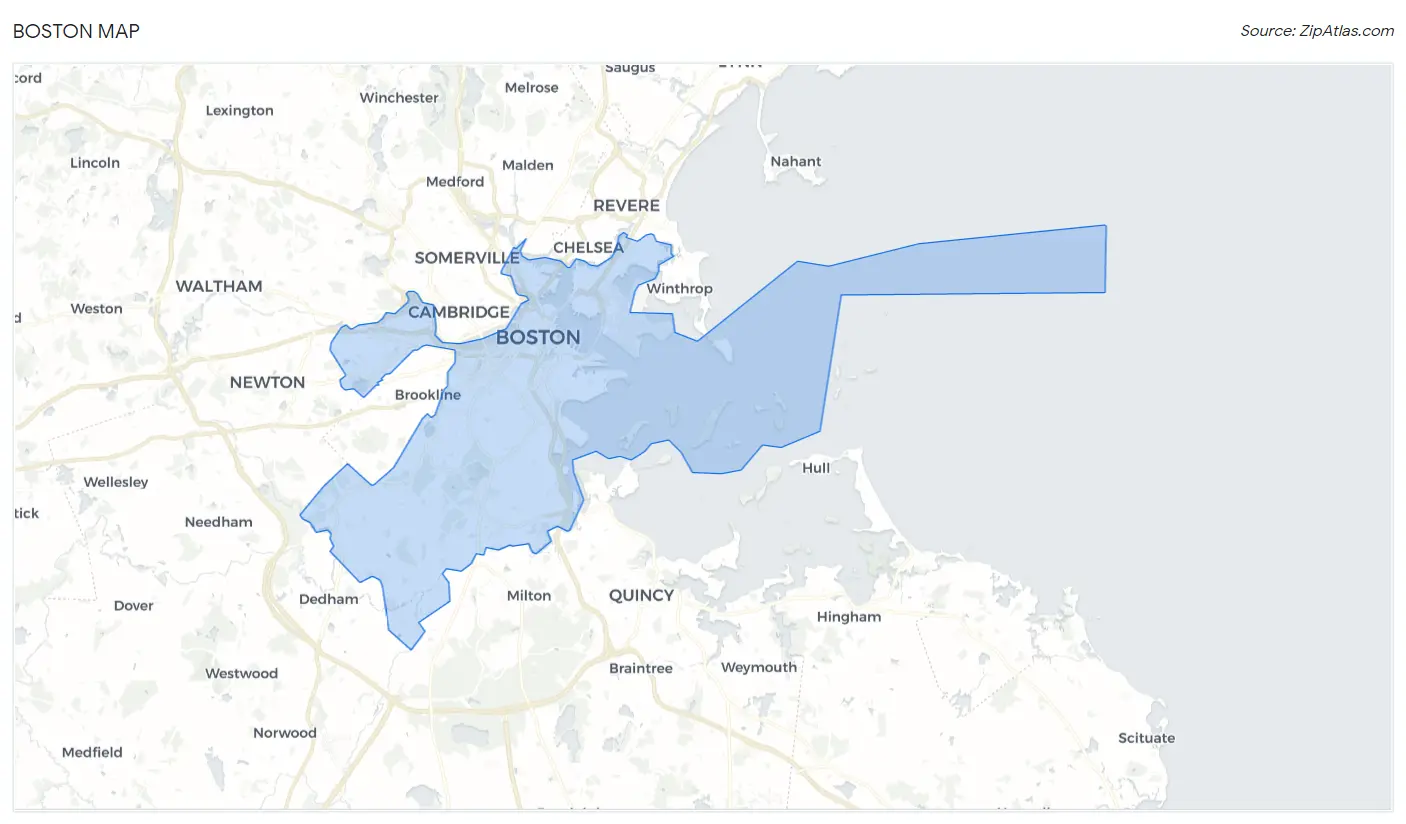
Boston Map
Boston Overview
$55,949
PER CAPITA INCOME
$106,015
AVG FAMILY INCOME
$89,212
AVG HOUSEHOLD INCOME
17.1%
WAGE / INCOME GAP [ % ]
82.9¢/ $1
WAGE / INCOME GAP [ $ ]
$11,137
FAMILY INCOME DEFICIT
0.54
INEQUALITY / GINI INDEX
665,945
TOTAL POPULATION
320,791
MALE POPULATION
345,154
FEMALE POPULATION
92.94
MALES / 100 FEMALES
107.59
FEMALES / 100 MALES
32.9
MEDIAN AGE
3.0
AVG FAMILY SIZE
2.3
AVG HOUSEHOLD SIZE
398,813
LABOR FORCE [ PEOPLE ]
69.7%
PERCENT IN LABOR FORCE
6.6%
UNEMPLOYMENT RATE
Income in Boston
Income Overview in Boston
Per Capita Income in Boston is $55,949, while median incomes of families and households are $106,015 and $89,212 respectively.
| Characteristic | Number | Measure |
| Per Capita Income | 665,945 | $55,949 |
| Median Family Income | 128,470 | $106,015 |
| Mean Family Income | 128,470 | $157,118 |
| Median Household Income | 276,053 | $89,212 |
| Mean Household Income | 276,053 | $132,509 |
| Income Deficit | 128,470 | $11,137 |
| Wage / Income Gap (%) | 665,945 | 17.11% |
| Wage / Income Gap ($) | 665,945 | 82.89¢ per $1 |
| Gini / Inequality Index | 665,945 | 0.54 |
Earnings by Sex in Boston
Average Earnings in Boston are $52,161, $57,249 for men and $47,451 for women, a difference of 17.1%.
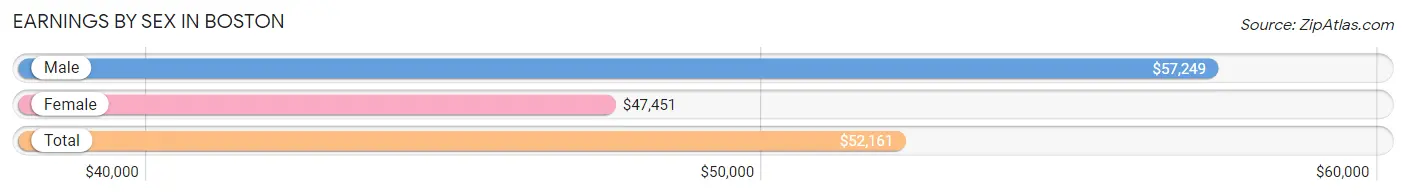
| Sex | Number | Average Earnings |
| Male | 203,814 (48.7%) | $57,249 |
| Female | 215,041 (51.3%) | $47,451 |
| Total | 418,855 (100.0%) | $52,161 |
Earnings by Sex by Income Bracket in Boston
The most common earnings brackets in Boston are $100,000+ for men (54,926 | 27.0%) and $100,000+ for women (40,589 | 18.9%).
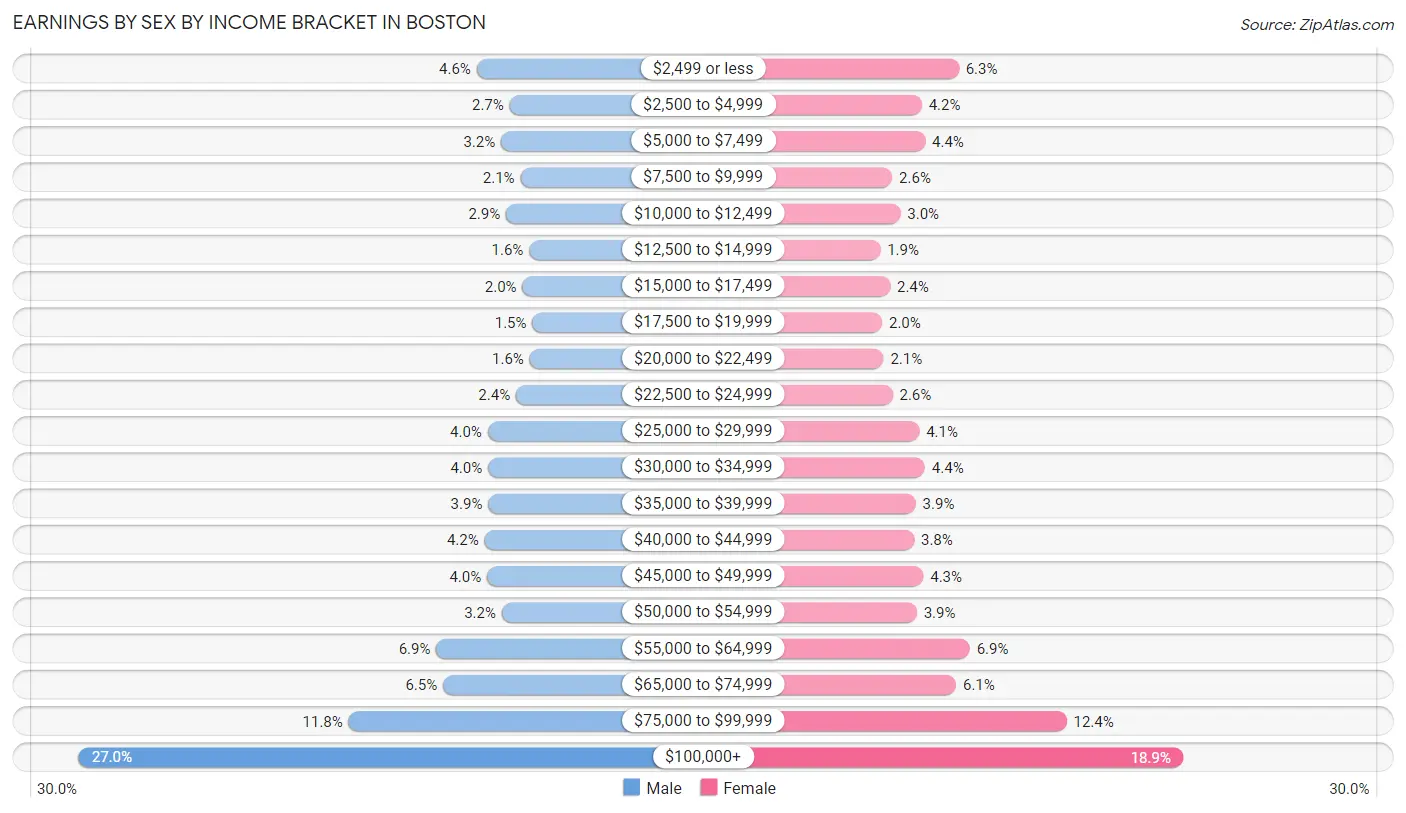
| Income | Male | Female |
| $2,499 or less | 9,353 (4.6%) | 13,520 (6.3%) |
| $2,500 to $4,999 | 5,584 (2.7%) | 9,052 (4.2%) |
| $5,000 to $7,499 | 6,561 (3.2%) | 9,469 (4.4%) |
| $7,500 to $9,999 | 4,334 (2.1%) | 5,489 (2.5%) |
| $10,000 to $12,499 | 5,985 (2.9%) | 6,473 (3.0%) |
| $12,500 to $14,999 | 3,340 (1.6%) | 4,050 (1.9%) |
| $15,000 to $17,499 | 4,110 (2.0%) | 5,222 (2.4%) |
| $17,500 to $19,999 | 2,966 (1.5%) | 4,259 (2.0%) |
| $20,000 to $22,499 | 3,285 (1.6%) | 4,435 (2.1%) |
| $22,500 to $24,999 | 4,858 (2.4%) | 5,517 (2.6%) |
| $25,000 to $29,999 | 8,101 (4.0%) | 8,758 (4.1%) |
| $30,000 to $34,999 | 8,052 (4.0%) | 9,432 (4.4%) |
| $35,000 to $39,999 | 8,030 (3.9%) | 8,328 (3.9%) |
| $40,000 to $44,999 | 8,451 (4.2%) | 8,135 (3.8%) |
| $45,000 to $49,999 | 8,165 (4.0%) | 9,253 (4.3%) |
| $50,000 to $54,999 | 6,485 (3.2%) | 8,441 (3.9%) |
| $55,000 to $64,999 | 13,989 (6.9%) | 14,855 (6.9%) |
| $65,000 to $74,999 | 13,203 (6.5%) | 13,207 (6.1%) |
| $75,000 to $99,999 | 24,036 (11.8%) | 26,557 (12.3%) |
| $100,000+ | 54,926 (27.0%) | 40,589 (18.9%) |
| Total | 203,814 (100.0%) | 215,041 (100.0%) |
Earnings by Sex by Educational Attainment in Boston
Average earnings in Boston are $68,304 for men and $58,201 for women, a difference of 14.8%. Men with an educational attainment of graduate degree enjoy the highest average annual earnings of $104,840, while those with less than high school education earn the least with $32,649. Women with an educational attainment of graduate degree earn the most with the average annual earnings of $86,360, while those with less than high school education have the smallest earnings of $24,258.
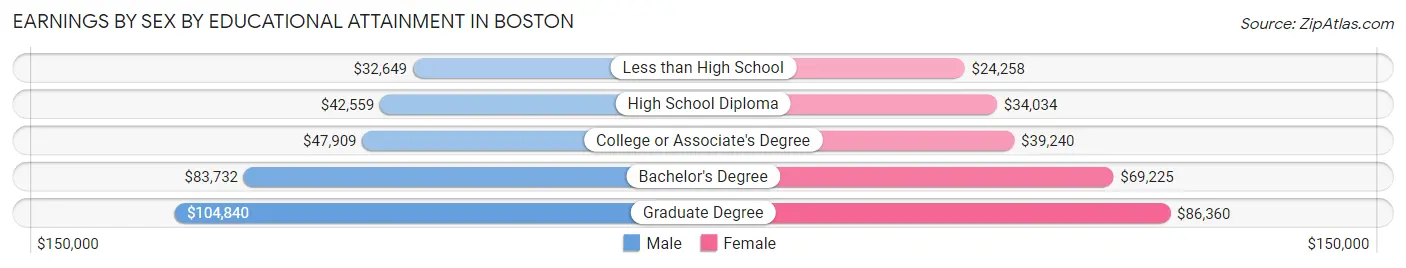
| Educational Attainment | Male Income | Female Income |
| Less than High School | $32,649 | $24,258 |
| High School Diploma | $42,559 | $34,034 |
| College or Associate's Degree | $47,909 | $39,240 |
| Bachelor's Degree | $83,732 | $69,225 |
| Graduate Degree | $104,840 | $86,360 |
| Total | $68,304 | $58,201 |
Family Income in Boston
Family Income Brackets in Boston
According to the Boston family income data, there are 31,475 families falling into the $200,000+ income range, which is the most common income bracket and makes up 24.5% of all families. Conversely, the $10,000 to $14,999 income bracket is the least frequent group with only 3,854 families (3.0%) belonging to this category.
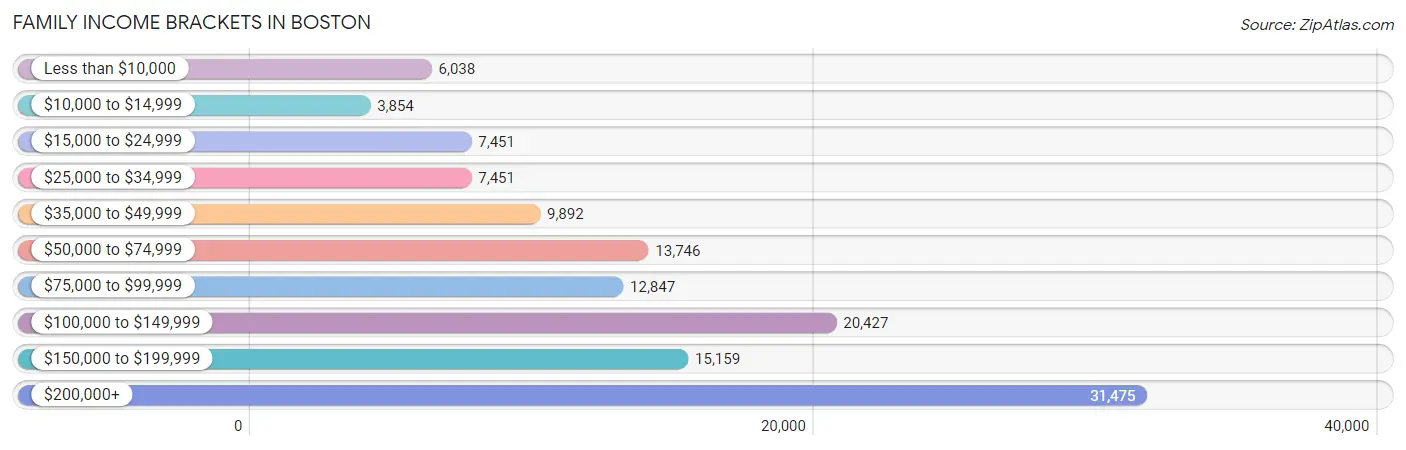
| Income Bracket | # Families | % Families |
| Less than $10,000 | 6,038 | 4.7% |
| $10,000 to $14,999 | 3,854 | 3.0% |
| $15,000 to $24,999 | 7,451 | 5.8% |
| $25,000 to $34,999 | 7,451 | 5.8% |
| $35,000 to $49,999 | 9,892 | 7.7% |
| $50,000 to $74,999 | 13,746 | 10.7% |
| $75,000 to $99,999 | 12,847 | 10.0% |
| $100,000 to $149,999 | 20,427 | 15.9% |
| $150,000 to $199,999 | 15,159 | 11.8% |
| $200,000+ | 31,475 | 24.5% |
Family Income by Famaliy Size in Boston
7+ person families (2,082 | 1.6%) account for the highest median family income in Boston with $140,157 per family, while 2-person families (62,100 | 48.3%) have the highest median income of $50,638 per family member.
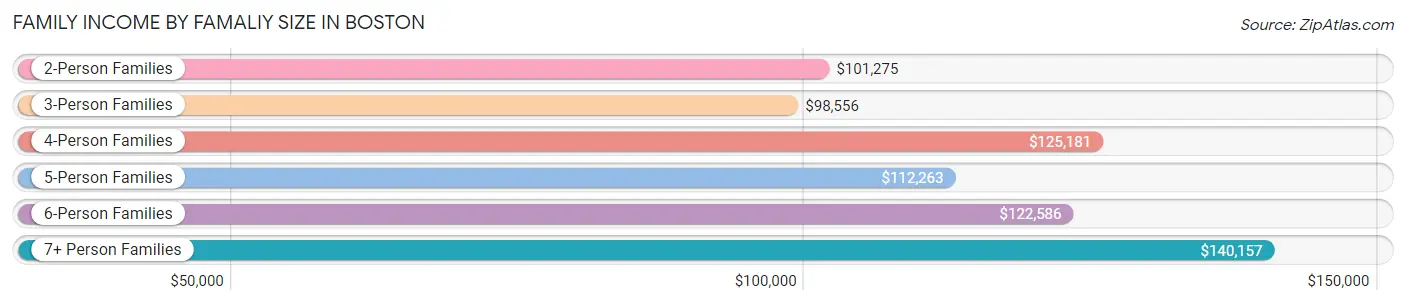
| Income Bracket | # Families | Median Income |
| 2-Person Families | 62,100 (48.3%) | $101,275 |
| 3-Person Families | 32,368 (25.2%) | $98,556 |
| 4-Person Families | 19,632 (15.3%) | $125,181 |
| 5-Person Families | 8,884 (6.9%) | $112,263 |
| 6-Person Families | 3,404 (2.6%) | $122,586 |
| 7+ Person Families | 2,082 (1.6%) | $140,157 |
| Total | 128,470 (100.0%) | $106,015 |
Family Income by Number of Earners in Boston
The median family income in Boston is $106,015, with families comprising 3+ earners (16,256) having the highest median family income of $158,883, while families with no earners (14,330) have the lowest median family income of $21,722, accounting for 12.7% and 11.2% of families, respectively.
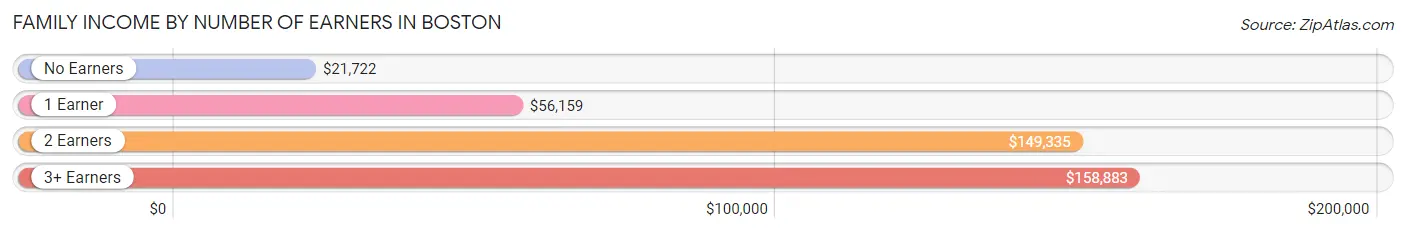
| Number of Earners | # Families | Median Income |
| No Earners | 14,330 (11.2%) | $21,722 |
| 1 Earner | 37,185 (28.9%) | $56,159 |
| 2 Earners | 60,699 (47.2%) | $149,335 |
| 3+ Earners | 16,256 (12.7%) | $158,883 |
| Total | 128,470 (100.0%) | $106,015 |
Household Income in Boston
Household Income Brackets in Boston
With 54,106 households falling in the category, the $200,000+ income range is the most frequent in Boston, accounting for 19.6% of all households. In contrast, only 14,907 households (5.4%) fall into the $25,000 to $34,999 income bracket, making it the least populous group.
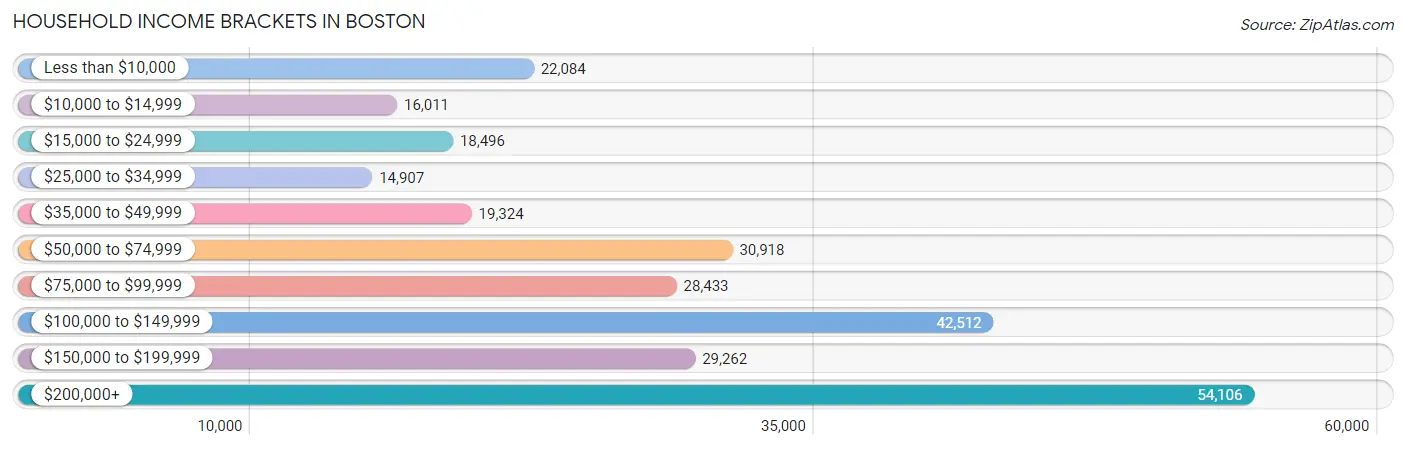
| Income Bracket | # Households | % Households |
| Less than $10,000 | 22,084 | 8.0% |
| $10,000 to $14,999 | 16,011 | 5.8% |
| $15,000 to $24,999 | 18,496 | 6.7% |
| $25,000 to $34,999 | 14,907 | 5.4% |
| $35,000 to $49,999 | 19,324 | 7.0% |
| $50,000 to $74,999 | 30,918 | 11.2% |
| $75,000 to $99,999 | 28,433 | 10.3% |
| $100,000 to $149,999 | 42,512 | 15.4% |
| $150,000 to $199,999 | 29,262 | 10.6% |
| $200,000+ | 54,106 | 19.6% |
Household Income by Householder Age in Boston
The median household income in Boston is $89,212, with the highest median household income of $113,612 found in the 25 to 44 years age bracket for the primary householder. A total of 122,808 households (44.5%) fall into this category. Meanwhile, the 15 to 24 years age bracket for the primary householder has the lowest median household income of $37,500, with 17,092 households (6.2%) in this group.
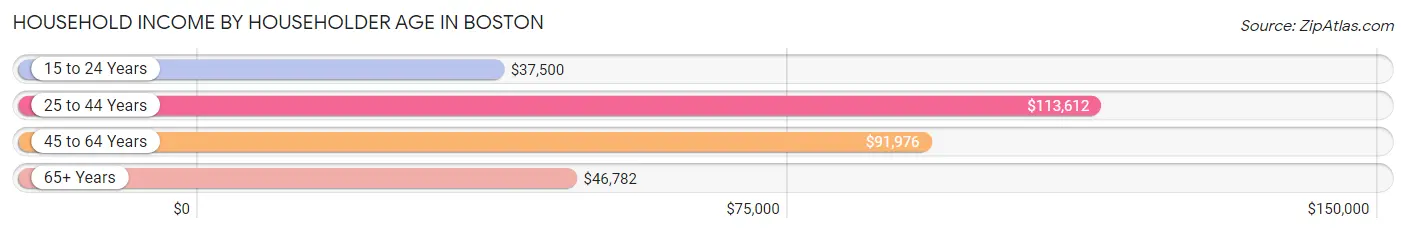
| Income Bracket | # Households | Median Income |
| 15 to 24 Years | 17,092 (6.2%) | $37,500 |
| 25 to 44 Years | 122,808 (44.5%) | $113,612 |
| 45 to 64 Years | 83,802 (30.4%) | $91,976 |
| 65+ Years | 52,351 (19.0%) | $46,782 |
| Total | 276,053 (100.0%) | $89,212 |
Poverty in Boston
Income Below Poverty by Sex and Age in Boston
With 16.4% poverty level for males and 18.5% for females among the residents of Boston, 18 to 24 year old males and 18 to 24 year old females are the most vulnerable to poverty, with 10,018 males (32.1%) and 12,139 females (36.0%) in their respective age groups living below the poverty level.
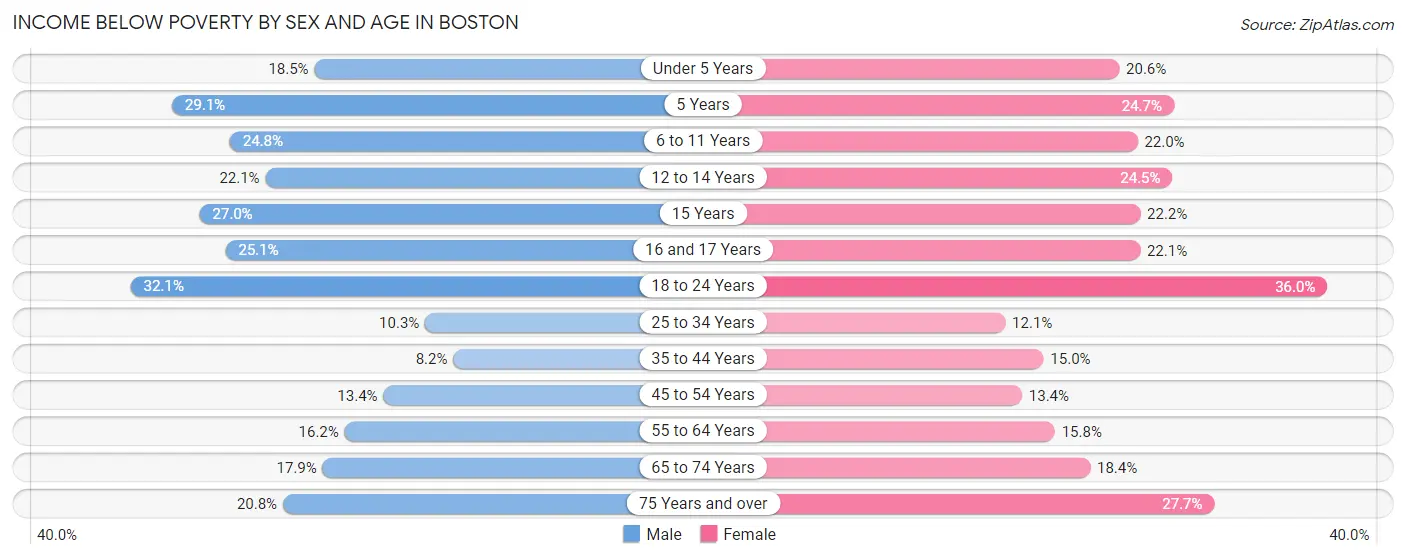
| Age Bracket | Male | Female |
| Under 5 Years | 2,896 (18.5%) | 3,092 (20.6%) |
| 5 Years | 988 (29.1%) | 522 (24.6%) |
| 6 to 11 Years | 4,011 (24.8%) | 3,528 (22.0%) |
| 12 to 14 Years | 2,093 (22.1%) | 1,996 (24.5%) |
| 15 Years | 771 (27.0%) | 695 (22.2%) |
| 16 and 17 Years | 1,311 (25.1%) | 1,104 (22.1%) |
| 18 to 24 Years | 10,018 (32.1%) | 12,139 (36.0%) |
| 25 to 34 Years | 7,916 (10.3%) | 9,707 (12.1%) |
| 35 to 44 Years | 3,487 (8.2%) | 6,575 (15.0%) |
| 45 to 54 Years | 4,439 (13.4%) | 4,715 (13.4%) |
| 55 to 64 Years | 5,287 (16.2%) | 5,671 (15.8%) |
| 65 to 74 Years | 3,850 (17.9%) | 4,835 (18.4%) |
| 75 Years and over | 2,609 (20.8%) | 5,451 (27.7%) |
| Total | 49,676 (16.4%) | 60,030 (18.5%) |
Income Above Poverty by Sex and Age in Boston
According to the poverty statistics in Boston, males aged 35 to 44 years and females aged 25 to 34 years are the age groups that are most secure financially, with 91.8% of males and 87.9% of females in these age groups living above the poverty line.
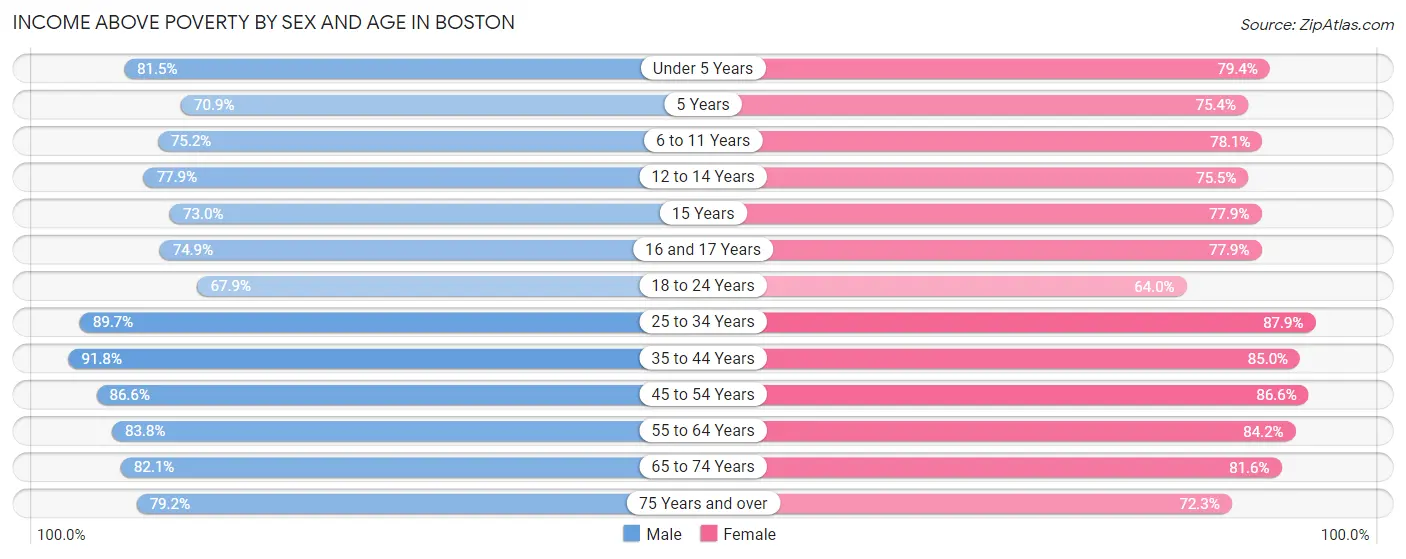
| Age Bracket | Male | Female |
| Under 5 Years | 12,777 (81.5%) | 11,927 (79.4%) |
| 5 Years | 2,412 (70.9%) | 1,596 (75.3%) |
| 6 to 11 Years | 12,189 (75.2%) | 12,548 (78.0%) |
| 12 to 14 Years | 7,367 (77.9%) | 6,138 (75.5%) |
| 15 Years | 2,082 (73.0%) | 2,443 (77.8%) |
| 16 and 17 Years | 3,913 (74.9%) | 3,882 (77.9%) |
| 18 to 24 Years | 21,159 (67.9%) | 21,547 (64.0%) |
| 25 to 34 Years | 69,255 (89.7%) | 70,286 (87.9%) |
| 35 to 44 Years | 39,217 (91.8%) | 37,333 (85.0%) |
| 45 to 54 Years | 28,783 (86.6%) | 30,559 (86.6%) |
| 55 to 64 Years | 27,264 (83.8%) | 30,204 (84.2%) |
| 65 to 74 Years | 17,677 (82.1%) | 21,397 (81.6%) |
| 75 Years and over | 9,922 (79.2%) | 14,259 (72.3%) |
| Total | 254,017 (83.6%) | 264,119 (81.5%) |
Income Below Poverty Among Married-Couple Families in Boston
The poverty statistics for married-couple families in Boston show that 5.9% or 4,634 of the total 78,195 families live below the poverty line. Families with 5 or more children have the highest poverty rate of 36.2%, comprising of 130 families. On the other hand, families with 1 or 2 children have the lowest poverty rate of 4.6%, which includes 1,165 families.
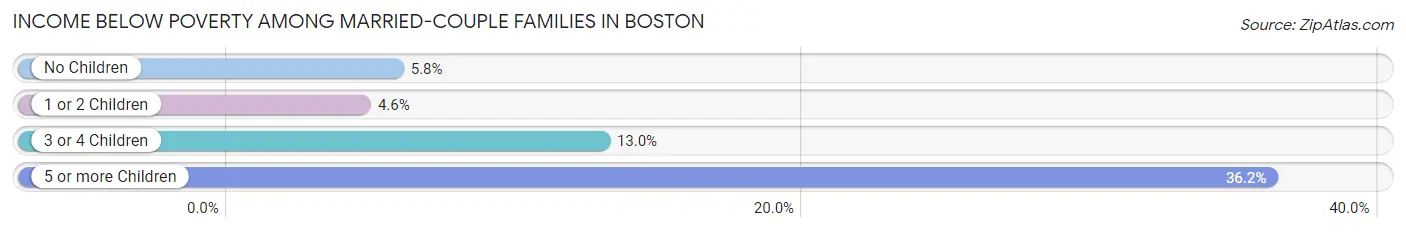
| Children | Above Poverty | Below Poverty |
| No Children | 45,694 (94.2%) | 2,799 (5.8%) |
| 1 or 2 Children | 24,007 (95.4%) | 1,165 (4.6%) |
| 3 or 4 Children | 3,631 (87.1%) | 540 (13.0%) |
| 5 or more Children | 229 (63.8%) | 130 (36.2%) |
| Total | 73,561 (94.1%) | 4,634 (5.9%) |
Income Below Poverty Among Single-Parent Households in Boston
According to the poverty data in Boston, 13.1% or 1,478 single-father households and 24.6% or 9,578 single-mother households are living below the poverty line. Among single-father households, those with 3 or 4 children have the highest poverty rate, with 191 households (37.6%) experiencing poverty. Likewise, among single-mother households, those with 5 or more children have the highest poverty rate, with 113 households (76.9%) falling below the poverty line.
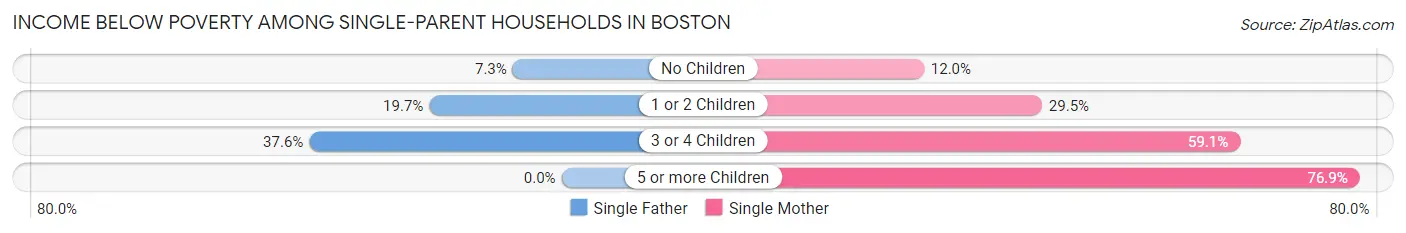
| Children | Single Father | Single Mother |
| No Children | 494 (7.3%) | 1,965 (11.9%) |
| 1 or 2 Children | 793 (19.7%) | 5,711 (29.5%) |
| 3 or 4 Children | 191 (37.6%) | 1,789 (59.1%) |
| 5 or more Children | 0 (0.0%) | 113 (76.9%) |
| Total | 1,478 (13.1%) | 9,578 (24.6%) |
Income Below Poverty Among Married-Couple vs Single-Parent Households in Boston
The poverty data for Boston shows that 4,634 of the married-couple family households (5.9%) and 11,056 of the single-parent households (22.0%) are living below the poverty level. Within the married-couple family households, those with 5 or more children have the highest poverty rate, with 130 households (36.2%) falling below the poverty line. Among the single-parent households, those with 5 or more children have the highest poverty rate, with 113 household (76.9%) living below poverty.
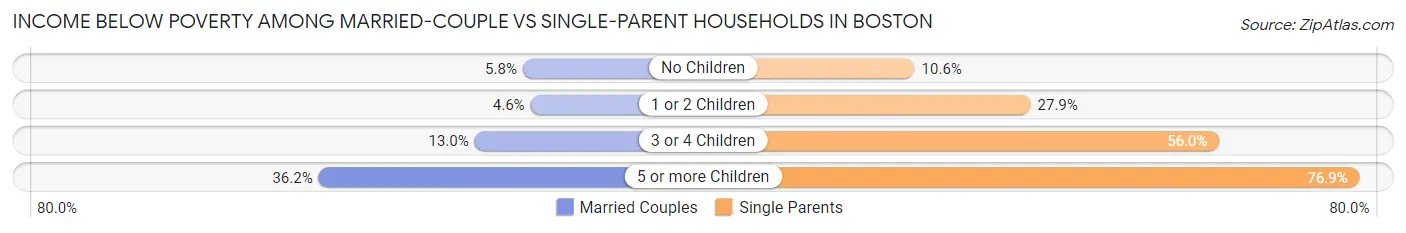
| Children | Married-Couple Families | Single-Parent Households |
| No Children | 2,799 (5.8%) | 2,459 (10.6%) |
| 1 or 2 Children | 1,165 (4.6%) | 6,504 (27.9%) |
| 3 or 4 Children | 540 (13.0%) | 1,980 (56.0%) |
| 5 or more Children | 130 (36.2%) | 113 (76.9%) |
| Total | 4,634 (5.9%) | 11,056 (22.0%) |
Race in Boston
The most populous races in Boston are White / Caucasian (323,655 | 48.6%), Black / African American (150,002 | 22.5%), and Hispanic or Latino (130,313 | 19.6%).
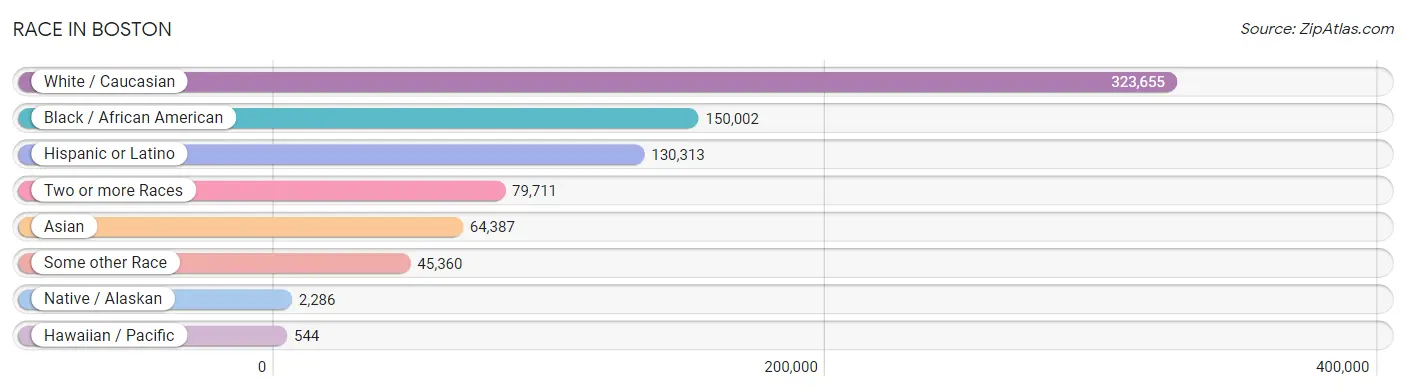
| Race | # Population | % Population |
| Asian | 64,387 | 9.7% |
| Black / African American | 150,002 | 22.5% |
| Hawaiian / Pacific | 544 | 0.1% |
| Hispanic or Latino | 130,313 | 19.6% |
| Native / Alaskan | 2,286 | 0.3% |
| White / Caucasian | 323,655 | 48.6% |
| Two or more Races | 79,711 | 12.0% |
| Some other Race | 45,360 | 6.8% |
| Total | 665,945 | 100.0% |
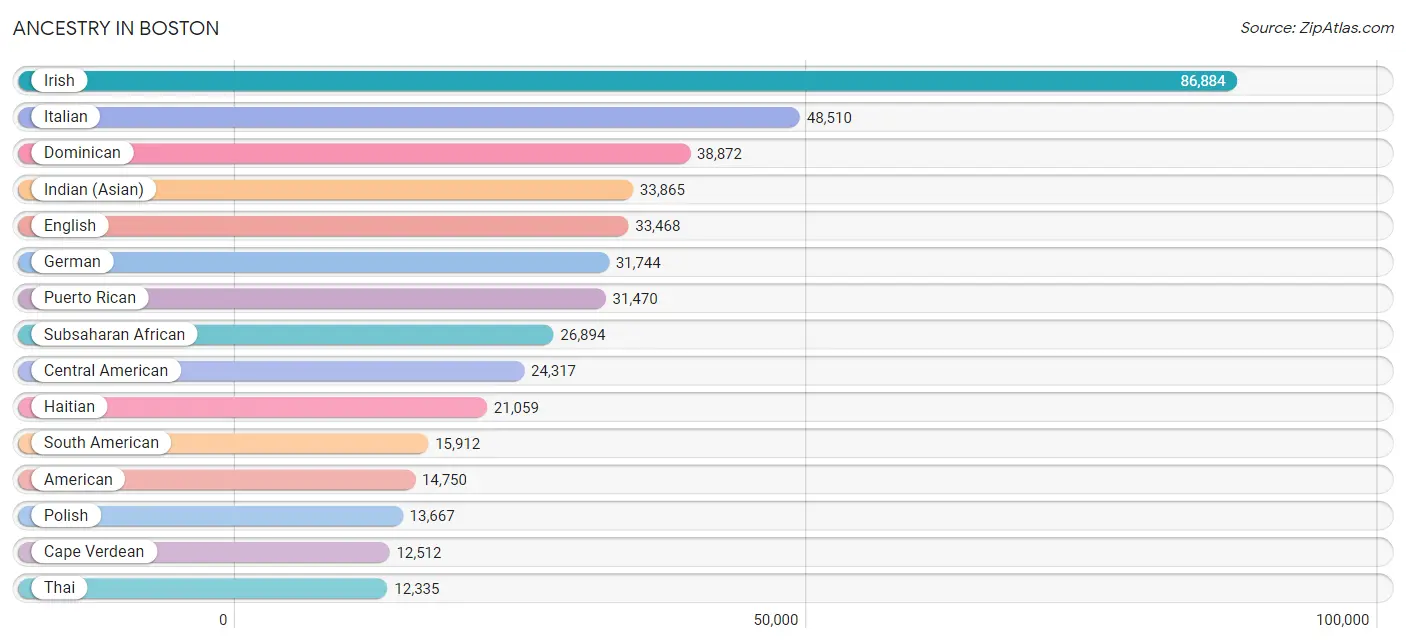
Ancestry in Boston
The most populous ancestries reported in Boston are Irish (86,884 | 13.1%), Italian (48,510 | 7.3%), Dominican (38,872 | 5.8%), Indian (Asian) (33,865 | 5.1%), and English (33,468 | 5.0%), together accounting for 36.3% of all Boston residents.
| Ancestry | # Population | % Population |
| Afghan | 157 | 0.0% |
| African | 4,881 | 0.7% |
| Alaska Native | 34 | 0.0% |
| Alaskan Athabascan | 27 | 0.0% |
| Albanian | 1,791 | 0.3% |
| Alsatian | 78 | 0.0% |
| American | 14,750 | 2.2% |
| Apache | 88 | 0.0% |
| Arab | 7,605 | 1.1% |
| Argentinean | 514 | 0.1% |
| Armenian | 1,249 | 0.2% |
| Assyrian / Chaldean / Syriac | 33 | 0.0% |
| Australian | 224 | 0.0% |
| Austrian | 822 | 0.1% |
| Bahamian | 23 | 0.0% |
| Bangladeshi | 8 | 0.0% |
| Barbadian | 2,825 | 0.4% |
| Basque | 88 | 0.0% |
| Belgian | 662 | 0.1% |
| Belizean | 180 | 0.0% |
| Bermudan | 154 | 0.0% |
| Bhutanese | 2,313 | 0.4% |
| Blackfeet | 478 | 0.1% |
| Bolivian | 343 | 0.1% |
| Brazilian | 3,552 | 0.5% |
| British | 2,688 | 0.4% |
| British West Indian | 2,377 | 0.4% |
| Bulgarian | 276 | 0.0% |
| Burmese | 4,787 | 0.7% |
| Cajun | 95 | 0.0% |
| Cambodian | 18 | 0.0% |
| Canadian | 1,936 | 0.3% |
| Cape Verdean | 12,512 | 1.9% |
| Carpatho Rusyn | 34 | 0.0% |
| Celtic | 72 | 0.0% |
| Central American | 24,317 | 3.6% |
| Central American Indian | 1,255 | 0.2% |
| Cherokee | 1,020 | 0.2% |
| Cheyenne | 93 | 0.0% |
| Chickasaw | 15 | 0.0% |
| Chilean | 619 | 0.1% |
| Chippewa | 26 | 0.0% |
| Choctaw | 121 | 0.0% |
| Colombian | 9,196 | 1.4% |
| Comanche | 6 | 0.0% |
| Costa Rican | 1,318 | 0.2% |
| Creek | 31 | 0.0% |
| Croatian | 477 | 0.1% |
| Cuban | 2,607 | 0.4% |
| Cypriot | 87 | 0.0% |
| Czech | 1,313 | 0.2% |
| Czechoslovakian | 57 | 0.0% |
| Danish | 1,244 | 0.2% |
| Dominican | 38,872 | 5.8% |
| Dutch | 2,637 | 0.4% |
| Eastern European | 4,280 | 0.6% |
| Ecuadorian | 1,803 | 0.3% |
| Egyptian | 491 | 0.1% |
| English | 33,468 | 5.0% |
| Estonian | 212 | 0.0% |
| Ethiopian | 1,439 | 0.2% |
| European | 7,598 | 1.1% |
| Filipino | 816 | 0.1% |
| Finnish | 844 | 0.1% |
| French | 11,205 | 1.7% |
| French American Indian | 21 | 0.0% |
| French Canadian | 8,010 | 1.2% |
| German | 31,744 | 4.8% |
| German Russian | 57 | 0.0% |
| Ghanaian | 743 | 0.1% |
| Greek | 6,413 | 1.0% |
| Guamanian / Chamorro | 28 | 0.0% |
| Guatemalan | 4,870 | 0.7% |
| Guyanese | 633 | 0.1% |
| Haitian | 21,059 | 3.2% |
| Honduran | 4,055 | 0.6% |
| Hungarian | 1,781 | 0.3% |
| Icelander | 17 | 0.0% |
| Indian (Asian) | 33,865 | 5.1% |
| Indonesian | 367 | 0.1% |
| Inupiat | 35 | 0.0% |
| Iranian | 1,313 | 0.2% |
| Iraqi | 180 | 0.0% |
| Irish | 86,884 | 13.1% |
| Iroquois | 38 | 0.0% |
| Israeli | 482 | 0.1% |
| Italian | 48,510 | 7.3% |
| Jamaican | 11,787 | 1.8% |
| Japanese | 763 | 0.1% |
| Jordanian | 136 | 0.0% |
| Kenyan | 624 | 0.1% |
| Korean | 3,418 | 0.5% |
| Laotian | 312 | 0.1% |
| Latvian | 334 | 0.1% |
| Lebanese | 2,197 | 0.3% |
| Liberian | 288 | 0.0% |
| Lithuanian | 2,234 | 0.3% |
| Luxembourger | 32 | 0.0% |
| Macedonian | 33 | 0.0% |
| Malaysian | 118 | 0.0% |
| Maltese | 54 | 0.0% |
| Mexican | 7,398 | 1.1% |
| Mexican American Indian | 307 | 0.1% |
| Mongolian | 128 | 0.0% |
| Moroccan | 869 | 0.1% |
| Native Hawaiian | 563 | 0.1% |
| Navajo | 227 | 0.0% |
| New Zealander | 174 | 0.0% |
| Nicaraguan | 464 | 0.1% |
| Nigerian | 3,193 | 0.5% |
| Northern European | 720 | 0.1% |
| Norwegian | 2,926 | 0.4% |
| Okinawan | 67 | 0.0% |
| Osage | 6 | 0.0% |
| Pakistani | 600 | 0.1% |
| Palestinian | 332 | 0.1% |
| Panamanian | 536 | 0.1% |
| Paraguayan | 125 | 0.0% |
| Peruvian | 1,396 | 0.2% |
| Polish | 13,667 | 2.1% |
| Portuguese | 6,011 | 0.9% |
| Potawatomi | 21 | 0.0% |
| Puerto Rican | 31,470 | 4.7% |
| Romanian | 826 | 0.1% |
| Russian | 7,262 | 1.1% |
| Salvadoran | 12,018 | 1.8% |
| Samoan | 145 | 0.0% |
| Scandinavian | 1,118 | 0.2% |
| Scotch-Irish | 2,529 | 0.4% |
| Scottish | 7,258 | 1.1% |
| Senegalese | 36 | 0.0% |
| Serbian | 453 | 0.1% |
| Sierra Leonean | 398 | 0.1% |
| Sioux | 46 | 0.0% |
| Slavic | 159 | 0.0% |
| Slovak | 722 | 0.1% |
| Slovene | 125 | 0.0% |
| Somali | 1,440 | 0.2% |
| South African | 303 | 0.1% |
| South American | 15,912 | 2.4% |
| South American Indian | 306 | 0.1% |
| Spaniard | 1,671 | 0.3% |
| Spanish | 1,129 | 0.2% |
| Spanish American | 109 | 0.0% |
| Sri Lankan | 11,375 | 1.7% |
| Subsaharan African | 26,894 | 4.0% |
| Sudanese | 159 | 0.0% |
| Swedish | 4,951 | 0.7% |
| Swiss | 1,084 | 0.2% |
| Syrian | 546 | 0.1% |
| Thai | 12,335 | 1.8% |
| Tlingit-Haida | 21 | 0.0% |
| Trinidadian and Tobagonian | 5,211 | 0.8% |
| Turkish | 1,129 | 0.2% |
| U.S. Virgin Islander | 144 | 0.0% |
| Ugandan | 83 | 0.0% |
| Ukrainian | 1,936 | 0.3% |
| Uruguayan | 116 | 0.0% |
| Venezuelan | 1,751 | 0.3% |
| Vietnamese | 484 | 0.1% |
| Welsh | 1,891 | 0.3% |
| West Indian | 1,926 | 0.3% |
| Yugoslavian | 139 | 0.0% |
| Zimbabwean | 52 | 0.0% | View All 164 Rows |
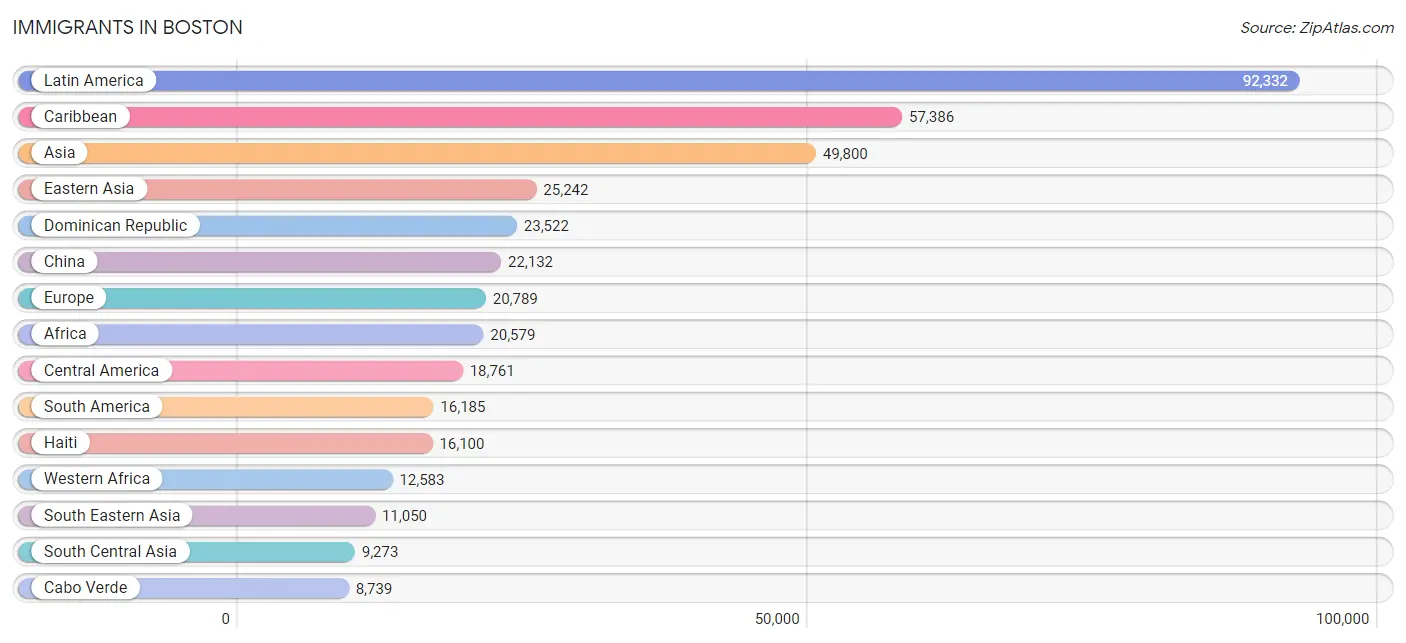
Immigrants in Boston
The most numerous immigrant groups reported in Boston came from Latin America (92,332 | 13.9%), Caribbean (57,386 | 8.6%), Asia (49,800 | 7.5%), Eastern Asia (25,242 | 3.8%), and Dominican Republic (23,522 | 3.5%), together accounting for 37.3% of all Boston residents.
| Immigration Origin | # Population | % Population |
| Afghanistan | 98 | 0.0% |
| Africa | 20,579 | 3.1% |
| Albania | 1,399 | 0.2% |
| Argentina | 393 | 0.1% |
| Armenia | 60 | 0.0% |
| Asia | 49,800 | 7.5% |
| Australia | 386 | 0.1% |
| Austria | 80 | 0.0% |
| Azores | 46 | 0.0% |
| Bahamas | 66 | 0.0% |
| Bangladesh | 548 | 0.1% |
| Barbados | 1,524 | 0.2% |
| Belarus | 317 | 0.1% |
| Belgium | 154 | 0.0% |
| Belize | 41 | 0.0% |
| Bolivia | 183 | 0.0% |
| Bosnia and Herzegovina | 102 | 0.0% |
| Brazil | 4,093 | 0.6% |
| Bulgaria | 256 | 0.0% |
| Cabo Verde | 8,739 | 1.3% |
| Cambodia | 448 | 0.1% |
| Cameroon | 173 | 0.0% |
| Canada | 2,584 | 0.4% |
| Caribbean | 57,386 | 8.6% |
| Central America | 18,761 | 2.8% |
| Chile | 509 | 0.1% |
| China | 22,132 | 3.3% |
| Colombia | 7,118 | 1.1% |
| Congo | 12 | 0.0% |
| Costa Rica | 649 | 0.1% |
| Croatia | 89 | 0.0% |
| Cuba | 916 | 0.1% |
| Czechoslovakia | 313 | 0.1% |
| Denmark | 169 | 0.0% |
| Dominica | 1,001 | 0.2% |
| Dominican Republic | 23,522 | 3.5% |
| Eastern Africa | 3,950 | 0.6% |
| Eastern Asia | 25,242 | 3.8% |
| Eastern Europe | 7,791 | 1.2% |
| Ecuador | 927 | 0.1% |
| Egypt | 293 | 0.0% |
| El Salvador | 7,474 | 1.1% |
| England | 670 | 0.1% |
| Eritrea | 112 | 0.0% |
| Ethiopia | 1,520 | 0.2% |
| Europe | 20,789 | 3.1% |
| France | 1,217 | 0.2% |
| Germany | 1,469 | 0.2% |
| Ghana | 765 | 0.1% |
| Greece | 1,125 | 0.2% |
| Grenada | 338 | 0.1% |
| Guatemala | 3,439 | 0.5% |
| Guyana | 616 | 0.1% |
| Haiti | 16,100 | 2.4% |
| Honduras | 2,776 | 0.4% |
| Hong Kong | 1,104 | 0.2% |
| Hungary | 183 | 0.0% |
| India | 6,199 | 0.9% |
| Indonesia | 270 | 0.0% |
| Iran | 1,252 | 0.2% |
| Iraq | 80 | 0.0% |
| Ireland | 2,087 | 0.3% |
| Israel | 643 | 0.1% |
| Italy | 1,595 | 0.2% |
| Jamaica | 7,695 | 1.2% |
| Japan | 686 | 0.1% |
| Jordan | 116 | 0.0% |
| Kazakhstan | 132 | 0.0% |
| Kenya | 947 | 0.1% |
| Korea | 2,406 | 0.4% |
| Kuwait | 506 | 0.1% |
| Laos | 43 | 0.0% |
| Latin America | 92,332 | 13.9% |
| Latvia | 131 | 0.0% |
| Lebanon | 308 | 0.1% |
| Liberia | 121 | 0.0% |
| Lithuania | 60 | 0.0% |
| Malaysia | 207 | 0.0% |
| Mexico | 2,382 | 0.4% |
| Middle Africa | 801 | 0.1% |
| Moldova | 65 | 0.0% |
| Morocco | 1,005 | 0.2% |
| Nepal | 193 | 0.0% |
| Netherlands | 234 | 0.0% |
| Nicaragua | 170 | 0.0% |
| Nigeria | 1,661 | 0.3% |
| North Macedonia | 21 | 0.0% |
| Northern Africa | 1,961 | 0.3% |
| Northern Europe | 5,047 | 0.8% |
| Norway | 42 | 0.0% |
| Oceania | 573 | 0.1% |
| Pakistan | 610 | 0.1% |
| Panama | 436 | 0.1% |
| Peru | 1,042 | 0.2% |
| Philippines | 1,383 | 0.2% |
| Poland | 760 | 0.1% |
| Portugal | 621 | 0.1% |
| Romania | 453 | 0.1% |
| Russia | 2,014 | 0.3% |
| Saudi Arabia | 327 | 0.1% |
| Scotland | 186 | 0.0% |
| Senegal | 32 | 0.0% |
| Serbia | 152 | 0.0% |
| Sierra Leone | 551 | 0.1% |
| Singapore | 240 | 0.0% |
| Somalia | 864 | 0.1% |
| South Africa | 581 | 0.1% |
| South America | 16,185 | 2.4% |
| South Central Asia | 9,273 | 1.4% |
| South Eastern Asia | 11,050 | 1.7% |
| Southern Europe | 4,423 | 0.7% |
| Spain | 1,082 | 0.2% |
| Sri Lanka | 134 | 0.0% |
| St. Vincent and the Grenadines | 174 | 0.0% |
| Sudan | 94 | 0.0% |
| Sweden | 286 | 0.0% |
| Switzerland | 278 | 0.0% |
| Syria | 156 | 0.0% |
| Taiwan | 975 | 0.2% |
| Thailand | 456 | 0.1% |
| Trinidad and Tobago | 4,459 | 0.7% |
| Turkey | 976 | 0.2% |
| Uganda | 156 | 0.0% |
| Ukraine | 1,076 | 0.2% |
| Uruguay | 3 | 0.0% |
| Uzbekistan | 54 | 0.0% |
| Venezuela | 1,193 | 0.2% |
| Vietnam | 7,694 | 1.2% |
| West Indies | 209 | 0.0% |
| Western Africa | 12,583 | 1.9% |
| Western Asia | 4,109 | 0.6% |
| Western Europe | 3,432 | 0.5% |
| Yemen | 223 | 0.0% |
| Zaire | 118 | 0.0% |
| Zimbabwe | 48 | 0.0% | View All 135 Rows |
Sex and Age in Boston
Sex and Age in Boston
The most populous age groups in Boston are 25 to 29 Years (41,976 | 13.1%) for men and 25 to 29 Years (43,817 | 12.7%) for women.
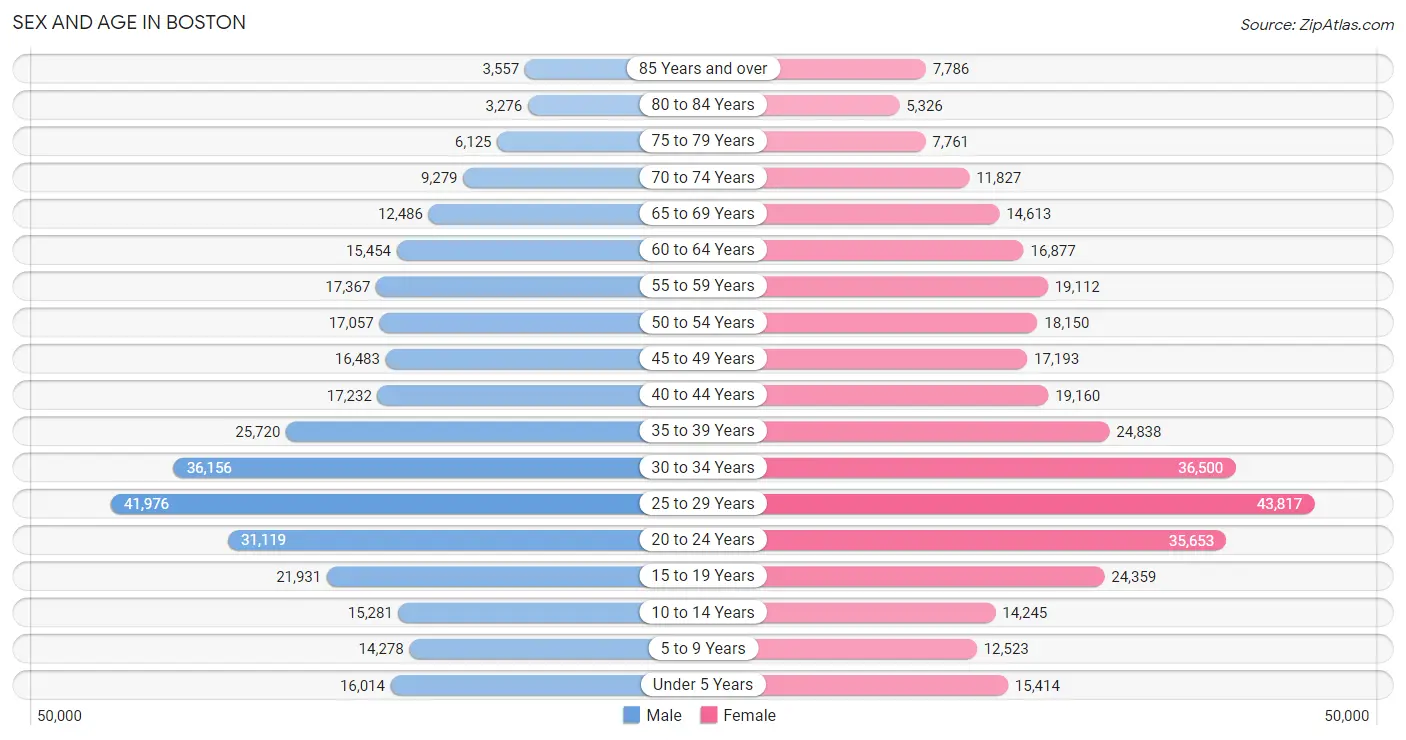
| Age Bracket | Male | Female |
| Under 5 Years | 16,014 (5.0%) | 15,414 (4.5%) |
| 5 to 9 Years | 14,278 (4.4%) | 12,523 (3.6%) |
| 10 to 14 Years | 15,281 (4.8%) | 14,245 (4.1%) |
| 15 to 19 Years | 21,931 (6.8%) | 24,359 (7.1%) |
| 20 to 24 Years | 31,119 (9.7%) | 35,653 (10.3%) |
| 25 to 29 Years | 41,976 (13.1%) | 43,817 (12.7%) |
| 30 to 34 Years | 36,156 (11.3%) | 36,500 (10.6%) |
| 35 to 39 Years | 25,720 (8.0%) | 24,838 (7.2%) |
| 40 to 44 Years | 17,232 (5.4%) | 19,160 (5.6%) |
| 45 to 49 Years | 16,483 (5.1%) | 17,193 (5.0%) |
| 50 to 54 Years | 17,057 (5.3%) | 18,150 (5.3%) |
| 55 to 59 Years | 17,367 (5.4%) | 19,112 (5.5%) |
| 60 to 64 Years | 15,454 (4.8%) | 16,877 (4.9%) |
| 65 to 69 Years | 12,486 (3.9%) | 14,613 (4.2%) |
| 70 to 74 Years | 9,279 (2.9%) | 11,827 (3.4%) |
| 75 to 79 Years | 6,125 (1.9%) | 7,761 (2.2%) |
| 80 to 84 Years | 3,276 (1.0%) | 5,326 (1.5%) |
| 85 Years and over | 3,557 (1.1%) | 7,786 (2.3%) |
| Total | 320,791 (100.0%) | 345,154 (100.0%) |
Families and Households in Boston
Median Family Size in Boston
The median family size in Boston is 3.05 persons per family, with single female/mother families (38,957 | 30.3%) accounting for the largest median family size of 3.1 persons per family. On the other hand, single male/father families (11,318 | 8.8%) represent the smallest median family size with 2.64 persons per family.
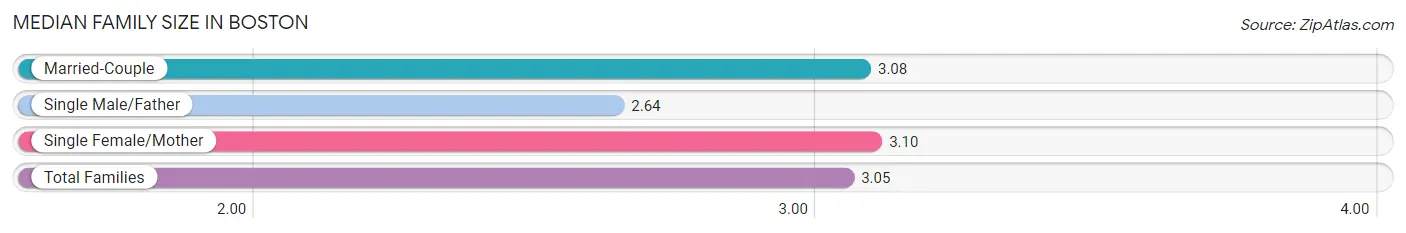
| Family Type | # Families | Family Size |
| Married-Couple | 78,195 (60.9%) | 3.08 |
| Single Male/Father | 11,318 (8.8%) | 2.64 |
| Single Female/Mother | 38,957 (30.3%) | 3.10 |
| Total Families | 128,470 (100.0%) | 3.05 |
Median Household Size in Boston
The median household size in Boston is 2.26 persons per household, with single female/mother households (38,957 | 14.1%) accounting for the largest median household size of 3.28 persons per household. non-family households (147,583 | 53.5%) represent the smallest median household size with 1.47 persons per household.
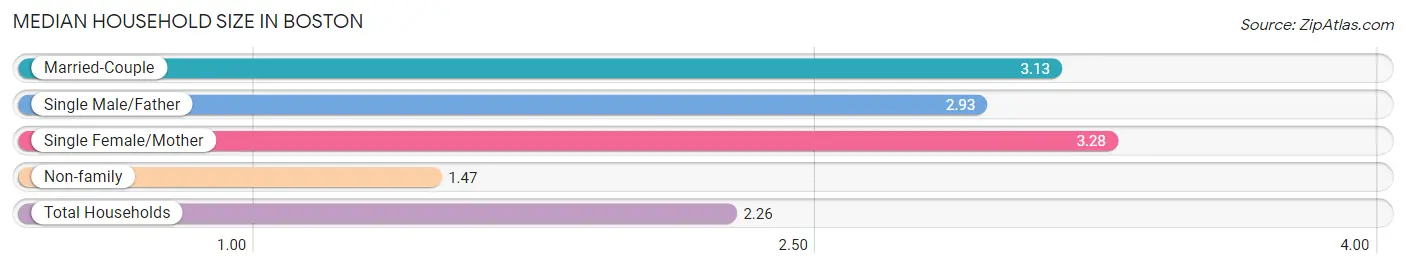
| Household Type | # Households | Household Size |
| Married-Couple | 78,195 (28.3%) | 3.13 |
| Single Male/Father | 11,318 (4.1%) | 2.93 |
| Single Female/Mother | 38,957 (14.1%) | 3.28 |
| Non-family | 147,583 (53.5%) | 1.47 |
| Total Households | 276,053 (100.0%) | 2.26 |
Household Size by Marriage Status in Boston
Out of a total of 276,053 households in Boston, 128,470 (46.5%) are family households, while 147,583 (53.5%) are nonfamily households. The most numerous type of family households are 2-person households, comprising 57,620, and the most common type of nonfamily households are 1-person households, comprising 100,853.
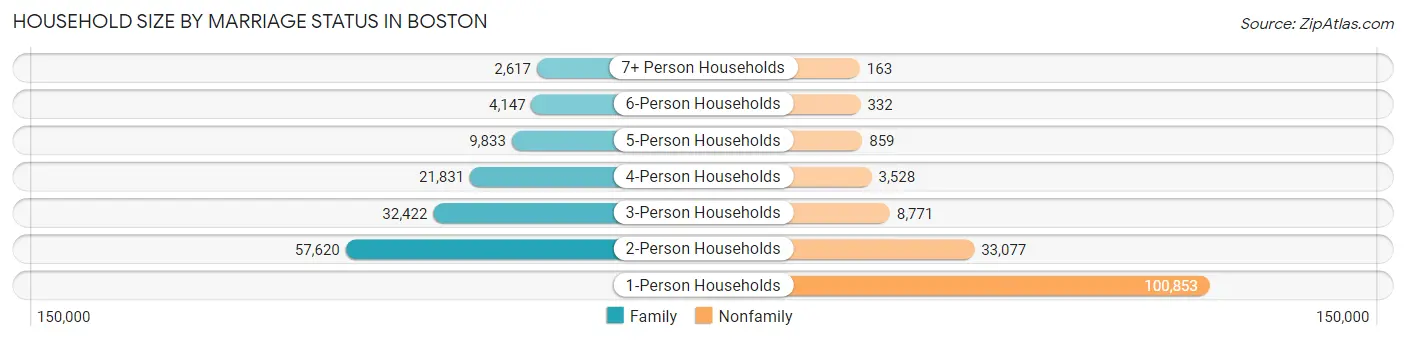
| Household Size | Family Households | Nonfamily Households |
| 1-Person Households | - | 100,853 (36.5%) |
| 2-Person Households | 57,620 (20.9%) | 33,077 (12.0%) |
| 3-Person Households | 32,422 (11.7%) | 8,771 (3.2%) |
| 4-Person Households | 21,831 (7.9%) | 3,528 (1.3%) |
| 5-Person Households | 9,833 (3.6%) | 859 (0.3%) |
| 6-Person Households | 4,147 (1.5%) | 332 (0.1%) |
| 7+ Person Households | 2,617 (0.9%) | 163 (0.1%) |
| Total | 128,470 (46.5%) | 147,583 (53.5%) |
Female Fertility in Boston
Fertility by Age in Boston
Average fertility rate in Boston is 33.0 births per 1,000 women. Women in the age bracket of 20 to 34 years have the highest fertility rate with 37.0 births per 1,000 women. Women in the age bracket of 20 to 34 years acount for 63.6% of all women with births.
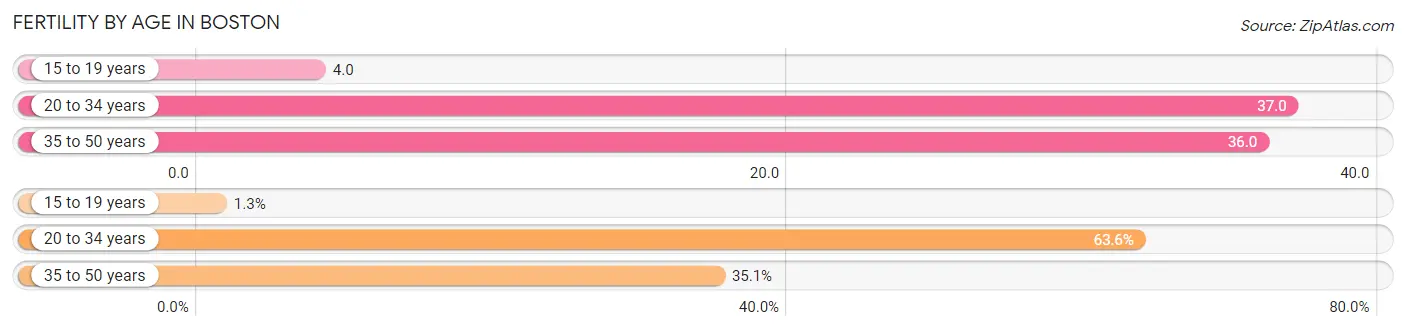
| Age Bracket | Women with Births | Births / 1,000 Women |
| 15 to 19 years | 86 (1.3%) | 4.0 |
| 20 to 34 years | 4,263 (63.6%) | 37.0 |
| 35 to 50 years | 2,350 (35.1%) | 36.0 |
| Total | 6,699 (100.0%) | 33.0 |
Fertility by Age by Marriage Status in Boston
68.5% of women with births (6,699) in Boston are married. The highest percentage of unmarried women with births falls into 15 to 19 years age bracket with 100.0% of them unmarried at the time of birth, while the lowest percentage of unmarried women with births belong to 35 to 50 years age bracket with 28.3% of them unmarried.
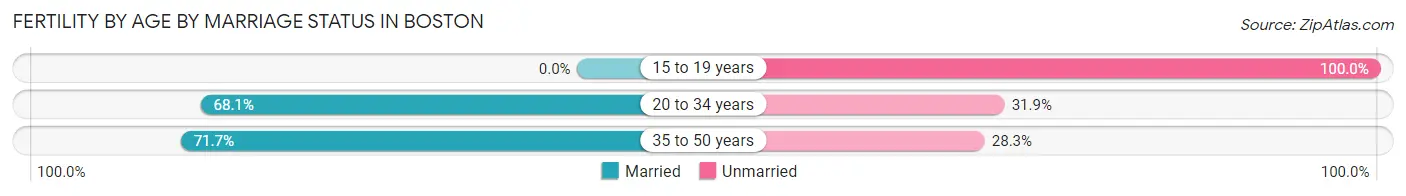
| Age Bracket | Married | Unmarried |
| 15 to 19 years | 0 (0.0%) | 86 (100.0%) |
| 20 to 34 years | 2,903 (68.1%) | 1,360 (31.9%) |
| 35 to 50 years | 1,685 (71.7%) | 665 (28.3%) |
| Total | 4,589 (68.5%) | 2,110 (31.5%) |
Fertility by Education in Boston
Average fertility rate in Boston is 33.0 births per 1,000 women. Women with the education attainment of graduate degree have the highest fertility rate of 45.0 births per 1,000 women, while women with the education attainment of college or associate's degree have the lowest fertility at 22.0 births per 1,000 women. Women with the education attainment of graduate degree represent 30.8% of all women with births.
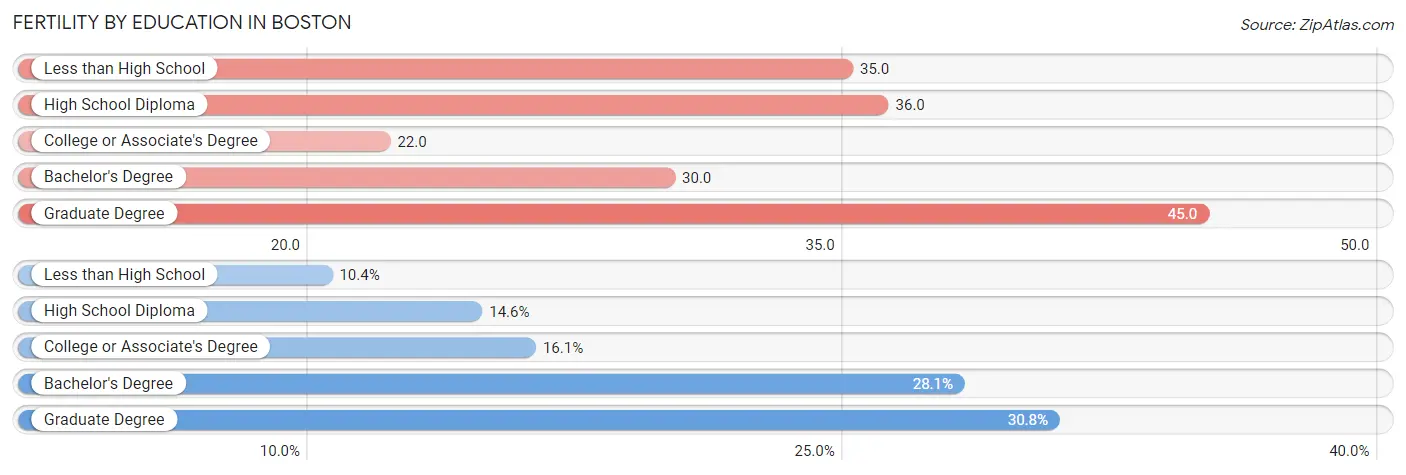
| Educational Attainment | Women with Births | Births / 1,000 Women |
| Less than High School | 695 (10.4%) | 35.0 |
| High School Diploma | 977 (14.6%) | 36.0 |
| College or Associate's Degree | 1,078 (16.1%) | 22.0 |
| Bachelor's Degree | 1,885 (28.1%) | 30.0 |
| Graduate Degree | 2,064 (30.8%) | 45.0 |
| Total | 6,699 (100.0%) | 33.0 |
Fertility by Education by Marriage Status in Boston
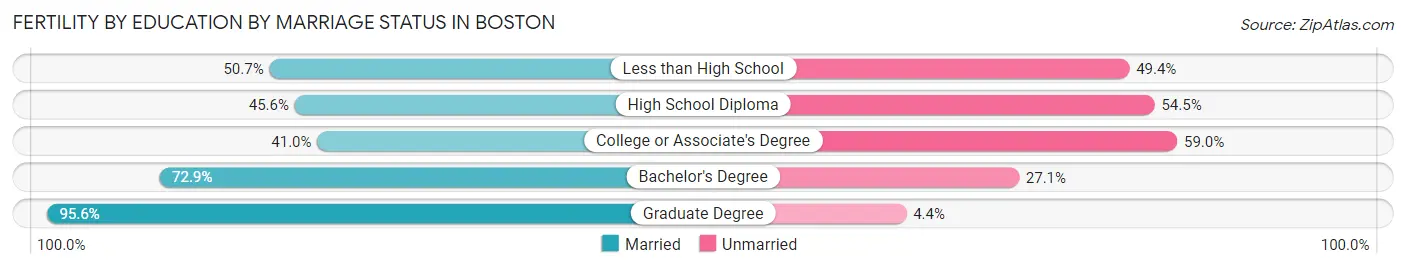
31.5% of women with births in Boston are unmarried. Women with the educational attainment of graduate degree are most likely to be married with 95.6% of them married at childbirth, while women with the educational attainment of college or associate's degree are least likely to be married with 59.0% of them unmarried at childbirth.
| Educational Attainment | Married | Unmarried |
| Less than High School | 352 (50.6%) | 343 (49.3%) |
| High School Diploma | 445 (45.6%) | 532 (54.4%) |
| College or Associate's Degree | 442 (41.0%) | 636 (59.0%) |
| Bachelor's Degree | 1,374 (72.9%) | 511 (27.1%) |
| Graduate Degree | 1,973 (95.6%) | 91 (4.4%) |
| Total | 4,589 (68.5%) | 2,110 (31.5%) |
Employment Characteristics in Boston
Employment by Class of Employer in Boston
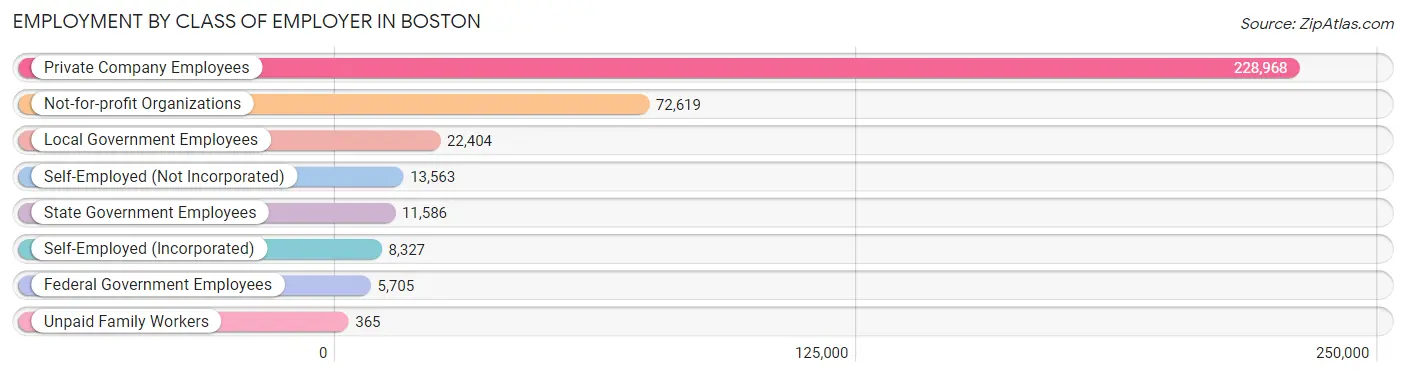
Among the 363,537 employed individuals in Boston, private company employees (228,968 | 63.0%), not-for-profit organizations (72,619 | 20.0%), and local government employees (22,404 | 6.2%) make up the most common classes of employment.
| Employer Class | # Employees | % Employees |
| Private Company Employees | 228,968 | 63.0% |
| Self-Employed (Incorporated) | 8,327 | 2.3% |
| Self-Employed (Not Incorporated) | 13,563 | 3.7% |
| Not-for-profit Organizations | 72,619 | 20.0% |
| Local Government Employees | 22,404 | 6.2% |
| State Government Employees | 11,586 | 3.2% |
| Federal Government Employees | 5,705 | 1.6% |
| Unpaid Family Workers | 365 | 0.1% |
| Total | 363,537 | 100.0% |
Employment Status by Age in Boston
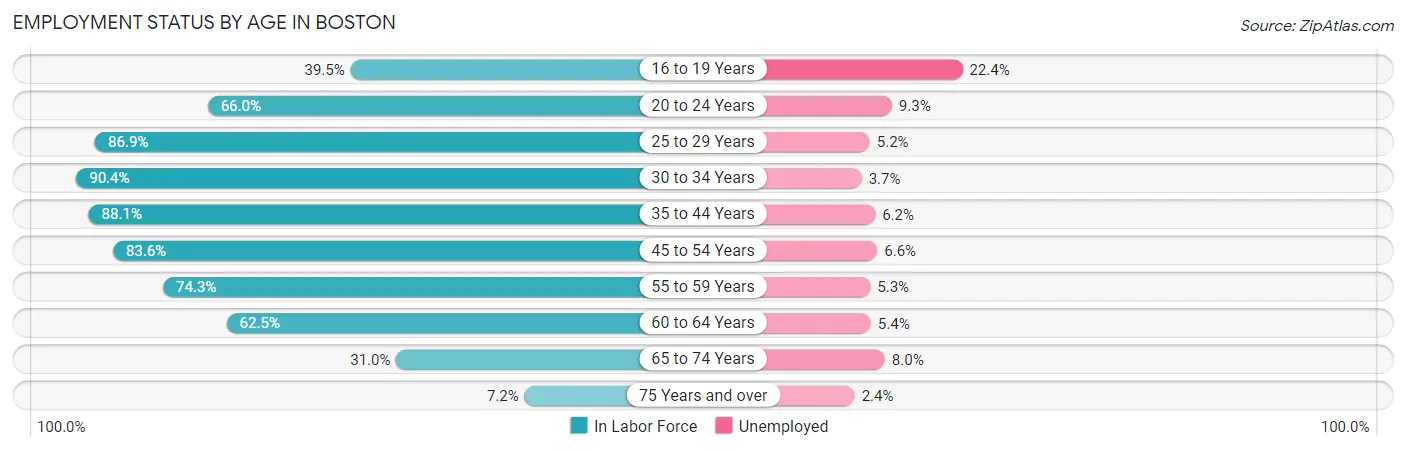
According to the labor force statistics for Boston, out of the total population over 16 years of age (572,185), 69.7% or 398,813 individuals are in the labor force, with 6.6% or 26,322 of them unemployed. The age group with the highest labor force participation rate is 30 to 34 years, with 90.4% or 65,681 individuals in the labor force. Within the labor force, the 16 to 19 years age range has the highest percentage of unemployed individuals, with 22.4% or 3,565 of them being unemployed.
| Age Bracket | In Labor Force | Unemployed |
| 16 to 19 Years | 15,913 (39.5%) | 3,565 (22.4%) |
| 20 to 24 Years | 44,070 (66.0%) | 4,099 (9.3%) |
| 25 to 29 Years | 74,554 (86.9%) | 3,877 (5.2%) |
| 30 to 34 Years | 65,681 (90.4%) | 2,430 (3.7%) |
| 35 to 44 Years | 76,603 (88.1%) | 4,749 (6.2%) |
| 45 to 54 Years | 57,586 (83.6%) | 3,801 (6.6%) |
| 55 to 59 Years | 27,104 (74.3%) | 1,437 (5.3%) |
| 60 to 64 Years | 20,207 (62.5%) | 1,091 (5.4%) |
| 65 to 74 Years | 14,944 (31.0%) | 1,196 (8.0%) |
| 75 Years and over | 2,436 (7.2%) | 58 (2.4%) |
| Total | 398,813 (69.7%) | 26,322 (6.6%) |
Employment Status by Educational Attainment in Boston
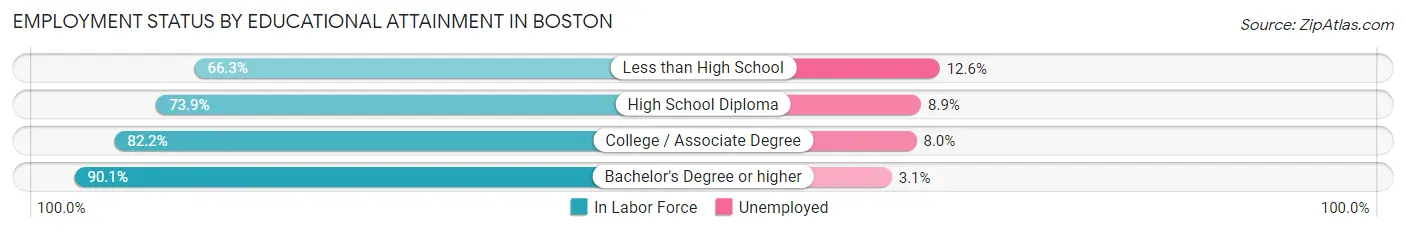
According to labor force statistics for Boston, 84.0% of individuals (321,797) out of the total population between 25 and 64 years of age (383,092) are in the labor force, with 5.4% or 17,377 of them being unemployed. The group with the highest labor force participation rate are those with the educational attainment of bachelor's degree or higher, with 90.1% or 199,098 individuals in the labor force. Within the labor force, individuals with less than high school education have the highest percentage of unemployment, with 12.6% or 2,836 of them being unemployed.
| Educational Attainment | In Labor Force | Unemployed |
| Less than High School | 22,504 (66.3%) | 4,277 (12.6%) |
| High School Diploma | 46,802 (73.9%) | 5,636 (8.9%) |
| College / Associate Degree | 53,303 (82.2%) | 5,188 (8.0%) |
| Bachelor's Degree or higher | 199,098 (90.1%) | 6,850 (3.1%) |
| Total | 321,797 (84.0%) | 20,687 (5.4%) |
Employment Occupations by Sex in Boston
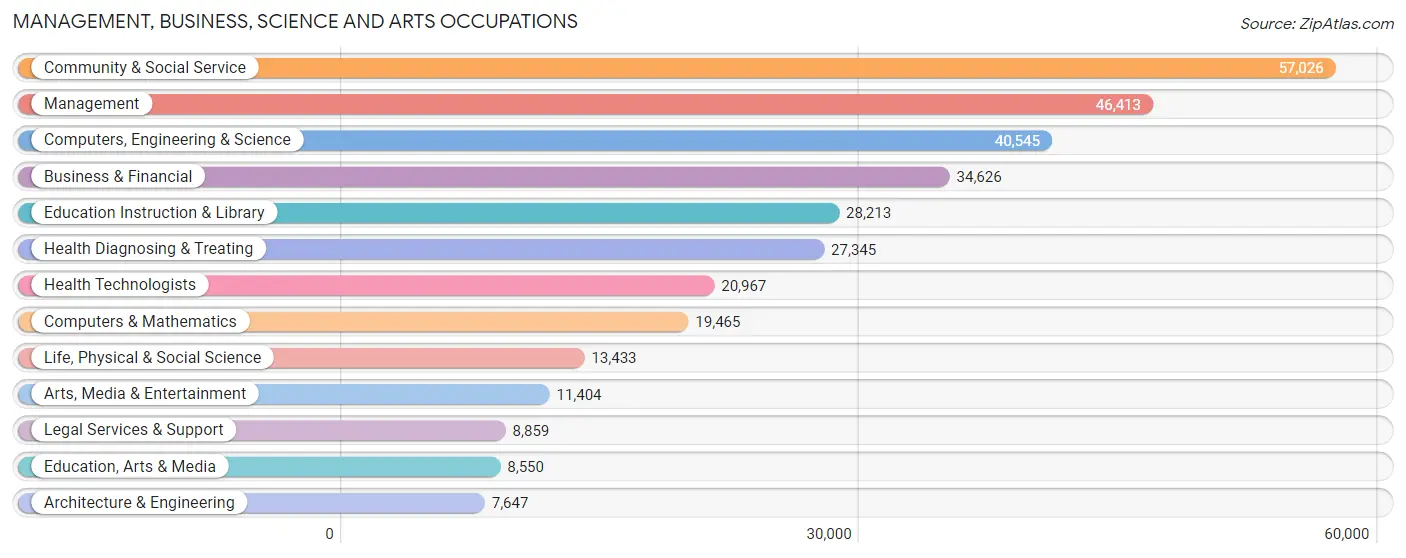
Management, Business, Science and Arts Occupations
The most common Management, Business, Science and Arts occupations in Boston are Community & Social Service (57,026 | 15.3%), Management (46,413 | 12.5%), Computers, Engineering & Science (40,545 | 10.9%), Business & Financial (34,626 | 9.3%), and Education Instruction & Library (28,213 | 7.6%).
Management, Business, Science and Arts Occupations by Sex
Within the Management, Business, Science and Arts occupations in Boston, the most male-oriented occupations are Architecture & Engineering (73.9%), Computers & Mathematics (68.4%), and Computers, Engineering & Science (64.3%), while the most female-oriented occupations are Health Technologists (71.7%), Health Diagnosing & Treating (71.3%), and Education, Arts & Media (69.8%).
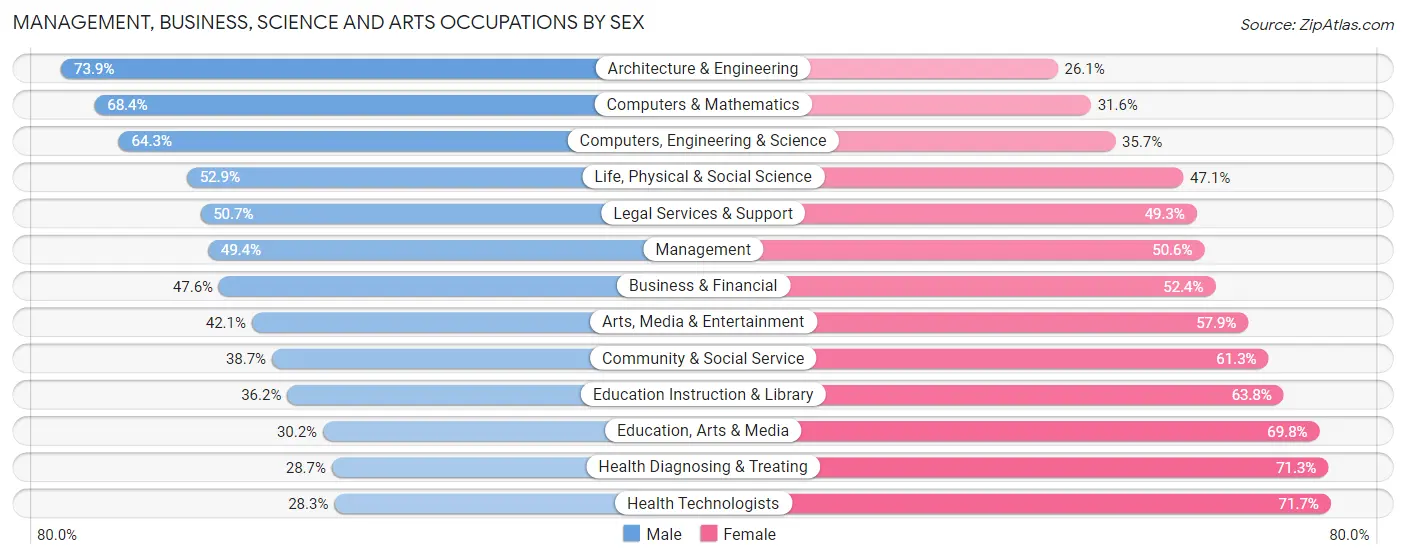
| Occupation | Male | Female |
| Management | 22,938 (49.4%) | 23,475 (50.6%) |
| Business & Financial | 16,470 (47.6%) | 18,156 (52.4%) |
| Computers, Engineering & Science | 26,072 (64.3%) | 14,473 (35.7%) |
| Computers & Mathematics | 13,309 (68.4%) | 6,156 (31.6%) |
| Architecture & Engineering | 5,651 (73.9%) | 1,996 (26.1%) |
| Life, Physical & Social Science | 7,112 (52.9%) | 6,321 (47.1%) |
| Community & Social Service | 22,078 (38.7%) | 34,948 (61.3%) |
| Education, Arts & Media | 2,583 (30.2%) | 5,967 (69.8%) |
| Legal Services & Support | 4,491 (50.7%) | 4,368 (49.3%) |
| Education Instruction & Library | 10,204 (36.2%) | 18,009 (63.8%) |
| Arts, Media & Entertainment | 4,800 (42.1%) | 6,604 (57.9%) |
| Health Diagnosing & Treating | 7,860 (28.7%) | 19,485 (71.3%) |
| Health Technologists | 5,940 (28.3%) | 15,027 (71.7%) |
| Total (Category) | 95,418 (46.3%) | 110,537 (53.7%) |
| Total (Overall) | 180,431 (48.4%) | 191,954 (51.5%) |
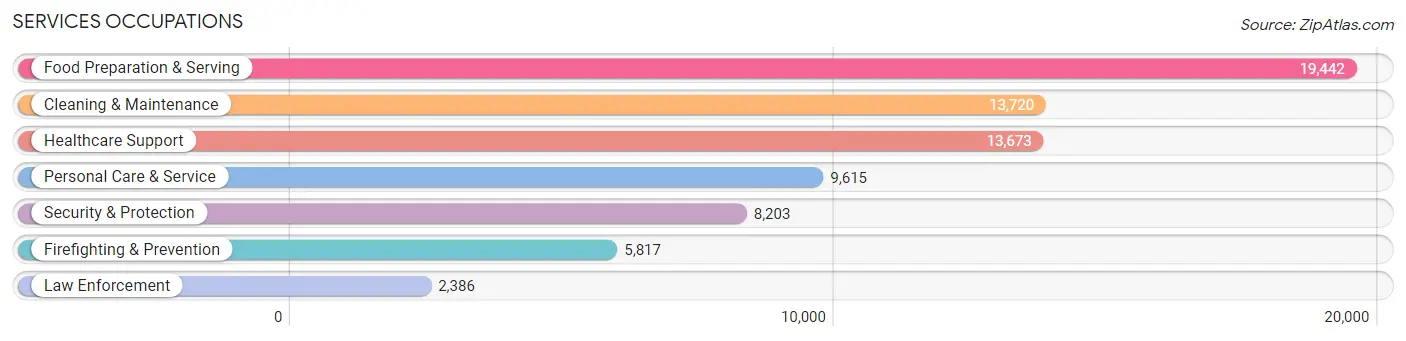
Services Occupations
The most common Services occupations in Boston are Food Preparation & Serving (19,442 | 5.2%), Cleaning & Maintenance (13,720 | 3.7%), Healthcare Support (13,673 | 3.7%), Personal Care & Service (9,615 | 2.6%), and Security & Protection (8,203 | 2.2%).
Services Occupations by Sex
Within the Services occupations in Boston, the most male-oriented occupations are Law Enforcement (82.1%), Security & Protection (77.7%), and Firefighting & Prevention (75.9%), while the most female-oriented occupations are Healthcare Support (87.7%), Personal Care & Service (69.1%), and Cleaning & Maintenance (47.6%).
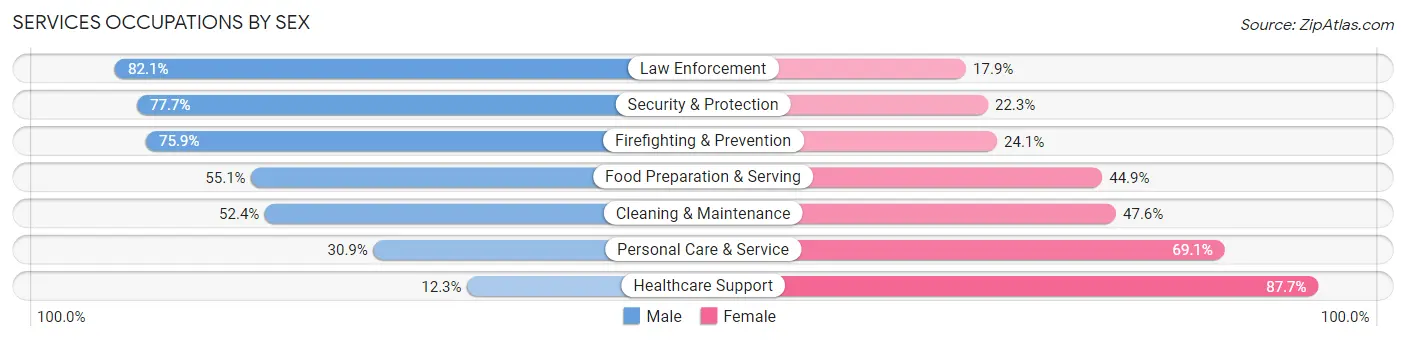
| Occupation | Male | Female |
| Healthcare Support | 1,685 (12.3%) | 11,988 (87.7%) |
| Security & Protection | 6,375 (77.7%) | 1,828 (22.3%) |
| Firefighting & Prevention | 4,417 (75.9%) | 1,400 (24.1%) |
| Law Enforcement | 1,958 (82.1%) | 428 (17.9%) |
| Food Preparation & Serving | 10,710 (55.1%) | 8,732 (44.9%) |
| Cleaning & Maintenance | 7,184 (52.4%) | 6,536 (47.6%) |
| Personal Care & Service | 2,970 (30.9%) | 6,645 (69.1%) |
| Total (Category) | 28,924 (44.7%) | 35,729 (55.3%) |
| Total (Overall) | 180,431 (48.4%) | 191,954 (51.5%) |
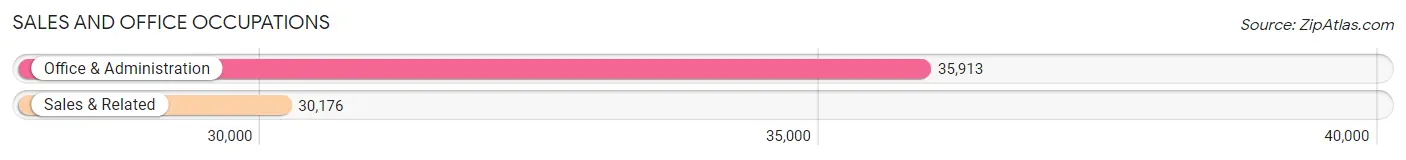
Sales and Office Occupations
The most common Sales and Office occupations in Boston are Office & Administration (35,913 | 9.6%), and Sales & Related (30,176 | 8.1%).
Sales and Office Occupations by Sex
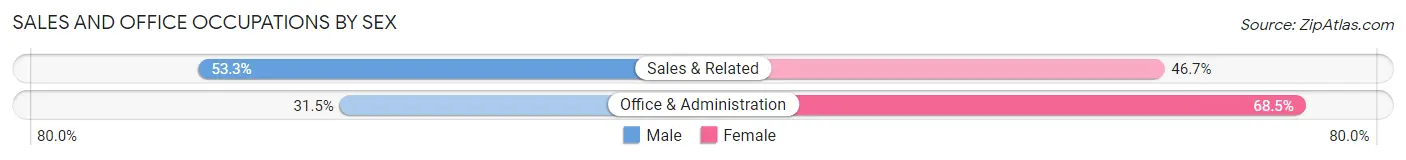
| Occupation | Male | Female |
| Sales & Related | 16,072 (53.3%) | 14,104 (46.7%) |
| Office & Administration | 11,322 (31.5%) | 24,591 (68.5%) |
| Total (Category) | 27,394 (41.4%) | 38,695 (58.6%) |
| Total (Overall) | 180,431 (48.4%) | 191,954 (51.5%) |
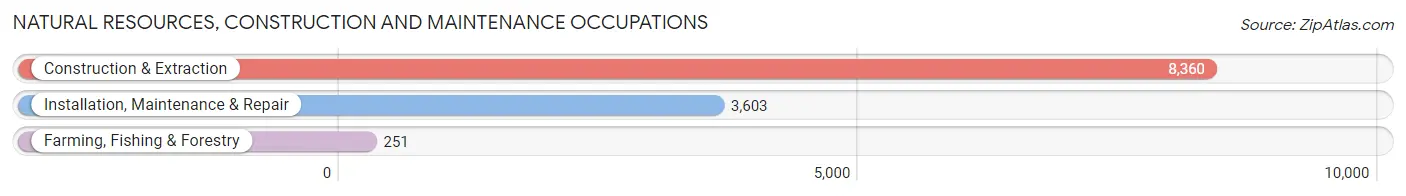
Natural Resources, Construction and Maintenance Occupations
The most common Natural Resources, Construction and Maintenance occupations in Boston are Construction & Extraction (8,360 | 2.2%), Installation, Maintenance & Repair (3,603 | 1.0%), and Farming, Fishing & Forestry (251 | 0.1%).
Natural Resources, Construction and Maintenance Occupations by Sex
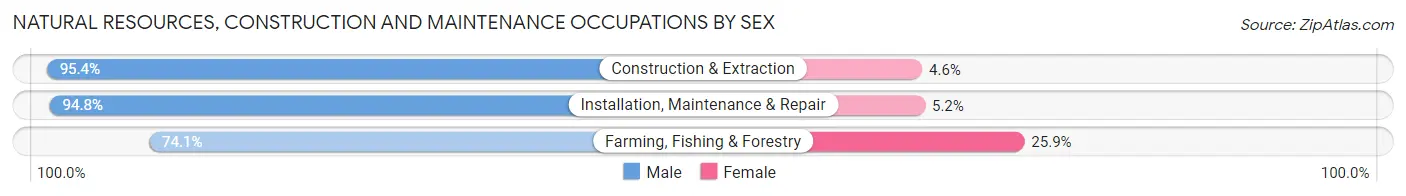
| Occupation | Male | Female |
| Farming, Fishing & Forestry | 186 (74.1%) | 65 (25.9%) |
| Construction & Extraction | 7,975 (95.4%) | 385 (4.6%) |
| Installation, Maintenance & Repair | 3,415 (94.8%) | 188 (5.2%) |
| Total (Category) | 11,576 (94.8%) | 638 (5.2%) |
| Total (Overall) | 180,431 (48.4%) | 191,954 (51.5%) |
Production, Transportation and Moving Occupations
The most common Production, Transportation and Moving occupations in Boston are Transportation (10,122 | 2.7%), Production (7,296 | 2.0%), and Material Moving (6,056 | 1.6%).
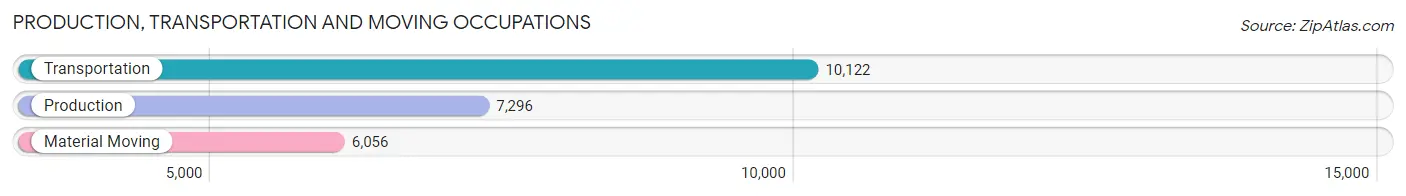
Production, Transportation and Moving Occupations by Sex
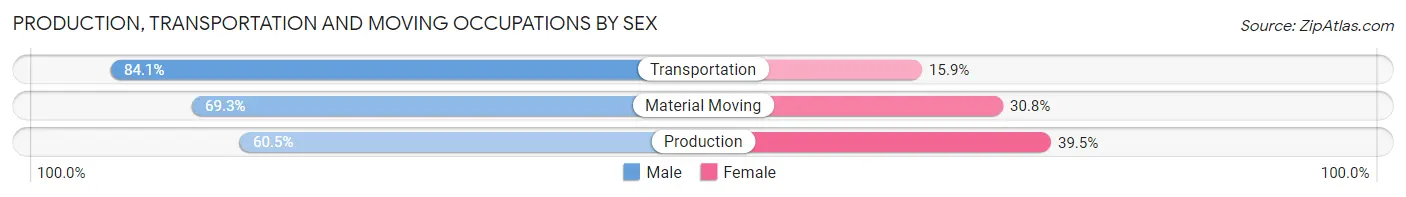
| Occupation | Male | Female |
| Production | 4,411 (60.5%) | 2,885 (39.5%) |
| Transportation | 8,514 (84.1%) | 1,608 (15.9%) |
| Material Moving | 4,194 (69.3%) | 1,862 (30.7%) |
| Total (Category) | 17,119 (72.9%) | 6,355 (27.1%) |
| Total (Overall) | 180,431 (48.4%) | 191,954 (51.5%) |
Employment Industries by Sex in Boston
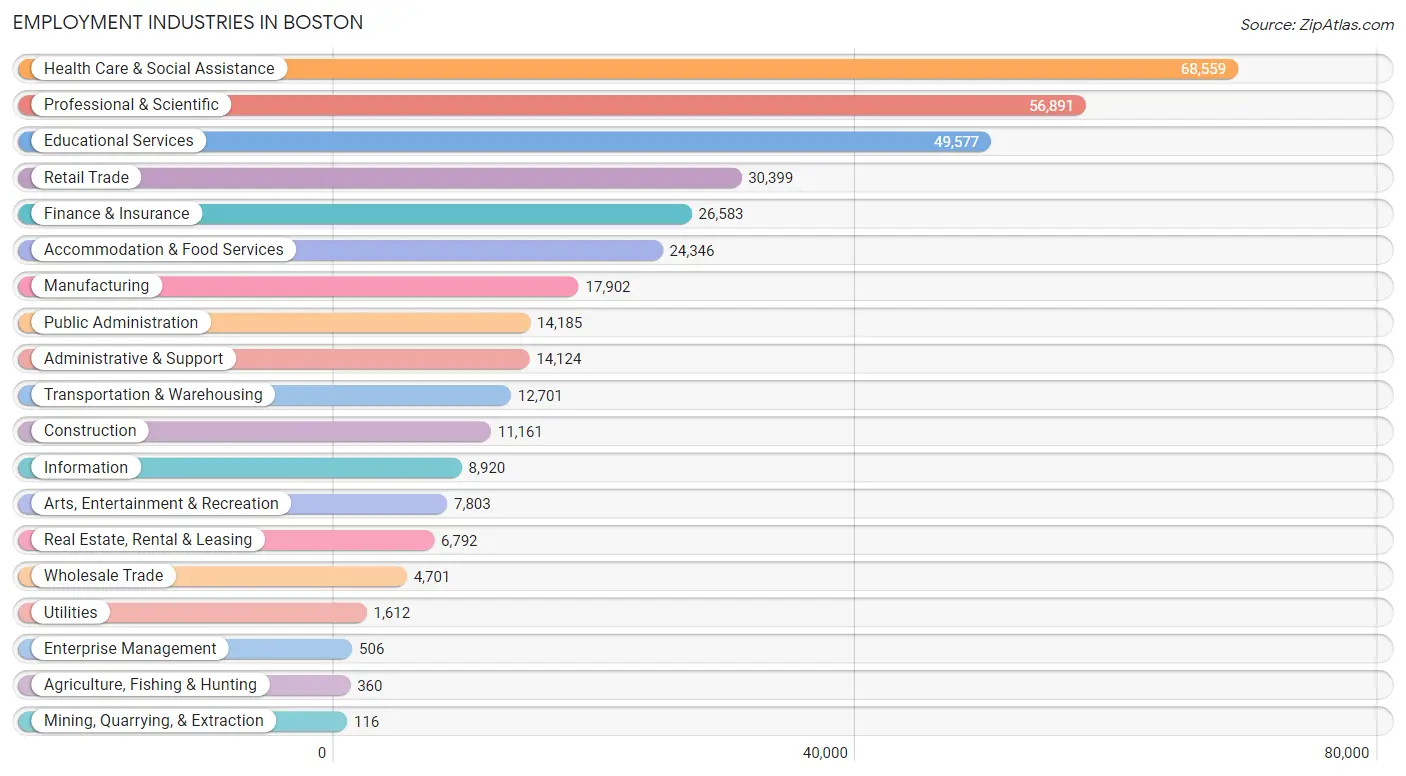
Employment Industries in Boston
The major employment industries in Boston include Health Care & Social Assistance (68,559 | 18.4%), Professional & Scientific (56,891 | 15.3%), Educational Services (49,577 | 13.3%), Retail Trade (30,399 | 8.2%), and Finance & Insurance (26,583 | 7.1%).
Employment Industries by Sex in Boston
The Boston industries that see more men than women are Mining, Quarrying, & Extraction (100.0%), Construction (87.3%), and Transportation & Warehousing (74.7%), whereas the industries that tend to have a higher number of women are Health Care & Social Assistance (73.4%), Educational Services (62.4%), and Retail Trade (50.7%).
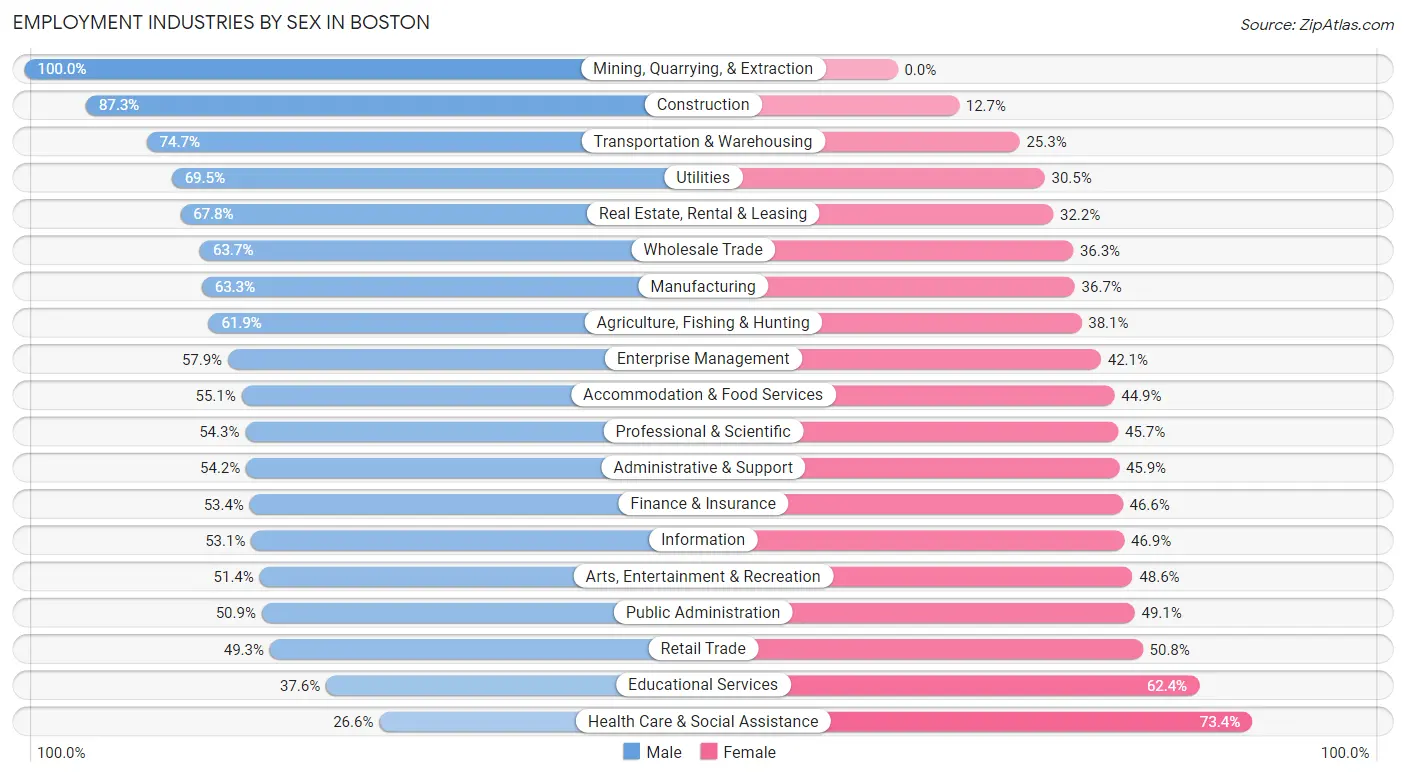
| Industry | Male | Female |
| Agriculture, Fishing & Hunting | 223 (61.9%) | 137 (38.1%) |
| Mining, Quarrying, & Extraction | 116 (100.0%) | 0 (0.0%) |
| Construction | 9,744 (87.3%) | 1,417 (12.7%) |
| Manufacturing | 11,336 (63.3%) | 6,566 (36.7%) |
| Wholesale Trade | 2,993 (63.7%) | 1,708 (36.3%) |
| Retail Trade | 14,973 (49.2%) | 15,426 (50.7%) |
| Transportation & Warehousing | 9,492 (74.7%) | 3,209 (25.3%) |
| Utilities | 1,121 (69.5%) | 491 (30.5%) |
| Information | 4,736 (53.1%) | 4,184 (46.9%) |
| Finance & Insurance | 14,199 (53.4%) | 12,384 (46.6%) |
| Real Estate, Rental & Leasing | 4,604 (67.8%) | 2,188 (32.2%) |
| Professional & Scientific | 30,907 (54.3%) | 25,984 (45.7%) |
| Enterprise Management | 293 (57.9%) | 213 (42.1%) |
| Administrative & Support | 7,648 (54.1%) | 6,476 (45.9%) |
| Educational Services | 18,640 (37.6%) | 30,937 (62.4%) |
| Health Care & Social Assistance | 18,238 (26.6%) | 50,321 (73.4%) |
| Arts, Entertainment & Recreation | 4,008 (51.4%) | 3,795 (48.6%) |
| Accommodation & Food Services | 13,412 (55.1%) | 10,934 (44.9%) |
| Public Administration | 7,223 (50.9%) | 6,962 (49.1%) |
| Total | 180,431 (48.4%) | 191,954 (51.5%) |
Education in Boston
School Enrollment in Boston
The most common levels of schooling among the 183,215 students in Boston are college / undergraduate (69,478 | 37.9%), graduate / professional (30,848 | 16.8%), and high school (23,939 | 13.1%).
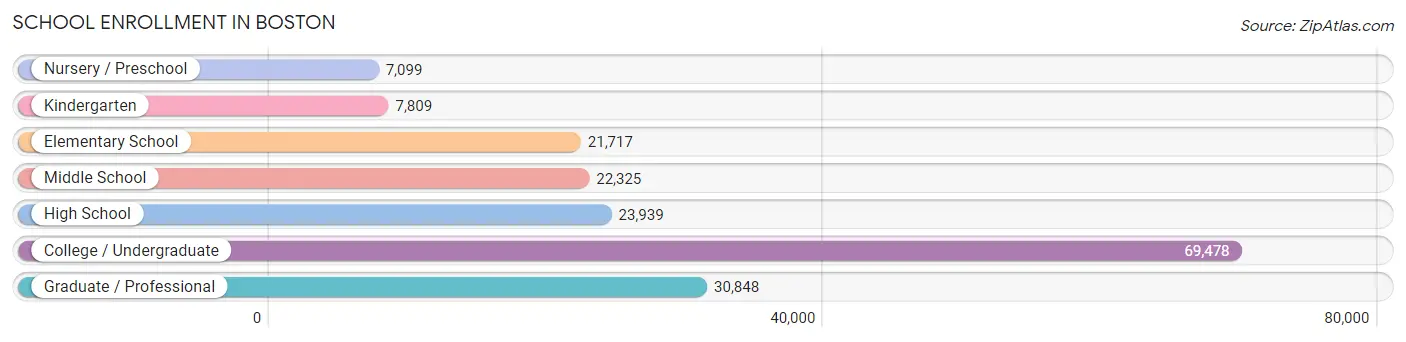
| School Level | # Students | % Students |
| Nursery / Preschool | 7,099 | 3.9% |
| Kindergarten | 7,809 | 4.3% |
| Elementary School | 21,717 | 11.8% |
| Middle School | 22,325 | 12.2% |
| High School | 23,939 | 13.1% |
| College / Undergraduate | 69,478 | 37.9% |
| Graduate / Professional | 30,848 | 16.8% |
| Total | 183,215 | 100.0% |
School Enrollment by Age by Funding Source in Boston
Out of a total of 183,215 students who are enrolled in schools in Boston, 90,875 (49.6%) attend a private institution, while the remaining 92,340 (50.4%) are enrolled in public schools. The age group of 20 to 24 year olds has the highest likelihood of being enrolled in private schools, with 32,445 (77.3% in the age bracket) enrolled. Conversely, the age group of 15 to 17 year olds has the lowest likelihood of being enrolled in a private school, with 13,614 (85.6% in the age bracket) attending a public institution.
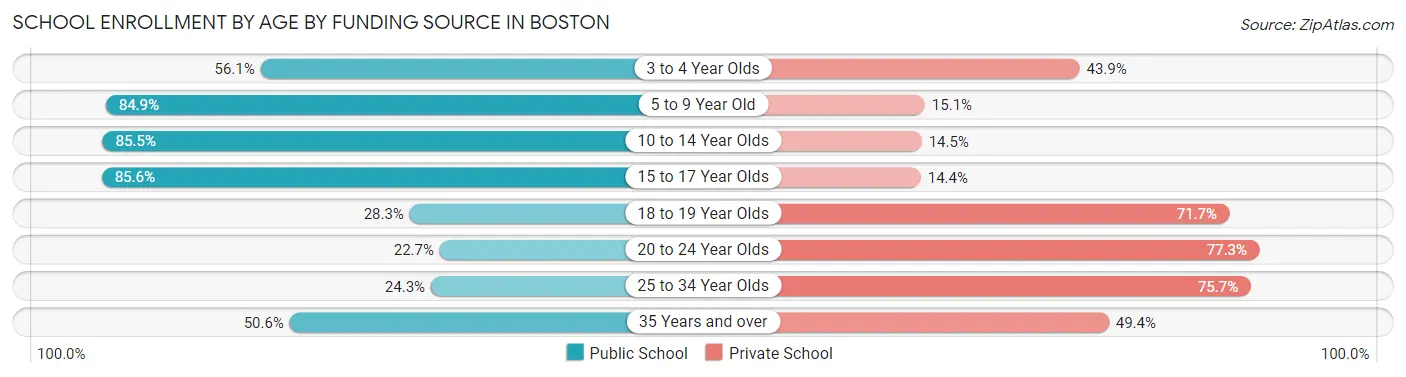
| Age Bracket | Public School | Private School |
| 3 to 4 Year Olds | 4,265 (56.1%) | 3,343 (43.9%) |
| 5 to 9 Year Old | 21,601 (84.9%) | 3,852 (15.1%) |
| 10 to 14 Year Olds | 24,624 (85.5%) | 4,185 (14.5%) |
| 15 to 17 Year Olds | 13,614 (85.6%) | 2,285 (14.4%) |
| 18 to 19 Year Olds | 7,830 (28.3%) | 19,868 (71.7%) |
| 20 to 24 Year Olds | 9,511 (22.7%) | 32,445 (77.3%) |
| 25 to 34 Year Olds | 6,726 (24.3%) | 20,935 (75.7%) |
| 35 Years and over | 4,116 (50.6%) | 4,015 (49.4%) |
| Total | 92,340 (50.4%) | 90,875 (49.6%) |
Educational Attainment by Field of Study in Boston
Business (46,226 | 16.8%), social sciences (35,744 | 13.0%), bio, nature & agricultural (23,809 | 8.7%), science & technology (21,400 | 7.8%), and engineering (20,519 | 7.5%) are the most common fields of study among 274,437 individuals in Boston who have obtained a bachelor's degree or higher.
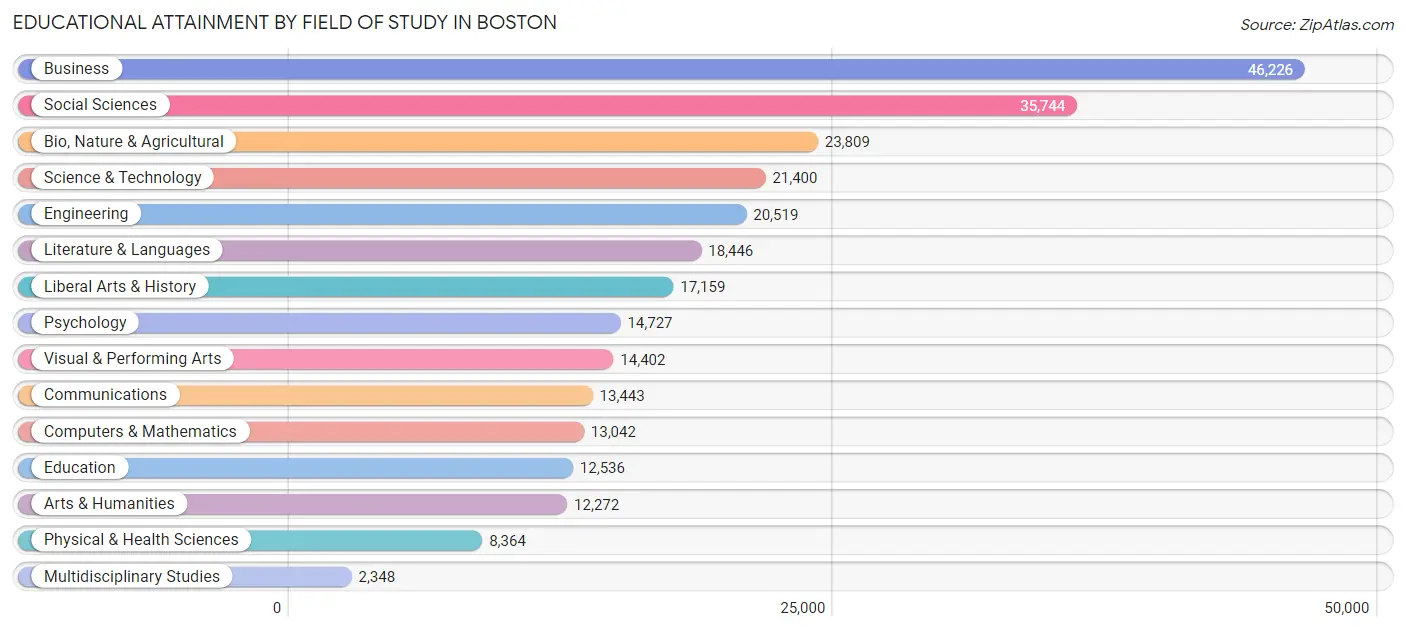
| Field of Study | # Graduates | % Graduates |
| Computers & Mathematics | 13,042 | 4.8% |
| Bio, Nature & Agricultural | 23,809 | 8.7% |
| Physical & Health Sciences | 8,364 | 3.0% |
| Psychology | 14,727 | 5.4% |
| Social Sciences | 35,744 | 13.0% |
| Engineering | 20,519 | 7.5% |
| Multidisciplinary Studies | 2,348 | 0.9% |
| Science & Technology | 21,400 | 7.8% |
| Business | 46,226 | 16.8% |
| Education | 12,536 | 4.6% |
| Literature & Languages | 18,446 | 6.7% |
| Liberal Arts & History | 17,159 | 6.2% |
| Visual & Performing Arts | 14,402 | 5.2% |
| Communications | 13,443 | 4.9% |
| Arts & Humanities | 12,272 | 4.5% |
| Total | 274,437 | 100.0% |
Transportation & Commute in Boston
Vehicle Availability by Sex in Boston
The most prevalent vehicle ownership categories in Boston are males with 1 vehicle (69,855, accounting for 40.8%) and females with 1 vehicle (75,431, making up 39.1%).
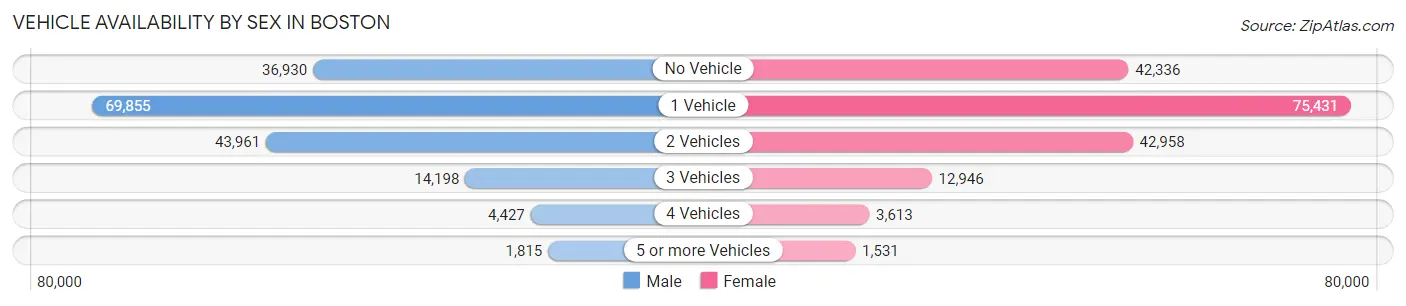
| Vehicles Available | Male | Female |
| No Vehicle | 36,930 (21.6%) | 42,336 (23.7%) |
| 1 Vehicle | 69,855 (40.8%) | 75,431 (42.2%) |
| 2 Vehicles | 43,961 (25.7%) | 42,958 (24.0%) |
| 3 Vehicles | 14,198 (8.3%) | 12,946 (7.2%) |
| 4 Vehicles | 4,427 (2.6%) | 3,613 (2.0%) |
| 5 or more Vehicles | 1,815 (1.1%) | 1,531 (0.9%) |
| Total | 171,186 (100.0%) | 178,815 (100.0%) |
Commute Time in Boston
The most frequently occuring commute durations in Boston are 30 to 34 minutes (59,744 commuters, 19.6%), 20 to 24 minutes (40,588 commuters, 13.3%), and 15 to 19 minutes (38,678 commuters, 12.7%).
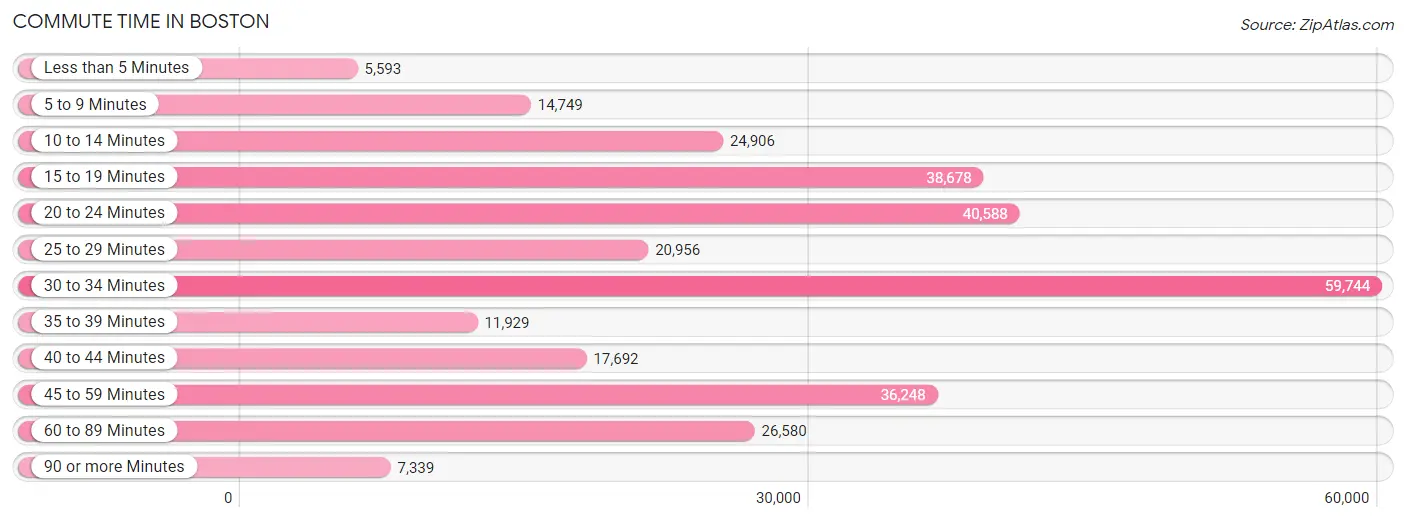
| Commute Time | # Commuters | % Commuters |
| Less than 5 Minutes | 5,593 | 1.8% |
| 5 to 9 Minutes | 14,749 | 4.8% |
| 10 to 14 Minutes | 24,906 | 8.2% |
| 15 to 19 Minutes | 38,678 | 12.7% |
| 20 to 24 Minutes | 40,588 | 13.3% |
| 25 to 29 Minutes | 20,956 | 6.9% |
| 30 to 34 Minutes | 59,744 | 19.6% |
| 35 to 39 Minutes | 11,929 | 3.9% |
| 40 to 44 Minutes | 17,692 | 5.8% |
| 45 to 59 Minutes | 36,248 | 11.9% |
| 60 to 89 Minutes | 26,580 | 8.7% |
| 90 or more Minutes | 7,339 | 2.4% |
Commute Time by Sex in Boston
The most common commute times in Boston are 30 to 34 minutes (29,511 commuters, 20.0%) for males and 30 to 34 minutes (30,233 commuters, 19.2%) for females.
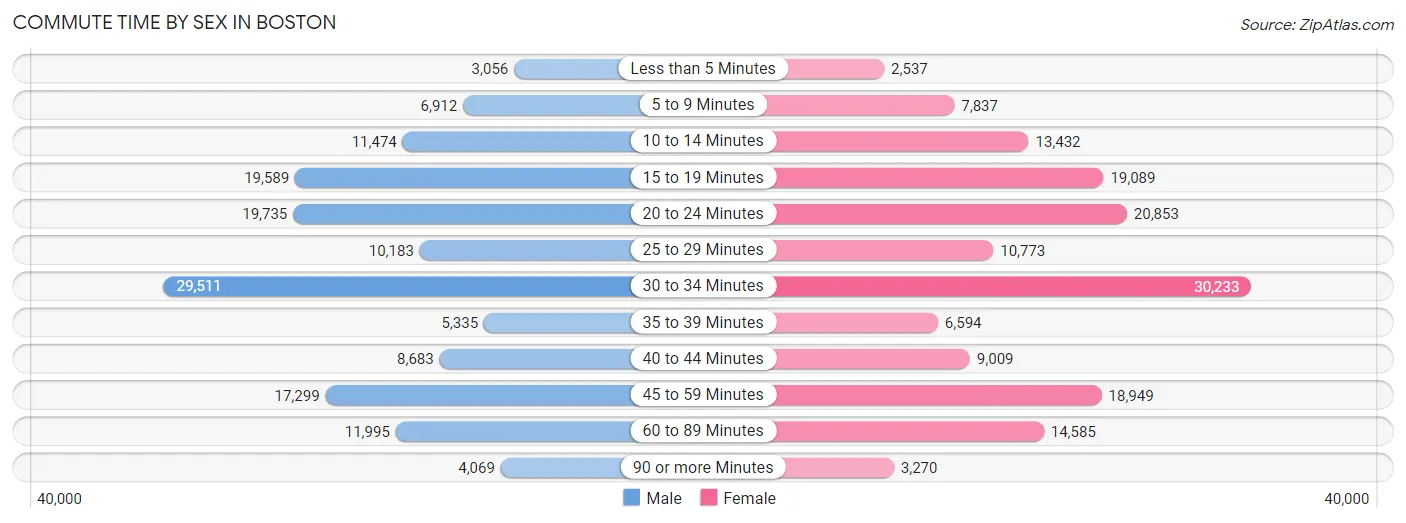
| Commute Time | Male | Female |
| Less than 5 Minutes | 3,056 (2.1%) | 2,537 (1.6%) |
| 5 to 9 Minutes | 6,912 (4.7%) | 7,837 (5.0%) |
| 10 to 14 Minutes | 11,474 (7.8%) | 13,432 (8.6%) |
| 15 to 19 Minutes | 19,589 (13.3%) | 19,089 (12.1%) |
| 20 to 24 Minutes | 19,735 (13.4%) | 20,853 (13.3%) |
| 25 to 29 Minutes | 10,183 (6.9%) | 10,773 (6.9%) |
| 30 to 34 Minutes | 29,511 (20.0%) | 30,233 (19.2%) |
| 35 to 39 Minutes | 5,335 (3.6%) | 6,594 (4.2%) |
| 40 to 44 Minutes | 8,683 (5.9%) | 9,009 (5.7%) |
| 45 to 59 Minutes | 17,299 (11.7%) | 18,949 (12.1%) |
| 60 to 89 Minutes | 11,995 (8.1%) | 14,585 (9.3%) |
| 90 or more Minutes | 4,069 (2.8%) | 3,270 (2.1%) |
Time of Departure to Work by Sex in Boston
The most frequent times of departure to work in Boston are 8:00 AM to 8:29 AM (23,544, 15.9%) for males and 8:00 AM to 8:29 AM (27,946, 17.8%) for females.
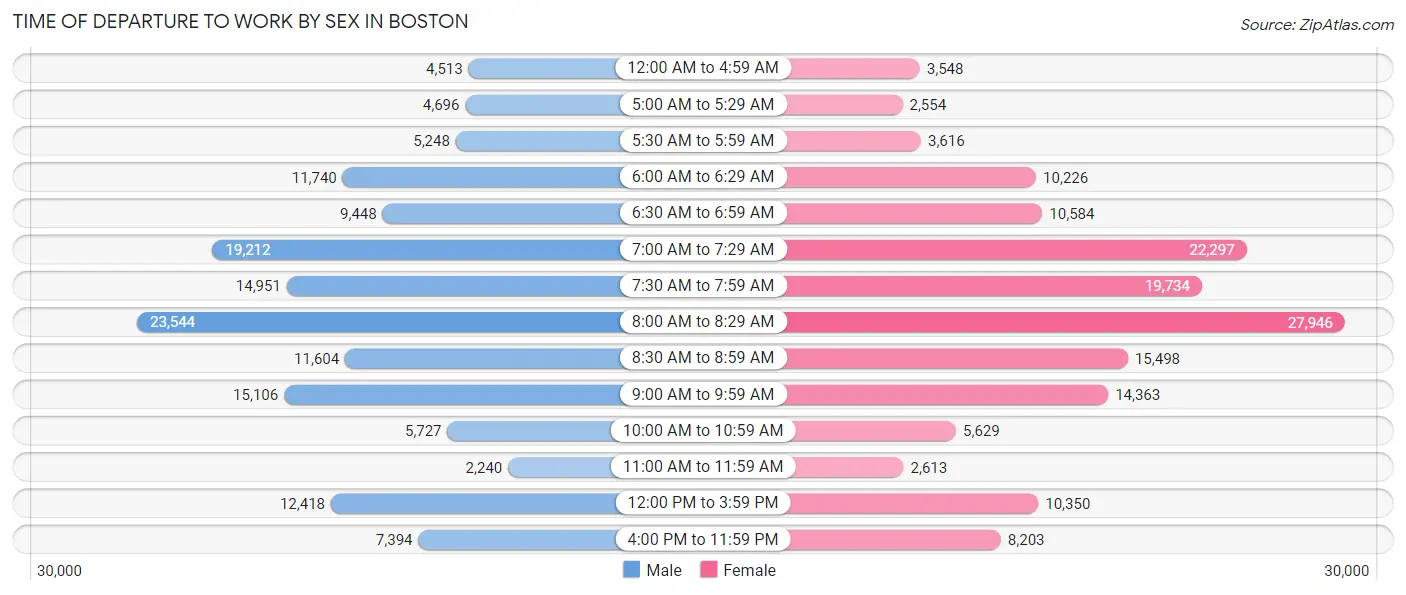
| Time of Departure | Male | Female |
| 12:00 AM to 4:59 AM | 4,513 (3.0%) | 3,548 (2.3%) |
| 5:00 AM to 5:29 AM | 4,696 (3.2%) | 2,554 (1.6%) |
| 5:30 AM to 5:59 AM | 5,248 (3.5%) | 3,616 (2.3%) |
| 6:00 AM to 6:29 AM | 11,740 (7.9%) | 10,226 (6.5%) |
| 6:30 AM to 6:59 AM | 9,448 (6.4%) | 10,584 (6.7%) |
| 7:00 AM to 7:29 AM | 19,212 (13.0%) | 22,297 (14.2%) |
| 7:30 AM to 7:59 AM | 14,951 (10.1%) | 19,734 (12.6%) |
| 8:00 AM to 8:29 AM | 23,544 (15.9%) | 27,946 (17.8%) |
| 8:30 AM to 8:59 AM | 11,604 (7.9%) | 15,498 (9.9%) |
| 9:00 AM to 9:59 AM | 15,106 (10.2%) | 14,363 (9.1%) |
| 10:00 AM to 10:59 AM | 5,727 (3.9%) | 5,629 (3.6%) |
| 11:00 AM to 11:59 AM | 2,240 (1.5%) | 2,613 (1.7%) |
| 12:00 PM to 3:59 PM | 12,418 (8.4%) | 10,350 (6.6%) |
| 4:00 PM to 11:59 PM | 7,394 (5.0%) | 8,203 (5.2%) |
| Total | 147,841 (100.0%) | 157,161 (100.0%) |
Housing Occupancy in Boston
Occupancy by Ownership in Boston
Of the total 276,053 dwellings in Boston, owner-occupied units account for 96,186 (34.8%), while renter-occupied units make up 179,867 (65.2%).
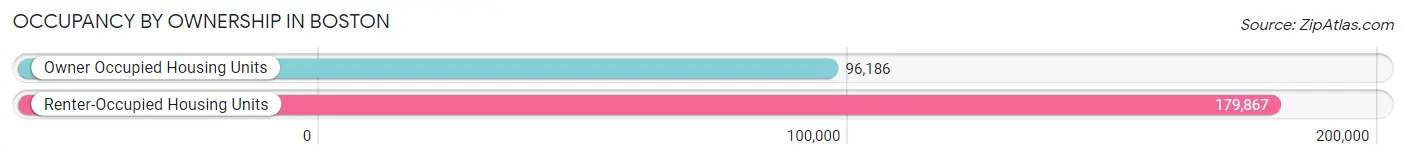
| Occupancy | # Housing Units | % Housing Units |
| Owner Occupied Housing Units | 96,186 | 34.8% |
| Renter-Occupied Housing Units | 179,867 | 65.2% |
| Total Occupied Housing Units | 276,053 | 100.0% |
Occupancy by Household Size in Boston
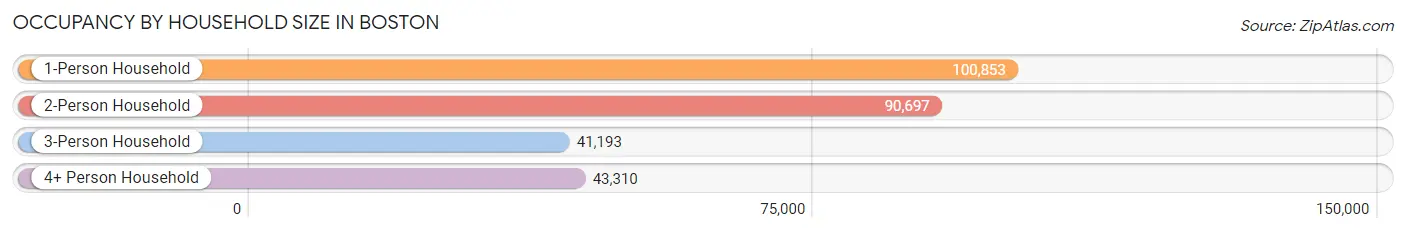
| Household Size | # Housing Units | % Housing Units |
| 1-Person Household | 100,853 | 36.5% |
| 2-Person Household | 90,697 | 32.9% |
| 3-Person Household | 41,193 | 14.9% |
| 4+ Person Household | 43,310 | 15.7% |
| Total Housing Units | 276,053 | 100.0% |
Occupancy by Ownership by Household Size in Boston
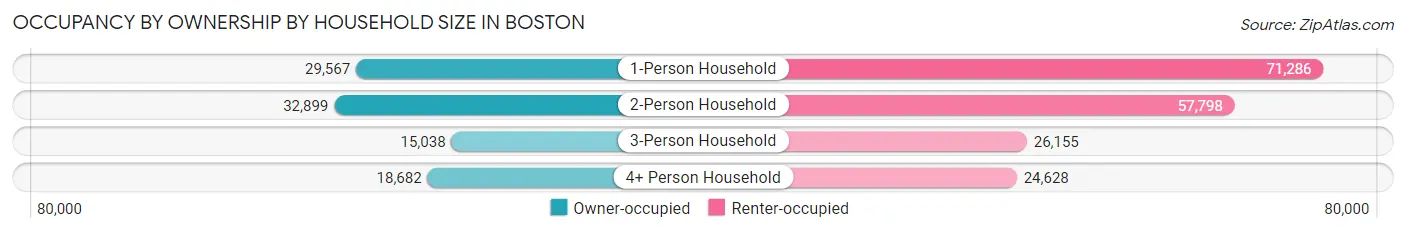
| Household Size | Owner-occupied | Renter-occupied |
| 1-Person Household | 29,567 (29.3%) | 71,286 (70.7%) |
| 2-Person Household | 32,899 (36.3%) | 57,798 (63.7%) |
| 3-Person Household | 15,038 (36.5%) | 26,155 (63.5%) |
| 4+ Person Household | 18,682 (43.1%) | 24,628 (56.9%) |
| Total Housing Units | 96,186 (34.8%) | 179,867 (65.2%) |
Occupancy by Educational Attainment in Boston
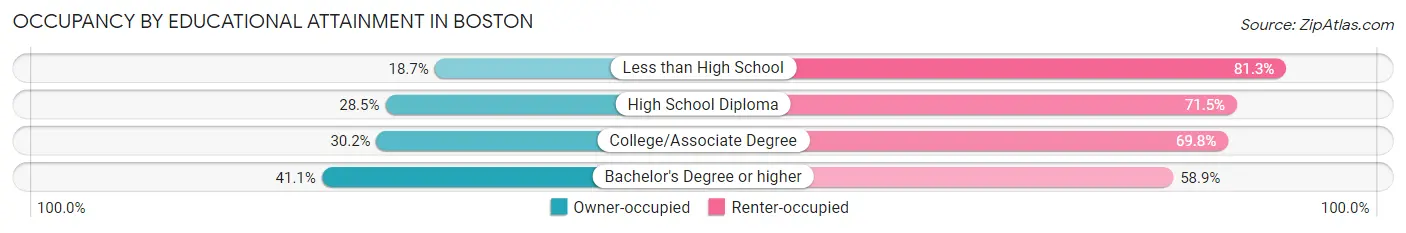
| Household Size | Owner-occupied | Renter-occupied |
| Less than High School | 5,375 (18.7%) | 23,340 (81.3%) |
| High School Diploma | 12,684 (28.5%) | 31,859 (71.5%) |
| College/Associate Degree | 14,591 (30.2%) | 33,665 (69.8%) |
| Bachelor's Degree or higher | 63,536 (41.1%) | 91,003 (58.9%) |
Occupancy by Age of Householder in Boston
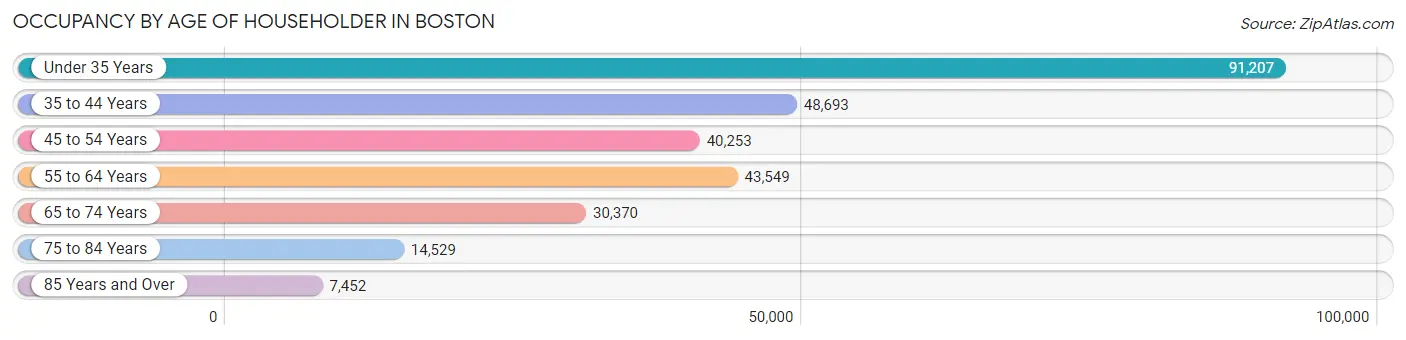
| Age Bracket | # Households | % Households |
| Under 35 Years | 91,207 | 33.0% |
| 35 to 44 Years | 48,693 | 17.6% |
| 45 to 54 Years | 40,253 | 14.6% |
| 55 to 64 Years | 43,549 | 15.8% |
| 65 to 74 Years | 30,370 | 11.0% |
| 75 to 84 Years | 14,529 | 5.3% |
| 85 Years and Over | 7,452 | 2.7% |
| Total | 276,053 | 100.0% |
Housing Finances in Boston
Median Income by Occupancy in Boston
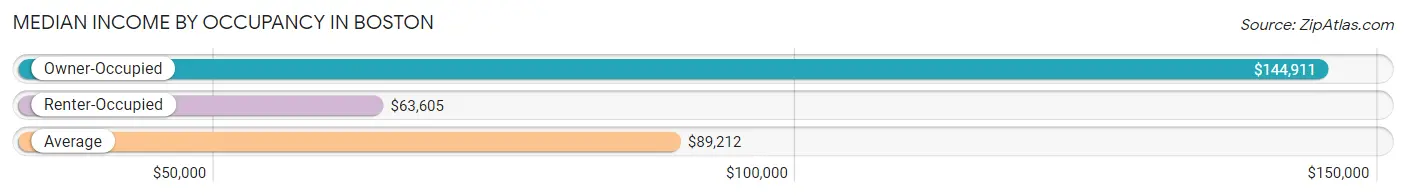
| Occupancy Type | # Households | Median Income |
| Owner-Occupied | 96,186 (34.8%) | $144,911 |
| Renter-Occupied | 179,867 (65.2%) | $63,605 |
| Average | 276,053 (100.0%) | $89,212 |
Occupancy by Householder Income Bracket in Boston
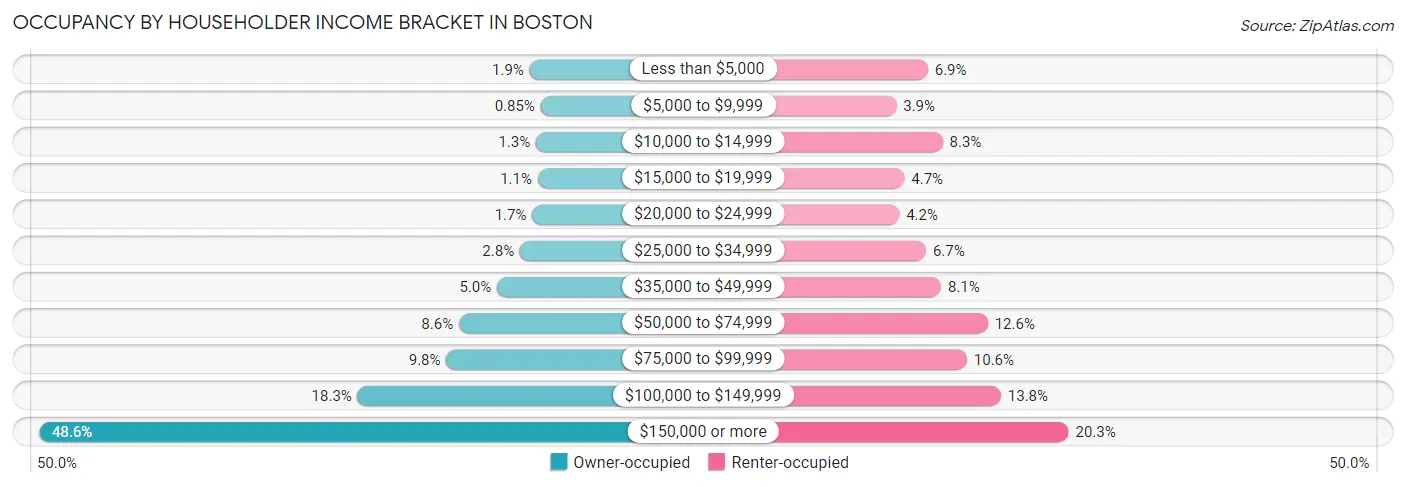
| Income Bracket | Owner-occupied | Renter-occupied |
| Less than $5,000 | 1,826 (1.9%) | 12,369 (6.9%) |
| $5,000 to $9,999 | 820 (0.9%) | 6,957 (3.9%) |
| $10,000 to $14,999 | 1,238 (1.3%) | 14,910 (8.3%) |
| $15,000 to $19,999 | 1,074 (1.1%) | 8,357 (4.6%) |
| $20,000 to $24,999 | 1,589 (1.7%) | 7,476 (4.2%) |
| $25,000 to $34,999 | 2,711 (2.8%) | 12,065 (6.7%) |
| $35,000 to $49,999 | 4,806 (5.0%) | 14,641 (8.1%) |
| $50,000 to $74,999 | 8,303 (8.6%) | 22,649 (12.6%) |
| $75,000 to $99,999 | 9,456 (9.8%) | 19,060 (10.6%) |
| $100,000 to $149,999 | 17,587 (18.3%) | 24,890 (13.8%) |
| $150,000 or more | 46,776 (48.6%) | 36,493 (20.3%) |
| Total | 96,186 (100.0%) | 179,867 (100.0%) |
Monthly Housing Cost Tiers in Boston
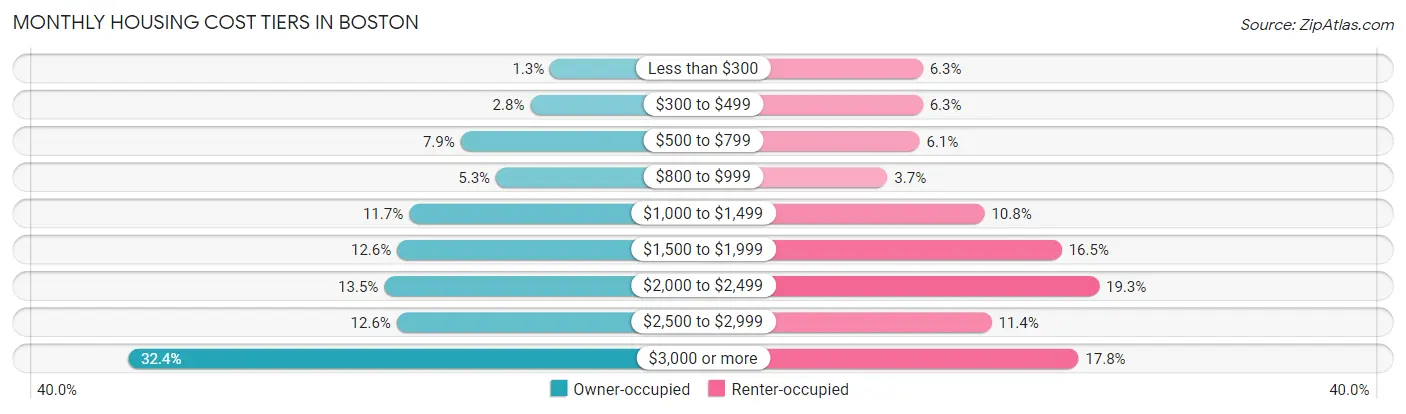
| Monthly Cost | Owner-occupied | Renter-occupied |
| Less than $300 | 1,254 (1.3%) | 11,292 (6.3%) |
| $300 to $499 | 2,651 (2.8%) | 11,300 (6.3%) |
| $500 to $799 | 7,591 (7.9%) | 10,878 (6.0%) |
| $800 to $999 | 5,093 (5.3%) | 6,626 (3.7%) |
| $1,000 to $1,499 | 11,245 (11.7%) | 19,481 (10.8%) |
| $1,500 to $1,999 | 12,088 (12.6%) | 29,721 (16.5%) |
| $2,000 to $2,499 | 13,002 (13.5%) | 34,668 (19.3%) |
| $2,500 to $2,999 | 12,119 (12.6%) | 20,417 (11.4%) |
| $3,000 or more | 31,143 (32.4%) | 31,921 (17.7%) |
| Total | 96,186 (100.0%) | 179,867 (100.0%) |
Physical Housing Characteristics in Boston
Housing Structures in Boston
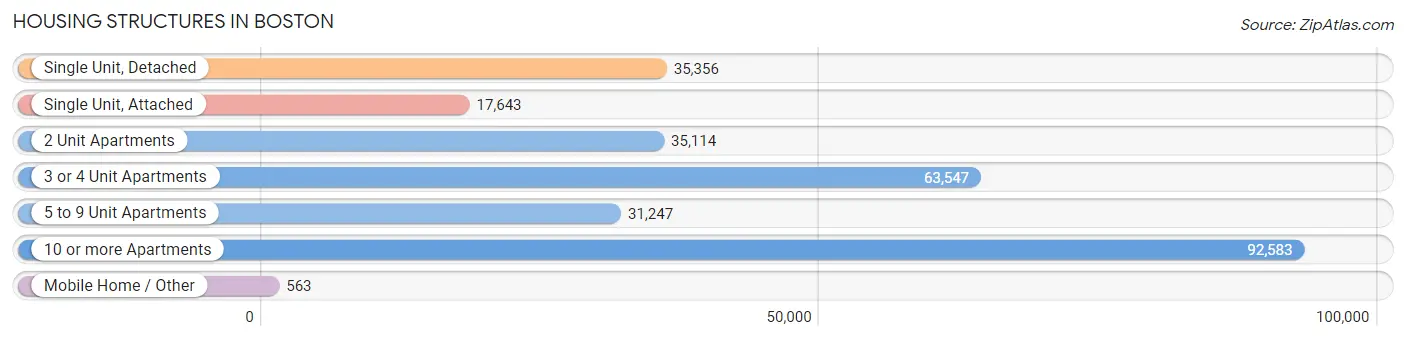
| Structure Type | # Housing Units | % Housing Units |
| Single Unit, Detached | 35,356 | 12.8% |
| Single Unit, Attached | 17,643 | 6.4% |
| 2 Unit Apartments | 35,114 | 12.7% |
| 3 or 4 Unit Apartments | 63,547 | 23.0% |
| 5 to 9 Unit Apartments | 31,247 | 11.3% |
| 10 or more Apartments | 92,583 | 33.5% |
| Mobile Home / Other | 563 | 0.2% |
| Total | 276,053 | 100.0% |
Housing Structures by Occupancy in Boston
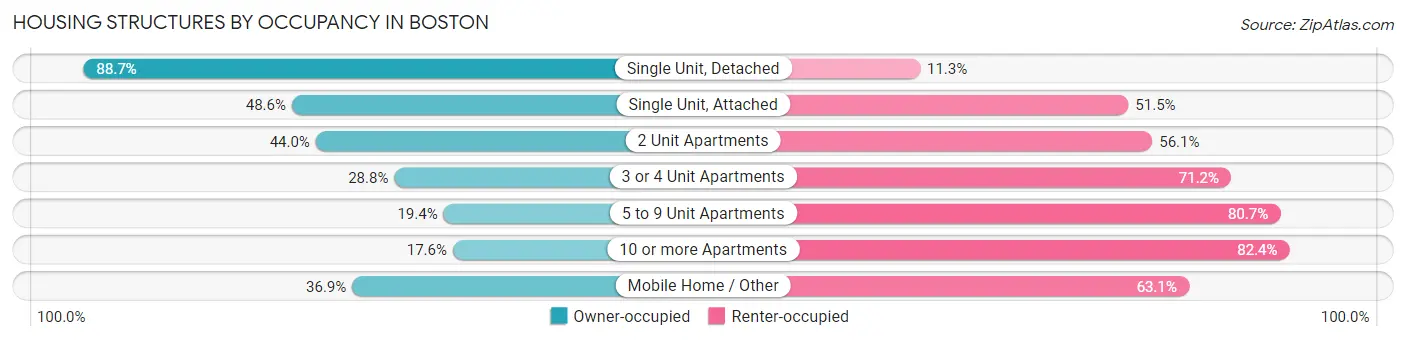
| Structure Type | Owner-occupied | Renter-occupied |
| Single Unit, Detached | 31,351 (88.7%) | 4,005 (11.3%) |
| Single Unit, Attached | 8,566 (48.5%) | 9,077 (51.4%) |
| 2 Unit Apartments | 15,433 (44.0%) | 19,681 (56.0%) |
| 3 or 4 Unit Apartments | 18,319 (28.8%) | 45,228 (71.2%) |
| 5 to 9 Unit Apartments | 6,047 (19.4%) | 25,200 (80.6%) |
| 10 or more Apartments | 16,262 (17.6%) | 76,321 (82.4%) |
| Mobile Home / Other | 208 (36.9%) | 355 (63.1%) |
| Total | 96,186 (34.8%) | 179,867 (65.2%) |
Housing Structures by Number of Rooms in Boston
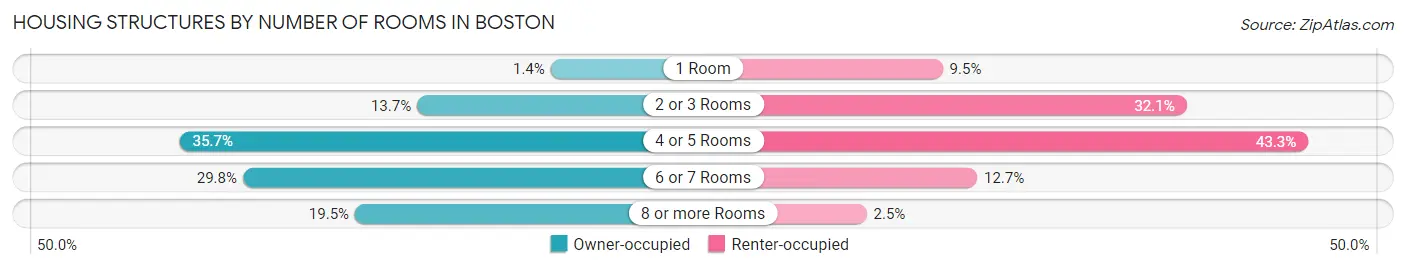
| Number of Rooms | Owner-occupied | Renter-occupied |
| 1 Room | 1,301 (1.3%) | 17,091 (9.5%) |
| 2 or 3 Rooms | 13,189 (13.7%) | 57,649 (32.1%) |
| 4 or 5 Rooms | 34,305 (35.7%) | 77,871 (43.3%) |
| 6 or 7 Rooms | 28,685 (29.8%) | 22,807 (12.7%) |
| 8 or more Rooms | 18,706 (19.5%) | 4,449 (2.5%) |
| Total | 96,186 (100.0%) | 179,867 (100.0%) |
Housing Structure by Heating Type in Boston
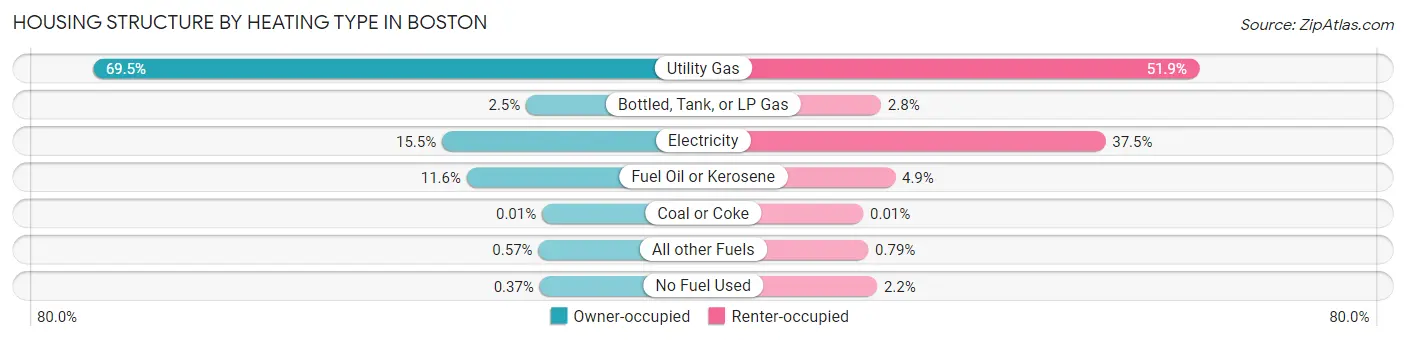
| Heating Type | Owner-occupied | Renter-occupied |
| Utility Gas | 66,820 (69.5%) | 93,356 (51.9%) |
| Bottled, Tank, or LP Gas | 2,372 (2.5%) | 4,970 (2.8%) |
| Electricity | 14,878 (15.5%) | 67,363 (37.4%) |
| Fuel Oil or Kerosene | 11,198 (11.6%) | 8,881 (4.9%) |
| Coal or Coke | 8 (0.0%) | 13 (0.0%) |
| All other Fuels | 551 (0.6%) | 1,415 (0.8%) |
| No Fuel Used | 359 (0.4%) | 3,869 (2.1%) |
| Total | 96,186 (100.0%) | 179,867 (100.0%) |
Household Vehicle Usage in Boston
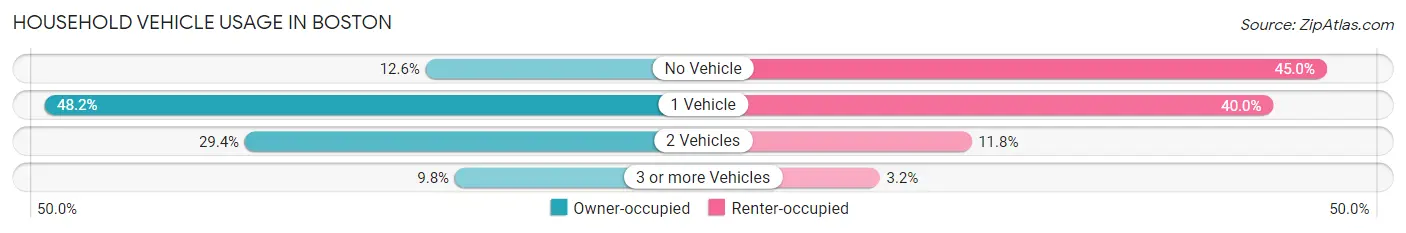
| Vehicles per Household | Owner-occupied | Renter-occupied |
| No Vehicle | 12,085 (12.6%) | 80,913 (45.0%) |
| 1 Vehicle | 46,332 (48.2%) | 71,930 (40.0%) |
| 2 Vehicles | 28,312 (29.4%) | 21,207 (11.8%) |
| 3 or more Vehicles | 9,457 (9.8%) | 5,817 (3.2%) |
| Total | 96,186 (100.0%) | 179,867 (100.0%) |
Real Estate & Mortgages in Boston
Real Estate and Mortgage Overview in Boston
| Characteristic | Without Mortgage | With Mortgage |
| Housing Units | 27,889 | 68,297 |
| Median Property Value | $686,100 | $684,500 |
| Median Household Income | $106,654 | $36,174 |
| Monthly Housing Costs | $957 | $29,430 |
| Real Estate Taxes | $4,261 | $1,196 |
Property Value by Mortgage Status in Boston
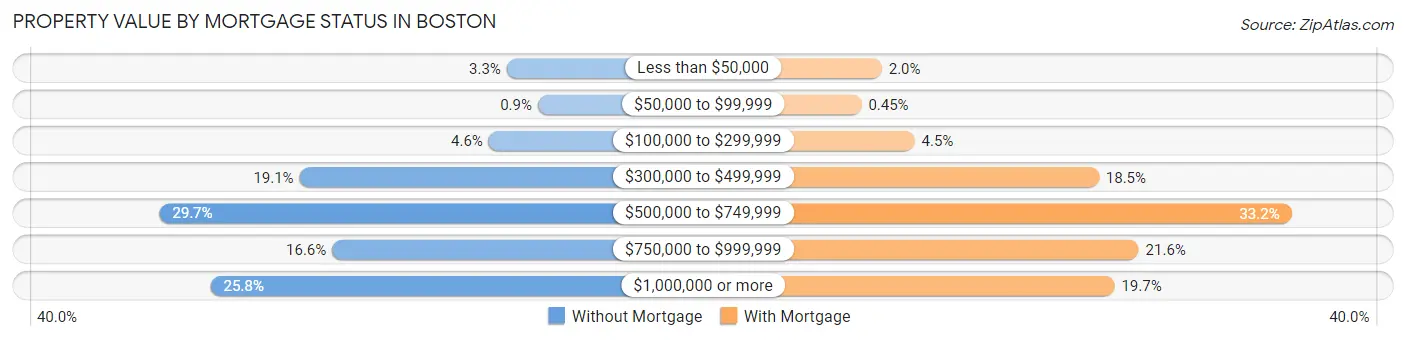
| Property Value | Without Mortgage | With Mortgage |
| Less than $50,000 | 911 (3.3%) | 1,364 (2.0%) |
| $50,000 to $99,999 | 250 (0.9%) | 308 (0.4%) |
| $100,000 to $299,999 | 1,295 (4.6%) | 3,076 (4.5%) |
| $300,000 to $499,999 | 5,317 (19.1%) | 12,661 (18.5%) |
| $500,000 to $749,999 | 8,292 (29.7%) | 22,683 (33.2%) |
| $750,000 to $999,999 | 4,620 (16.6%) | 14,730 (21.6%) |
| $1,000,000 or more | 7,204 (25.8%) | 13,475 (19.7%) |
| Total | 27,889 (100.0%) | 68,297 (100.0%) |
Household Income by Mortgage Status in Boston
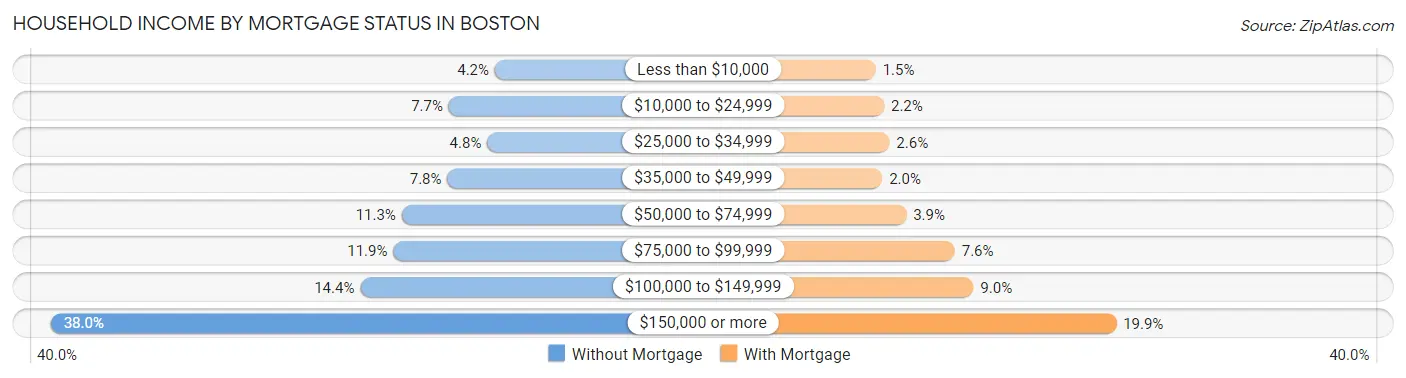
| Household Income | Without Mortgage | With Mortgage |
| Less than $10,000 | 1,162 (4.2%) | 1,050 (1.5%) |
| $10,000 to $24,999 | 2,141 (7.7%) | 1,484 (2.2%) |
| $25,000 to $34,999 | 1,324 (4.8%) | 1,760 (2.6%) |
| $35,000 to $49,999 | 2,173 (7.8%) | 1,387 (2.0%) |
| $50,000 to $74,999 | 3,142 (11.3%) | 2,633 (3.9%) |
| $75,000 to $99,999 | 3,321 (11.9%) | 5,161 (7.6%) |
| $100,000 to $149,999 | 4,024 (14.4%) | 6,135 (9.0%) |
| $150,000 or more | 10,602 (38.0%) | 13,563 (19.9%) |
| Total | 27,889 (100.0%) | 68,297 (100.0%) |
Property Value to Household Income Ratio in Boston
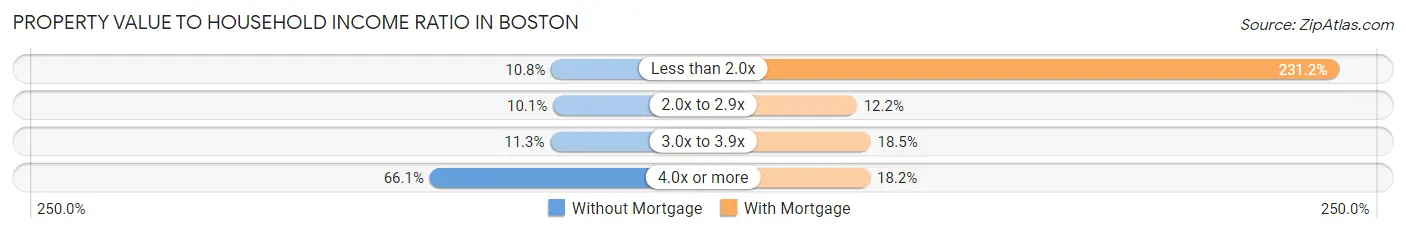
| Value-to-Income Ratio | Without Mortgage | With Mortgage |
| Less than 2.0x | 3,023 (10.8%) | 157,917 (231.2%) |
| 2.0x to 2.9x | 2,809 (10.1%) | 8,317 (12.2%) |
| 3.0x to 3.9x | 3,160 (11.3%) | 12,609 (18.5%) |
| 4.0x or more | 18,420 (66.0%) | 12,433 (18.2%) |
| Total | 27,889 (100.0%) | 68,297 (100.0%) |
Real Estate Taxes by Mortgage Status in Boston
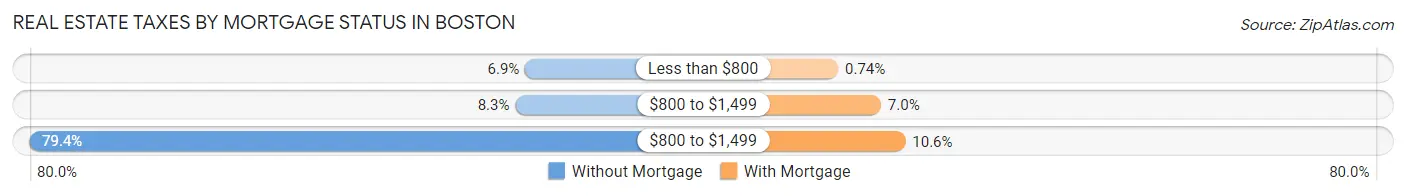
| Property Taxes | Without Mortgage | With Mortgage |
| Less than $800 | 1,912 (6.9%) | 508 (0.7%) |
| $800 to $1,499 | 2,316 (8.3%) | 4,777 (7.0%) |
| $800 to $1,499 | 22,134 (79.4%) | 7,220 (10.6%) |
| Total | 27,889 (100.0%) | 68,297 (100.0%) |
Health & Disability in Boston
Health Insurance Coverage by Age in Boston
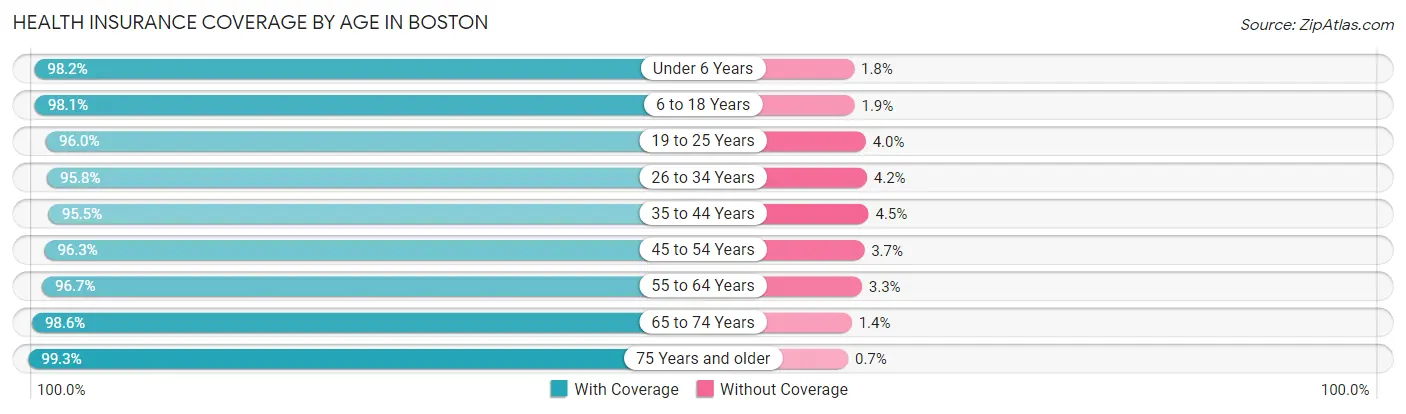
| Age Bracket | With Coverage | Without Coverage |
| Under 6 Years | 36,380 (98.2%) | 674 (1.8%) |
| 6 to 18 Years | 78,615 (98.1%) | 1,530 (1.9%) |
| 19 to 25 Years | 96,555 (96.0%) | 4,023 (4.0%) |
| 26 to 34 Years | 134,364 (95.8%) | 5,886 (4.2%) |
| 35 to 44 Years | 82,642 (95.5%) | 3,909 (4.5%) |
| 45 to 54 Years | 65,953 (96.3%) | 2,538 (3.7%) |
| 55 to 64 Years | 66,219 (96.7%) | 2,236 (3.3%) |
| 65 to 74 Years | 47,100 (98.6%) | 659 (1.4%) |
| 75 Years and older | 32,014 (99.3%) | 227 (0.7%) |
| Total | 639,842 (96.7%) | 21,682 (3.3%) |
Health Insurance Coverage by Citizenship Status in Boston
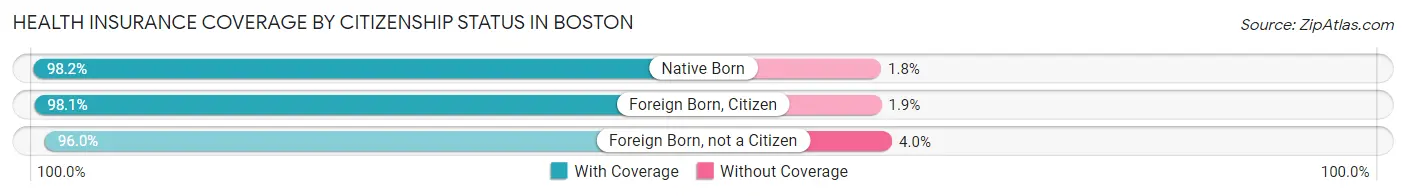
| Citizenship Status | With Coverage | Without Coverage |
| Native Born | 36,380 (98.2%) | 674 (1.8%) |
| Foreign Born, Citizen | 78,615 (98.1%) | 1,530 (1.9%) |
| Foreign Born, not a Citizen | 96,555 (96.0%) | 4,023 (4.0%) |
Health Insurance Coverage by Household Income in Boston
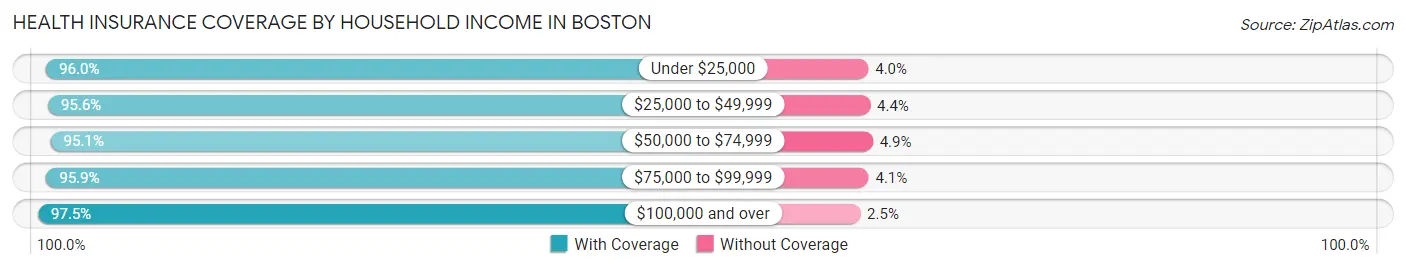
| Household Income | With Coverage | Without Coverage |
| Under $25,000 | 90,202 (96.0%) | 3,791 (4.0%) |
| $25,000 to $49,999 | 69,425 (95.6%) | 3,175 (4.4%) |
| $50,000 to $74,999 | 63,057 (95.1%) | 3,222 (4.9%) |
| $75,000 to $99,999 | 60,463 (95.9%) | 2,562 (4.1%) |
| $100,000 and over | 318,367 (97.5%) | 8,151 (2.5%) |
Public vs Private Health Insurance Coverage by Age in Boston
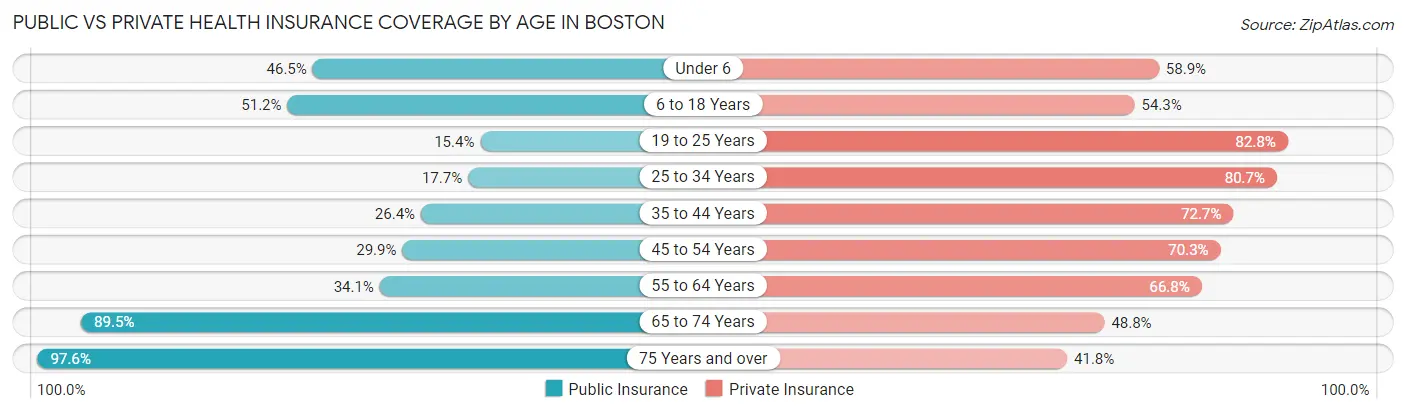
| Age Bracket | Public Insurance | Private Insurance |
| Under 6 | 17,245 (46.5%) | 21,809 (58.9%) |
| 6 to 18 Years | 41,057 (51.2%) | 43,553 (54.3%) |
| 19 to 25 Years | 15,515 (15.4%) | 83,230 (82.8%) |
| 25 to 34 Years | 24,827 (17.7%) | 113,230 (80.7%) |
| 35 to 44 Years | 22,882 (26.4%) | 62,881 (72.7%) |
| 45 to 54 Years | 20,478 (29.9%) | 48,132 (70.3%) |
| 55 to 64 Years | 23,335 (34.1%) | 45,710 (66.8%) |
| 65 to 74 Years | 42,745 (89.5%) | 23,283 (48.7%) |
| 75 Years and over | 31,466 (97.6%) | 13,484 (41.8%) |
| Total | 239,550 (36.2%) | 455,312 (68.8%) |
Disability Status by Sex by Age in Boston
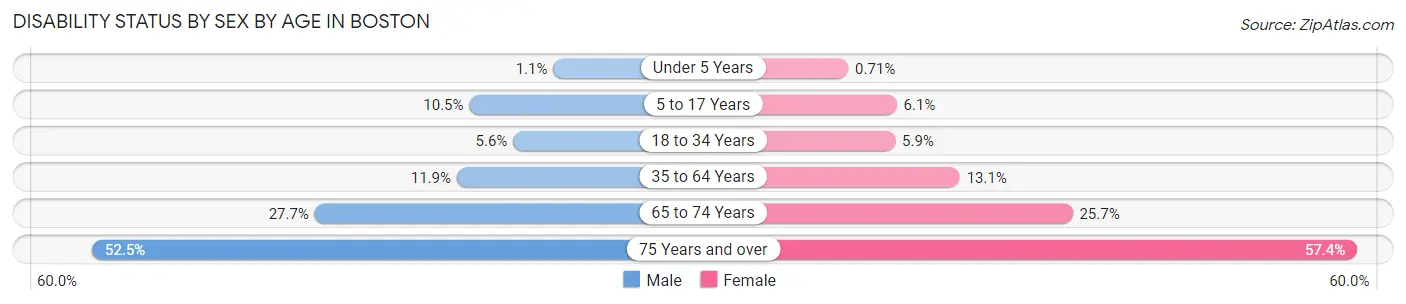
| Age Bracket | Male | Female |
| Under 5 Years | 180 (1.1%) | 109 (0.7%) |
| 5 to 17 Years | 3,939 (10.5%) | 2,135 (6.1%) |
| 18 to 34 Years | 6,825 (5.6%) | 7,836 (5.9%) |
| 35 to 64 Years | 12,856 (11.9%) | 15,105 (13.1%) |
| 65 to 74 Years | 5,960 (27.7%) | 6,738 (25.7%) |
| 75 Years and over | 6,579 (52.5%) | 11,309 (57.4%) |
Disability Class by Sex by Age in Boston
Disability Class: Hearing Difficulty
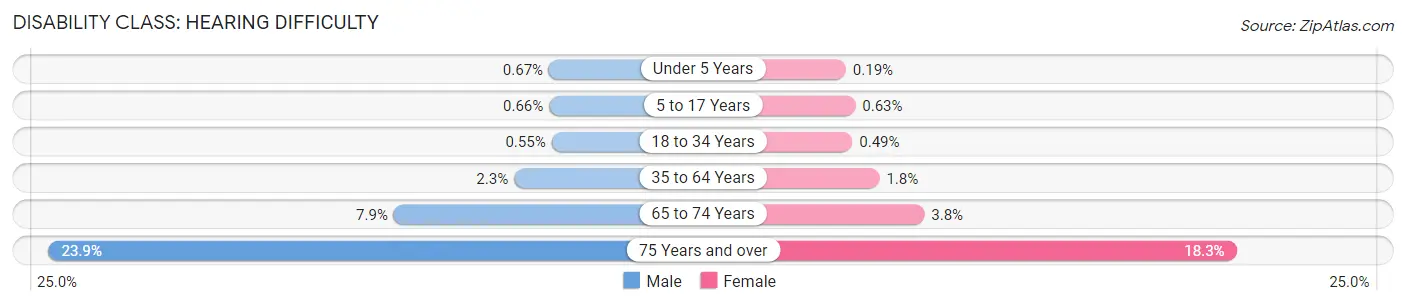
| Age Bracket | Male | Female |
| Under 5 Years | 107 (0.7%) | 29 (0.2%) |
| 5 to 17 Years | 247 (0.7%) | 219 (0.6%) |
| 18 to 34 Years | 676 (0.5%) | 646 (0.5%) |
| 35 to 64 Years | 2,481 (2.3%) | 2,016 (1.8%) |
| 65 to 74 Years | 1,694 (7.9%) | 1,004 (3.8%) |
| 75 Years and over | 2,994 (23.9%) | 3,608 (18.3%) |
Disability Class: Vision Difficulty
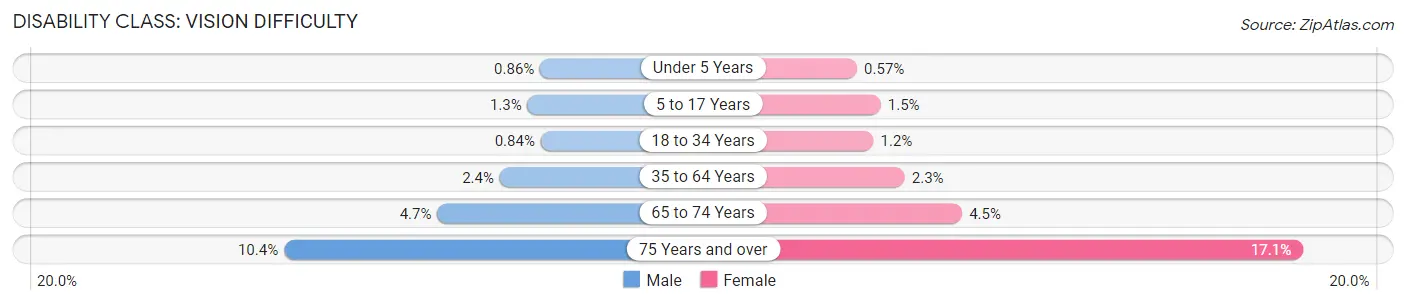
| Age Bracket | Male | Female |
| Under 5 Years | 138 (0.9%) | 88 (0.6%) |
| 5 to 17 Years | 502 (1.3%) | 509 (1.5%) |
| 18 to 34 Years | 1,026 (0.8%) | 1,556 (1.2%) |
| 35 to 64 Years | 2,558 (2.4%) | 2,696 (2.3%) |
| 65 to 74 Years | 1,007 (4.7%) | 1,172 (4.5%) |
| 75 Years and over | 1,300 (10.4%) | 3,375 (17.1%) |
Disability Class: Cognitive Difficulty
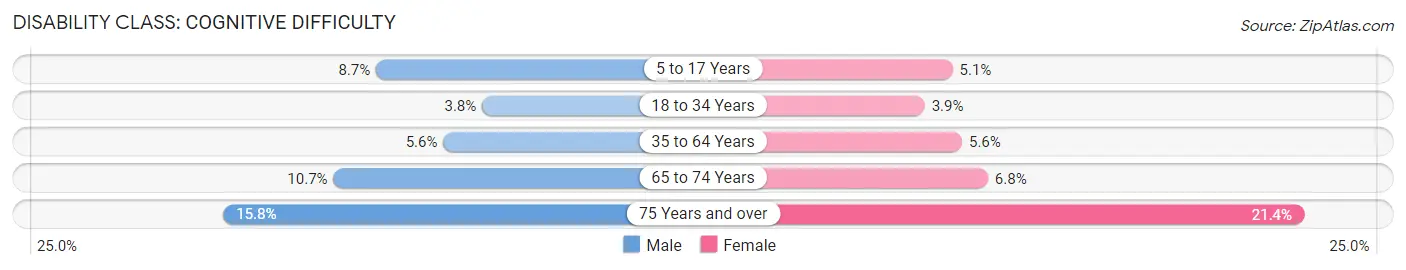
| Age Bracket | Male | Female |
| 5 to 17 Years | 3,268 (8.7%) | 1,799 (5.1%) |
| 18 to 34 Years | 4,599 (3.8%) | 5,081 (3.8%) |
| 35 to 64 Years | 6,045 (5.6%) | 6,420 (5.6%) |
| 65 to 74 Years | 2,298 (10.7%) | 1,778 (6.8%) |
| 75 Years and over | 1,978 (15.8%) | 4,226 (21.4%) |
Disability Class: Ambulatory Difficulty
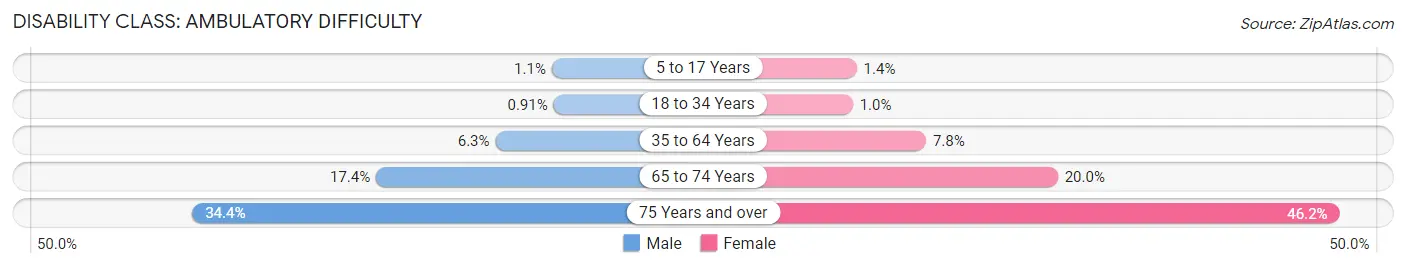
| Age Bracket | Male | Female |
| 5 to 17 Years | 408 (1.1%) | 482 (1.4%) |
| 18 to 34 Years | 1,110 (0.9%) | 1,325 (1.0%) |
| 35 to 64 Years | 6,845 (6.3%) | 8,987 (7.8%) |
| 65 to 74 Years | 3,742 (17.4%) | 5,258 (20.0%) |
| 75 Years and over | 4,316 (34.4%) | 9,103 (46.2%) |
Disability Class: Self-Care Difficulty
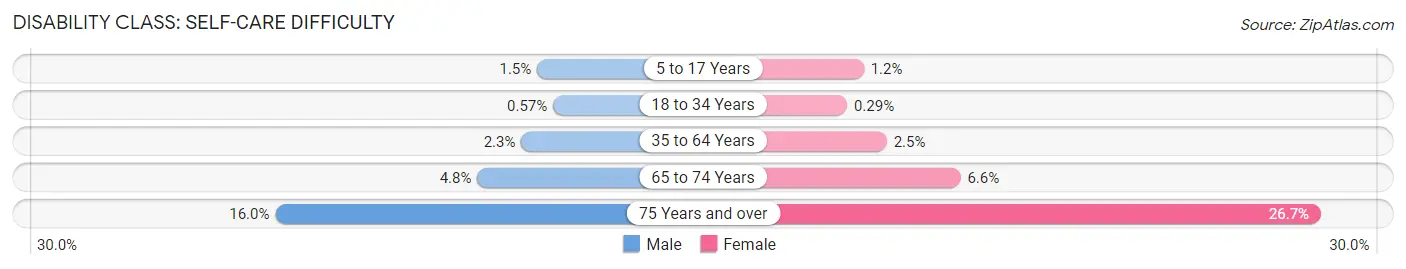
| Age Bracket | Male | Female |
| 5 to 17 Years | 551 (1.5%) | 427 (1.2%) |
| 18 to 34 Years | 700 (0.6%) | 379 (0.3%) |
| 35 to 64 Years | 2,535 (2.3%) | 2,879 (2.5%) |
| 65 to 74 Years | 1,031 (4.8%) | 1,735 (6.6%) |
| 75 Years and over | 2,010 (16.0%) | 5,258 (26.7%) |
Technology Access in Boston
Computing Device Access in Boston
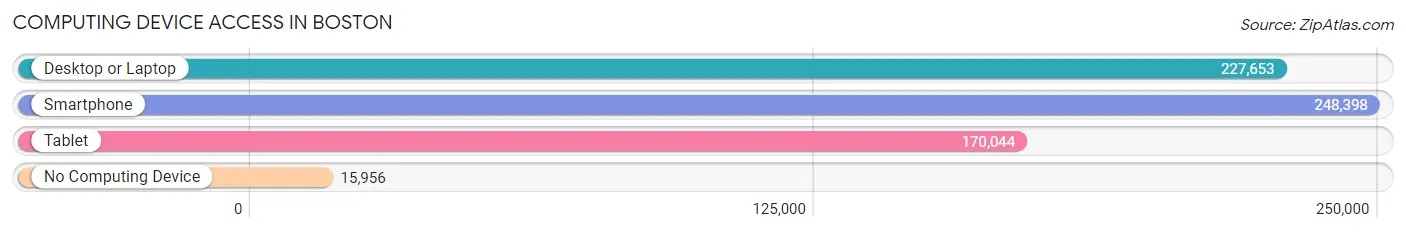
| Device Type | # Households | % Households |
| Desktop or Laptop | 227,653 | 82.5% |
| Smartphone | 248,398 | 90.0% |
| Tablet | 170,044 | 61.6% |
| No Computing Device | 15,956 | 5.8% |
| Total | 276,053 | 100.0% |
Internet Access in Boston
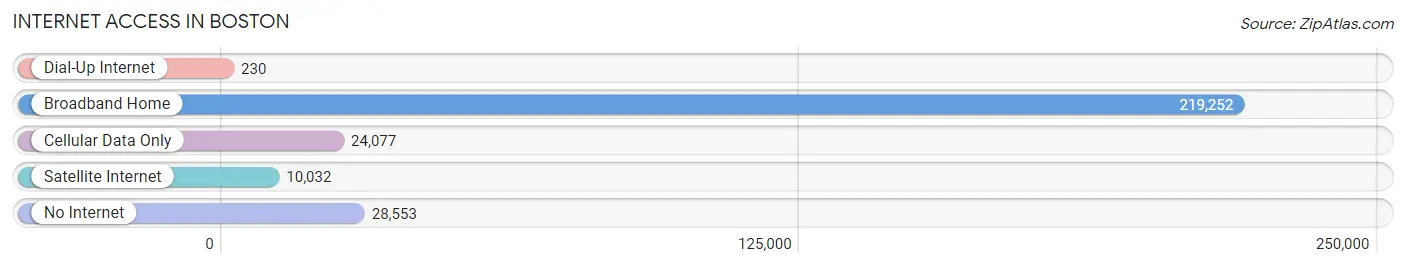
| Internet Type | # Households | % Households |
| Dial-Up Internet | 230 | 0.1% |
| Broadband Home | 219,252 | 79.4% |
| Cellular Data Only | 24,077 | 8.7% |
| Satellite Internet | 10,032 | 3.6% |
| No Internet | 28,553 | 10.3% |
| Total | 276,053 | 100.0% |
Boston Summary
Boston, Massachusetts is a city with a rich history, diverse geography, vibrant economy, and unique demographics. Located in the northeastern United States, Boston is the largest city in the state of Massachusetts and the 21st largest city in the United States. It is the capital of the Commonwealth of Massachusetts and the county seat of Suffolk County.
History
Boston has a long and storied history that dates back to 1630 when it was founded by Puritan settlers from England. The city was named after Boston, Lincolnshire, England, and was the site of several key events during the American Revolution, including the Boston Massacre, the Boston Tea Party, and the Battle of Bunker Hill. During the 19th century, Boston became a major manufacturing and trading center, and was the birthplace of the American Industrial Revolution. In the 20th century, Boston experienced a period of rapid growth and development, becoming a major center for higher education, healthcare, finance, and technology.
Geography
Boston is located in the northeastern United States, on the Atlantic coast of Massachusetts. It is bordered by the cities of Cambridge, Somerville, and Brookline to the north; the towns of Winthrop, Revere, and Chelsea to the east; the towns of Milton and Quincy to the south; and the towns of Dedham and Needham to the west. The city is situated on a peninsula, with the Charles River to the west and the Mystic River to the east. The city covers an area of 89.6 square miles, and is the most populous city in New England.
Economy
Boston is a major economic center in the United States, with a diverse and vibrant economy. The city is home to a number of major corporations, including Fidelity Investments, Liberty Mutual Insurance, and State Street Corporation. The city is also a major center for higher education, healthcare, finance, and technology. The city is home to several major universities, including Harvard University, Boston University, and the Massachusetts Institute of Technology. The city is also home to several major hospitals, including Massachusetts General Hospital, Brigham and Women’s Hospital, and Boston Children’s Hospital.
Demographics
As of the 2010 census, the population of Boston was 617,594, making it the 21st largest city in the United States. The city is racially and ethnically diverse, with a population that is approximately 53.9% White, 25.5% African American, 12.4% Hispanic or Latino, 8.3% Asian, and 0.4% Native American. The city is also home to a large immigrant population, with approximately 20.9% of the population born outside of the United States. The median household income in Boston is $53,841, and the median home value is $440,000.
Common Questions
What is Per Capita Income in Boston?
Per Capita income in Boston is $55,949.
What is the Median Family Income in Boston?
Median Family Income in Boston is $106,015.
What is the Median Household income in Boston?
Median Household Income in Boston is $89,212.
What is Income or Wage Gap in Boston?
Income or Wage Gap in Boston is 17.1%.
Women in Boston earn 82.9 cents for every dollar earned by a man.
What is Family Income Deficit in Boston?
Family Income Deficit in Boston is $11,137.
Families that are below poverty line in Boston earn $11,137 less on average than the poverty threshold level.
What is Inequality or Gini Index in Boston?
Inequality or Gini Index in Boston is 0.54.
What is the Total Population of Boston?
Total Population of Boston is 665,945.
What is the Total Male Population of Boston?
Total Male Population of Boston is 320,791.
What is the Total Female Population of Boston?
Total Female Population of Boston is 345,154.
What is the Ratio of Males per 100 Females in Boston?
There are 92.94 Males per 100 Females in Boston.
What is the Ratio of Females per 100 Males in Boston?
There are 107.59 Females per 100 Males in Boston.
What is the Median Population Age in Boston?
Median Population Age in Boston is 32.9 Years.
What is the Average Family Size in Boston
Average Family Size in Boston is 3.0 People.
What is the Average Household Size in Boston
Average Household Size in Boston is 2.3 People.
How Large is the Labor Force in Boston?
There are 398,813 People in the Labor Forcein in Boston.
What is the Percentage of People in the Labor Force in Boston?
69.7% of People are in the Labor Force in Boston.
What is the Unemployment Rate in Boston?
Unemployment Rate in Boston is 6.6%.