Williamstown, MA Map & Demographics
Williamstown Map
Williamstown Overview
$44,377
PER CAPITA INCOME
$180,500
AVG FAMILY INCOME
$110,855
AVG HOUSEHOLD INCOME
9.5%
WAGE / INCOME GAP [ % ]
90.5¢/ $1
WAGE / INCOME GAP [ $ ]
0.57
INEQUALITY / GINI INDEX
4,498
TOTAL POPULATION
1,909
MALE POPULATION
2,589
FEMALE POPULATION
73.74
MALES / 100 FEMALES
135.62
FEMALES / 100 MALES
21.8
MEDIAN AGE
2.9
AVG FAMILY SIZE
2.1
AVG HOUSEHOLD SIZE
2,402
LABOR FORCE [ PEOPLE ]
59.3%
PERCENT IN LABOR FORCE
0.7%
UNEMPLOYMENT RATE
Williamstown Zip Codes
Williamstown Area Codes
Income in Williamstown
Income Overview in Williamstown
Per Capita Income in Williamstown is $44,377, while median incomes of families and households are $180,500 and $110,855 respectively.
| Characteristic | Number | Measure |
| Per Capita Income | 4,498 | $44,377 |
| Median Family Income | 602 | $180,500 |
| Mean Family Income | 602 | $259,784 |
| Median Household Income | 1,189 | $110,855 |
| Mean Household Income | 1,189 | $163,626 |
| Income Deficit | 602 | $0 |
| Wage / Income Gap (%) | 4,498 | 9.48% |
| Wage / Income Gap ($) | 4,498 | 90.52¢ per $1 |
| Gini / Inequality Index | 4,498 | 0.57 |
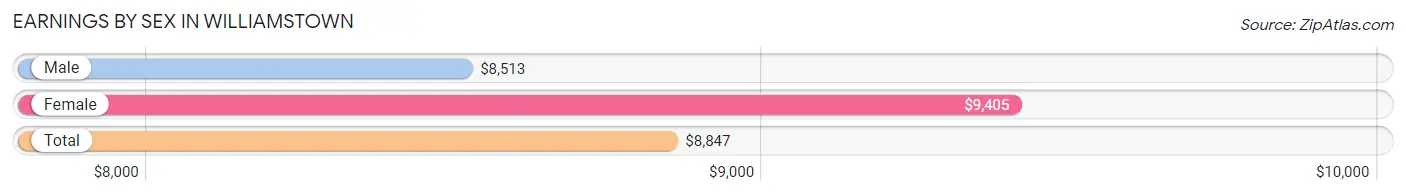
Earnings by Sex in Williamstown
Average Earnings in Williamstown are $8,847, $8,513 for men and $9,405 for women, a difference of 9.5%.
| Sex | Number | Average Earnings |
| Male | 1,393 (47.0%) | $8,513 |
| Female | 1,571 (53.0%) | $9,405 |
| Total | 2,964 (100.0%) | $8,847 |
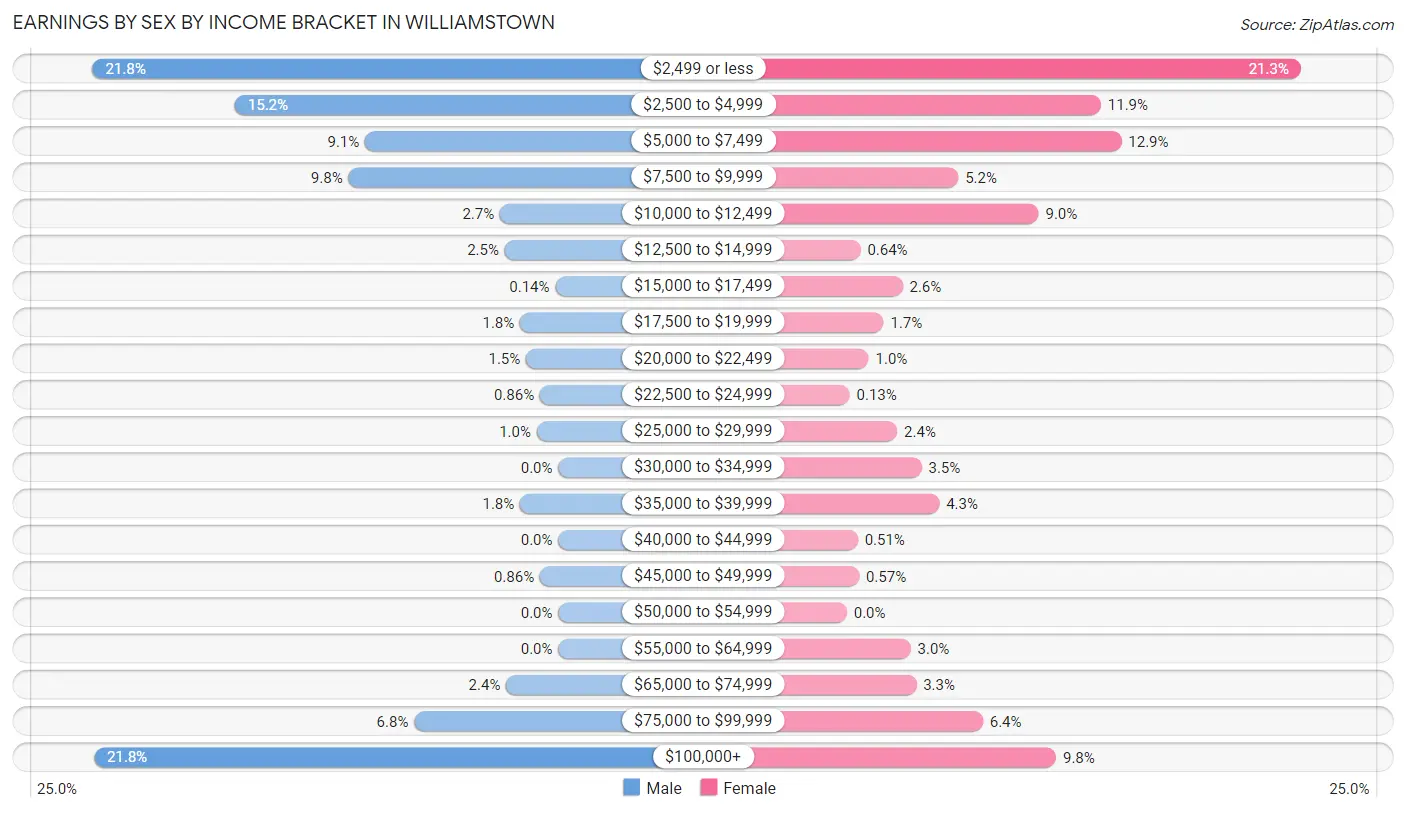
Earnings by Sex by Income Bracket in Williamstown
The most common earnings brackets in Williamstown are $2,499 or less for men (304 | 21.8%) and $2,499 or less for women (334 | 21.3%).
| Income | Male | Female |
| $2,499 or less | 304 (21.8%) | 334 (21.3%) |
| $2,500 to $4,999 | 211 (15.1%) | 187 (11.9%) |
| $5,000 to $7,499 | 126 (9.0%) | 202 (12.9%) |
| $7,500 to $9,999 | 137 (9.8%) | 82 (5.2%) |
| $10,000 to $12,499 | 38 (2.7%) | 141 (9.0%) |
| $12,500 to $14,999 | 35 (2.5%) | 10 (0.6%) |
| $15,000 to $17,499 | 2 (0.1%) | 41 (2.6%) |
| $17,500 to $19,999 | 25 (1.8%) | 27 (1.7%) |
| $20,000 to $22,499 | 21 (1.5%) | 16 (1.0%) |
| $22,500 to $24,999 | 12 (0.9%) | 2 (0.1%) |
| $25,000 to $29,999 | 14 (1.0%) | 37 (2.4%) |
| $30,000 to $34,999 | 0 (0.0%) | 55 (3.5%) |
| $35,000 to $39,999 | 25 (1.8%) | 68 (4.3%) |
| $40,000 to $44,999 | 0 (0.0%) | 8 (0.5%) |
| $45,000 to $49,999 | 12 (0.9%) | 9 (0.6%) |
| $50,000 to $54,999 | 0 (0.0%) | 0 (0.0%) |
| $55,000 to $64,999 | 0 (0.0%) | 47 (3.0%) |
| $65,000 to $74,999 | 34 (2.4%) | 51 (3.3%) |
| $75,000 to $99,999 | 94 (6.8%) | 100 (6.4%) |
| $100,000+ | 303 (21.7%) | 154 (9.8%) |
| Total | 1,393 (100.0%) | 1,571 (100.0%) |
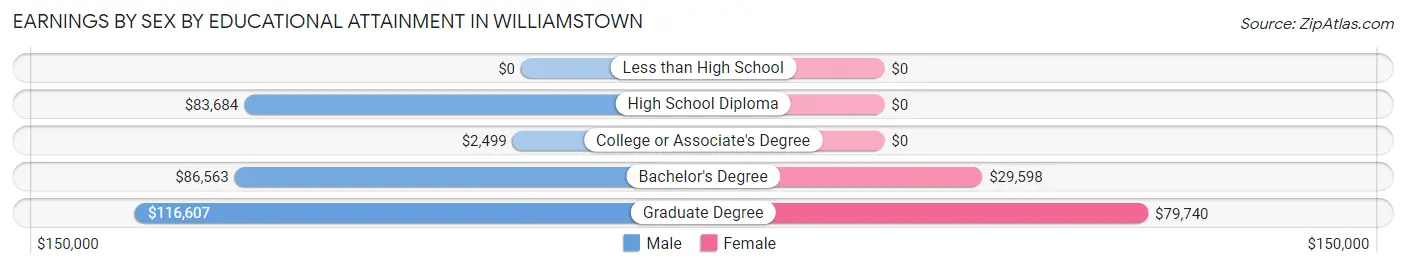
Earnings by Sex by Educational Attainment in Williamstown
Average earnings in Williamstown are $113,289 for men and $64,911 for women, a difference of 42.7%. Men with an educational attainment of graduate degree enjoy the highest average annual earnings of $116,607, while those with college or associate's degree education earn the least with $2,499. Women with an educational attainment of graduate degree earn the most with the average annual earnings of $79,740, while those with bachelor's degree education have the smallest earnings of $29,598.
| Educational Attainment | Male Income | Female Income |
| Less than High School | - | - |
| High School Diploma | $83,684 | $0 |
| College or Associate's Degree | $2,499 | $0 |
| Bachelor's Degree | $86,563 | $29,598 |
| Graduate Degree | $116,607 | $79,740 |
| Total | $113,289 | $64,911 |
Family Income in Williamstown
Family Income Brackets in Williamstown
According to the Williamstown family income data, there are 282 families falling into the $200,000+ income range, which is the most common income bracket and makes up 46.8% of all families.
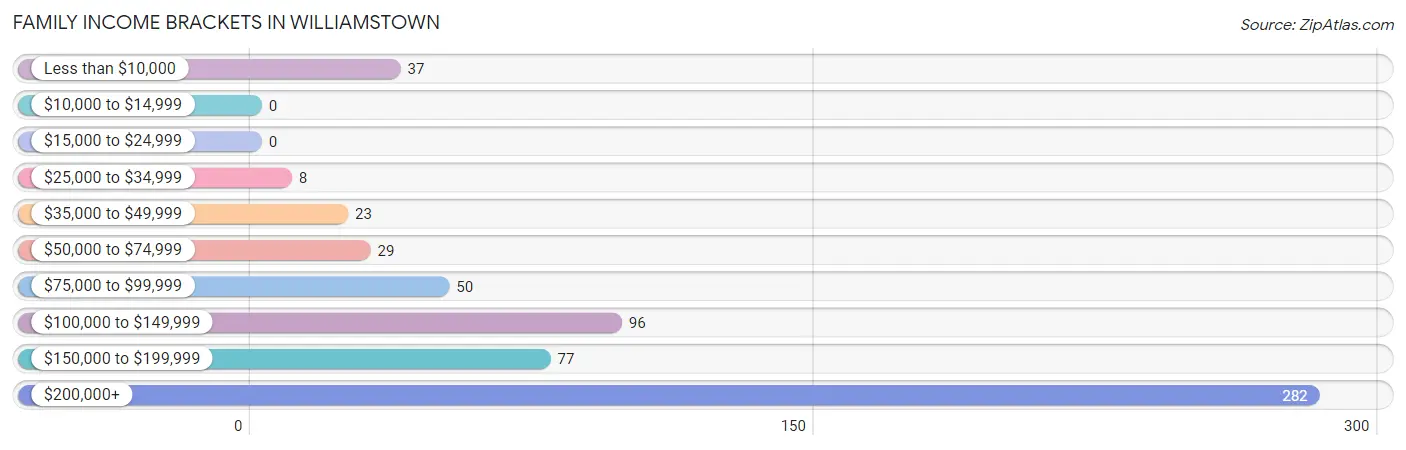
| Income Bracket | # Families | % Families |
| Less than $10,000 | 37 | 6.1% |
| $10,000 to $14,999 | 0 | 0.0% |
| $15,000 to $24,999 | 0 | 0.0% |
| $25,000 to $34,999 | 8 | 1.3% |
| $35,000 to $49,999 | 23 | 3.8% |
| $50,000 to $74,999 | 29 | 4.8% |
| $75,000 to $99,999 | 50 | 8.3% |
| $100,000 to $149,999 | 96 | 15.9% |
| $150,000 to $199,999 | 77 | 12.8% |
| $200,000+ | 282 | 46.8% |
Family Income by Famaliy Size in Williamstown
5-person families (74 | 12.3%) account for the highest median family income in Williamstown with $250,001 per family, while 3-person families (110 | 18.3%) have the highest median income of $62,197 per family member.
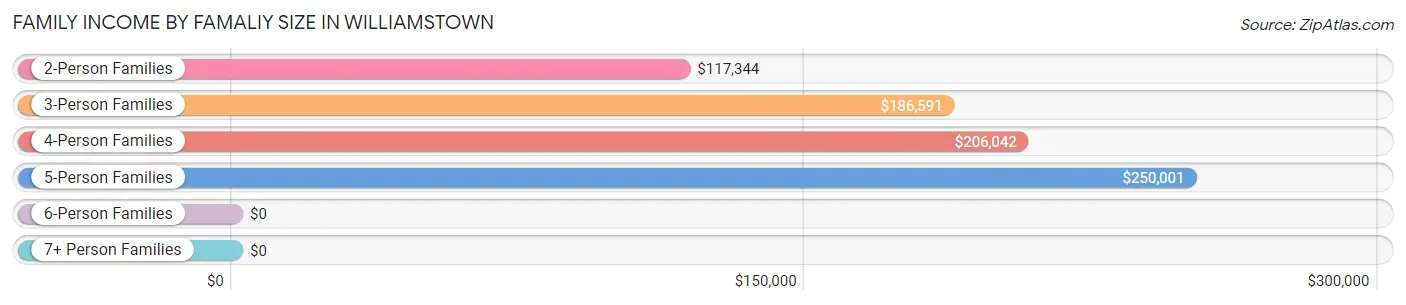
| Income Bracket | # Families | Median Income |
| 2-Person Families | 313 (52.0%) | $117,344 |
| 3-Person Families | 110 (18.3%) | $186,591 |
| 4-Person Families | 105 (17.4%) | $206,042 |
| 5-Person Families | 74 (12.3%) | $250,001 |
| 6-Person Families | 0 (0.0%) | $0 |
| 7+ Person Families | 0 (0.0%) | $0 |
| Total | 602 (100.0%) | $180,500 |
Family Income by Number of Earners in Williamstown
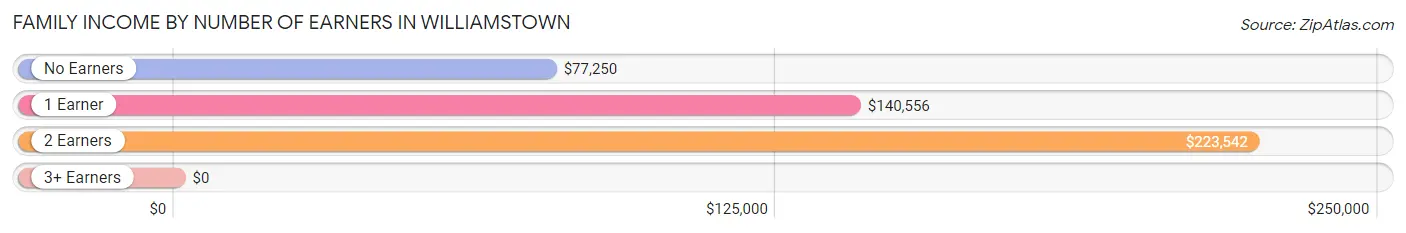
| Number of Earners | # Families | Median Income |
| No Earners | 70 (11.6%) | $77,250 |
| 1 Earner | 174 (28.9%) | $140,556 |
| 2 Earners | 335 (55.6%) | $223,542 |
| 3+ Earners | 23 (3.8%) | $0 |
| Total | 602 (100.0%) | $180,500 |
Household Income in Williamstown
Household Income Brackets in Williamstown
With 301 households falling in the category, the $200,000+ income range is the most frequent in Williamstown, accounting for 25.3% of all households. In contrast, only 59 households (5.0%) fall into the $35,000 to $49,999 income bracket, making it the least populous group.
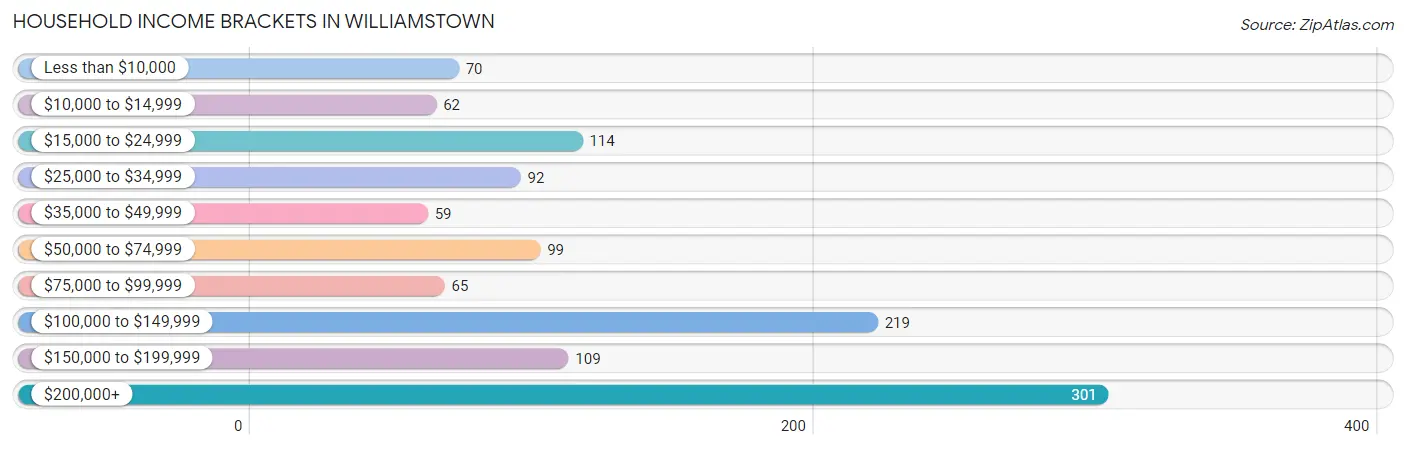
| Income Bracket | # Households | % Households |
| Less than $10,000 | 70 | 5.9% |
| $10,000 to $14,999 | 62 | 5.2% |
| $15,000 to $24,999 | 114 | 9.6% |
| $25,000 to $34,999 | 92 | 7.7% |
| $35,000 to $49,999 | 59 | 5.0% |
| $50,000 to $74,999 | 99 | 8.3% |
| $75,000 to $99,999 | 65 | 5.5% |
| $100,000 to $149,999 | 219 | 18.4% |
| $150,000 to $199,999 | 109 | 9.2% |
| $200,000+ | 301 | 25.3% |
Household Income by Householder Age in Williamstown
The median household income in Williamstown is $110,855, with the highest median household income of $164,323 found in the 25 to 44 years age bracket for the primary householder. A total of 229 households (19.3%) fall into this category. Meanwhile, the 15 to 24 years age bracket for the primary householder has the lowest median household income of $23,882, with 49 households (4.1%) in this group.
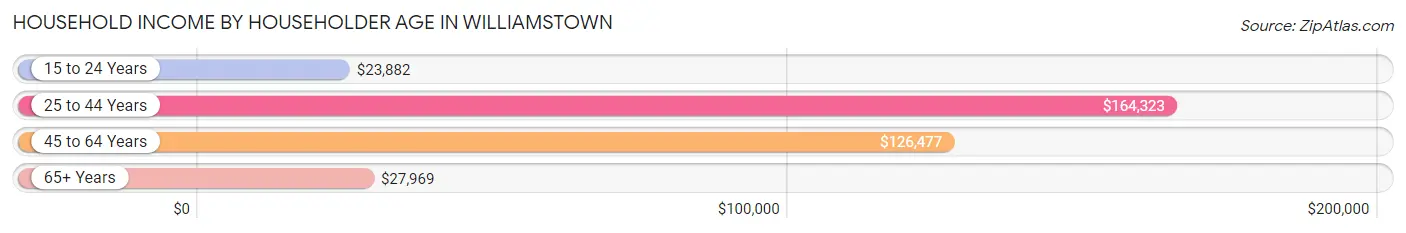
| Income Bracket | # Households | Median Income |
| 15 to 24 Years | 49 (4.1%) | $23,882 |
| 25 to 44 Years | 229 (19.3%) | $164,323 |
| 45 to 64 Years | 429 (36.1%) | $126,477 |
| 65+ Years | 482 (40.5%) | $27,969 |
| Total | 1,189 (100.0%) | $110,855 |
Poverty in Williamstown
Income Below Poverty by Sex and Age in Williamstown
With 12.2% poverty level for males and 15.1% for females among the residents of Williamstown, 18 to 24 year old males and 18 to 24 year old females are the most vulnerable to poverty, with 54 males (41.9%) and 103 females (61.0%) in their respective age groups living below the poverty level.
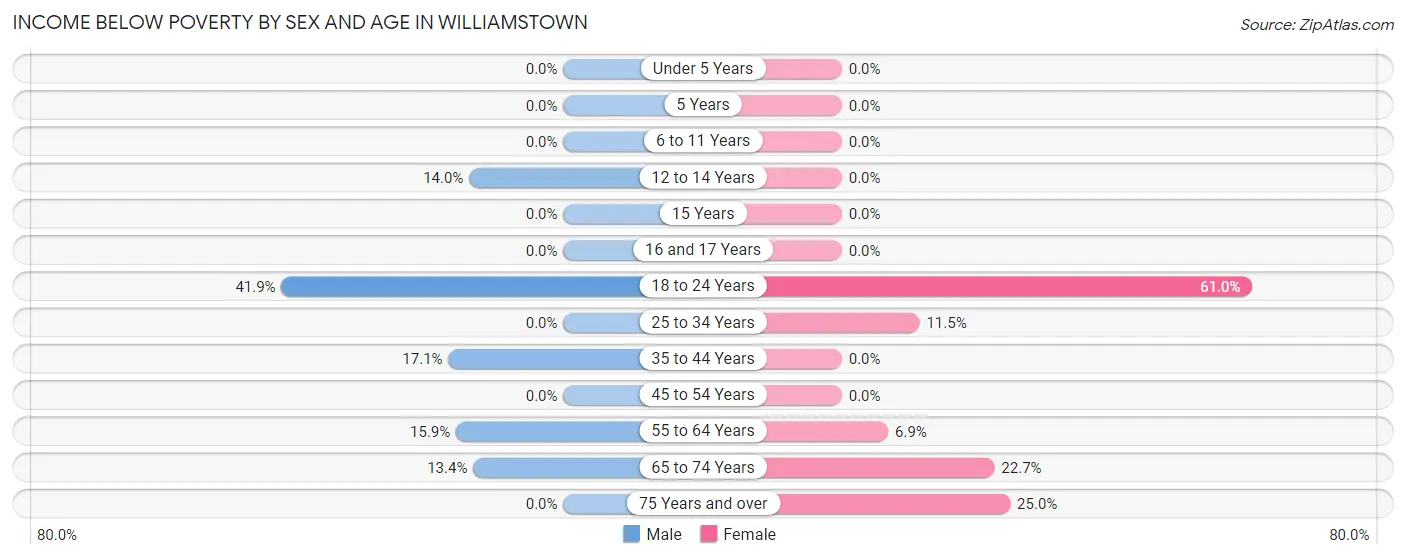
| Age Bracket | Male | Female |
| Under 5 Years | 0 (0.0%) | 0 (0.0%) |
| 5 Years | 0 (0.0%) | 0 (0.0%) |
| 6 to 11 Years | 0 (0.0%) | 0 (0.0%) |
| 12 to 14 Years | 13 (14.0%) | 0 (0.0%) |
| 15 Years | 0 (0.0%) | 0 (0.0%) |
| 16 and 17 Years | 0 (0.0%) | 0 (0.0%) |
| 18 to 24 Years | 54 (41.9%) | 103 (61.0%) |
| 25 to 34 Years | 0 (0.0%) | 12 (11.5%) |
| 35 to 44 Years | 14 (17.1%) | 0 (0.0%) |
| 45 to 54 Years | 0 (0.0%) | 0 (0.0%) |
| 55 to 64 Years | 25 (15.9%) | 13 (6.9%) |
| 65 to 74 Years | 19 (13.4%) | 58 (22.7%) |
| 75 Years and over | 0 (0.0%) | 40 (25.0%) |
| Total | 125 (12.2%) | 226 (15.1%) |
Income Above Poverty by Sex and Age in Williamstown
According to the poverty statistics in Williamstown, males aged under 5 years and females aged under 5 years are the age groups that are most secure financially, with 100.0% of males and 100.0% of females in these age groups living above the poverty line.
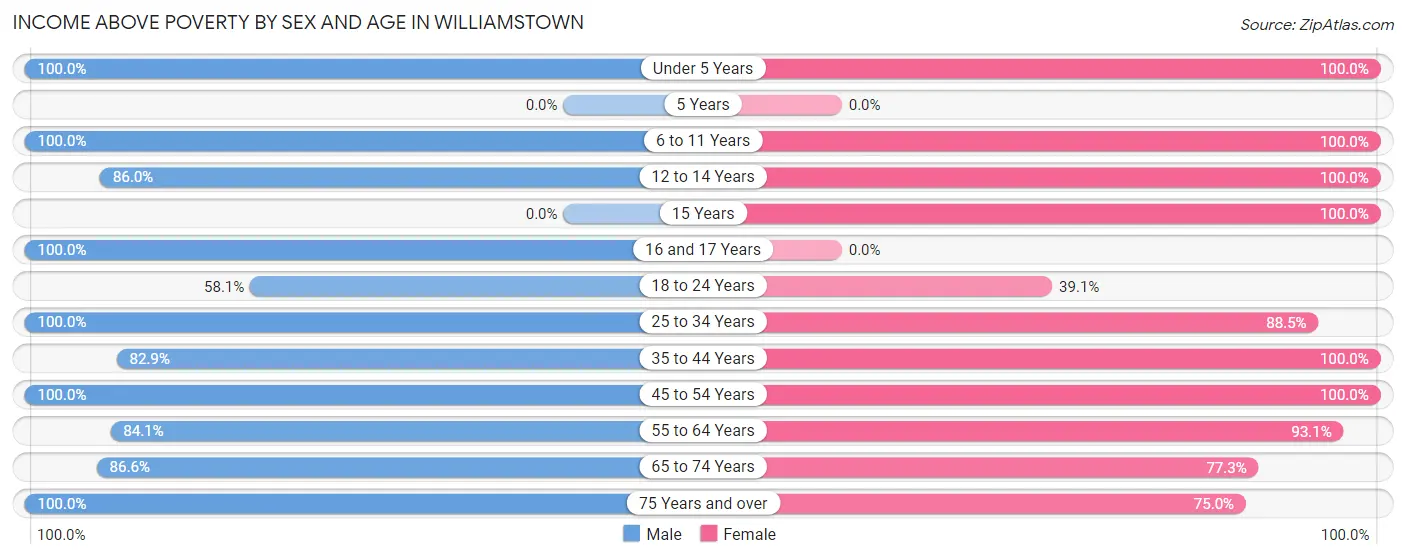
| Age Bracket | Male | Female |
| Under 5 Years | 25 (100.0%) | 107 (100.0%) |
| 5 Years | 0 (0.0%) | 0 (0.0%) |
| 6 to 11 Years | 35 (100.0%) | 130 (100.0%) |
| 12 to 14 Years | 80 (86.0%) | 31 (100.0%) |
| 15 Years | 0 (0.0%) | 22 (100.0%) |
| 16 and 17 Years | 50 (100.0%) | 0 (0.0%) |
| 18 to 24 Years | 75 (58.1%) | 66 (39.1%) |
| 25 to 34 Years | 64 (100.0%) | 92 (88.5%) |
| 35 to 44 Years | 68 (82.9%) | 179 (100.0%) |
| 45 to 54 Years | 178 (100.0%) | 152 (100.0%) |
| 55 to 64 Years | 132 (84.1%) | 176 (93.1%) |
| 65 to 74 Years | 123 (86.6%) | 198 (77.3%) |
| 75 Years and over | 72 (100.0%) | 120 (75.0%) |
| Total | 902 (87.8%) | 1,273 (84.9%) |
Income Below Poverty Among Married-Couple Families in Williamstown
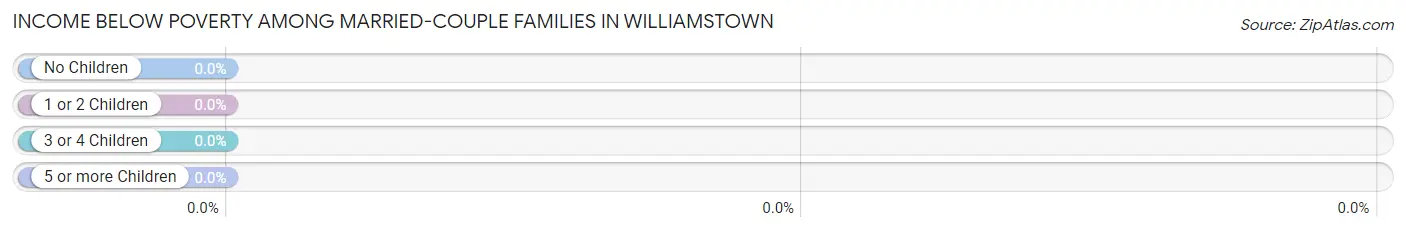
| Children | Above Poverty | Below Poverty |
| No Children | 261 (100.0%) | 0 (0.0%) |
| 1 or 2 Children | 161 (100.0%) | 0 (0.0%) |
| 3 or 4 Children | 60 (100.0%) | 0 (0.0%) |
| 5 or more Children | 0 (0.0%) | 0 (0.0%) |
| Total | 482 (100.0%) | 0 (0.0%) |
Income Below Poverty Among Single-Parent Households in Williamstown
According to the poverty data in Williamstown, 42.9% or 15 single-father households and 25.9% or 22 single-mother households are living below the poverty line. Among single-father households, those with 1 or 2 children have the highest poverty rate, with 15 households (100.0%) experiencing poverty. Likewise, among single-mother households, those with no children have the highest poverty rate, with 22 households (34.4%) falling below the poverty line.
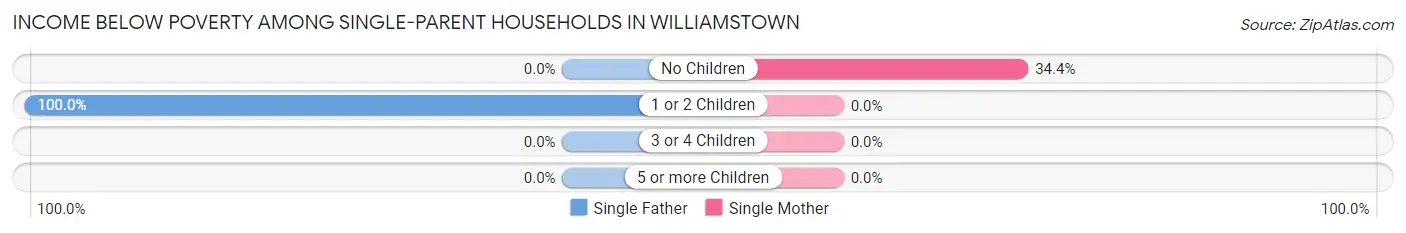
| Children | Single Father | Single Mother |
| No Children | 0 (0.0%) | 22 (34.4%) |
| 1 or 2 Children | 15 (100.0%) | 0 (0.0%) |
| 3 or 4 Children | 0 (0.0%) | 0 (0.0%) |
| 5 or more Children | 0 (0.0%) | 0 (0.0%) |
| Total | 15 (42.9%) | 22 (25.9%) |
Income Below Poverty Among Married-Couple vs Single-Parent Households in Williamstown
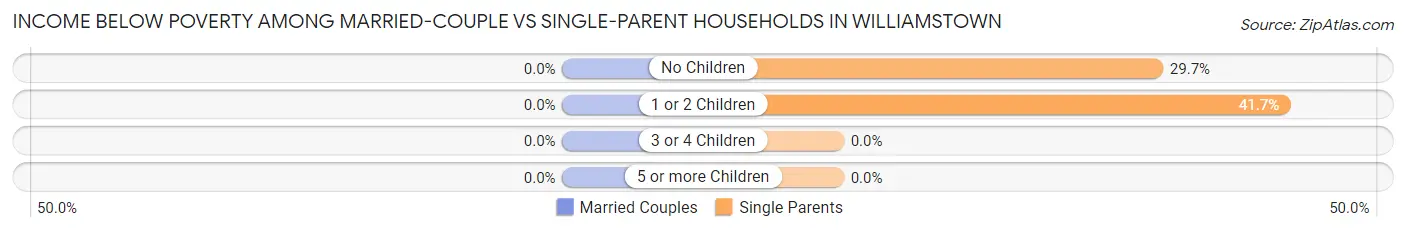
| Children | Married-Couple Families | Single-Parent Households |
| No Children | 0 (0.0%) | 22 (29.7%) |
| 1 or 2 Children | 0 (0.0%) | 15 (41.7%) |
| 3 or 4 Children | 0 (0.0%) | 0 (0.0%) |
| 5 or more Children | 0 (0.0%) | 0 (0.0%) |
| Total | 0 (0.0%) | 37 (30.8%) |
Race in Williamstown
The most populous races in Williamstown are White / Caucasian (3,573 | 79.4%), Two or more Races (376 | 8.4%), and Asian (291 | 6.5%).
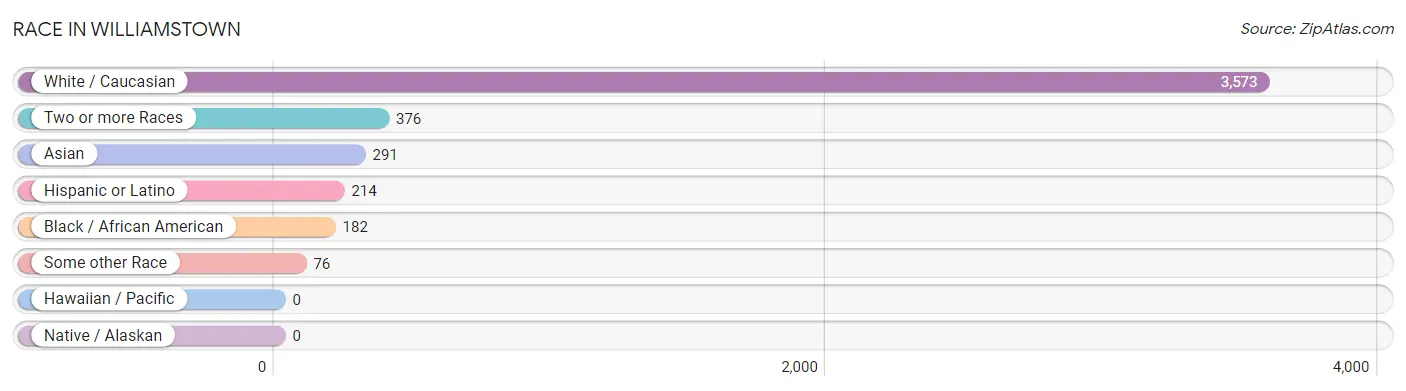
| Race | # Population | % Population |
| Asian | 291 | 6.5% |
| Black / African American | 182 | 4.1% |
| Hawaiian / Pacific | 0 | 0.0% |
| Hispanic or Latino | 214 | 4.8% |
| Native / Alaskan | 0 | 0.0% |
| White / Caucasian | 3,573 | 79.4% |
| Two or more Races | 376 | 8.4% |
| Some other Race | 76 | 1.7% |
| Total | 4,498 | 100.0% |
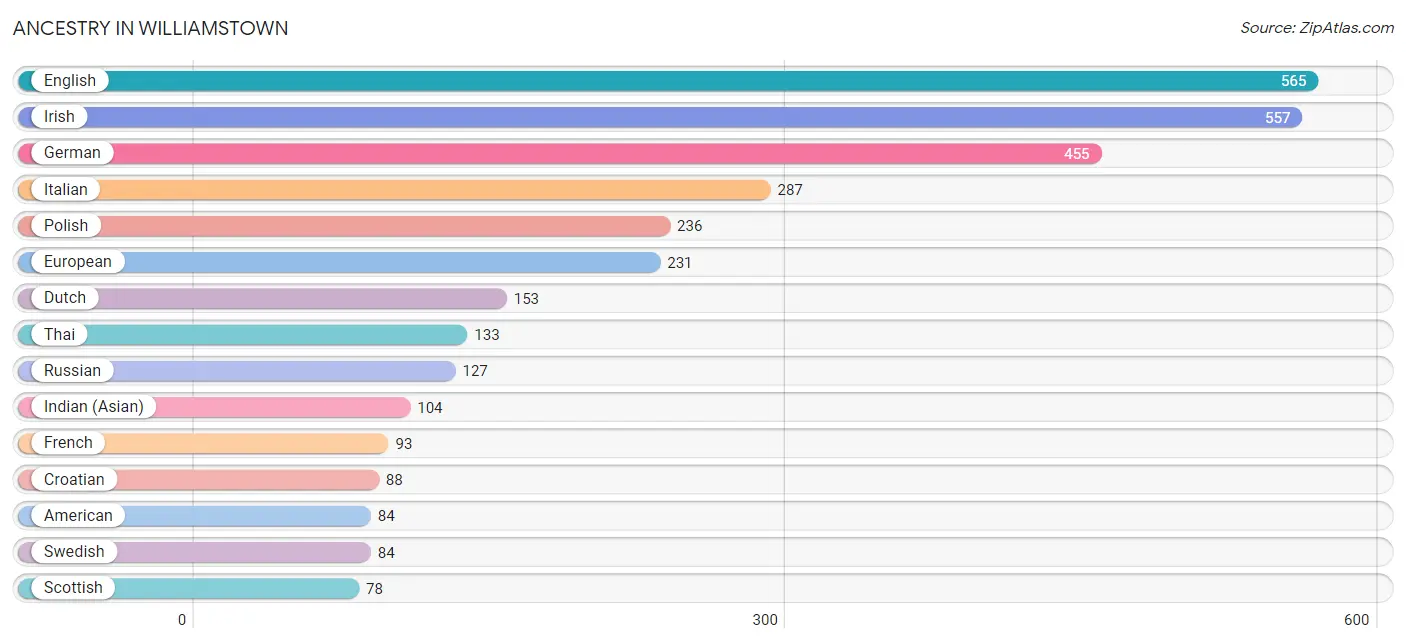
Ancestry in Williamstown
The most populous ancestries reported in Williamstown are English (565 | 12.6%), Irish (557 | 12.4%), German (455 | 10.1%), Italian (287 | 6.4%), and Polish (236 | 5.2%), together accounting for 46.7% of all Williamstown residents.
| Ancestry | # Population | % Population |
| African | 22 | 0.5% |
| Alsatian | 9 | 0.2% |
| American | 84 | 1.9% |
| Arab | 38 | 0.8% |
| Armenian | 3 | 0.1% |
| Austrian | 56 | 1.2% |
| Belgian | 16 | 0.4% |
| Bhutanese | 74 | 1.7% |
| Brazilian | 11 | 0.2% |
| British | 18 | 0.4% |
| British West Indian | 3 | 0.1% |
| Burmese | 74 | 1.7% |
| Central American | 16 | 0.4% |
| Colombian | 16 | 0.4% |
| Costa Rican | 16 | 0.4% |
| Croatian | 88 | 2.0% |
| Cuban | 21 | 0.5% |
| Czech | 3 | 0.1% |
| Dominican | 4 | 0.1% |
| Dutch | 153 | 3.4% |
| Eastern European | 50 | 1.1% |
| English | 565 | 12.6% |
| European | 231 | 5.1% |
| Filipino | 8 | 0.2% |
| Finnish | 29 | 0.6% |
| French | 93 | 2.1% |
| French Canadian | 25 | 0.6% |
| German | 455 | 10.1% |
| Greek | 11 | 0.2% |
| Guyanese | 6 | 0.1% |
| Haitian | 3 | 0.1% |
| Hungarian | 45 | 1.0% |
| Indian (Asian) | 104 | 2.3% |
| Indonesian | 15 | 0.3% |
| Irish | 557 | 12.4% |
| Israeli | 9 | 0.2% |
| Italian | 287 | 6.4% |
| Jamaican | 9 | 0.2% |
| Korean | 35 | 0.8% |
| Latvian | 3 | 0.1% |
| Lebanese | 18 | 0.4% |
| Lithuanian | 72 | 1.6% |
| Macedonian | 40 | 0.9% |
| Mexican | 22 | 0.5% |
| Norwegian | 6 | 0.1% |
| Pakistani | 11 | 0.2% |
| Palestinian | 16 | 0.4% |
| Polish | 236 | 5.2% |
| Portuguese | 10 | 0.2% |
| Puerto Rican | 16 | 0.4% |
| Romanian | 7 | 0.2% |
| Russian | 127 | 2.8% |
| Scandinavian | 35 | 0.8% |
| Scotch-Irish | 39 | 0.9% |
| Scottish | 78 | 1.7% |
| Serbian | 52 | 1.2% |
| Sierra Leonean | 1 | 0.0% |
| Slavic | 10 | 0.2% |
| South American | 16 | 0.4% |
| Spanish | 18 | 0.4% |
| Sri Lankan | 18 | 0.4% |
| Subsaharan African | 29 | 0.6% |
| Swedish | 84 | 1.9% |
| Swiss | 9 | 0.2% |
| Syrian | 18 | 0.4% |
| Thai | 133 | 3.0% |
| Ukrainian | 43 | 1.0% |
| Vietnamese | 20 | 0.4% |
| Welsh | 21 | 0.5% |
| West Indian | 19 | 0.4% |
| Yugoslavian | 8 | 0.2% | View All 71 Rows |
Immigrants in Williamstown
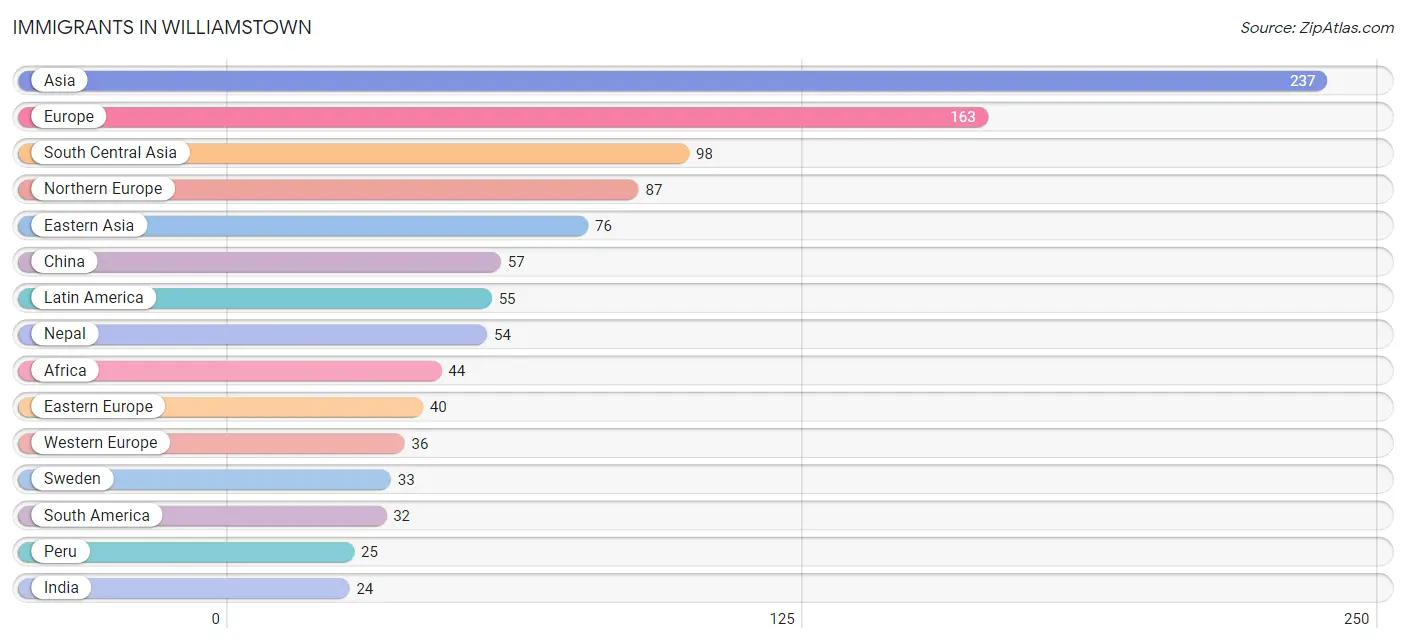
The most numerous immigrant groups reported in Williamstown came from Asia (237 | 5.3%), Europe (163 | 3.6%), South Central Asia (98 | 2.2%), Northern Europe (87 | 1.9%), and Eastern Asia (76 | 1.7%), together accounting for 14.7% of all Williamstown residents.
| Immigration Origin | # Population | % Population |
| Africa | 44 | 1.0% |
| Asia | 237 | 5.3% |
| Australia | 3 | 0.1% |
| Bangladesh | 20 | 0.4% |
| Belgium | 11 | 0.2% |
| Bosnia and Herzegovina | 11 | 0.2% |
| Canada | 2 | 0.0% |
| Caribbean | 23 | 0.5% |
| China | 57 | 1.3% |
| Colombia | 7 | 0.2% |
| Dominican Republic | 18 | 0.4% |
| Eastern Africa | 14 | 0.3% |
| Eastern Asia | 76 | 1.7% |
| Eastern Europe | 40 | 0.9% |
| England | 22 | 0.5% |
| Europe | 163 | 3.6% |
| France | 9 | 0.2% |
| Haiti | 5 | 0.1% |
| Hungary | 3 | 0.1% |
| India | 24 | 0.5% |
| Ireland | 8 | 0.2% |
| Korea | 19 | 0.4% |
| Latin America | 55 | 1.2% |
| Middle Africa | 17 | 0.4% |
| Nepal | 54 | 1.2% |
| Netherlands | 16 | 0.4% |
| Nigeria | 4 | 0.1% |
| Northern Europe | 87 | 1.9% |
| Oceania | 3 | 0.1% |
| Peru | 25 | 0.6% |
| Russia | 5 | 0.1% |
| Sierra Leone | 9 | 0.2% |
| South America | 32 | 0.7% |
| South Central Asia | 98 | 2.2% |
| South Eastern Asia | 14 | 0.3% |
| Sweden | 33 | 0.7% |
| Ukraine | 10 | 0.2% |
| Vietnam | 14 | 0.3% |
| Western Africa | 13 | 0.3% |
| Western Asia | 21 | 0.5% |
| Western Europe | 36 | 0.8% |
| Zaire | 17 | 0.4% | View All 42 Rows |
Sex and Age in Williamstown
Sex and Age in Williamstown
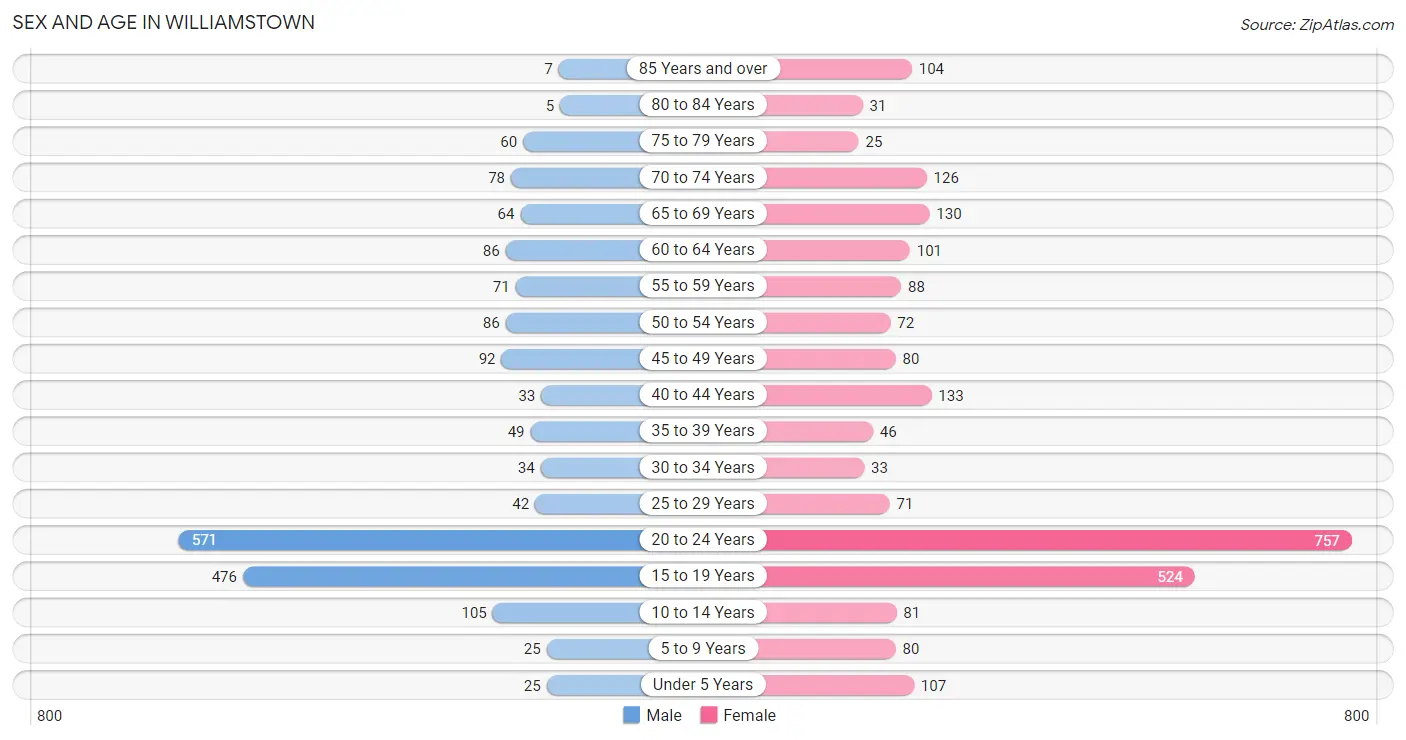
The most populous age groups in Williamstown are 20 to 24 Years (571 | 29.9%) for men and 20 to 24 Years (757 | 29.2%) for women.
| Age Bracket | Male | Female |
| Under 5 Years | 25 (1.3%) | 107 (4.1%) |
| 5 to 9 Years | 25 (1.3%) | 80 (3.1%) |
| 10 to 14 Years | 105 (5.5%) | 81 (3.1%) |
| 15 to 19 Years | 476 (24.9%) | 524 (20.2%) |
| 20 to 24 Years | 571 (29.9%) | 757 (29.2%) |
| 25 to 29 Years | 42 (2.2%) | 71 (2.7%) |
| 30 to 34 Years | 34 (1.8%) | 33 (1.3%) |
| 35 to 39 Years | 49 (2.6%) | 46 (1.8%) |
| 40 to 44 Years | 33 (1.7%) | 133 (5.1%) |
| 45 to 49 Years | 92 (4.8%) | 80 (3.1%) |
| 50 to 54 Years | 86 (4.5%) | 72 (2.8%) |
| 55 to 59 Years | 71 (3.7%) | 88 (3.4%) |
| 60 to 64 Years | 86 (4.5%) | 101 (3.9%) |
| 65 to 69 Years | 64 (3.4%) | 130 (5.0%) |
| 70 to 74 Years | 78 (4.1%) | 126 (4.9%) |
| 75 to 79 Years | 60 (3.1%) | 25 (1.0%) |
| 80 to 84 Years | 5 (0.3%) | 31 (1.2%) |
| 85 Years and over | 7 (0.4%) | 104 (4.0%) |
| Total | 1,909 (100.0%) | 2,589 (100.0%) |
Families and Households in Williamstown
Median Family Size in Williamstown
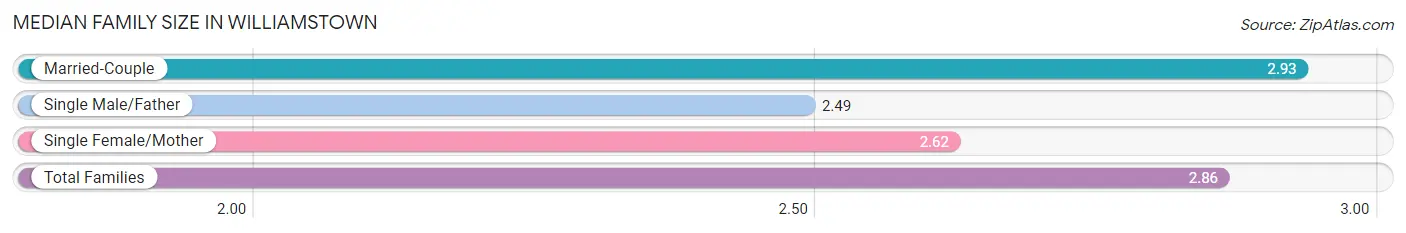
The median family size in Williamstown is 2.86 persons per family, with married-couple families (482 | 80.1%) accounting for the largest median family size of 2.93 persons per family. On the other hand, single male/father families (35 | 5.8%) represent the smallest median family size with 2.49 persons per family.
| Family Type | # Families | Family Size |
| Married-Couple | 482 (80.1%) | 2.93 |
| Single Male/Father | 35 (5.8%) | 2.49 |
| Single Female/Mother | 85 (14.1%) | 2.62 |
| Total Families | 602 (100.0%) | 2.86 |
Median Household Size in Williamstown
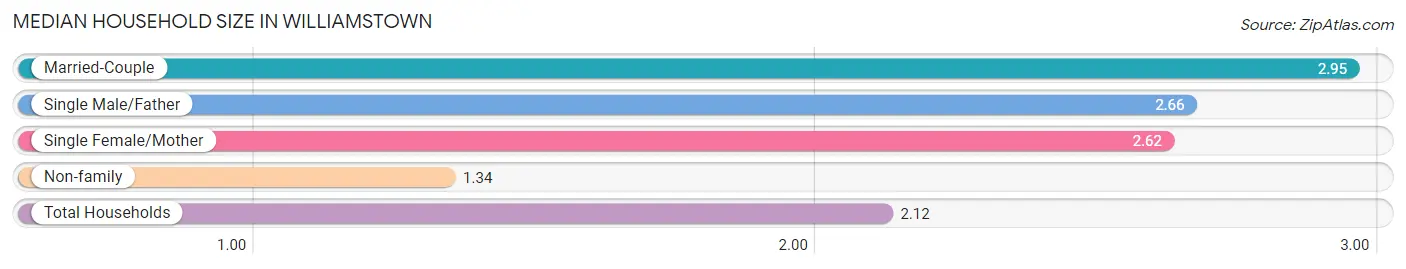
The median household size in Williamstown is 2.12 persons per household, with married-couple households (482 | 40.5%) accounting for the largest median household size of 2.95 persons per household. non-family households (587 | 49.4%) represent the smallest median household size with 1.34 persons per household.
| Household Type | # Households | Household Size |
| Married-Couple | 482 (40.5%) | 2.95 |
| Single Male/Father | 35 (2.9%) | 2.66 |
| Single Female/Mother | 85 (7.1%) | 2.62 |
| Non-family | 587 (49.4%) | 1.34 |
| Total Households | 1,189 (100.0%) | 2.12 |
Household Size by Marriage Status in Williamstown
Out of a total of 1,189 households in Williamstown, 602 (50.6%) are family households, while 587 (49.4%) are nonfamily households. The most numerous type of family households are 2-person households, comprising 313, and the most common type of nonfamily households are 1-person households, comprising 476.
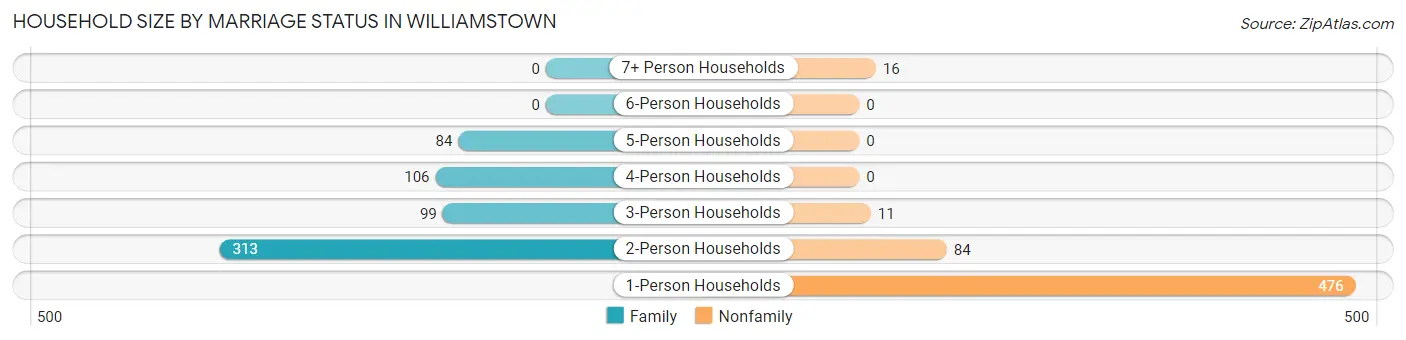
| Household Size | Family Households | Nonfamily Households |
| 1-Person Households | - | 476 (40.0%) |
| 2-Person Households | 313 (26.3%) | 84 (7.1%) |
| 3-Person Households | 99 (8.3%) | 11 (0.9%) |
| 4-Person Households | 106 (8.9%) | 0 (0.0%) |
| 5-Person Households | 84 (7.1%) | 0 (0.0%) |
| 6-Person Households | 0 (0.0%) | 0 (0.0%) |
| 7+ Person Households | 0 (0.0%) | 16 (1.3%) |
| Total | 602 (50.6%) | 587 (49.4%) |
Female Fertility in Williamstown
Fertility by Age in Williamstown
Average fertility rate in Williamstown is 5.0 births per 1,000 women. Women in the age bracket of 20 to 34 years have the highest fertility rate with 10.0 births per 1,000 women. Women in the age bracket of 20 to 34 years acount for 100.0% of all women with births.
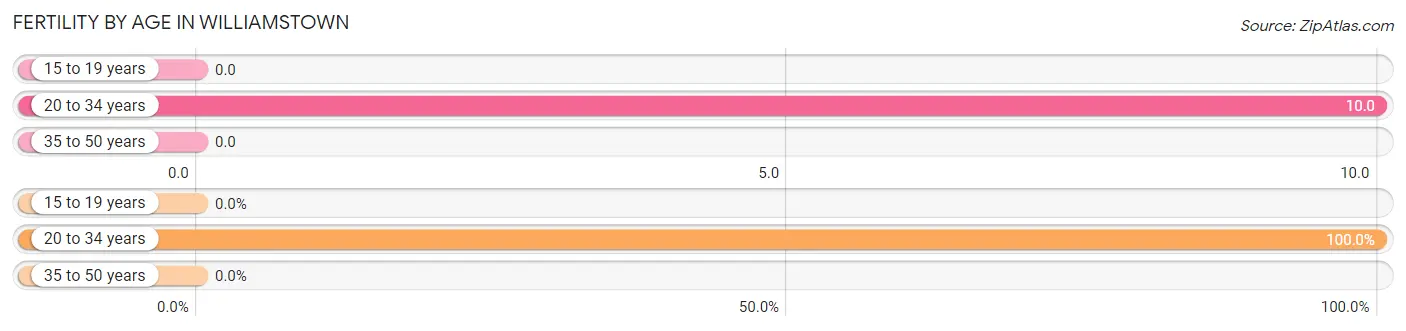
| Age Bracket | Women with Births | Births / 1,000 Women |
| 15 to 19 years | 0 (0.0%) | 0.0 |
| 20 to 34 years | 9 (100.0%) | 10.0 |
| 35 to 50 years | 0 (0.0%) | 0.0 |
| Total | 9 (100.0%) | 5.0 |
Fertility by Age by Marriage Status in Williamstown
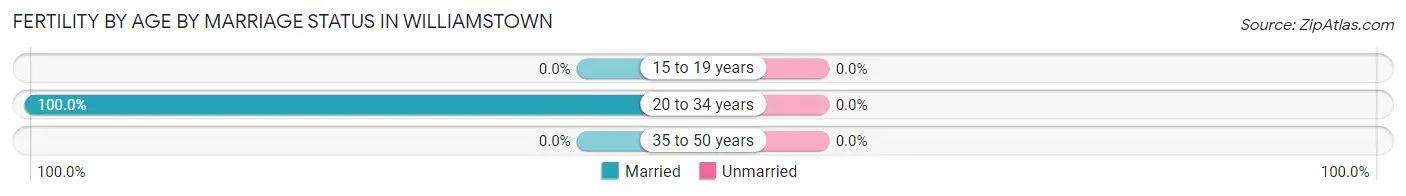
| Age Bracket | Married | Unmarried |
| 15 to 19 years | 0 (0.0%) | 0 (0.0%) |
| 20 to 34 years | 9 (100.0%) | 0 (0.0%) |
| 35 to 50 years | 0 (0.0%) | 0 (0.0%) |
| Total | 9 (100.0%) | 0 (0.0%) |
Fertility by Education in Williamstown
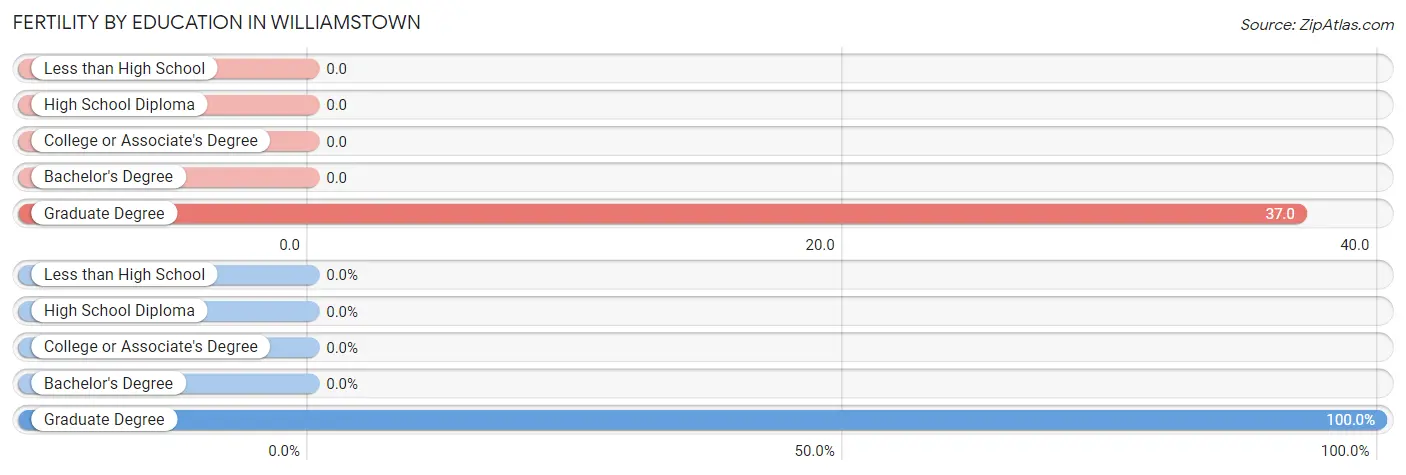
| Educational Attainment | Women with Births | Births / 1,000 Women |
| Less than High School | 0 (0.0%) | 0.0 |
| High School Diploma | 0 (0.0%) | 0.0 |
| College or Associate's Degree | 0 (0.0%) | 0.0 |
| Bachelor's Degree | 0 (0.0%) | 0.0 |
| Graduate Degree | 9 (100.0%) | 37.0 |
| Total | 9 (100.0%) | 5.0 |
Fertility by Education by Marriage Status in Williamstown
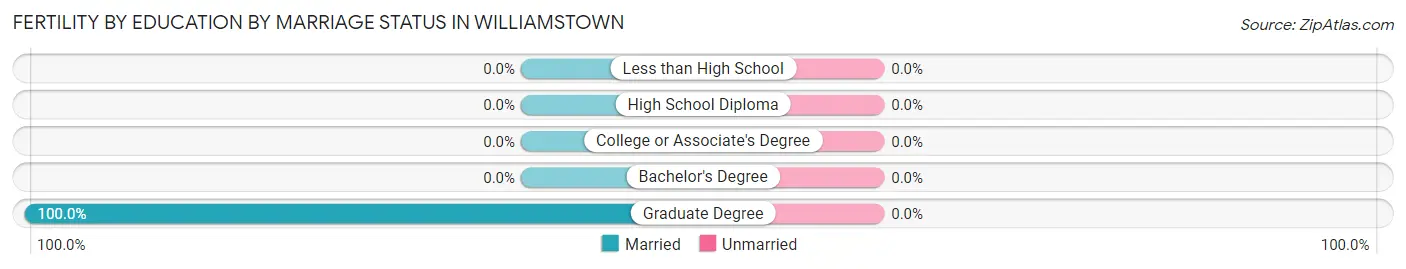
| Educational Attainment | Married | Unmarried |
| Less than High School | 0 (0.0%) | 0 (0.0%) |
| High School Diploma | 0 (0.0%) | 0 (0.0%) |
| College or Associate's Degree | 0 (0.0%) | 0 (0.0%) |
| Bachelor's Degree | 0 (0.0%) | 0 (0.0%) |
| Graduate Degree | 9 (100.0%) | 0 (0.0%) |
| Total | 9 (100.0%) | 0 (0.0%) |
Employment Characteristics in Williamstown
Employment by Class of Employer in Williamstown
Among the 2,210 employed individuals in Williamstown, not-for-profit organizations (1,360 | 61.5%), private company employees (386 | 17.5%), and self-employed (not incorporated) (211 | 9.6%) make up the most common classes of employment.
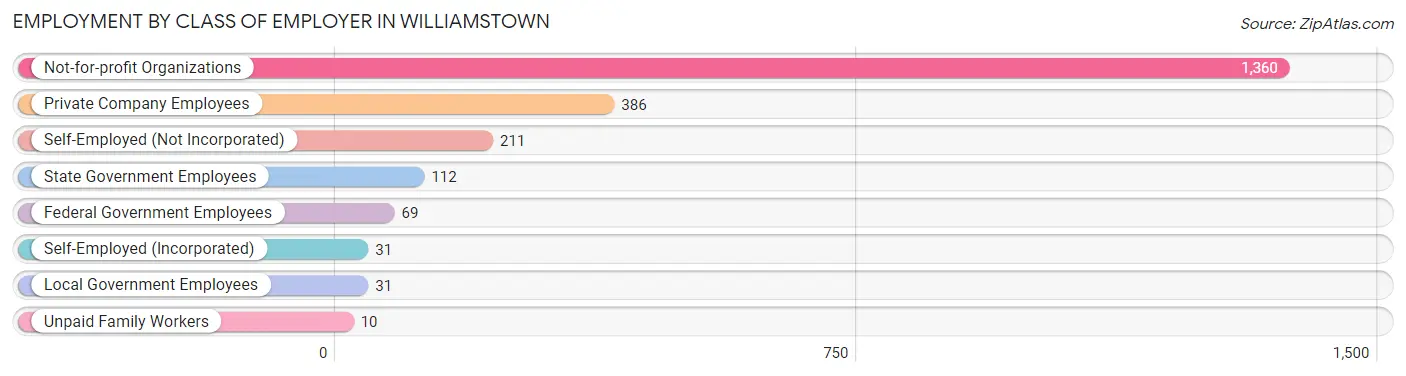
| Employer Class | # Employees | % Employees |
| Private Company Employees | 386 | 17.5% |
| Self-Employed (Incorporated) | 31 | 1.4% |
| Self-Employed (Not Incorporated) | 211 | 9.6% |
| Not-for-profit Organizations | 1,360 | 61.5% |
| Local Government Employees | 31 | 1.4% |
| State Government Employees | 112 | 5.1% |
| Federal Government Employees | 69 | 3.1% |
| Unpaid Family Workers | 10 | 0.4% |
| Total | 2,210 | 100.0% |
Employment Status by Age in Williamstown
According to the labor force statistics for Williamstown, out of the total population over 16 years of age (4,051), 59.3% or 2,402 individuals are in the labor force, with 0.7% or 17 of them unemployed. The age group with the highest labor force participation rate is 30 to 34 years, with 100.0% or 67 individuals in the labor force. Within the labor force, the 16 to 19 years age range has the highest percentage of unemployed individuals, with 2.7% or 11 of them being unemployed.
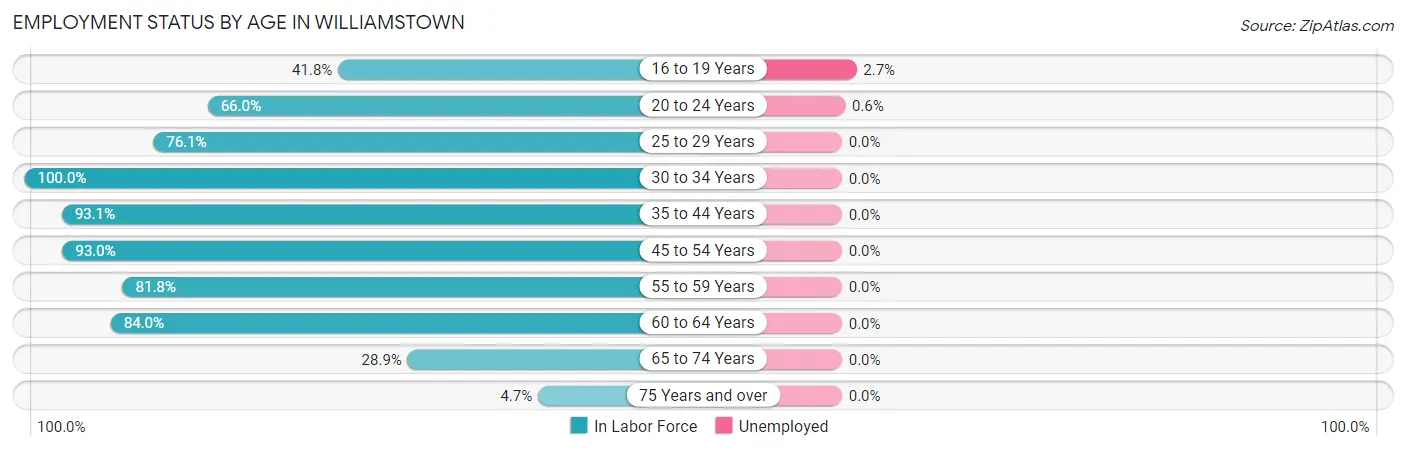
| Age Bracket | In Labor Force | Unemployed |
| 16 to 19 Years | 408 (41.8%) | 11 (2.7%) |
| 20 to 24 Years | 876 (66.0%) | 5 (0.6%) |
| 25 to 29 Years | 86 (76.1%) | 0 (0.0%) |
| 30 to 34 Years | 67 (100.0%) | 0 (0.0%) |
| 35 to 44 Years | 243 (93.1%) | 0 (0.0%) |
| 45 to 54 Years | 307 (93.0%) | 0 (0.0%) |
| 55 to 59 Years | 130 (81.8%) | 0 (0.0%) |
| 60 to 64 Years | 157 (84.0%) | 0 (0.0%) |
| 65 to 74 Years | 115 (28.9%) | 0 (0.0%) |
| 75 Years and over | 11 (4.7%) | 0 (0.0%) |
| Total | 2,402 (59.3%) | 17 (0.7%) |
Employment Status by Educational Attainment in Williamstown
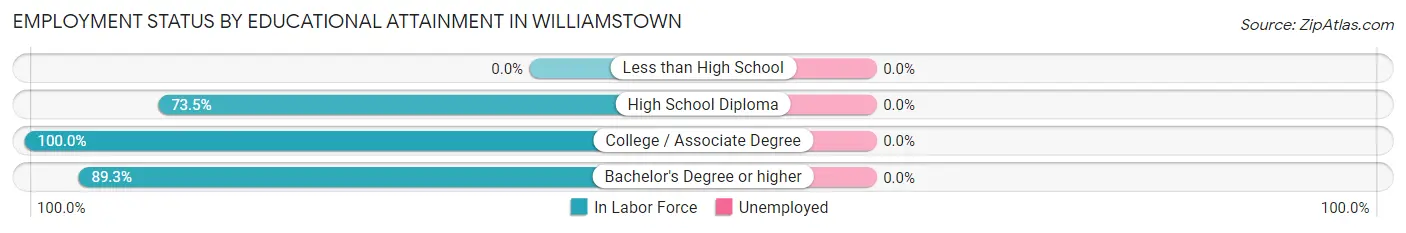
| Educational Attainment | In Labor Force | Unemployed |
| Less than High School | 0 (0.0%) | 0 (0.0%) |
| High School Diploma | 50 (73.5%) | 0 (0.0%) |
| College / Associate Degree | 26 (100.0%) | 0 (0.0%) |
| Bachelor's Degree or higher | 914 (89.3%) | 0 (0.0%) |
| Total | 990 (88.6%) | 0 (0.0%) |
Employment Occupations by Sex in Williamstown
Management, Business, Science and Arts Occupations
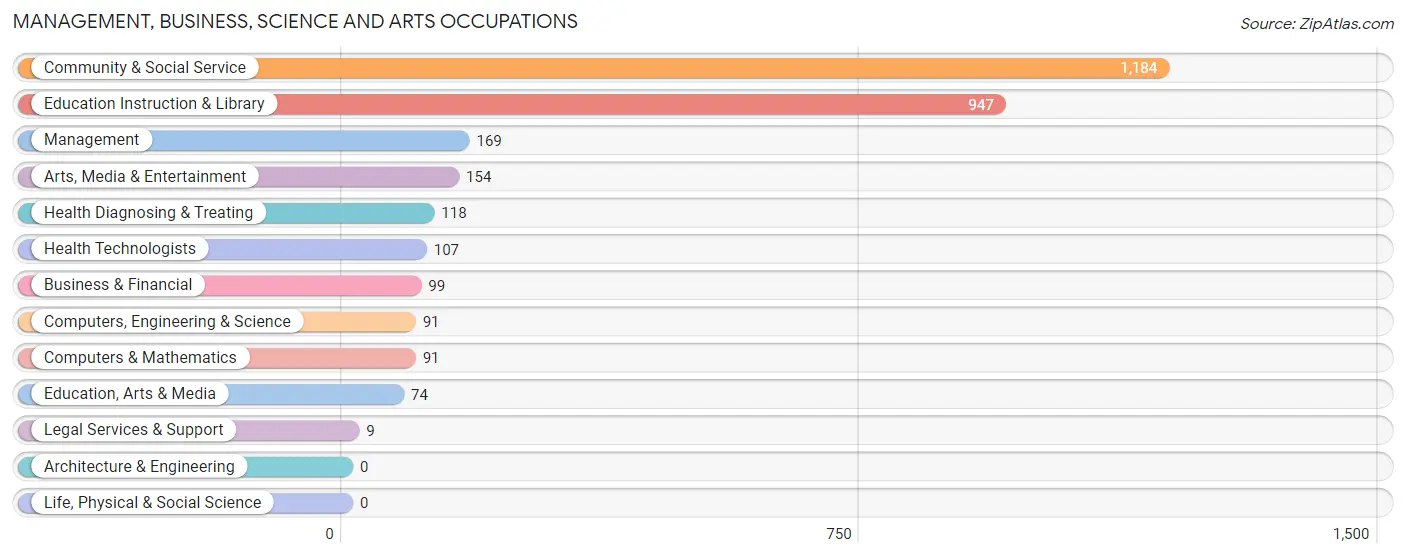
The most common Management, Business, Science and Arts occupations in Williamstown are Community & Social Service (1,184 | 49.6%), Education Instruction & Library (947 | 39.7%), Management (169 | 7.1%), Arts, Media & Entertainment (154 | 6.5%), and Health Diagnosing & Treating (118 | 5.0%).
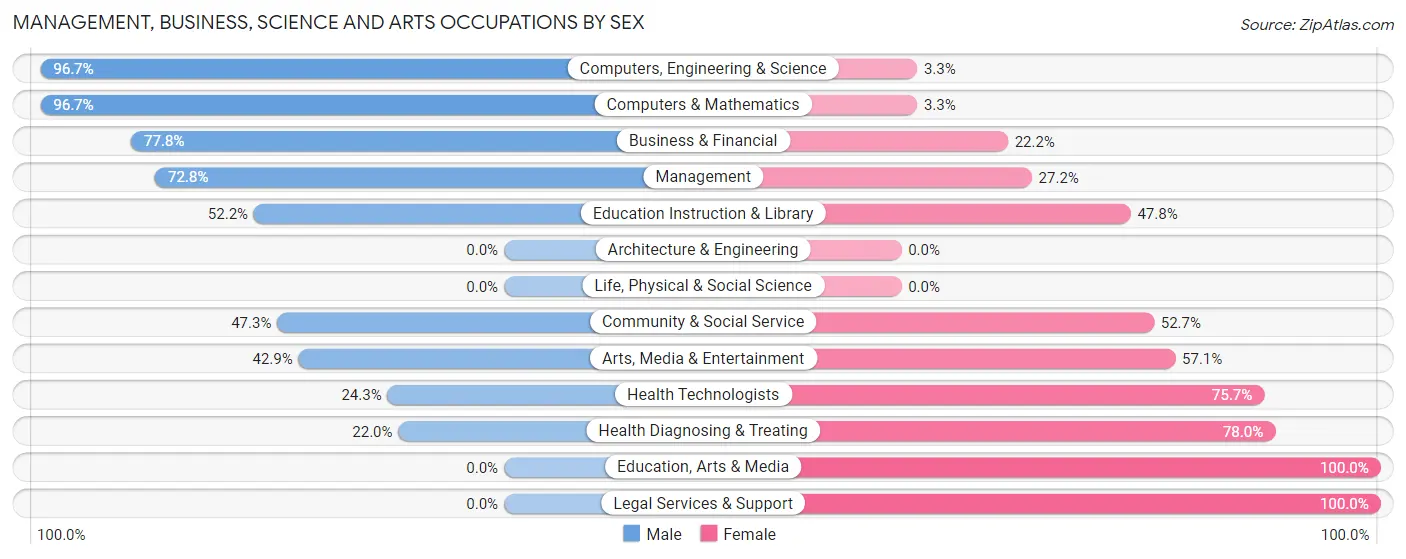
Management, Business, Science and Arts Occupations by Sex
Within the Management, Business, Science and Arts occupations in Williamstown, the most male-oriented occupations are Computers, Engineering & Science (96.7%), Computers & Mathematics (96.7%), and Business & Financial (77.8%), while the most female-oriented occupations are Education, Arts & Media (100.0%), Legal Services & Support (100.0%), and Health Diagnosing & Treating (78.0%).
| Occupation | Male | Female |
| Management | 123 (72.8%) | 46 (27.2%) |
| Business & Financial | 77 (77.8%) | 22 (22.2%) |
| Computers, Engineering & Science | 88 (96.7%) | 3 (3.3%) |
| Computers & Mathematics | 88 (96.7%) | 3 (3.3%) |
| Architecture & Engineering | 0 (0.0%) | 0 (0.0%) |
| Life, Physical & Social Science | 0 (0.0%) | 0 (0.0%) |
| Community & Social Service | 560 (47.3%) | 624 (52.7%) |
| Education, Arts & Media | 0 (0.0%) | 74 (100.0%) |
| Legal Services & Support | 0 (0.0%) | 9 (100.0%) |
| Education Instruction & Library | 494 (52.2%) | 453 (47.8%) |
| Arts, Media & Entertainment | 66 (42.9%) | 88 (57.1%) |
| Health Diagnosing & Treating | 26 (22.0%) | 92 (78.0%) |
| Health Technologists | 26 (24.3%) | 81 (75.7%) |
| Total (Category) | 874 (52.6%) | 787 (47.4%) |
| Total (Overall) | 1,084 (45.5%) | 1,301 (54.5%) |
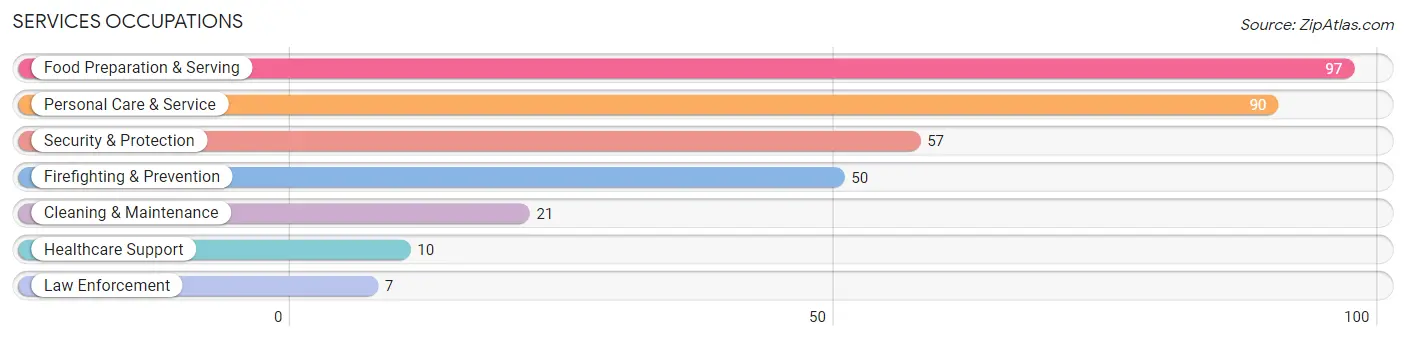
Services Occupations
The most common Services occupations in Williamstown are Food Preparation & Serving (97 | 4.1%), Personal Care & Service (90 | 3.8%), Security & Protection (57 | 2.4%), Firefighting & Prevention (50 | 2.1%), and Cleaning & Maintenance (21 | 0.9%).
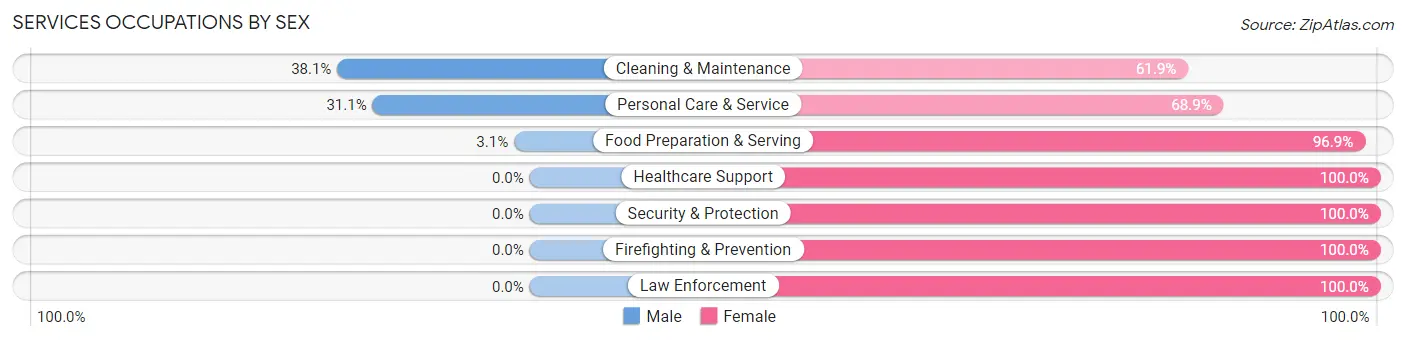
Services Occupations by Sex
Within the Services occupations in Williamstown, the most male-oriented occupations are Cleaning & Maintenance (38.1%), Personal Care & Service (31.1%), and Food Preparation & Serving (3.1%), while the most female-oriented occupations are Healthcare Support (100.0%), Security & Protection (100.0%), and Firefighting & Prevention (100.0%).
| Occupation | Male | Female |
| Healthcare Support | 0 (0.0%) | 10 (100.0%) |
| Security & Protection | 0 (0.0%) | 57 (100.0%) |
| Firefighting & Prevention | 0 (0.0%) | 50 (100.0%) |
| Law Enforcement | 0 (0.0%) | 7 (100.0%) |
| Food Preparation & Serving | 3 (3.1%) | 94 (96.9%) |
| Cleaning & Maintenance | 8 (38.1%) | 13 (61.9%) |
| Personal Care & Service | 28 (31.1%) | 62 (68.9%) |
| Total (Category) | 39 (14.2%) | 236 (85.8%) |
| Total (Overall) | 1,084 (45.5%) | 1,301 (54.5%) |
Sales and Office Occupations
The most common Sales and Office occupations in Williamstown are Office & Administration (235 | 9.9%), and Sales & Related (164 | 6.9%).
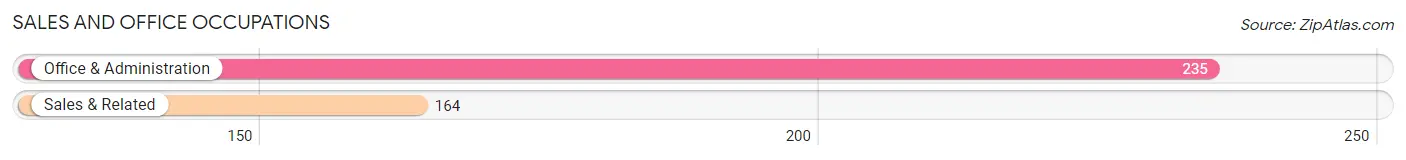
Sales and Office Occupations by Sex
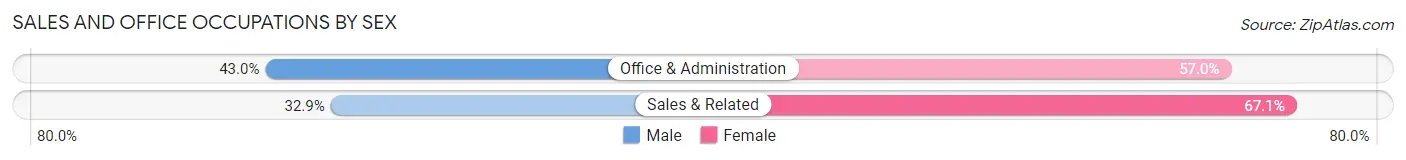
| Occupation | Male | Female |
| Sales & Related | 54 (32.9%) | 110 (67.1%) |
| Office & Administration | 101 (43.0%) | 134 (57.0%) |
| Total (Category) | 155 (38.9%) | 244 (61.2%) |
| Total (Overall) | 1,084 (45.5%) | 1,301 (54.5%) |
Natural Resources, Construction and Maintenance Occupations
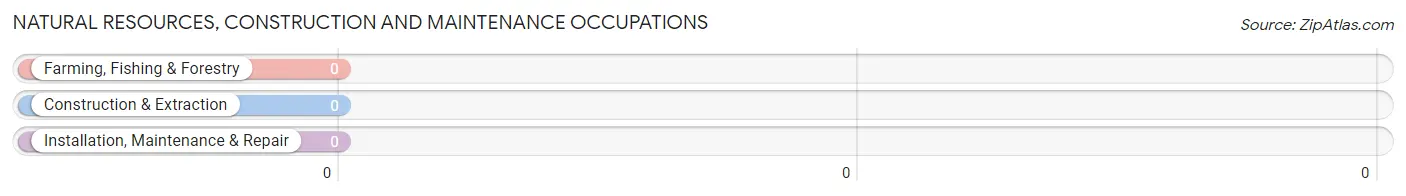
Natural Resources, Construction and Maintenance Occupations by Sex
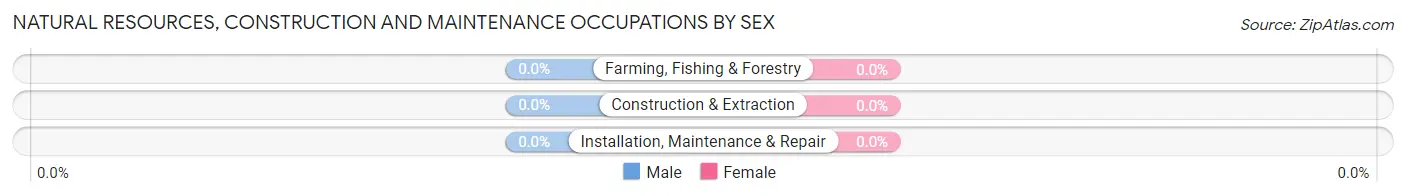
| Occupation | Male | Female |
| Farming, Fishing & Forestry | 0 (0.0%) | 0 (0.0%) |
| Construction & Extraction | 0 (0.0%) | 0 (0.0%) |
| Installation, Maintenance & Repair | 0 (0.0%) | 0 (0.0%) |
| Total (Category) | 0 (0.0%) | 0 (0.0%) |
| Total (Overall) | 1,084 (45.5%) | 1,301 (54.5%) |
Production, Transportation and Moving Occupations
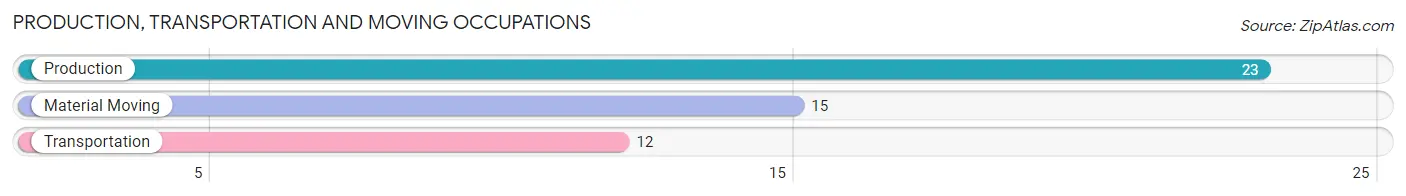
The most common Production, Transportation and Moving occupations in Williamstown are Production (23 | 1.0%), Material Moving (15 | 0.6%), and Transportation (12 | 0.5%).
Production, Transportation and Moving Occupations by Sex
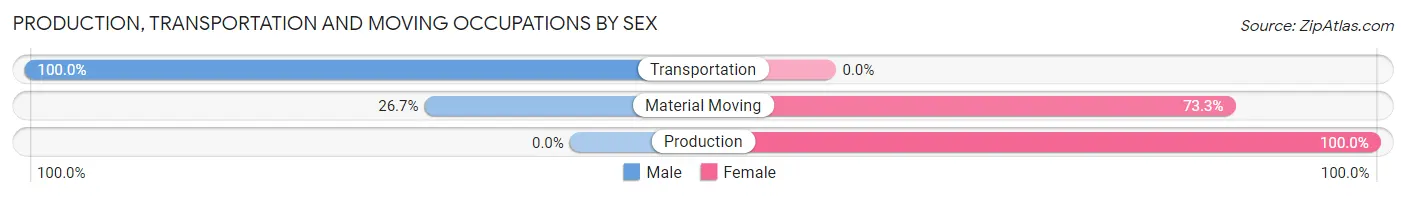
| Occupation | Male | Female |
| Production | 0 (0.0%) | 23 (100.0%) |
| Transportation | 12 (100.0%) | 0 (0.0%) |
| Material Moving | 4 (26.7%) | 11 (73.3%) |
| Total (Category) | 16 (32.0%) | 34 (68.0%) |
| Total (Overall) | 1,084 (45.5%) | 1,301 (54.5%) |
Employment Industries by Sex in Williamstown
Employment Industries in Williamstown
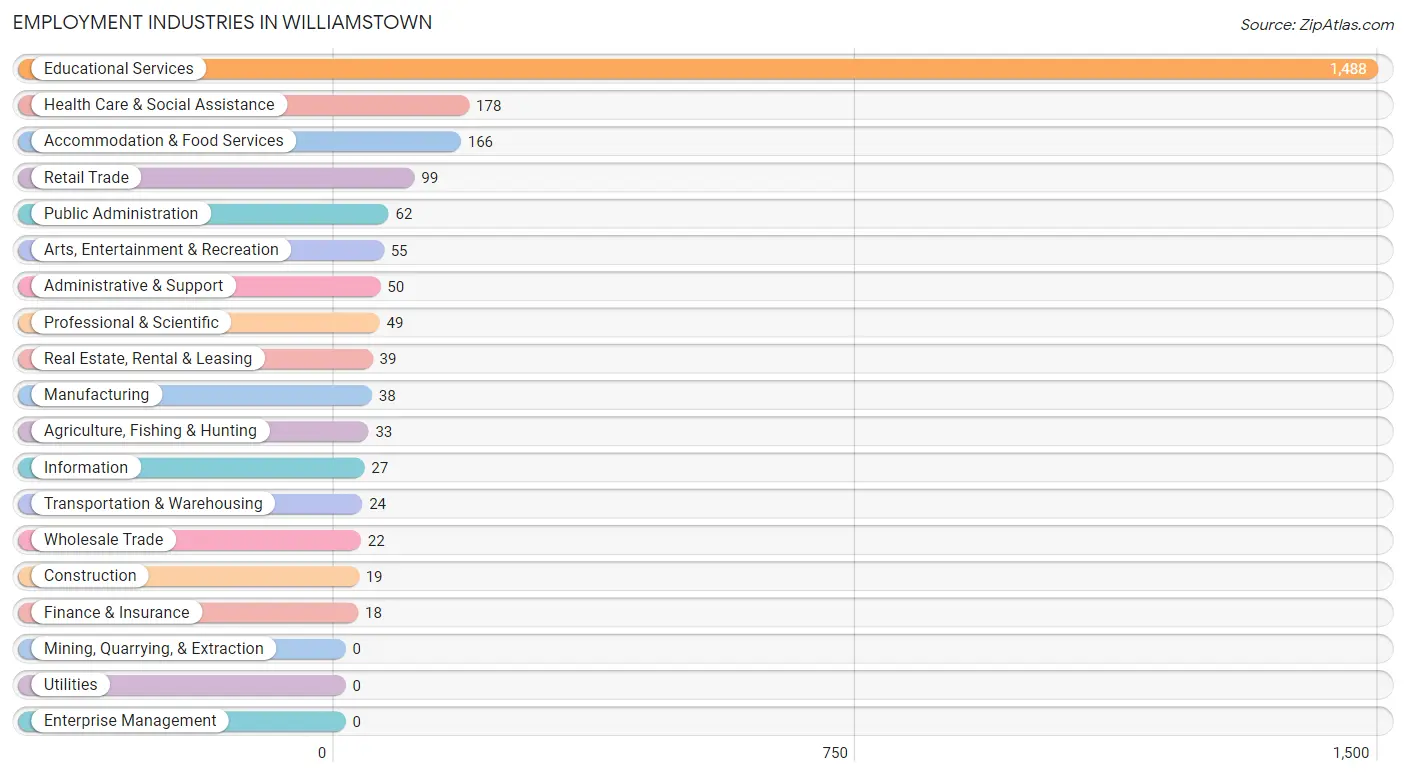
The major employment industries in Williamstown include Educational Services (1,488 | 62.4%), Health Care & Social Assistance (178 | 7.5%), Accommodation & Food Services (166 | 7.0%), Retail Trade (99 | 4.2%), and Public Administration (62 | 2.6%).
Employment Industries by Sex in Williamstown
The Williamstown industries that see more men than women are Agriculture, Fishing & Hunting (100.0%), Construction (100.0%), and Transportation & Warehousing (100.0%), whereas the industries that tend to have a higher number of women are Arts, Entertainment & Recreation (100.0%), Public Administration (100.0%), and Accommodation & Food Services (91.0%).
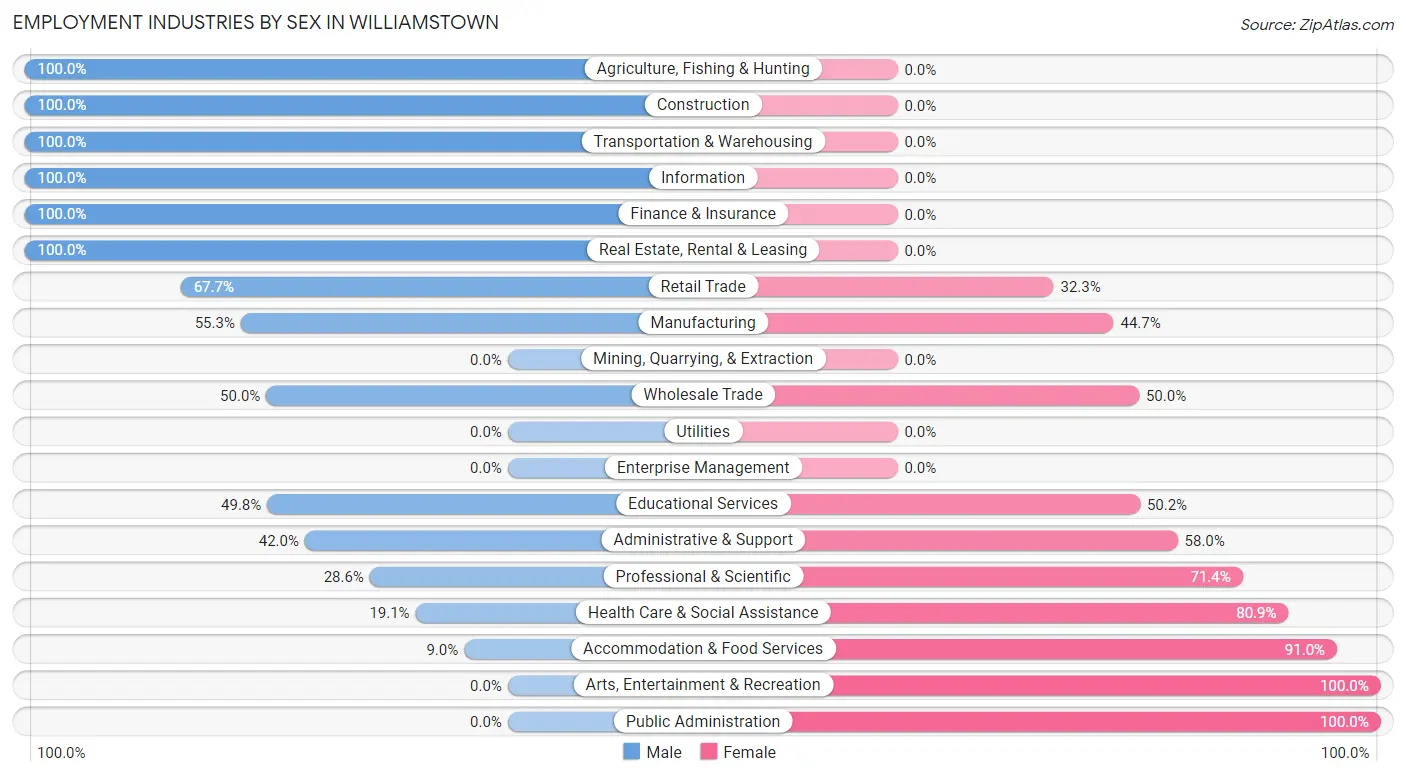
| Industry | Male | Female |
| Agriculture, Fishing & Hunting | 33 (100.0%) | 0 (0.0%) |
| Mining, Quarrying, & Extraction | 0 (0.0%) | 0 (0.0%) |
| Construction | 19 (100.0%) | 0 (0.0%) |
| Manufacturing | 21 (55.3%) | 17 (44.7%) |
| Wholesale Trade | 11 (50.0%) | 11 (50.0%) |
| Retail Trade | 67 (67.7%) | 32 (32.3%) |
| Transportation & Warehousing | 24 (100.0%) | 0 (0.0%) |
| Utilities | 0 (0.0%) | 0 (0.0%) |
| Information | 27 (100.0%) | 0 (0.0%) |
| Finance & Insurance | 18 (100.0%) | 0 (0.0%) |
| Real Estate, Rental & Leasing | 39 (100.0%) | 0 (0.0%) |
| Professional & Scientific | 14 (28.6%) | 35 (71.4%) |
| Enterprise Management | 0 (0.0%) | 0 (0.0%) |
| Administrative & Support | 21 (42.0%) | 29 (58.0%) |
| Educational Services | 741 (49.8%) | 747 (50.2%) |
| Health Care & Social Assistance | 34 (19.1%) | 144 (80.9%) |
| Arts, Entertainment & Recreation | 0 (0.0%) | 55 (100.0%) |
| Accommodation & Food Services | 15 (9.0%) | 151 (91.0%) |
| Public Administration | 0 (0.0%) | 62 (100.0%) |
| Total | 1,084 (45.5%) | 1,301 (54.5%) |
Education in Williamstown
School Enrollment in Williamstown
The most common levels of schooling among the 2,684 students in Williamstown are college / undergraduate (2,152 | 80.2%), high school (146 | 5.4%), and middle school (139 | 5.2%).
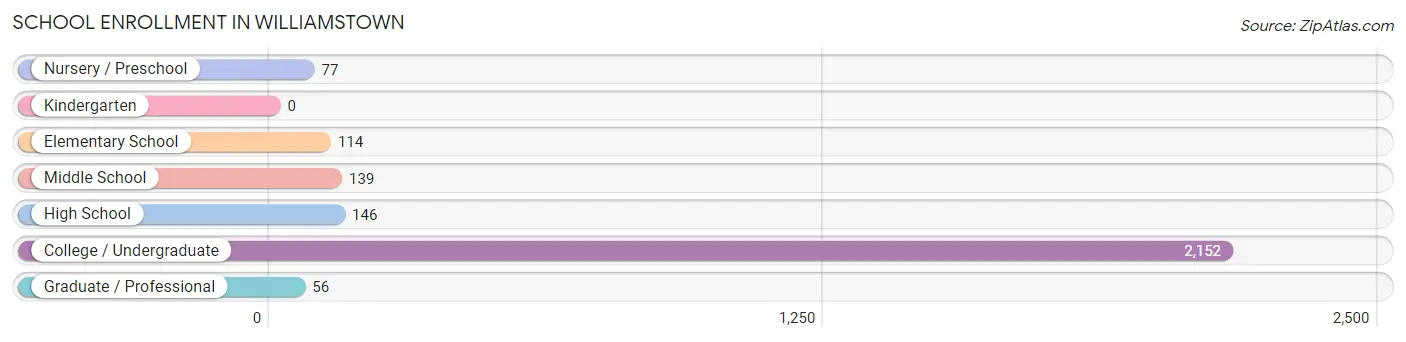
| School Level | # Students | % Students |
| Nursery / Preschool | 77 | 2.9% |
| Kindergarten | 0 | 0.0% |
| Elementary School | 114 | 4.3% |
| Middle School | 139 | 5.2% |
| High School | 146 | 5.4% |
| College / Undergraduate | 2,152 | 80.2% |
| Graduate / Professional | 56 | 2.1% |
| Total | 2,684 | 100.0% |
School Enrollment by Age by Funding Source in Williamstown
Out of a total of 2,684 students who are enrolled in schools in Williamstown, 1,683 (62.7%) attend a private institution, while the remaining 1,001 (37.3%) are enrolled in public schools. The age group of 3 to 4 year olds has the highest likelihood of being enrolled in private schools, with 62 (80.5% in the age bracket) enrolled. Conversely, the age group of 5 to 9 year old has the lowest likelihood of being enrolled in a private school, with 105 (100.0% in the age bracket) attending a public institution.
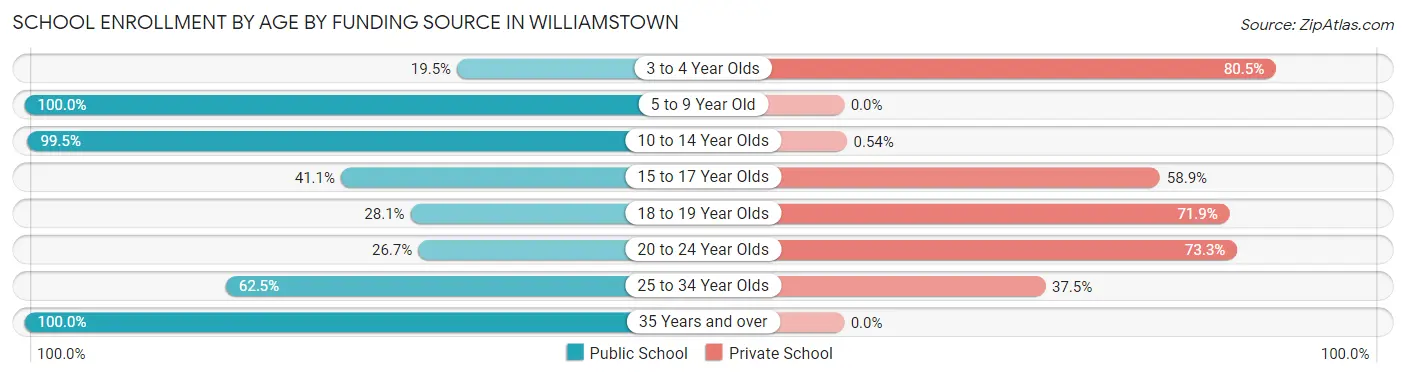
| Age Bracket | Public School | Private School |
| 3 to 4 Year Olds | 15 (19.5%) | 62 (80.5%) |
| 5 to 9 Year Old | 105 (100.0%) | 0 (0.0%) |
| 10 to 14 Year Olds | 185 (99.5%) | 1 (0.5%) |
| 15 to 17 Year Olds | 60 (41.1%) | 86 (58.9%) |
| 18 to 19 Year Olds | 235 (28.1%) | 600 (71.9%) |
| 20 to 24 Year Olds | 335 (26.7%) | 919 (73.3%) |
| 25 to 34 Year Olds | 25 (62.5%) | 15 (37.5%) |
| 35 Years and over | 41 (100.0%) | 0 (0.0%) |
| Total | 1,001 (37.3%) | 1,683 (62.7%) |
Educational Attainment by Field of Study in Williamstown
Literature & languages (310 | 20.3%), bio, nature & agricultural (177 | 11.6%), visual & performing arts (173 | 11.3%), liberal arts & history (162 | 10.6%), and social sciences (131 | 8.6%) are the most common fields of study among 1,527 individuals in Williamstown who have obtained a bachelor's degree or higher.
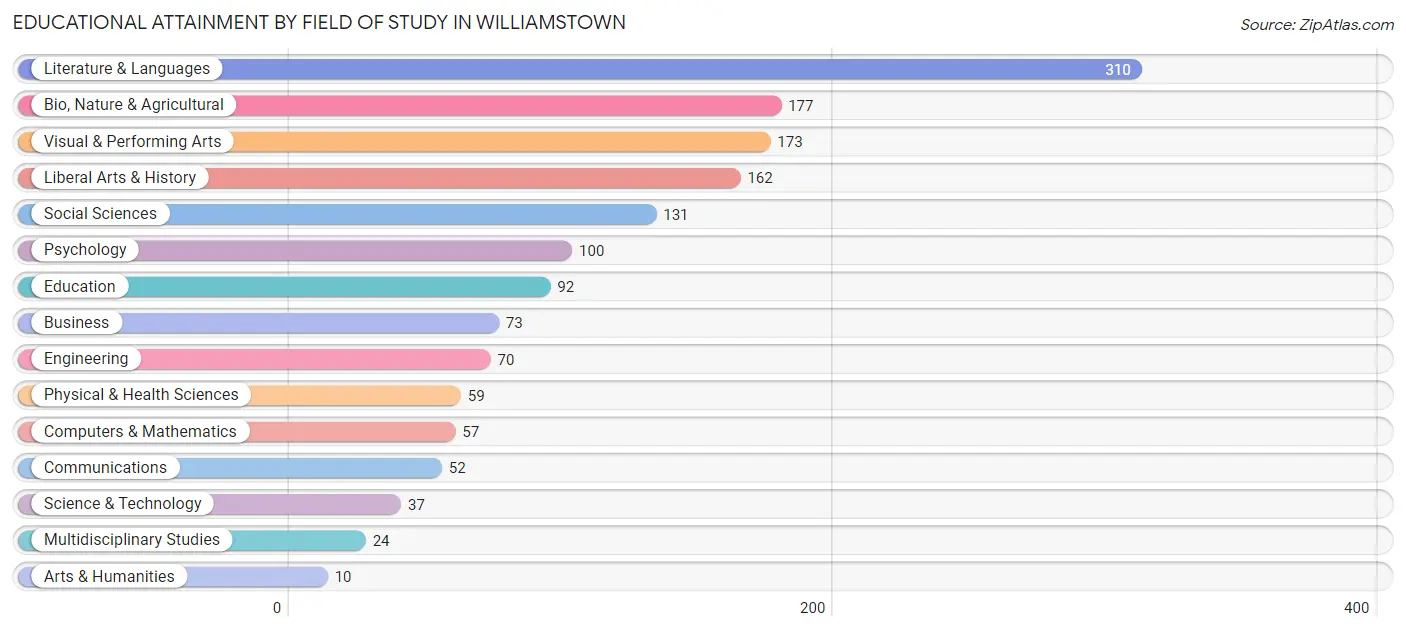
| Field of Study | # Graduates | % Graduates |
| Computers & Mathematics | 57 | 3.7% |
| Bio, Nature & Agricultural | 177 | 11.6% |
| Physical & Health Sciences | 59 | 3.9% |
| Psychology | 100 | 6.6% |
| Social Sciences | 131 | 8.6% |
| Engineering | 70 | 4.6% |
| Multidisciplinary Studies | 24 | 1.6% |
| Science & Technology | 37 | 2.4% |
| Business | 73 | 4.8% |
| Education | 92 | 6.0% |
| Literature & Languages | 310 | 20.3% |
| Liberal Arts & History | 162 | 10.6% |
| Visual & Performing Arts | 173 | 11.3% |
| Communications | 52 | 3.4% |
| Arts & Humanities | 10 | 0.6% |
| Total | 1,527 | 100.0% |
Transportation & Commute in Williamstown
Vehicle Availability by Sex in Williamstown
The most prevalent vehicle ownership categories in Williamstown are males with 2 vehicles (287, accounting for 50.8%) and females with 2 vehicles (349, making up 44.2%).
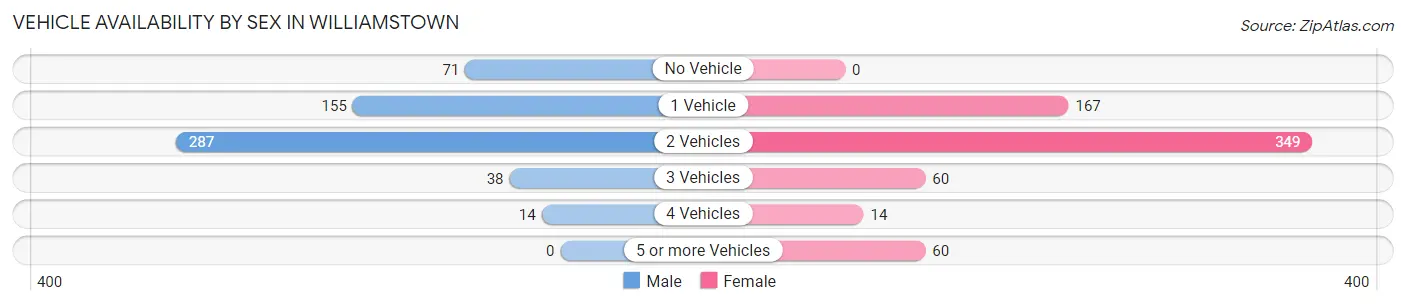
| Vehicles Available | Male | Female |
| No Vehicle | 71 (12.6%) | 0 (0.0%) |
| 1 Vehicle | 155 (27.4%) | 167 (25.7%) |
| 2 Vehicles | 287 (50.8%) | 349 (53.7%) |
| 3 Vehicles | 38 (6.7%) | 60 (9.2%) |
| 4 Vehicles | 14 (2.5%) | 14 (2.1%) |
| 5 or more Vehicles | 0 (0.0%) | 60 (9.2%) |
| Total | 565 (100.0%) | 650 (100.0%) |
Commute Time in Williamstown
The most frequently occuring commute durations in Williamstown are 5 to 9 minutes (603 commuters, 32.1%), 10 to 14 minutes (509 commuters, 27.1%), and less than 5 minutes (262 commuters, 13.9%).
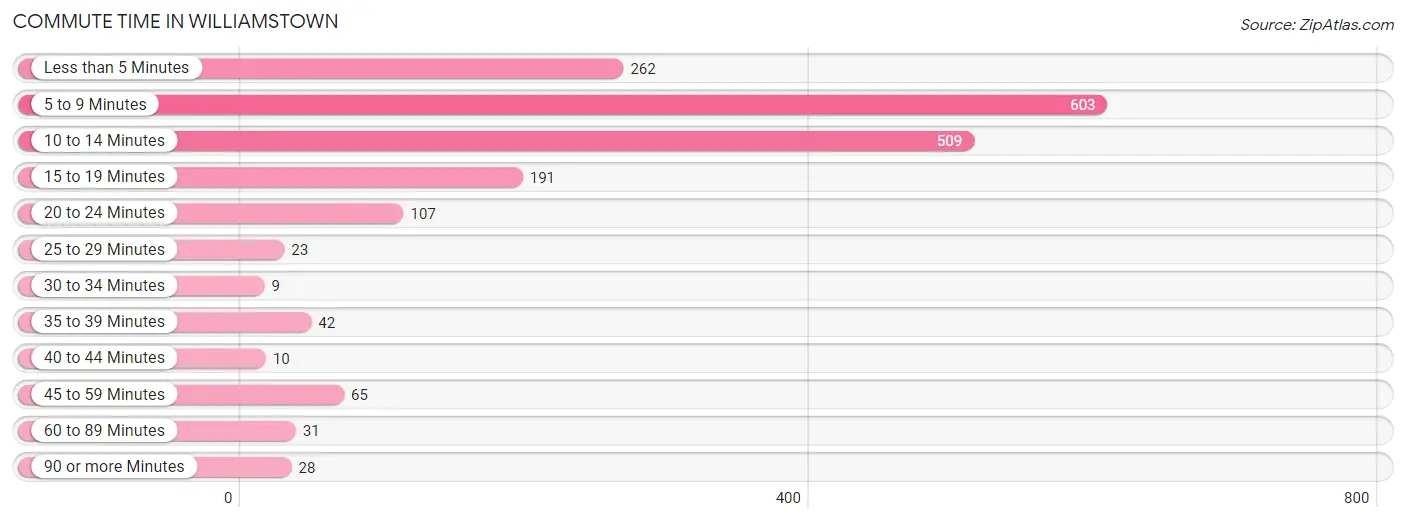
| Commute Time | # Commuters | % Commuters |
| Less than 5 Minutes | 262 | 13.9% |
| 5 to 9 Minutes | 603 | 32.1% |
| 10 to 14 Minutes | 509 | 27.1% |
| 15 to 19 Minutes | 191 | 10.2% |
| 20 to 24 Minutes | 107 | 5.7% |
| 25 to 29 Minutes | 23 | 1.2% |
| 30 to 34 Minutes | 9 | 0.5% |
| 35 to 39 Minutes | 42 | 2.2% |
| 40 to 44 Minutes | 10 | 0.5% |
| 45 to 59 Minutes | 65 | 3.5% |
| 60 to 89 Minutes | 31 | 1.7% |
| 90 or more Minutes | 28 | 1.5% |
Commute Time by Sex in Williamstown
The most common commute times in Williamstown are 5 to 9 minutes (298 commuters, 36.2%) for males and 10 to 14 minutes (345 commuters, 32.7%) for females.
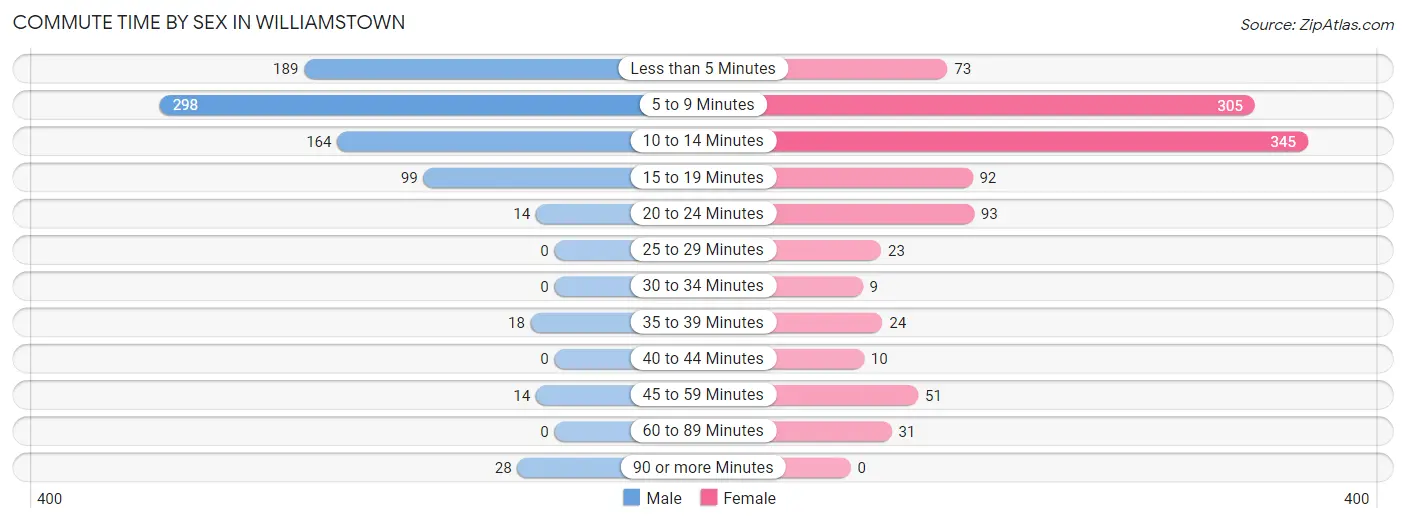
| Commute Time | Male | Female |
| Less than 5 Minutes | 189 (22.9%) | 73 (6.9%) |
| 5 to 9 Minutes | 298 (36.2%) | 305 (28.9%) |
| 10 to 14 Minutes | 164 (19.9%) | 345 (32.7%) |
| 15 to 19 Minutes | 99 (12.0%) | 92 (8.7%) |
| 20 to 24 Minutes | 14 (1.7%) | 93 (8.8%) |
| 25 to 29 Minutes | 0 (0.0%) | 23 (2.2%) |
| 30 to 34 Minutes | 0 (0.0%) | 9 (0.9%) |
| 35 to 39 Minutes | 18 (2.2%) | 24 (2.3%) |
| 40 to 44 Minutes | 0 (0.0%) | 10 (0.9%) |
| 45 to 59 Minutes | 14 (1.7%) | 51 (4.8%) |
| 60 to 89 Minutes | 0 (0.0%) | 31 (2.9%) |
| 90 or more Minutes | 28 (3.4%) | 0 (0.0%) |
Time of Departure to Work by Sex in Williamstown
The most frequent times of departure to work in Williamstown are 12:00 PM to 3:59 PM (175, 21.2%) for males and 12:00 PM to 3:59 PM (254, 24.0%) for females.
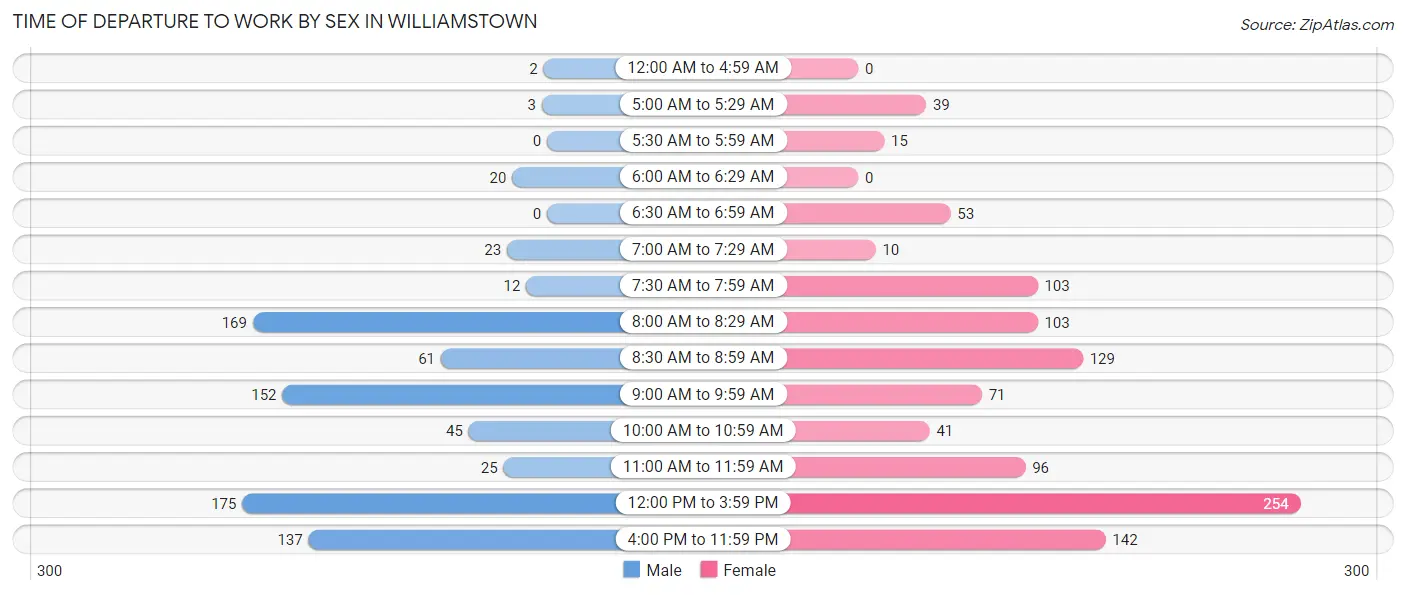
| Time of Departure | Male | Female |
| 12:00 AM to 4:59 AM | 2 (0.2%) | 0 (0.0%) |
| 5:00 AM to 5:29 AM | 3 (0.4%) | 39 (3.7%) |
| 5:30 AM to 5:59 AM | 0 (0.0%) | 15 (1.4%) |
| 6:00 AM to 6:29 AM | 20 (2.4%) | 0 (0.0%) |
| 6:30 AM to 6:59 AM | 0 (0.0%) | 53 (5.0%) |
| 7:00 AM to 7:29 AM | 23 (2.8%) | 10 (0.9%) |
| 7:30 AM to 7:59 AM | 12 (1.5%) | 103 (9.8%) |
| 8:00 AM to 8:29 AM | 169 (20.5%) | 103 (9.8%) |
| 8:30 AM to 8:59 AM | 61 (7.4%) | 129 (12.2%) |
| 9:00 AM to 9:59 AM | 152 (18.4%) | 71 (6.7%) |
| 10:00 AM to 10:59 AM | 45 (5.5%) | 41 (3.9%) |
| 11:00 AM to 11:59 AM | 25 (3.0%) | 96 (9.1%) |
| 12:00 PM to 3:59 PM | 175 (21.2%) | 254 (24.0%) |
| 4:00 PM to 11:59 PM | 137 (16.6%) | 142 (13.5%) |
| Total | 824 (100.0%) | 1,056 (100.0%) |
Housing Occupancy in Williamstown
Occupancy by Ownership in Williamstown
Of the total 1,189 dwellings in Williamstown, owner-occupied units account for 745 (62.7%), while renter-occupied units make up 444 (37.3%).
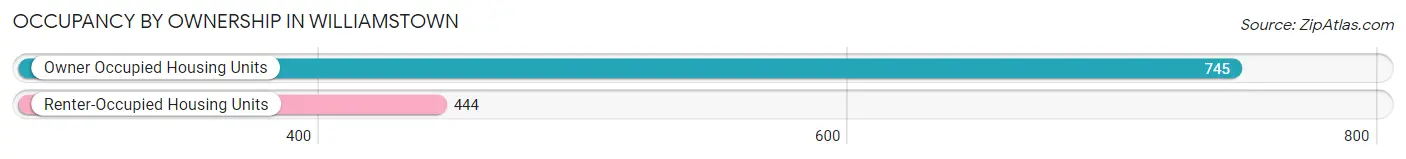
| Occupancy | # Housing Units | % Housing Units |
| Owner Occupied Housing Units | 745 | 62.7% |
| Renter-Occupied Housing Units | 444 | 37.3% |
| Total Occupied Housing Units | 1,189 | 100.0% |
Occupancy by Household Size in Williamstown
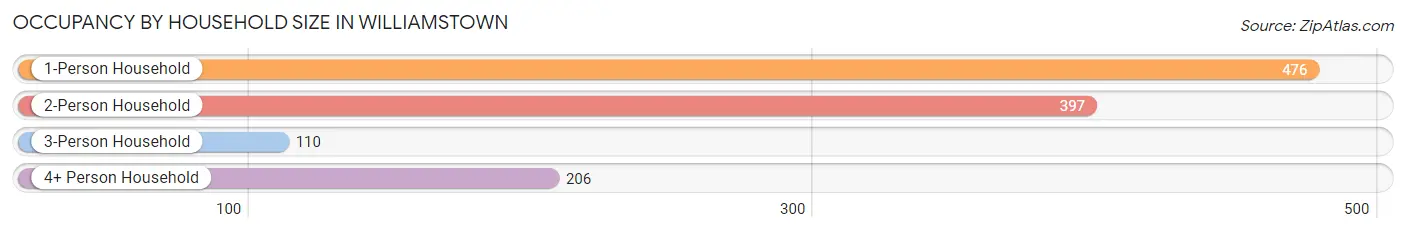
| Household Size | # Housing Units | % Housing Units |
| 1-Person Household | 476 | 40.0% |
| 2-Person Household | 397 | 33.4% |
| 3-Person Household | 110 | 9.2% |
| 4+ Person Household | 206 | 17.3% |
| Total Housing Units | 1,189 | 100.0% |
Occupancy by Ownership by Household Size in Williamstown
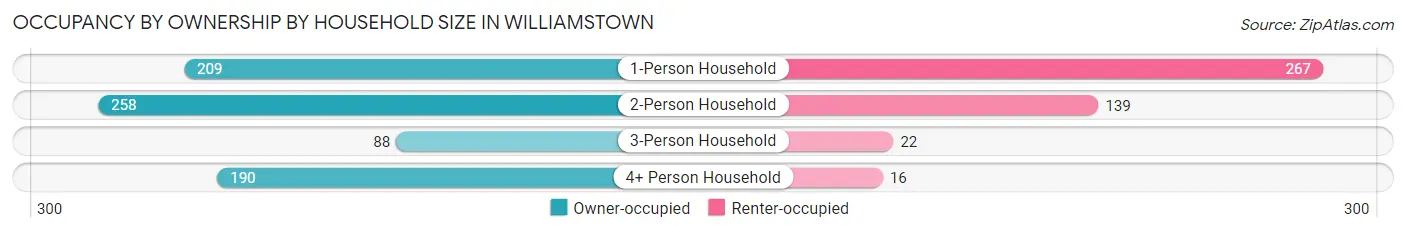
| Household Size | Owner-occupied | Renter-occupied |
| 1-Person Household | 209 (43.9%) | 267 (56.1%) |
| 2-Person Household | 258 (65.0%) | 139 (35.0%) |
| 3-Person Household | 88 (80.0%) | 22 (20.0%) |
| 4+ Person Household | 190 (92.2%) | 16 (7.8%) |
| Total Housing Units | 745 (62.7%) | 444 (37.3%) |
Occupancy by Educational Attainment in Williamstown
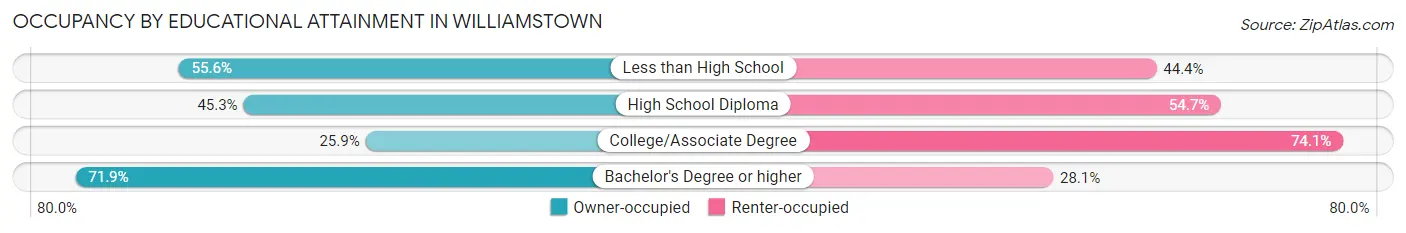
| Household Size | Owner-occupied | Renter-occupied |
| Less than High School | 10 (55.6%) | 8 (44.4%) |
| High School Diploma | 77 (45.3%) | 93 (54.7%) |
| College/Associate Degree | 35 (25.9%) | 100 (74.1%) |
| Bachelor's Degree or higher | 623 (71.9%) | 243 (28.1%) |
Occupancy by Age of Householder in Williamstown
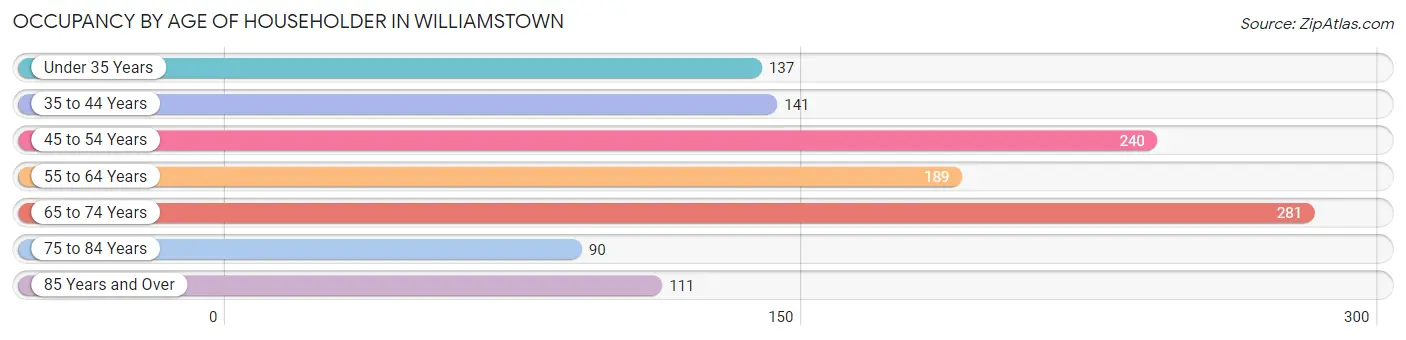
| Age Bracket | # Households | % Households |
| Under 35 Years | 137 | 11.5% |
| 35 to 44 Years | 141 | 11.9% |
| 45 to 54 Years | 240 | 20.2% |
| 55 to 64 Years | 189 | 15.9% |
| 65 to 74 Years | 281 | 23.6% |
| 75 to 84 Years | 90 | 7.6% |
| 85 Years and Over | 111 | 9.3% |
| Total | 1,189 | 100.0% |
Housing Finances in Williamstown
Median Income by Occupancy in Williamstown
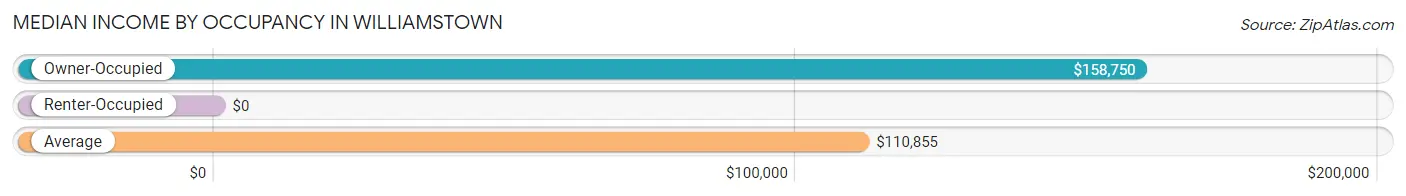
| Occupancy Type | # Households | Median Income |
| Owner-Occupied | 745 (62.7%) | $158,750 |
| Renter-Occupied | 444 (37.3%) | $0 |
| Average | 1,189 (100.0%) | $110,855 |
Occupancy by Householder Income Bracket in Williamstown
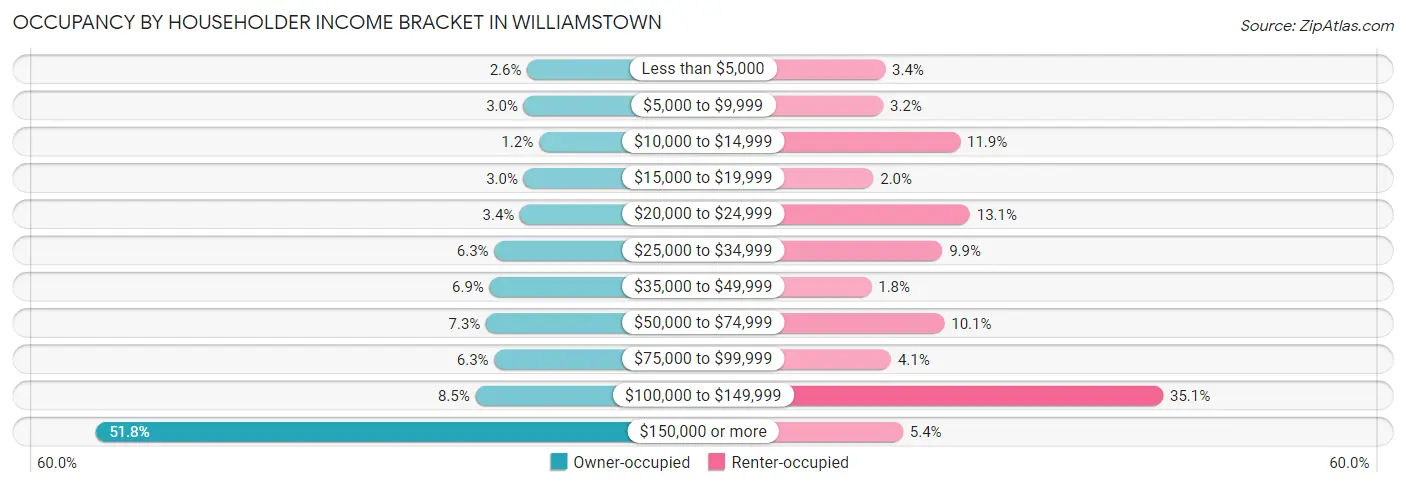
| Income Bracket | Owner-occupied | Renter-occupied |
| Less than $5,000 | 19 (2.5%) | 15 (3.4%) |
| $5,000 to $9,999 | 22 (2.9%) | 14 (3.2%) |
| $10,000 to $14,999 | 9 (1.2%) | 53 (11.9%) |
| $15,000 to $19,999 | 22 (2.9%) | 9 (2.0%) |
| $20,000 to $24,999 | 25 (3.4%) | 58 (13.1%) |
| $25,000 to $34,999 | 47 (6.3%) | 44 (9.9%) |
| $35,000 to $49,999 | 51 (6.9%) | 8 (1.8%) |
| $50,000 to $74,999 | 54 (7.2%) | 45 (10.1%) |
| $75,000 to $99,999 | 47 (6.3%) | 18 (4.1%) |
| $100,000 to $149,999 | 63 (8.5%) | 156 (35.1%) |
| $150,000 or more | 386 (51.8%) | 24 (5.4%) |
| Total | 745 (100.0%) | 444 (100.0%) |
Monthly Housing Cost Tiers in Williamstown
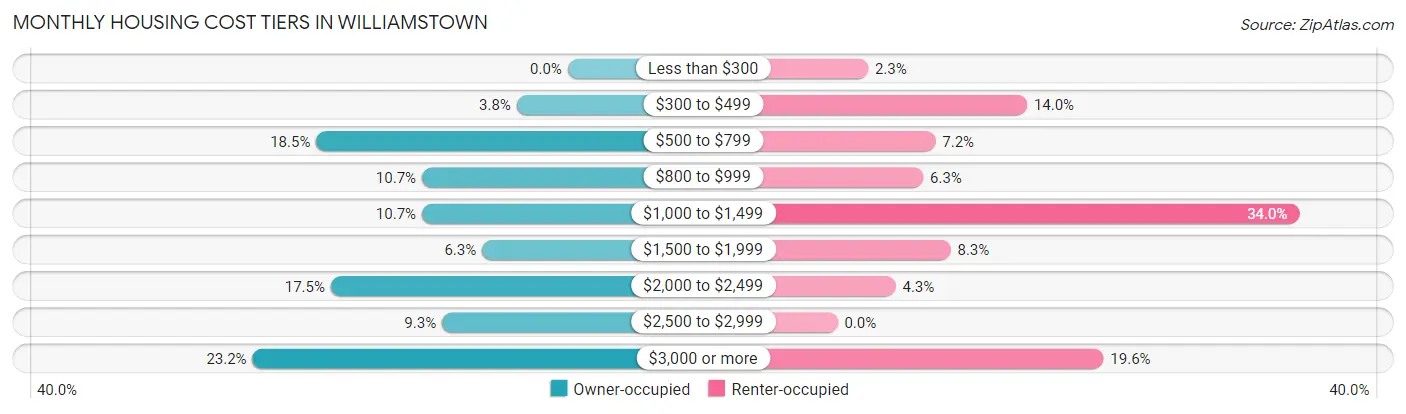
| Monthly Cost | Owner-occupied | Renter-occupied |
| Less than $300 | 0 (0.0%) | 10 (2.2%) |
| $300 to $499 | 28 (3.8%) | 62 (14.0%) |
| $500 to $799 | 138 (18.5%) | 32 (7.2%) |
| $800 to $999 | 80 (10.7%) | 28 (6.3%) |
| $1,000 to $1,499 | 80 (10.7%) | 151 (34.0%) |
| $1,500 to $1,999 | 47 (6.3%) | 37 (8.3%) |
| $2,000 to $2,499 | 130 (17.4%) | 19 (4.3%) |
| $2,500 to $2,999 | 69 (9.3%) | 0 (0.0%) |
| $3,000 or more | 173 (23.2%) | 87 (19.6%) |
| Total | 745 (100.0%) | 444 (100.0%) |
Physical Housing Characteristics in Williamstown
Housing Structures in Williamstown
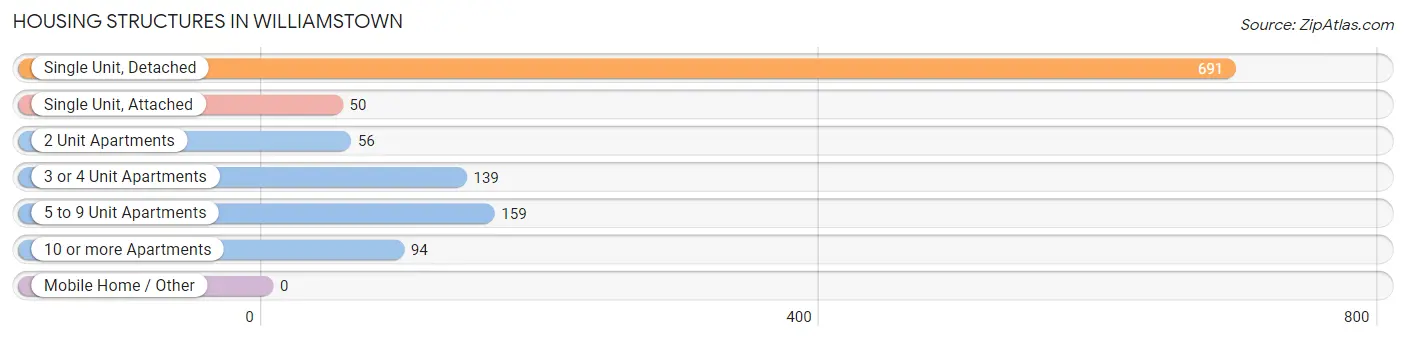
| Structure Type | # Housing Units | % Housing Units |
| Single Unit, Detached | 691 | 58.1% |
| Single Unit, Attached | 50 | 4.2% |
| 2 Unit Apartments | 56 | 4.7% |
| 3 or 4 Unit Apartments | 139 | 11.7% |
| 5 to 9 Unit Apartments | 159 | 13.4% |
| 10 or more Apartments | 94 | 7.9% |
| Mobile Home / Other | 0 | 0.0% |
| Total | 1,189 | 100.0% |
Housing Structures by Occupancy in Williamstown
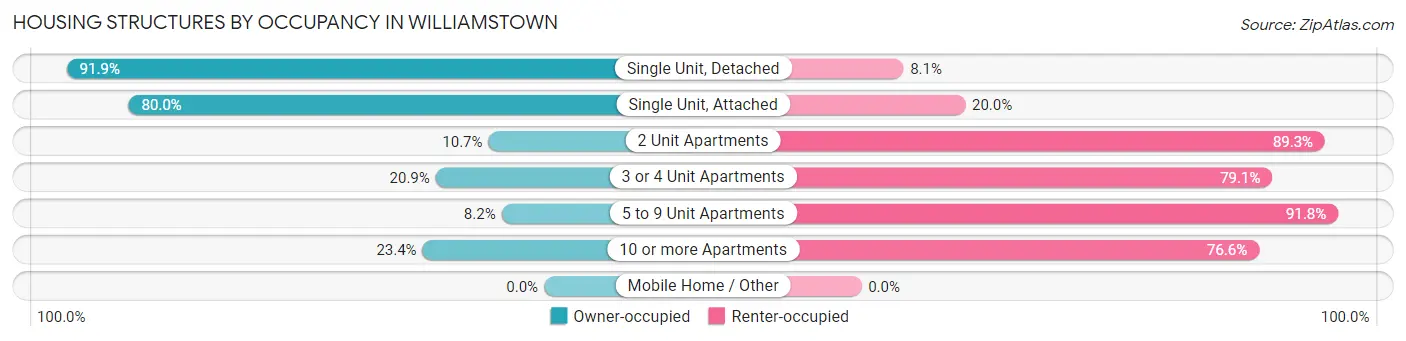
| Structure Type | Owner-occupied | Renter-occupied |
| Single Unit, Detached | 635 (91.9%) | 56 (8.1%) |
| Single Unit, Attached | 40 (80.0%) | 10 (20.0%) |
| 2 Unit Apartments | 6 (10.7%) | 50 (89.3%) |
| 3 or 4 Unit Apartments | 29 (20.9%) | 110 (79.1%) |
| 5 to 9 Unit Apartments | 13 (8.2%) | 146 (91.8%) |
| 10 or more Apartments | 22 (23.4%) | 72 (76.6%) |
| Mobile Home / Other | 0 (0.0%) | 0 (0.0%) |
| Total | 745 (62.7%) | 444 (37.3%) |
Housing Structures by Number of Rooms in Williamstown
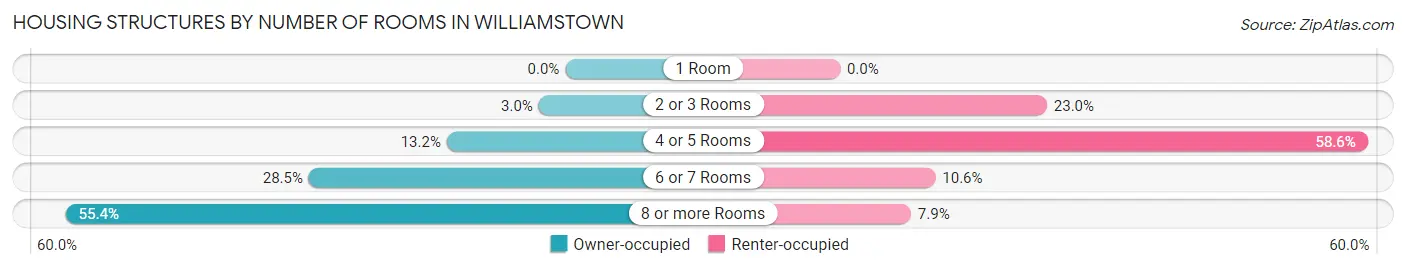
| Number of Rooms | Owner-occupied | Renter-occupied |
| 1 Room | 0 (0.0%) | 0 (0.0%) |
| 2 or 3 Rooms | 22 (2.9%) | 102 (23.0%) |
| 4 or 5 Rooms | 98 (13.2%) | 260 (58.6%) |
| 6 or 7 Rooms | 212 (28.5%) | 47 (10.6%) |
| 8 or more Rooms | 413 (55.4%) | 35 (7.9%) |
| Total | 745 (100.0%) | 444 (100.0%) |
Housing Structure by Heating Type in Williamstown
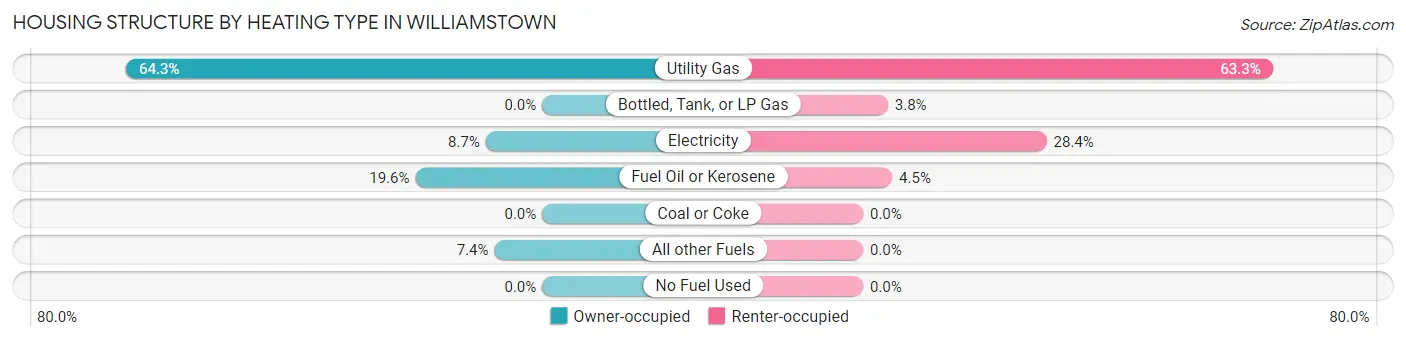
| Heating Type | Owner-occupied | Renter-occupied |
| Utility Gas | 479 (64.3%) | 281 (63.3%) |
| Bottled, Tank, or LP Gas | 0 (0.0%) | 17 (3.8%) |
| Electricity | 65 (8.7%) | 126 (28.4%) |
| Fuel Oil or Kerosene | 146 (19.6%) | 20 (4.5%) |
| Coal or Coke | 0 (0.0%) | 0 (0.0%) |
| All other Fuels | 55 (7.4%) | 0 (0.0%) |
| No Fuel Used | 0 (0.0%) | 0 (0.0%) |
| Total | 745 (100.0%) | 444 (100.0%) |
Household Vehicle Usage in Williamstown
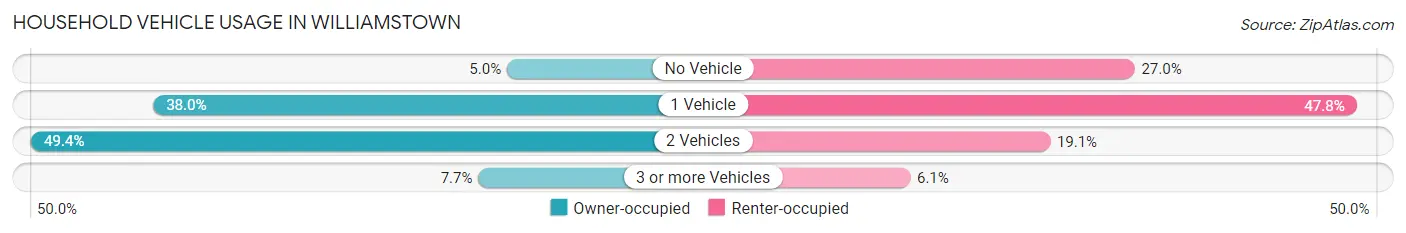
| Vehicles per Household | Owner-occupied | Renter-occupied |
| No Vehicle | 37 (5.0%) | 120 (27.0%) |
| 1 Vehicle | 283 (38.0%) | 212 (47.7%) |
| 2 Vehicles | 368 (49.4%) | 85 (19.1%) |
| 3 or more Vehicles | 57 (7.6%) | 27 (6.1%) |
| Total | 745 (100.0%) | 444 (100.0%) |
Real Estate & Mortgages in Williamstown
Real Estate and Mortgage Overview in Williamstown
| Characteristic | Without Mortgage | With Mortgage |
| Housing Units | 342 | 403 |
| Median Property Value | $327,100 | $539,800 |
| Median Household Income | $64,318 | $293 |
| Monthly Housing Costs | $882 | $173 |
| Real Estate Taxes | $4,423 | $19 |
Property Value by Mortgage Status in Williamstown
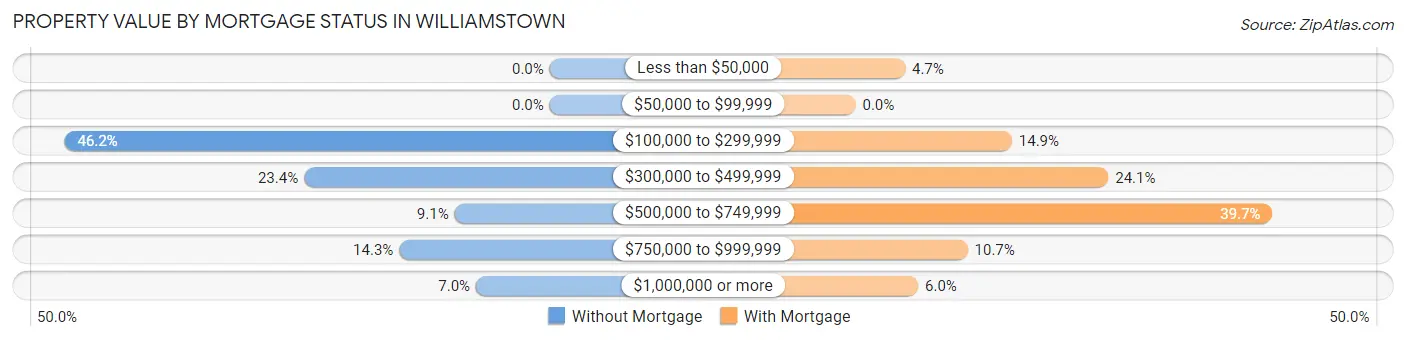
| Property Value | Without Mortgage | With Mortgage |
| Less than $50,000 | 0 (0.0%) | 19 (4.7%) |
| $50,000 to $99,999 | 0 (0.0%) | 0 (0.0%) |
| $100,000 to $299,999 | 158 (46.2%) | 60 (14.9%) |
| $300,000 to $499,999 | 80 (23.4%) | 97 (24.1%) |
| $500,000 to $749,999 | 31 (9.1%) | 160 (39.7%) |
| $750,000 to $999,999 | 49 (14.3%) | 43 (10.7%) |
| $1,000,000 or more | 24 (7.0%) | 24 (6.0%) |
| Total | 342 (100.0%) | 403 (100.0%) |
Household Income by Mortgage Status in Williamstown
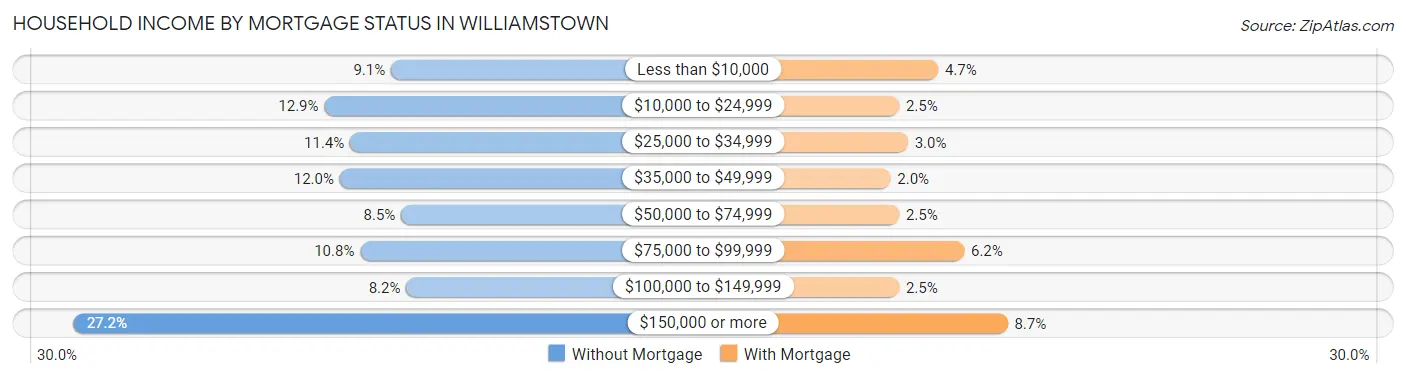
| Household Income | Without Mortgage | With Mortgage |
| Less than $10,000 | 31 (9.1%) | 19 (4.7%) |
| $10,000 to $24,999 | 44 (12.9%) | 10 (2.5%) |
| $25,000 to $34,999 | 39 (11.4%) | 12 (3.0%) |
| $35,000 to $49,999 | 41 (12.0%) | 8 (2.0%) |
| $50,000 to $74,999 | 29 (8.5%) | 10 (2.5%) |
| $75,000 to $99,999 | 37 (10.8%) | 25 (6.2%) |
| $100,000 to $149,999 | 28 (8.2%) | 10 (2.5%) |
| $150,000 or more | 93 (27.2%) | 35 (8.7%) |
| Total | 342 (100.0%) | 403 (100.0%) |
Property Value to Household Income Ratio in Williamstown
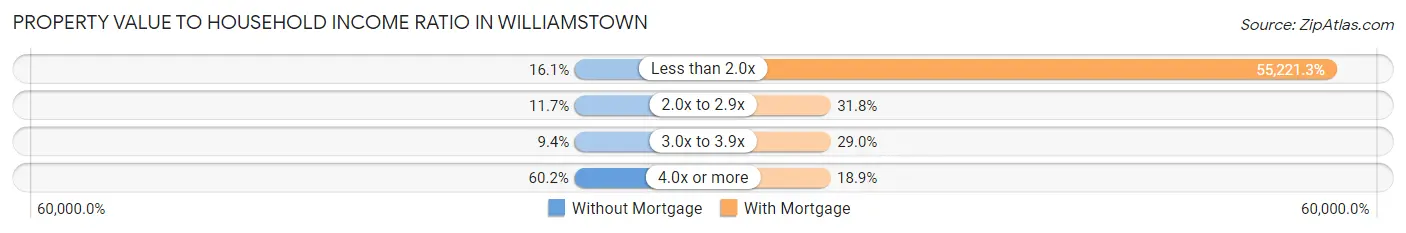
| Value-to-Income Ratio | Without Mortgage | With Mortgage |
| Less than 2.0x | 55 (16.1%) | 222,542 (55,221.3%) |
| 2.0x to 2.9x | 40 (11.7%) | 128 (31.8%) |
| 3.0x to 3.9x | 32 (9.4%) | 117 (29.0%) |
| 4.0x or more | 206 (60.2%) | 76 (18.9%) |
| Total | 342 (100.0%) | 403 (100.0%) |
Real Estate Taxes by Mortgage Status in Williamstown
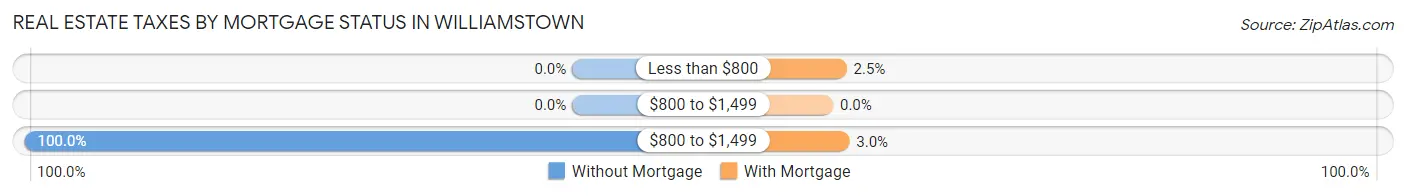
| Property Taxes | Without Mortgage | With Mortgage |
| Less than $800 | 0 (0.0%) | 10 (2.5%) |
| $800 to $1,499 | 0 (0.0%) | 0 (0.0%) |
| $800 to $1,499 | 342 (100.0%) | 12 (3.0%) |
| Total | 342 (100.0%) | 403 (100.0%) |
Health & Disability in Williamstown
Health Insurance Coverage by Age in Williamstown
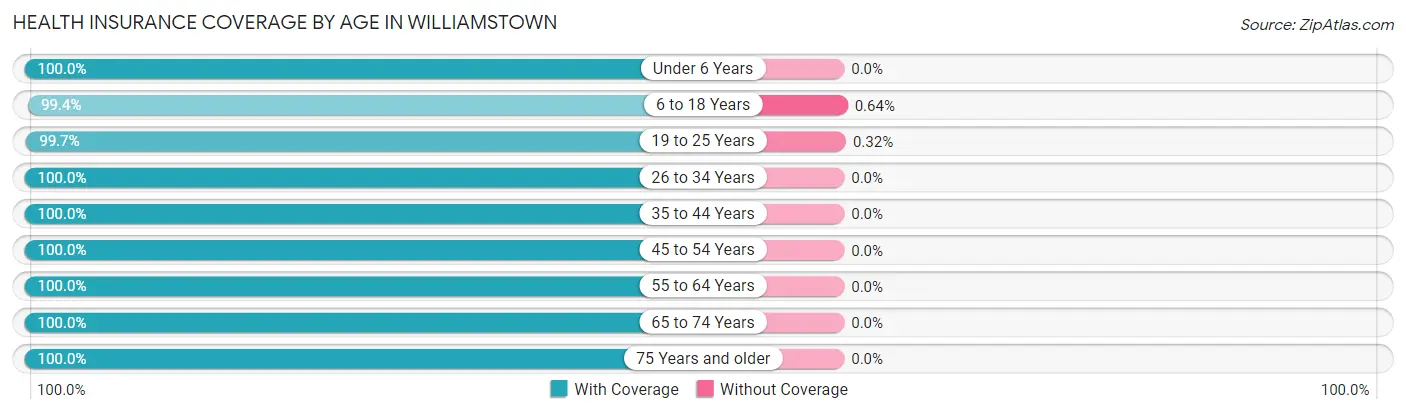
| Age Bracket | With Coverage | Without Coverage |
| Under 6 Years | 132 (100.0%) | 0 (0.0%) |
| 6 to 18 Years | 775 (99.4%) | 5 (0.6%) |
| 19 to 25 Years | 1,860 (99.7%) | 6 (0.3%) |
| 26 to 34 Years | 144 (100.0%) | 0 (0.0%) |
| 35 to 44 Years | 261 (100.0%) | 0 (0.0%) |
| 45 to 54 Years | 330 (100.0%) | 0 (0.0%) |
| 55 to 64 Years | 346 (100.0%) | 0 (0.0%) |
| 65 to 74 Years | 398 (100.0%) | 0 (0.0%) |
| 75 Years and older | 232 (100.0%) | 0 (0.0%) |
| Total | 4,478 (99.8%) | 11 (0.3%) |
Health Insurance Coverage by Citizenship Status in Williamstown
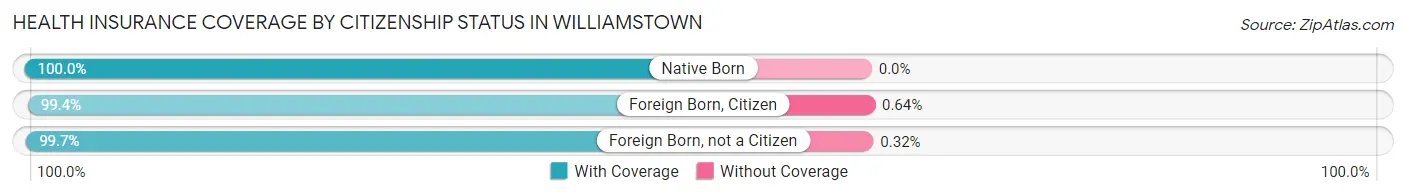
| Citizenship Status | With Coverage | Without Coverage |
| Native Born | 132 (100.0%) | 0 (0.0%) |
| Foreign Born, Citizen | 775 (99.4%) | 5 (0.6%) |
| Foreign Born, not a Citizen | 1,860 (99.7%) | 6 (0.3%) |
Health Insurance Coverage by Household Income in Williamstown
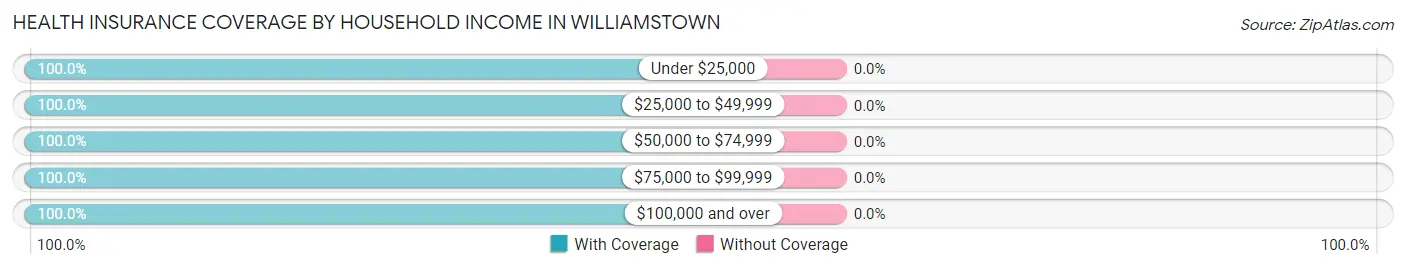
| Household Income | With Coverage | Without Coverage |
| Under $25,000 | 320 (100.0%) | 0 (0.0%) |
| $25,000 to $49,999 | 275 (100.0%) | 0 (0.0%) |
| $50,000 to $74,999 | 167 (100.0%) | 0 (0.0%) |
| $75,000 to $99,999 | 130 (100.0%) | 0 (0.0%) |
| $100,000 and over | 1,634 (100.0%) | 0 (0.0%) |
Public vs Private Health Insurance Coverage by Age in Williamstown
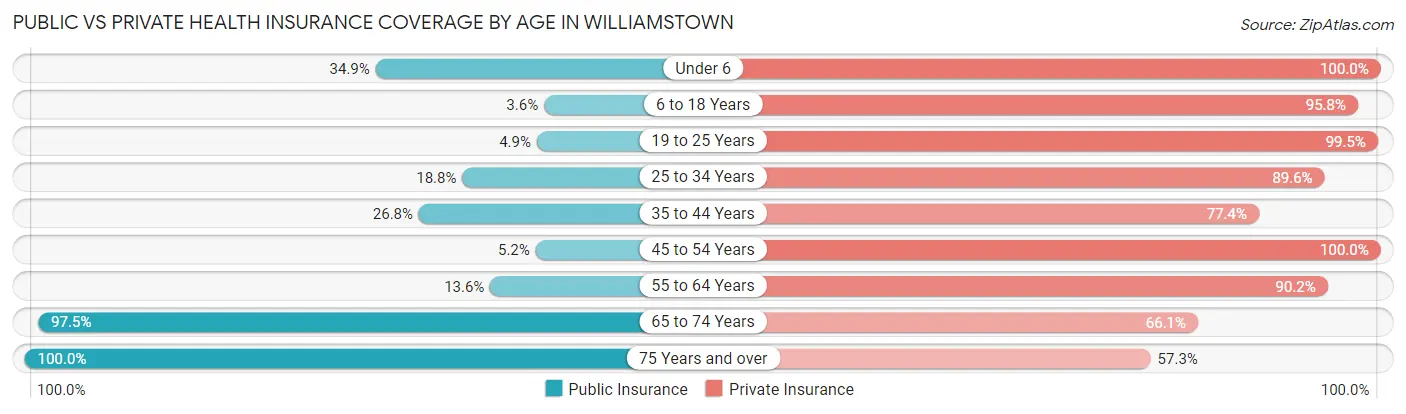
| Age Bracket | Public Insurance | Private Insurance |
| Under 6 | 46 (34.8%) | 132 (100.0%) |
| 6 to 18 Years | 28 (3.6%) | 747 (95.8%) |
| 19 to 25 Years | 92 (4.9%) | 1,856 (99.5%) |
| 25 to 34 Years | 27 (18.8%) | 129 (89.6%) |
| 35 to 44 Years | 70 (26.8%) | 202 (77.4%) |
| 45 to 54 Years | 17 (5.1%) | 330 (100.0%) |
| 55 to 64 Years | 47 (13.6%) | 312 (90.2%) |
| 65 to 74 Years | 388 (97.5%) | 263 (66.1%) |
| 75 Years and over | 232 (100.0%) | 133 (57.3%) |
| Total | 947 (21.1%) | 4,104 (91.4%) |
Disability Status by Sex by Age in Williamstown
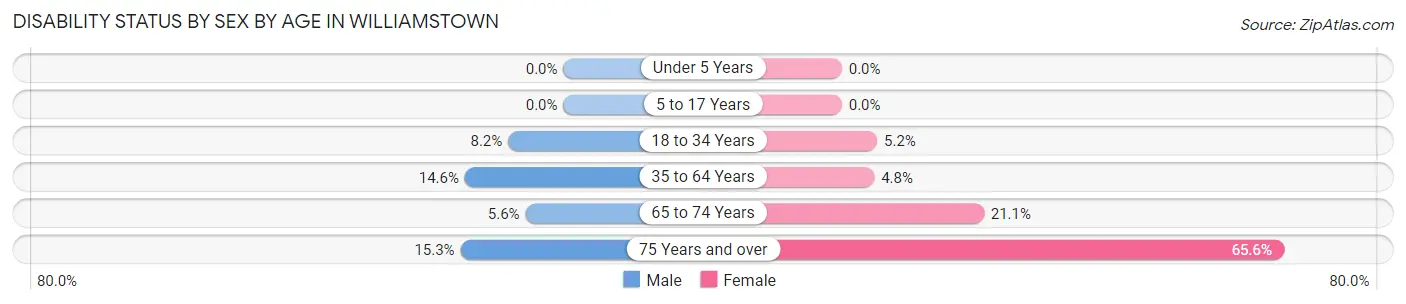
| Age Bracket | Male | Female |
| Under 5 Years | 0 (0.0%) | 0 (0.0%) |
| 5 to 17 Years | 0 (0.0%) | 0 (0.0%) |
| 18 to 34 Years | 84 (8.2%) | 70 (5.2%) |
| 35 to 64 Years | 61 (14.6%) | 25 (4.8%) |
| 65 to 74 Years | 8 (5.6%) | 54 (21.1%) |
| 75 Years and over | 11 (15.3%) | 105 (65.6%) |
Disability Class by Sex by Age in Williamstown
Disability Class: Hearing Difficulty
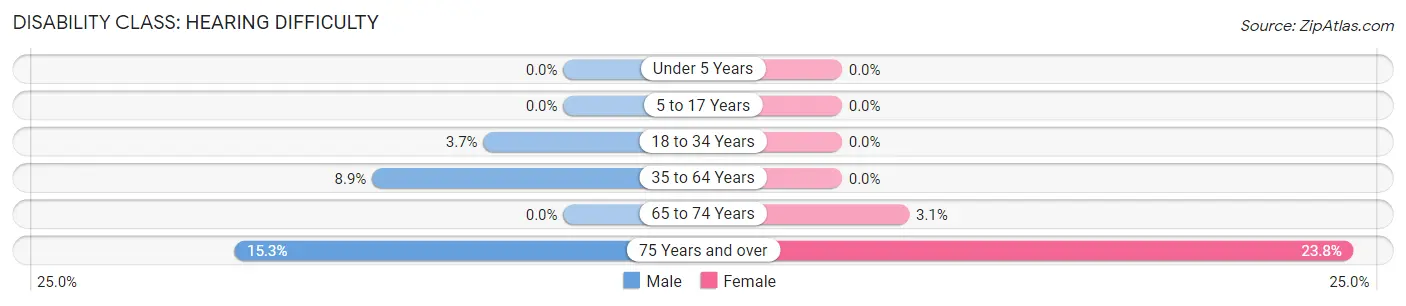
| Age Bracket | Male | Female |
| Under 5 Years | 0 (0.0%) | 0 (0.0%) |
| 5 to 17 Years | 0 (0.0%) | 0 (0.0%) |
| 18 to 34 Years | 38 (3.7%) | 0 (0.0%) |
| 35 to 64 Years | 37 (8.9%) | 0 (0.0%) |
| 65 to 74 Years | 0 (0.0%) | 8 (3.1%) |
| 75 Years and over | 11 (15.3%) | 38 (23.7%) |
Disability Class: Vision Difficulty
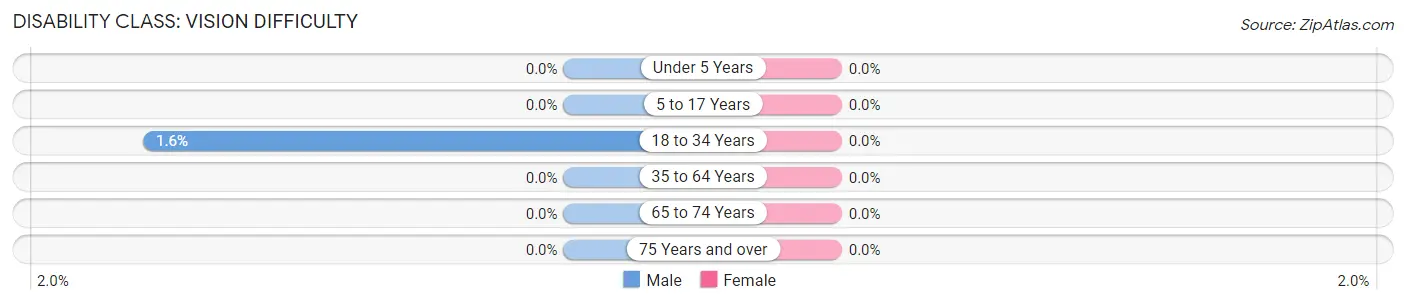
| Age Bracket | Male | Female |
| Under 5 Years | 0 (0.0%) | 0 (0.0%) |
| 5 to 17 Years | 0 (0.0%) | 0 (0.0%) |
| 18 to 34 Years | 16 (1.6%) | 0 (0.0%) |
| 35 to 64 Years | 0 (0.0%) | 0 (0.0%) |
| 65 to 74 Years | 0 (0.0%) | 0 (0.0%) |
| 75 Years and over | 0 (0.0%) | 0 (0.0%) |
Disability Class: Cognitive Difficulty
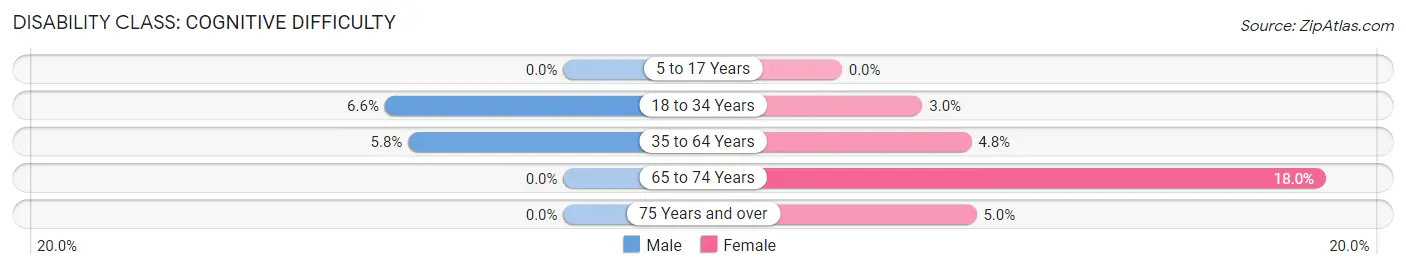
| Age Bracket | Male | Female |
| 5 to 17 Years | 0 (0.0%) | 0 (0.0%) |
| 18 to 34 Years | 68 (6.6%) | 40 (3.0%) |
| 35 to 64 Years | 24 (5.8%) | 25 (4.8%) |
| 65 to 74 Years | 0 (0.0%) | 46 (18.0%) |
| 75 Years and over | 0 (0.0%) | 8 (5.0%) |
Disability Class: Ambulatory Difficulty
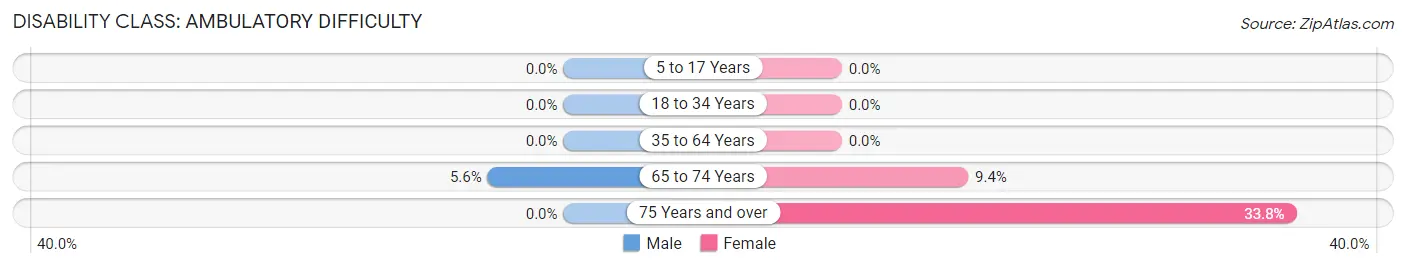
| Age Bracket | Male | Female |
| 5 to 17 Years | 0 (0.0%) | 0 (0.0%) |
| 18 to 34 Years | 0 (0.0%) | 0 (0.0%) |
| 35 to 64 Years | 0 (0.0%) | 0 (0.0%) |
| 65 to 74 Years | 8 (5.6%) | 24 (9.4%) |
| 75 Years and over | 0 (0.0%) | 54 (33.8%) |
Disability Class: Self-Care Difficulty
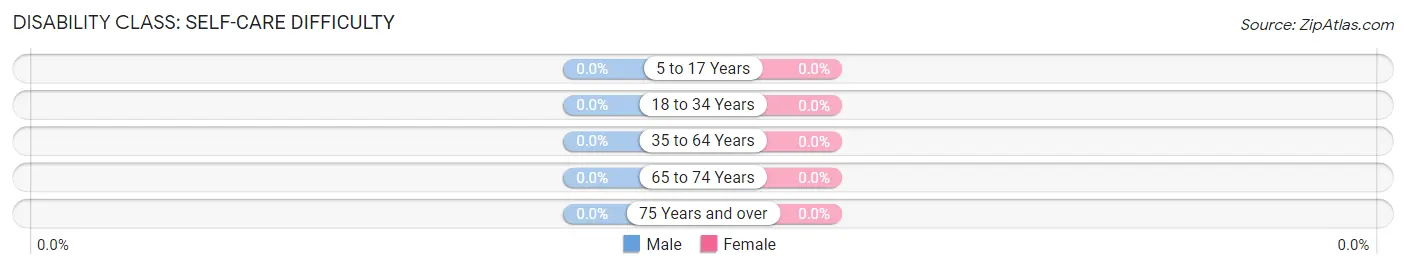
| Age Bracket | Male | Female |
| 5 to 17 Years | 0 (0.0%) | 0 (0.0%) |
| 18 to 34 Years | 0 (0.0%) | 0 (0.0%) |
| 35 to 64 Years | 0 (0.0%) | 0 (0.0%) |
| 65 to 74 Years | 0 (0.0%) | 0 (0.0%) |
| 75 Years and over | 0 (0.0%) | 0 (0.0%) |
Technology Access in Williamstown
Computing Device Access in Williamstown
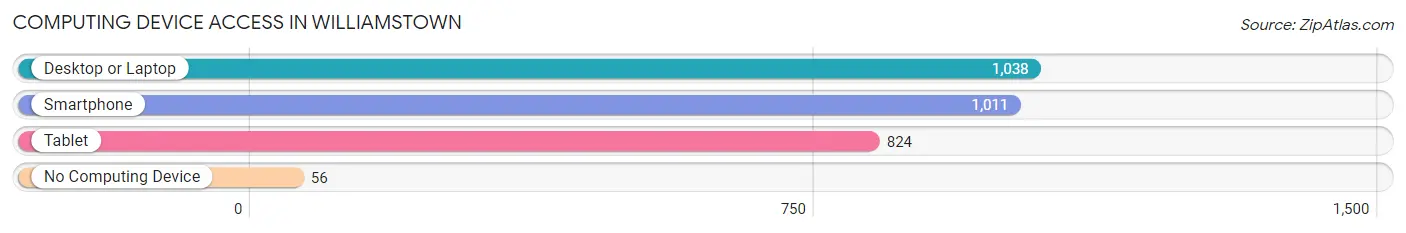
| Device Type | # Households | % Households |
| Desktop or Laptop | 1,038 | 87.3% |
| Smartphone | 1,011 | 85.0% |
| Tablet | 824 | 69.3% |
| No Computing Device | 56 | 4.7% |
| Total | 1,189 | 100.0% |
Internet Access in Williamstown
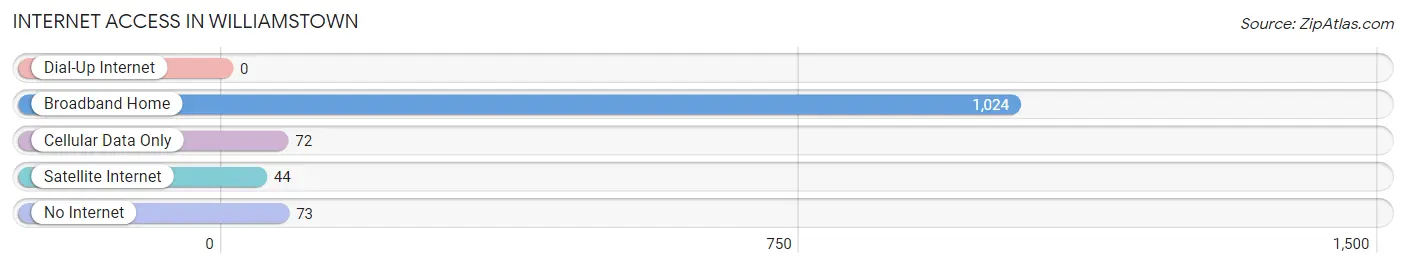
| Internet Type | # Households | % Households |
| Dial-Up Internet | 0 | 0.0% |
| Broadband Home | 1,024 | 86.1% |
| Cellular Data Only | 72 | 6.1% |
| Satellite Internet | 44 | 3.7% |
| No Internet | 73 | 6.1% |
| Total | 1,189 | 100.0% |
Williamstown Summary
Williamstown is a town located in Berkshire County, Massachusetts, United States. It is part of the Pittsfield, Massachusetts Metropolitan Statistical Area. The population was 7,754 at the 2010 census.
History
Williamstown was first settled in 1753 and was officially incorporated in 1765. The town was named after Colonel Ephraim Williams, a veteran of the French and Indian War and a benefactor of Williams College. The town was the home of Williams College, which was founded in 1793.
Geography
Williamstown is located in the northwest corner of Berkshire County, Massachusetts. It is bordered by the towns of Pownal, Vermont to the north, New Ashford to the east, Lanesborough to the south, and Pownal, Vermont and New York to the west. The town is located in the Berkshire Mountains and is home to several mountain peaks, including Mount Greylock, the highest point in Massachusetts.
The town is located at the confluence of the Green River and the Hoosic River. The town is home to several lakes, including Lake Onota, Lake Pontoosuc, and Lake Garfield.
Economy
Williamstown is home to Williams College, a private liberal arts college. The college is the town's largest employer and is a major contributor to the local economy. The town is also home to several other businesses, including a number of restaurants, retail stores, and professional services.
The town is also home to several cultural attractions, including the Williamstown Theatre Festival, the Clark Art Institute, and the Williams College Museum of Art.
Demographics
As of the 2010 census, there were 7,754 people, 2,845 households, and 1,717 families residing in the town. The population density was 517.2 people per square mile (199.7/km2). There were 3,093 housing units at an average density of 206.2 per square mile (79.6/km2). The racial makeup of the town was 94.2% White, 1.2% African American, 0.2% Native American, 2.2% Asian, 0.0% Pacific Islander, 0.7% from other races, and 1.5% from two or more races. Hispanic or Latino of any race were 2.5% of the population.
There were 2,845 households, out of which 24.2% had children under the age of 18 living with them, 48.2% were married couples living together, 8.2% had a female householder with no husband present, and 40.2% were non-families. 33.2% of all households were made up of individuals, and 11.3% had someone living alone who was 65 years of age or older. The average household size was 2.29 and the average family size was 2.94.
In the town, the population was spread out, with 19.2% under the age of 18, 24.2% from 18 to 24, 22.2% from 25 to 44, 22.7% from 45 to 64, and 11.7% who were 65 years of age or older. The median age was 33 years. For every 100 females, there were 87.2 males. For every 100 females age 18 and over, there were 84.2 males.
The median income for a household in the town was $50,977, and the median income for a family was $68,984. Males had a median income of $45,844 versus $35,836 for females. The per capita income for the town was $27,868. About 4.2% of families and 10.3% of the population were below the poverty line, including 6.7% of those under age 18 and 5.4% of those age 65 or over.
Common Questions
What is Per Capita Income in Williamstown?
Per Capita income in Williamstown is $44,377.
What is the Median Family Income in Williamstown?
Median Family Income in Williamstown is $180,500.
What is the Median Household income in Williamstown?
Median Household Income in Williamstown is $110,855.
What is Income or Wage Gap in Williamstown?
Income or Wage Gap in Williamstown is 9.5%.
Women in Williamstown earn 90.5 cents for every dollar earned by a man.
What is Inequality or Gini Index in Williamstown?
Inequality or Gini Index in Williamstown is 0.57.
What is the Total Population of Williamstown?
Total Population of Williamstown is 4,498.
What is the Total Male Population of Williamstown?
Total Male Population of Williamstown is 1,909.
What is the Total Female Population of Williamstown?
Total Female Population of Williamstown is 2,589.
What is the Ratio of Males per 100 Females in Williamstown?
There are 73.74 Males per 100 Females in Williamstown.
What is the Ratio of Females per 100 Males in Williamstown?
There are 135.62 Females per 100 Males in Williamstown.
What is the Median Population Age in Williamstown?
Median Population Age in Williamstown is 21.8 Years.
What is the Average Family Size in Williamstown
Average Family Size in Williamstown is 2.9 People.
What is the Average Household Size in Williamstown
Average Household Size in Williamstown is 2.1 People.
How Large is the Labor Force in Williamstown?
There are 2,402 People in the Labor Forcein in Williamstown.
What is the Percentage of People in the Labor Force in Williamstown?
59.3% of People are in the Labor Force in Williamstown.
What is the Unemployment Rate in Williamstown?
Unemployment Rate in Williamstown is 0.7%.