Cities with the Lowest Renter-Occupied Median Costs of Housing in Massachusetts
RELATED REPORTS & OPTIONS
Lowest Renter Housing Costs
Massachusetts
Compare Cities
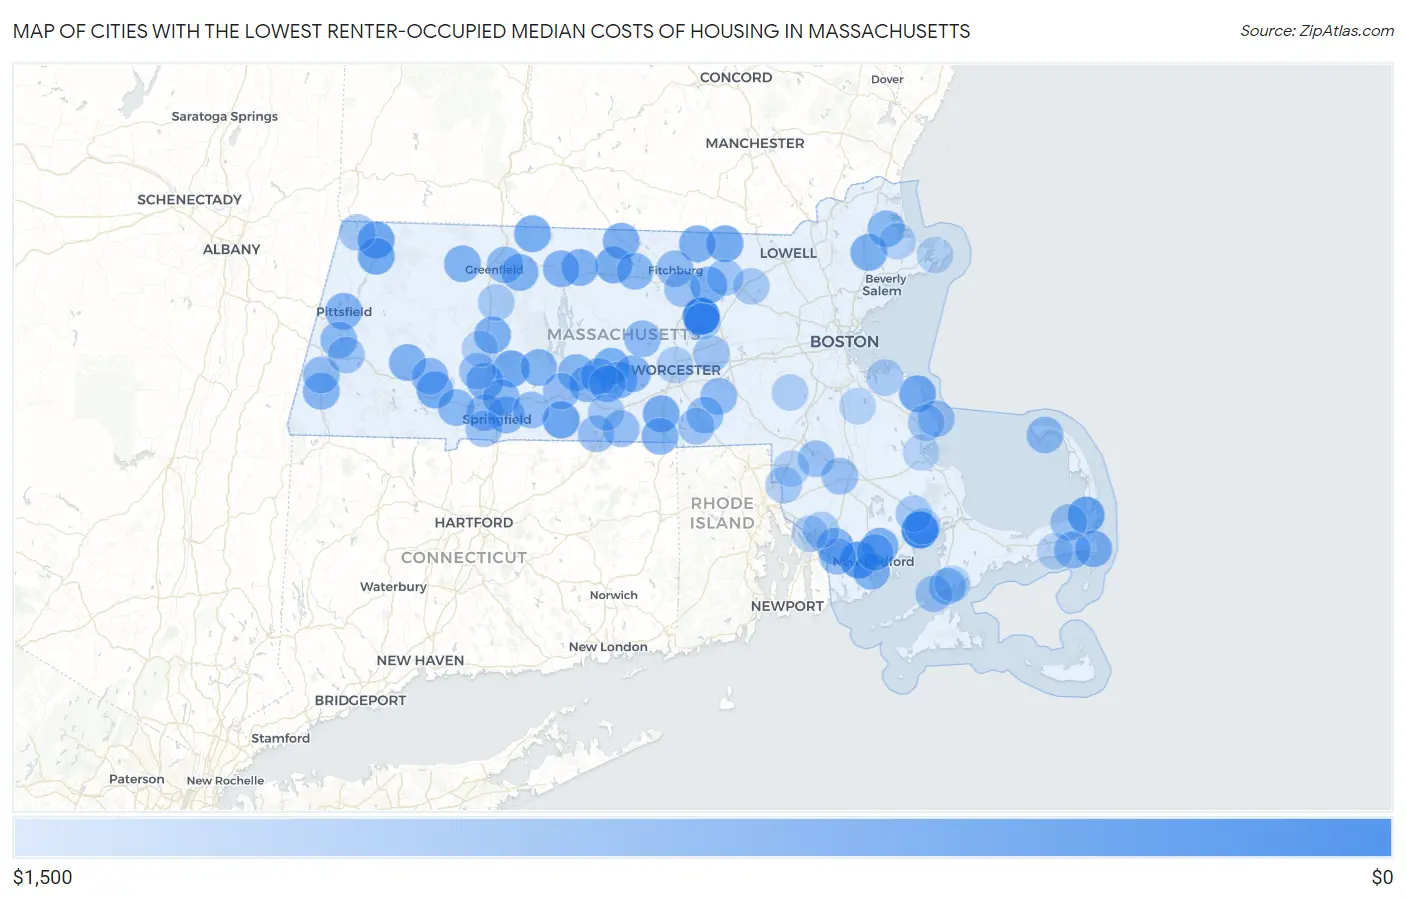
Map of Cities with the Lowest Renter-Occupied Median Costs of Housing in Massachusetts
$1,500
$0
Cities with the Lowest Renter-Occupied Median Costs of Housing in Massachusetts
| City | Housing Costs | vs State | vs National | |
| 1. | South Lancaster | $379 | $1,588(-1.21k)#1 | $1,268(-889)#210 |
| 2. | Weweantic | $488 | $1,588(-1.10k)#2 | $1,268(-780)#733 |
| 3. | Smith Mills | $658 | $1,588(-930)#3 | $1,268(-610)#3,334 |
| 4. | West Warren | $793 | $1,588(-795)#4 | $1,268(-475)#7,688 |
| 5. | Orleans | $804 | $1,588(-784)#5 | $1,268(-464)#8,003 |
| 6. | Monson Center | $816 | $1,588(-772)#6 | $1,268(-452)#8,382 |
| 7. | North Adams | $843 | $1,588(-745)#7 | $1,268(-425)#9,323 |
| 8. | Granby | $859 | $1,588(-729)#8 | $1,268(-409)#9,940 |
| 9. | Russell | $864 | $1,588(-724)#9 | $1,268(-404)#10,106 |
| 10. | Scituate | $870 | $1,588(-718)#10 | $1,268(-398)#10,252 |
| 11. | Adams | $879 | $1,588(-709)#11 | $1,268(-389)#10,535 |
| 12. | Pepperell | $894 | $1,588(-694)#12 | $1,268(-374)#10,941 |
| 13. | Oxford | $911 | $1,588(-677)#13 | $1,268(-357)#11,381 |
| 14. | Baldwinville | $913 | $1,588(-675)#14 | $1,268(-355)#11,440 |
| 15. | Northfield | $915 | $1,588(-673)#15 | $1,268(-353)#11,517 |
| 16. | Shirley | $927 | $1,588(-661)#16 | $1,268(-341)#11,842 |
| 17. | North Brookfield | $931 | $1,588(-657)#17 | $1,268(-337)#11,928 |
| 18. | Holyoke | $937 | $1,588(-651)#18 | $1,268(-331)#12,070 |
| 19. | Topsfield | $944 | $1,588(-644)#19 | $1,268(-324)#12,273 |
| 20. | Hatfield | $944 | $1,588(-644)#20 | $1,268(-324)#12,280 |
| 21. | Townsend | $953 | $1,588(-635)#21 | $1,268(-315)#12,566 |
| 22. | Winchendon | $959 | $1,588(-629)#22 | $1,268(-309)#12,698 |
| 23. | Acushnet Center | $959 | $1,588(-629)#23 | $1,268(-309)#12,700 |
| 24. | Chatham | $965 | $1,588(-623)#24 | $1,268(-303)#12,850 |
| 25. | Athol | $981 | $1,588(-607)#25 | $1,268(-287)#13,189 |
| 26. | Chester | $981 | $1,588(-607)#26 | $1,268(-287)#13,196 |
| 27. | Orange | $988 | $1,588(-600)#27 | $1,268(-280)#13,323 |
| 28. | East Brookfield | $988 | $1,588(-600)#28 | $1,268(-280)#13,334 |
| 29. | Millers Falls | $996 | $1,588(-592)#29 | $1,268(-272)#13,484 |
| 30. | Shelburne Falls | $998 | $1,588(-590)#30 | $1,268(-270)#13,508 |
| 31. | Webster | $999 | $1,588(-589)#31 | $1,268(-269)#13,517 |
| 32. | Ware | $1,010 | $1,588(-578)#32 | $1,268(-258)#13,697 |
| 33. | Warren | $1,011 | $1,588(-577)#33 | $1,268(-257)#13,730 |
| 34. | Greenfield | $1,012 | $1,588(-576)#34 | $1,268(-256)#13,735 |
| 35. | Belchertown | $1,013 | $1,588(-575)#35 | $1,268(-255)#13,753 |
| 36. | Bliss Corner | $1,014 | $1,588(-574)#36 | $1,268(-254)#13,767 |
| 37. | Fall River | $1,020 | $1,588(-568)#37 | $1,268(-248)#13,864 |
| 38. | Spencer | $1,022 | $1,588(-566)#38 | $1,268(-246)#13,902 |
| 39. | New Bedford | $1,026 | $1,588(-562)#39 | $1,268(-242)#13,975 |
| 40. | Pittsfield | $1,027 | $1,588(-561)#40 | $1,268(-241)#13,987 |
| 41. | Great Barrington | $1,031 | $1,588(-557)#41 | $1,268(-237)#14,060 |
| 42. | West Springfield Town | $1,038 | $1,588(-550)#42 | $1,268(-230)#14,174 |
| 43. | Rowley | $1,039 | $1,588(-549)#43 | $1,268(-229)#14,202 |
| 44. | Gardner | $1,041 | $1,588(-547)#44 | $1,268(-227)#14,221 |
| 45. | Springfield | $1,047 | $1,588(-541)#45 | $1,268(-221)#14,356 |
| 46. | Westfield | $1,050 | $1,588(-538)#46 | $1,268(-218)#14,404 |
| 47. | Turners Falls | $1,054 | $1,588(-534)#47 | $1,268(-214)#14,467 |
| 48. | Lenox | $1,055 | $1,588(-533)#48 | $1,268(-213)#14,490 |
| 49. | Chicopee | $1,058 | $1,588(-530)#49 | $1,268(-210)#14,524 |
| 50. | West Brookfield | $1,066 | $1,588(-522)#50 | $1,268(-202)#14,692 |
| 51. | Brookfield | $1,069 | $1,588(-519)#51 | $1,268(-199)#14,751 |
| 52. | Huntington | $1,081 | $1,588(-507)#52 | $1,268(-187)#14,953 |
| 53. | Harwich Port | $1,087 | $1,588(-501)#53 | $1,268(-181)#15,065 |
| 54. | Falmouth | $1,101 | $1,588(-487)#54 | $1,268(-167)#15,286 |
| 55. | Provincetown | $1,106 | $1,588(-482)#55 | $1,268(-162)#15,366 |
| 56. | Rutland | $1,110 | $1,588(-478)#56 | $1,268(-158)#15,436 |
| 57. | Fitchburg | $1,115 | $1,588(-473)#57 | $1,268(-153)#15,509 |
| 58. | Upton | $1,116 | $1,588(-472)#58 | $1,268(-152)#15,527 |
| 59. | Housatonic | $1,116 | $1,588(-472)#59 | $1,268(-152)#15,528 |
| 60. | Palmer Town | $1,118 | $1,588(-470)#60 | $1,268(-150)#15,550 |
| 61. | Whitinsville | $1,125 | $1,588(-463)#61 | $1,268(-143)#15,659 |
| 62. | Wilbraham | $1,125 | $1,588(-463)#62 | $1,268(-143)#15,664 |
| 63. | North Westport | $1,130 | $1,588(-458)#63 | $1,268(-138)#15,777 |
| 64. | Southbridge Town | $1,142 | $1,588(-446)#64 | $1,268(-126)#15,923 |
| 65. | Ocean Bluff Brant Rock | $1,157 | $1,588(-431)#65 | $1,268(-111)#16,158 |
| 66. | Holland | $1,165 | $1,588(-423)#66 | $1,268(-103)#16,263 |
| 67. | Easthampton Town | $1,168 | $1,588(-420)#67 | $1,268(-100.0)#16,308 |
| 68. | Leominster | $1,171 | $1,588(-417)#68 | $1,268(-97.0)#16,342 |
| 69. | Brewster | $1,177 | $1,588(-411)#69 | $1,268(-91.0)#16,420 |
| 70. | Taunton | $1,180 | $1,588(-408)#70 | $1,268(-88.0)#16,459 |
| 71. | Norton Center | $1,181 | $1,588(-407)#71 | $1,268(-87.0)#16,479 |
| 72. | Lee | $1,193 | $1,588(-395)#72 | $1,268(-75.0)#16,640 |
| 73. | Northborough | $1,208 | $1,588(-380)#73 | $1,268(-60.0)#16,780 |
| 74. | East Douglas | $1,210 | $1,588(-378)#74 | $1,268(-58.0)#16,812 |
| 75. | Agawam Town | $1,218 | $1,588(-370)#75 | $1,268(-50.0)#16,893 |
| 76. | Woods Hole | $1,219 | $1,588(-369)#76 | $1,268(-49.0)#16,901 |
| 77. | Ayer | $1,223 | $1,588(-365)#77 | $1,268(-45.0)#16,938 |
| 78. | Marshfield | $1,227 | $1,588(-361)#78 | $1,268(-41.0)#16,980 |
| 79. | Williamstown | $1,244 | $1,588(-344)#79 | $1,268(-24.0)#17,137 |
| 80. | North Attleborough | $1,246 | $1,588(-342)#80 | $1,268(-22.0)#17,147 |
| 81. | Fiskdale | $1,256 | $1,588(-332)#81 | $1,268(-12.0)#17,262 |
| 82. | West Wareham | $1,269 | $1,588(-319)#82 | $1,268(+1.000)#17,353 |
| 83. | South Deerfield | $1,271 | $1,588(-317)#83 | $1,268(+3.00)#17,367 |
| 84. | Littleton Common | $1,275 | $1,588(-313)#84 | $1,268(+7.00)#17,396 |
| 85. | Clinton | $1,281 | $1,588(-307)#85 | $1,268(+13.0)#17,440 |
| 86. | North Seekonk | $1,283 | $1,588(-305)#86 | $1,268(+15.0)#17,465 |
| 87. | Wareham Center | $1,304 | $1,588(-284)#87 | $1,268(+36.0)#17,671 |
| 88. | Somerset | $1,307 | $1,588(-281)#88 | $1,268(+39.0)#17,689 |
| 89. | Worcester | $1,312 | $1,588(-276)#89 | $1,268(+44.0)#17,724 |
| 90. | Hingham | $1,319 | $1,588(-269)#90 | $1,268(+51.0)#17,794 |
| 91. | Medfield | $1,324 | $1,588(-264)#91 | $1,268(+56.0)#17,827 |
| 92. | Ocean Grove | $1,327 | $1,588(-261)#92 | $1,268(+59.0)#17,848 |
| 93. | Northampton | $1,355 | $1,588(-233)#93 | $1,268(+87.0)#18,090 |
| 94. | Attleboro | $1,359 | $1,588(-229)#94 | $1,268(+91.0)#18,120 |
| 95. | Ipswich | $1,367 | $1,588(-221)#95 | $1,268(+99.0)#18,199 |
| 96. | Holbrook | $1,380 | $1,588(-208)#96 | $1,268(+112)#18,320 |
| 97. | Teaticket | $1,388 | $1,588(-200)#97 | $1,268(+120)#18,380 |
| 98. | Gloucester | $1,390 | $1,588(-198)#98 | $1,268(+122)#18,399 |
| 99. | Dennis Port | $1,390 | $1,588(-198)#99 | $1,268(+122)#18,402 |
| 100. | Kingston | $1,398 | $1,588(-190)#100 | $1,268(+130)#18,465 |
Common Questions
What are the Top 10 Cities with the Lowest Renter-Occupied Median Costs of Housing in Massachusetts?
Top 10 Cities with the Lowest Renter-Occupied Median Costs of Housing in Massachusetts are:
#1
$379
#2
$488
#3
$658
#4
$804
#5
$816
#6
$843
#7
$859
#8
$864
#9
$870
#10
$879
What city has the Lowest Renter-Occupied Median Costs of Housing in Massachusetts?
South Lancaster has the Lowest Renter-Occupied Median Costs of Housing in Massachusetts with $379.
What is the Median Renter-Occupied Housing Costs in the State of Massachusetts?
Median Renter-Occupied Housing Costs in Massachusetts is $1,588.
What is the Median Renter-Occupied Housing Costs in the United States?
Median Renter-Occupied Housing Costs in the United States is $1,268.