Hudson, MA Map & Demographics
Hudson Map
Hudson Overview
$49,409
PER CAPITA INCOME
$129,925
AVG FAMILY INCOME
$91,324
AVG HOUSEHOLD INCOME
19.6%
WAGE / INCOME GAP [ % ]
80.4¢/ $1
WAGE / INCOME GAP [ $ ]
0.43
INEQUALITY / GINI INDEX
15,496
TOTAL POPULATION
7,473
MALE POPULATION
8,023
FEMALE POPULATION
93.14
MALES / 100 FEMALES
107.36
FEMALES / 100 MALES
43.8
MEDIAN AGE
3.0
AVG FAMILY SIZE
2.4
AVG HOUSEHOLD SIZE
8,563
LABOR FORCE [ PEOPLE ]
66.2%
PERCENT IN LABOR FORCE
4.3%
UNEMPLOYMENT RATE
Hudson Zip Codes
Income in Hudson
Income Overview in Hudson
Per Capita Income in Hudson is $49,409, while median incomes of families and households are $129,925 and $91,324 respectively.
| Characteristic | Number | Measure |
| Per Capita Income | 15,496 | $49,409 |
| Median Family Income | 3,931 | $129,925 |
| Mean Family Income | 3,931 | $148,848 |
| Median Household Income | 6,534 | $91,324 |
| Mean Household Income | 6,534 | $116,864 |
| Income Deficit | 3,931 | $0 |
| Wage / Income Gap (%) | 15,496 | 19.62% |
| Wage / Income Gap ($) | 15,496 | 80.38¢ per $1 |
| Gini / Inequality Index | 15,496 | 0.43 |
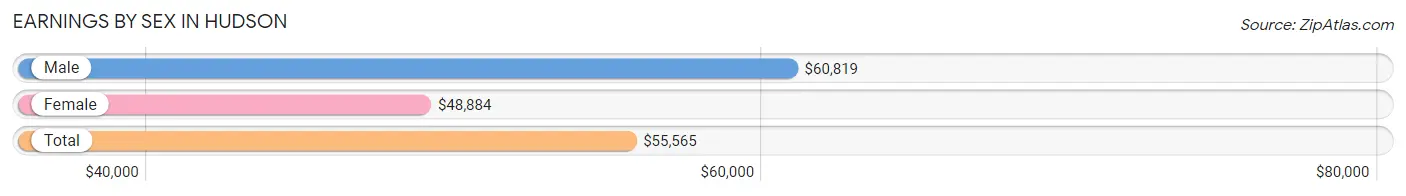
Earnings by Sex in Hudson
Average Earnings in Hudson are $55,565, $60,819 for men and $48,884 for women, a difference of 19.6%.
| Sex | Number | Average Earnings |
| Male | 4,672 (53.6%) | $60,819 |
| Female | 4,043 (46.4%) | $48,884 |
| Total | 8,715 (100.0%) | $55,565 |
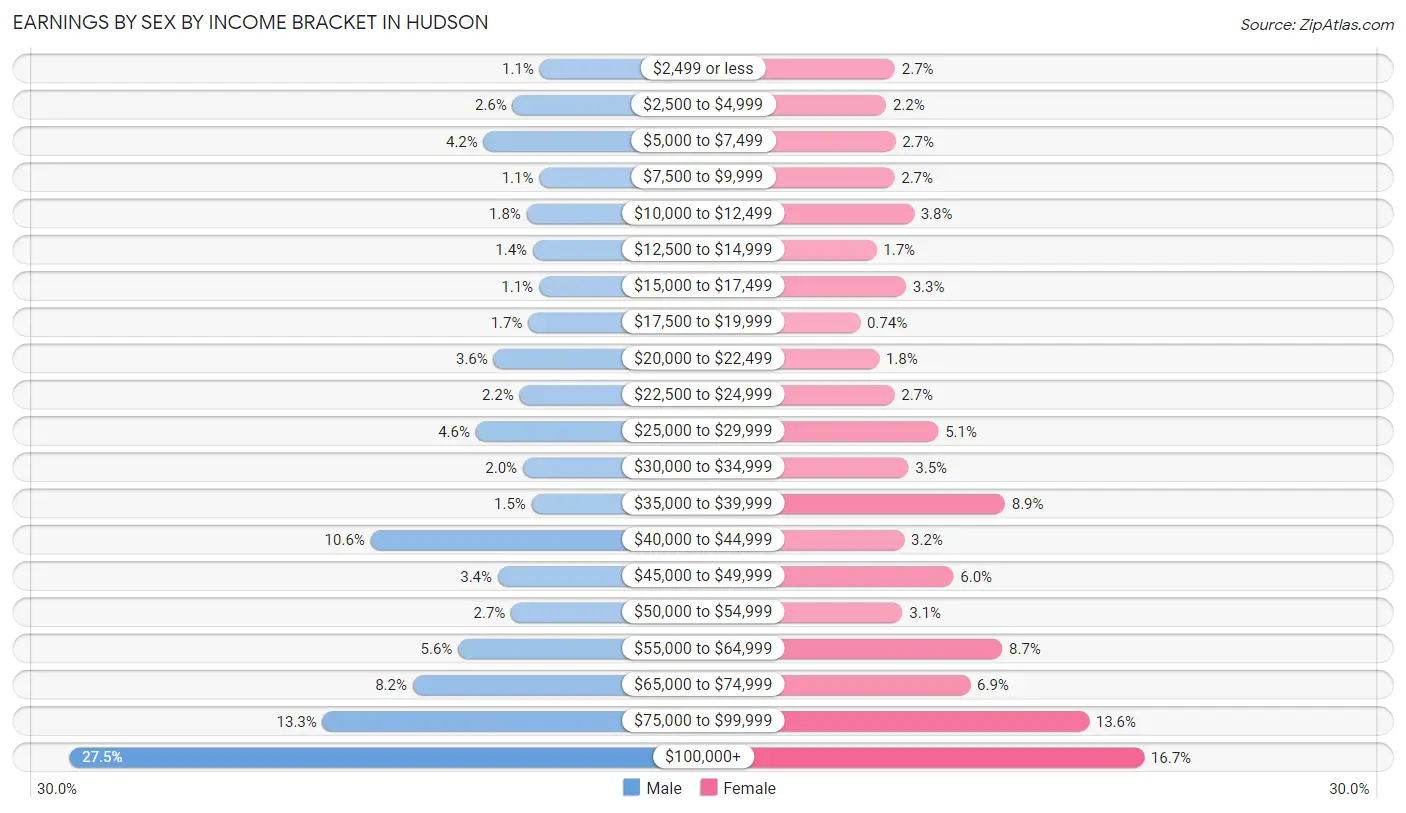
Earnings by Sex by Income Bracket in Hudson
The most common earnings brackets in Hudson are $100,000+ for men (1,285 | 27.5%) and $100,000+ for women (675 | 16.7%).
| Income | Male | Female |
| $2,499 or less | 49 (1.1%) | 109 (2.7%) |
| $2,500 to $4,999 | 120 (2.6%) | 89 (2.2%) |
| $5,000 to $7,499 | 196 (4.2%) | 110 (2.7%) |
| $7,500 to $9,999 | 50 (1.1%) | 108 (2.7%) |
| $10,000 to $12,499 | 83 (1.8%) | 152 (3.8%) |
| $12,500 to $14,999 | 67 (1.4%) | 67 (1.7%) |
| $15,000 to $17,499 | 51 (1.1%) | 134 (3.3%) |
| $17,500 to $19,999 | 79 (1.7%) | 30 (0.7%) |
| $20,000 to $22,499 | 170 (3.6%) | 73 (1.8%) |
| $22,500 to $24,999 | 102 (2.2%) | 108 (2.7%) |
| $25,000 to $29,999 | 217 (4.6%) | 208 (5.1%) |
| $30,000 to $34,999 | 93 (2.0%) | 140 (3.5%) |
| $35,000 to $39,999 | 70 (1.5%) | 359 (8.9%) |
| $40,000 to $44,999 | 493 (10.5%) | 130 (3.2%) |
| $45,000 to $49,999 | 159 (3.4%) | 242 (6.0%) |
| $50,000 to $54,999 | 124 (2.6%) | 126 (3.1%) |
| $55,000 to $64,999 | 263 (5.6%) | 353 (8.7%) |
| $65,000 to $74,999 | 382 (8.2%) | 280 (6.9%) |
| $75,000 to $99,999 | 619 (13.3%) | 550 (13.6%) |
| $100,000+ | 1,285 (27.5%) | 675 (16.7%) |
| Total | 4,672 (100.0%) | 4,043 (100.0%) |
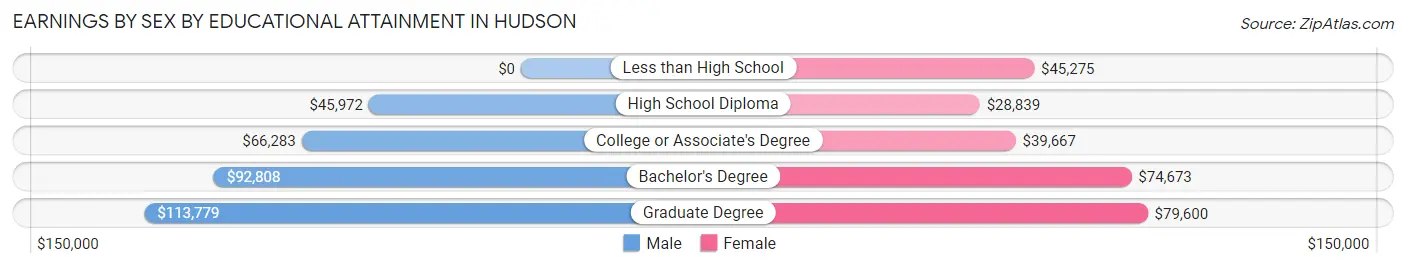
Earnings by Sex by Educational Attainment in Hudson
Average earnings in Hudson are $68,171 for men and $55,571 for women, a difference of 18.5%. Men with an educational attainment of graduate degree enjoy the highest average annual earnings of $113,779, while those with high school diploma education earn the least with $45,972. Women with an educational attainment of graduate degree earn the most with the average annual earnings of $79,600, while those with high school diploma education have the smallest earnings of $28,839.
| Educational Attainment | Male Income | Female Income |
| Less than High School | - | - |
| High School Diploma | $45,972 | $28,839 |
| College or Associate's Degree | $66,283 | $39,667 |
| Bachelor's Degree | $92,808 | $74,673 |
| Graduate Degree | $113,779 | $79,600 |
| Total | $68,171 | $55,571 |
Family Income in Hudson
Family Income Brackets in Hudson
According to the Hudson family income data, there are 1,006 families falling into the $100,000 to $149,999 income range, which is the most common income bracket and makes up 25.6% of all families. Conversely, the $10,000 to $14,999 income bracket is the least frequent group with only 12 families (0.3%) belonging to this category.
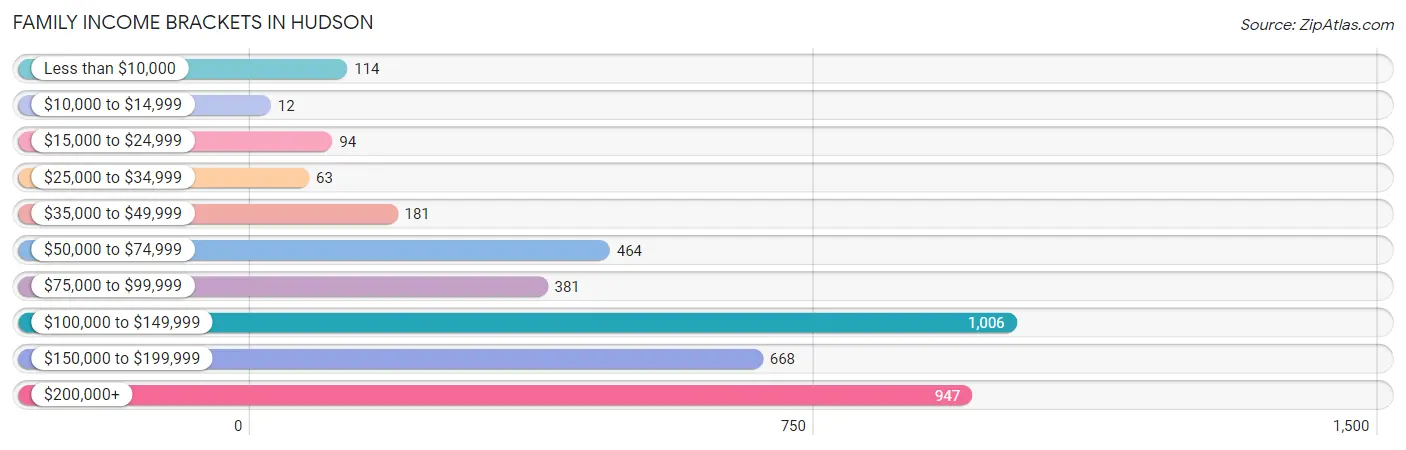
| Income Bracket | # Families | % Families |
| Less than $10,000 | 114 | 2.9% |
| $10,000 to $14,999 | 12 | 0.3% |
| $15,000 to $24,999 | 94 | 2.4% |
| $25,000 to $34,999 | 63 | 1.6% |
| $35,000 to $49,999 | 181 | 4.6% |
| $50,000 to $74,999 | 464 | 11.8% |
| $75,000 to $99,999 | 381 | 9.7% |
| $100,000 to $149,999 | 1,006 | 25.6% |
| $150,000 to $199,999 | 668 | 17.0% |
| $200,000+ | 947 | 24.1% |
Family Income by Famaliy Size in Hudson
5-person families (396 | 10.1%) account for the highest median family income in Hudson with $177,813 per family, while 2-person families (1,794 | 45.6%) have the highest median income of $55,882 per family member.
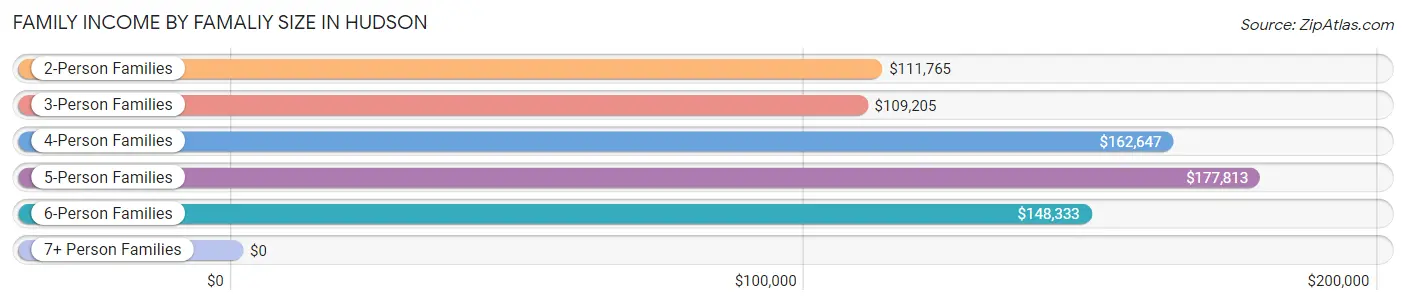
| Income Bracket | # Families | Median Income |
| 2-Person Families | 1,794 (45.6%) | $111,765 |
| 3-Person Families | 942 (24.0%) | $109,205 |
| 4-Person Families | 718 (18.3%) | $162,647 |
| 5-Person Families | 396 (10.1%) | $177,813 |
| 6-Person Families | 48 (1.2%) | $148,333 |
| 7+ Person Families | 33 (0.8%) | $0 |
| Total | 3,931 (100.0%) | $129,925 |
Family Income by Number of Earners in Hudson
The median family income in Hudson is $129,925, with families comprising 2 earners (1,718) having the highest median family income of $159,231, while families with no earners (459) have the lowest median family income of $55,469, accounting for 43.7% and 11.7% of families, respectively.
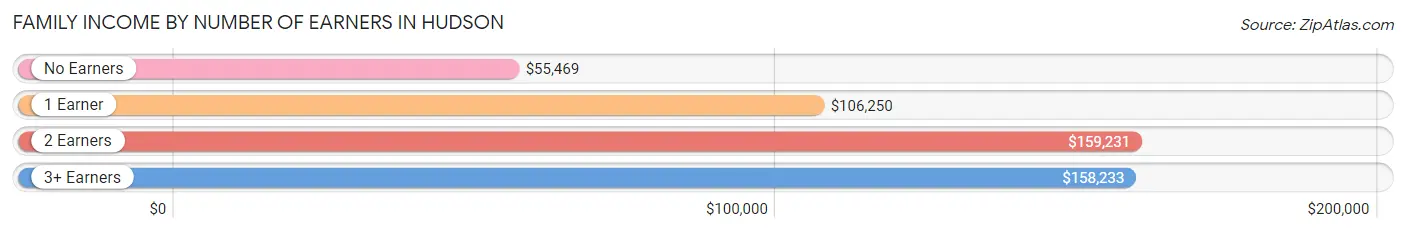
| Number of Earners | # Families | Median Income |
| No Earners | 459 (11.7%) | $55,469 |
| 1 Earner | 1,261 (32.1%) | $106,250 |
| 2 Earners | 1,718 (43.7%) | $159,231 |
| 3+ Earners | 493 (12.5%) | $158,233 |
| Total | 3,931 (100.0%) | $129,925 |
Household Income in Hudson
Household Income Brackets in Hudson
With 1,222 households falling in the category, the $100,000 to $149,999 income range is the most frequent in Hudson, accounting for 18.7% of all households. In contrast, only 91 households (1.4%) fall into the $10,000 to $14,999 income bracket, making it the least populous group.
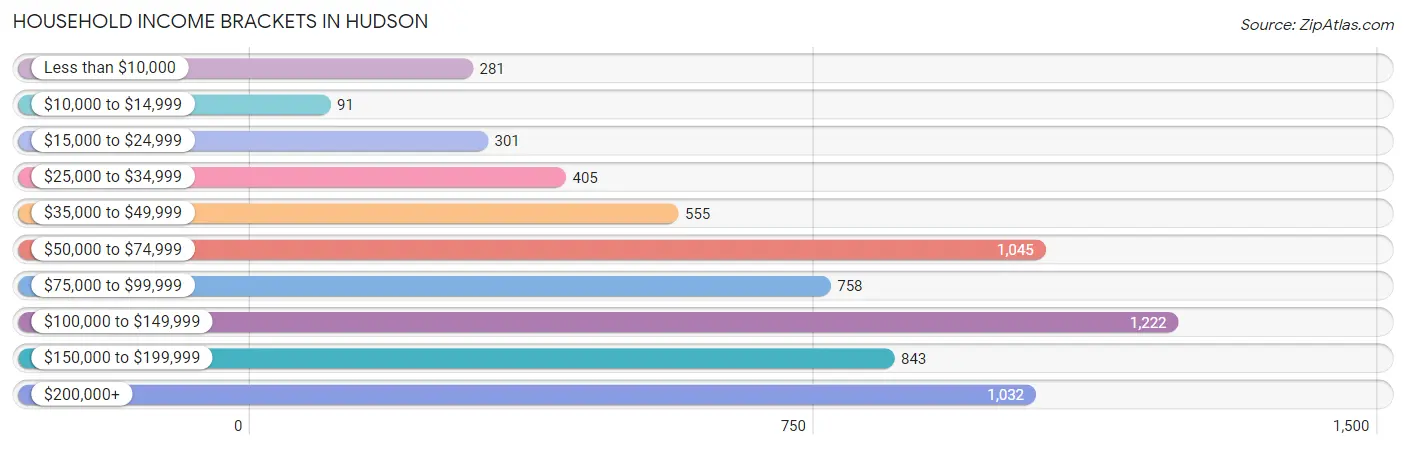
| Income Bracket | # Households | % Households |
| Less than $10,000 | 281 | 4.3% |
| $10,000 to $14,999 | 91 | 1.4% |
| $15,000 to $24,999 | 301 | 4.6% |
| $25,000 to $34,999 | 405 | 6.2% |
| $35,000 to $49,999 | 555 | 8.5% |
| $50,000 to $74,999 | 1,045 | 16.0% |
| $75,000 to $99,999 | 758 | 11.6% |
| $100,000 to $149,999 | 1,222 | 18.7% |
| $150,000 to $199,999 | 843 | 12.9% |
| $200,000+ | 1,032 | 15.8% |
Household Income by Householder Age in Hudson
The median household income in Hudson is $91,324, with the highest median household income of $124,750 found in the 25 to 44 years age bracket for the primary householder. A total of 1,839 households (28.1%) fall into this category. Meanwhile, the 65+ years age bracket for the primary householder has the lowest median household income of $55,991, with 1,987 households (30.4%) in this group.
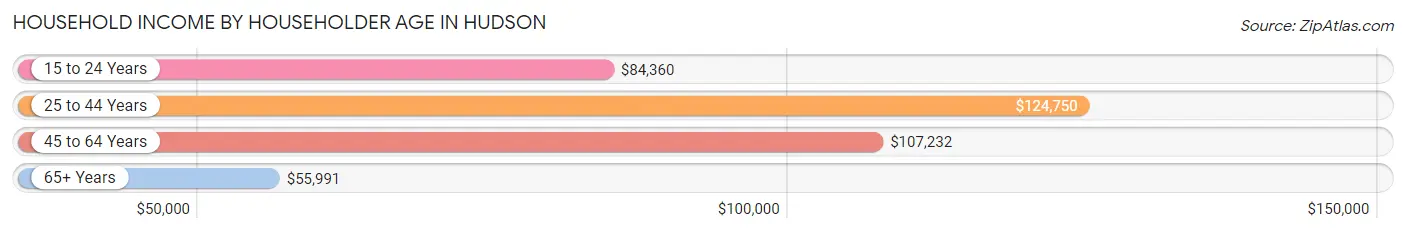
| Income Bracket | # Households | Median Income |
| 15 to 24 Years | 213 (3.3%) | $84,360 |
| 25 to 44 Years | 1,839 (28.1%) | $124,750 |
| 45 to 64 Years | 2,495 (38.2%) | $107,232 |
| 65+ Years | 1,987 (30.4%) | $55,991 |
| Total | 6,534 (100.0%) | $91,324 |
Poverty in Hudson
Income Below Poverty by Sex and Age in Hudson
With 6.0% poverty level for males and 7.4% for females among the residents of Hudson, under 5 year old males and 18 to 24 year old females are the most vulnerable to poverty, with 67 males (13.9%) and 95 females (19.3%) in their respective age groups living below the poverty level.
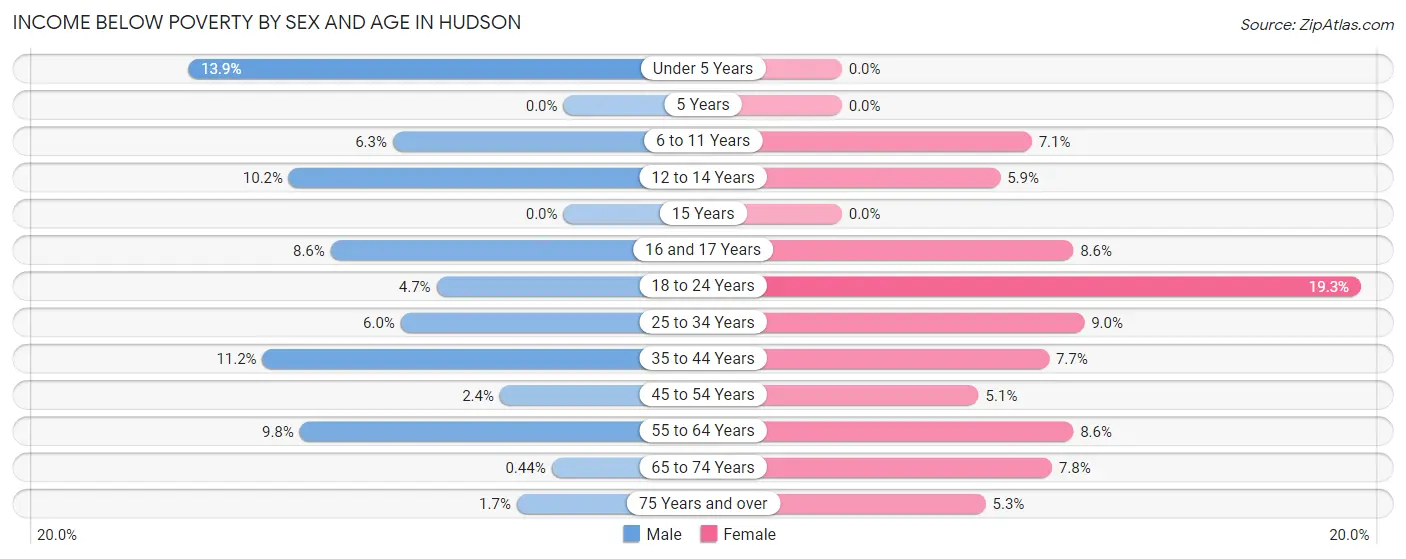
| Age Bracket | Male | Female |
| Under 5 Years | 67 (13.9%) | 0 (0.0%) |
| 5 Years | 0 (0.0%) | 0 (0.0%) |
| 6 to 11 Years | 25 (6.3%) | 31 (7.0%) |
| 12 to 14 Years | 11 (10.2%) | 16 (5.9%) |
| 15 Years | 0 (0.0%) | 0 (0.0%) |
| 16 and 17 Years | 21 (8.6%) | 11 (8.6%) |
| 18 to 24 Years | 27 (4.7%) | 95 (19.3%) |
| 25 to 34 Years | 64 (6.0%) | 81 (9.0%) |
| 35 to 44 Years | 98 (11.2%) | 85 (7.7%) |
| 45 to 54 Years | 29 (2.4%) | 57 (5.1%) |
| 55 to 64 Years | 96 (9.8%) | 105 (8.6%) |
| 65 to 74 Years | 3 (0.4%) | 64 (7.8%) |
| 75 Years and over | 9 (1.7%) | 52 (5.3%) |
| Total | 450 (6.0%) | 597 (7.4%) |
Income Above Poverty by Sex and Age in Hudson
According to the poverty statistics in Hudson, males aged 5 years and females aged under 5 years are the age groups that are most secure financially, with 100.0% of males and 100.0% of females in these age groups living above the poverty line.
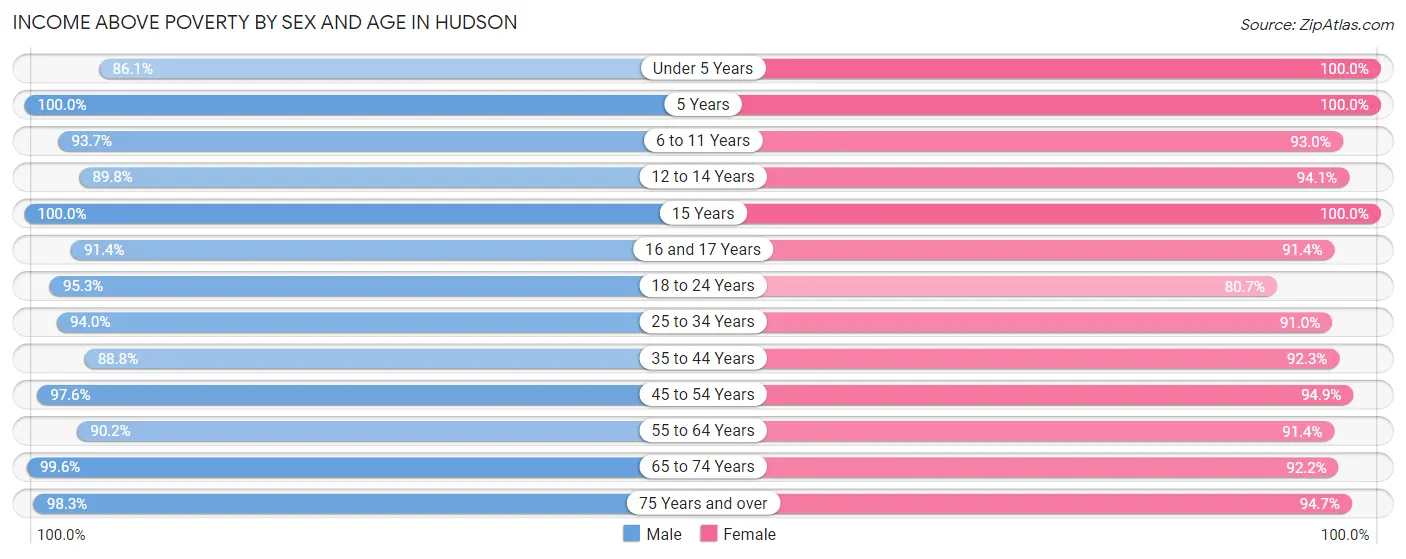
| Age Bracket | Male | Female |
| Under 5 Years | 414 (86.1%) | 358 (100.0%) |
| 5 Years | 89 (100.0%) | 70 (100.0%) |
| 6 to 11 Years | 370 (93.7%) | 409 (92.9%) |
| 12 to 14 Years | 97 (89.8%) | 256 (94.1%) |
| 15 Years | 210 (100.0%) | 119 (100.0%) |
| 16 and 17 Years | 222 (91.4%) | 117 (91.4%) |
| 18 to 24 Years | 546 (95.3%) | 398 (80.7%) |
| 25 to 34 Years | 995 (94.0%) | 819 (91.0%) |
| 35 to 44 Years | 779 (88.8%) | 1,020 (92.3%) |
| 45 to 54 Years | 1,202 (97.6%) | 1,065 (94.9%) |
| 55 to 64 Years | 885 (90.2%) | 1,117 (91.4%) |
| 65 to 74 Years | 685 (99.6%) | 756 (92.2%) |
| 75 Years and over | 510 (98.3%) | 922 (94.7%) |
| Total | 7,004 (94.0%) | 7,426 (92.6%) |
Income Below Poverty Among Married-Couple Families in Hudson
The poverty statistics for married-couple families in Hudson show that 1.5% or 47 of the total 3,194 families live below the poverty line. Families with no children have the highest poverty rate of 1.7%, comprising of 30 families. On the other hand, families with 3 or 4 children have the lowest poverty rate of 0.0%, which includes 0 families.
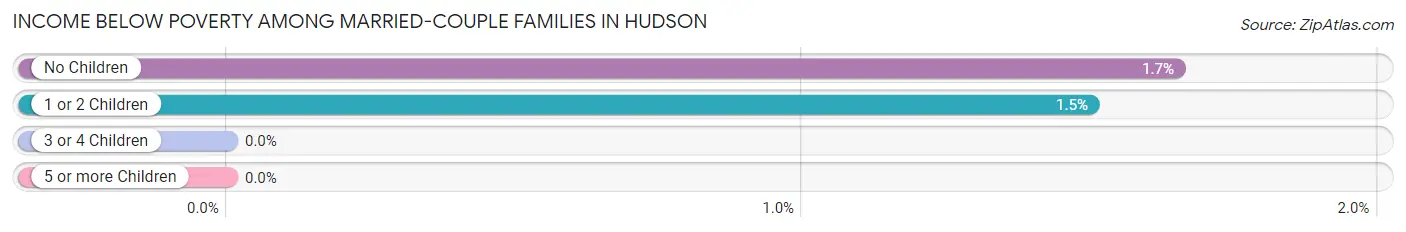
| Children | Above Poverty | Below Poverty |
| No Children | 1,792 (98.4%) | 30 (1.7%) |
| 1 or 2 Children | 1,115 (98.5%) | 17 (1.5%) |
| 3 or 4 Children | 240 (100.0%) | 0 (0.0%) |
| 5 or more Children | 0 (0.0%) | 0 (0.0%) |
| Total | 3,147 (98.5%) | 47 (1.5%) |
Income Below Poverty Among Single-Parent Households in Hudson
According to the poverty data in Hudson, 26.4% or 53 single-father households and 14.9% or 80 single-mother households are living below the poverty line. Among single-father households, those with 1 or 2 children have the highest poverty rate, with 53 households (64.6%) experiencing poverty. Likewise, among single-mother households, those with 1 or 2 children have the highest poverty rate, with 54 households (23.9%) falling below the poverty line.
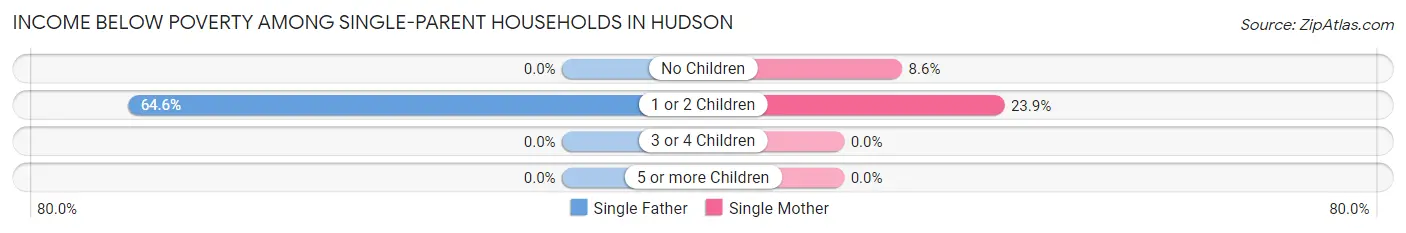
| Children | Single Father | Single Mother |
| No Children | 0 (0.0%) | 26 (8.6%) |
| 1 or 2 Children | 53 (64.6%) | 54 (23.9%) |
| 3 or 4 Children | 0 (0.0%) | 0 (0.0%) |
| 5 or more Children | 0 (0.0%) | 0 (0.0%) |
| Total | 53 (26.4%) | 80 (14.9%) |
Income Below Poverty Among Married-Couple vs Single-Parent Households in Hudson
The poverty data for Hudson shows that 47 of the married-couple family households (1.5%) and 133 of the single-parent households (18.0%) are living below the poverty level. Within the married-couple family households, those with no children have the highest poverty rate, with 30 households (1.7%) falling below the poverty line. Among the single-parent households, those with 1 or 2 children have the highest poverty rate, with 107 household (34.7%) living below poverty.
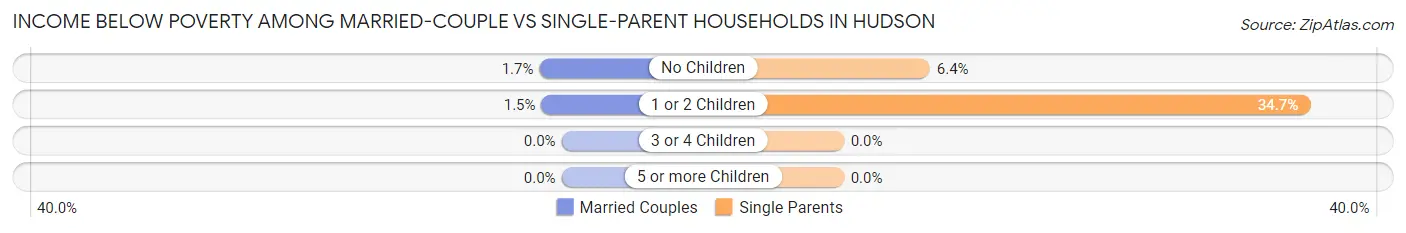
| Children | Married-Couple Families | Single-Parent Households |
| No Children | 30 (1.7%) | 26 (6.4%) |
| 1 or 2 Children | 17 (1.5%) | 107 (34.7%) |
| 3 or 4 Children | 0 (0.0%) | 0 (0.0%) |
| 5 or more Children | 0 (0.0%) | 0 (0.0%) |
| Total | 47 (1.5%) | 133 (18.0%) |
Race in Hudson
The most populous races in Hudson are White / Caucasian (13,035 | 84.1%), Hispanic or Latino (1,111 | 7.2%), and Two or more Races (1,107 | 7.1%).
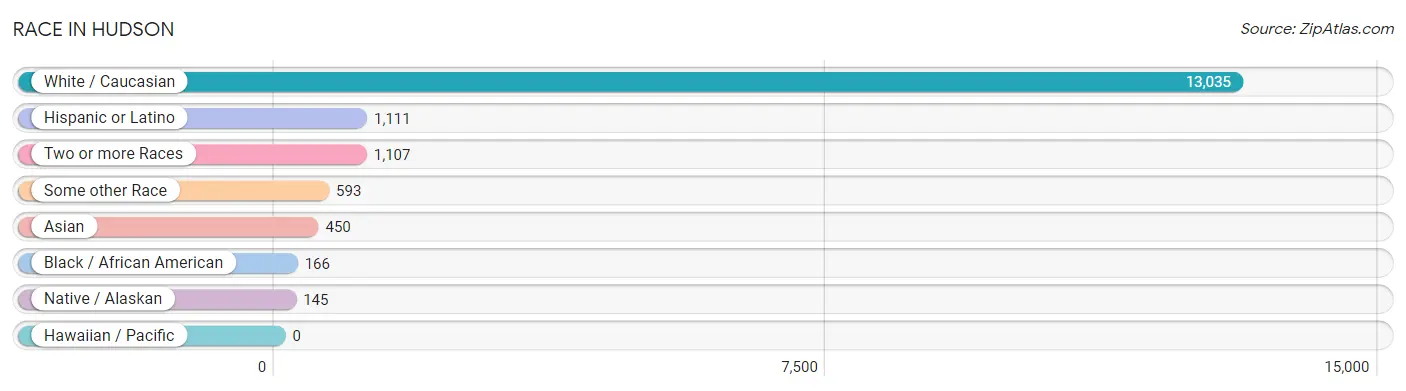
| Race | # Population | % Population |
| Asian | 450 | 2.9% |
| Black / African American | 166 | 1.1% |
| Hawaiian / Pacific | 0 | 0.0% |
| Hispanic or Latino | 1,111 | 7.2% |
| Native / Alaskan | 145 | 0.9% |
| White / Caucasian | 13,035 | 84.1% |
| Two or more Races | 1,107 | 7.1% |
| Some other Race | 593 | 3.8% |
| Total | 15,496 | 100.0% |
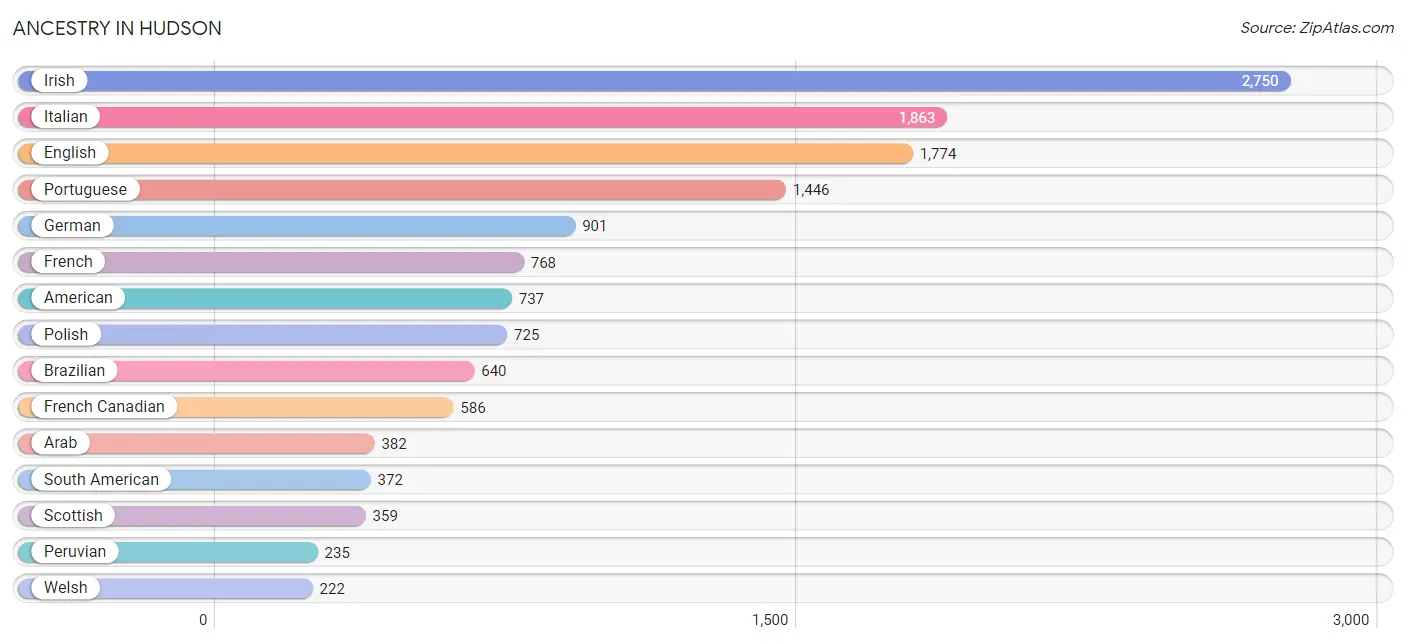
Ancestry in Hudson
The most populous ancestries reported in Hudson are Irish (2,750 | 17.7%), Italian (1,863 | 12.0%), English (1,774 | 11.5%), Portuguese (1,446 | 9.3%), and German (901 | 5.8%), together accounting for 56.4% of all Hudson residents.
| Ancestry | # Population | % Population |
| Albanian | 25 | 0.2% |
| Alsatian | 10 | 0.1% |
| American | 737 | 4.8% |
| Arab | 382 | 2.5% |
| Armenian | 104 | 0.7% |
| Bahamian | 20 | 0.1% |
| Belgian | 8 | 0.1% |
| Brazilian | 640 | 4.1% |
| British | 69 | 0.4% |
| Burmese | 27 | 0.2% |
| Canadian | 179 | 1.2% |
| Central American | 189 | 1.2% |
| Central American Indian | 143 | 0.9% |
| Cherokee | 32 | 0.2% |
| Chilean | 123 | 0.8% |
| Cuban | 20 | 0.1% |
| Czech | 12 | 0.1% |
| Danish | 175 | 1.1% |
| Dutch | 136 | 0.9% |
| Eastern European | 9 | 0.1% |
| Egyptian | 18 | 0.1% |
| English | 1,774 | 11.5% |
| European | 153 | 1.0% |
| Finnish | 61 | 0.4% |
| French | 768 | 5.0% |
| French American Indian | 29 | 0.2% |
| French Canadian | 586 | 3.8% |
| German | 901 | 5.8% |
| Greek | 162 | 1.1% |
| Guatemalan | 141 | 0.9% |
| Haitian | 4 | 0.0% |
| Hungarian | 24 | 0.2% |
| Indian (Asian) | 157 | 1.0% |
| Iranian | 60 | 0.4% |
| Iraqi | 63 | 0.4% |
| Irish | 2,750 | 17.7% |
| Iroquois | 44 | 0.3% |
| Italian | 1,863 | 12.0% |
| Korean | 180 | 1.2% |
| Lebanese | 10 | 0.1% |
| Lithuanian | 145 | 0.9% |
| Mexican | 194 | 1.3% |
| Mexican American Indian | 20 | 0.1% |
| Mongolian | 31 | 0.2% |
| Nigerian | 20 | 0.1% |
| Northern European | 28 | 0.2% |
| Norwegian | 52 | 0.3% |
| Pakistani | 12 | 0.1% |
| Pennsylvania German | 13 | 0.1% |
| Peruvian | 235 | 1.5% |
| Polish | 725 | 4.7% |
| Portuguese | 1,446 | 9.3% |
| Puerto Rican | 144 | 0.9% |
| Russian | 138 | 0.9% |
| Salvadoran | 48 | 0.3% |
| Scandinavian | 76 | 0.5% |
| Scotch-Irish | 100 | 0.6% |
| Scottish | 359 | 2.3% |
| Slovak | 9 | 0.1% |
| South American | 372 | 2.4% |
| Spanish | 8 | 0.1% |
| Sri Lankan | 84 | 0.5% |
| Subsaharan African | 20 | 0.1% |
| Swedish | 129 | 0.8% |
| Thai | 62 | 0.4% |
| Trinidadian and Tobagonian | 29 | 0.2% |
| Ukrainian | 6 | 0.0% |
| Venezuelan | 14 | 0.1% |
| Vietnamese | 9 | 0.1% |
| Welsh | 222 | 1.4% | View All 70 Rows |
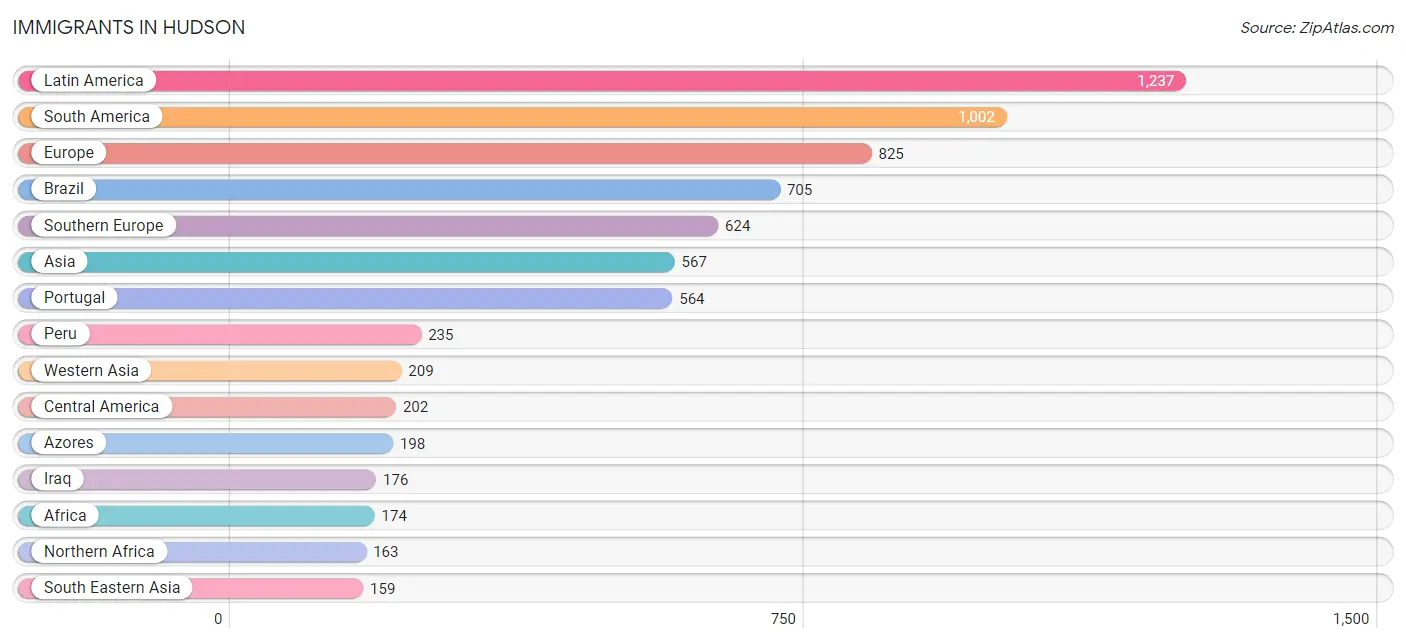
Immigrants in Hudson
The most numerous immigrant groups reported in Hudson came from Latin America (1,237 | 8.0%), South America (1,002 | 6.5%), Europe (825 | 5.3%), Brazil (705 | 4.5%), and Southern Europe (624 | 4.0%), together accounting for 28.3% of all Hudson residents.
| Immigration Origin | # Population | % Population |
| Africa | 174 | 1.1% |
| Albania | 14 | 0.1% |
| Asia | 567 | 3.7% |
| Azores | 198 | 1.3% |
| Brazil | 705 | 4.5% |
| Canada | 145 | 0.9% |
| Caribbean | 33 | 0.2% |
| Central America | 202 | 1.3% |
| Chile | 48 | 0.3% |
| China | 83 | 0.5% |
| Eastern Asia | 113 | 0.7% |
| Eastern Europe | 48 | 0.3% |
| Egypt | 18 | 0.1% |
| El Salvador | 68 | 0.4% |
| England | 22 | 0.1% |
| Europe | 825 | 5.3% |
| France | 64 | 0.4% |
| Germany | 40 | 0.3% |
| Greece | 31 | 0.2% |
| Guatemala | 122 | 0.8% |
| Haiti | 4 | 0.0% |
| India | 17 | 0.1% |
| Iran | 60 | 0.4% |
| Iraq | 176 | 1.1% |
| Italy | 29 | 0.2% |
| Japan | 30 | 0.2% |
| Kuwait | 33 | 0.2% |
| Latin America | 1,237 | 8.0% |
| Malaysia | 25 | 0.2% |
| Mexico | 12 | 0.1% |
| Northern Africa | 163 | 1.1% |
| Northern Europe | 49 | 0.3% |
| Pakistan | 9 | 0.1% |
| Peru | 235 | 1.5% |
| Philippines | 107 | 0.7% |
| Portugal | 564 | 3.6% |
| Russia | 34 | 0.2% |
| South America | 1,002 | 6.5% |
| South Central Asia | 86 | 0.5% |
| South Eastern Asia | 159 | 1.0% |
| Southern Europe | 624 | 4.0% |
| Trinidad and Tobago | 29 | 0.2% |
| Venezuela | 14 | 0.1% |
| Vietnam | 27 | 0.2% |
| Western Asia | 209 | 1.3% |
| Western Europe | 104 | 0.7% | View All 46 Rows |
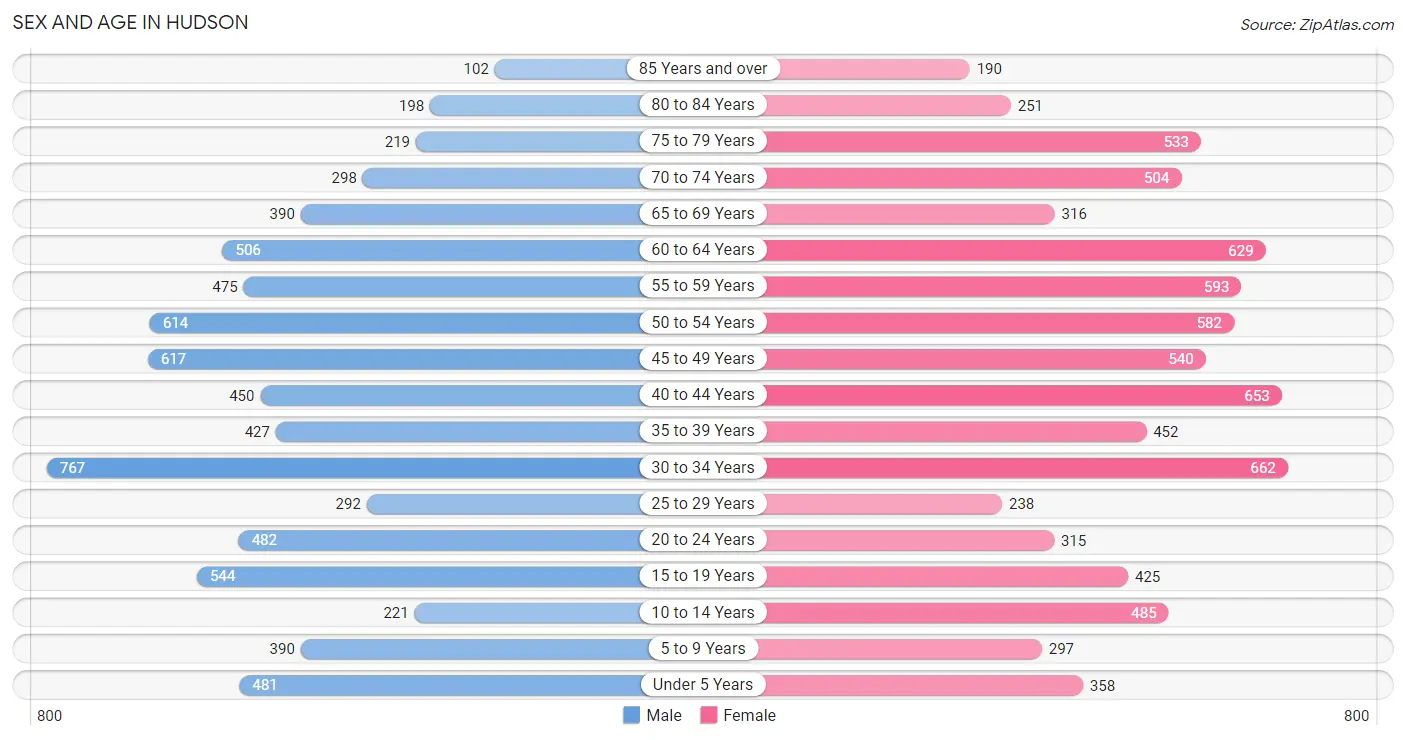
Sex and Age in Hudson
Sex and Age in Hudson
The most populous age groups in Hudson are 30 to 34 Years (767 | 10.3%) for men and 30 to 34 Years (662 | 8.3%) for women.
| Age Bracket | Male | Female |
| Under 5 Years | 481 (6.4%) | 358 (4.5%) |
| 5 to 9 Years | 390 (5.2%) | 297 (3.7%) |
| 10 to 14 Years | 221 (3.0%) | 485 (6.0%) |
| 15 to 19 Years | 544 (7.3%) | 425 (5.3%) |
| 20 to 24 Years | 482 (6.5%) | 315 (3.9%) |
| 25 to 29 Years | 292 (3.9%) | 238 (3.0%) |
| 30 to 34 Years | 767 (10.3%) | 662 (8.3%) |
| 35 to 39 Years | 427 (5.7%) | 452 (5.6%) |
| 40 to 44 Years | 450 (6.0%) | 653 (8.1%) |
| 45 to 49 Years | 617 (8.3%) | 540 (6.7%) |
| 50 to 54 Years | 614 (8.2%) | 582 (7.2%) |
| 55 to 59 Years | 475 (6.4%) | 593 (7.4%) |
| 60 to 64 Years | 506 (6.8%) | 629 (7.8%) |
| 65 to 69 Years | 390 (5.2%) | 316 (3.9%) |
| 70 to 74 Years | 298 (4.0%) | 504 (6.3%) |
| 75 to 79 Years | 219 (2.9%) | 533 (6.6%) |
| 80 to 84 Years | 198 (2.6%) | 251 (3.1%) |
| 85 Years and over | 102 (1.4%) | 190 (2.4%) |
| Total | 7,473 (100.0%) | 8,023 (100.0%) |
Families and Households in Hudson
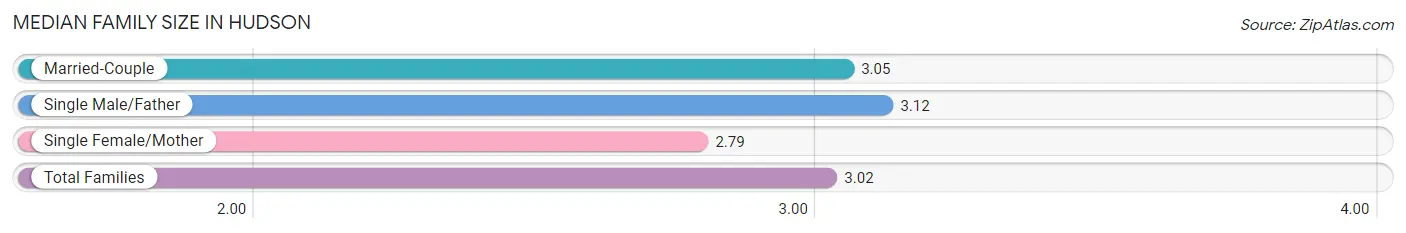
Median Family Size in Hudson
The median family size in Hudson is 3.02 persons per family, with single male/father families (201 | 5.1%) accounting for the largest median family size of 3.12 persons per family. On the other hand, single female/mother families (536 | 13.6%) represent the smallest median family size with 2.79 persons per family.
| Family Type | # Families | Family Size |
| Married-Couple | 3,194 (81.2%) | 3.05 |
| Single Male/Father | 201 (5.1%) | 3.12 |
| Single Female/Mother | 536 (13.6%) | 2.79 |
| Total Families | 3,931 (100.0%) | 3.02 |
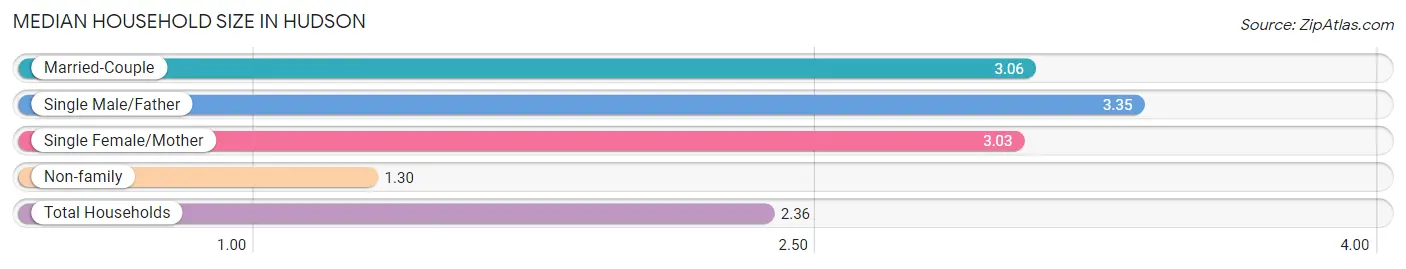
Median Household Size in Hudson
The median household size in Hudson is 2.36 persons per household, with single male/father households (201 | 3.1%) accounting for the largest median household size of 3.35 persons per household. non-family households (2,603 | 39.8%) represent the smallest median household size with 1.30 persons per household.
| Household Type | # Households | Household Size |
| Married-Couple | 3,194 (48.9%) | 3.06 |
| Single Male/Father | 201 (3.1%) | 3.35 |
| Single Female/Mother | 536 (8.2%) | 3.03 |
| Non-family | 2,603 (39.8%) | 1.30 |
| Total Households | 6,534 (100.0%) | 2.36 |
Household Size by Marriage Status in Hudson
Out of a total of 6,534 households in Hudson, 3,931 (60.2%) are family households, while 2,603 (39.8%) are nonfamily households. The most numerous type of family households are 2-person households, comprising 1,718, and the most common type of nonfamily households are 1-person households, comprising 1,928.
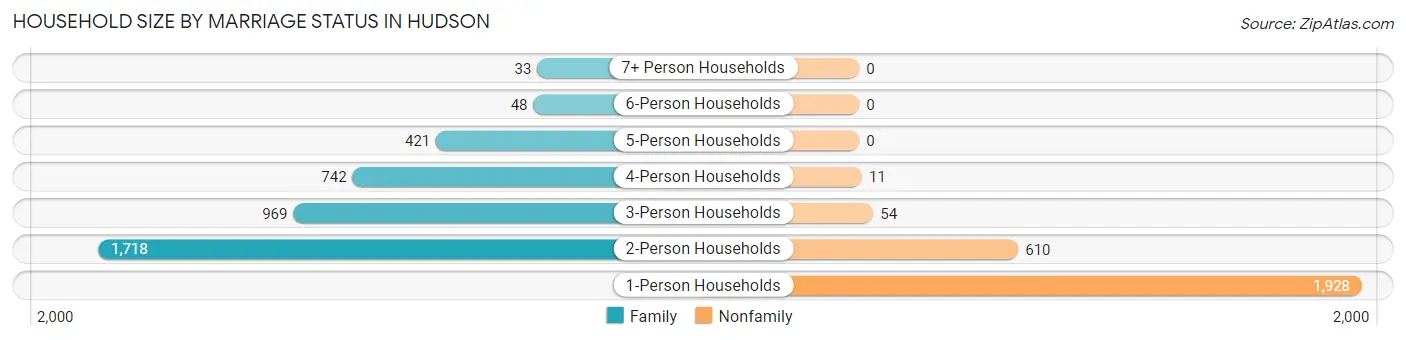
| Household Size | Family Households | Nonfamily Households |
| 1-Person Households | - | 1,928 (29.5%) |
| 2-Person Households | 1,718 (26.3%) | 610 (9.3%) |
| 3-Person Households | 969 (14.8%) | 54 (0.8%) |
| 4-Person Households | 742 (11.4%) | 11 (0.2%) |
| 5-Person Households | 421 (6.4%) | 0 (0.0%) |
| 6-Person Households | 48 (0.7%) | 0 (0.0%) |
| 7+ Person Households | 33 (0.5%) | 0 (0.0%) |
| Total | 3,931 (60.2%) | 2,603 (39.8%) |
Female Fertility in Hudson
Fertility by Age in Hudson
Average fertility rate in Hudson is 51.0 births per 1,000 women. Women in the age bracket of 35 to 50 years have the highest fertility rate with 62.0 births per 1,000 women. Women in the age bracket of 35 to 50 years acount for 63.8% of all women with births.
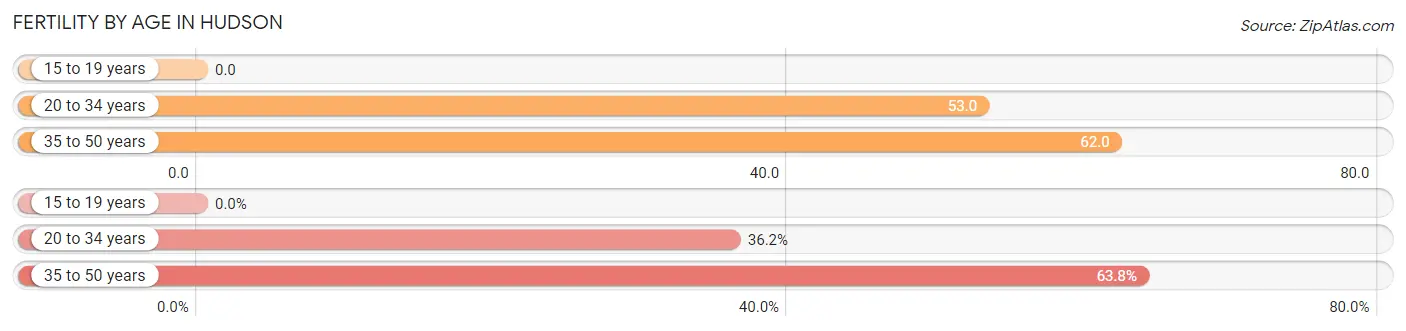
| Age Bracket | Women with Births | Births / 1,000 Women |
| 15 to 19 years | 0 (0.0%) | 0.0 |
| 20 to 34 years | 64 (36.2%) | 53.0 |
| 35 to 50 years | 113 (63.8%) | 62.0 |
| Total | 177 (100.0%) | 51.0 |
Fertility by Age by Marriage Status in Hudson
75.1% of women with births (177) in Hudson are married. The highest percentage of unmarried women with births falls into 20 to 34 years age bracket with 34.4% of them unmarried at the time of birth, while the lowest percentage of unmarried women with births belong to 35 to 50 years age bracket with 19.5% of them unmarried.
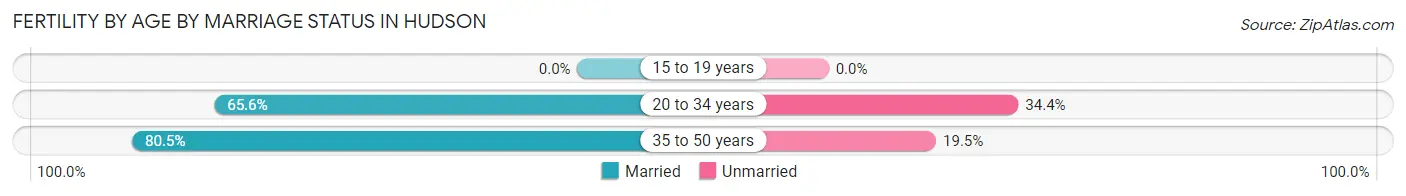
| Age Bracket | Married | Unmarried |
| 15 to 19 years | 0 (0.0%) | 0 (0.0%) |
| 20 to 34 years | 42 (65.6%) | 22 (34.4%) |
| 35 to 50 years | 91 (80.5%) | 22 (19.5%) |
| Total | 133 (75.1%) | 44 (24.9%) |
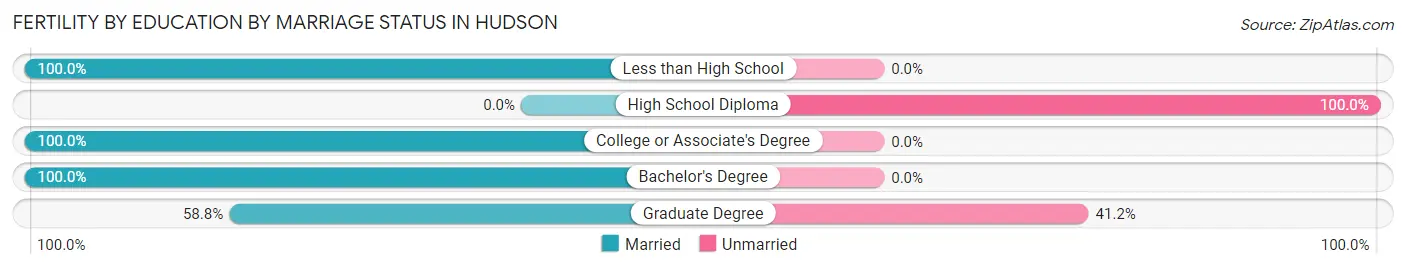
Fertility by Education in Hudson
Average fertility rate in Hudson is 51.0 births per 1,000 women. Women with the education attainment of less than high school have the highest fertility rate of 99.0 births per 1,000 women, while women with the education attainment of bachelor's degree have the lowest fertility at 31.0 births per 1,000 women. Women with the education attainment of less than high school represent 29.9% of all women with births.
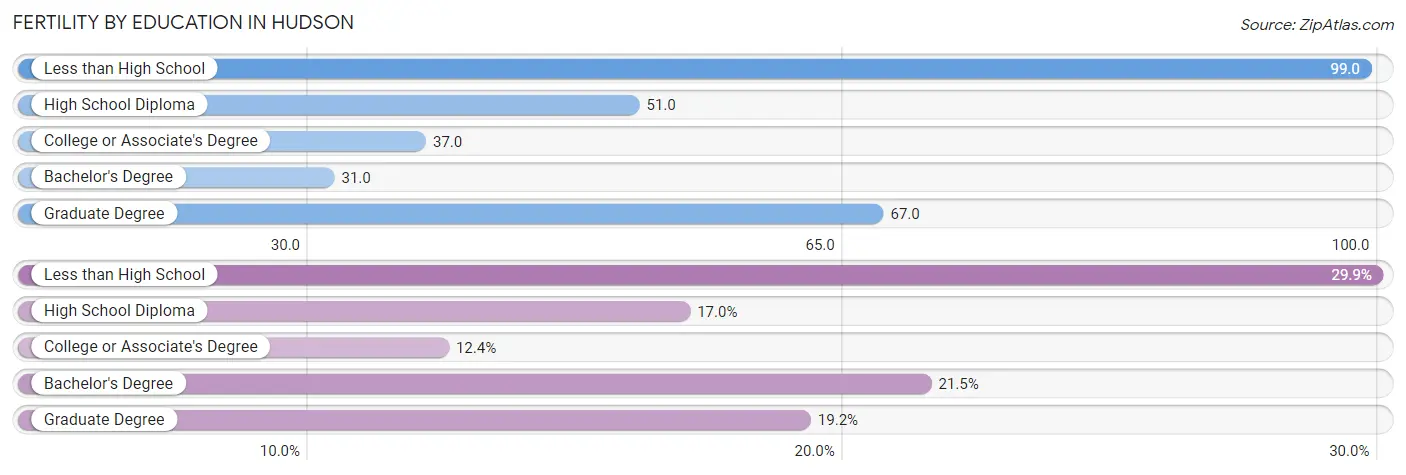
| Educational Attainment | Women with Births | Births / 1,000 Women |
| Less than High School | 53 (29.9%) | 99.0 |
| High School Diploma | 30 (17.0%) | 51.0 |
| College or Associate's Degree | 22 (12.4%) | 37.0 |
| Bachelor's Degree | 38 (21.5%) | 31.0 |
| Graduate Degree | 34 (19.2%) | 67.0 |
| Total | 177 (100.0%) | 51.0 |
Fertility by Education by Marriage Status in Hudson
24.9% of women with births in Hudson are unmarried. Women with the educational attainment of less than high school are most likely to be married with 100.0% of them married at childbirth, while women with the educational attainment of high school diploma are least likely to be married with 100.0% of them unmarried at childbirth.
| Educational Attainment | Married | Unmarried |
| Less than High School | 53 (100.0%) | 0 (0.0%) |
| High School Diploma | 0 (0.0%) | 30 (100.0%) |
| College or Associate's Degree | 22 (100.0%) | 0 (0.0%) |
| Bachelor's Degree | 38 (100.0%) | 0 (0.0%) |
| Graduate Degree | 20 (58.8%) | 14 (41.2%) |
| Total | 133 (75.1%) | 44 (24.9%) |
Employment Characteristics in Hudson
Employment by Class of Employer in Hudson
Among the 7,921 employed individuals in Hudson, private company employees (5,322 | 67.2%), local government employees (738 | 9.3%), and self-employed (not incorporated) (630 | 8.0%) make up the most common classes of employment.
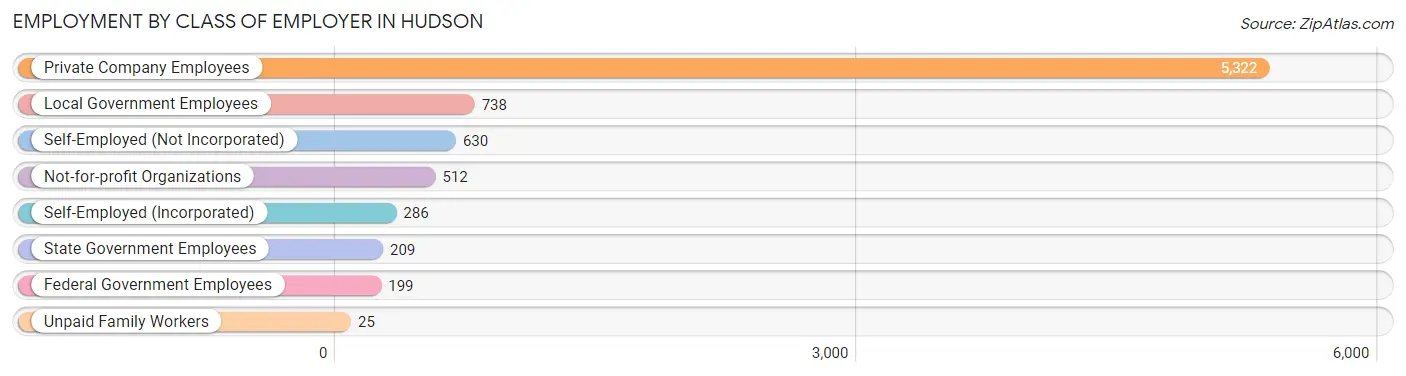
| Employer Class | # Employees | % Employees |
| Private Company Employees | 5,322 | 67.2% |
| Self-Employed (Incorporated) | 286 | 3.6% |
| Self-Employed (Not Incorporated) | 630 | 8.0% |
| Not-for-profit Organizations | 512 | 6.5% |
| Local Government Employees | 738 | 9.3% |
| State Government Employees | 209 | 2.6% |
| Federal Government Employees | 199 | 2.5% |
| Unpaid Family Workers | 25 | 0.3% |
| Total | 7,921 | 100.0% |
Employment Status by Age in Hudson
According to the labor force statistics for Hudson, out of the total population over 16 years of age (12,935), 66.2% or 8,563 individuals are in the labor force, with 4.3% or 368 of them unemployed. The age group with the highest labor force participation rate is 20 to 24 years, with 87.6% or 698 individuals in the labor force. Within the labor force, the 75 years and over age range has the highest percentage of unemployed individuals, with 12.1% or 15 of them being unemployed.
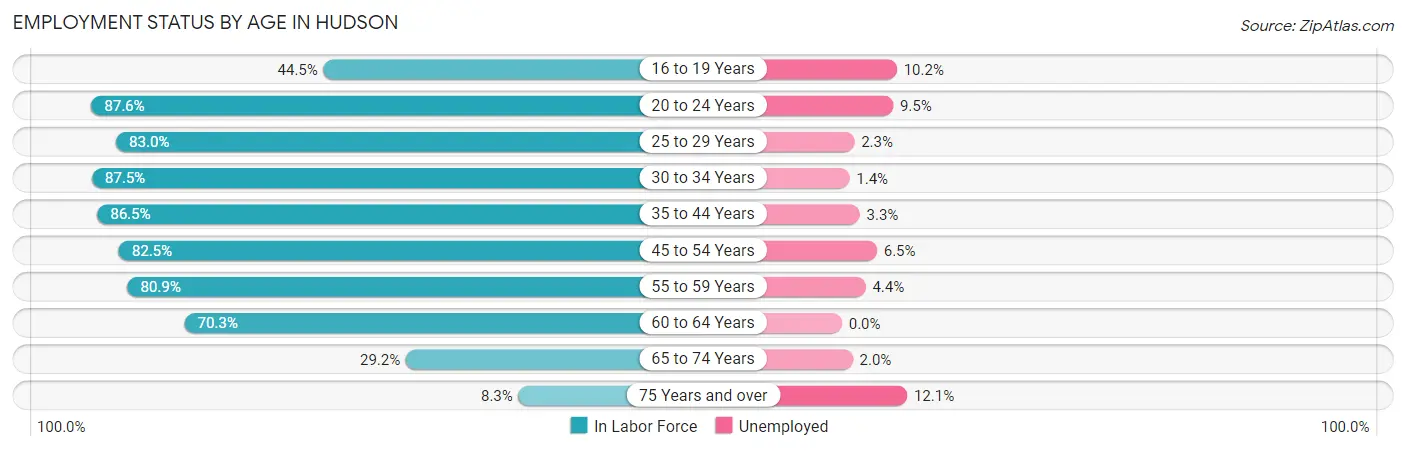
| Age Bracket | In Labor Force | Unemployed |
| 16 to 19 Years | 285 (44.5%) | 29 (10.2%) |
| 20 to 24 Years | 698 (87.6%) | 66 (9.5%) |
| 25 to 29 Years | 440 (83.0%) | 10 (2.3%) |
| 30 to 34 Years | 1,250 (87.5%) | 18 (1.4%) |
| 35 to 44 Years | 1,714 (86.5%) | 57 (3.3%) |
| 45 to 54 Years | 1,941 (82.5%) | 126 (6.5%) |
| 55 to 59 Years | 864 (80.9%) | 38 (4.4%) |
| 60 to 64 Years | 798 (70.3%) | 0 (0.0%) |
| 65 to 74 Years | 440 (29.2%) | 9 (2.0%) |
| 75 Years and over | 124 (8.3%) | 15 (12.1%) |
| Total | 8,563 (66.2%) | 368 (4.3%) |
Employment Status by Educational Attainment in Hudson
According to labor force statistics for Hudson, 82.5% of individuals (7,010) out of the total population between 25 and 64 years of age (8,497) are in the labor force, with 3.5% or 245 of them being unemployed. The group with the highest labor force participation rate are those with the educational attainment of bachelor's degree or higher, with 90.6% or 3,575 individuals in the labor force. Within the labor force, individuals with bachelor's degree or higher education have the highest percentage of unemployment, with 4.2% or 150 of them being unemployed.
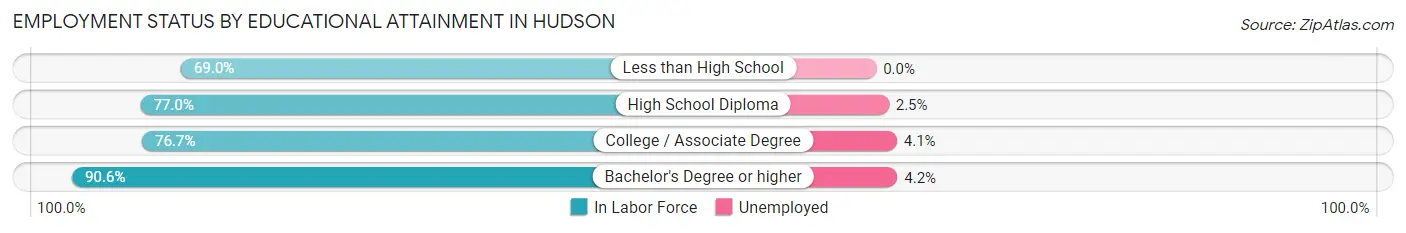
| Educational Attainment | In Labor Force | Unemployed |
| Less than High School | 570 (69.0%) | 0 (0.0%) |
| High School Diploma | 1,262 (77.0%) | 41 (2.5%) |
| College / Associate Degree | 1,600 (76.7%) | 86 (4.1%) |
| Bachelor's Degree or higher | 3,575 (90.6%) | 166 (4.2%) |
| Total | 7,010 (82.5%) | 297 (3.5%) |
Employment Occupations by Sex in Hudson
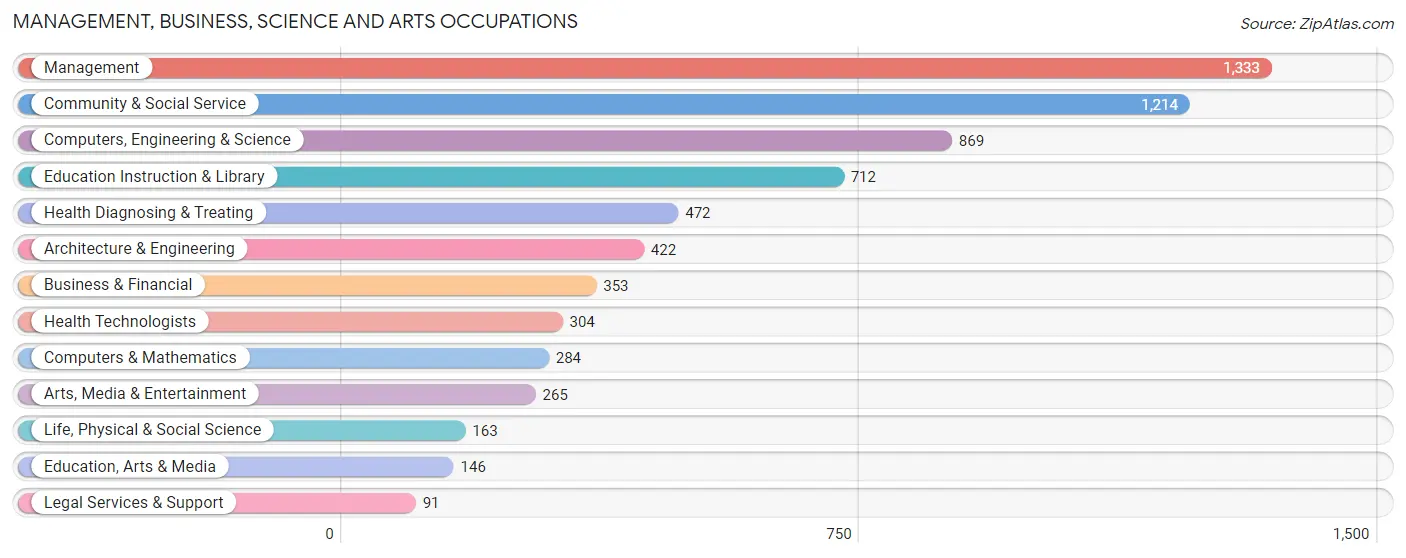
Management, Business, Science and Arts Occupations
The most common Management, Business, Science and Arts occupations in Hudson are Management (1,333 | 16.3%), Community & Social Service (1,214 | 14.8%), Computers, Engineering & Science (869 | 10.6%), Education Instruction & Library (712 | 8.7%), and Health Diagnosing & Treating (472 | 5.8%).
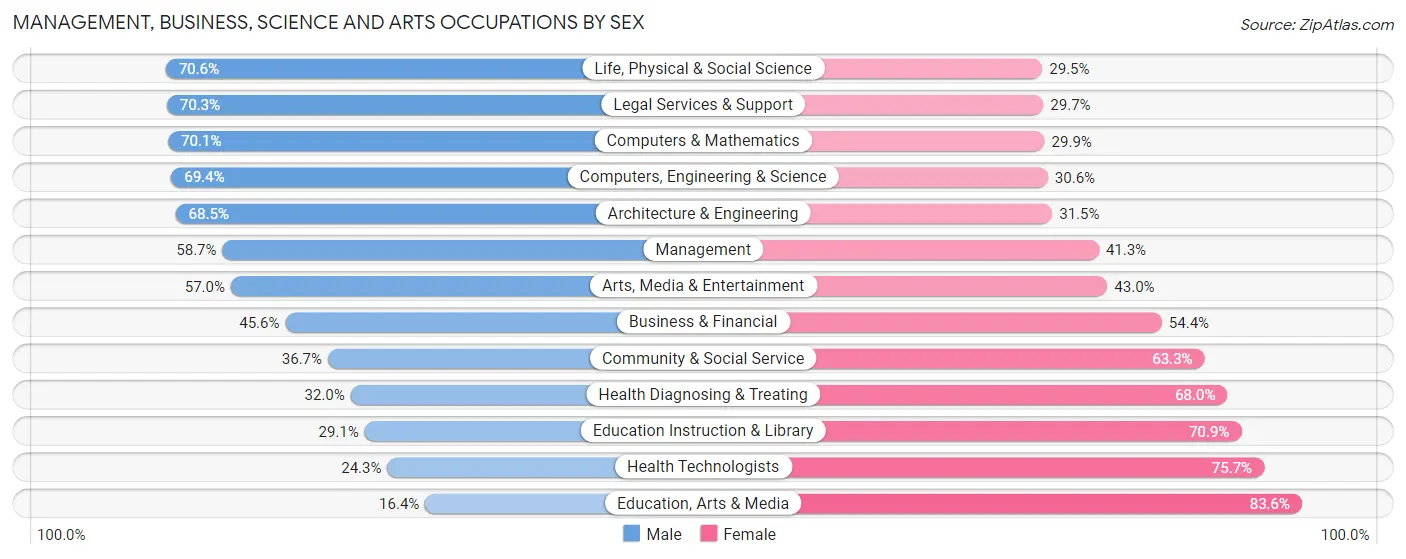
Management, Business, Science and Arts Occupations by Sex
Within the Management, Business, Science and Arts occupations in Hudson, the most male-oriented occupations are Life, Physical & Social Science (70.6%), Legal Services & Support (70.3%), and Computers & Mathematics (70.1%), while the most female-oriented occupations are Education, Arts & Media (83.6%), Health Technologists (75.7%), and Education Instruction & Library (70.9%).
| Occupation | Male | Female |
| Management | 783 (58.7%) | 550 (41.3%) |
| Business & Financial | 161 (45.6%) | 192 (54.4%) |
| Computers, Engineering & Science | 603 (69.4%) | 266 (30.6%) |
| Computers & Mathematics | 199 (70.1%) | 85 (29.9%) |
| Architecture & Engineering | 289 (68.5%) | 133 (31.5%) |
| Life, Physical & Social Science | 115 (70.6%) | 48 (29.4%) |
| Community & Social Service | 446 (36.7%) | 768 (63.3%) |
| Education, Arts & Media | 24 (16.4%) | 122 (83.6%) |
| Legal Services & Support | 64 (70.3%) | 27 (29.7%) |
| Education Instruction & Library | 207 (29.1%) | 505 (70.9%) |
| Arts, Media & Entertainment | 151 (57.0%) | 114 (43.0%) |
| Health Diagnosing & Treating | 151 (32.0%) | 321 (68.0%) |
| Health Technologists | 74 (24.3%) | 230 (75.7%) |
| Total (Category) | 2,144 (50.5%) | 2,097 (49.4%) |
| Total (Overall) | 4,439 (54.2%) | 3,752 (45.8%) |
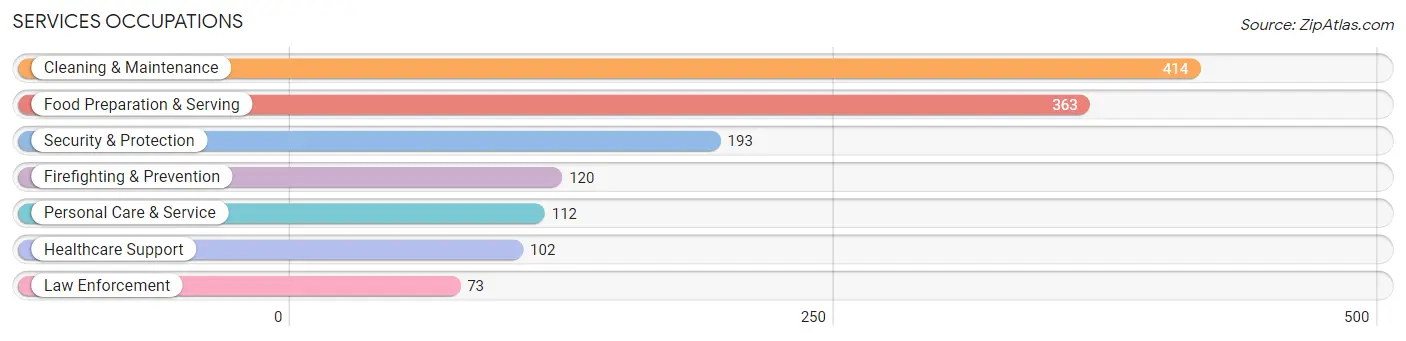
Services Occupations
The most common Services occupations in Hudson are Cleaning & Maintenance (414 | 5.1%), Food Preparation & Serving (363 | 4.4%), Security & Protection (193 | 2.4%), Firefighting & Prevention (120 | 1.5%), and Personal Care & Service (112 | 1.4%).
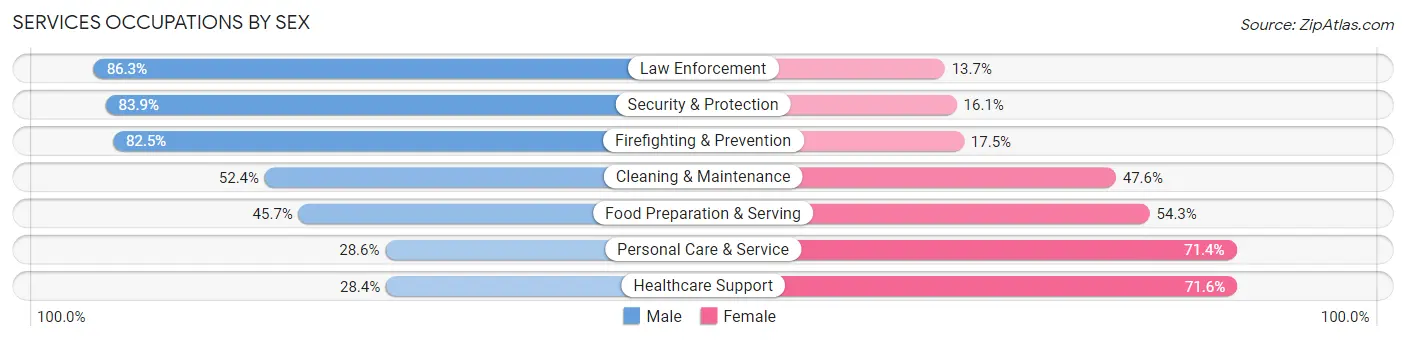
Services Occupations by Sex
Within the Services occupations in Hudson, the most male-oriented occupations are Law Enforcement (86.3%), Security & Protection (83.9%), and Firefighting & Prevention (82.5%), while the most female-oriented occupations are Healthcare Support (71.6%), Personal Care & Service (71.4%), and Food Preparation & Serving (54.3%).
| Occupation | Male | Female |
| Healthcare Support | 29 (28.4%) | 73 (71.6%) |
| Security & Protection | 162 (83.9%) | 31 (16.1%) |
| Firefighting & Prevention | 99 (82.5%) | 21 (17.5%) |
| Law Enforcement | 63 (86.3%) | 10 (13.7%) |
| Food Preparation & Serving | 166 (45.7%) | 197 (54.3%) |
| Cleaning & Maintenance | 217 (52.4%) | 197 (47.6%) |
| Personal Care & Service | 32 (28.6%) | 80 (71.4%) |
| Total (Category) | 606 (51.2%) | 578 (48.8%) |
| Total (Overall) | 4,439 (54.2%) | 3,752 (45.8%) |
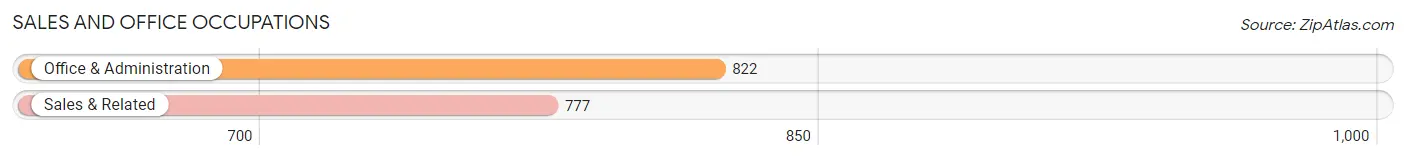
Sales and Office Occupations
The most common Sales and Office occupations in Hudson are Office & Administration (822 | 10.0%), and Sales & Related (777 | 9.5%).
Sales and Office Occupations by Sex
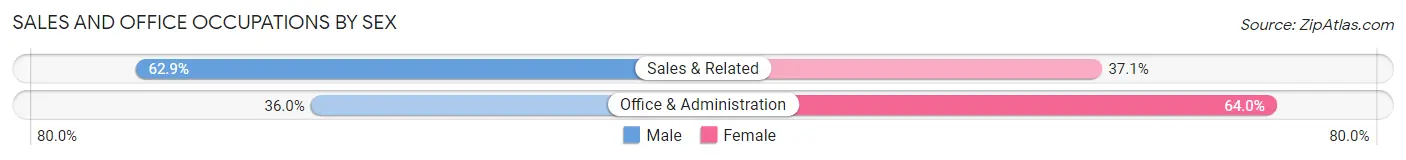
| Occupation | Male | Female |
| Sales & Related | 489 (62.9%) | 288 (37.1%) |
| Office & Administration | 296 (36.0%) | 526 (64.0%) |
| Total (Category) | 785 (49.1%) | 814 (50.9%) |
| Total (Overall) | 4,439 (54.2%) | 3,752 (45.8%) |
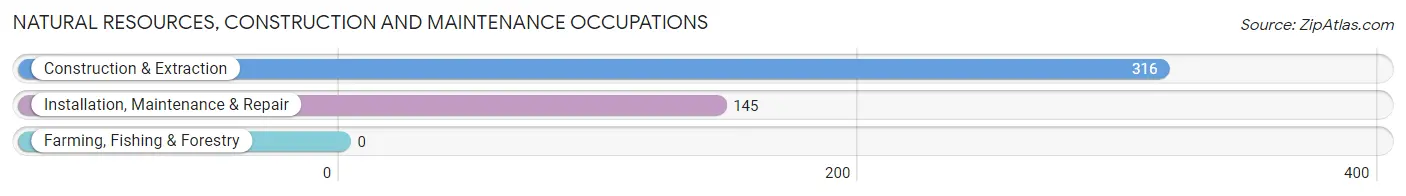
Natural Resources, Construction and Maintenance Occupations
The most common Natural Resources, Construction and Maintenance occupations in Hudson are Construction & Extraction (316 | 3.9%), and Installation, Maintenance & Repair (145 | 1.8%).
Natural Resources, Construction and Maintenance Occupations by Sex
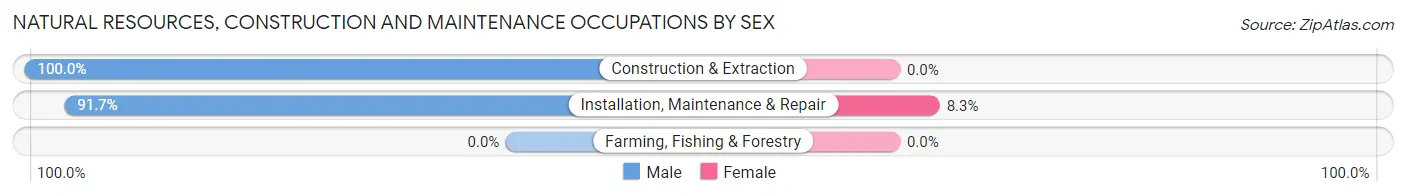
| Occupation | Male | Female |
| Farming, Fishing & Forestry | 0 (0.0%) | 0 (0.0%) |
| Construction & Extraction | 316 (100.0%) | 0 (0.0%) |
| Installation, Maintenance & Repair | 133 (91.7%) | 12 (8.3%) |
| Total (Category) | 449 (97.4%) | 12 (2.6%) |
| Total (Overall) | 4,439 (54.2%) | 3,752 (45.8%) |
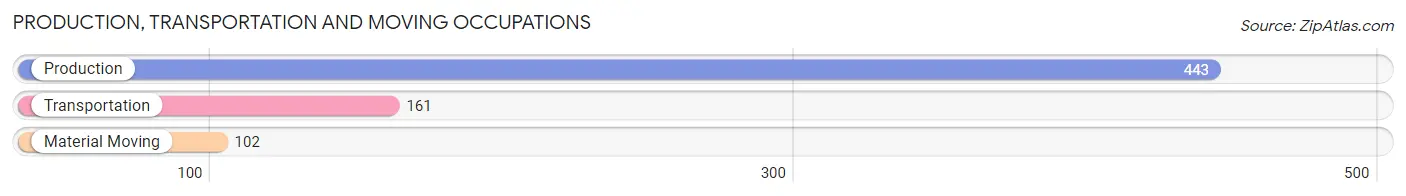
Production, Transportation and Moving Occupations
The most common Production, Transportation and Moving occupations in Hudson are Production (443 | 5.4%), Transportation (161 | 2.0%), and Material Moving (102 | 1.3%).
Production, Transportation and Moving Occupations by Sex
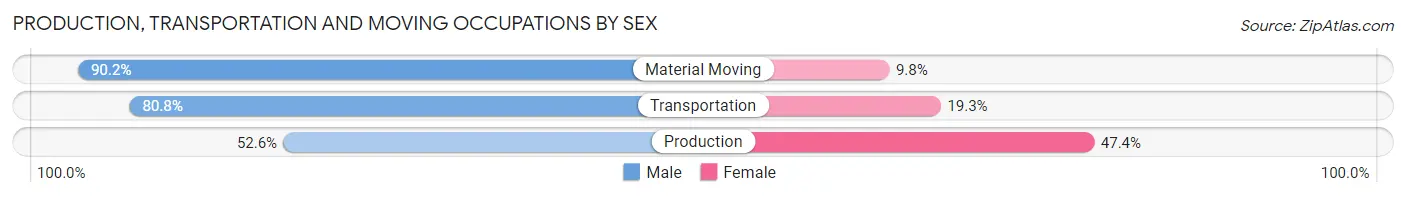
| Occupation | Male | Female |
| Production | 233 (52.6%) | 210 (47.4%) |
| Transportation | 130 (80.7%) | 31 (19.3%) |
| Material Moving | 92 (90.2%) | 10 (9.8%) |
| Total (Category) | 455 (64.4%) | 251 (35.5%) |
| Total (Overall) | 4,439 (54.2%) | 3,752 (45.8%) |
Employment Industries by Sex in Hudson
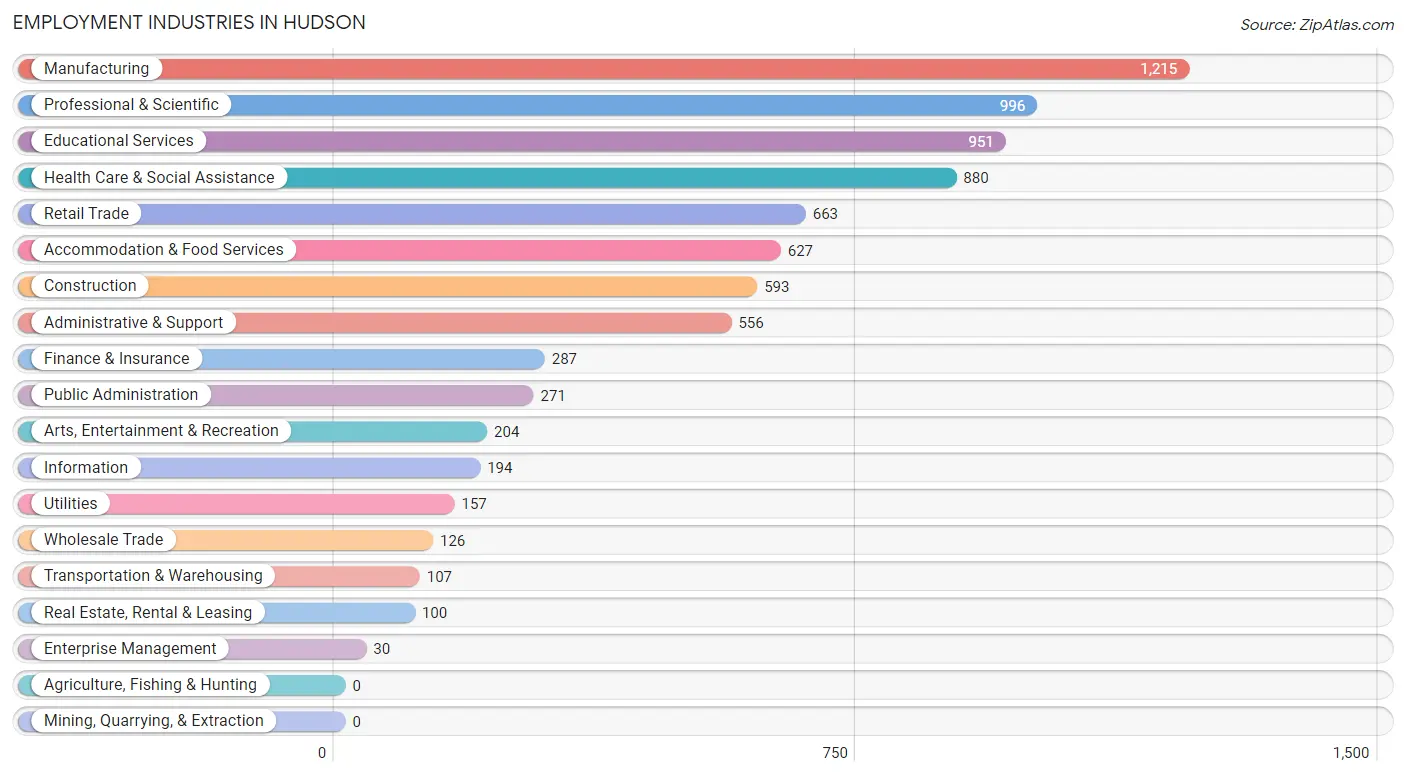
Employment Industries in Hudson
The major employment industries in Hudson include Manufacturing (1,215 | 14.8%), Professional & Scientific (996 | 12.2%), Educational Services (951 | 11.6%), Health Care & Social Assistance (880 | 10.7%), and Retail Trade (663 | 8.1%).
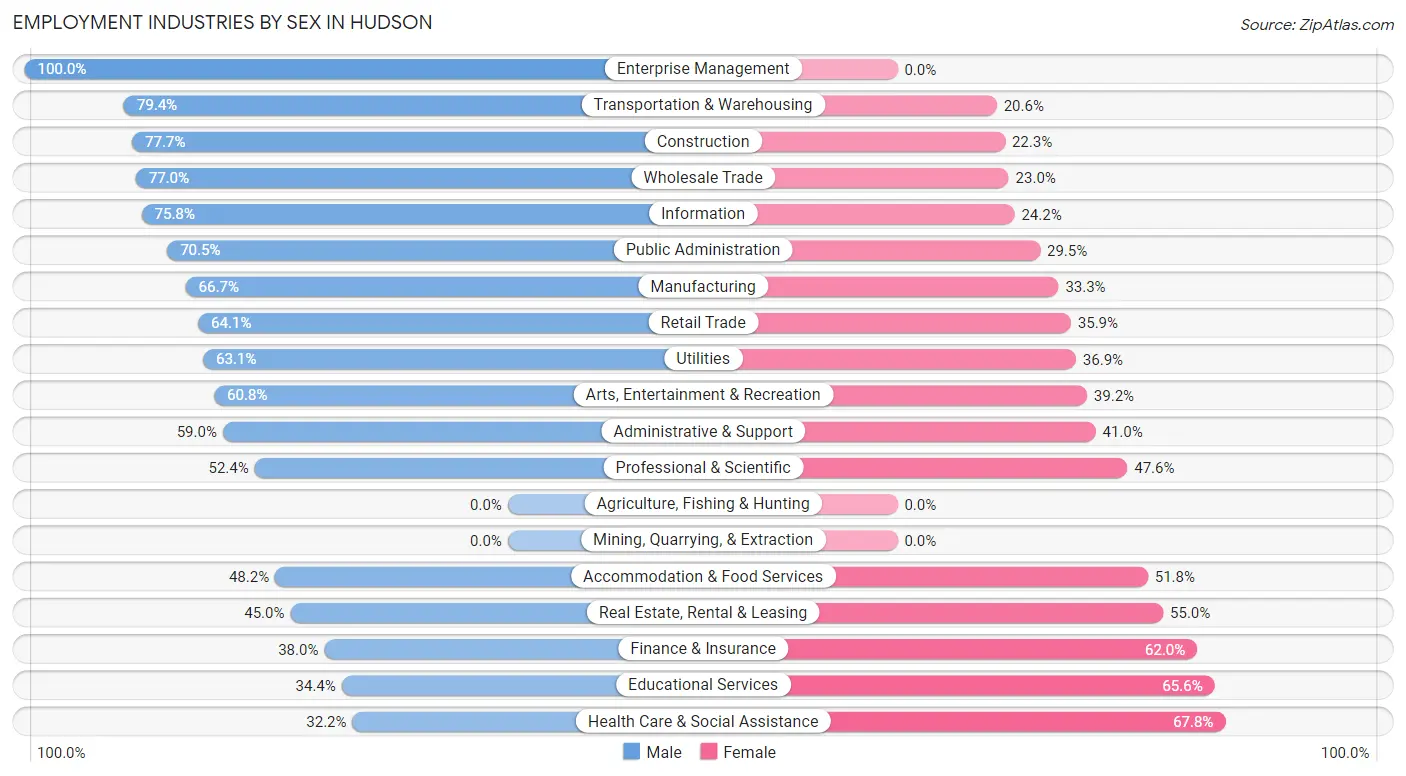
Employment Industries by Sex in Hudson
The Hudson industries that see more men than women are Enterprise Management (100.0%), Transportation & Warehousing (79.4%), and Construction (77.7%), whereas the industries that tend to have a higher number of women are Health Care & Social Assistance (67.8%), Educational Services (65.6%), and Finance & Insurance (62.0%).
| Industry | Male | Female |
| Agriculture, Fishing & Hunting | 0 (0.0%) | 0 (0.0%) |
| Mining, Quarrying, & Extraction | 0 (0.0%) | 0 (0.0%) |
| Construction | 461 (77.7%) | 132 (22.3%) |
| Manufacturing | 810 (66.7%) | 405 (33.3%) |
| Wholesale Trade | 97 (77.0%) | 29 (23.0%) |
| Retail Trade | 425 (64.1%) | 238 (35.9%) |
| Transportation & Warehousing | 85 (79.4%) | 22 (20.6%) |
| Utilities | 99 (63.1%) | 58 (36.9%) |
| Information | 147 (75.8%) | 47 (24.2%) |
| Finance & Insurance | 109 (38.0%) | 178 (62.0%) |
| Real Estate, Rental & Leasing | 45 (45.0%) | 55 (55.0%) |
| Professional & Scientific | 522 (52.4%) | 474 (47.6%) |
| Enterprise Management | 30 (100.0%) | 0 (0.0%) |
| Administrative & Support | 328 (59.0%) | 228 (41.0%) |
| Educational Services | 327 (34.4%) | 624 (65.6%) |
| Health Care & Social Assistance | 283 (32.2%) | 597 (67.8%) |
| Arts, Entertainment & Recreation | 124 (60.8%) | 80 (39.2%) |
| Accommodation & Food Services | 302 (48.2%) | 325 (51.8%) |
| Public Administration | 191 (70.5%) | 80 (29.5%) |
| Total | 4,439 (54.2%) | 3,752 (45.8%) |
Education in Hudson
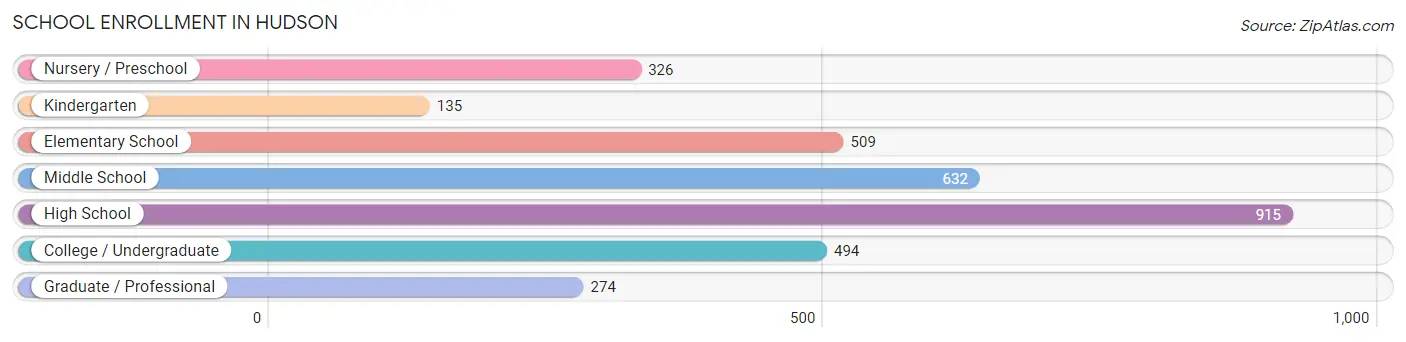
School Enrollment in Hudson
The most common levels of schooling among the 3,285 students in Hudson are high school (915 | 27.9%), middle school (632 | 19.2%), and elementary school (509 | 15.5%).
| School Level | # Students | % Students |
| Nursery / Preschool | 326 | 9.9% |
| Kindergarten | 135 | 4.1% |
| Elementary School | 509 | 15.5% |
| Middle School | 632 | 19.2% |
| High School | 915 | 27.9% |
| College / Undergraduate | 494 | 15.0% |
| Graduate / Professional | 274 | 8.3% |
| Total | 3,285 | 100.0% |
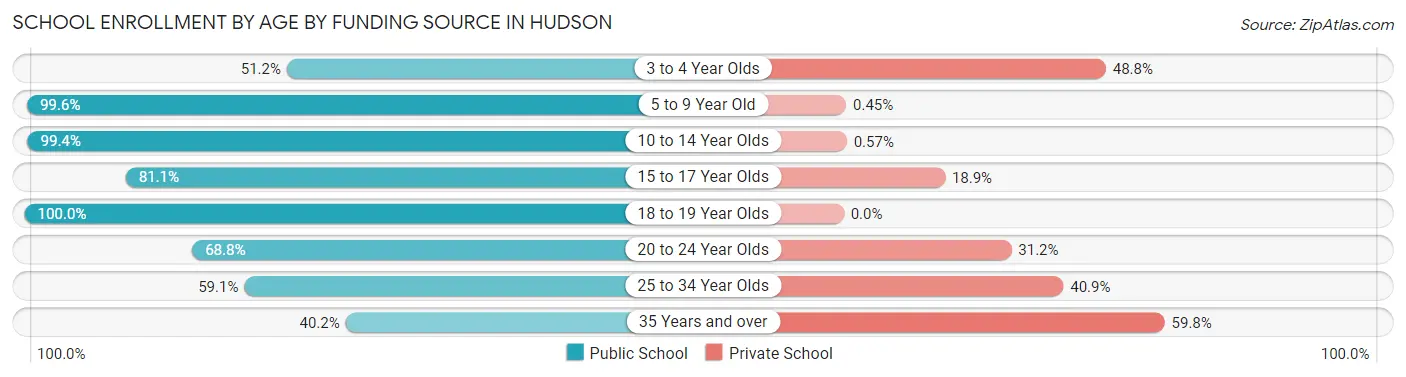
School Enrollment by Age by Funding Source in Hudson
Out of a total of 3,285 students who are enrolled in schools in Hudson, 585 (17.8%) attend a private institution, while the remaining 2,700 (82.2%) are enrolled in public schools. The age group of 35 years and over has the highest likelihood of being enrolled in private schools, with 107 (59.8% in the age bracket) enrolled. Conversely, the age group of 18 to 19 year olds has the lowest likelihood of being enrolled in a private school, with 168 (100.0% in the age bracket) attending a public institution.
| Age Bracket | Public School | Private School |
| 3 to 4 Year Olds | 131 (51.2%) | 125 (48.8%) |
| 5 to 9 Year Old | 666 (99.6%) | 3 (0.4%) |
| 10 to 14 Year Olds | 702 (99.4%) | 4 (0.6%) |
| 15 to 17 Year Olds | 568 (81.1%) | 132 (18.9%) |
| 18 to 19 Year Olds | 168 (100.0%) | 0 (0.0%) |
| 20 to 24 Year Olds | 251 (68.8%) | 114 (31.2%) |
| 25 to 34 Year Olds | 143 (59.1%) | 99 (40.9%) |
| 35 Years and over | 72 (40.2%) | 107 (59.8%) |
| Total | 2,700 (82.2%) | 585 (17.8%) |
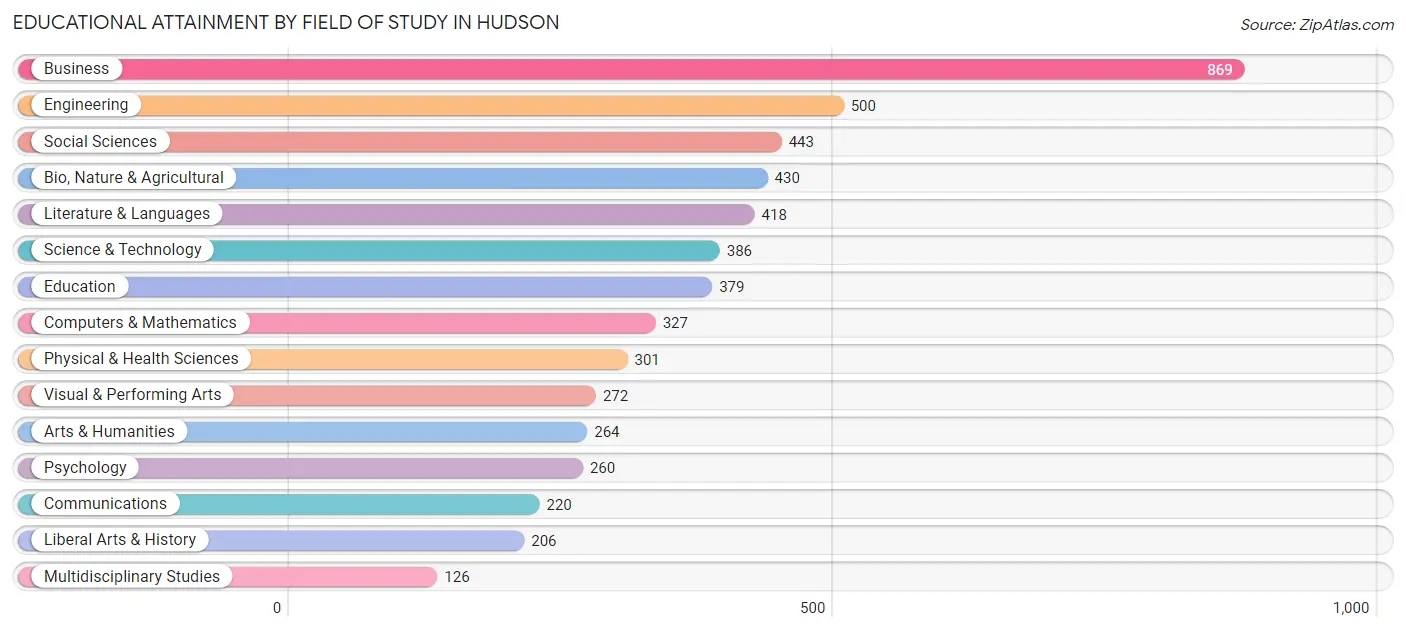
Educational Attainment by Field of Study in Hudson
Business (869 | 16.1%), engineering (500 | 9.3%), social sciences (443 | 8.2%), bio, nature & agricultural (430 | 8.0%), and literature & languages (418 | 7.7%) are the most common fields of study among 5,401 individuals in Hudson who have obtained a bachelor's degree or higher.
| Field of Study | # Graduates | % Graduates |
| Computers & Mathematics | 327 | 6.0% |
| Bio, Nature & Agricultural | 430 | 8.0% |
| Physical & Health Sciences | 301 | 5.6% |
| Psychology | 260 | 4.8% |
| Social Sciences | 443 | 8.2% |
| Engineering | 500 | 9.3% |
| Multidisciplinary Studies | 126 | 2.3% |
| Science & Technology | 386 | 7.1% |
| Business | 869 | 16.1% |
| Education | 379 | 7.0% |
| Literature & Languages | 418 | 7.7% |
| Liberal Arts & History | 206 | 3.8% |
| Visual & Performing Arts | 272 | 5.0% |
| Communications | 220 | 4.1% |
| Arts & Humanities | 264 | 4.9% |
| Total | 5,401 | 100.0% |
Transportation & Commute in Hudson
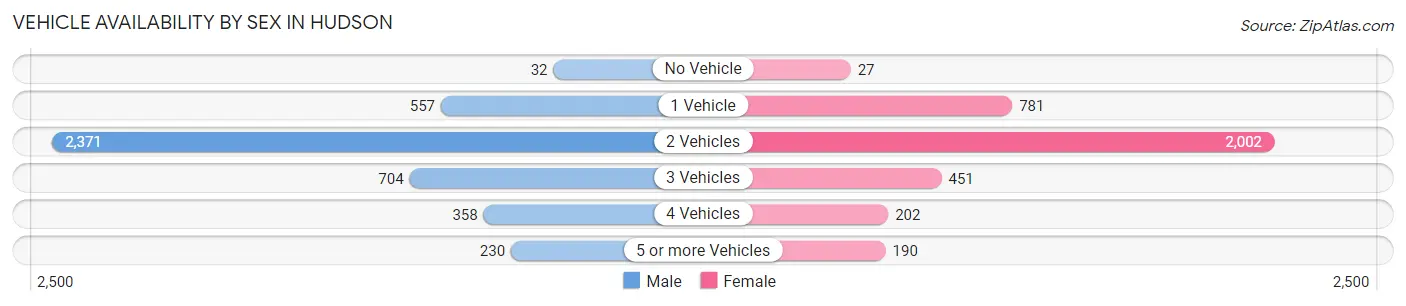
Vehicle Availability by Sex in Hudson
The most prevalent vehicle ownership categories in Hudson are males with 2 vehicles (2,371, accounting for 55.8%) and females with 2 vehicles (2,002, making up 64.9%).
| Vehicles Available | Male | Female |
| No Vehicle | 32 (0.7%) | 27 (0.7%) |
| 1 Vehicle | 557 (13.1%) | 781 (21.4%) |
| 2 Vehicles | 2,371 (55.8%) | 2,002 (54.8%) |
| 3 Vehicles | 704 (16.6%) | 451 (12.3%) |
| 4 Vehicles | 358 (8.4%) | 202 (5.5%) |
| 5 or more Vehicles | 230 (5.4%) | 190 (5.2%) |
| Total | 4,252 (100.0%) | 3,653 (100.0%) |
Commute Time in Hudson
The most frequently occuring commute durations in Hudson are 30 to 34 minutes (847 commuters, 12.8%), 45 to 59 minutes (843 commuters, 12.7%), and 15 to 19 minutes (822 commuters, 12.4%).
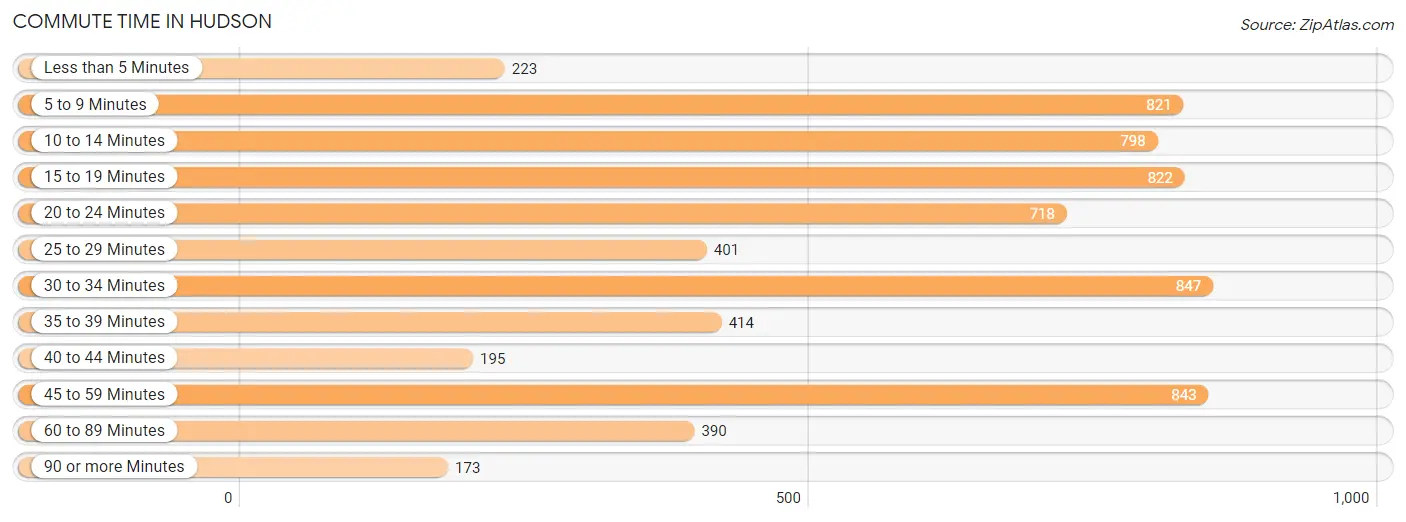
| Commute Time | # Commuters | % Commuters |
| Less than 5 Minutes | 223 | 3.4% |
| 5 to 9 Minutes | 821 | 12.4% |
| 10 to 14 Minutes | 798 | 12.0% |
| 15 to 19 Minutes | 822 | 12.4% |
| 20 to 24 Minutes | 718 | 10.8% |
| 25 to 29 Minutes | 401 | 6.0% |
| 30 to 34 Minutes | 847 | 12.8% |
| 35 to 39 Minutes | 414 | 6.2% |
| 40 to 44 Minutes | 195 | 2.9% |
| 45 to 59 Minutes | 843 | 12.7% |
| 60 to 89 Minutes | 390 | 5.9% |
| 90 or more Minutes | 173 | 2.6% |
Commute Time by Sex in Hudson
The most common commute times in Hudson are 45 to 59 minutes (617 commuters, 16.7%) for males and 5 to 9 minutes (575 commuters, 19.5%) for females.
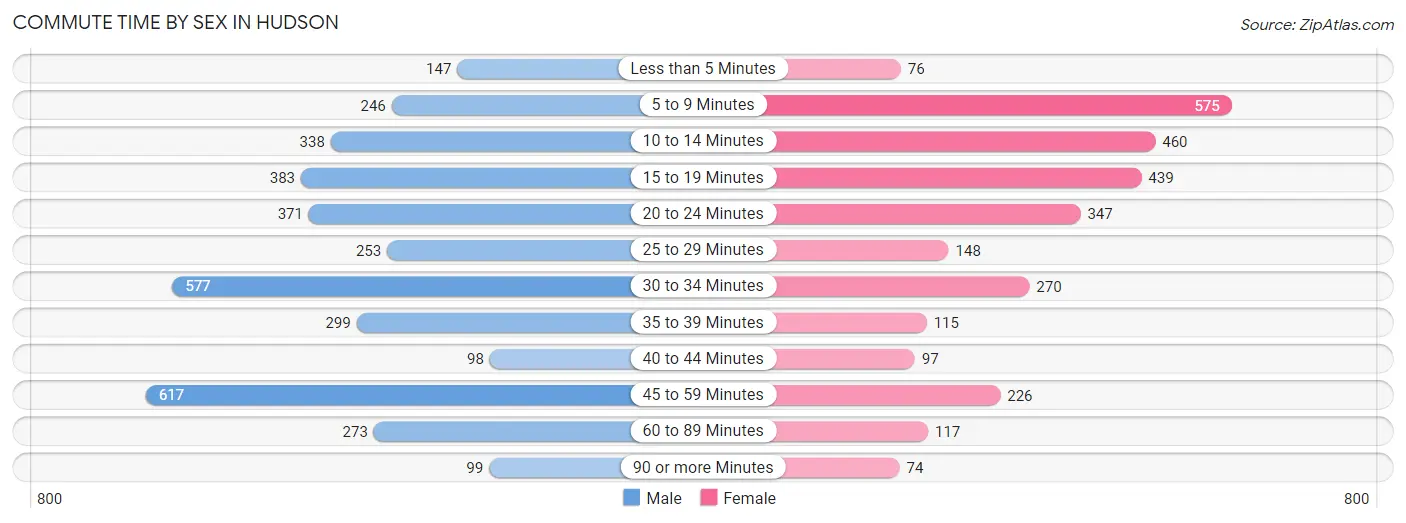
| Commute Time | Male | Female |
| Less than 5 Minutes | 147 (4.0%) | 76 (2.6%) |
| 5 to 9 Minutes | 246 (6.7%) | 575 (19.5%) |
| 10 to 14 Minutes | 338 (9.1%) | 460 (15.6%) |
| 15 to 19 Minutes | 383 (10.3%) | 439 (14.9%) |
| 20 to 24 Minutes | 371 (10.0%) | 347 (11.8%) |
| 25 to 29 Minutes | 253 (6.8%) | 148 (5.0%) |
| 30 to 34 Minutes | 577 (15.6%) | 270 (9.2%) |
| 35 to 39 Minutes | 299 (8.1%) | 115 (3.9%) |
| 40 to 44 Minutes | 98 (2.6%) | 97 (3.3%) |
| 45 to 59 Minutes | 617 (16.7%) | 226 (7.7%) |
| 60 to 89 Minutes | 273 (7.4%) | 117 (4.0%) |
| 90 or more Minutes | 99 (2.7%) | 74 (2.5%) |
Time of Departure to Work by Sex in Hudson
The most frequent times of departure to work in Hudson are 7:00 AM to 7:29 AM (586, 15.8%) for males and 7:30 AM to 7:59 AM (539, 18.3%) for females.
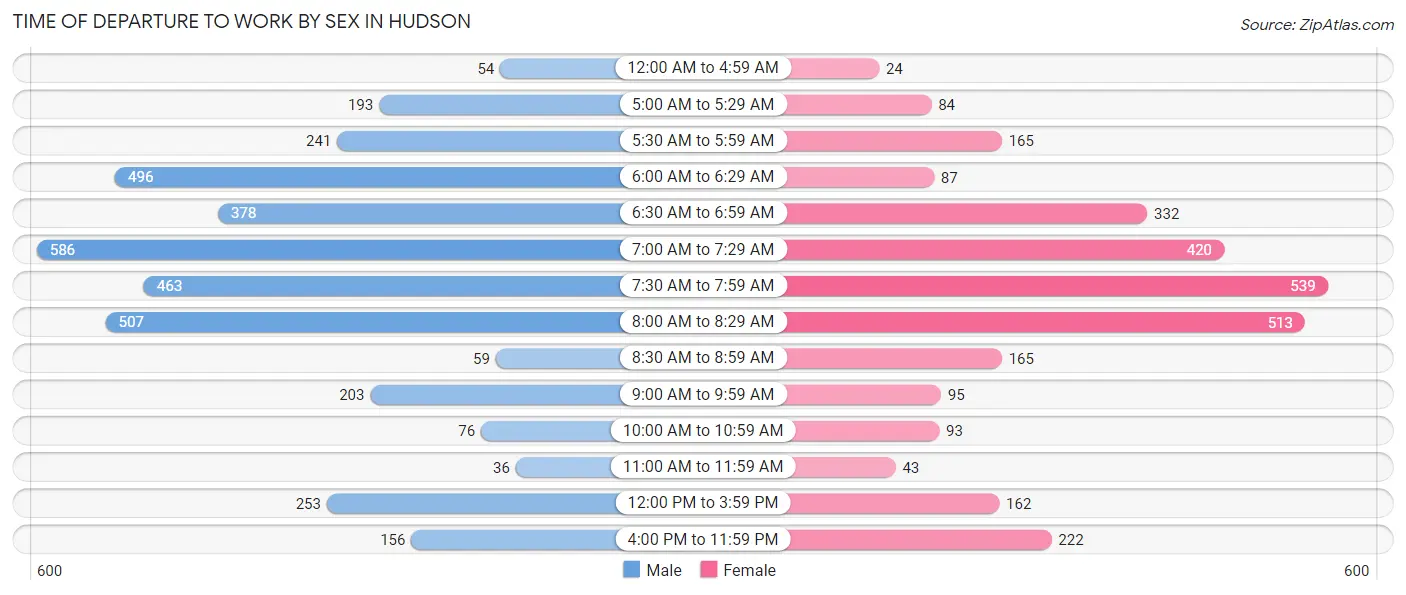
| Time of Departure | Male | Female |
| 12:00 AM to 4:59 AM | 54 (1.5%) | 24 (0.8%) |
| 5:00 AM to 5:29 AM | 193 (5.2%) | 84 (2.9%) |
| 5:30 AM to 5:59 AM | 241 (6.5%) | 165 (5.6%) |
| 6:00 AM to 6:29 AM | 496 (13.4%) | 87 (3.0%) |
| 6:30 AM to 6:59 AM | 378 (10.2%) | 332 (11.3%) |
| 7:00 AM to 7:29 AM | 586 (15.8%) | 420 (14.3%) |
| 7:30 AM to 7:59 AM | 463 (12.5%) | 539 (18.3%) |
| 8:00 AM to 8:29 AM | 507 (13.7%) | 513 (17.4%) |
| 8:30 AM to 8:59 AM | 59 (1.6%) | 165 (5.6%) |
| 9:00 AM to 9:59 AM | 203 (5.5%) | 95 (3.2%) |
| 10:00 AM to 10:59 AM | 76 (2.1%) | 93 (3.2%) |
| 11:00 AM to 11:59 AM | 36 (1.0%) | 43 (1.5%) |
| 12:00 PM to 3:59 PM | 253 (6.8%) | 162 (5.5%) |
| 4:00 PM to 11:59 PM | 156 (4.2%) | 222 (7.5%) |
| Total | 3,701 (100.0%) | 2,944 (100.0%) |
Housing Occupancy in Hudson
Occupancy by Ownership in Hudson
Of the total 6,534 dwellings in Hudson, owner-occupied units account for 4,416 (67.6%), while renter-occupied units make up 2,118 (32.4%).
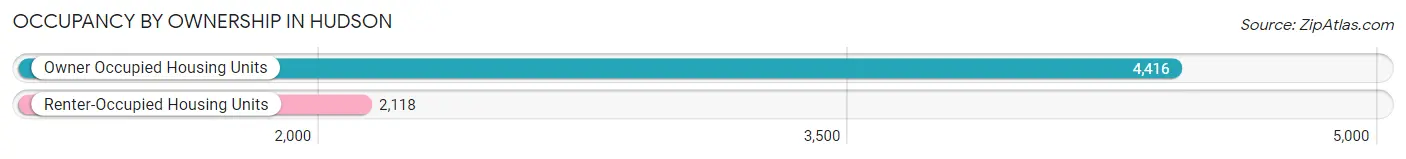
| Occupancy | # Housing Units | % Housing Units |
| Owner Occupied Housing Units | 4,416 | 67.6% |
| Renter-Occupied Housing Units | 2,118 | 32.4% |
| Total Occupied Housing Units | 6,534 | 100.0% |
Occupancy by Household Size in Hudson
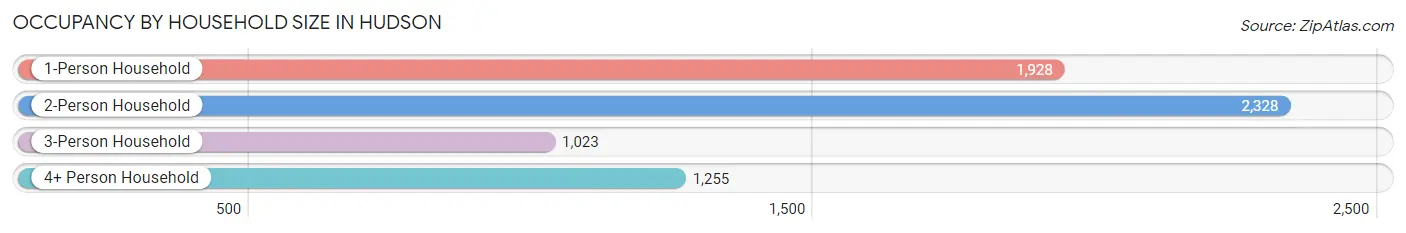
| Household Size | # Housing Units | % Housing Units |
| 1-Person Household | 1,928 | 29.5% |
| 2-Person Household | 2,328 | 35.6% |
| 3-Person Household | 1,023 | 15.7% |
| 4+ Person Household | 1,255 | 19.2% |
| Total Housing Units | 6,534 | 100.0% |
Occupancy by Ownership by Household Size in Hudson
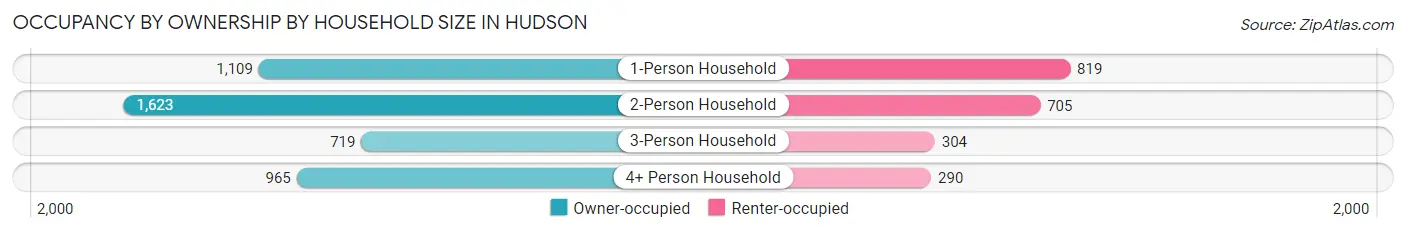
| Household Size | Owner-occupied | Renter-occupied |
| 1-Person Household | 1,109 (57.5%) | 819 (42.5%) |
| 2-Person Household | 1,623 (69.7%) | 705 (30.3%) |
| 3-Person Household | 719 (70.3%) | 304 (29.7%) |
| 4+ Person Household | 965 (76.9%) | 290 (23.1%) |
| Total Housing Units | 4,416 (67.6%) | 2,118 (32.4%) |
Occupancy by Educational Attainment in Hudson
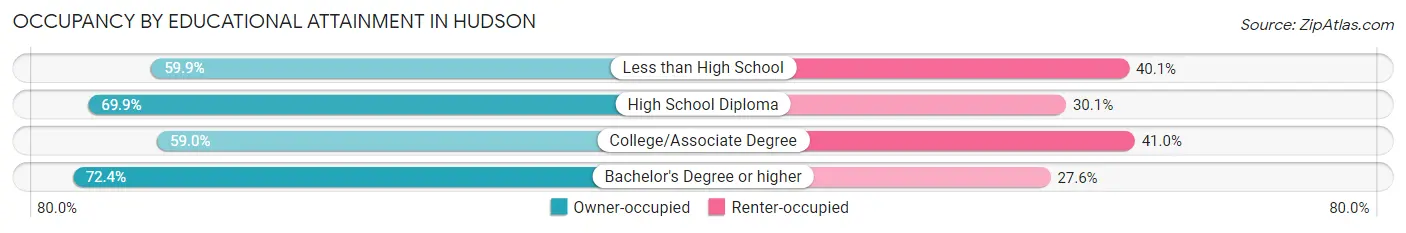
| Household Size | Owner-occupied | Renter-occupied |
| Less than High School | 387 (59.9%) | 259 (40.1%) |
| High School Diploma | 912 (69.9%) | 393 (30.1%) |
| College/Associate Degree | 879 (59.0%) | 611 (41.0%) |
| Bachelor's Degree or higher | 2,238 (72.4%) | 855 (27.6%) |
Occupancy by Age of Householder in Hudson
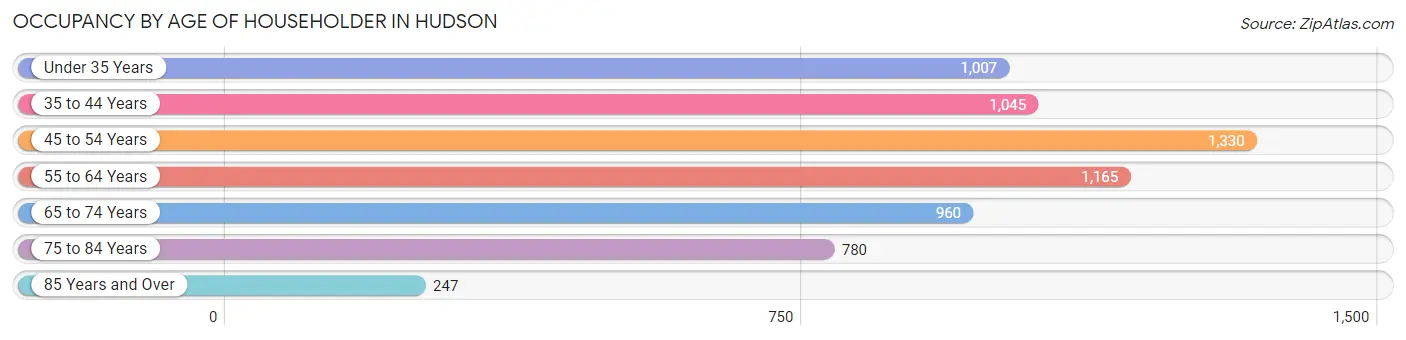
| Age Bracket | # Households | % Households |
| Under 35 Years | 1,007 | 15.4% |
| 35 to 44 Years | 1,045 | 16.0% |
| 45 to 54 Years | 1,330 | 20.4% |
| 55 to 64 Years | 1,165 | 17.8% |
| 65 to 74 Years | 960 | 14.7% |
| 75 to 84 Years | 780 | 11.9% |
| 85 Years and Over | 247 | 3.8% |
| Total | 6,534 | 100.0% |
Housing Finances in Hudson
Median Income by Occupancy in Hudson
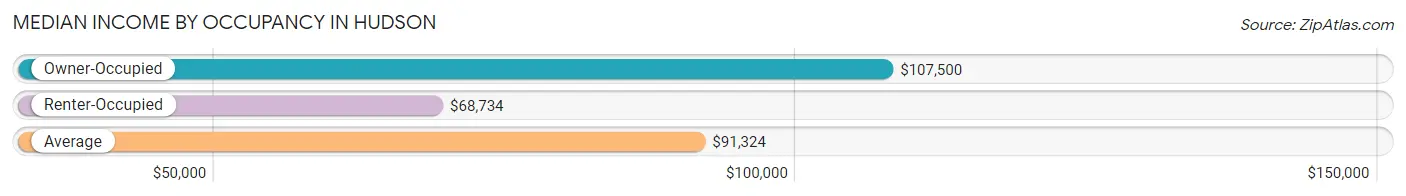
| Occupancy Type | # Households | Median Income |
| Owner-Occupied | 4,416 (67.6%) | $107,500 |
| Renter-Occupied | 2,118 (32.4%) | $68,734 |
| Average | 6,534 (100.0%) | $91,324 |
Occupancy by Householder Income Bracket in Hudson
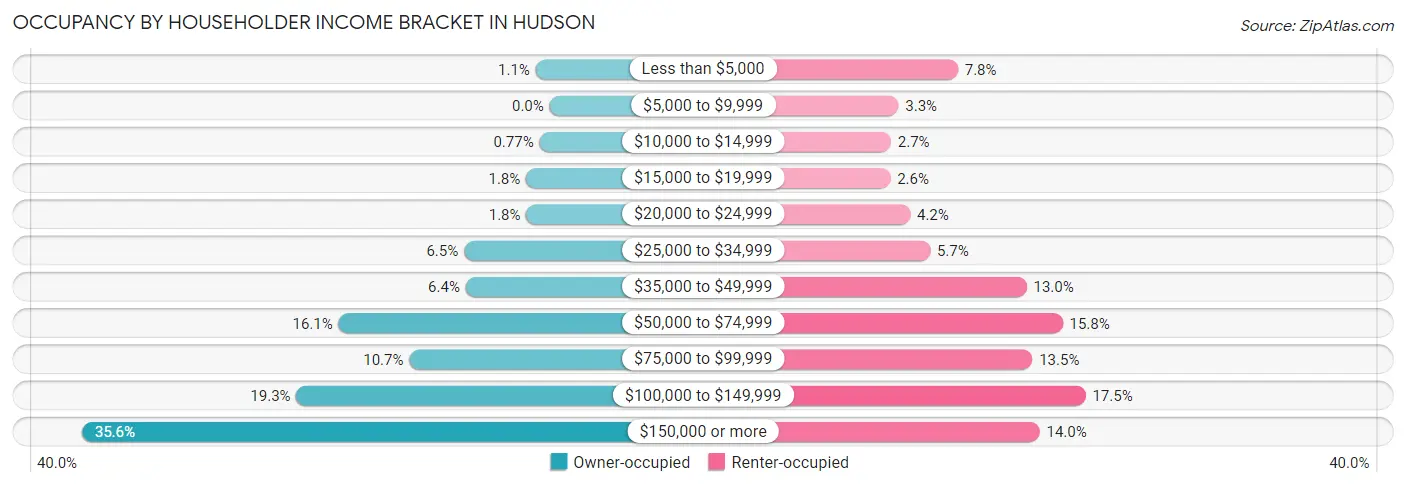
| Income Bracket | Owner-occupied | Renter-occupied |
| Less than $5,000 | 47 (1.1%) | 165 (7.8%) |
| $5,000 to $9,999 | 0 (0.0%) | 69 (3.3%) |
| $10,000 to $14,999 | 34 (0.8%) | 57 (2.7%) |
| $15,000 to $19,999 | 79 (1.8%) | 56 (2.6%) |
| $20,000 to $24,999 | 78 (1.8%) | 88 (4.2%) |
| $25,000 to $34,999 | 288 (6.5%) | 120 (5.7%) |
| $35,000 to $49,999 | 282 (6.4%) | 276 (13.0%) |
| $50,000 to $74,999 | 710 (16.1%) | 334 (15.8%) |
| $75,000 to $99,999 | 472 (10.7%) | 285 (13.5%) |
| $100,000 to $149,999 | 852 (19.3%) | 371 (17.5%) |
| $150,000 or more | 1,574 (35.6%) | 297 (14.0%) |
| Total | 4,416 (100.0%) | 2,118 (100.0%) |
Monthly Housing Cost Tiers in Hudson
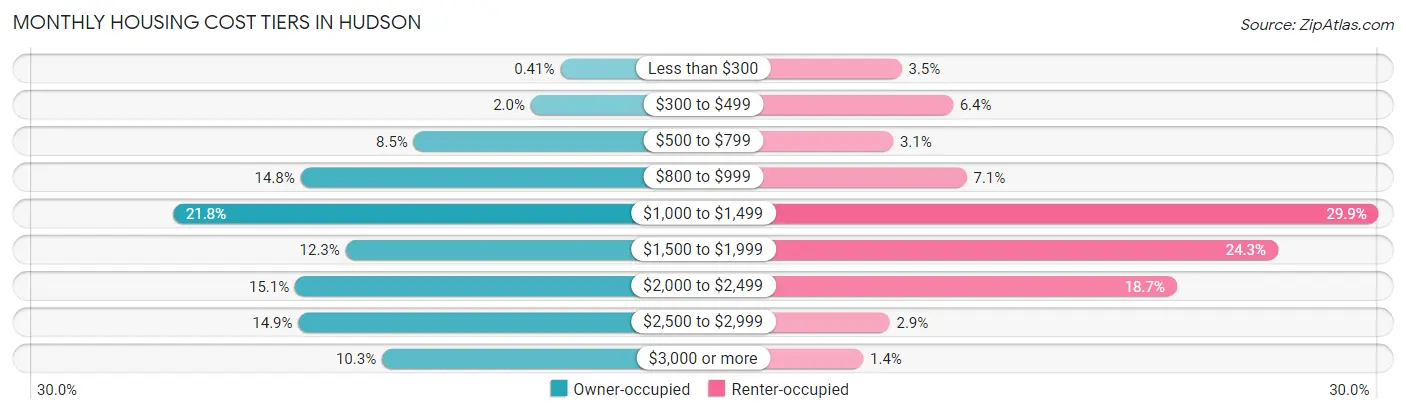
| Monthly Cost | Owner-occupied | Renter-occupied |
| Less than $300 | 18 (0.4%) | 75 (3.5%) |
| $300 to $499 | 90 (2.0%) | 135 (6.4%) |
| $500 to $799 | 376 (8.5%) | 65 (3.1%) |
| $800 to $999 | 652 (14.8%) | 151 (7.1%) |
| $1,000 to $1,499 | 963 (21.8%) | 633 (29.9%) |
| $1,500 to $1,999 | 542 (12.3%) | 515 (24.3%) |
| $2,000 to $2,499 | 665 (15.1%) | 397 (18.7%) |
| $2,500 to $2,999 | 657 (14.9%) | 61 (2.9%) |
| $3,000 or more | 453 (10.3%) | 30 (1.4%) |
| Total | 4,416 (100.0%) | 2,118 (100.0%) |
Physical Housing Characteristics in Hudson
Housing Structures in Hudson
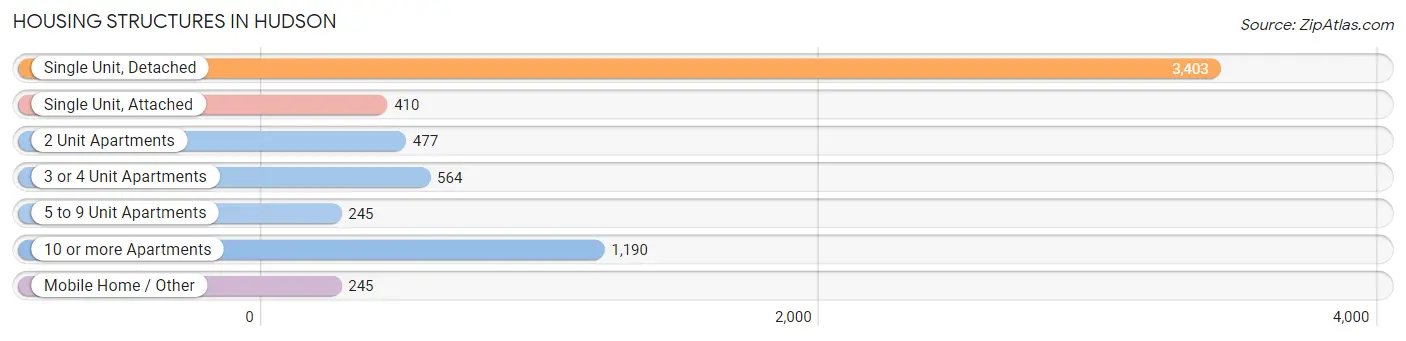
| Structure Type | # Housing Units | % Housing Units |
| Single Unit, Detached | 3,403 | 52.1% |
| Single Unit, Attached | 410 | 6.3% |
| 2 Unit Apartments | 477 | 7.3% |
| 3 or 4 Unit Apartments | 564 | 8.6% |
| 5 to 9 Unit Apartments | 245 | 3.7% |
| 10 or more Apartments | 1,190 | 18.2% |
| Mobile Home / Other | 245 | 3.7% |
| Total | 6,534 | 100.0% |
Housing Structures by Occupancy in Hudson
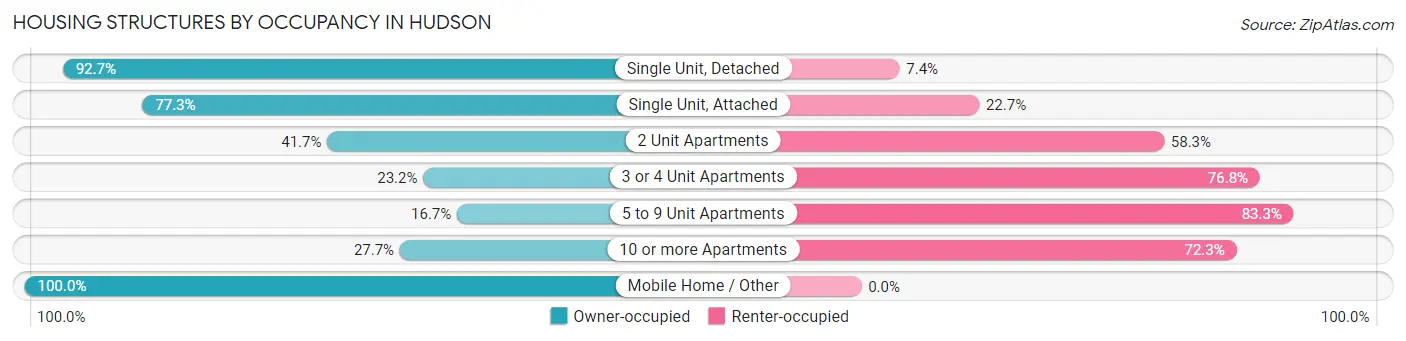
| Structure Type | Owner-occupied | Renter-occupied |
| Single Unit, Detached | 3,153 (92.6%) | 250 (7.3%) |
| Single Unit, Attached | 317 (77.3%) | 93 (22.7%) |
| 2 Unit Apartments | 199 (41.7%) | 278 (58.3%) |
| 3 or 4 Unit Apartments | 131 (23.2%) | 433 (76.8%) |
| 5 to 9 Unit Apartments | 41 (16.7%) | 204 (83.3%) |
| 10 or more Apartments | 330 (27.7%) | 860 (72.3%) |
| Mobile Home / Other | 245 (100.0%) | 0 (0.0%) |
| Total | 4,416 (67.6%) | 2,118 (32.4%) |
Housing Structures by Number of Rooms in Hudson
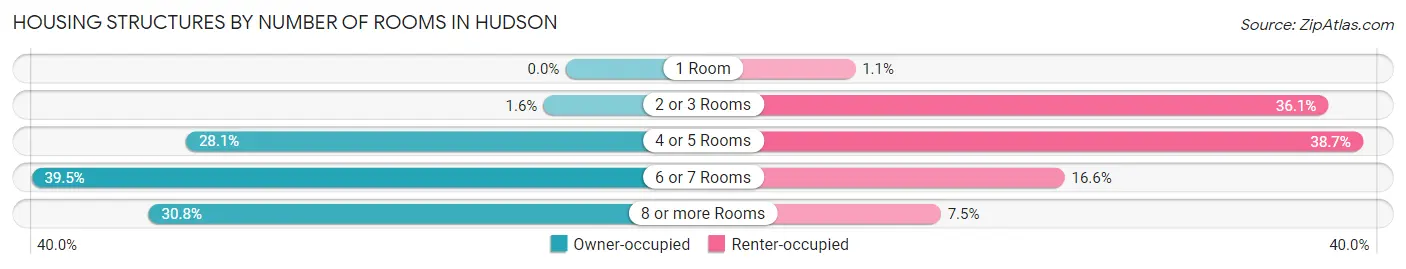
| Number of Rooms | Owner-occupied | Renter-occupied |
| 1 Room | 0 (0.0%) | 24 (1.1%) |
| 2 or 3 Rooms | 72 (1.6%) | 765 (36.1%) |
| 4 or 5 Rooms | 1,239 (28.1%) | 819 (38.7%) |
| 6 or 7 Rooms | 1,744 (39.5%) | 352 (16.6%) |
| 8 or more Rooms | 1,361 (30.8%) | 158 (7.5%) |
| Total | 4,416 (100.0%) | 2,118 (100.0%) |
Housing Structure by Heating Type in Hudson
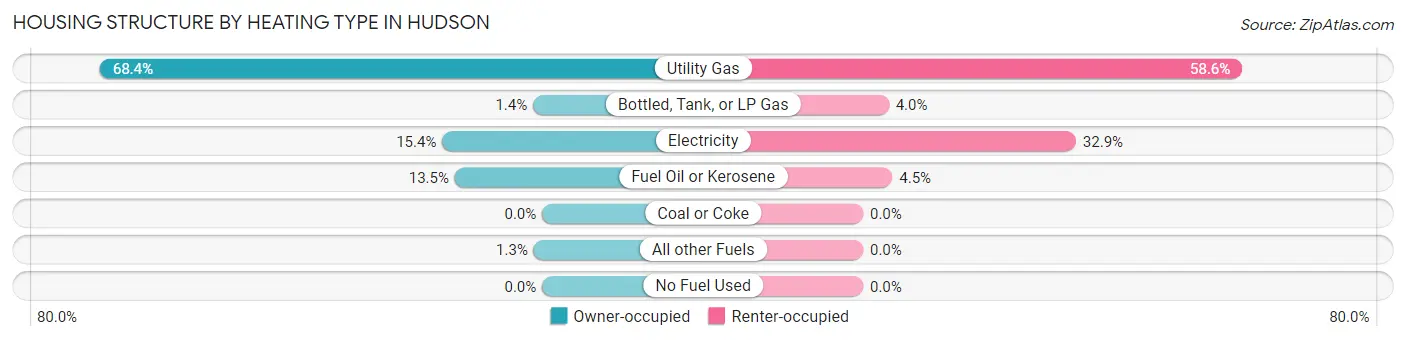
| Heating Type | Owner-occupied | Renter-occupied |
| Utility Gas | 3,019 (68.4%) | 1,241 (58.6%) |
| Bottled, Tank, or LP Gas | 62 (1.4%) | 84 (4.0%) |
| Electricity | 682 (15.4%) | 697 (32.9%) |
| Fuel Oil or Kerosene | 596 (13.5%) | 96 (4.5%) |
| Coal or Coke | 0 (0.0%) | 0 (0.0%) |
| All other Fuels | 57 (1.3%) | 0 (0.0%) |
| No Fuel Used | 0 (0.0%) | 0 (0.0%) |
| Total | 4,416 (100.0%) | 2,118 (100.0%) |
Household Vehicle Usage in Hudson
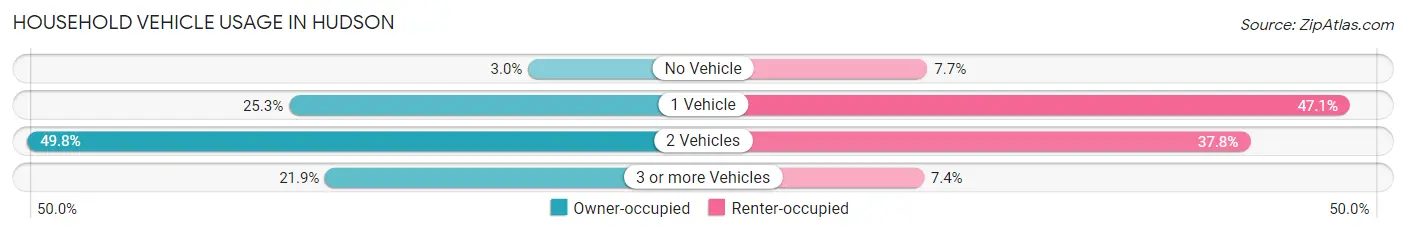
| Vehicles per Household | Owner-occupied | Renter-occupied |
| No Vehicle | 132 (3.0%) | 163 (7.7%) |
| 1 Vehicle | 1,118 (25.3%) | 998 (47.1%) |
| 2 Vehicles | 2,197 (49.7%) | 801 (37.8%) |
| 3 or more Vehicles | 969 (21.9%) | 156 (7.4%) |
| Total | 4,416 (100.0%) | 2,118 (100.0%) |
Real Estate & Mortgages in Hudson
Real Estate and Mortgage Overview in Hudson
| Characteristic | Without Mortgage | With Mortgage |
| Housing Units | 1,843 | 2,573 |
| Median Property Value | $417,300 | $457,800 |
| Median Household Income | $75,026 | $1,163 |
| Monthly Housing Costs | $940 | $453 |
| Real Estate Taxes | $6,299 | $106 |
Property Value by Mortgage Status in Hudson
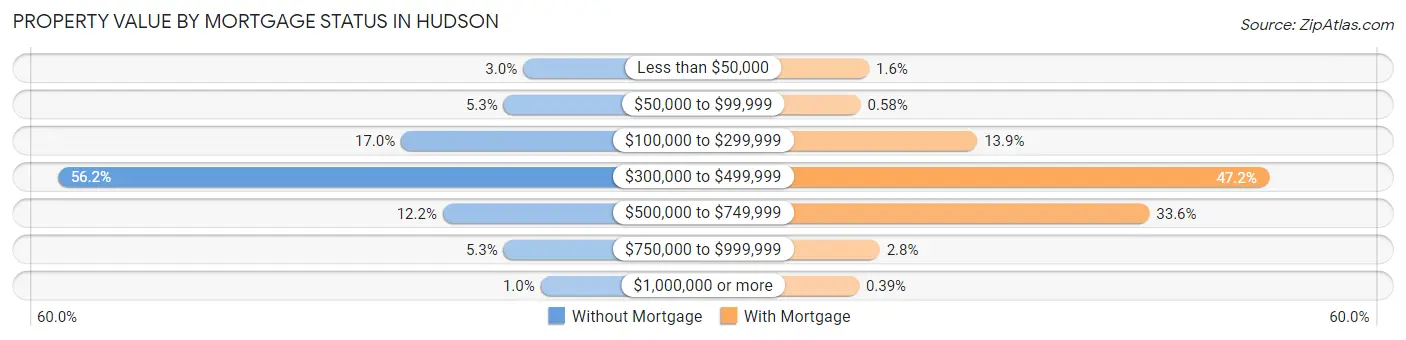
| Property Value | Without Mortgage | With Mortgage |
| Less than $50,000 | 56 (3.0%) | 40 (1.5%) |
| $50,000 to $99,999 | 97 (5.3%) | 15 (0.6%) |
| $100,000 to $299,999 | 313 (17.0%) | 358 (13.9%) |
| $300,000 to $499,999 | 1,036 (56.2%) | 1,215 (47.2%) |
| $500,000 to $749,999 | 225 (12.2%) | 864 (33.6%) |
| $750,000 to $999,999 | 97 (5.3%) | 71 (2.8%) |
| $1,000,000 or more | 19 (1.0%) | 10 (0.4%) |
| Total | 1,843 (100.0%) | 2,573 (100.0%) |
Household Income by Mortgage Status in Hudson
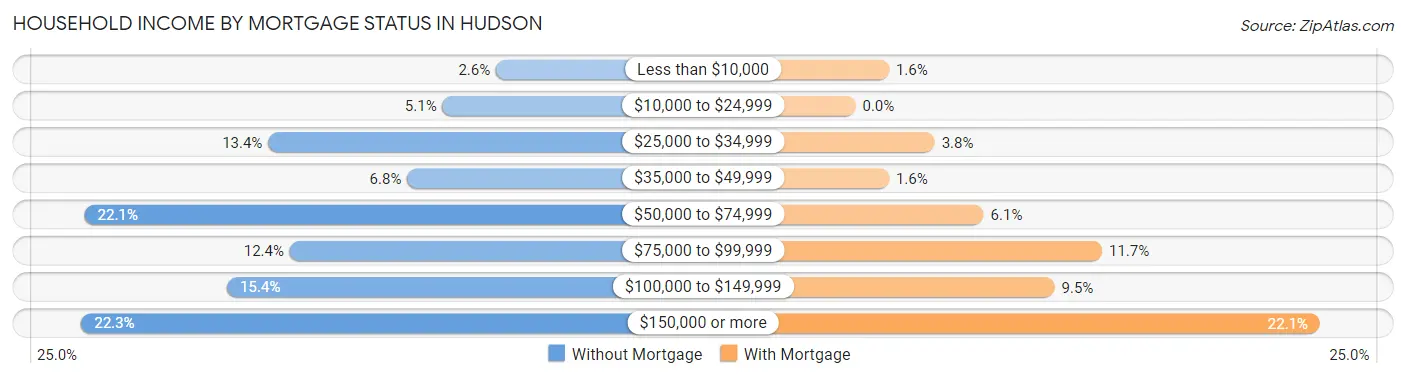
| Household Income | Without Mortgage | With Mortgage |
| Less than $10,000 | 47 (2.5%) | 41 (1.6%) |
| $10,000 to $24,999 | 94 (5.1%) | 0 (0.0%) |
| $25,000 to $34,999 | 247 (13.4%) | 97 (3.8%) |
| $35,000 to $49,999 | 125 (6.8%) | 41 (1.6%) |
| $50,000 to $74,999 | 408 (22.1%) | 157 (6.1%) |
| $75,000 to $99,999 | 228 (12.4%) | 302 (11.7%) |
| $100,000 to $149,999 | 283 (15.4%) | 244 (9.5%) |
| $150,000 or more | 411 (22.3%) | 569 (22.1%) |
| Total | 1,843 (100.0%) | 2,573 (100.0%) |
Property Value to Household Income Ratio in Hudson
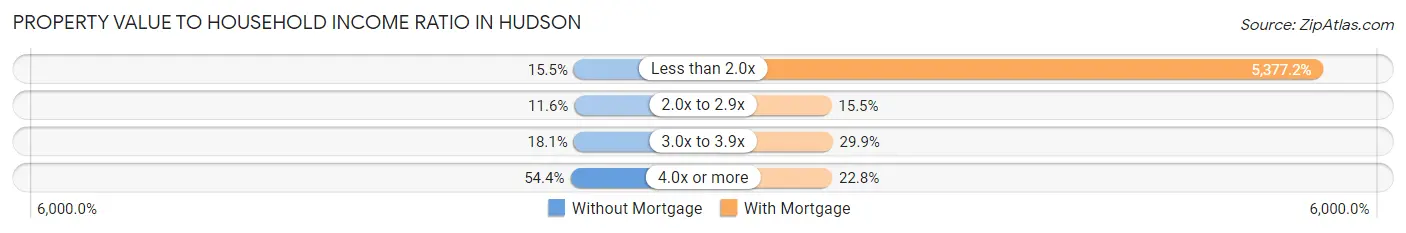
| Value-to-Income Ratio | Without Mortgage | With Mortgage |
| Less than 2.0x | 285 (15.5%) | 138,356 (5,377.2%) |
| 2.0x to 2.9x | 214 (11.6%) | 399 (15.5%) |
| 3.0x to 3.9x | 333 (18.1%) | 770 (29.9%) |
| 4.0x or more | 1,002 (54.4%) | 587 (22.8%) |
| Total | 1,843 (100.0%) | 2,573 (100.0%) |
Real Estate Taxes by Mortgage Status in Hudson
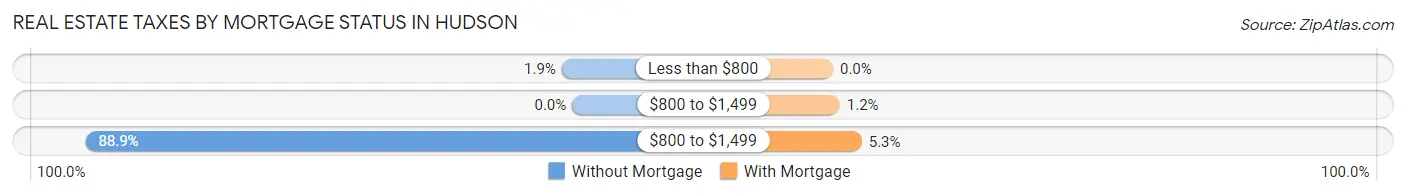
| Property Taxes | Without Mortgage | With Mortgage |
| Less than $800 | 35 (1.9%) | 0 (0.0%) |
| $800 to $1,499 | 0 (0.0%) | 32 (1.2%) |
| $800 to $1,499 | 1,638 (88.9%) | 135 (5.2%) |
| Total | 1,843 (100.0%) | 2,573 (100.0%) |
Health & Disability in Hudson
Health Insurance Coverage by Age in Hudson
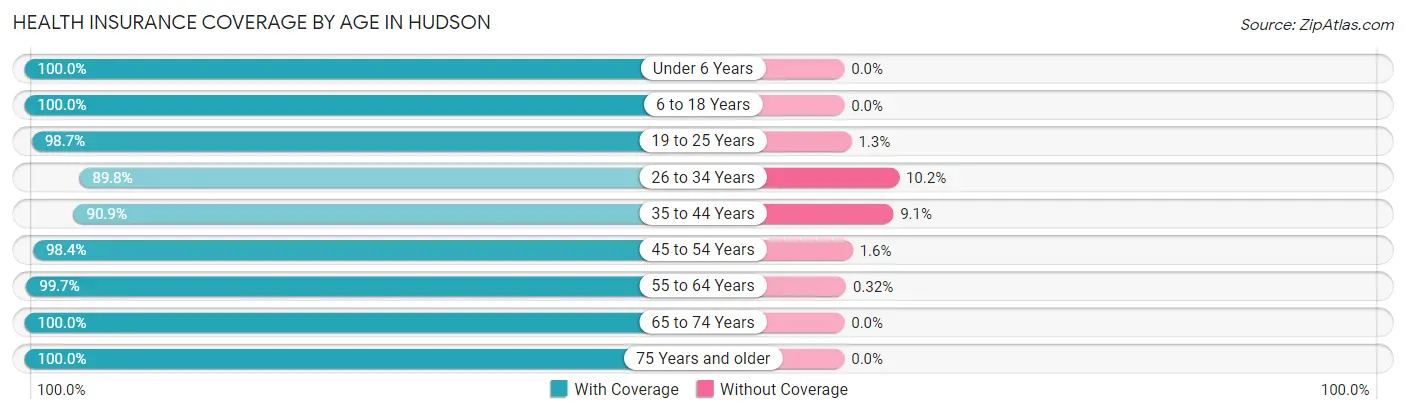
| Age Bracket | With Coverage | Without Coverage |
| Under 6 Years | 998 (100.0%) | 0 (0.0%) |
| 6 to 18 Years | 2,123 (100.0%) | 0 (0.0%) |
| 19 to 25 Years | 960 (98.7%) | 13 (1.3%) |
| 26 to 34 Years | 1,673 (89.8%) | 190 (10.2%) |
| 35 to 44 Years | 1,801 (90.9%) | 181 (9.1%) |
| 45 to 54 Years | 2,316 (98.4%) | 37 (1.6%) |
| 55 to 64 Years | 2,196 (99.7%) | 7 (0.3%) |
| 65 to 74 Years | 1,508 (100.0%) | 0 (0.0%) |
| 75 Years and older | 1,493 (100.0%) | 0 (0.0%) |
| Total | 15,068 (97.2%) | 428 (2.8%) |
Health Insurance Coverage by Citizenship Status in Hudson
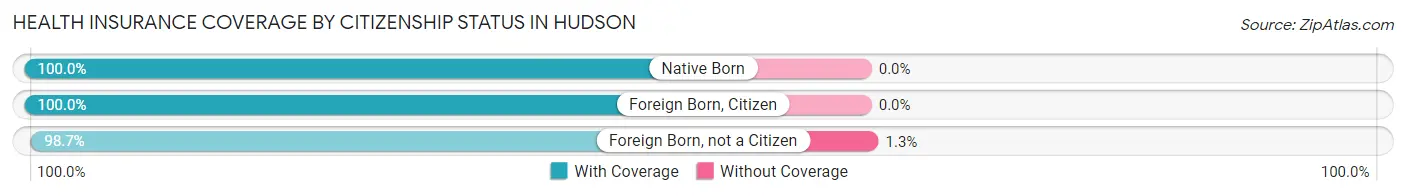
| Citizenship Status | With Coverage | Without Coverage |
| Native Born | 998 (100.0%) | 0 (0.0%) |
| Foreign Born, Citizen | 2,123 (100.0%) | 0 (0.0%) |
| Foreign Born, not a Citizen | 960 (98.7%) | 13 (1.3%) |
Health Insurance Coverage by Household Income in Hudson
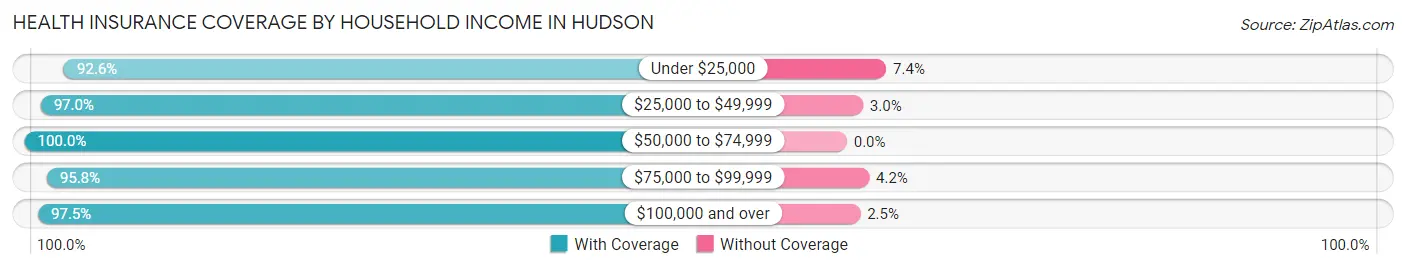
| Household Income | With Coverage | Without Coverage |
| Under $25,000 | 1,005 (92.6%) | 80 (7.4%) |
| $25,000 to $49,999 | 1,576 (97.0%) | 49 (3.0%) |
| $50,000 to $74,999 | 1,949 (100.0%) | 0 (0.0%) |
| $75,000 to $99,999 | 1,627 (95.8%) | 71 (4.2%) |
| $100,000 and over | 8,857 (97.5%) | 228 (2.5%) |
Public vs Private Health Insurance Coverage by Age in Hudson
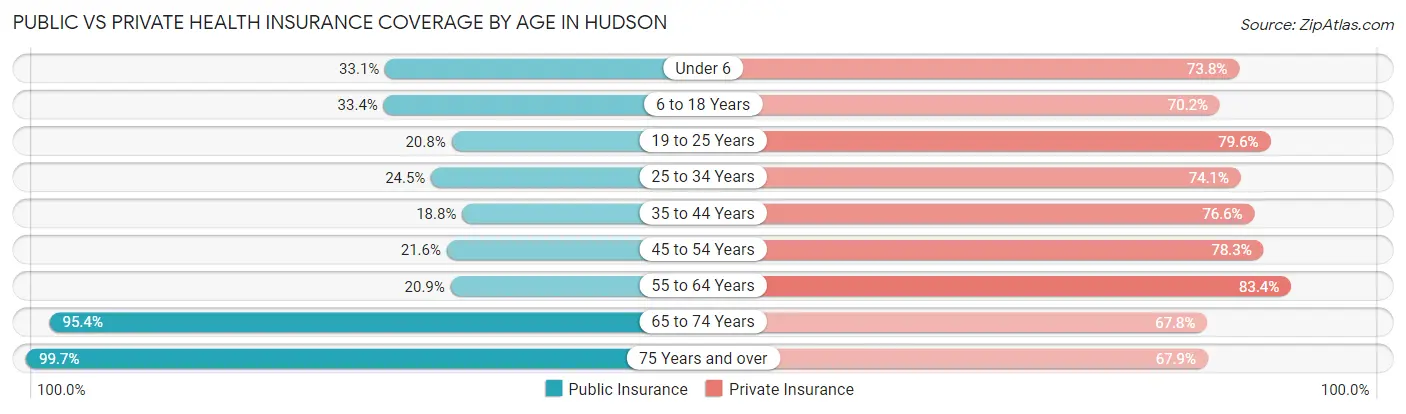
| Age Bracket | Public Insurance | Private Insurance |
| Under 6 | 330 (33.1%) | 736 (73.8%) |
| 6 to 18 Years | 708 (33.4%) | 1,490 (70.2%) |
| 19 to 25 Years | 202 (20.8%) | 774 (79.5%) |
| 25 to 34 Years | 457 (24.5%) | 1,380 (74.1%) |
| 35 to 44 Years | 372 (18.8%) | 1,518 (76.6%) |
| 45 to 54 Years | 509 (21.6%) | 1,842 (78.3%) |
| 55 to 64 Years | 461 (20.9%) | 1,837 (83.4%) |
| 65 to 74 Years | 1,438 (95.4%) | 1,023 (67.8%) |
| 75 Years and over | 1,489 (99.7%) | 1,014 (67.9%) |
| Total | 5,966 (38.5%) | 11,614 (75.0%) |
Disability Status by Sex by Age in Hudson
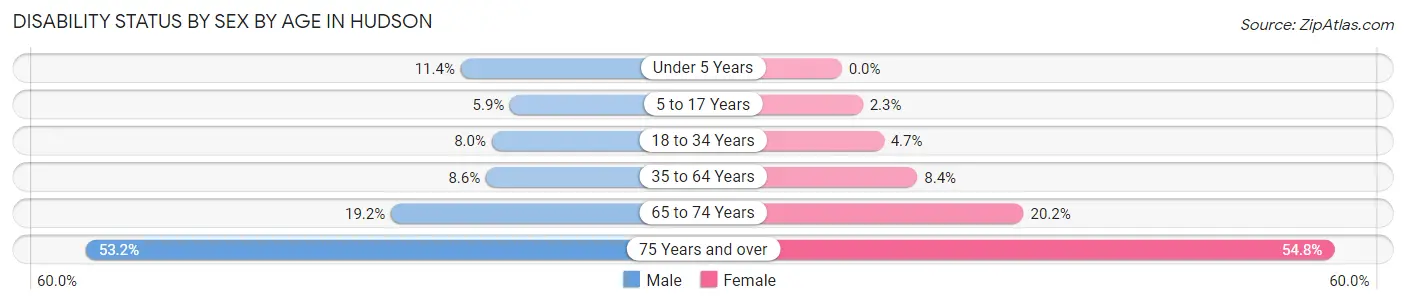
| Age Bracket | Male | Female |
| Under 5 Years | 55 (11.4%) | 0 (0.0%) |
| 5 to 17 Years | 63 (5.9%) | 24 (2.3%) |
| 18 to 34 Years | 130 (8.0%) | 65 (4.7%) |
| 35 to 64 Years | 266 (8.6%) | 290 (8.4%) |
| 65 to 74 Years | 132 (19.2%) | 166 (20.2%) |
| 75 Years and over | 276 (53.2%) | 534 (54.8%) |
Disability Class by Sex by Age in Hudson
Disability Class: Hearing Difficulty
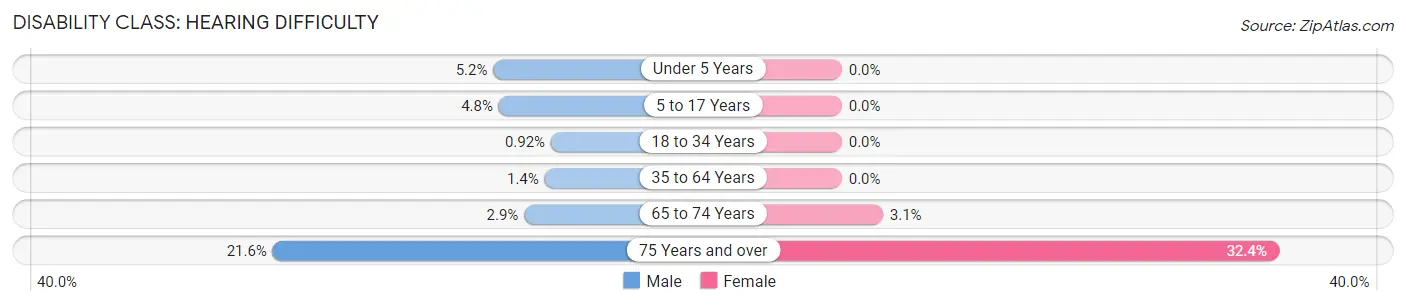
| Age Bracket | Male | Female |
| Under 5 Years | 25 (5.2%) | 0 (0.0%) |
| 5 to 17 Years | 51 (4.8%) | 0 (0.0%) |
| 18 to 34 Years | 15 (0.9%) | 0 (0.0%) |
| 35 to 64 Years | 43 (1.4%) | 0 (0.0%) |
| 65 to 74 Years | 20 (2.9%) | 25 (3.0%) |
| 75 Years and over | 112 (21.6%) | 316 (32.4%) |
Disability Class: Vision Difficulty
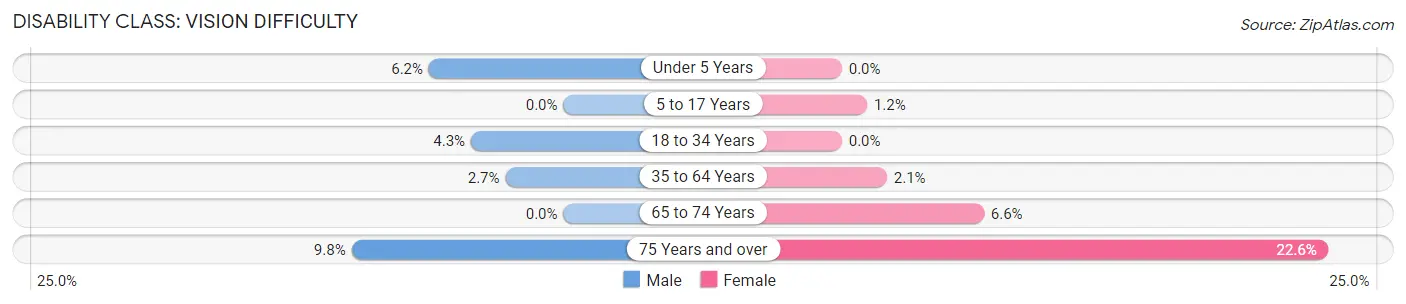
| Age Bracket | Male | Female |
| Under 5 Years | 30 (6.2%) | 0 (0.0%) |
| 5 to 17 Years | 0 (0.0%) | 12 (1.2%) |
| 18 to 34 Years | 70 (4.3%) | 0 (0.0%) |
| 35 to 64 Years | 83 (2.7%) | 72 (2.1%) |
| 65 to 74 Years | 0 (0.0%) | 54 (6.6%) |
| 75 Years and over | 51 (9.8%) | 220 (22.6%) |
Disability Class: Cognitive Difficulty
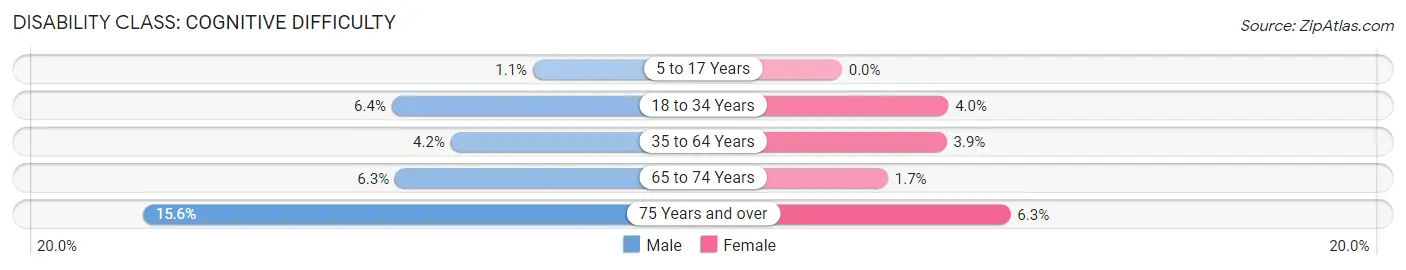
| Age Bracket | Male | Female |
| 5 to 17 Years | 12 (1.1%) | 0 (0.0%) |
| 18 to 34 Years | 104 (6.4%) | 55 (4.0%) |
| 35 to 64 Years | 129 (4.2%) | 134 (3.9%) |
| 65 to 74 Years | 43 (6.2%) | 14 (1.7%) |
| 75 Years and over | 81 (15.6%) | 61 (6.3%) |
Disability Class: Ambulatory Difficulty
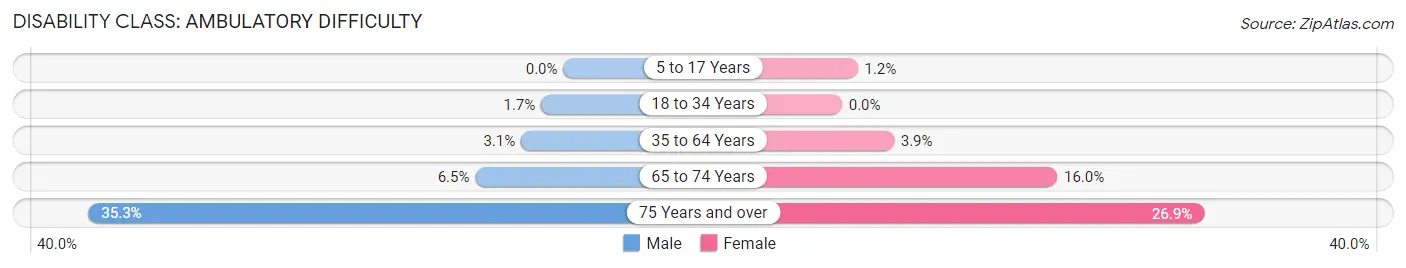
| Age Bracket | Male | Female |
| 5 to 17 Years | 0 (0.0%) | 12 (1.2%) |
| 18 to 34 Years | 27 (1.7%) | 0 (0.0%) |
| 35 to 64 Years | 97 (3.1%) | 133 (3.9%) |
| 65 to 74 Years | 45 (6.5%) | 131 (16.0%) |
| 75 Years and over | 183 (35.3%) | 262 (26.9%) |
Disability Class: Self-Care Difficulty
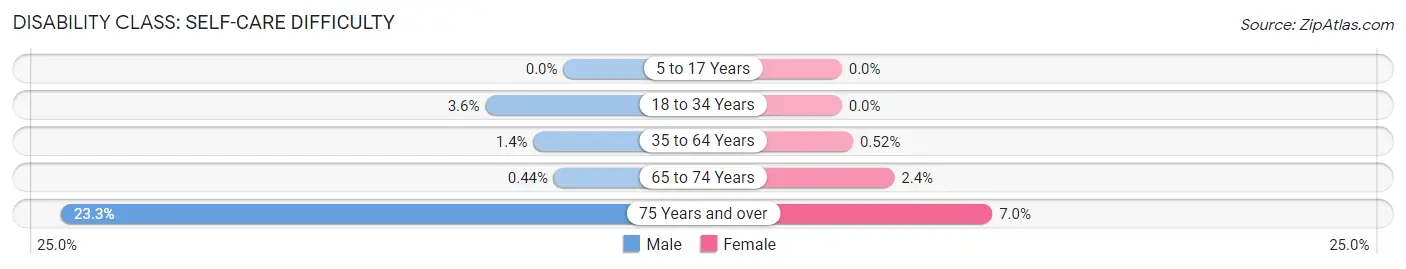
| Age Bracket | Male | Female |
| 5 to 17 Years | 0 (0.0%) | 0 (0.0%) |
| 18 to 34 Years | 59 (3.6%) | 0 (0.0%) |
| 35 to 64 Years | 43 (1.4%) | 18 (0.5%) |
| 65 to 74 Years | 3 (0.4%) | 20 (2.4%) |
| 75 Years and over | 121 (23.3%) | 68 (7.0%) |
Technology Access in Hudson
Computing Device Access in Hudson
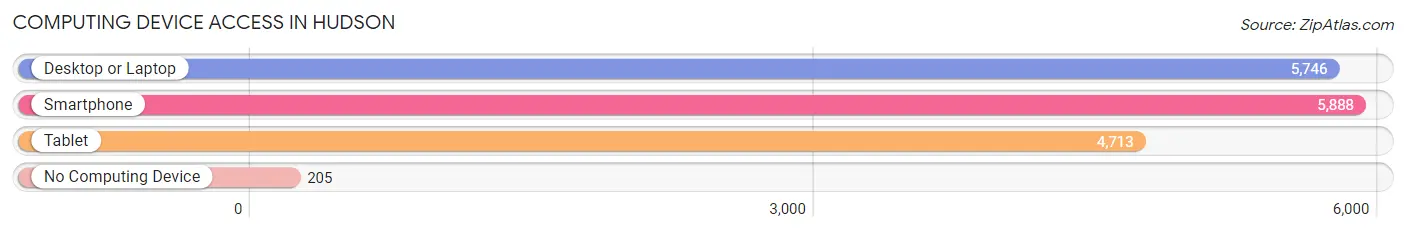
| Device Type | # Households | % Households |
| Desktop or Laptop | 5,746 | 87.9% |
| Smartphone | 5,888 | 90.1% |
| Tablet | 4,713 | 72.1% |
| No Computing Device | 205 | 3.1% |
| Total | 6,534 | 100.0% |
Internet Access in Hudson
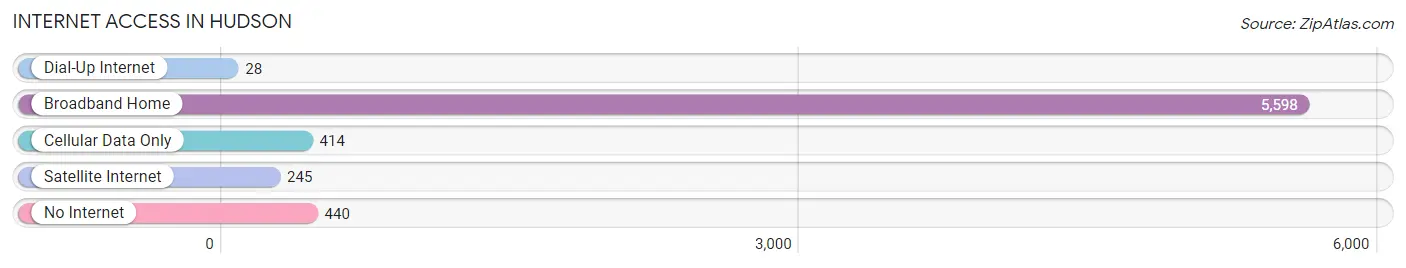
| Internet Type | # Households | % Households |
| Dial-Up Internet | 28 | 0.4% |
| Broadband Home | 5,598 | 85.7% |
| Cellular Data Only | 414 | 6.3% |
| Satellite Internet | 245 | 3.7% |
| No Internet | 440 | 6.7% |
| Total | 6,534 | 100.0% |
Hudson Summary
Hudson, Massachusetts is a town located in Middlesex County, approximately 25 miles west of Boston. It is bordered by the towns of Marlborough, Stow, Bolton, Berlin, and Sudbury. The town has a population of 19,063 as of the 2010 census, and is part of the MetroWest region of Massachusetts.
History
Hudson was first settled in 1699 by settlers from Marlborough, and was officially incorporated in 1866. The town was named after Charles Hudson, a prominent local businessman and politician. The town was originally an agricultural community, with many of its residents working in the local mills. In the late 19th century, the town began to industrialize, with the opening of several factories, including the Hudson Manufacturing Company, which produced textiles.
Geography
Hudson is located in eastern Massachusetts, in Middlesex County. It is bordered by the towns of Marlborough, Stow, Bolton, Berlin, and Sudbury. The town has a total area of 16.3 square miles, of which 16.2 square miles is land and 0.1 square miles is water. The Assabet River runs through the town, and there are several ponds and lakes, including Lake Boon, Lake Whitehall, and Lake Hoccomocco.
Economy
Hudson is a primarily residential community, with a few small businesses located in the town. The largest employers in the town are the Hudson Public Schools, the Hudson Fire Department, and the Hudson Police Department. There are also several small businesses located in the town, including restaurants, retail stores, and professional services.
Demographics
As of the 2010 census, there were 19,063 people, 7,093 households, and 4,945 families residing in the town. The population density was 1,170.3 people per square mile. The racial makeup of the town was 87.3% White, 4.2% African American, 0.3% Native American, 4.7% Asian, 0.1% Pacific Islander, 1.7% from other races, and 1.9% from two or more races. Hispanic or Latino of any race were 4.2% of the population.
The median income for a household in the town was $76,845, and the median income for a family was $90,945. The per capita income for the town was $35,945. About 3.2% of families and 4.7% of the population were below the poverty line, including 5.2% of those under age 18 and 4.2% of those age 65 or over.
Common Questions
What is Per Capita Income in Hudson?
Per Capita income in Hudson is $49,409.
What is the Median Family Income in Hudson?
Median Family Income in Hudson is $129,925.
What is the Median Household income in Hudson?
Median Household Income in Hudson is $91,324.
What is Income or Wage Gap in Hudson?
Income or Wage Gap in Hudson is 19.6%.
Women in Hudson earn 80.4 cents for every dollar earned by a man.
What is Inequality or Gini Index in Hudson?
Inequality or Gini Index in Hudson is 0.43.
What is the Total Population of Hudson?
Total Population of Hudson is 15,496.
What is the Total Male Population of Hudson?
Total Male Population of Hudson is 7,473.
What is the Total Female Population of Hudson?
Total Female Population of Hudson is 8,023.
What is the Ratio of Males per 100 Females in Hudson?
There are 93.14 Males per 100 Females in Hudson.
What is the Ratio of Females per 100 Males in Hudson?
There are 107.36 Females per 100 Males in Hudson.
What is the Median Population Age in Hudson?
Median Population Age in Hudson is 43.8 Years.
What is the Average Family Size in Hudson
Average Family Size in Hudson is 3.0 People.
What is the Average Household Size in Hudson
Average Household Size in Hudson is 2.4 People.
How Large is the Labor Force in Hudson?
There are 8,563 People in the Labor Forcein in Hudson.
What is the Percentage of People in the Labor Force in Hudson?
66.2% of People are in the Labor Force in Hudson.
What is the Unemployment Rate in Hudson?
Unemployment Rate in Hudson is 4.3%.