Easthampton Town, MA Map & Demographics
Easthampton Town Map
Easthampton Town Overview
$42,677
PER CAPITA INCOME
$89,699
AVG FAMILY INCOME
$67,329
AVG HOUSEHOLD INCOME
27.2%
WAGE / INCOME GAP [ % ]
72.8¢/ $1
WAGE / INCOME GAP [ $ ]
0.44
INEQUALITY / GINI INDEX
16,136
TOTAL POPULATION
7,962
MALE POPULATION
8,174
FEMALE POPULATION
97.41
MALES / 100 FEMALES
102.66
FEMALES / 100 MALES
47.0
MEDIAN AGE
2.5
AVG FAMILY SIZE
2.0
AVG HOUSEHOLD SIZE
8,544
LABOR FORCE [ PEOPLE ]
62.0%
PERCENT IN LABOR FORCE
5.4%
UNEMPLOYMENT RATE
Income in Easthampton Town
Income Overview in Easthampton Town
Per Capita Income in Easthampton Town is $42,677, while median incomes of families and households are $89,699 and $67,329 respectively.
| Characteristic | Number | Measure |
| Per Capita Income | 16,136 | $42,677 |
| Median Family Income | 4,499 | $89,699 |
| Mean Family Income | 4,499 | $112,140 |
| Median Household Income | 7,935 | $67,329 |
| Mean Household Income | 7,935 | $88,267 |
| Income Deficit | 4,499 | $0 |
| Wage / Income Gap (%) | 16,136 | 27.18% |
| Wage / Income Gap ($) | 16,136 | 72.82¢ per $1 |
| Gini / Inequality Index | 16,136 | 0.44 |
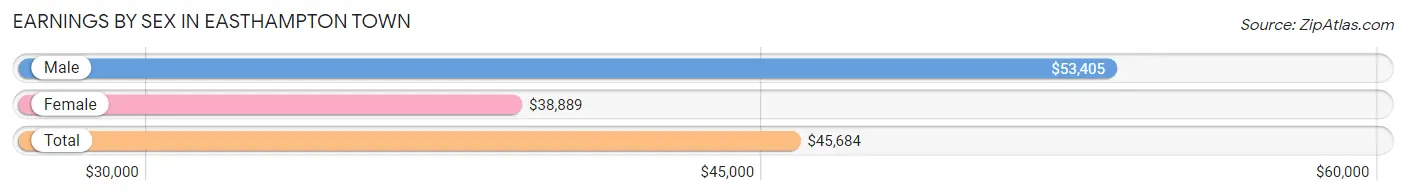
Earnings by Sex in Easthampton Town
Average Earnings in Easthampton Town are $45,684, $53,405 for men and $38,889 for women, a difference of 27.2%.
| Sex | Number | Average Earnings |
| Male | 4,144 (47.2%) | $53,405 |
| Female | 4,626 (52.7%) | $38,889 |
| Total | 8,770 (100.0%) | $45,684 |
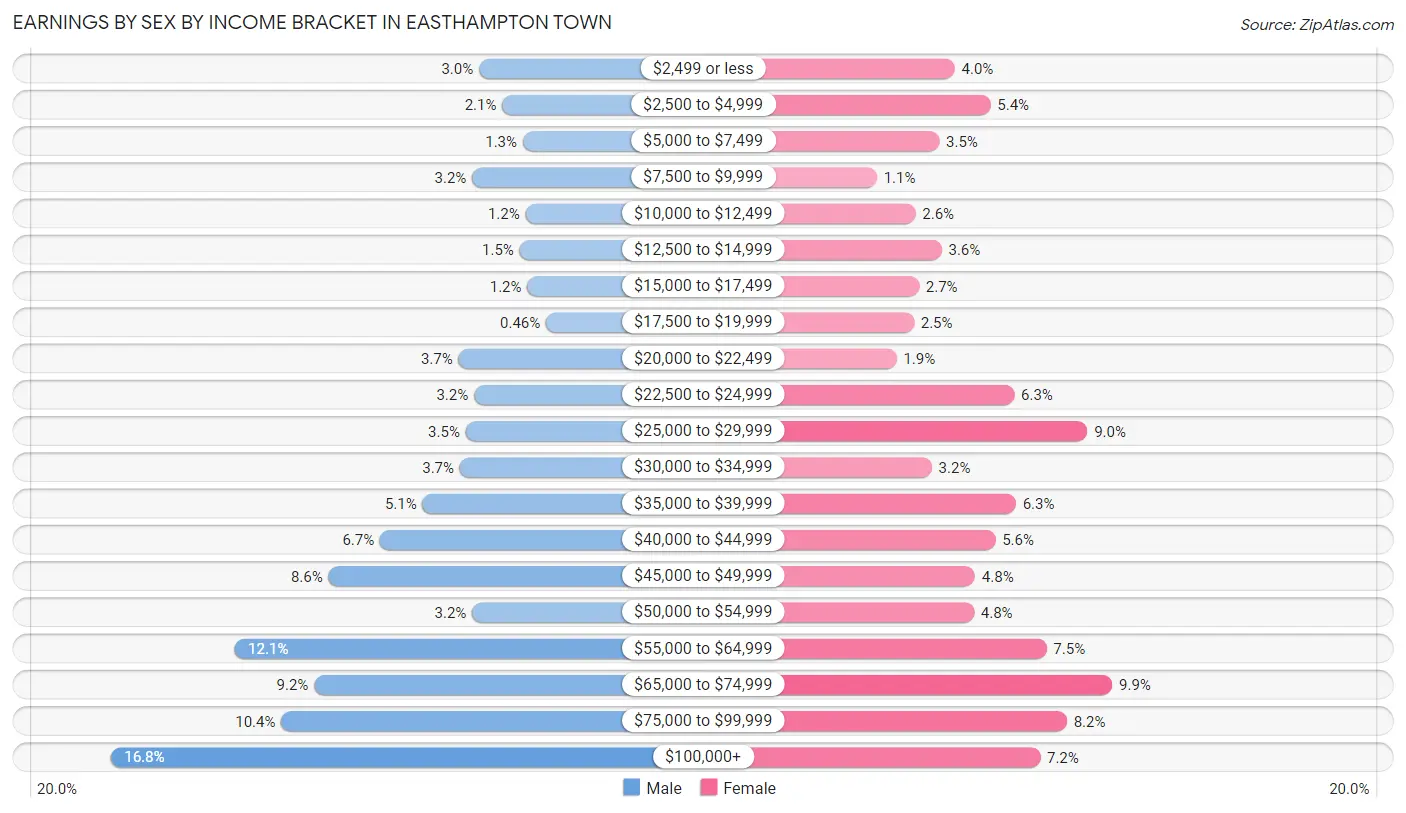
Earnings by Sex by Income Bracket in Easthampton Town
The most common earnings brackets in Easthampton Town are $100,000+ for men (694 | 16.8%) and $65,000 to $74,999 for women (460 | 9.9%).
| Income | Male | Female |
| $2,499 or less | 123 (3.0%) | 187 (4.0%) |
| $2,500 to $4,999 | 87 (2.1%) | 249 (5.4%) |
| $5,000 to $7,499 | 55 (1.3%) | 160 (3.5%) |
| $7,500 to $9,999 | 134 (3.2%) | 52 (1.1%) |
| $10,000 to $12,499 | 51 (1.2%) | 119 (2.6%) |
| $12,500 to $14,999 | 60 (1.5%) | 164 (3.5%) |
| $15,000 to $17,499 | 48 (1.2%) | 125 (2.7%) |
| $17,500 to $19,999 | 19 (0.5%) | 116 (2.5%) |
| $20,000 to $22,499 | 155 (3.7%) | 86 (1.9%) |
| $22,500 to $24,999 | 131 (3.2%) | 290 (6.3%) |
| $25,000 to $29,999 | 144 (3.5%) | 417 (9.0%) |
| $30,000 to $34,999 | 153 (3.7%) | 147 (3.2%) |
| $35,000 to $39,999 | 211 (5.1%) | 293 (6.3%) |
| $40,000 to $44,999 | 277 (6.7%) | 257 (5.6%) |
| $45,000 to $49,999 | 357 (8.6%) | 222 (4.8%) |
| $50,000 to $54,999 | 134 (3.2%) | 220 (4.8%) |
| $55,000 to $64,999 | 502 (12.1%) | 346 (7.5%) |
| $65,000 to $74,999 | 379 (9.1%) | 460 (9.9%) |
| $75,000 to $99,999 | 430 (10.4%) | 381 (8.2%) |
| $100,000+ | 694 (16.8%) | 335 (7.2%) |
| Total | 4,144 (100.0%) | 4,626 (100.0%) |
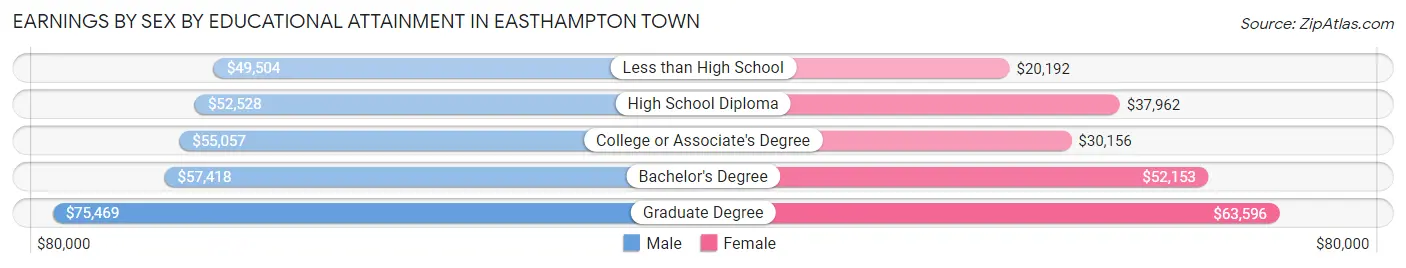
Earnings by Sex by Educational Attainment in Easthampton Town
Average earnings in Easthampton Town are $56,865 for men and $44,391 for women, a difference of 21.9%. Men with an educational attainment of graduate degree enjoy the highest average annual earnings of $75,469, while those with less than high school education earn the least with $49,504. Women with an educational attainment of graduate degree earn the most with the average annual earnings of $63,596, while those with less than high school education have the smallest earnings of $20,192.
| Educational Attainment | Male Income | Female Income |
| Less than High School | $49,504 | $20,192 |
| High School Diploma | $52,528 | $37,962 |
| College or Associate's Degree | $55,057 | $30,156 |
| Bachelor's Degree | $57,418 | $52,153 |
| Graduate Degree | $75,469 | $63,596 |
| Total | $56,865 | $44,391 |
Family Income in Easthampton Town
Family Income Brackets in Easthampton Town
According to the Easthampton Town family income data, there are 1,179 families falling into the $100,000 to $149,999 income range, which is the most common income bracket and makes up 26.2% of all families. Conversely, the less than $10,000 income bracket is the least frequent group with only 18 families (0.4%) belonging to this category.
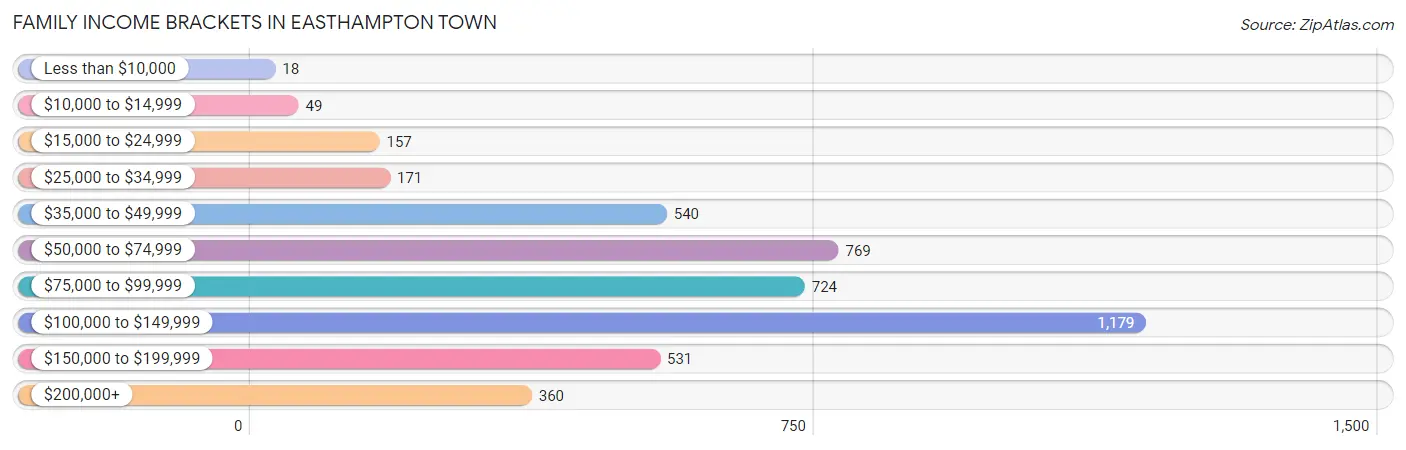
| Income Bracket | # Families | % Families |
| Less than $10,000 | 18 | 0.4% |
| $10,000 to $14,999 | 49 | 1.1% |
| $15,000 to $24,999 | 157 | 3.5% |
| $25,000 to $34,999 | 171 | 3.8% |
| $35,000 to $49,999 | 540 | 12.0% |
| $50,000 to $74,999 | 769 | 17.1% |
| $75,000 to $99,999 | 724 | 16.1% |
| $100,000 to $149,999 | 1,179 | 26.2% |
| $150,000 to $199,999 | 531 | 11.8% |
| $200,000+ | 360 | 8.0% |
Family Income by Famaliy Size in Easthampton Town
4-person families (640 | 14.2%) account for the highest median family income in Easthampton Town with $134,066 per family, while 3-person families (663 | 14.7%) have the highest median income of $43,064 per family member.
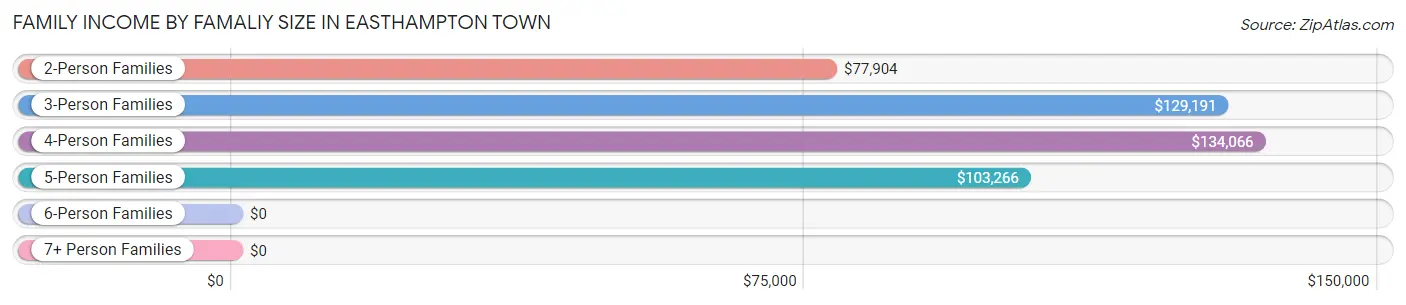
| Income Bracket | # Families | Median Income |
| 2-Person Families | 2,976 (66.1%) | $77,904 |
| 3-Person Families | 663 (14.7%) | $129,191 |
| 4-Person Families | 640 (14.2%) | $134,066 |
| 5-Person Families | 159 (3.5%) | $103,266 |
| 6-Person Families | 35 (0.8%) | $0 |
| 7+ Person Families | 26 (0.6%) | $0 |
| Total | 4,499 (100.0%) | $89,699 |
Family Income by Number of Earners in Easthampton Town
The median family income in Easthampton Town is $89,699, with families comprising 3+ earners (448) having the highest median family income of $134,398, while families with no earners (811) have the lowest median family income of $54,449, accounting for 10.0% and 18.0% of families, respectively.
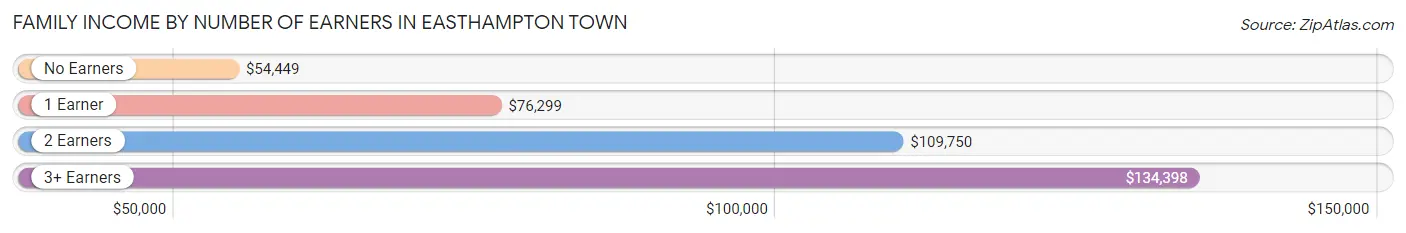
| Number of Earners | # Families | Median Income |
| No Earners | 811 (18.0%) | $54,449 |
| 1 Earner | 1,467 (32.6%) | $76,299 |
| 2 Earners | 1,773 (39.4%) | $109,750 |
| 3+ Earners | 448 (10.0%) | $134,398 |
| Total | 4,499 (100.0%) | $89,699 |
Household Income in Easthampton Town
Household Income Brackets in Easthampton Town
With 1,563 households falling in the category, the $100,000 to $149,999 income range is the most frequent in Easthampton Town, accounting for 19.7% of all households. In contrast, only 270 households (3.4%) fall into the less than $10,000 income bracket, making it the least populous group.
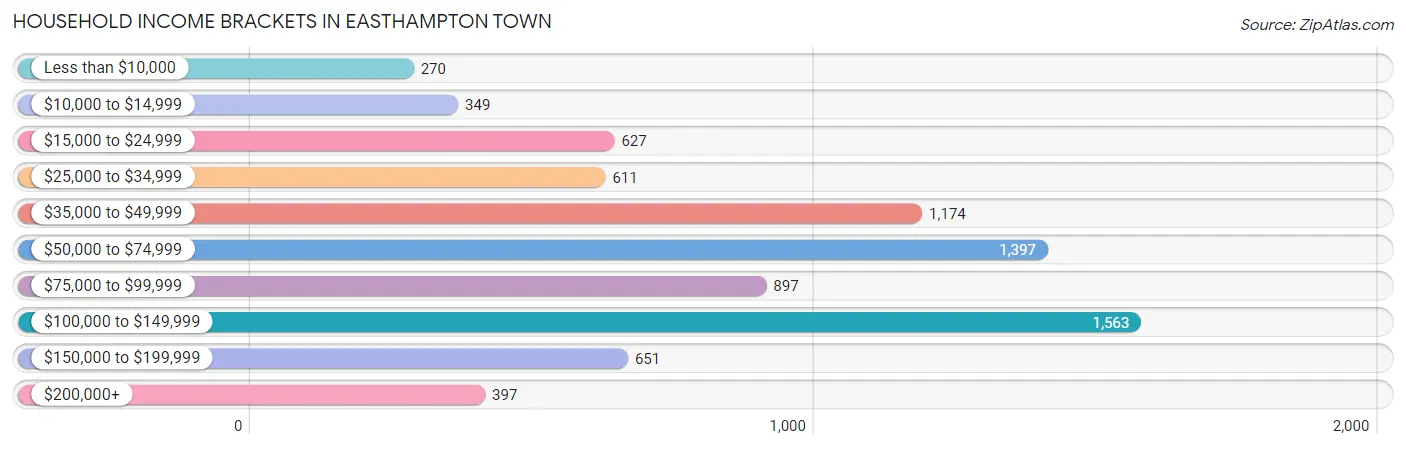
| Income Bracket | # Households | % Households |
| Less than $10,000 | 270 | 3.4% |
| $10,000 to $14,999 | 349 | 4.4% |
| $15,000 to $24,999 | 627 | 7.9% |
| $25,000 to $34,999 | 611 | 7.7% |
| $35,000 to $49,999 | 1,174 | 14.8% |
| $50,000 to $74,999 | 1,397 | 17.6% |
| $75,000 to $99,999 | 897 | 11.3% |
| $100,000 to $149,999 | 1,563 | 19.7% |
| $150,000 to $199,999 | 651 | 8.2% |
| $200,000+ | 397 | 5.0% |
Household Income by Householder Age in Easthampton Town
The median household income in Easthampton Town is $67,329, with the highest median household income of $87,730 found in the 45 to 64 years age bracket for the primary householder. A total of 2,763 households (34.8%) fall into this category. Meanwhile, the 15 to 24 years age bracket for the primary householder has the lowest median household income of $46,286, with 273 households (3.4%) in this group.
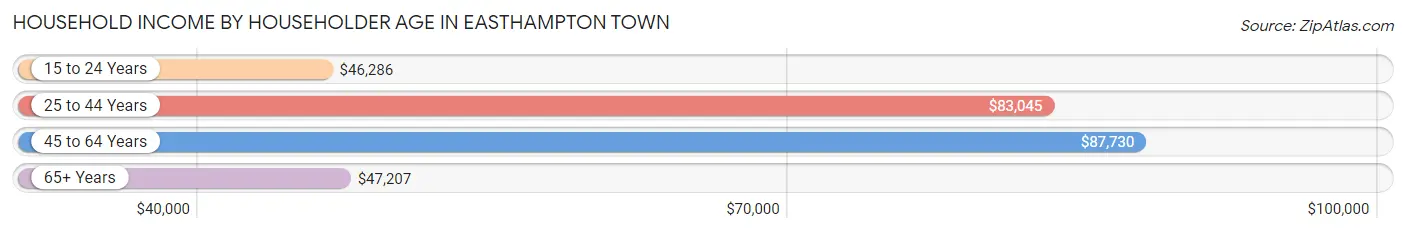
| Income Bracket | # Households | Median Income |
| 15 to 24 Years | 273 (3.4%) | $46,286 |
| 25 to 44 Years | 2,297 (28.9%) | $83,045 |
| 45 to 64 Years | 2,763 (34.8%) | $87,730 |
| 65+ Years | 2,602 (32.8%) | $47,207 |
| Total | 7,935 (100.0%) | $67,329 |
Poverty in Easthampton Town
Income Below Poverty by Sex and Age in Easthampton Town
With 9.9% poverty level for males and 8.7% for females among the residents of Easthampton Town, 5 year old males and 5 year old females are the most vulnerable to poverty, with 21 males (38.9%) and 15 females (27.3%) in their respective age groups living below the poverty level.
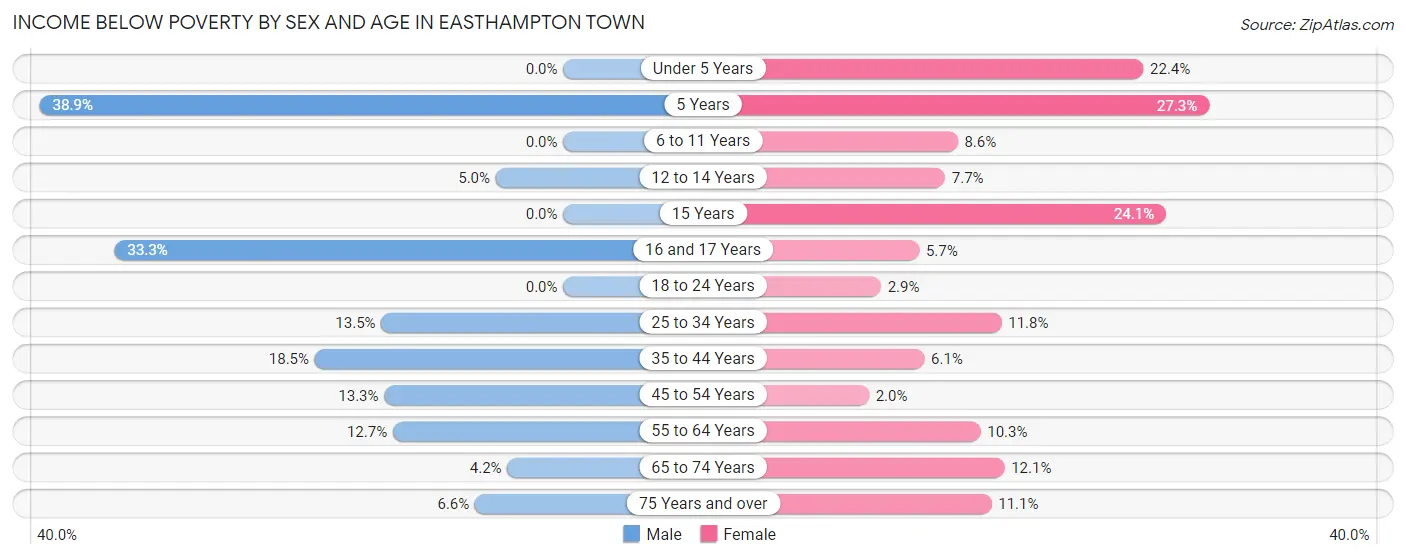
| Age Bracket | Male | Female |
| Under 5 Years | 0 (0.0%) | 34 (22.4%) |
| 5 Years | 21 (38.9%) | 15 (27.3%) |
| 6 to 11 Years | 0 (0.0%) | 45 (8.6%) |
| 12 to 14 Years | 21 (5.0%) | 15 (7.6%) |
| 15 Years | 0 (0.0%) | 13 (24.1%) |
| 16 and 17 Years | 26 (33.3%) | 13 (5.7%) |
| 18 to 24 Years | 0 (0.0%) | 17 (2.9%) |
| 25 to 34 Years | 131 (13.5%) | 99 (11.8%) |
| 35 to 44 Years | 193 (18.4%) | 77 (6.1%) |
| 45 to 54 Years | 128 (13.3%) | 19 (2.0%) |
| 55 to 64 Years | 168 (12.7%) | 137 (10.3%) |
| 65 to 74 Years | 49 (4.2%) | 137 (12.1%) |
| 75 Years and over | 47 (6.6%) | 89 (11.1%) |
| Total | 784 (9.9%) | 710 (8.7%) |
Income Above Poverty by Sex and Age in Easthampton Town
According to the poverty statistics in Easthampton Town, males aged under 5 years and females aged 45 to 54 years are the age groups that are most secure financially, with 100.0% of males and 98.0% of females in these age groups living above the poverty line.
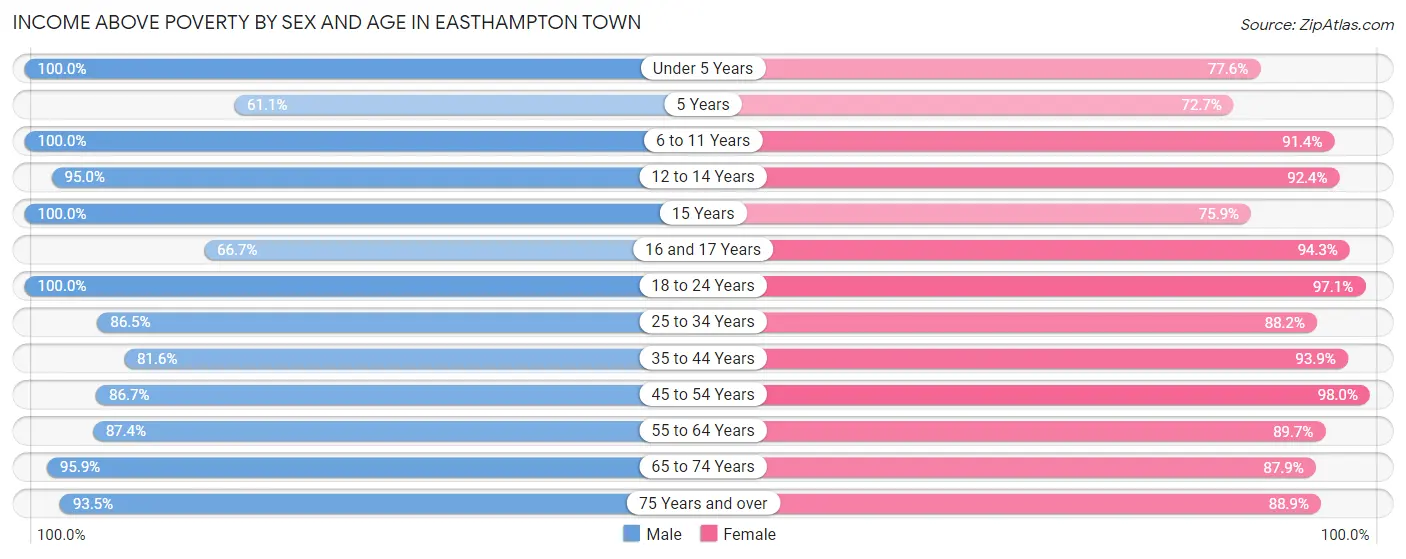
| Age Bracket | Male | Female |
| Under 5 Years | 283 (100.0%) | 118 (77.6%) |
| 5 Years | 33 (61.1%) | 40 (72.7%) |
| 6 to 11 Years | 462 (100.0%) | 479 (91.4%) |
| 12 to 14 Years | 398 (95.0%) | 181 (92.3%) |
| 15 Years | 86 (100.0%) | 41 (75.9%) |
| 16 and 17 Years | 52 (66.7%) | 214 (94.3%) |
| 18 to 24 Years | 361 (100.0%) | 572 (97.1%) |
| 25 to 34 Years | 839 (86.5%) | 737 (88.2%) |
| 35 to 44 Years | 853 (81.6%) | 1,183 (93.9%) |
| 45 to 54 Years | 835 (86.7%) | 933 (98.0%) |
| 55 to 64 Years | 1,160 (87.4%) | 1,196 (89.7%) |
| 65 to 74 Years | 1,133 (95.9%) | 999 (87.9%) |
| 75 Years and over | 671 (93.4%) | 713 (88.9%) |
| Total | 7,166 (90.1%) | 7,406 (91.2%) |
Income Below Poverty Among Married-Couple Families in Easthampton Town
The poverty statistics for married-couple families in Easthampton Town show that 1.4% or 43 of the total 3,076 families live below the poverty line. Families with no children have the highest poverty rate of 2.0%, comprising of 43 families. On the other hand, families with 1 or 2 children have the lowest poverty rate of 0.0%, which includes 0 families.
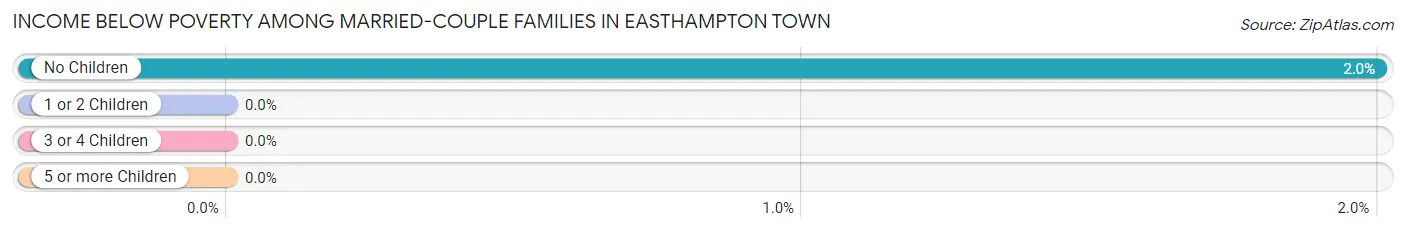
| Children | Above Poverty | Below Poverty |
| No Children | 2,105 (98.0%) | 43 (2.0%) |
| 1 or 2 Children | 879 (100.0%) | 0 (0.0%) |
| 3 or 4 Children | 49 (100.0%) | 0 (0.0%) |
| 5 or more Children | 0 (0.0%) | 0 (0.0%) |
| Total | 3,033 (98.6%) | 43 (1.4%) |
Income Below Poverty Among Single-Parent Households in Easthampton Town
According to the poverty data in Easthampton Town, 10.1% or 64 single-father households and 10.1% or 79 single-mother households are living below the poverty line. Among single-father households, those with no children have the highest poverty rate, with 49 households (13.3%) experiencing poverty. Likewise, among single-mother households, those with 5 or more children have the highest poverty rate, with 17 households (100.0%) falling below the poverty line.
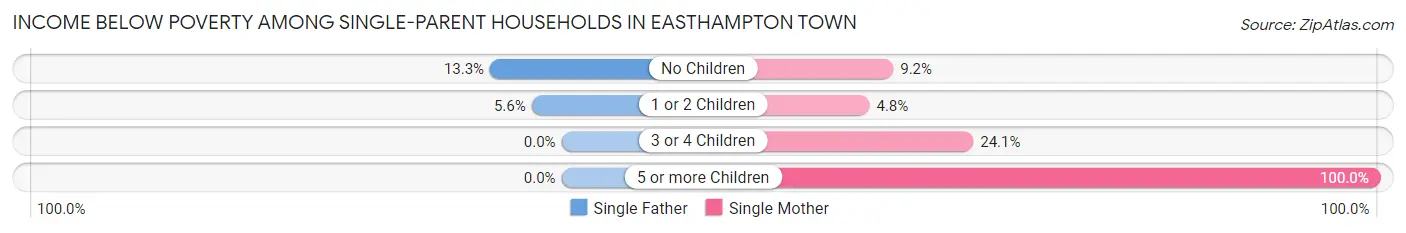
| Children | Single Father | Single Mother |
| No Children | 49 (13.3%) | 17 (9.2%) |
| 1 or 2 Children | 15 (5.6%) | 24 (4.8%) |
| 3 or 4 Children | 0 (0.0%) | 21 (24.1%) |
| 5 or more Children | 0 (0.0%) | 17 (100.0%) |
| Total | 64 (10.1%) | 79 (10.1%) |
Income Below Poverty Among Married-Couple vs Single-Parent Households in Easthampton Town
The poverty data for Easthampton Town shows that 43 of the married-couple family households (1.4%) and 143 of the single-parent households (10.1%) are living below the poverty level. Within the married-couple family households, those with no children have the highest poverty rate, with 43 households (2.0%) falling below the poverty line. Among the single-parent households, those with 5 or more children have the highest poverty rate, with 17 household (100.0%) living below poverty.
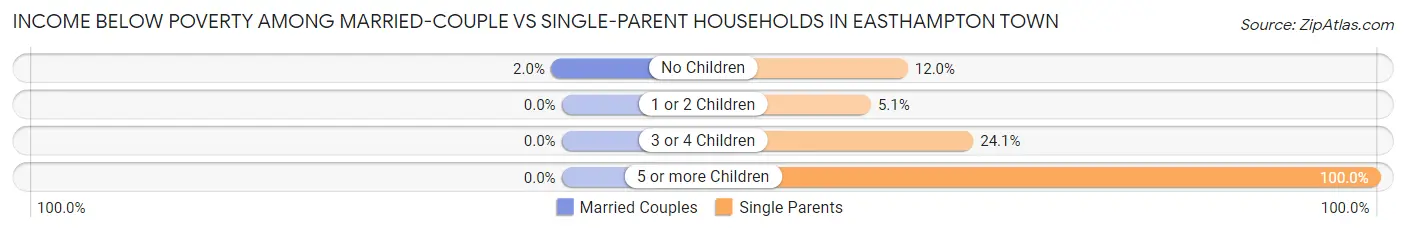
| Children | Married-Couple Families | Single-Parent Households |
| No Children | 43 (2.0%) | 66 (12.0%) |
| 1 or 2 Children | 0 (0.0%) | 39 (5.1%) |
| 3 or 4 Children | 0 (0.0%) | 21 (24.1%) |
| 5 or more Children | 0 (0.0%) | 17 (100.0%) |
| Total | 43 (1.4%) | 143 (10.1%) |
Race in Easthampton Town
The most populous races in Easthampton Town are White / Caucasian (14,067 | 87.2%), Two or more Races (1,405 | 8.7%), and Hispanic or Latino (1,277 | 7.9%).
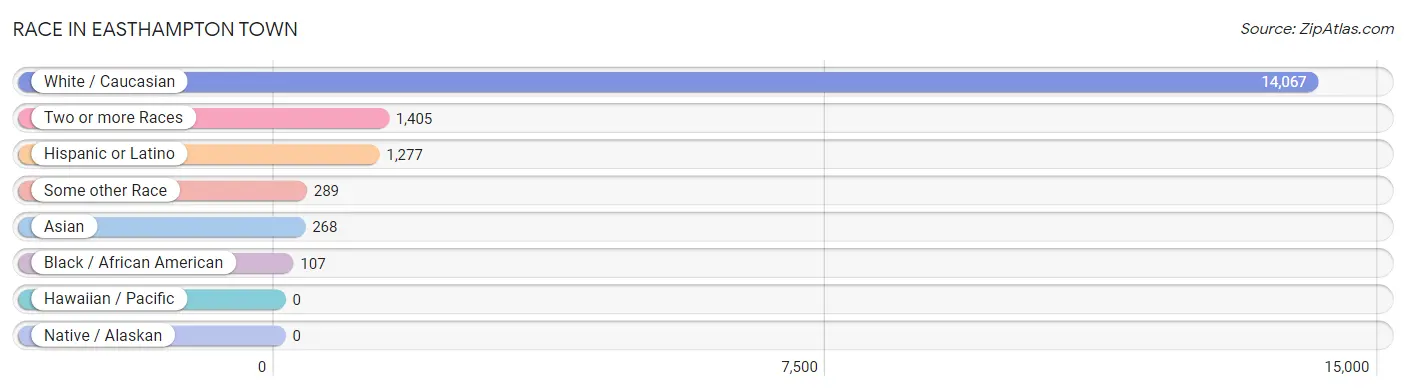
| Race | # Population | % Population |
| Asian | 268 | 1.7% |
| Black / African American | 107 | 0.7% |
| Hawaiian / Pacific | 0 | 0.0% |
| Hispanic or Latino | 1,277 | 7.9% |
| Native / Alaskan | 0 | 0.0% |
| White / Caucasian | 14,067 | 87.2% |
| Two or more Races | 1,405 | 8.7% |
| Some other Race | 289 | 1.8% |
| Total | 16,136 | 100.0% |
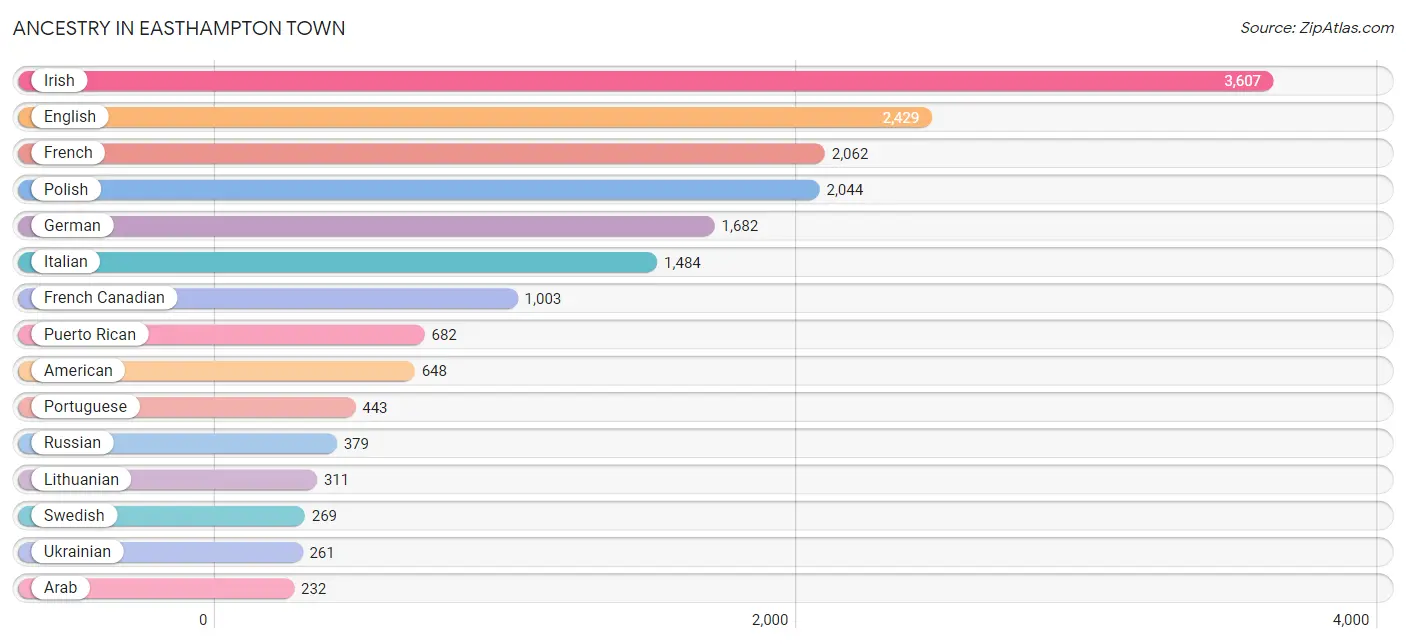
Ancestry in Easthampton Town
The most populous ancestries reported in Easthampton Town are Irish (3,607 | 22.4%), English (2,429 | 15.0%), French (2,062 | 12.8%), Polish (2,044 | 12.7%), and German (1,682 | 10.4%), together accounting for 73.3% of all Easthampton Town residents.
| Ancestry | # Population | % Population |
| African | 2 | 0.0% |
| American | 648 | 4.0% |
| Arab | 232 | 1.4% |
| Argentinean | 20 | 0.1% |
| Armenian | 17 | 0.1% |
| Austrian | 54 | 0.3% |
| Belgian | 35 | 0.2% |
| Bhutanese | 80 | 0.5% |
| Blackfeet | 22 | 0.1% |
| Brazilian | 57 | 0.4% |
| British | 107 | 0.7% |
| Canadian | 100 | 0.6% |
| Central American | 76 | 0.5% |
| Colombian | 58 | 0.4% |
| Cuban | 97 | 0.6% |
| Czech | 48 | 0.3% |
| Czechoslovakian | 16 | 0.1% |
| Danish | 45 | 0.3% |
| Dominican | 131 | 0.8% |
| Eastern European | 198 | 1.2% |
| Egyptian | 34 | 0.2% |
| English | 2,429 | 15.0% |
| European | 146 | 0.9% |
| French | 2,062 | 12.8% |
| French Canadian | 1,003 | 6.2% |
| German | 1,682 | 10.4% |
| Honduran | 53 | 0.3% |
| Hungarian | 117 | 0.7% |
| Indian (Asian) | 156 | 1.0% |
| Iranian | 15 | 0.1% |
| Irish | 3,607 | 22.4% |
| Iroquois | 13 | 0.1% |
| Italian | 1,484 | 9.2% |
| Japanese | 10 | 0.1% |
| Korean | 26 | 0.2% |
| Lebanese | 50 | 0.3% |
| Lithuanian | 311 | 1.9% |
| Mexican | 75 | 0.5% |
| Mexican American Indian | 43 | 0.3% |
| Moroccan | 89 | 0.5% |
| Nigerian | 41 | 0.3% |
| Northern European | 34 | 0.2% |
| Norwegian | 35 | 0.2% |
| Peruvian | 96 | 0.6% |
| Polish | 2,044 | 12.7% |
| Portuguese | 443 | 2.8% |
| Puerto Rican | 682 | 4.2% |
| Romanian | 20 | 0.1% |
| Russian | 379 | 2.4% |
| Salvadoran | 23 | 0.1% |
| Scandinavian | 35 | 0.2% |
| Scotch-Irish | 48 | 0.3% |
| Scottish | 227 | 1.4% |
| Serbian | 56 | 0.4% |
| South American | 174 | 1.1% |
| Soviet Union | 21 | 0.1% |
| Spaniard | 40 | 0.3% |
| Subsaharan African | 43 | 0.3% |
| Swedish | 269 | 1.7% |
| Swiss | 156 | 1.0% |
| Syrian | 21 | 0.1% |
| Thai | 143 | 0.9% |
| Trinidadian and Tobagonian | 28 | 0.2% |
| Turkish | 52 | 0.3% |
| Ukrainian | 261 | 1.6% |
| Welsh | 95 | 0.6% |
| Yugoslavian | 88 | 0.5% | View All 67 Rows |
Immigrants in Easthampton Town
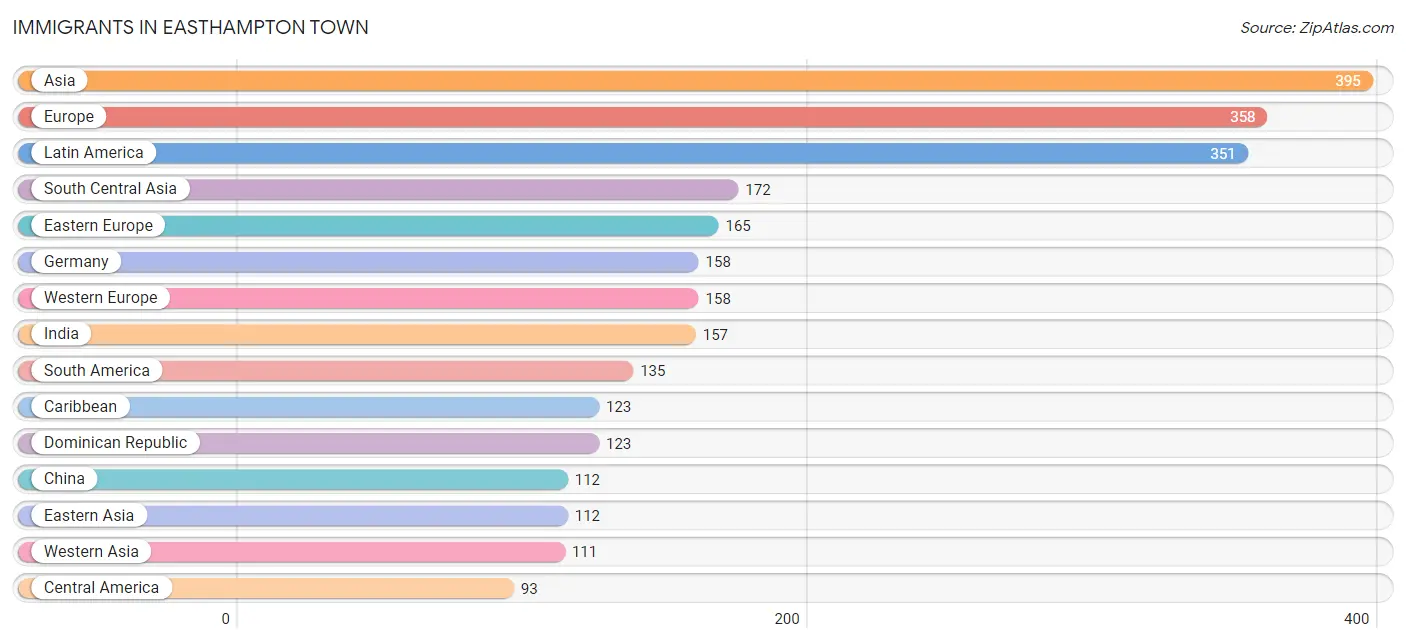
The most numerous immigrant groups reported in Easthampton Town came from Asia (395 | 2.5%), Europe (358 | 2.2%), Latin America (351 | 2.2%), South Central Asia (172 | 1.1%), and Eastern Europe (165 | 1.0%), together accounting for 8.9% of all Easthampton Town residents.
| Immigration Origin | # Population | % Population |
| Africa | 80 | 0.5% |
| Argentina | 20 | 0.1% |
| Asia | 395 | 2.5% |
| Bosnia and Herzegovina | 44 | 0.3% |
| Brazil | 57 | 0.4% |
| Canada | 23 | 0.1% |
| Caribbean | 123 | 0.8% |
| Central America | 93 | 0.6% |
| China | 112 | 0.7% |
| Colombia | 58 | 0.4% |
| Dominican Republic | 123 | 0.8% |
| Eastern Asia | 112 | 0.7% |
| Eastern Europe | 165 | 1.0% |
| El Salvador | 40 | 0.3% |
| Europe | 358 | 2.2% |
| Germany | 158 | 1.0% |
| Honduras | 53 | 0.3% |
| Hungary | 35 | 0.2% |
| India | 157 | 1.0% |
| Iran | 15 | 0.1% |
| Latin America | 351 | 2.2% |
| Lithuania | 17 | 0.1% |
| Middle Africa | 18 | 0.1% |
| Morocco | 62 | 0.4% |
| Northern Africa | 62 | 0.4% |
| Northern Europe | 17 | 0.1% |
| Portugal | 18 | 0.1% |
| Romania | 4 | 0.0% |
| Russia | 34 | 0.2% |
| South America | 135 | 0.8% |
| South Central Asia | 172 | 1.1% |
| Southern Europe | 18 | 0.1% |
| Syria | 73 | 0.4% |
| Turkey | 38 | 0.2% |
| Ukraine | 31 | 0.2% |
| Western Asia | 111 | 0.7% |
| Western Europe | 158 | 1.0% | View All 37 Rows |
Sex and Age in Easthampton Town
Sex and Age in Easthampton Town
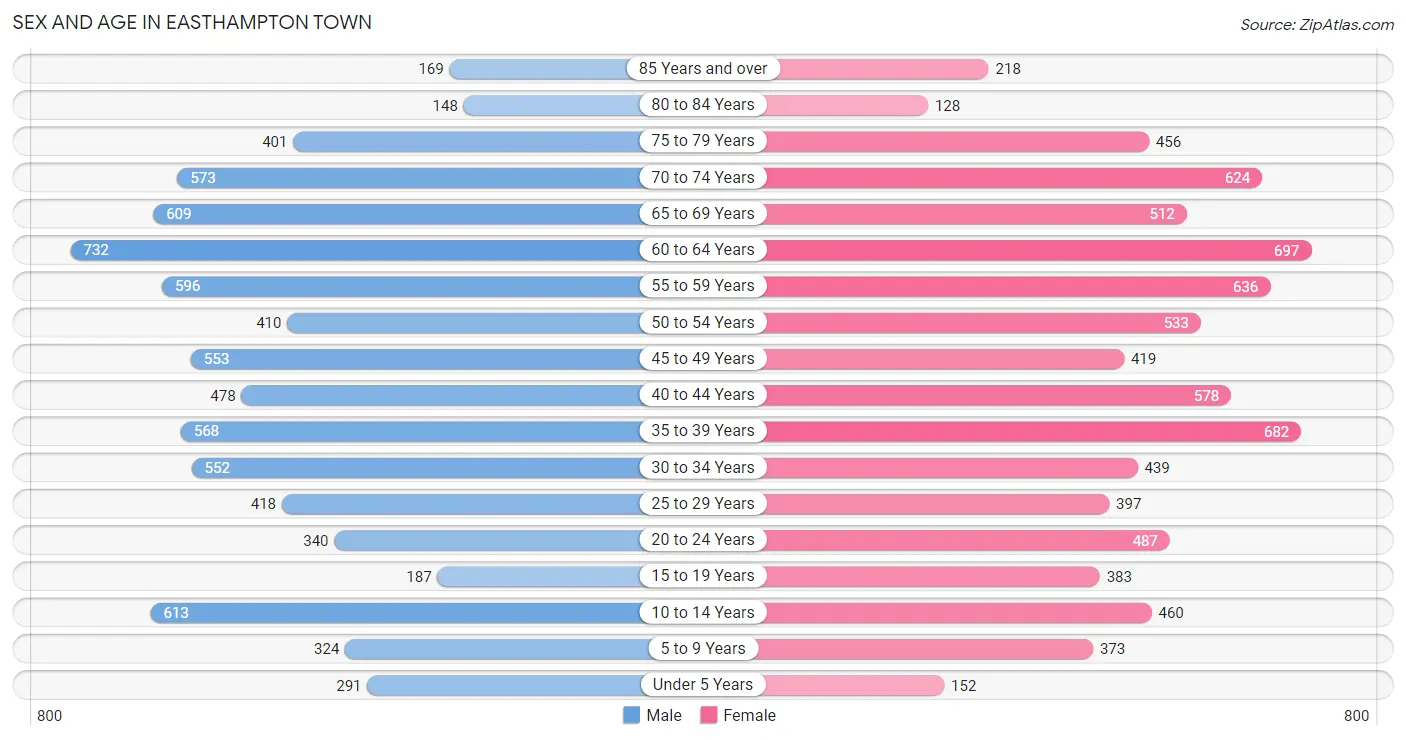
The most populous age groups in Easthampton Town are 60 to 64 Years (732 | 9.2%) for men and 60 to 64 Years (697 | 8.5%) for women.
| Age Bracket | Male | Female |
| Under 5 Years | 291 (3.6%) | 152 (1.9%) |
| 5 to 9 Years | 324 (4.1%) | 373 (4.6%) |
| 10 to 14 Years | 613 (7.7%) | 460 (5.6%) |
| 15 to 19 Years | 187 (2.4%) | 383 (4.7%) |
| 20 to 24 Years | 340 (4.3%) | 487 (6.0%) |
| 25 to 29 Years | 418 (5.2%) | 397 (4.9%) |
| 30 to 34 Years | 552 (6.9%) | 439 (5.4%) |
| 35 to 39 Years | 568 (7.1%) | 682 (8.3%) |
| 40 to 44 Years | 478 (6.0%) | 578 (7.1%) |
| 45 to 49 Years | 553 (7.0%) | 419 (5.1%) |
| 50 to 54 Years | 410 (5.1%) | 533 (6.5%) |
| 55 to 59 Years | 596 (7.5%) | 636 (7.8%) |
| 60 to 64 Years | 732 (9.2%) | 697 (8.5%) |
| 65 to 69 Years | 609 (7.6%) | 512 (6.3%) |
| 70 to 74 Years | 573 (7.2%) | 624 (7.6%) |
| 75 to 79 Years | 401 (5.0%) | 456 (5.6%) |
| 80 to 84 Years | 148 (1.9%) | 128 (1.6%) |
| 85 Years and over | 169 (2.1%) | 218 (2.7%) |
| Total | 7,962 (100.0%) | 8,174 (100.0%) |
Families and Households in Easthampton Town
Median Family Size in Easthampton Town
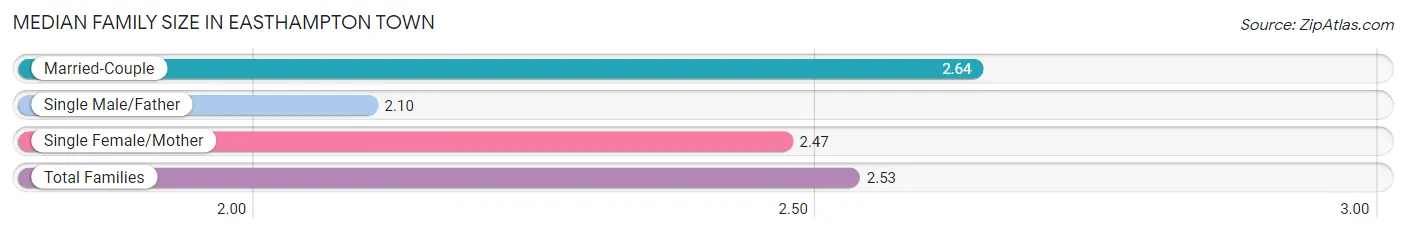
The median family size in Easthampton Town is 2.53 persons per family, with married-couple families (3,076 | 68.4%) accounting for the largest median family size of 2.64 persons per family. On the other hand, single male/father families (637 | 14.2%) represent the smallest median family size with 2.10 persons per family.
| Family Type | # Families | Family Size |
| Married-Couple | 3,076 (68.4%) | 2.64 |
| Single Male/Father | 637 (14.2%) | 2.10 |
| Single Female/Mother | 786 (17.5%) | 2.47 |
| Total Families | 4,499 (100.0%) | 2.53 |
Median Household Size in Easthampton Town
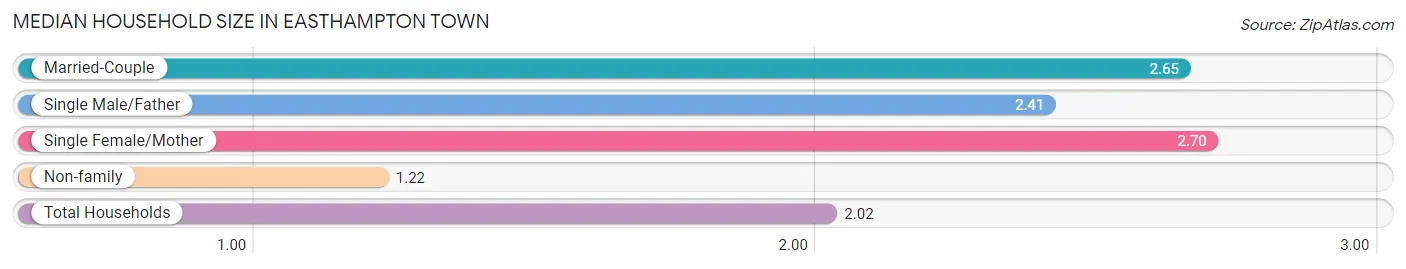
The median household size in Easthampton Town is 2.02 persons per household, with single female/mother households (786 | 9.9%) accounting for the largest median household size of 2.7 persons per household. non-family households (3,436 | 43.3%) represent the smallest median household size with 1.22 persons per household.
| Household Type | # Households | Household Size |
| Married-Couple | 3,076 (38.8%) | 2.65 |
| Single Male/Father | 637 (8.0%) | 2.41 |
| Single Female/Mother | 786 (9.9%) | 2.70 |
| Non-family | 3,436 (43.3%) | 1.22 |
| Total Households | 7,935 (100.0%) | 2.02 |
Household Size by Marriage Status in Easthampton Town
Out of a total of 7,935 households in Easthampton Town, 4,499 (56.7%) are family households, while 3,436 (43.3%) are nonfamily households. The most numerous type of family households are 2-person households, comprising 2,662, and the most common type of nonfamily households are 1-person households, comprising 2,620.
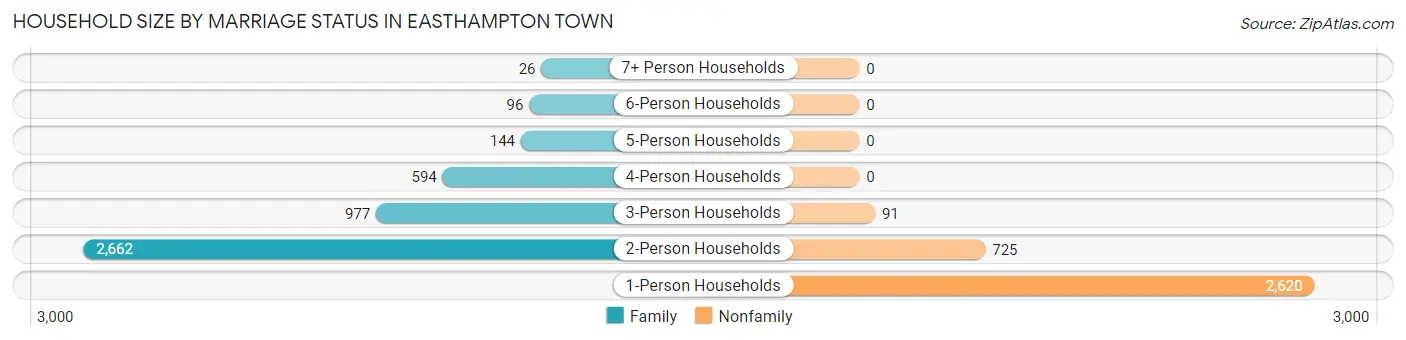
| Household Size | Family Households | Nonfamily Households |
| 1-Person Households | - | 2,620 (33.0%) |
| 2-Person Households | 2,662 (33.6%) | 725 (9.1%) |
| 3-Person Households | 977 (12.3%) | 91 (1.1%) |
| 4-Person Households | 594 (7.5%) | 0 (0.0%) |
| 5-Person Households | 144 (1.8%) | 0 (0.0%) |
| 6-Person Households | 96 (1.2%) | 0 (0.0%) |
| 7+ Person Households | 26 (0.3%) | 0 (0.0%) |
| Total | 4,499 (56.7%) | 3,436 (43.3%) |
Female Fertility in Easthampton Town
Fertility by Age in Easthampton Town
Average fertility rate in Easthampton Town is 14.0 births per 1,000 women. Women in the age bracket of 35 to 50 years have the highest fertility rate with 18.0 births per 1,000 women. Women in the age bracket of 35 to 50 years acount for 66.7% of all women with births.
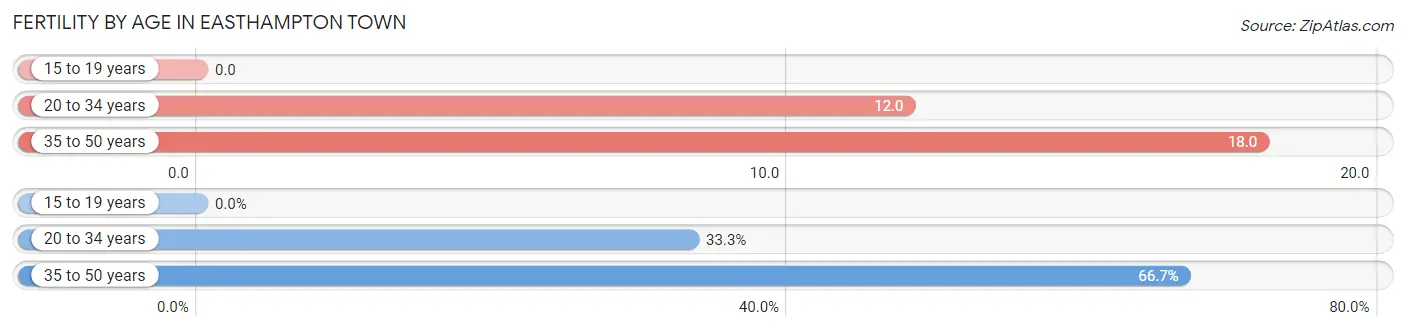
| Age Bracket | Women with Births | Births / 1,000 Women |
| 15 to 19 years | 0 (0.0%) | 0.0 |
| 20 to 34 years | 16 (33.3%) | 12.0 |
| 35 to 50 years | 32 (66.7%) | 18.0 |
| Total | 48 (100.0%) | 14.0 |
Fertility by Age by Marriage Status in Easthampton Town
68.8% of women with births (48) in Easthampton Town are married. The highest percentage of unmarried women with births falls into 35 to 50 years age bracket with 46.9% of them unmarried at the time of birth, while the lowest percentage of unmarried women with births belong to 20 to 34 years age bracket with 0.0% of them unmarried.
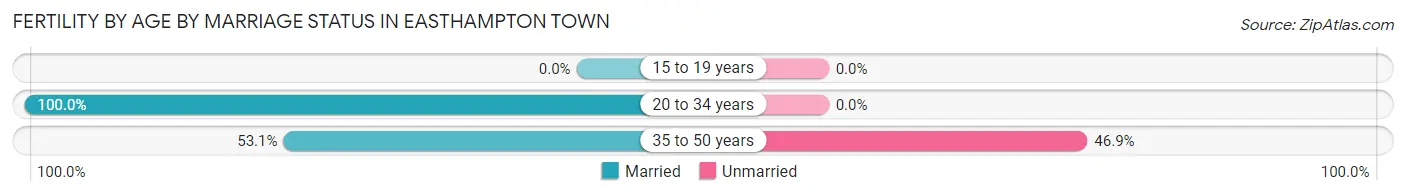
| Age Bracket | Married | Unmarried |
| 15 to 19 years | 0 (0.0%) | 0 (0.0%) |
| 20 to 34 years | 16 (100.0%) | 0 (0.0%) |
| 35 to 50 years | 17 (53.1%) | 15 (46.9%) |
| Total | 33 (68.8%) | 15 (31.2%) |
Fertility by Education in Easthampton Town
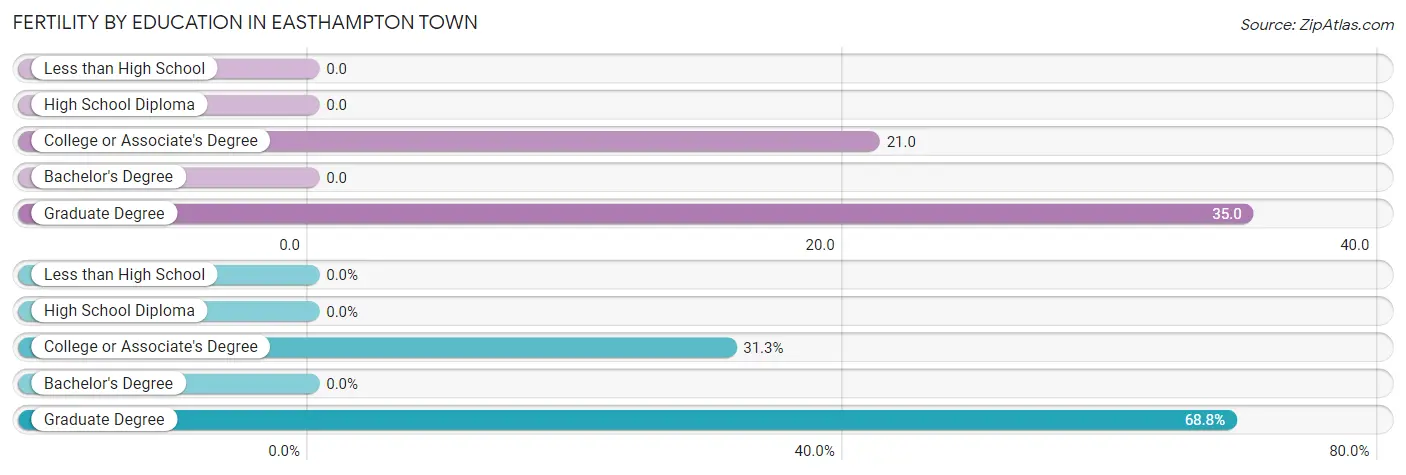
| Educational Attainment | Women with Births | Births / 1,000 Women |
| Less than High School | 0 (0.0%) | 0.0 |
| High School Diploma | 0 (0.0%) | 0.0 |
| College or Associate's Degree | 15 (31.2%) | 21.0 |
| Bachelor's Degree | 0 (0.0%) | 0.0 |
| Graduate Degree | 33 (68.8%) | 35.0 |
| Total | 48 (100.0%) | 14.0 |
Fertility by Education by Marriage Status in Easthampton Town
31.2% of women with births in Easthampton Town are unmarried. Women with the educational attainment of graduate degree are most likely to be married with 100.0% of them married at childbirth, while women with the educational attainment of college or associate's degree are least likely to be married with 100.0% of them unmarried at childbirth.
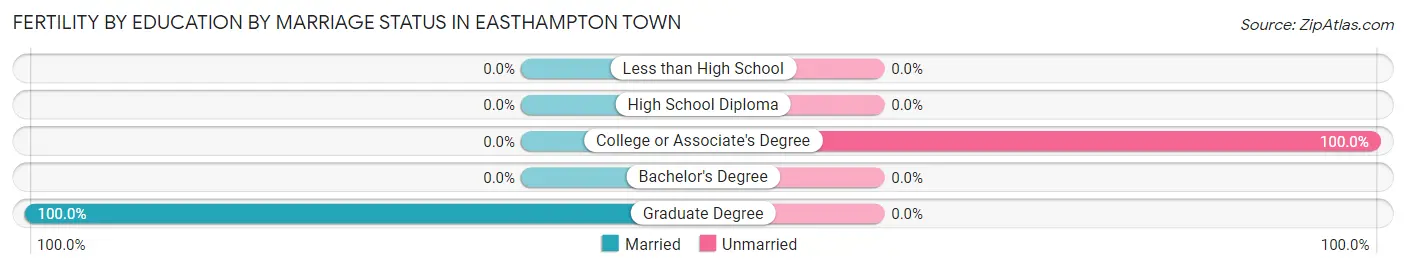
| Educational Attainment | Married | Unmarried |
| Less than High School | 0 (0.0%) | 0 (0.0%) |
| High School Diploma | 0 (0.0%) | 0 (0.0%) |
| College or Associate's Degree | 0 (0.0%) | 15 (100.0%) |
| Bachelor's Degree | 0 (0.0%) | 0 (0.0%) |
| Graduate Degree | 33 (100.0%) | 0 (0.0%) |
| Total | 33 (68.8%) | 15 (31.2%) |
Employment Characteristics in Easthampton Town
Employment by Class of Employer in Easthampton Town
Among the 8,005 employed individuals in Easthampton Town, private company employees (4,832 | 60.4%), not-for-profit organizations (1,093 | 13.7%), and local government employees (573 | 7.2%) make up the most common classes of employment.
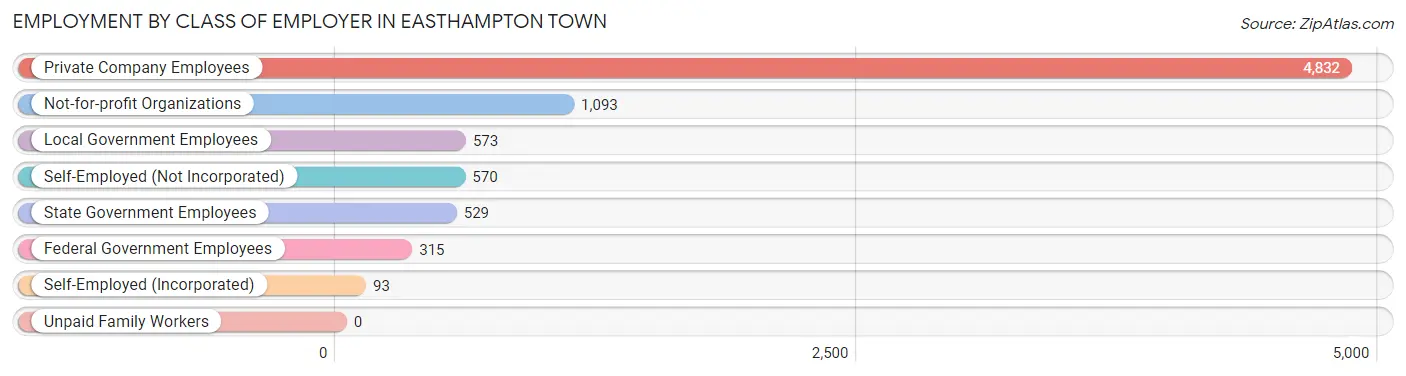
| Employer Class | # Employees | % Employees |
| Private Company Employees | 4,832 | 60.4% |
| Self-Employed (Incorporated) | 93 | 1.2% |
| Self-Employed (Not Incorporated) | 570 | 7.1% |
| Not-for-profit Organizations | 1,093 | 13.7% |
| Local Government Employees | 573 | 7.2% |
| State Government Employees | 529 | 6.6% |
| Federal Government Employees | 315 | 3.9% |
| Unpaid Family Workers | 0 | 0.0% |
| Total | 8,005 | 100.0% |
Employment Status by Age in Easthampton Town
According to the labor force statistics for Easthampton Town, out of the total population over 16 years of age (13,781), 62.0% or 8,544 individuals are in the labor force, with 5.4% or 461 of them unemployed. The age group with the highest labor force participation rate is 20 to 24 years, with 92.4% or 764 individuals in the labor force. Within the labor force, the 20 to 24 years age range has the highest percentage of unemployed individuals, with 12.6% or 96 of them being unemployed.
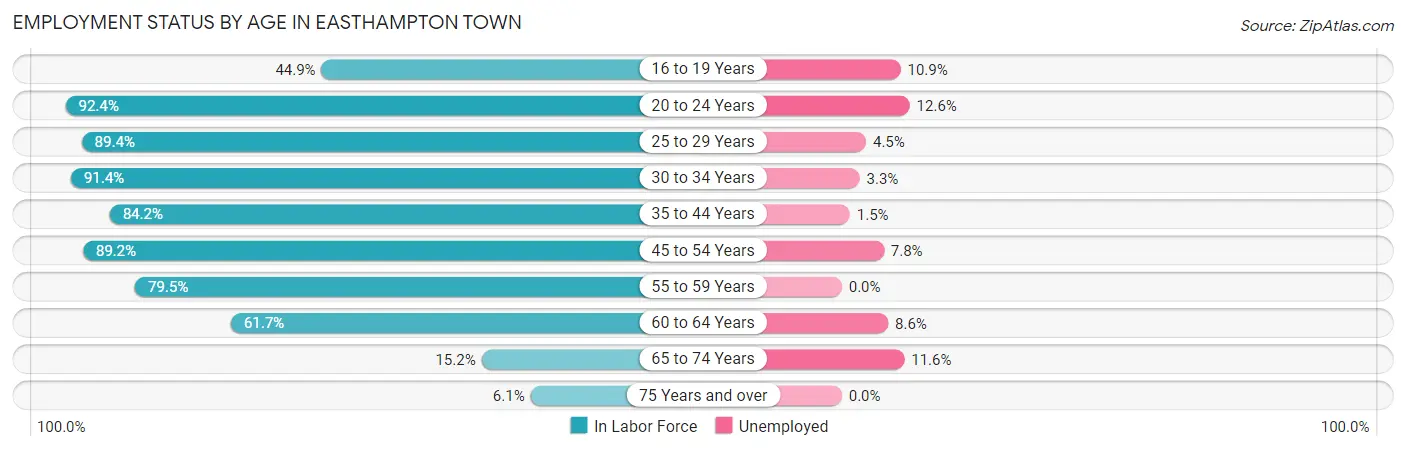
| Age Bracket | In Labor Force | Unemployed |
| 16 to 19 Years | 192 (44.9%) | 21 (10.9%) |
| 20 to 24 Years | 764 (92.4%) | 96 (12.6%) |
| 25 to 29 Years | 729 (89.4%) | 33 (4.5%) |
| 30 to 34 Years | 906 (91.4%) | 30 (3.3%) |
| 35 to 44 Years | 1,942 (84.2%) | 29 (1.5%) |
| 45 to 54 Years | 1,708 (89.2%) | 133 (7.8%) |
| 55 to 59 Years | 979 (79.5%) | 0 (0.0%) |
| 60 to 64 Years | 882 (61.7%) | 76 (8.6%) |
| 65 to 74 Years | 352 (15.2%) | 41 (11.6%) |
| 75 Years and over | 93 (6.1%) | 0 (0.0%) |
| Total | 8,544 (62.0%) | 461 (5.4%) |
Employment Status by Educational Attainment in Easthampton Town
According to labor force statistics for Easthampton Town, 82.3% of individuals (7,150) out of the total population between 25 and 64 years of age (8,688) are in the labor force, with 4.2% or 300 of them being unemployed. The group with the highest labor force participation rate are those with the educational attainment of bachelor's degree or higher, with 93.9% or 3,732 individuals in the labor force. Within the labor force, individuals with high school diploma education have the highest percentage of unemployment, with 6.4% or 102 of them being unemployed.
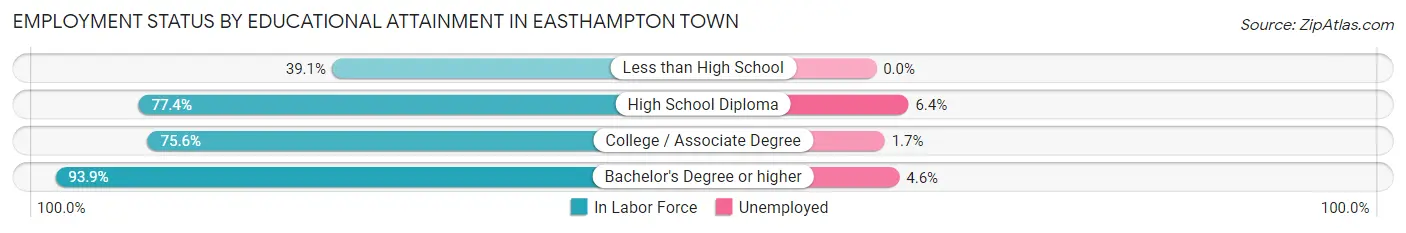
| Educational Attainment | In Labor Force | Unemployed |
| Less than High School | 201 (39.1%) | 0 (0.0%) |
| High School Diploma | 1,601 (77.4%) | 132 (6.4%) |
| College / Associate Degree | 1,611 (75.6%) | 36 (1.7%) |
| Bachelor's Degree or higher | 3,732 (93.9%) | 183 (4.6%) |
| Total | 7,150 (82.3%) | 365 (4.2%) |
Employment Occupations by Sex in Easthampton Town
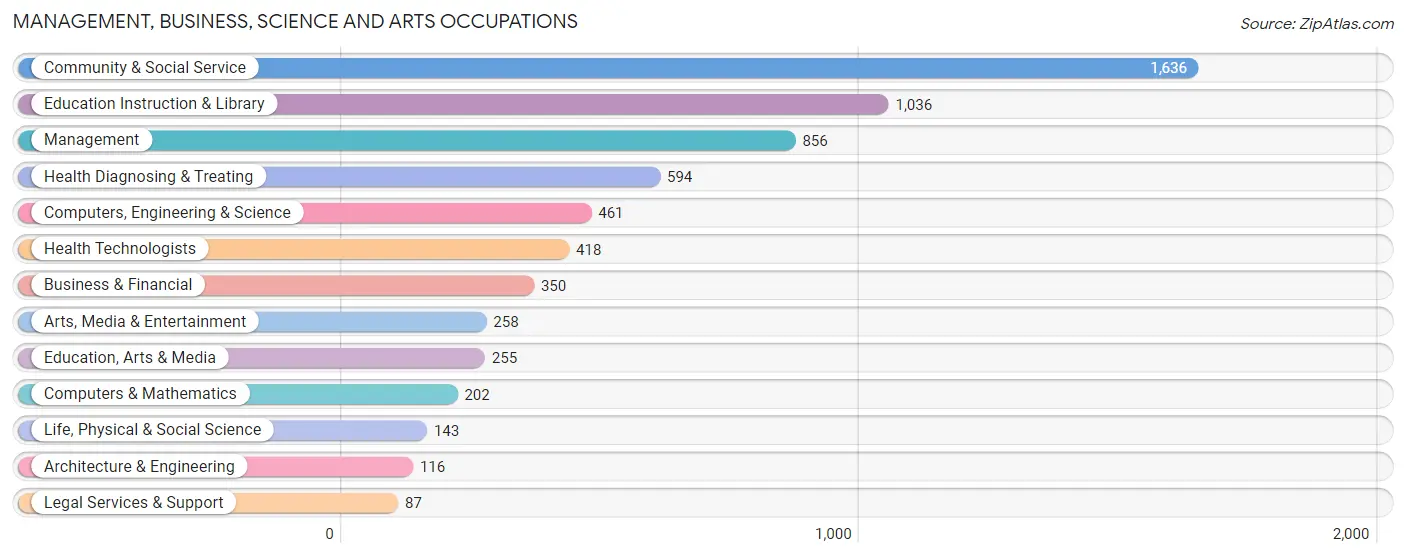
Management, Business, Science and Arts Occupations
The most common Management, Business, Science and Arts occupations in Easthampton Town are Community & Social Service (1,636 | 20.2%), Education Instruction & Library (1,036 | 12.8%), Management (856 | 10.6%), Health Diagnosing & Treating (594 | 7.3%), and Computers, Engineering & Science (461 | 5.7%).
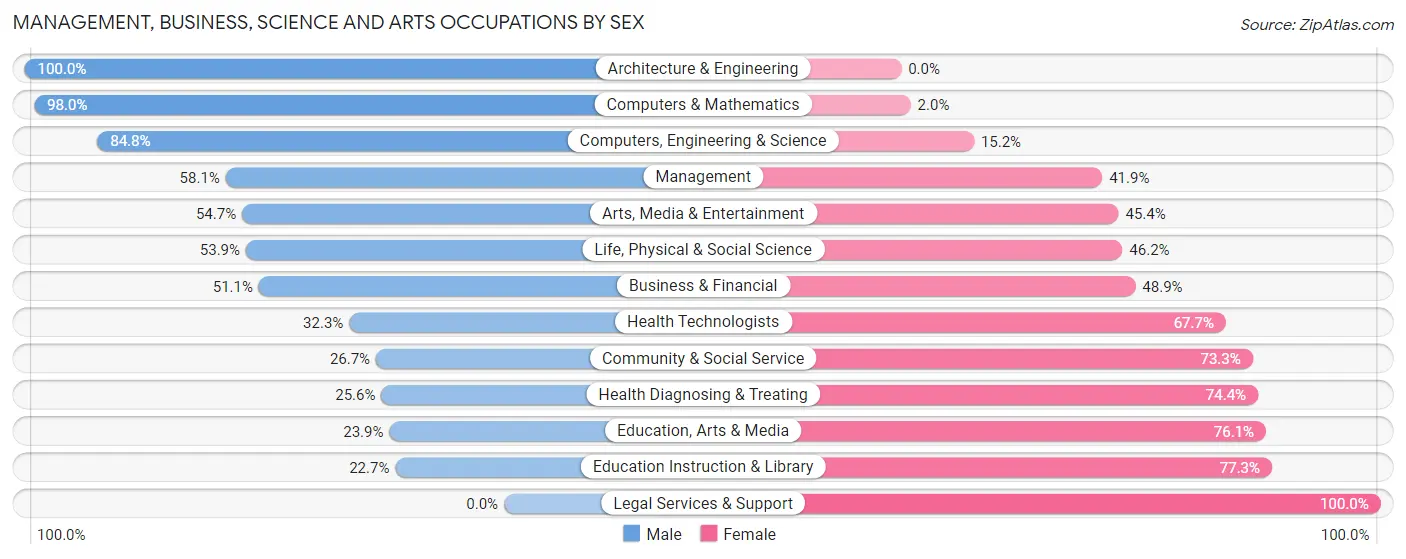
Management, Business, Science and Arts Occupations by Sex
Within the Management, Business, Science and Arts occupations in Easthampton Town, the most male-oriented occupations are Architecture & Engineering (100.0%), Computers & Mathematics (98.0%), and Computers, Engineering & Science (84.8%), while the most female-oriented occupations are Legal Services & Support (100.0%), Education Instruction & Library (77.3%), and Education, Arts & Media (76.1%).
| Occupation | Male | Female |
| Management | 497 (58.1%) | 359 (41.9%) |
| Business & Financial | 179 (51.1%) | 171 (48.9%) |
| Computers, Engineering & Science | 391 (84.8%) | 70 (15.2%) |
| Computers & Mathematics | 198 (98.0%) | 4 (2.0%) |
| Architecture & Engineering | 116 (100.0%) | 0 (0.0%) |
| Life, Physical & Social Science | 77 (53.8%) | 66 (46.2%) |
| Community & Social Service | 437 (26.7%) | 1,199 (73.3%) |
| Education, Arts & Media | 61 (23.9%) | 194 (76.1%) |
| Legal Services & Support | 0 (0.0%) | 87 (100.0%) |
| Education Instruction & Library | 235 (22.7%) | 801 (77.3%) |
| Arts, Media & Entertainment | 141 (54.6%) | 117 (45.4%) |
| Health Diagnosing & Treating | 152 (25.6%) | 442 (74.4%) |
| Health Technologists | 135 (32.3%) | 283 (67.7%) |
| Total (Category) | 1,656 (42.5%) | 2,241 (57.5%) |
| Total (Overall) | 3,844 (47.5%) | 4,245 (52.5%) |
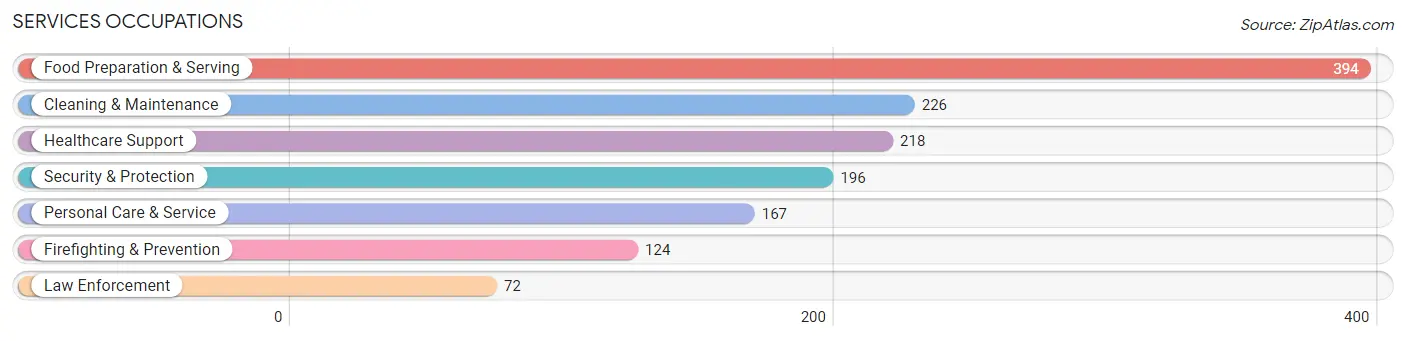
Services Occupations
The most common Services occupations in Easthampton Town are Food Preparation & Serving (394 | 4.9%), Cleaning & Maintenance (226 | 2.8%), Healthcare Support (218 | 2.7%), Security & Protection (196 | 2.4%), and Personal Care & Service (167 | 2.1%).
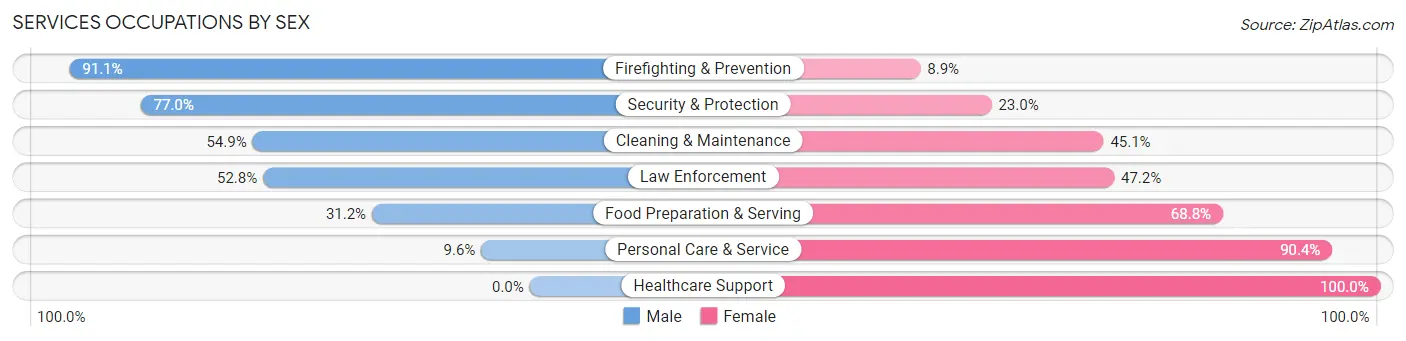
Services Occupations by Sex
Within the Services occupations in Easthampton Town, the most male-oriented occupations are Firefighting & Prevention (91.1%), Security & Protection (77.0%), and Cleaning & Maintenance (54.9%), while the most female-oriented occupations are Healthcare Support (100.0%), Personal Care & Service (90.4%), and Food Preparation & Serving (68.8%).
| Occupation | Male | Female |
| Healthcare Support | 0 (0.0%) | 218 (100.0%) |
| Security & Protection | 151 (77.0%) | 45 (23.0%) |
| Firefighting & Prevention | 113 (91.1%) | 11 (8.9%) |
| Law Enforcement | 38 (52.8%) | 34 (47.2%) |
| Food Preparation & Serving | 123 (31.2%) | 271 (68.8%) |
| Cleaning & Maintenance | 124 (54.9%) | 102 (45.1%) |
| Personal Care & Service | 16 (9.6%) | 151 (90.4%) |
| Total (Category) | 414 (34.5%) | 787 (65.5%) |
| Total (Overall) | 3,844 (47.5%) | 4,245 (52.5%) |
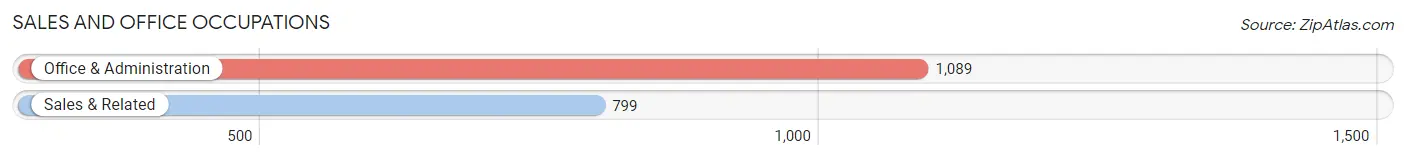
Sales and Office Occupations
The most common Sales and Office occupations in Easthampton Town are Office & Administration (1,089 | 13.5%), and Sales & Related (799 | 9.9%).
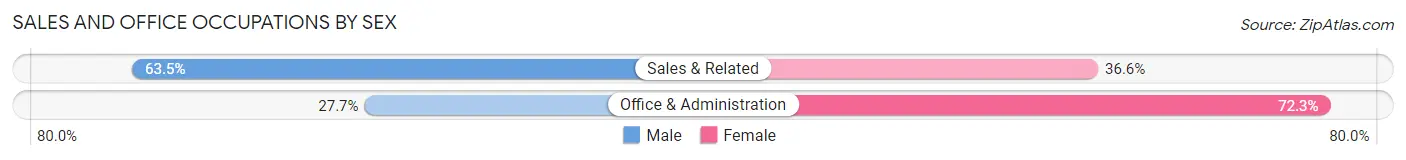
Sales and Office Occupations by Sex
| Occupation | Male | Female |
| Sales & Related | 507 (63.4%) | 292 (36.5%) |
| Office & Administration | 302 (27.7%) | 787 (72.3%) |
| Total (Category) | 809 (42.8%) | 1,079 (57.2%) |
| Total (Overall) | 3,844 (47.5%) | 4,245 (52.5%) |
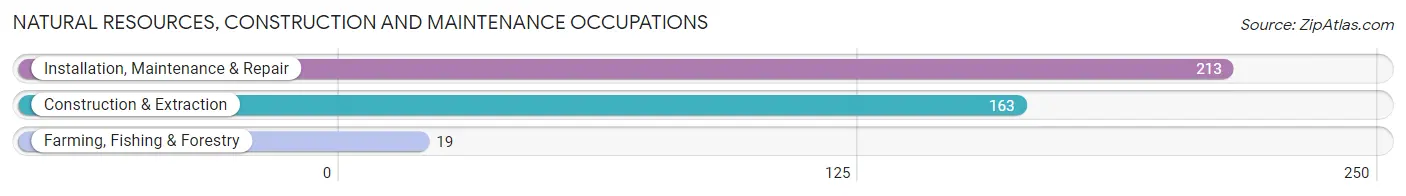
Natural Resources, Construction and Maintenance Occupations
The most common Natural Resources, Construction and Maintenance occupations in Easthampton Town are Installation, Maintenance & Repair (213 | 2.6%), Construction & Extraction (163 | 2.0%), and Farming, Fishing & Forestry (19 | 0.2%).
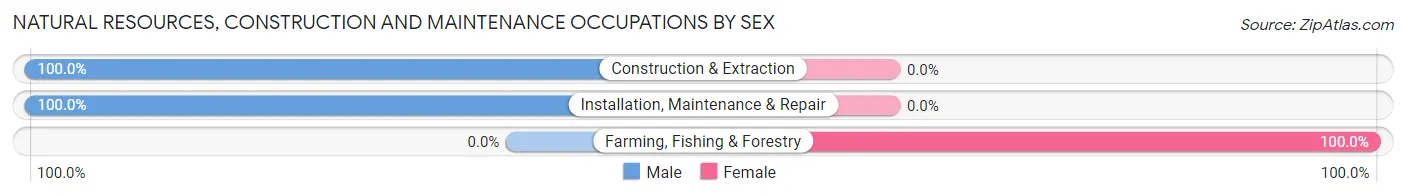
Natural Resources, Construction and Maintenance Occupations by Sex
| Occupation | Male | Female |
| Farming, Fishing & Forestry | 0 (0.0%) | 19 (100.0%) |
| Construction & Extraction | 163 (100.0%) | 0 (0.0%) |
| Installation, Maintenance & Repair | 213 (100.0%) | 0 (0.0%) |
| Total (Category) | 376 (95.2%) | 19 (4.8%) |
| Total (Overall) | 3,844 (47.5%) | 4,245 (52.5%) |
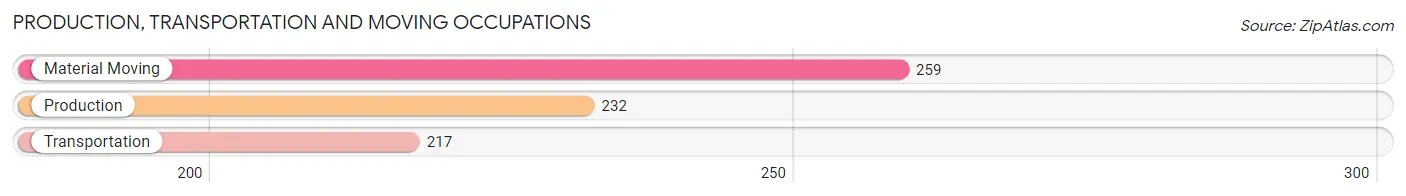
Production, Transportation and Moving Occupations
The most common Production, Transportation and Moving occupations in Easthampton Town are Material Moving (259 | 3.2%), Production (232 | 2.9%), and Transportation (217 | 2.7%).
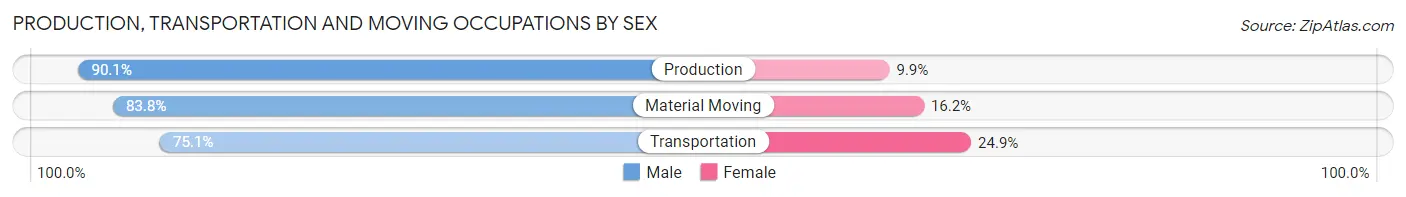
Production, Transportation and Moving Occupations by Sex
| Occupation | Male | Female |
| Production | 209 (90.1%) | 23 (9.9%) |
| Transportation | 163 (75.1%) | 54 (24.9%) |
| Material Moving | 217 (83.8%) | 42 (16.2%) |
| Total (Category) | 589 (83.2%) | 119 (16.8%) |
| Total (Overall) | 3,844 (47.5%) | 4,245 (52.5%) |
Employment Industries by Sex in Easthampton Town
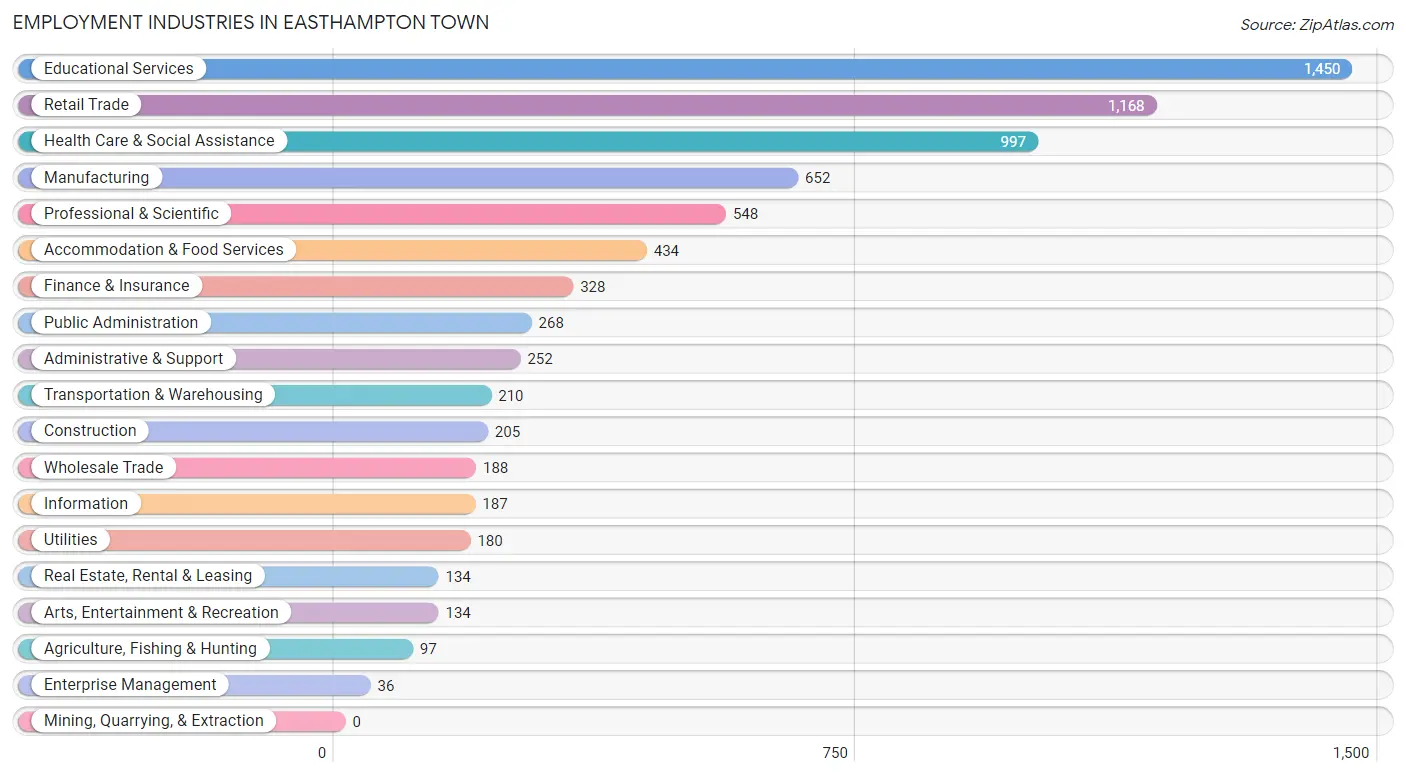
Employment Industries in Easthampton Town
The major employment industries in Easthampton Town include Educational Services (1,450 | 17.9%), Retail Trade (1,168 | 14.4%), Health Care & Social Assistance (997 | 12.3%), Manufacturing (652 | 8.1%), and Professional & Scientific (548 | 6.8%).
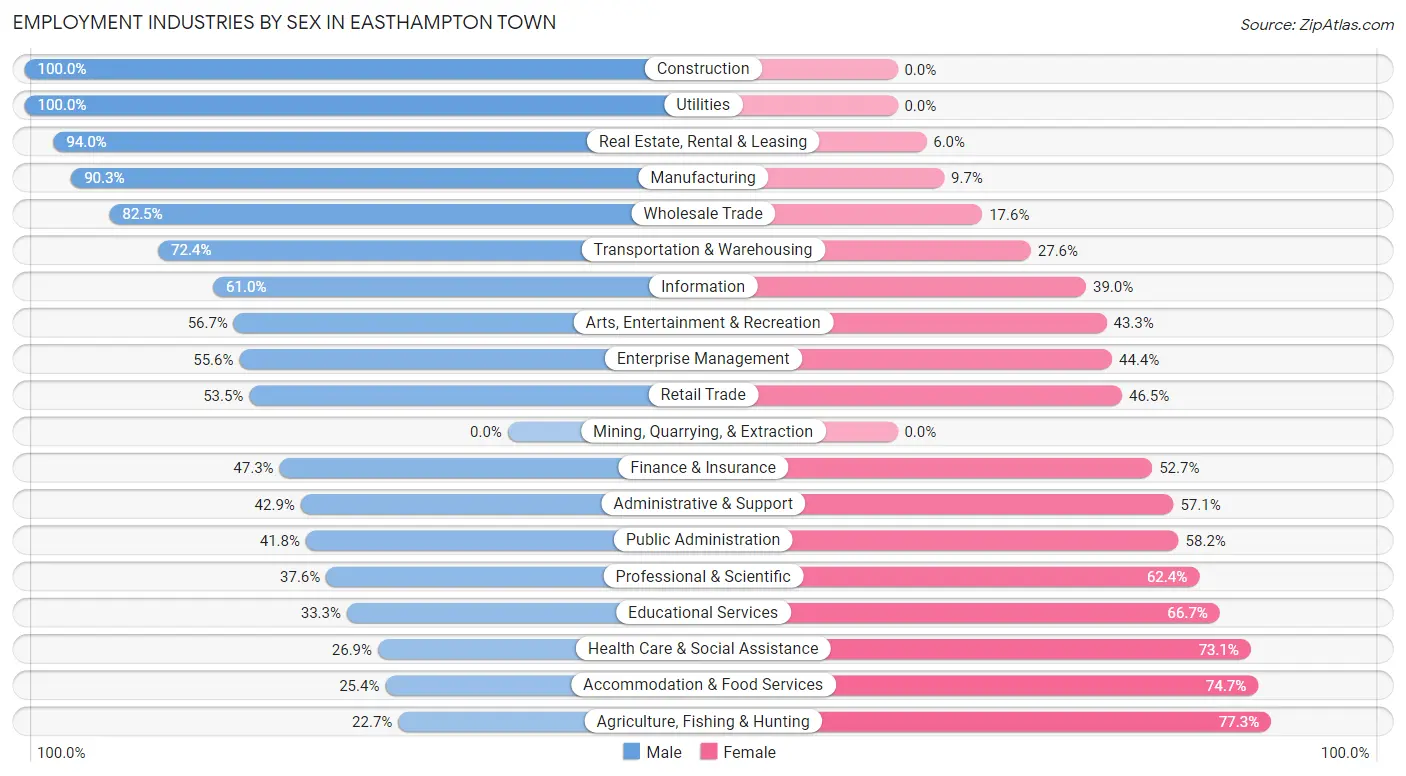
Employment Industries by Sex in Easthampton Town
The Easthampton Town industries that see more men than women are Construction (100.0%), Utilities (100.0%), and Real Estate, Rental & Leasing (94.0%), whereas the industries that tend to have a higher number of women are Agriculture, Fishing & Hunting (77.3%), Accommodation & Food Services (74.7%), and Health Care & Social Assistance (73.1%).
| Industry | Male | Female |
| Agriculture, Fishing & Hunting | 22 (22.7%) | 75 (77.3%) |
| Mining, Quarrying, & Extraction | 0 (0.0%) | 0 (0.0%) |
| Construction | 205 (100.0%) | 0 (0.0%) |
| Manufacturing | 589 (90.3%) | 63 (9.7%) |
| Wholesale Trade | 155 (82.5%) | 33 (17.5%) |
| Retail Trade | 625 (53.5%) | 543 (46.5%) |
| Transportation & Warehousing | 152 (72.4%) | 58 (27.6%) |
| Utilities | 180 (100.0%) | 0 (0.0%) |
| Information | 114 (61.0%) | 73 (39.0%) |
| Finance & Insurance | 155 (47.3%) | 173 (52.7%) |
| Real Estate, Rental & Leasing | 126 (94.0%) | 8 (6.0%) |
| Professional & Scientific | 206 (37.6%) | 342 (62.4%) |
| Enterprise Management | 20 (55.6%) | 16 (44.4%) |
| Administrative & Support | 108 (42.9%) | 144 (57.1%) |
| Educational Services | 483 (33.3%) | 967 (66.7%) |
| Health Care & Social Assistance | 268 (26.9%) | 729 (73.1%) |
| Arts, Entertainment & Recreation | 76 (56.7%) | 58 (43.3%) |
| Accommodation & Food Services | 110 (25.4%) | 324 (74.7%) |
| Public Administration | 112 (41.8%) | 156 (58.2%) |
| Total | 3,844 (47.5%) | 4,245 (52.5%) |
Education in Easthampton Town
School Enrollment in Easthampton Town
The most common levels of schooling among the 2,872 students in Easthampton Town are middle school (735 | 25.6%), elementary school (697 | 24.3%), and high school (621 | 21.6%).
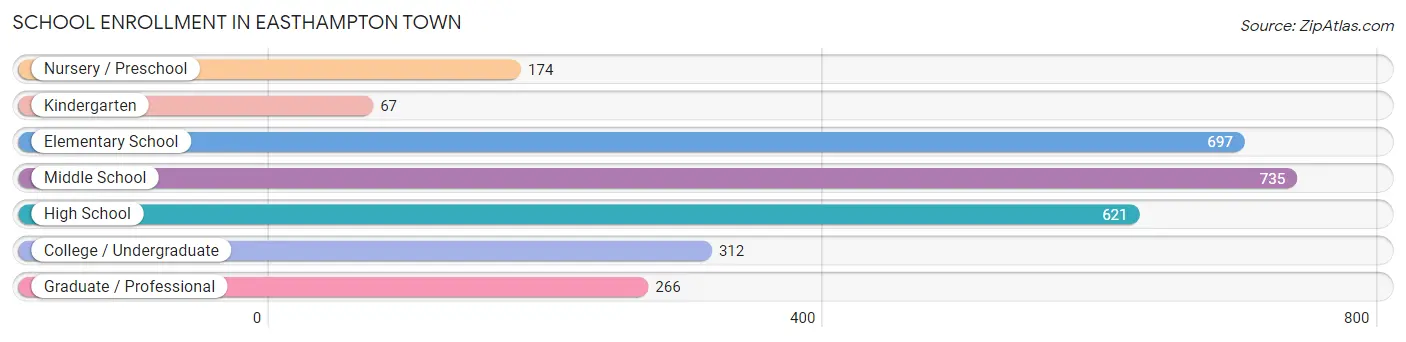
| School Level | # Students | % Students |
| Nursery / Preschool | 174 | 6.1% |
| Kindergarten | 67 | 2.3% |
| Elementary School | 697 | 24.3% |
| Middle School | 735 | 25.6% |
| High School | 621 | 21.6% |
| College / Undergraduate | 312 | 10.9% |
| Graduate / Professional | 266 | 9.3% |
| Total | 2,872 | 100.0% |
School Enrollment by Age by Funding Source in Easthampton Town
Out of a total of 2,872 students who are enrolled in schools in Easthampton Town, 445 (15.5%) attend a private institution, while the remaining 2,427 (84.5%) are enrolled in public schools. The age group of 3 to 4 year olds has the highest likelihood of being enrolled in private schools, with 55 (47.4% in the age bracket) enrolled. Conversely, the age group of 10 to 14 year olds has the lowest likelihood of being enrolled in a private school, with 932 (95.9% in the age bracket) attending a public institution.
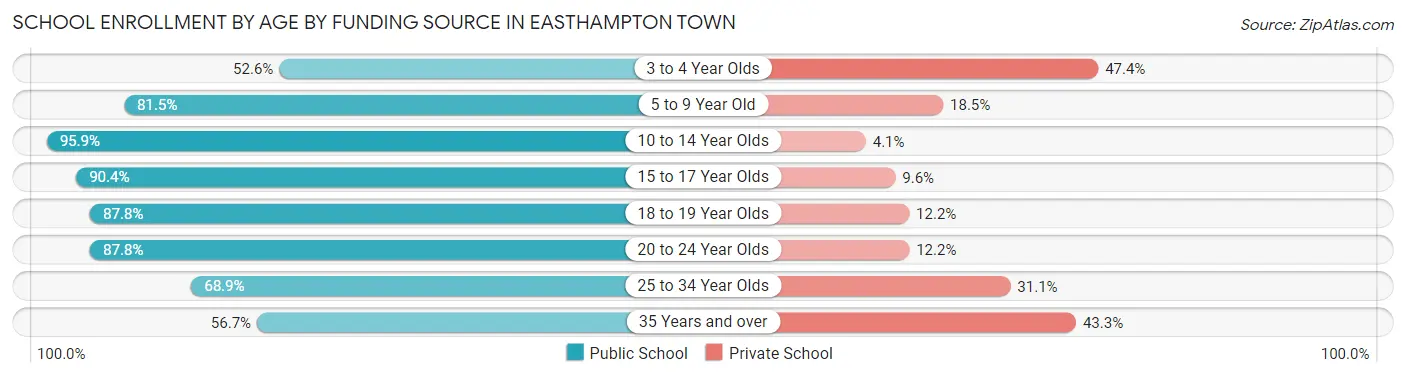
| Age Bracket | Public School | Private School |
| 3 to 4 Year Olds | 61 (52.6%) | 55 (47.4%) |
| 5 to 9 Year Old | 528 (81.5%) | 120 (18.5%) |
| 10 to 14 Year Olds | 932 (95.9%) | 40 (4.1%) |
| 15 to 17 Year Olds | 404 (90.4%) | 43 (9.6%) |
| 18 to 19 Year Olds | 108 (87.8%) | 15 (12.2%) |
| 20 to 24 Year Olds | 115 (87.8%) | 16 (12.2%) |
| 25 to 34 Year Olds | 182 (68.9%) | 82 (31.1%) |
| 35 Years and over | 97 (56.7%) | 74 (43.3%) |
| Total | 2,427 (84.5%) | 445 (15.5%) |
Educational Attainment by Field of Study in Easthampton Town
Visual & performing arts (620 | 11.8%), social sciences (618 | 11.7%), bio, nature & agricultural (554 | 10.5%), psychology (535 | 10.2%), and business (472 | 9.0%) are the most common fields of study among 5,265 individuals in Easthampton Town who have obtained a bachelor's degree or higher.
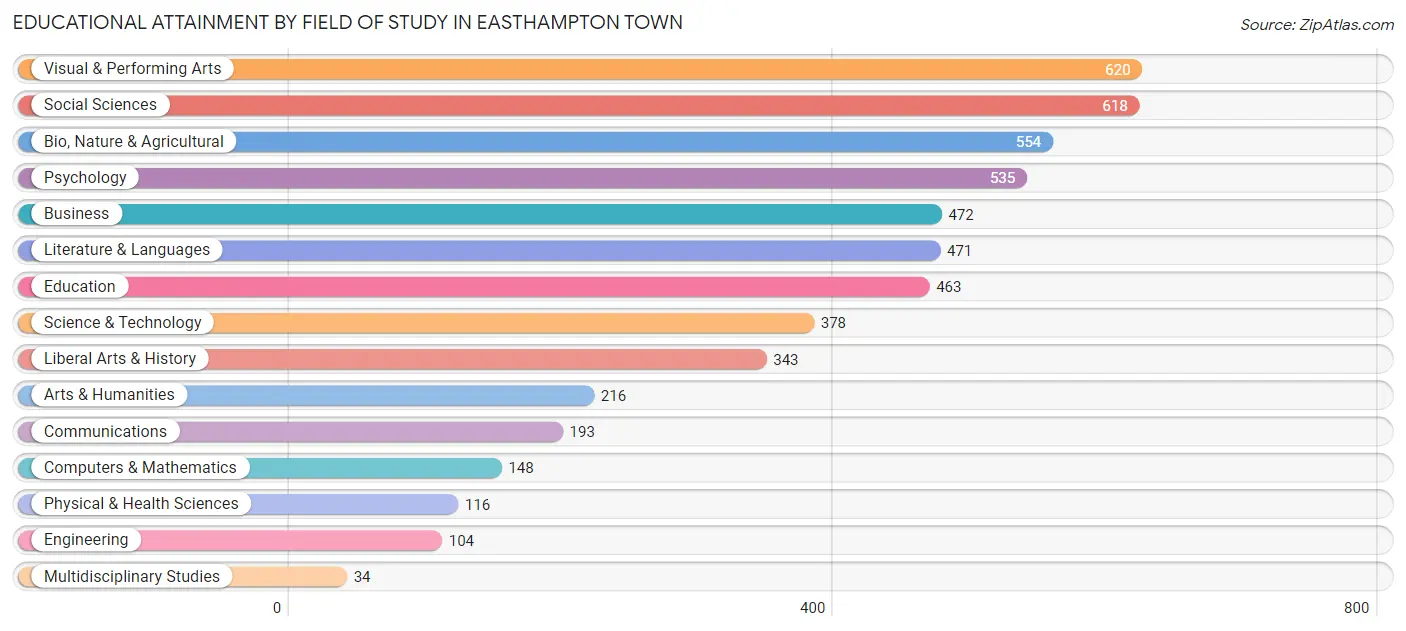
| Field of Study | # Graduates | % Graduates |
| Computers & Mathematics | 148 | 2.8% |
| Bio, Nature & Agricultural | 554 | 10.5% |
| Physical & Health Sciences | 116 | 2.2% |
| Psychology | 535 | 10.2% |
| Social Sciences | 618 | 11.7% |
| Engineering | 104 | 2.0% |
| Multidisciplinary Studies | 34 | 0.6% |
| Science & Technology | 378 | 7.2% |
| Business | 472 | 9.0% |
| Education | 463 | 8.8% |
| Literature & Languages | 471 | 8.9% |
| Liberal Arts & History | 343 | 6.5% |
| Visual & Performing Arts | 620 | 11.8% |
| Communications | 193 | 3.7% |
| Arts & Humanities | 216 | 4.1% |
| Total | 5,265 | 100.0% |
Transportation & Commute in Easthampton Town
Vehicle Availability by Sex in Easthampton Town
The most prevalent vehicle ownership categories in Easthampton Town are males with 2 vehicles (2,013, accounting for 53.2%) and females with 2 vehicles (2,349, making up 48.5%).
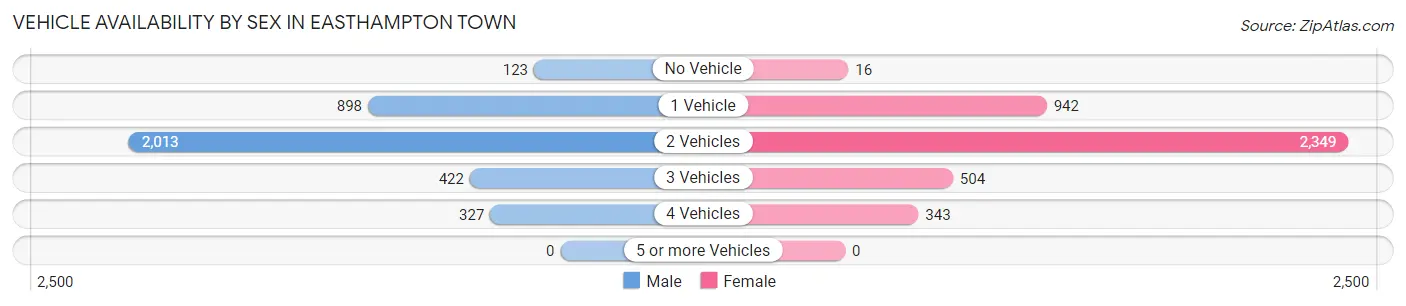
| Vehicles Available | Male | Female |
| No Vehicle | 123 (3.3%) | 16 (0.4%) |
| 1 Vehicle | 898 (23.7%) | 942 (22.7%) |
| 2 Vehicles | 2,013 (53.2%) | 2,349 (56.6%) |
| 3 Vehicles | 422 (11.2%) | 504 (12.1%) |
| 4 Vehicles | 327 (8.6%) | 343 (8.3%) |
| 5 or more Vehicles | 0 (0.0%) | 0 (0.0%) |
| Total | 3,783 (100.0%) | 4,154 (100.0%) |
Commute Time in Easthampton Town
The most frequently occuring commute durations in Easthampton Town are 15 to 19 minutes (1,374 commuters, 19.5%), 20 to 24 minutes (1,118 commuters, 15.8%), and 30 to 34 minutes (1,084 commuters, 15.4%).
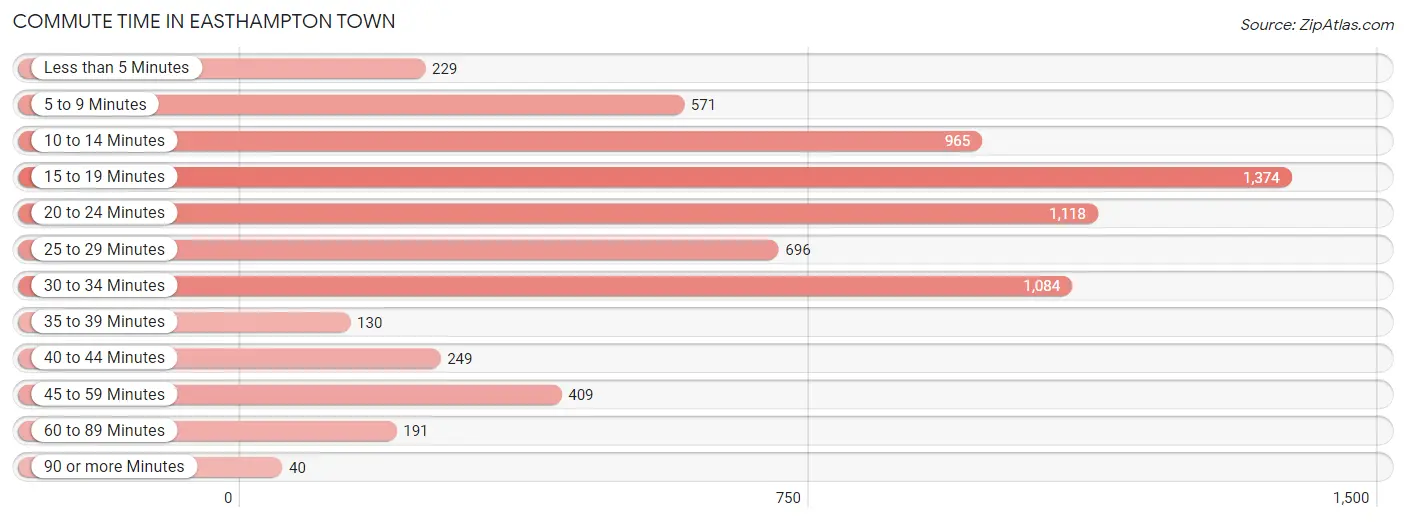
| Commute Time | # Commuters | % Commuters |
| Less than 5 Minutes | 229 | 3.3% |
| 5 to 9 Minutes | 571 | 8.1% |
| 10 to 14 Minutes | 965 | 13.7% |
| 15 to 19 Minutes | 1,374 | 19.5% |
| 20 to 24 Minutes | 1,118 | 15.8% |
| 25 to 29 Minutes | 696 | 9.9% |
| 30 to 34 Minutes | 1,084 | 15.4% |
| 35 to 39 Minutes | 130 | 1.8% |
| 40 to 44 Minutes | 249 | 3.5% |
| 45 to 59 Minutes | 409 | 5.8% |
| 60 to 89 Minutes | 191 | 2.7% |
| 90 or more Minutes | 40 | 0.6% |
Commute Time by Sex in Easthampton Town
The most common commute times in Easthampton Town are 15 to 19 minutes (649 commuters, 19.5%) for males and 15 to 19 minutes (725 commuters, 19.5%) for females.
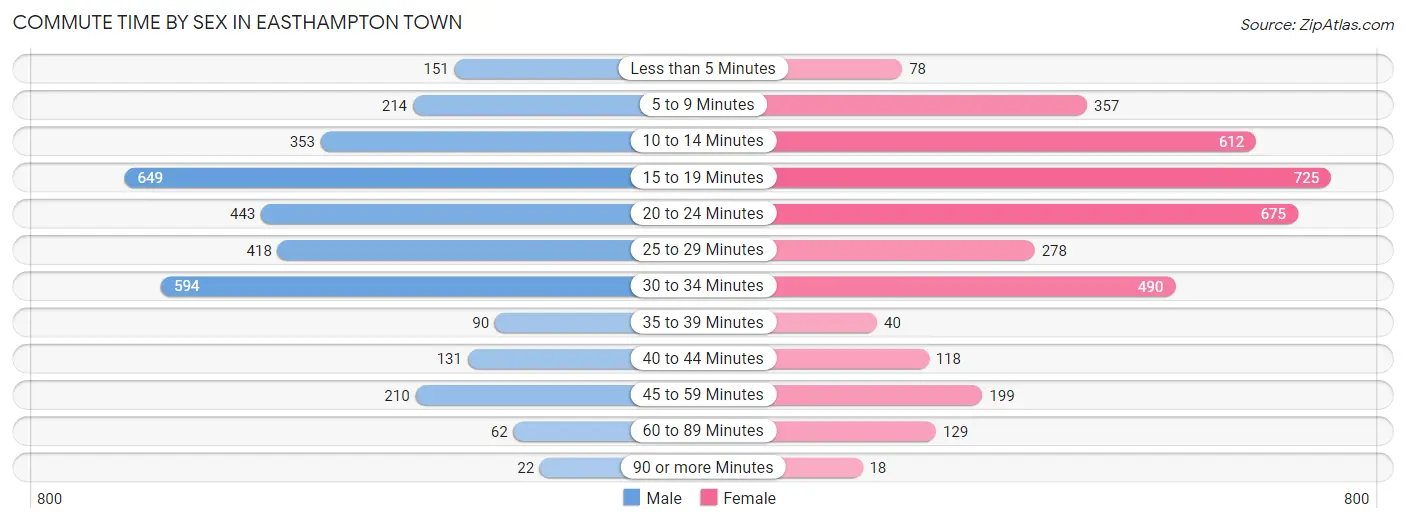
| Commute Time | Male | Female |
| Less than 5 Minutes | 151 (4.5%) | 78 (2.1%) |
| 5 to 9 Minutes | 214 (6.4%) | 357 (9.6%) |
| 10 to 14 Minutes | 353 (10.6%) | 612 (16.5%) |
| 15 to 19 Minutes | 649 (19.5%) | 725 (19.5%) |
| 20 to 24 Minutes | 443 (13.3%) | 675 (18.1%) |
| 25 to 29 Minutes | 418 (12.5%) | 278 (7.5%) |
| 30 to 34 Minutes | 594 (17.8%) | 490 (13.2%) |
| 35 to 39 Minutes | 90 (2.7%) | 40 (1.1%) |
| 40 to 44 Minutes | 131 (3.9%) | 118 (3.2%) |
| 45 to 59 Minutes | 210 (6.3%) | 199 (5.3%) |
| 60 to 89 Minutes | 62 (1.9%) | 129 (3.5%) |
| 90 or more Minutes | 22 (0.7%) | 18 (0.5%) |
Time of Departure to Work by Sex in Easthampton Town
The most frequent times of departure to work in Easthampton Town are 6:30 AM to 6:59 AM (455, 13.6%) for males and 8:30 AM to 8:59 AM (813, 21.9%) for females.
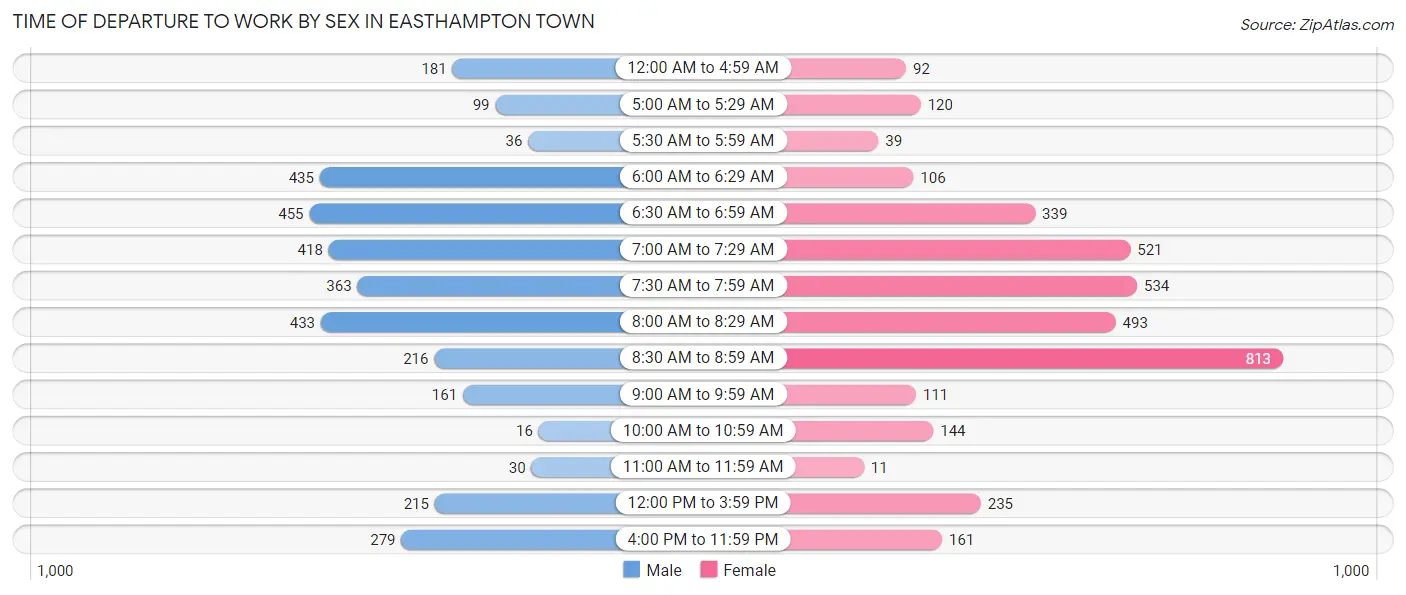
| Time of Departure | Male | Female |
| 12:00 AM to 4:59 AM | 181 (5.4%) | 92 (2.5%) |
| 5:00 AM to 5:29 AM | 99 (3.0%) | 120 (3.2%) |
| 5:30 AM to 5:59 AM | 36 (1.1%) | 39 (1.1%) |
| 6:00 AM to 6:29 AM | 435 (13.0%) | 106 (2.9%) |
| 6:30 AM to 6:59 AM | 455 (13.6%) | 339 (9.1%) |
| 7:00 AM to 7:29 AM | 418 (12.5%) | 521 (14.0%) |
| 7:30 AM to 7:59 AM | 363 (10.9%) | 534 (14.4%) |
| 8:00 AM to 8:29 AM | 433 (13.0%) | 493 (13.3%) |
| 8:30 AM to 8:59 AM | 216 (6.5%) | 813 (21.9%) |
| 9:00 AM to 9:59 AM | 161 (4.8%) | 111 (3.0%) |
| 10:00 AM to 10:59 AM | 16 (0.5%) | 144 (3.9%) |
| 11:00 AM to 11:59 AM | 30 (0.9%) | 11 (0.3%) |
| 12:00 PM to 3:59 PM | 215 (6.4%) | 235 (6.3%) |
| 4:00 PM to 11:59 PM | 279 (8.4%) | 161 (4.3%) |
| Total | 3,337 (100.0%) | 3,719 (100.0%) |
Housing Occupancy in Easthampton Town
Occupancy by Ownership in Easthampton Town
Of the total 7,935 dwellings in Easthampton Town, owner-occupied units account for 4,818 (60.7%), while renter-occupied units make up 3,117 (39.3%).
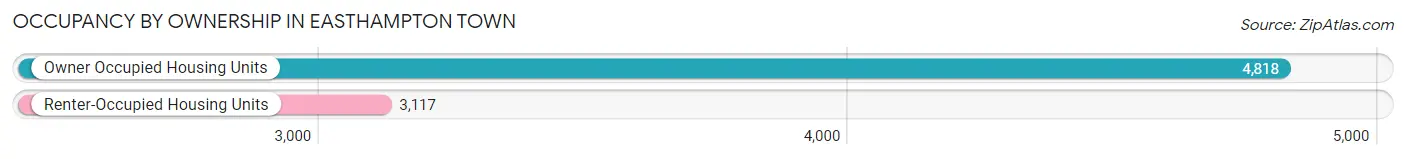
| Occupancy | # Housing Units | % Housing Units |
| Owner Occupied Housing Units | 4,818 | 60.7% |
| Renter-Occupied Housing Units | 3,117 | 39.3% |
| Total Occupied Housing Units | 7,935 | 100.0% |
Occupancy by Household Size in Easthampton Town
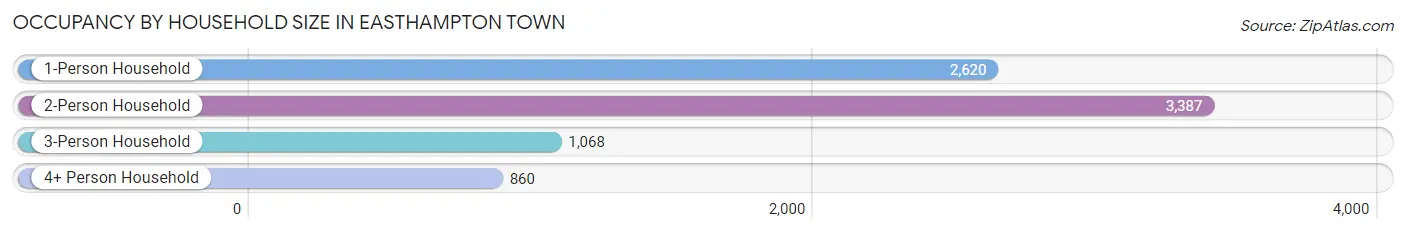
| Household Size | # Housing Units | % Housing Units |
| 1-Person Household | 2,620 | 33.0% |
| 2-Person Household | 3,387 | 42.7% |
| 3-Person Household | 1,068 | 13.5% |
| 4+ Person Household | 860 | 10.8% |
| Total Housing Units | 7,935 | 100.0% |
Occupancy by Ownership by Household Size in Easthampton Town
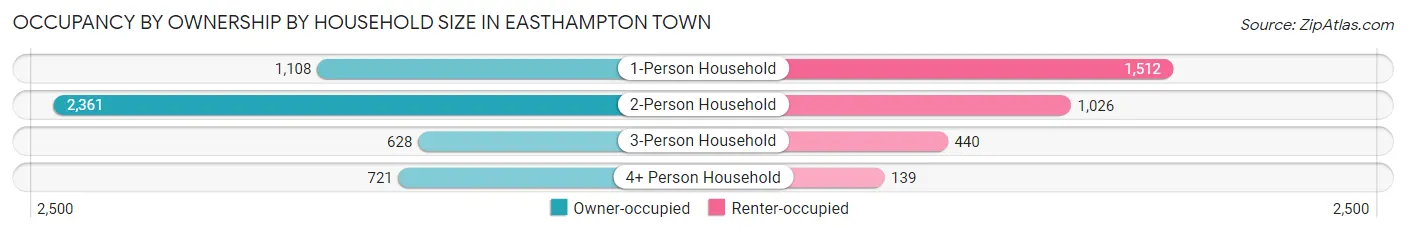
| Household Size | Owner-occupied | Renter-occupied |
| 1-Person Household | 1,108 (42.3%) | 1,512 (57.7%) |
| 2-Person Household | 2,361 (69.7%) | 1,026 (30.3%) |
| 3-Person Household | 628 (58.8%) | 440 (41.2%) |
| 4+ Person Household | 721 (83.8%) | 139 (16.2%) |
| Total Housing Units | 4,818 (60.7%) | 3,117 (39.3%) |
Occupancy by Educational Attainment in Easthampton Town
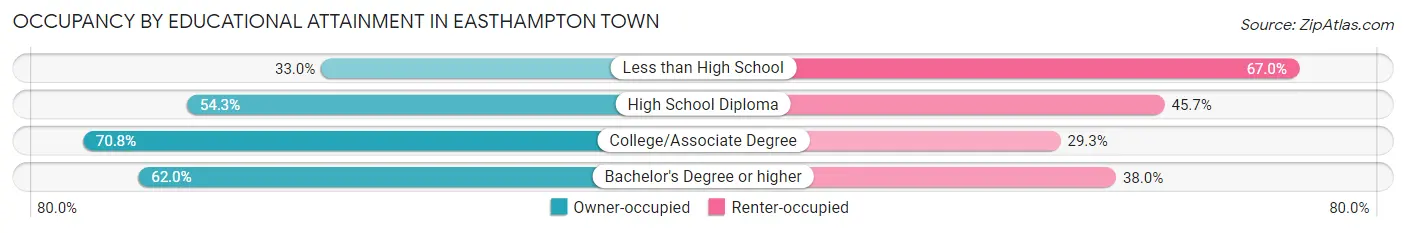
| Household Size | Owner-occupied | Renter-occupied |
| Less than High School | 155 (33.0%) | 315 (67.0%) |
| High School Diploma | 1,045 (54.3%) | 881 (45.7%) |
| College/Associate Degree | 1,497 (70.8%) | 619 (29.2%) |
| Bachelor's Degree or higher | 2,121 (62.0%) | 1,302 (38.0%) |
Occupancy by Age of Householder in Easthampton Town
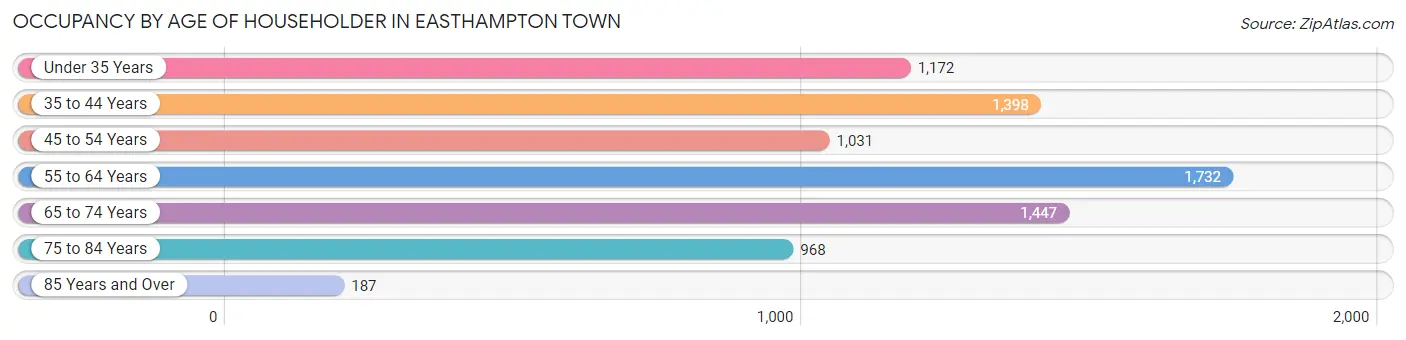
| Age Bracket | # Households | % Households |
| Under 35 Years | 1,172 | 14.8% |
| 35 to 44 Years | 1,398 | 17.6% |
| 45 to 54 Years | 1,031 | 13.0% |
| 55 to 64 Years | 1,732 | 21.8% |
| 65 to 74 Years | 1,447 | 18.2% |
| 75 to 84 Years | 968 | 12.2% |
| 85 Years and Over | 187 | 2.4% |
| Total | 7,935 | 100.0% |
Housing Finances in Easthampton Town
Median Income by Occupancy in Easthampton Town
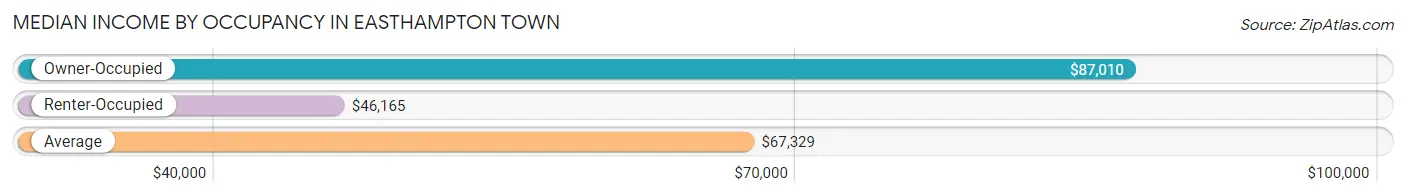
| Occupancy Type | # Households | Median Income |
| Owner-Occupied | 4,818 (60.7%) | $87,010 |
| Renter-Occupied | 3,117 (39.3%) | $46,165 |
| Average | 7,935 (100.0%) | $67,329 |
Occupancy by Householder Income Bracket in Easthampton Town
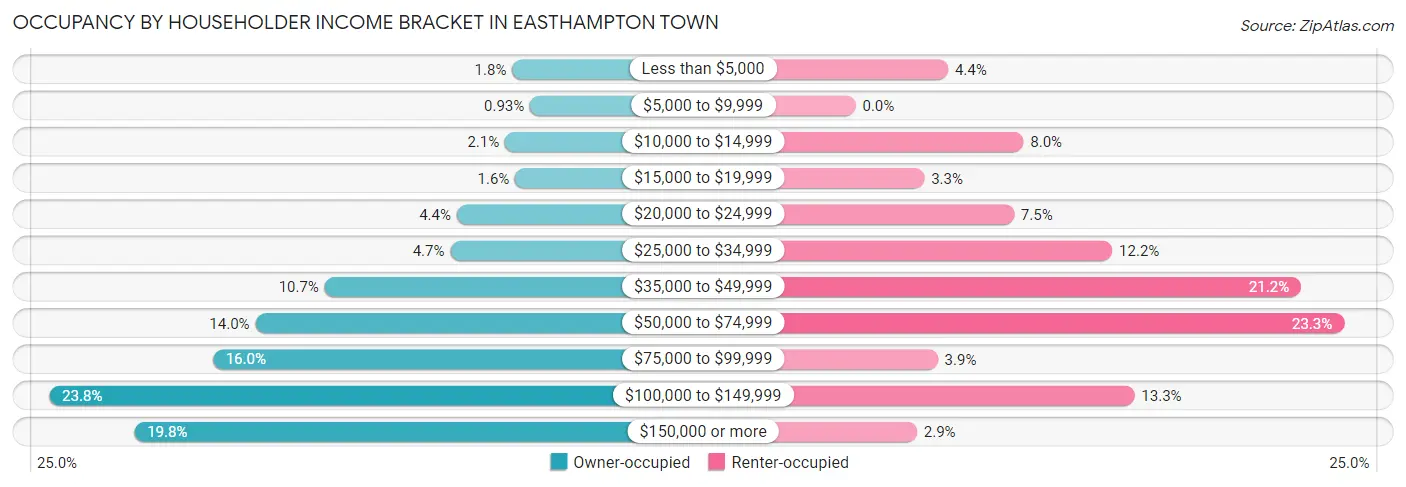
| Income Bracket | Owner-occupied | Renter-occupied |
| Less than $5,000 | 86 (1.8%) | 137 (4.4%) |
| $5,000 to $9,999 | 45 (0.9%) | 0 (0.0%) |
| $10,000 to $14,999 | 102 (2.1%) | 249 (8.0%) |
| $15,000 to $19,999 | 79 (1.6%) | 102 (3.3%) |
| $20,000 to $24,999 | 213 (4.4%) | 235 (7.5%) |
| $25,000 to $34,999 | 228 (4.7%) | 381 (12.2%) |
| $35,000 to $49,999 | 516 (10.7%) | 661 (21.2%) |
| $50,000 to $74,999 | 675 (14.0%) | 725 (23.3%) |
| $75,000 to $99,999 | 773 (16.0%) | 122 (3.9%) |
| $100,000 to $149,999 | 1,148 (23.8%) | 414 (13.3%) |
| $150,000 or more | 953 (19.8%) | 91 (2.9%) |
| Total | 4,818 (100.0%) | 3,117 (100.0%) |
Monthly Housing Cost Tiers in Easthampton Town
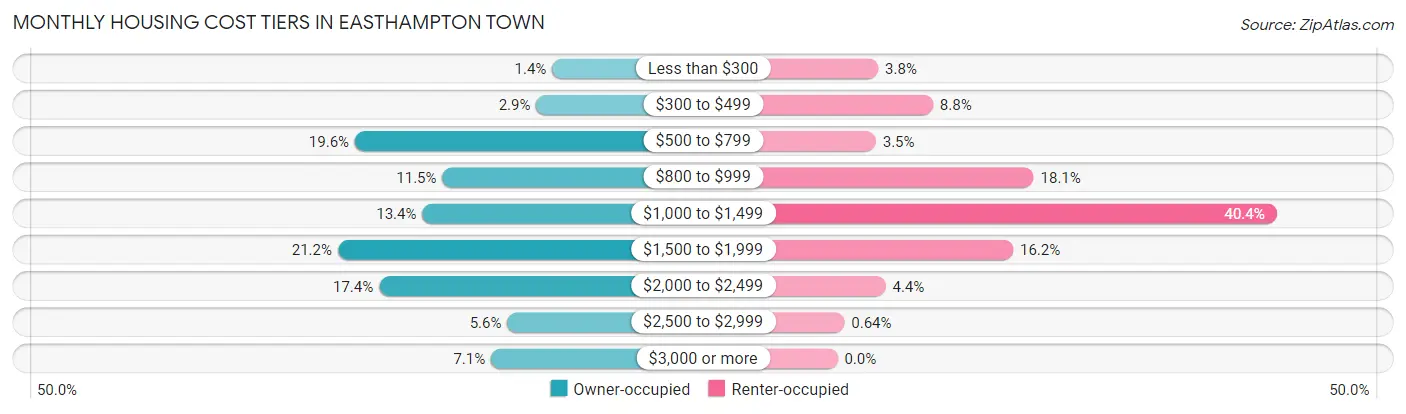
| Monthly Cost | Owner-occupied | Renter-occupied |
| Less than $300 | 69 (1.4%) | 117 (3.7%) |
| $300 to $499 | 139 (2.9%) | 274 (8.8%) |
| $500 to $799 | 944 (19.6%) | 110 (3.5%) |
| $800 to $999 | 556 (11.5%) | 563 (18.1%) |
| $1,000 to $1,499 | 645 (13.4%) | 1,260 (40.4%) |
| $1,500 to $1,999 | 1,020 (21.2%) | 504 (16.2%) |
| $2,000 to $2,499 | 837 (17.4%) | 138 (4.4%) |
| $2,500 to $2,999 | 268 (5.6%) | 20 (0.6%) |
| $3,000 or more | 340 (7.1%) | 0 (0.0%) |
| Total | 4,818 (100.0%) | 3,117 (100.0%) |
Physical Housing Characteristics in Easthampton Town
Housing Structures in Easthampton Town
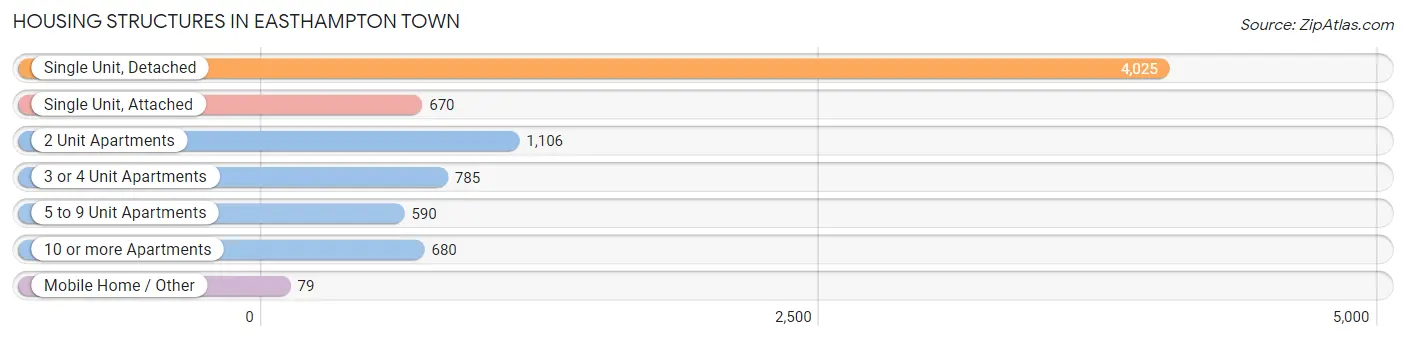
| Structure Type | # Housing Units | % Housing Units |
| Single Unit, Detached | 4,025 | 50.7% |
| Single Unit, Attached | 670 | 8.4% |
| 2 Unit Apartments | 1,106 | 13.9% |
| 3 or 4 Unit Apartments | 785 | 9.9% |
| 5 to 9 Unit Apartments | 590 | 7.4% |
| 10 or more Apartments | 680 | 8.6% |
| Mobile Home / Other | 79 | 1.0% |
| Total | 7,935 | 100.0% |
Housing Structures by Occupancy in Easthampton Town
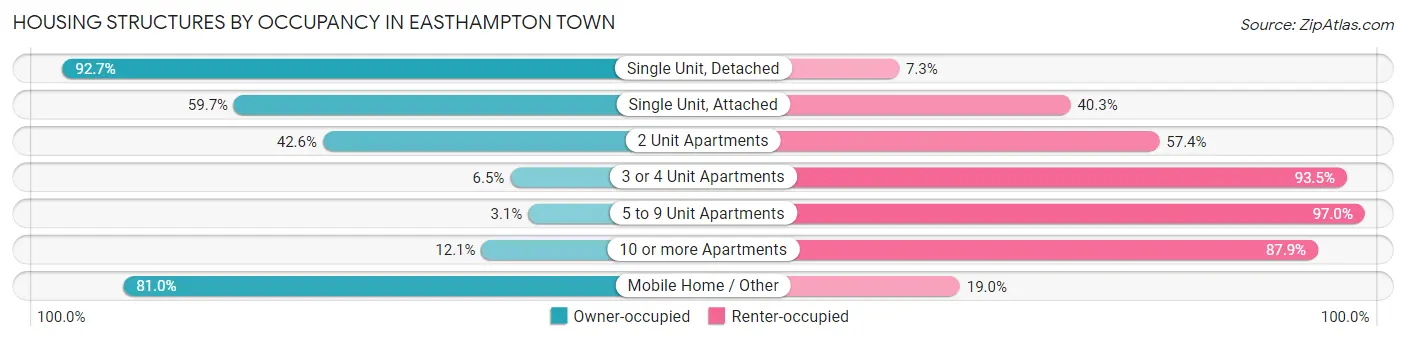
| Structure Type | Owner-occupied | Renter-occupied |
| Single Unit, Detached | 3,732 (92.7%) | 293 (7.3%) |
| Single Unit, Attached | 400 (59.7%) | 270 (40.3%) |
| 2 Unit Apartments | 471 (42.6%) | 635 (57.4%) |
| 3 or 4 Unit Apartments | 51 (6.5%) | 734 (93.5%) |
| 5 to 9 Unit Apartments | 18 (3.0%) | 572 (97.0%) |
| 10 or more Apartments | 82 (12.1%) | 598 (87.9%) |
| Mobile Home / Other | 64 (81.0%) | 15 (19.0%) |
| Total | 4,818 (60.7%) | 3,117 (39.3%) |
Housing Structures by Number of Rooms in Easthampton Town
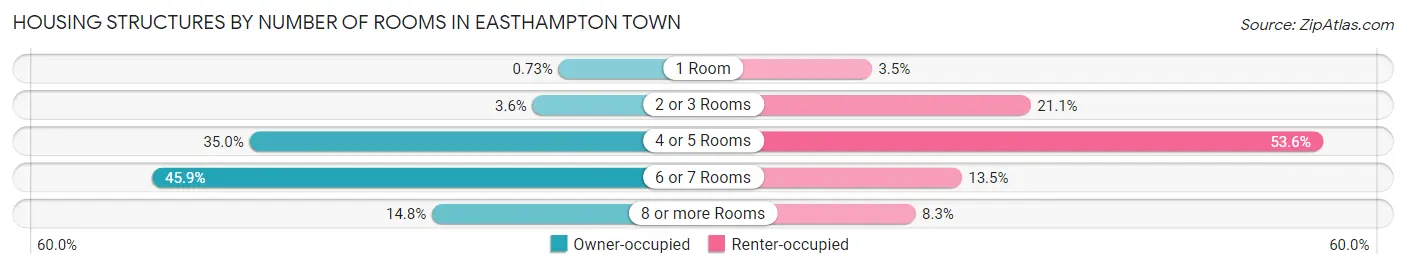
| Number of Rooms | Owner-occupied | Renter-occupied |
| 1 Room | 35 (0.7%) | 109 (3.5%) |
| 2 or 3 Rooms | 174 (3.6%) | 659 (21.1%) |
| 4 or 5 Rooms | 1,688 (35.0%) | 1,669 (53.5%) |
| 6 or 7 Rooms | 2,209 (45.9%) | 420 (13.5%) |
| 8 or more Rooms | 712 (14.8%) | 260 (8.3%) |
| Total | 4,818 (100.0%) | 3,117 (100.0%) |
Housing Structure by Heating Type in Easthampton Town
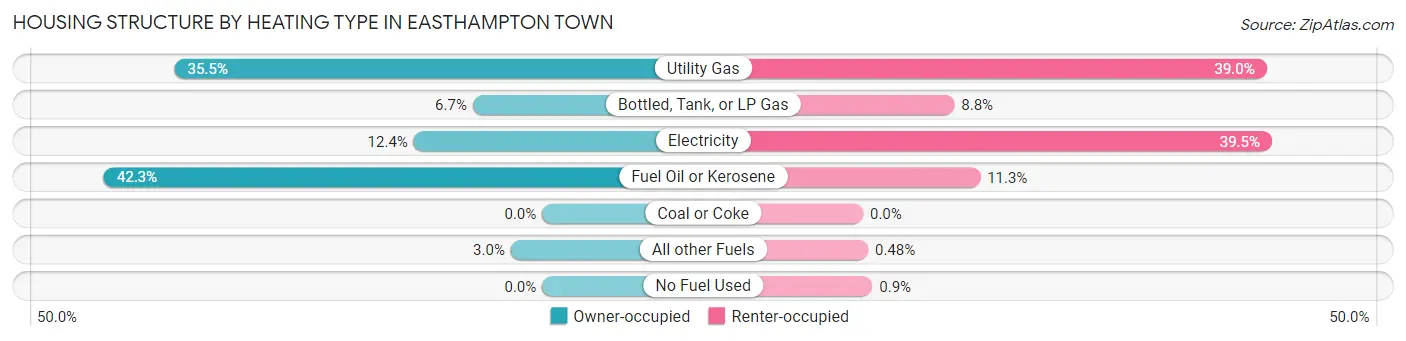
| Heating Type | Owner-occupied | Renter-occupied |
| Utility Gas | 1,711 (35.5%) | 1,215 (39.0%) |
| Bottled, Tank, or LP Gas | 323 (6.7%) | 275 (8.8%) |
| Electricity | 598 (12.4%) | 1,231 (39.5%) |
| Fuel Oil or Kerosene | 2,040 (42.3%) | 353 (11.3%) |
| Coal or Coke | 0 (0.0%) | 0 (0.0%) |
| All other Fuels | 146 (3.0%) | 15 (0.5%) |
| No Fuel Used | 0 (0.0%) | 28 (0.9%) |
| Total | 4,818 (100.0%) | 3,117 (100.0%) |
Household Vehicle Usage in Easthampton Town
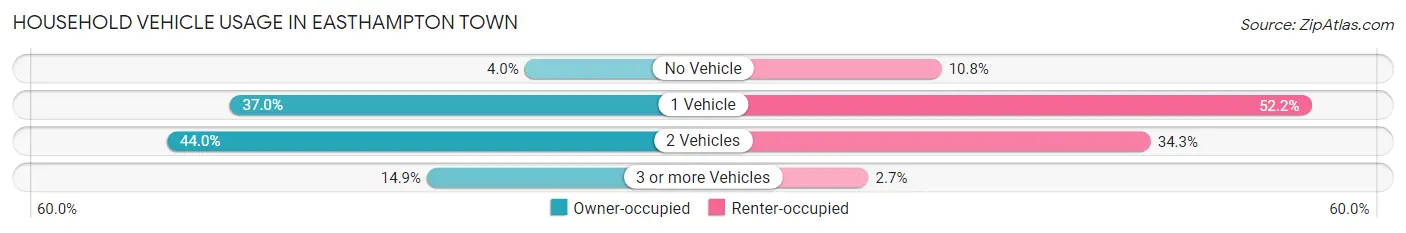
| Vehicles per Household | Owner-occupied | Renter-occupied |
| No Vehicle | 192 (4.0%) | 338 (10.8%) |
| 1 Vehicle | 1,784 (37.0%) | 1,628 (52.2%) |
| 2 Vehicles | 2,122 (44.0%) | 1,068 (34.3%) |
| 3 or more Vehicles | 720 (14.9%) | 83 (2.7%) |
| Total | 4,818 (100.0%) | 3,117 (100.0%) |
Real Estate & Mortgages in Easthampton Town
Real Estate and Mortgage Overview in Easthampton Town
| Characteristic | Without Mortgage | With Mortgage |
| Housing Units | 1,752 | 3,066 |
| Median Property Value | $325,200 | $334,300 |
| Median Household Income | $73,857 | $661 |
| Monthly Housing Costs | $739 | $340 |
| Real Estate Taxes | $4,460 | $48 |
Property Value by Mortgage Status in Easthampton Town
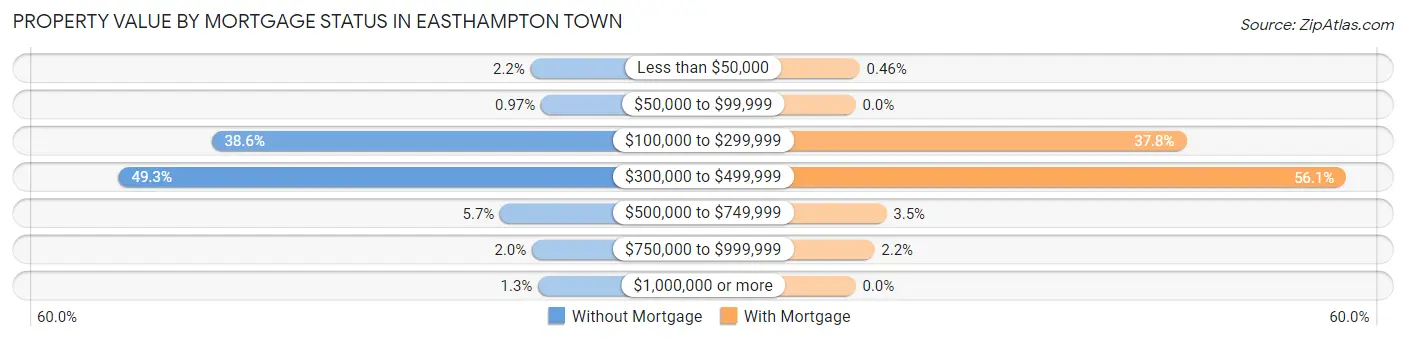
| Property Value | Without Mortgage | With Mortgage |
| Less than $50,000 | 38 (2.2%) | 14 (0.5%) |
| $50,000 to $99,999 | 17 (1.0%) | 0 (0.0%) |
| $100,000 to $299,999 | 677 (38.6%) | 1,159 (37.8%) |
| $300,000 to $499,999 | 863 (49.3%) | 1,719 (56.1%) |
| $500,000 to $749,999 | 99 (5.7%) | 108 (3.5%) |
| $750,000 to $999,999 | 35 (2.0%) | 66 (2.1%) |
| $1,000,000 or more | 23 (1.3%) | 0 (0.0%) |
| Total | 1,752 (100.0%) | 3,066 (100.0%) |
Household Income by Mortgage Status in Easthampton Town
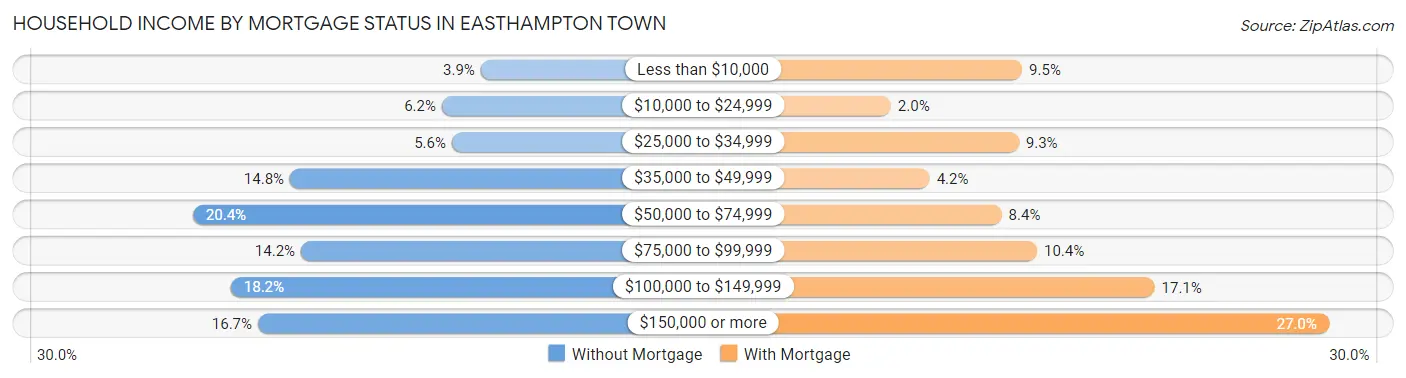
| Household Income | Without Mortgage | With Mortgage |
| Less than $10,000 | 69 (3.9%) | 292 (9.5%) |
| $10,000 to $24,999 | 108 (6.2%) | 62 (2.0%) |
| $25,000 to $34,999 | 98 (5.6%) | 286 (9.3%) |
| $35,000 to $49,999 | 260 (14.8%) | 130 (4.2%) |
| $50,000 to $74,999 | 357 (20.4%) | 256 (8.4%) |
| $75,000 to $99,999 | 249 (14.2%) | 318 (10.4%) |
| $100,000 to $149,999 | 319 (18.2%) | 524 (17.1%) |
| $150,000 or more | 292 (16.7%) | 829 (27.0%) |
| Total | 1,752 (100.0%) | 3,066 (100.0%) |
Property Value to Household Income Ratio in Easthampton Town
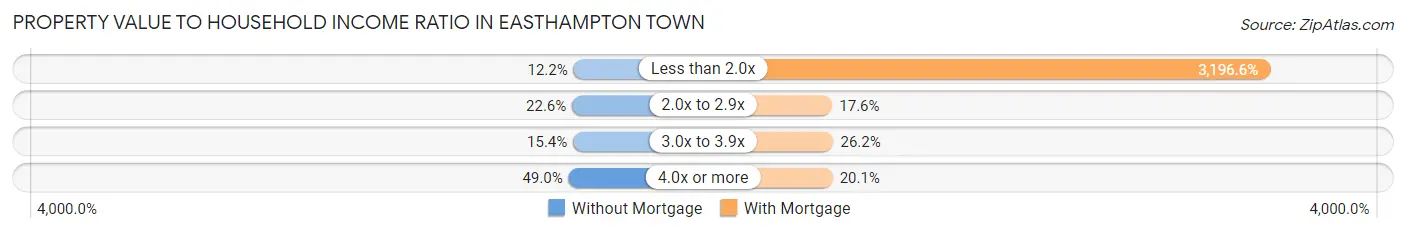
| Value-to-Income Ratio | Without Mortgage | With Mortgage |
| Less than 2.0x | 214 (12.2%) | 98,009 (3,196.6%) |
| 2.0x to 2.9x | 396 (22.6%) | 540 (17.6%) |
| 3.0x to 3.9x | 270 (15.4%) | 804 (26.2%) |
| 4.0x or more | 858 (49.0%) | 617 (20.1%) |
| Total | 1,752 (100.0%) | 3,066 (100.0%) |
Real Estate Taxes by Mortgage Status in Easthampton Town
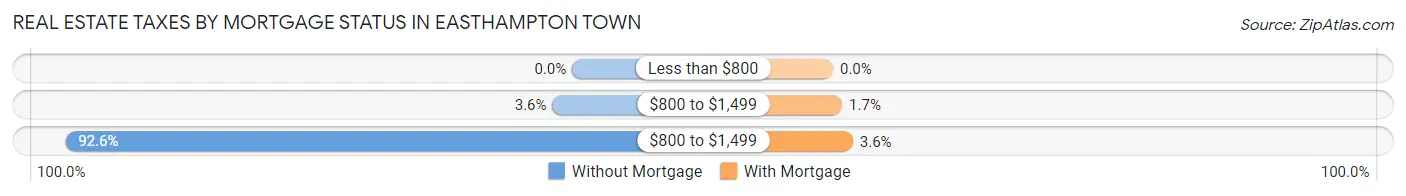
| Property Taxes | Without Mortgage | With Mortgage |
| Less than $800 | 0 (0.0%) | 0 (0.0%) |
| $800 to $1,499 | 63 (3.6%) | 51 (1.7%) |
| $800 to $1,499 | 1,622 (92.6%) | 111 (3.6%) |
| Total | 1,752 (100.0%) | 3,066 (100.0%) |
Health & Disability in Easthampton Town
Health Insurance Coverage by Age in Easthampton Town
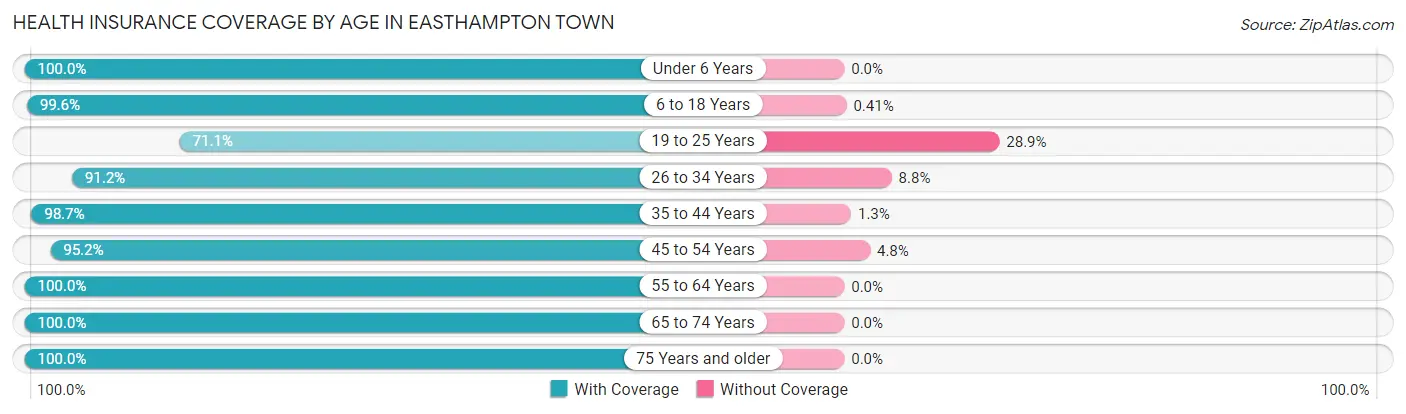
| Age Bracket | With Coverage | Without Coverage |
| Under 6 Years | 552 (100.0%) | 0 (0.0%) |
| 6 to 18 Years | 2,191 (99.6%) | 9 (0.4%) |
| 19 to 25 Years | 747 (71.1%) | 304 (28.9%) |
| 26 to 34 Years | 1,467 (91.2%) | 142 (8.8%) |
| 35 to 44 Years | 2,277 (98.7%) | 29 (1.3%) |
| 45 to 54 Years | 1,823 (95.2%) | 92 (4.8%) |
| 55 to 64 Years | 2,661 (100.0%) | 0 (0.0%) |
| 65 to 74 Years | 2,318 (100.0%) | 0 (0.0%) |
| 75 Years and older | 1,520 (100.0%) | 0 (0.0%) |
| Total | 15,556 (96.4%) | 576 (3.6%) |
Health Insurance Coverage by Citizenship Status in Easthampton Town
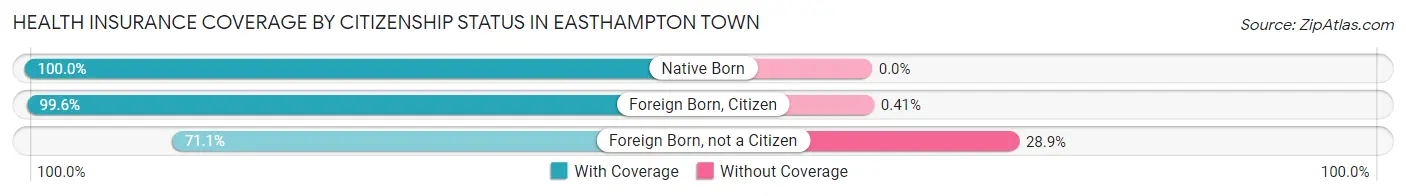
| Citizenship Status | With Coverage | Without Coverage |
| Native Born | 552 (100.0%) | 0 (0.0%) |
| Foreign Born, Citizen | 2,191 (99.6%) | 9 (0.4%) |
| Foreign Born, not a Citizen | 747 (71.1%) | 304 (28.9%) |
Health Insurance Coverage by Household Income in Easthampton Town
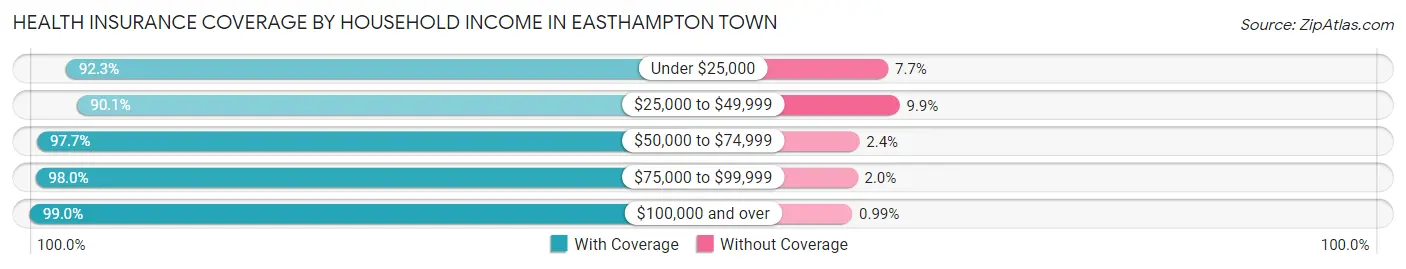
| Household Income | With Coverage | Without Coverage |
| Under $25,000 | 1,597 (92.3%) | 134 (7.7%) |
| $25,000 to $49,999 | 2,463 (90.1%) | 270 (9.9%) |
| $50,000 to $74,999 | 2,496 (97.7%) | 60 (2.4%) |
| $75,000 to $99,999 | 2,092 (98.0%) | 43 (2.0%) |
| $100,000 and over | 6,795 (99.0%) | 68 (1.0%) |
Public vs Private Health Insurance Coverage by Age in Easthampton Town
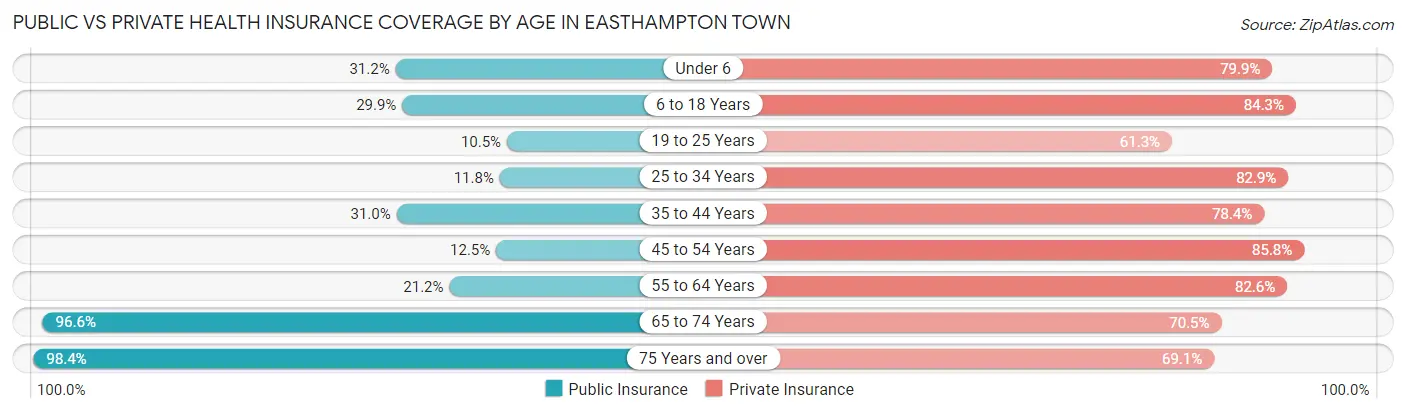
| Age Bracket | Public Insurance | Private Insurance |
| Under 6 | 172 (31.2%) | 441 (79.9%) |
| 6 to 18 Years | 658 (29.9%) | 1,854 (84.3%) |
| 19 to 25 Years | 110 (10.5%) | 644 (61.3%) |
| 25 to 34 Years | 190 (11.8%) | 1,333 (82.9%) |
| 35 to 44 Years | 714 (31.0%) | 1,808 (78.4%) |
| 45 to 54 Years | 239 (12.5%) | 1,643 (85.8%) |
| 55 to 64 Years | 563 (21.2%) | 2,199 (82.6%) |
| 65 to 74 Years | 2,240 (96.6%) | 1,633 (70.5%) |
| 75 Years and over | 1,495 (98.4%) | 1,050 (69.1%) |
| Total | 6,381 (39.6%) | 12,605 (78.1%) |
Disability Status by Sex by Age in Easthampton Town
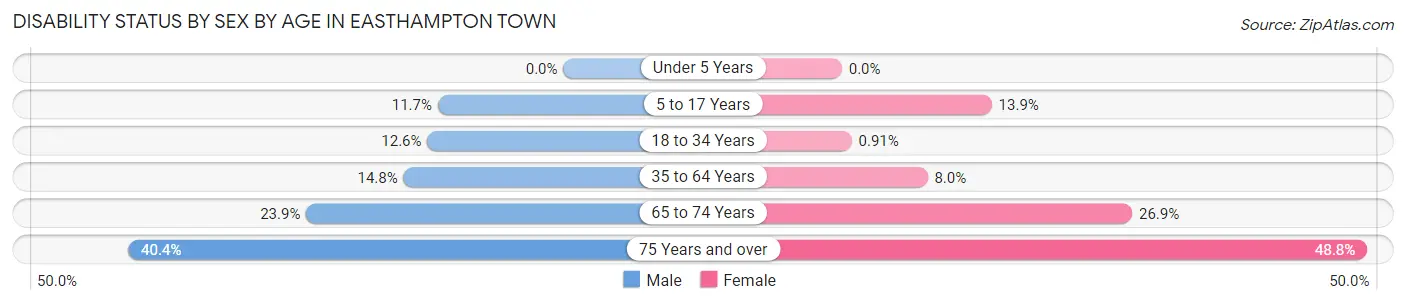
| Age Bracket | Male | Female |
| Under 5 Years | 0 (0.0%) | 0 (0.0%) |
| 5 to 17 Years | 128 (11.7%) | 155 (13.9%) |
| 18 to 34 Years | 168 (12.6%) | 13 (0.9%) |
| 35 to 64 Years | 495 (14.8%) | 282 (8.0%) |
| 65 to 74 Years | 282 (23.9%) | 306 (26.9%) |
| 75 Years and over | 290 (40.4%) | 391 (48.7%) |
Disability Class by Sex by Age in Easthampton Town
Disability Class: Hearing Difficulty
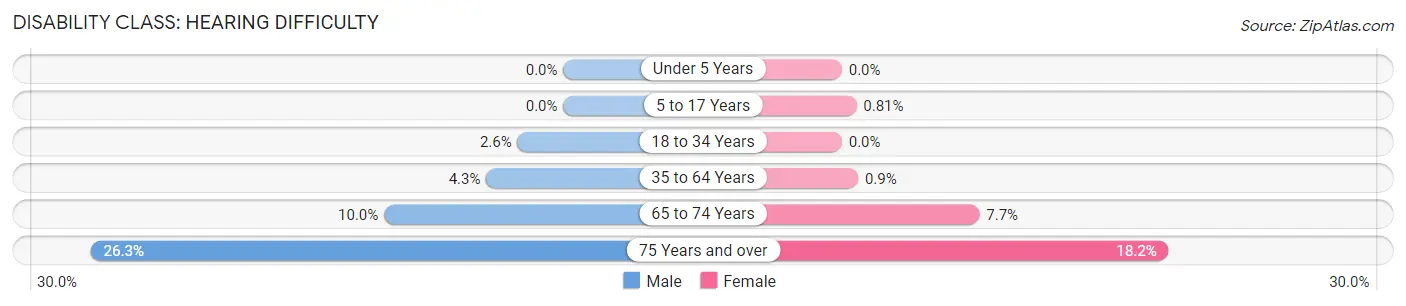
| Age Bracket | Male | Female |
| Under 5 Years | 0 (0.0%) | 0 (0.0%) |
| 5 to 17 Years | 0 (0.0%) | 9 (0.8%) |
| 18 to 34 Years | 34 (2.5%) | 0 (0.0%) |
| 35 to 64 Years | 143 (4.3%) | 32 (0.9%) |
| 65 to 74 Years | 118 (10.0%) | 87 (7.7%) |
| 75 Years and over | 189 (26.3%) | 146 (18.2%) |
Disability Class: Vision Difficulty
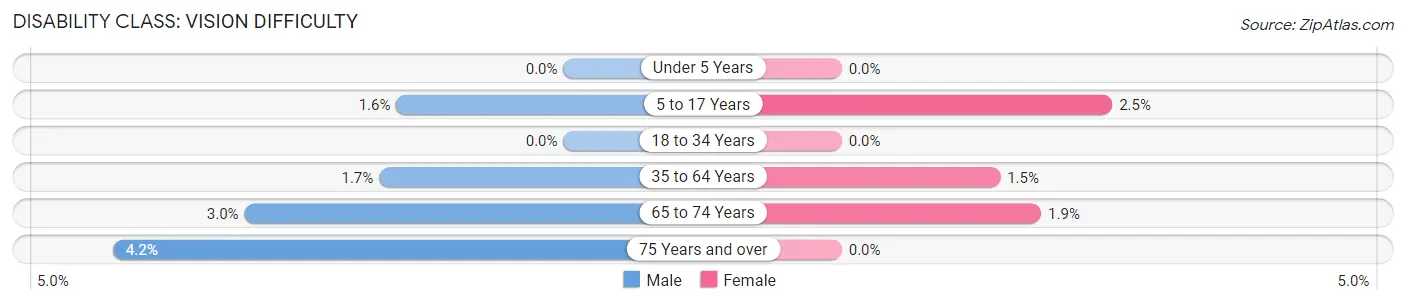
| Age Bracket | Male | Female |
| Under 5 Years | 0 (0.0%) | 0 (0.0%) |
| 5 to 17 Years | 17 (1.5%) | 28 (2.5%) |
| 18 to 34 Years | 0 (0.0%) | 0 (0.0%) |
| 35 to 64 Years | 57 (1.7%) | 52 (1.5%) |
| 65 to 74 Years | 35 (3.0%) | 21 (1.8%) |
| 75 Years and over | 30 (4.2%) | 0 (0.0%) |
Disability Class: Cognitive Difficulty
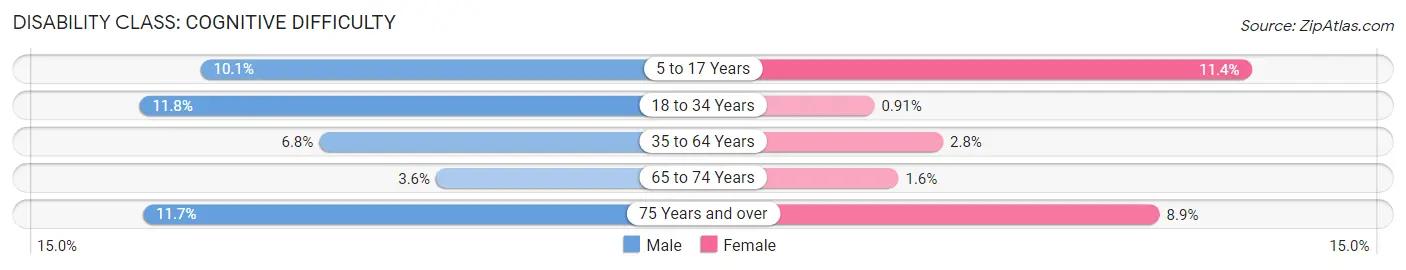
| Age Bracket | Male | Female |
| 5 to 17 Years | 111 (10.1%) | 127 (11.4%) |
| 18 to 34 Years | 157 (11.8%) | 13 (0.9%) |
| 35 to 64 Years | 227 (6.8%) | 100 (2.8%) |
| 65 to 74 Years | 42 (3.5%) | 18 (1.6%) |
| 75 Years and over | 84 (11.7%) | 71 (8.8%) |
Disability Class: Ambulatory Difficulty
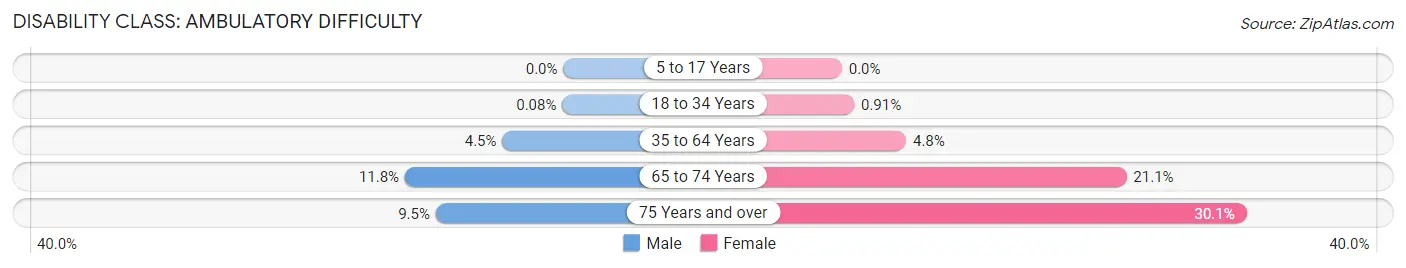
| Age Bracket | Male | Female |
| 5 to 17 Years | 0 (0.0%) | 0 (0.0%) |
| 18 to 34 Years | 1 (0.1%) | 13 (0.9%) |
| 35 to 64 Years | 151 (4.5%) | 169 (4.8%) |
| 65 to 74 Years | 139 (11.8%) | 240 (21.1%) |
| 75 Years and over | 68 (9.5%) | 241 (30.0%) |
Disability Class: Self-Care Difficulty
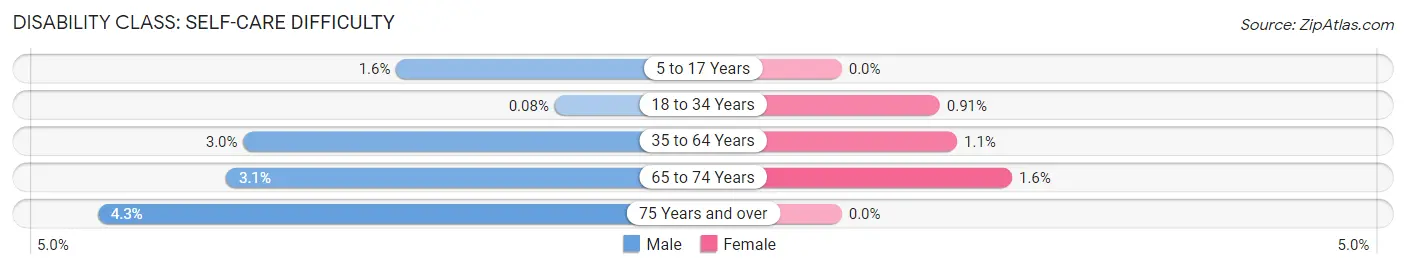
| Age Bracket | Male | Female |
| 5 to 17 Years | 17 (1.5%) | 0 (0.0%) |
| 18 to 34 Years | 1 (0.1%) | 13 (0.9%) |
| 35 to 64 Years | 99 (3.0%) | 38 (1.1%) |
| 65 to 74 Years | 37 (3.1%) | 18 (1.6%) |
| 75 Years and over | 31 (4.3%) | 0 (0.0%) |
Technology Access in Easthampton Town
Computing Device Access in Easthampton Town
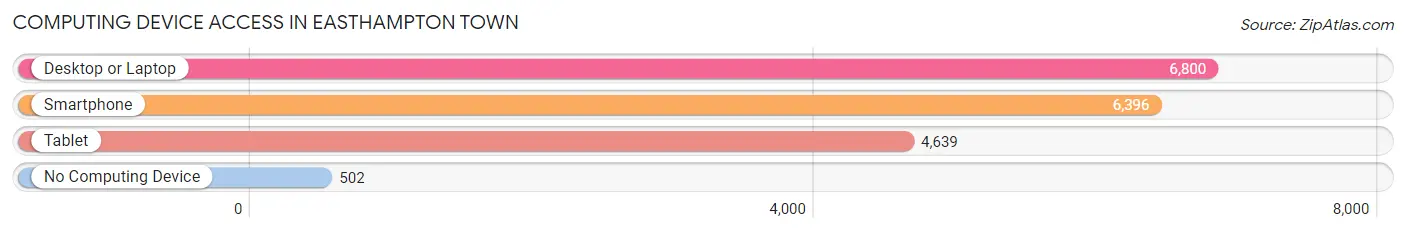
| Device Type | # Households | % Households |
| Desktop or Laptop | 6,800 | 85.7% |
| Smartphone | 6,396 | 80.6% |
| Tablet | 4,639 | 58.5% |
| No Computing Device | 502 | 6.3% |
| Total | 7,935 | 100.0% |
Internet Access in Easthampton Town
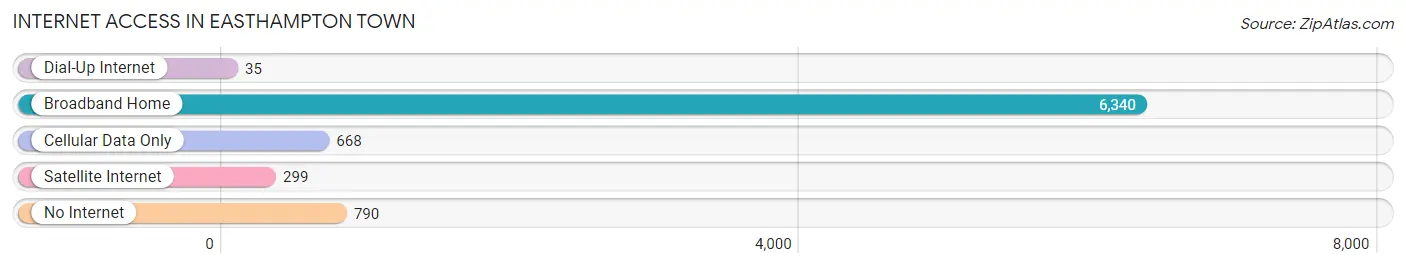
| Internet Type | # Households | % Households |
| Dial-Up Internet | 35 | 0.4% |
| Broadband Home | 6,340 | 79.9% |
| Cellular Data Only | 668 | 8.4% |
| Satellite Internet | 299 | 3.8% |
| No Internet | 790 | 10.0% |
| Total | 7,935 | 100.0% |
Easthampton Town Summary
Easthampton Town, MA is a small town located in the Pioneer Valley of western Massachusetts. It is situated in the foothills of the Berkshires, and is bordered by the towns of Southampton, Westhampton, and Northampton. Easthampton is a rural community with a population of approximately 16,000 people.
History
Easthampton was first settled in 1664 by English settlers from Northampton. The town was originally known as “East Hampton”, and was part of the original Hampshire County. In 1785, the town was officially incorporated as “Easthampton”.
In the 19th century, Easthampton was a major center for the production of paper and textiles. The town was home to several paper mills, as well as a cotton mill and a woolen mill. The paper mills were the primary source of employment for the town’s residents.
In the late 19th century, Easthampton began to experience a decline in its industrial base. The paper mills began to close, and the town’s population began to decline. In the early 20th century, the town’s economy shifted to a more service-based economy.
Geography
Easthampton is located in the Pioneer Valley of western Massachusetts. The town is situated in the foothills of the Berkshires, and is bordered by the towns of Southampton, Westhampton, and Northampton. The town is located approximately 20 miles north of Springfield, and 80 miles west of Boston.
The town is divided into two distinct sections: the “Upper Town” and the “Lower Town”. The Upper Town is located on a hill overlooking the Connecticut River, and is home to the town’s historic district. The Lower Town is located in the valley below, and is home to the town’s commercial district.
Economy
Easthampton’s economy is largely based on service industries. The town is home to several retail stores, restaurants, and other businesses. The town is also home to several manufacturing companies, including a paper mill and a plastics factory.
The town is also home to several educational institutions, including the Easthampton High School, the Easthampton Community College, and the Easthampton Technical Institute.
Demographics
As of the 2010 census, the population of Easthampton was 16,053. The town has a population density of 1,092 people per square mile. The median age of the town’s population is 40.7 years.
The racial makeup of the town is 87.3% White, 5.2% African American, 0.7% Native American, 1.7% Asian, 0.1% Pacific Islander, 2.2% from other races, and 2.8% from two or more races. The town’s Hispanic population is 5.2%.
The median household income in Easthampton is $50,945. The median home value is $219,400. The town’s unemployment rate is 4.2%.
Conclusion
Easthampton Town, MA is a small town located in the Pioneer Valley of western Massachusetts. It is situated in the foothills of the Berkshires, and is bordered by the towns of Southampton, Westhampton, and Northampton. Easthampton is a rural community with a population of approximately 16,000 people. The town’s economy is largely based on service industries, and the town is home to several educational institutions. The town’s population is 87.3% White, 5.2% African American, 0.7% Native American, 1.7% Asian, 0.1% Pacific Islander, 2.2% from other races, and 2.8% from two or more races. The median household income in Easthampton is $50,945, and the median home value is $219,400.
Common Questions
What is Per Capita Income in Easthampton Town?
Per Capita income in Easthampton Town is $42,677.
What is the Median Family Income in Easthampton Town?
Median Family Income in Easthampton Town is $89,699.
What is the Median Household income in Easthampton Town?
Median Household Income in Easthampton Town is $67,329.
What is Income or Wage Gap in Easthampton Town?
Income or Wage Gap in Easthampton Town is 27.2%.
Women in Easthampton Town earn 72.8 cents for every dollar earned by a man.
What is Inequality or Gini Index in Easthampton Town?
Inequality or Gini Index in Easthampton Town is 0.44.
What is the Total Population of Easthampton Town?
Total Population of Easthampton Town is 16,136.
What is the Total Male Population of Easthampton Town?
Total Male Population of Easthampton Town is 7,962.
What is the Total Female Population of Easthampton Town?
Total Female Population of Easthampton Town is 8,174.
What is the Ratio of Males per 100 Females in Easthampton Town?
There are 97.41 Males per 100 Females in Easthampton Town.
What is the Ratio of Females per 100 Males in Easthampton Town?
There are 102.66 Females per 100 Males in Easthampton Town.
What is the Median Population Age in Easthampton Town?
Median Population Age in Easthampton Town is 47.0 Years.
What is the Average Family Size in Easthampton Town
Average Family Size in Easthampton Town is 2.5 People.
What is the Average Household Size in Easthampton Town
Average Household Size in Easthampton Town is 2.0 People.
How Large is the Labor Force in Easthampton Town?
There are 8,544 People in the Labor Forcein in Easthampton Town.
What is the Percentage of People in the Labor Force in Easthampton Town?
62.0% of People are in the Labor Force in Easthampton Town.
What is the Unemployment Rate in Easthampton Town?
Unemployment Rate in Easthampton Town is 5.4%.