North Westport, MA Map & Demographics
North Westport Map
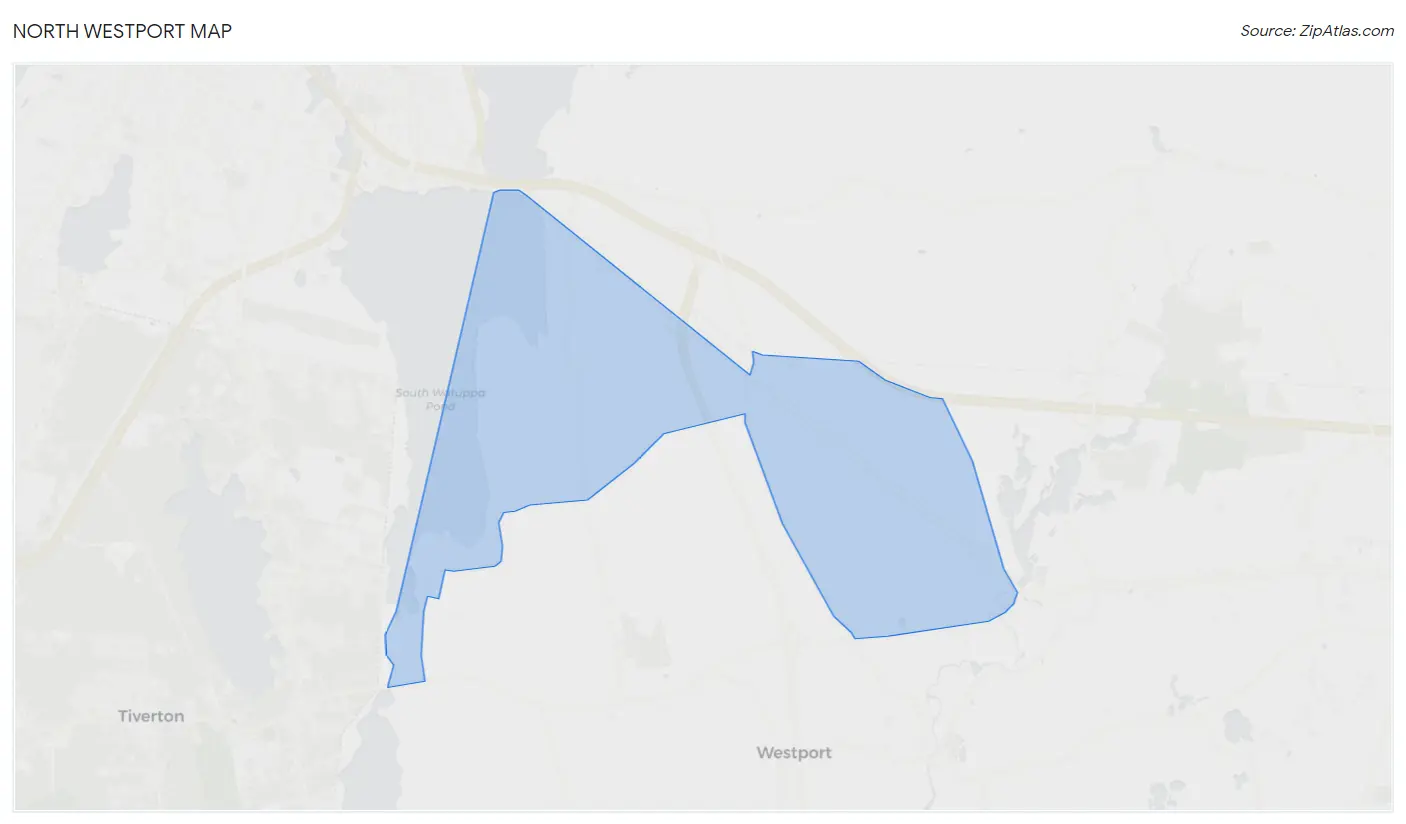
North Westport Overview
$45,606
PER CAPITA INCOME
$87,230
AVG FAMILY INCOME
$82,408
AVG HOUSEHOLD INCOME
49.0%
WAGE / INCOME GAP [ % ]
51.0¢/ $1
WAGE / INCOME GAP [ $ ]
0.48
INEQUALITY / GINI INDEX
4,660
TOTAL POPULATION
2,236
MALE POPULATION
2,424
FEMALE POPULATION
92.24
MALES / 100 FEMALES
108.41
FEMALES / 100 MALES
49.3
MEDIAN AGE
3.0
AVG FAMILY SIZE
2.4
AVG HOUSEHOLD SIZE
2,484
LABOR FORCE [ PEOPLE ]
63.7%
PERCENT IN LABOR FORCE
1.7%
UNEMPLOYMENT RATE
Income in North Westport
Income Overview in North Westport
Per Capita Income in North Westport is $45,606, while median incomes of families and households are $87,230 and $82,408 respectively.
| Characteristic | Number | Measure |
| Per Capita Income | 4,660 | $45,606 |
| Median Family Income | 1,215 | $87,230 |
| Mean Family Income | 1,215 | $119,412 |
| Median Household Income | 1,931 | $82,408 |
| Mean Household Income | 1,931 | $109,898 |
| Income Deficit | 1,215 | $0 |
| Wage / Income Gap (%) | 4,660 | 49.05% |
| Wage / Income Gap ($) | 4,660 | 50.95¢ per $1 |
| Gini / Inequality Index | 4,660 | 0.48 |
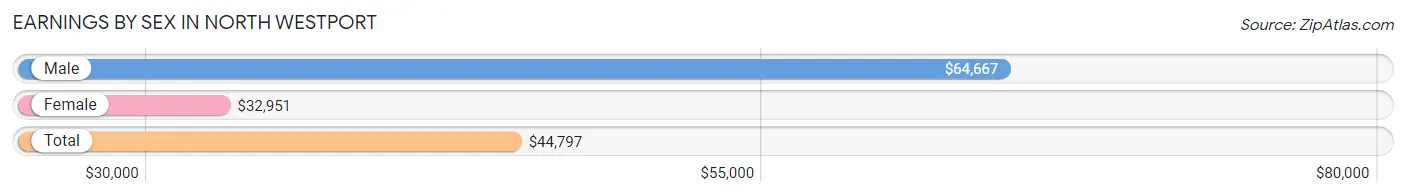
Earnings by Sex in North Westport
Average Earnings in North Westport are $44,797, $64,667 for men and $32,951 for women, a difference of 49.0%.
| Sex | Number | Average Earnings |
| Male | 1,346 (51.5%) | $64,667 |
| Female | 1,266 (48.5%) | $32,951 |
| Total | 2,612 (100.0%) | $44,797 |
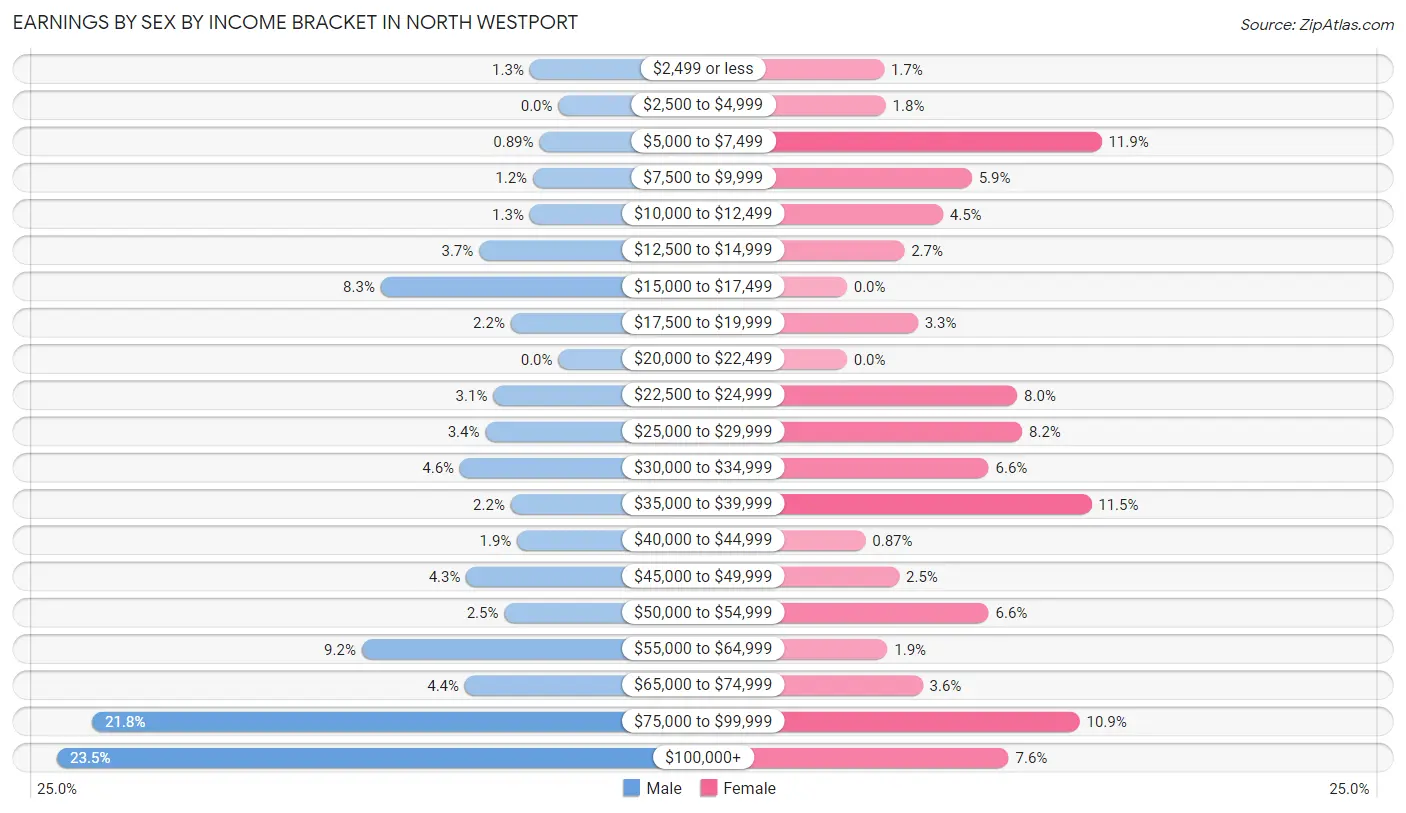
Earnings by Sex by Income Bracket in North Westport
The most common earnings brackets in North Westport are $100,000+ for men (316 | 23.5%) and $5,000 to $7,499 for women (151 | 11.9%).
| Income | Male | Female |
| $2,499 or less | 18 (1.3%) | 22 (1.7%) |
| $2,500 to $4,999 | 0 (0.0%) | 23 (1.8%) |
| $5,000 to $7,499 | 12 (0.9%) | 151 (11.9%) |
| $7,500 to $9,999 | 16 (1.2%) | 74 (5.9%) |
| $10,000 to $12,499 | 18 (1.3%) | 57 (4.5%) |
| $12,500 to $14,999 | 50 (3.7%) | 34 (2.7%) |
| $15,000 to $17,499 | 112 (8.3%) | 0 (0.0%) |
| $17,500 to $19,999 | 30 (2.2%) | 42 (3.3%) |
| $20,000 to $22,499 | 0 (0.0%) | 0 (0.0%) |
| $22,500 to $24,999 | 41 (3.0%) | 101 (8.0%) |
| $25,000 to $29,999 | 46 (3.4%) | 104 (8.2%) |
| $30,000 to $34,999 | 62 (4.6%) | 84 (6.6%) |
| $35,000 to $39,999 | 30 (2.2%) | 145 (11.5%) |
| $40,000 to $44,999 | 26 (1.9%) | 11 (0.9%) |
| $45,000 to $49,999 | 58 (4.3%) | 31 (2.5%) |
| $50,000 to $54,999 | 34 (2.5%) | 84 (6.6%) |
| $55,000 to $64,999 | 124 (9.2%) | 24 (1.9%) |
| $65,000 to $74,999 | 59 (4.4%) | 45 (3.5%) |
| $75,000 to $99,999 | 294 (21.8%) | 138 (10.9%) |
| $100,000+ | 316 (23.5%) | 96 (7.6%) |
| Total | 1,346 (100.0%) | 1,266 (100.0%) |
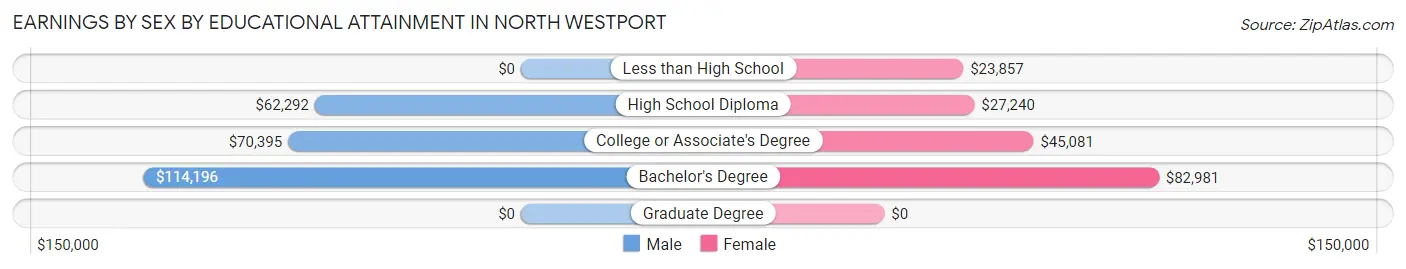
Earnings by Sex by Educational Attainment in North Westport
Average earnings in North Westport are $75,357 for men and $35,357 for women, a difference of 53.1%. Men with an educational attainment of bachelor's degree enjoy the highest average annual earnings of $114,196, while those with high school diploma education earn the least with $62,292. Women with an educational attainment of bachelor's degree earn the most with the average annual earnings of $82,981, while those with less than high school education have the smallest earnings of $23,857.
| Educational Attainment | Male Income | Female Income |
| Less than High School | - | - |
| High School Diploma | $62,292 | $27,240 |
| College or Associate's Degree | $70,395 | $45,081 |
| Bachelor's Degree | $114,196 | $82,981 |
| Graduate Degree | - | - |
| Total | $75,357 | $35,357 |
Family Income in North Westport
Family Income Brackets in North Westport
According to the North Westport family income data, there are 332 families falling into the $100,000 to $149,999 income range, which is the most common income bracket and makes up 27.3% of all families.
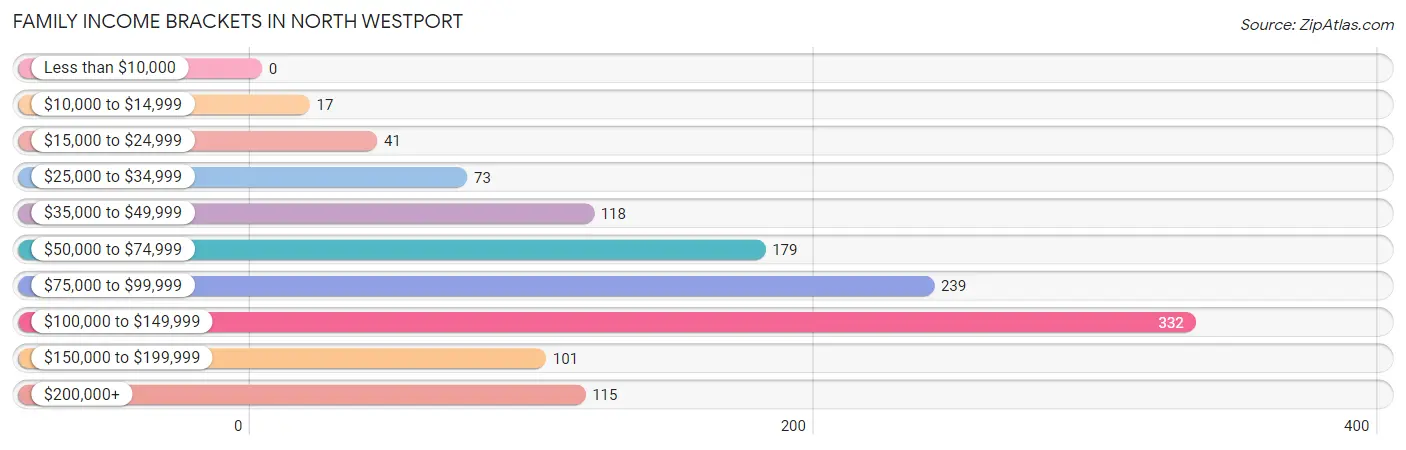
| Income Bracket | # Families | % Families |
| Less than $10,000 | 0 | 0.0% |
| $10,000 to $14,999 | 17 | 1.4% |
| $15,000 to $24,999 | 41 | 3.4% |
| $25,000 to $34,999 | 73 | 6.0% |
| $35,000 to $49,999 | 118 | 9.7% |
| $50,000 to $74,999 | 179 | 14.7% |
| $75,000 to $99,999 | 239 | 19.7% |
| $100,000 to $149,999 | 332 | 27.3% |
| $150,000 to $199,999 | 101 | 8.3% |
| $200,000+ | 115 | 9.5% |
Family Income by Famaliy Size in North Westport
5-person families (86 | 7.1%) account for the highest median family income in North Westport with $165,000 per family, while 3-person families (383 | 31.5%) have the highest median income of $39,663 per family member.
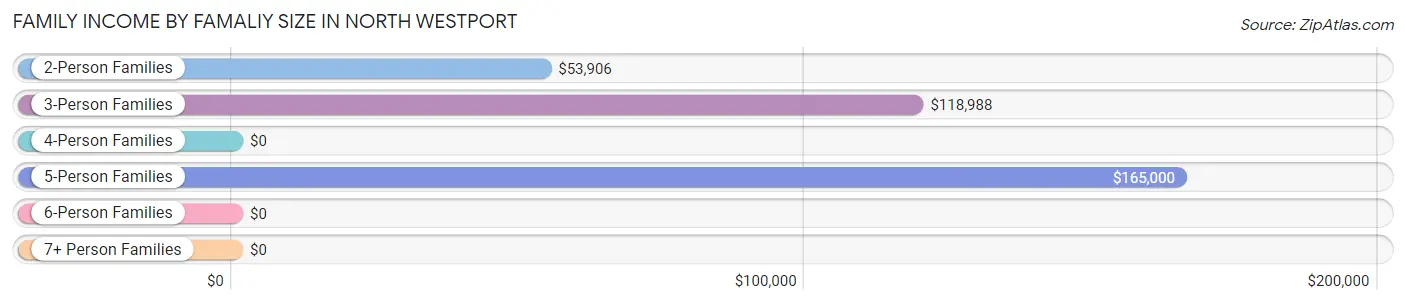
| Income Bracket | # Families | Median Income |
| 2-Person Families | 461 (37.9%) | $53,906 |
| 3-Person Families | 383 (31.5%) | $118,988 |
| 4-Person Families | 235 (19.3%) | $0 |
| 5-Person Families | 86 (7.1%) | $165,000 |
| 6-Person Families | 26 (2.1%) | $0 |
| 7+ Person Families | 24 (2.0%) | $0 |
| Total | 1,215 (100.0%) | $87,230 |
Family Income by Number of Earners in North Westport
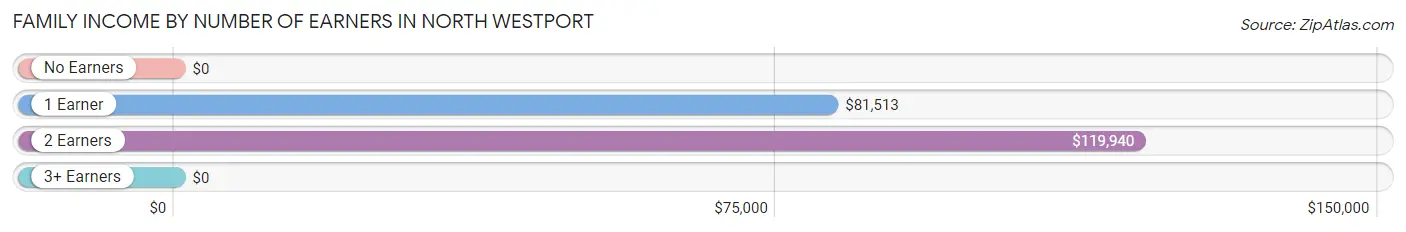
| Number of Earners | # Families | Median Income |
| No Earners | 131 (10.8%) | $0 |
| 1 Earner | 436 (35.9%) | $81,513 |
| 2 Earners | 395 (32.5%) | $119,940 |
| 3+ Earners | 253 (20.8%) | $0 |
| Total | 1,215 (100.0%) | $87,230 |
Household Income in North Westport
Household Income Brackets in North Westport
With 479 households falling in the category, the $100,000 to $149,999 income range is the most frequent in North Westport, accounting for 24.8% of all households. In contrast, only 29 households (1.5%) fall into the less than $10,000 income bracket, making it the least populous group.
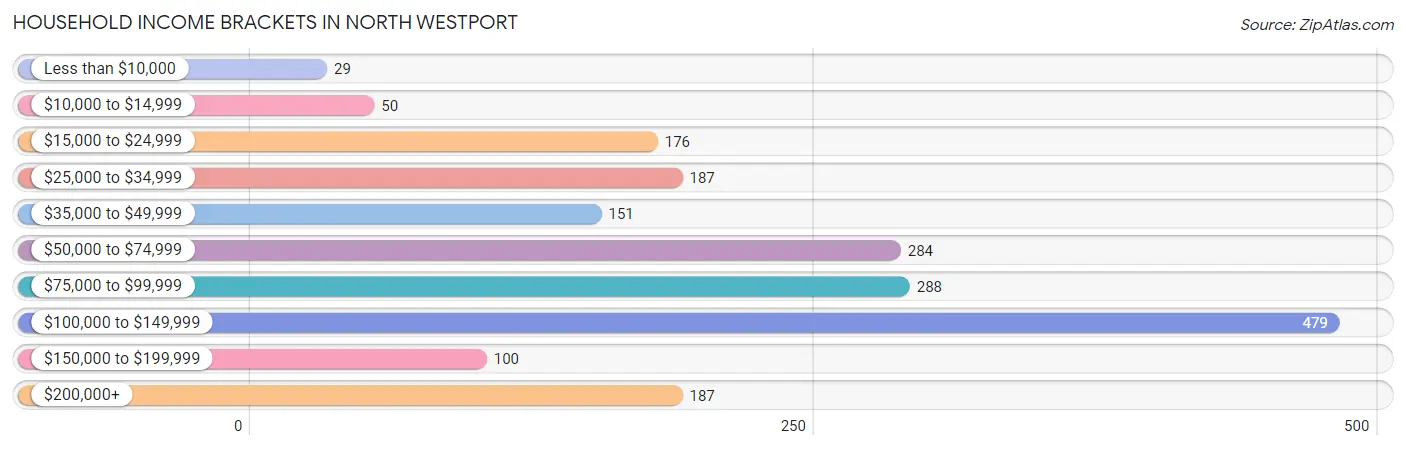
| Income Bracket | # Households | % Households |
| Less than $10,000 | 29 | 1.5% |
| $10,000 to $14,999 | 50 | 2.6% |
| $15,000 to $24,999 | 176 | 9.1% |
| $25,000 to $34,999 | 187 | 9.7% |
| $35,000 to $49,999 | 151 | 7.8% |
| $50,000 to $74,999 | 284 | 14.7% |
| $75,000 to $99,999 | 288 | 14.9% |
| $100,000 to $149,999 | 479 | 24.8% |
| $150,000 to $199,999 | 100 | 5.2% |
| $200,000+ | 187 | 9.7% |
Household Income by Householder Age in North Westport
The median household income in North Westport is $82,408, with the highest median household income of $121,220 found in the 25 to 44 years age bracket for the primary householder. A total of 466 households (24.1%) fall into this category. Meanwhile, the 15 to 24 years age bracket for the primary householder has the lowest median household income of $0, with 19 households (1.0%) in this group.
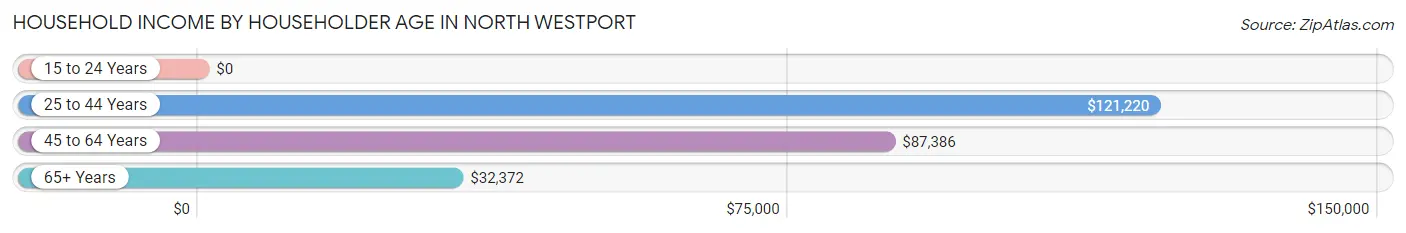
| Income Bracket | # Households | Median Income |
| 15 to 24 Years | 19 (1.0%) | $0 |
| 25 to 44 Years | 466 (24.1%) | $121,220 |
| 45 to 64 Years | 798 (41.3%) | $87,386 |
| 65+ Years | 648 (33.6%) | $32,372 |
| Total | 1,931 (100.0%) | $82,408 |
Poverty in North Westport
Income Below Poverty by Sex and Age in North Westport
With 7.3% poverty level for males and 8.9% for females among the residents of North Westport, under 5 year old males and 12 to 14 year old females are the most vulnerable to poverty, with 43 males (40.6%) and 17 females (23.3%) in their respective age groups living below the poverty level.
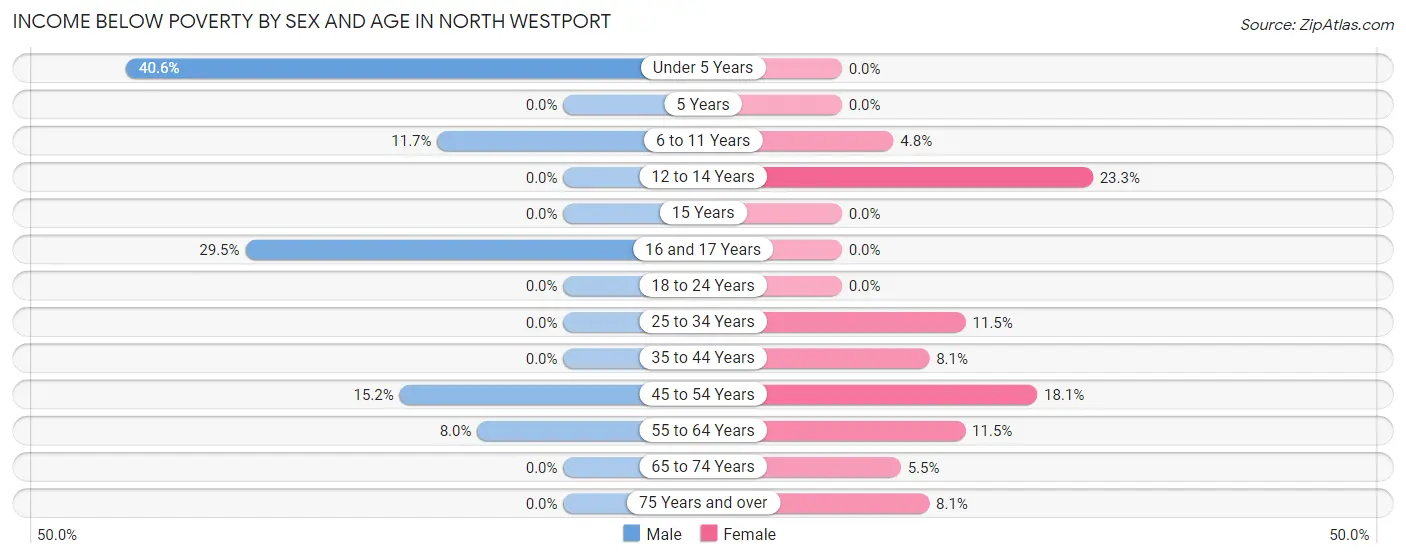
| Age Bracket | Male | Female |
| Under 5 Years | 43 (40.6%) | 0 (0.0%) |
| 5 Years | 0 (0.0%) | 0 (0.0%) |
| 6 to 11 Years | 9 (11.7%) | 8 (4.8%) |
| 12 to 14 Years | 0 (0.0%) | 17 (23.3%) |
| 15 Years | 0 (0.0%) | 0 (0.0%) |
| 16 and 17 Years | 18 (29.5%) | 0 (0.0%) |
| 18 to 24 Years | 0 (0.0%) | 0 (0.0%) |
| 25 to 34 Years | 0 (0.0%) | 27 (11.5%) |
| 35 to 44 Years | 0 (0.0%) | 18 (8.1%) |
| 45 to 54 Years | 52 (15.2%) | 68 (18.1%) |
| 55 to 64 Years | 41 (8.0%) | 34 (11.5%) |
| 65 to 74 Years | 0 (0.0%) | 15 (5.5%) |
| 75 Years and over | 0 (0.0%) | 29 (8.1%) |
| Total | 163 (7.3%) | 216 (8.9%) |
Income Above Poverty by Sex and Age in North Westport
According to the poverty statistics in North Westport, males aged 5 years and females aged under 5 years are the age groups that are most secure financially, with 100.0% of males and 100.0% of females in these age groups living above the poverty line.
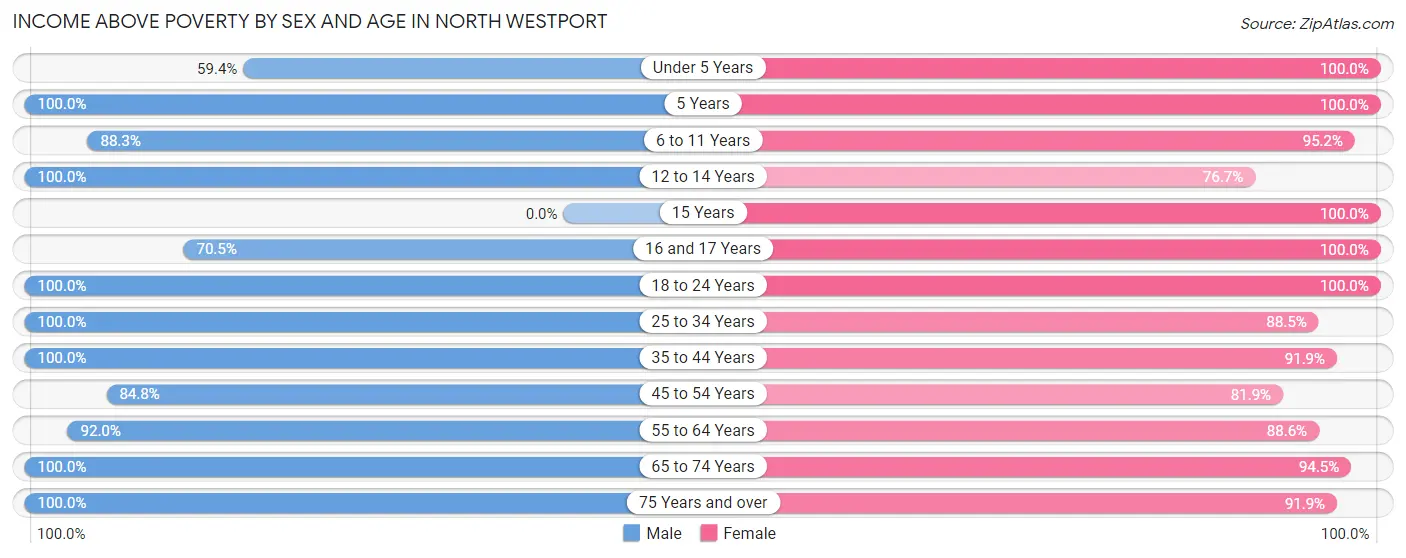
| Age Bracket | Male | Female |
| Under 5 Years | 63 (59.4%) | 94 (100.0%) |
| 5 Years | 24 (100.0%) | 58 (100.0%) |
| 6 to 11 Years | 68 (88.3%) | 159 (95.2%) |
| 12 to 14 Years | 114 (100.0%) | 56 (76.7%) |
| 15 Years | 0 (0.0%) | 48 (100.0%) |
| 16 and 17 Years | 43 (70.5%) | 21 (100.0%) |
| 18 to 24 Years | 111 (100.0%) | 202 (100.0%) |
| 25 to 34 Years | 177 (100.0%) | 208 (88.5%) |
| 35 to 44 Years | 344 (100.0%) | 204 (91.9%) |
| 45 to 54 Years | 290 (84.8%) | 307 (81.9%) |
| 55 to 64 Years | 472 (92.0%) | 263 (88.5%) |
| 65 to 74 Years | 181 (100.0%) | 259 (94.5%) |
| 75 Years and over | 186 (100.0%) | 329 (91.9%) |
| Total | 2,073 (92.7%) | 2,208 (91.1%) |
Income Below Poverty Among Married-Couple Families in North Westport
The poverty statistics for married-couple families in North Westport show that 4.6% or 41 of the total 897 families live below the poverty line. Families with no children have the highest poverty rate of 6.4%, comprising of 41 families. On the other hand, families with 1 or 2 children have the lowest poverty rate of 0.0%, which includes 0 families.
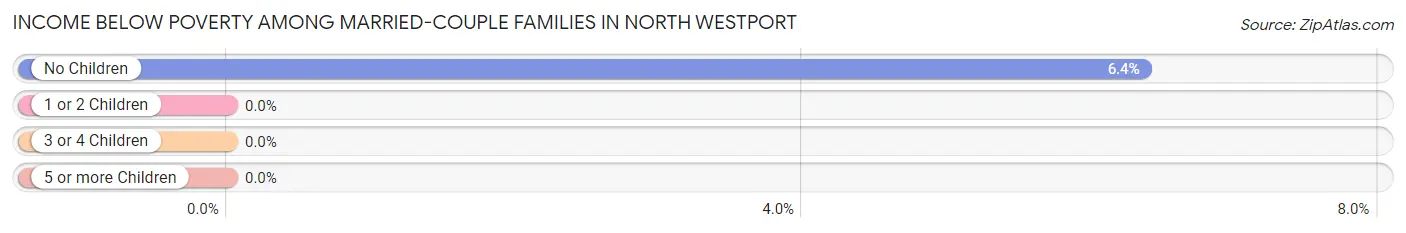
| Children | Above Poverty | Below Poverty |
| No Children | 604 (93.6%) | 41 (6.4%) |
| 1 or 2 Children | 157 (100.0%) | 0 (0.0%) |
| 3 or 4 Children | 71 (100.0%) | 0 (0.0%) |
| 5 or more Children | 24 (100.0%) | 0 (0.0%) |
| Total | 856 (95.4%) | 41 (4.6%) |
Income Below Poverty Among Single-Parent Households in North Westport
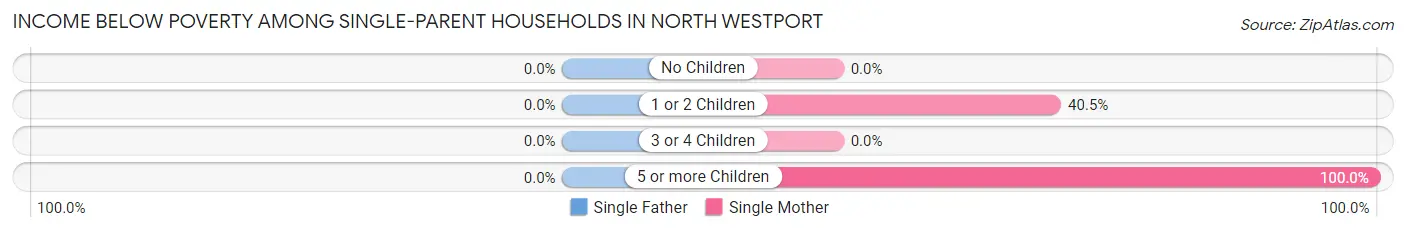
| Children | Single Father | Single Mother |
| No Children | 0 (0.0%) | 0 (0.0%) |
| 1 or 2 Children | 0 (0.0%) | 32 (40.5%) |
| 3 or 4 Children | 0 (0.0%) | 0 (0.0%) |
| 5 or more Children | 0 (0.0%) | 8 (100.0%) |
| Total | 0 (0.0%) | 40 (33.9%) |
Income Below Poverty Among Married-Couple vs Single-Parent Households in North Westport
The poverty data for North Westport shows that 41 of the married-couple family households (4.6%) and 40 of the single-parent households (12.6%) are living below the poverty level. Within the married-couple family households, those with no children have the highest poverty rate, with 41 households (6.4%) falling below the poverty line. Among the single-parent households, those with 5 or more children have the highest poverty rate, with 8 household (100.0%) living below poverty.
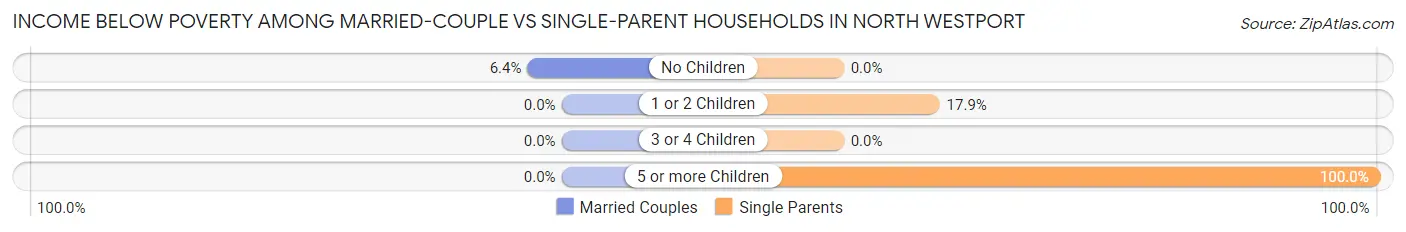
| Children | Married-Couple Families | Single-Parent Households |
| No Children | 41 (6.4%) | 0 (0.0%) |
| 1 or 2 Children | 0 (0.0%) | 32 (17.9%) |
| 3 or 4 Children | 0 (0.0%) | 0 (0.0%) |
| 5 or more Children | 0 (0.0%) | 8 (100.0%) |
| Total | 41 (4.6%) | 40 (12.6%) |
Race in North Westport
The most populous races in North Westport are White / Caucasian (4,460 | 95.7%), Two or more Races (151 | 3.2%), and Some other Race (49 | 1.1%).
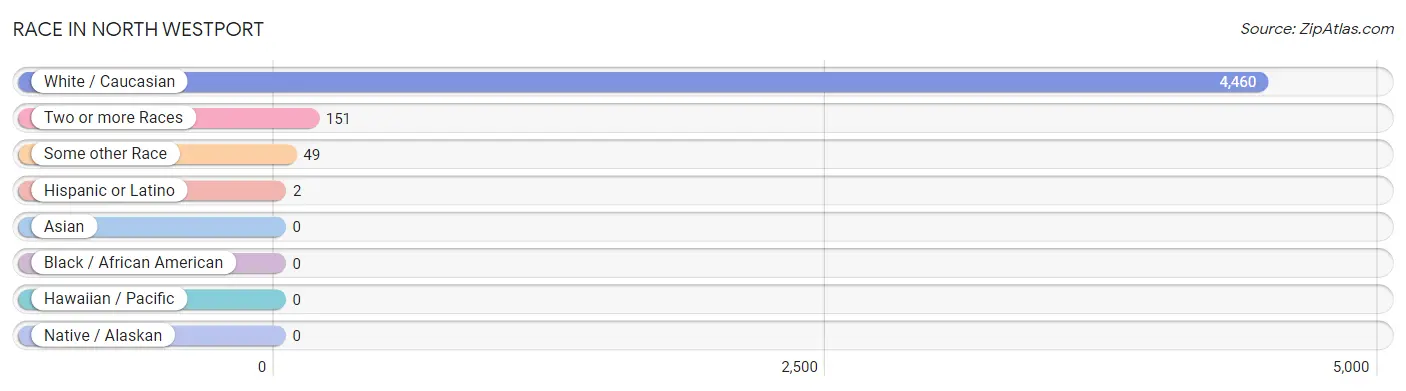
| Race | # Population | % Population |
| Asian | 0 | 0.0% |
| Black / African American | 0 | 0.0% |
| Hawaiian / Pacific | 0 | 0.0% |
| Hispanic or Latino | 2 | 0.0% |
| Native / Alaskan | 0 | 0.0% |
| White / Caucasian | 4,460 | 95.7% |
| Two or more Races | 151 | 3.2% |
| Some other Race | 49 | 1.1% |
| Total | 4,660 | 100.0% |
Ancestry in North Westport
The most populous ancestries reported in North Westport are Portuguese (2,245 | 48.2%), French (839 | 18.0%), English (714 | 15.3%), Irish (268 | 5.8%), and French Canadian (204 | 4.4%), together accounting for 91.6% of all North Westport residents.
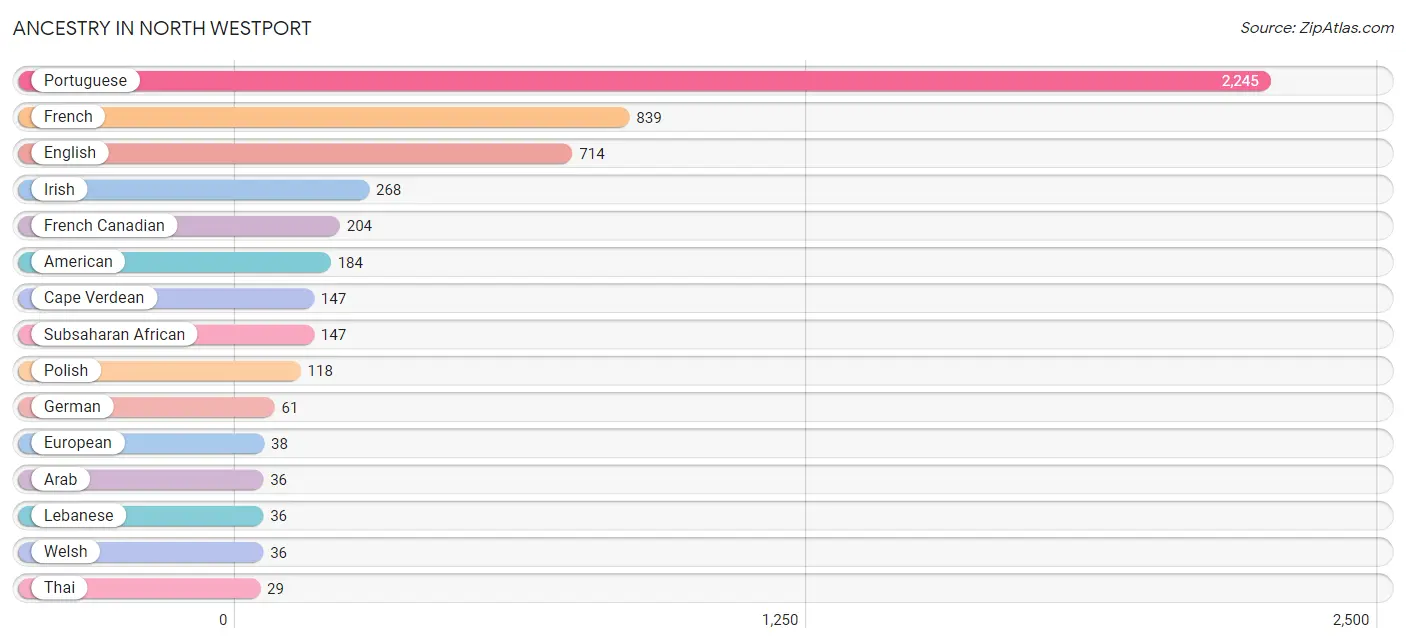
| Ancestry | # Population | % Population |
| American | 184 | 4.0% |
| Arab | 36 | 0.8% |
| Brazilian | 16 | 0.3% |
| Cape Verdean | 147 | 3.2% |
| English | 714 | 15.3% |
| European | 38 | 0.8% |
| French | 839 | 18.0% |
| French American Indian | 3 | 0.1% |
| French Canadian | 204 | 4.4% |
| German | 61 | 1.3% |
| Irish | 268 | 5.8% |
| Italian | 7 | 0.2% |
| Lebanese | 36 | 0.8% |
| Mexican | 1 | 0.0% |
| Polish | 118 | 2.5% |
| Portuguese | 2,245 | 48.2% |
| Puerto Rican | 1 | 0.0% |
| Scottish | 8 | 0.2% |
| Subsaharan African | 147 | 3.2% |
| Thai | 29 | 0.6% |
| Welsh | 36 | 0.8% | View All 21 Rows |
Immigrants in North Westport
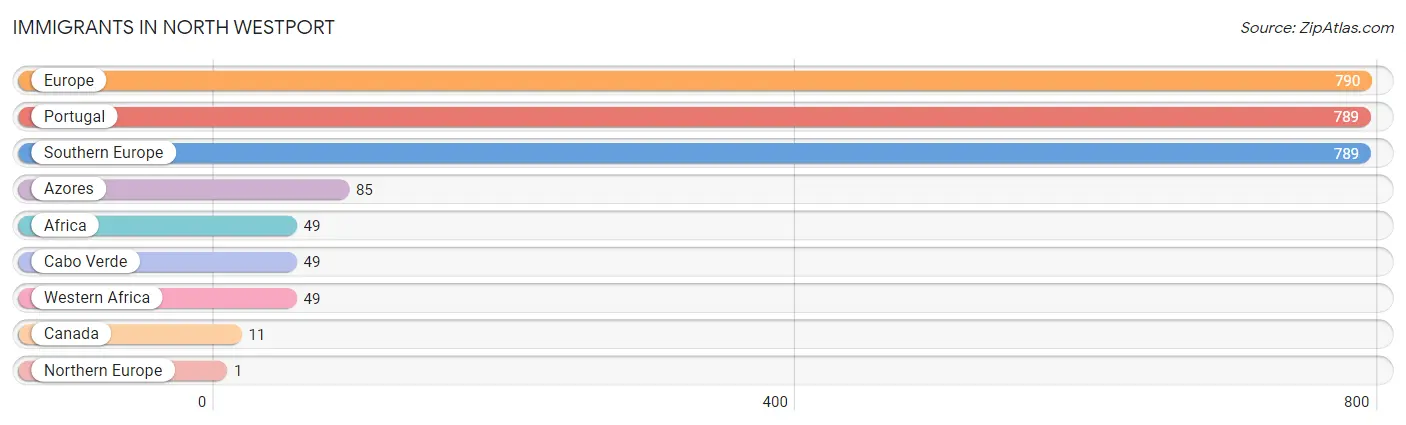
The most numerous immigrant groups reported in North Westport came from Europe (790 | 17.0%), Portugal (789 | 16.9%), Southern Europe (789 | 16.9%), Azores (85 | 1.8%), and Africa (49 | 1.1%), together accounting for 53.7% of all North Westport residents.
| Immigration Origin | # Population | % Population |
| Africa | 49 | 1.1% |
| Azores | 85 | 1.8% |
| Cabo Verde | 49 | 1.1% |
| Canada | 11 | 0.2% |
| Europe | 790 | 17.0% |
| Northern Europe | 1 | 0.0% |
| Portugal | 789 | 16.9% |
| Southern Europe | 789 | 16.9% |
| Western Africa | 49 | 1.1% | View All 9 Rows |
Sex and Age in North Westport
Sex and Age in North Westport
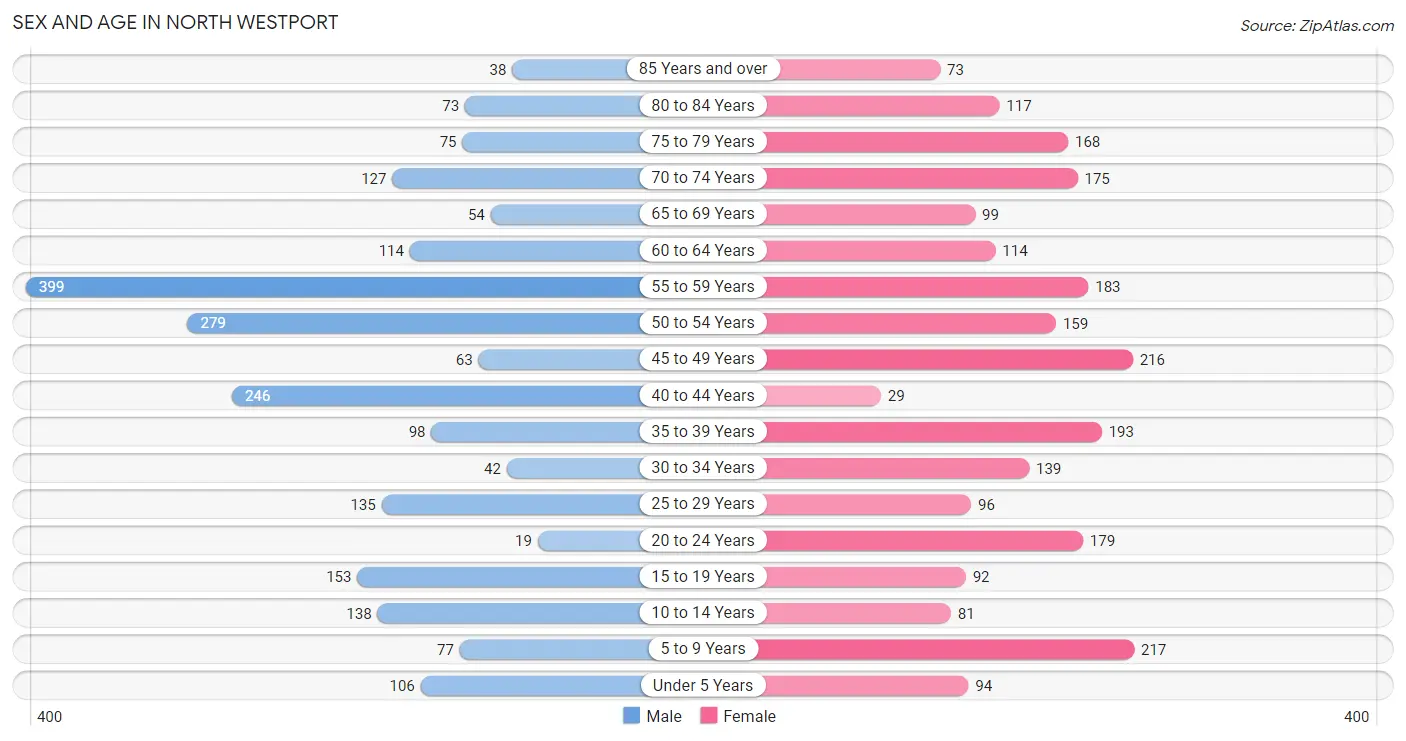
The most populous age groups in North Westport are 55 to 59 Years (399 | 17.8%) for men and 5 to 9 Years (217 | 8.9%) for women.
| Age Bracket | Male | Female |
| Under 5 Years | 106 (4.7%) | 94 (3.9%) |
| 5 to 9 Years | 77 (3.4%) | 217 (8.9%) |
| 10 to 14 Years | 138 (6.2%) | 81 (3.3%) |
| 15 to 19 Years | 153 (6.8%) | 92 (3.8%) |
| 20 to 24 Years | 19 (0.9%) | 179 (7.4%) |
| 25 to 29 Years | 135 (6.0%) | 96 (4.0%) |
| 30 to 34 Years | 42 (1.9%) | 139 (5.7%) |
| 35 to 39 Years | 98 (4.4%) | 193 (8.0%) |
| 40 to 44 Years | 246 (11.0%) | 29 (1.2%) |
| 45 to 49 Years | 63 (2.8%) | 216 (8.9%) |
| 50 to 54 Years | 279 (12.5%) | 159 (6.6%) |
| 55 to 59 Years | 399 (17.8%) | 183 (7.5%) |
| 60 to 64 Years | 114 (5.1%) | 114 (4.7%) |
| 65 to 69 Years | 54 (2.4%) | 99 (4.1%) |
| 70 to 74 Years | 127 (5.7%) | 175 (7.2%) |
| 75 to 79 Years | 75 (3.4%) | 168 (6.9%) |
| 80 to 84 Years | 73 (3.3%) | 117 (4.8%) |
| 85 Years and over | 38 (1.7%) | 73 (3.0%) |
| Total | 2,236 (100.0%) | 2,424 (100.0%) |
Families and Households in North Westport
Median Family Size in North Westport
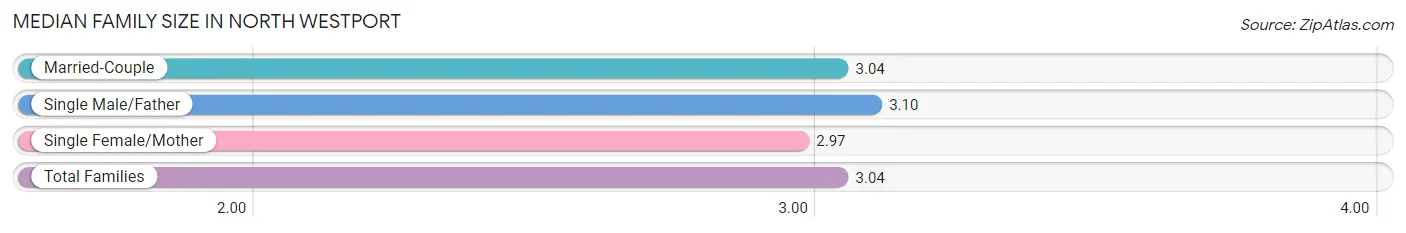
The median family size in North Westport is 3.04 persons per family, with single male/father families (200 | 16.5%) accounting for the largest median family size of 3.1 persons per family. On the other hand, single female/mother families (118 | 9.7%) represent the smallest median family size with 2.97 persons per family.
| Family Type | # Families | Family Size |
| Married-Couple | 897 (73.8%) | 3.04 |
| Single Male/Father | 200 (16.5%) | 3.10 |
| Single Female/Mother | 118 (9.7%) | 2.97 |
| Total Families | 1,215 (100.0%) | 3.04 |
Median Household Size in North Westport
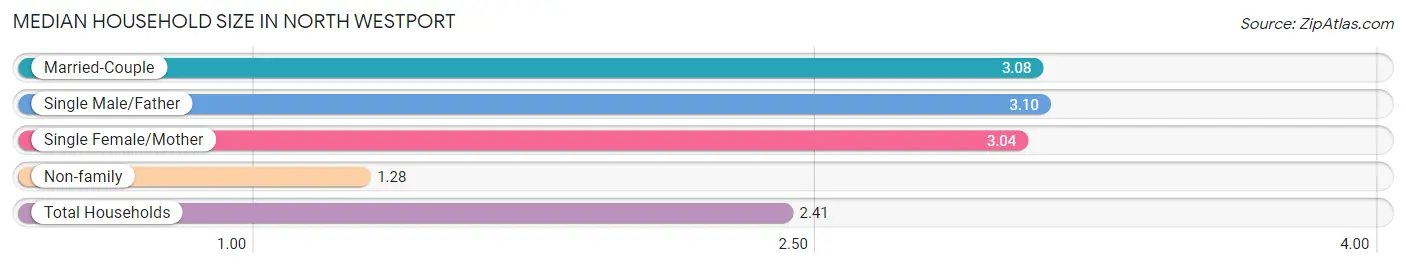
The median household size in North Westport is 2.41 persons per household, with single male/father households (200 | 10.4%) accounting for the largest median household size of 3.1 persons per household. non-family households (716 | 37.1%) represent the smallest median household size with 1.28 persons per household.
| Household Type | # Households | Household Size |
| Married-Couple | 897 (46.5%) | 3.08 |
| Single Male/Father | 200 (10.4%) | 3.10 |
| Single Female/Mother | 118 (6.1%) | 3.04 |
| Non-family | 716 (37.1%) | 1.28 |
| Total Households | 1,931 (100.0%) | 2.41 |
Household Size by Marriage Status in North Westport
Out of a total of 1,931 households in North Westport, 1,215 (62.9%) are family households, while 716 (37.1%) are nonfamily households. The most numerous type of family households are 3-person households, comprising 427, and the most common type of nonfamily households are 1-person households, comprising 573.
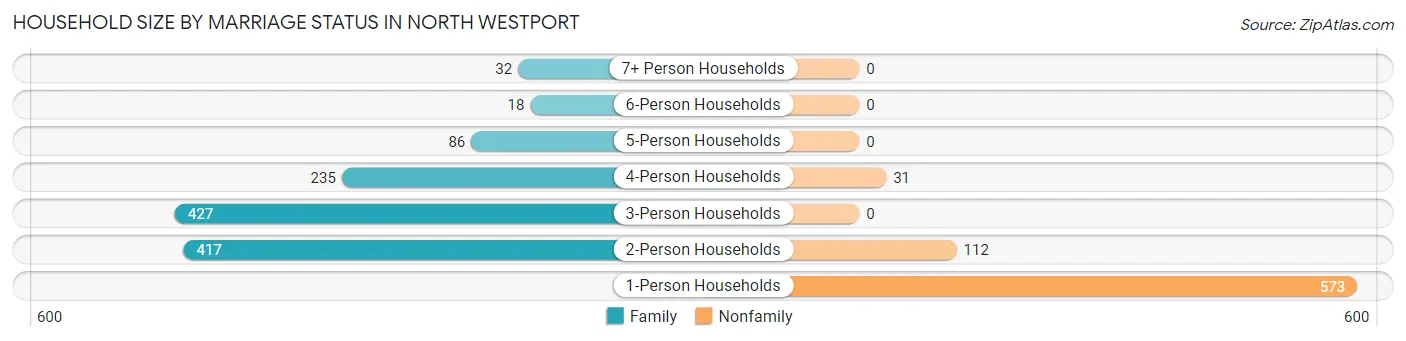
| Household Size | Family Households | Nonfamily Households |
| 1-Person Households | - | 573 (29.7%) |
| 2-Person Households | 417 (21.6%) | 112 (5.8%) |
| 3-Person Households | 427 (22.1%) | 0 (0.0%) |
| 4-Person Households | 235 (12.2%) | 31 (1.6%) |
| 5-Person Households | 86 (4.4%) | 0 (0.0%) |
| 6-Person Households | 18 (0.9%) | 0 (0.0%) |
| 7+ Person Households | 32 (1.7%) | 0 (0.0%) |
| Total | 1,215 (62.9%) | 716 (37.1%) |
Female Fertility in North Westport
Fertility by Age in North Westport
Average fertility rate in North Westport is 24.0 births per 1,000 women. Women in the age bracket of 35 to 50 years have the highest fertility rate with 32.0 births per 1,000 women. Women in the age bracket of 35 to 50 years acount for 66.7% of all women with births.
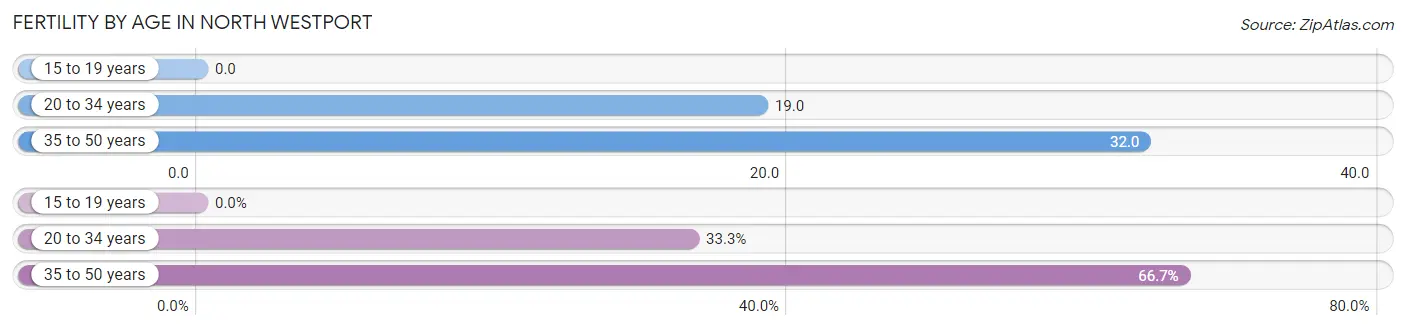
| Age Bracket | Women with Births | Births / 1,000 Women |
| 15 to 19 years | 0 (0.0%) | 0.0 |
| 20 to 34 years | 8 (33.3%) | 19.0 |
| 35 to 50 years | 16 (66.7%) | 32.0 |
| Total | 24 (100.0%) | 24.0 |
Fertility by Age by Marriage Status in North Westport
66.7% of women with births (24) in North Westport are married. The highest percentage of unmarried women with births falls into 20 to 34 years age bracket with 100.0% of them unmarried at the time of birth, while the lowest percentage of unmarried women with births belong to 35 to 50 years age bracket with 0.0% of them unmarried.
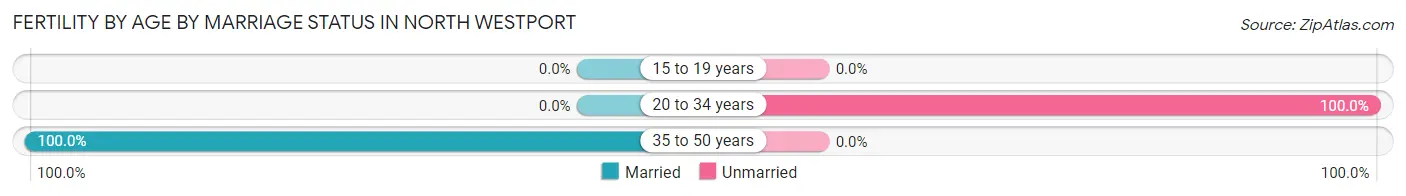
| Age Bracket | Married | Unmarried |
| 15 to 19 years | 0 (0.0%) | 0 (0.0%) |
| 20 to 34 years | 0 (0.0%) | 8 (100.0%) |
| 35 to 50 years | 16 (100.0%) | 0 (0.0%) |
| Total | 16 (66.7%) | 8 (33.3%) |
Fertility by Education in North Westport
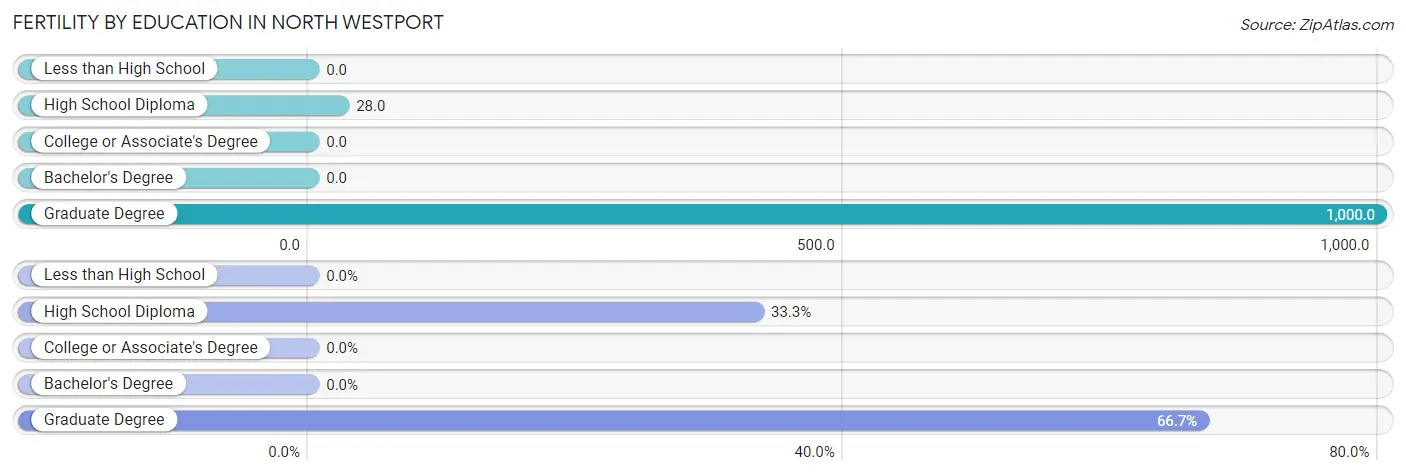
| Educational Attainment | Women with Births | Births / 1,000 Women |
| Less than High School | 0 (0.0%) | 0.0 |
| High School Diploma | 8 (33.3%) | 28.0 |
| College or Associate's Degree | 0 (0.0%) | 0.0 |
| Bachelor's Degree | 0 (0.0%) | 0.0 |
| Graduate Degree | 16 (66.7%) | 1,000.0 |
| Total | 24 (100.0%) | 24.0 |
Fertility by Education by Marriage Status in North Westport
33.3% of women with births in North Westport are unmarried. Women with the educational attainment of graduate degree are most likely to be married with 100.0% of them married at childbirth, while women with the educational attainment of high school diploma are least likely to be married with 100.0% of them unmarried at childbirth.
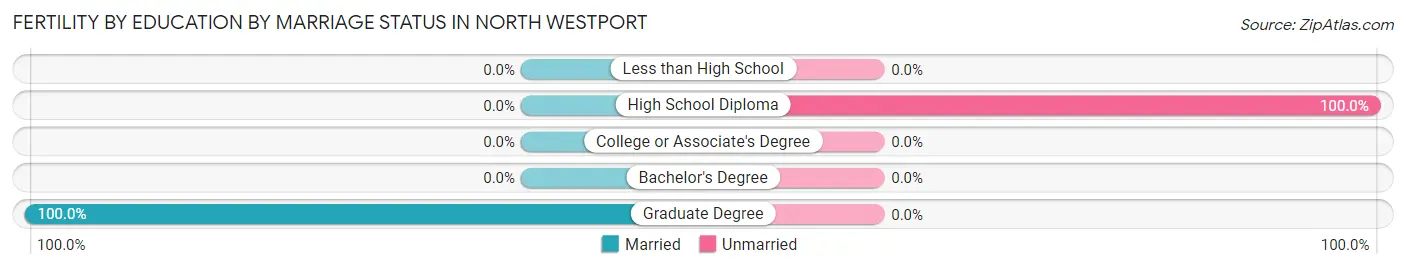
| Educational Attainment | Married | Unmarried |
| Less than High School | 0 (0.0%) | 0 (0.0%) |
| High School Diploma | 0 (0.0%) | 8 (100.0%) |
| College or Associate's Degree | 0 (0.0%) | 0 (0.0%) |
| Bachelor's Degree | 0 (0.0%) | 0 (0.0%) |
| Graduate Degree | 16 (100.0%) | 0 (0.0%) |
| Total | 16 (66.7%) | 8 (33.3%) |
Employment Characteristics in North Westport
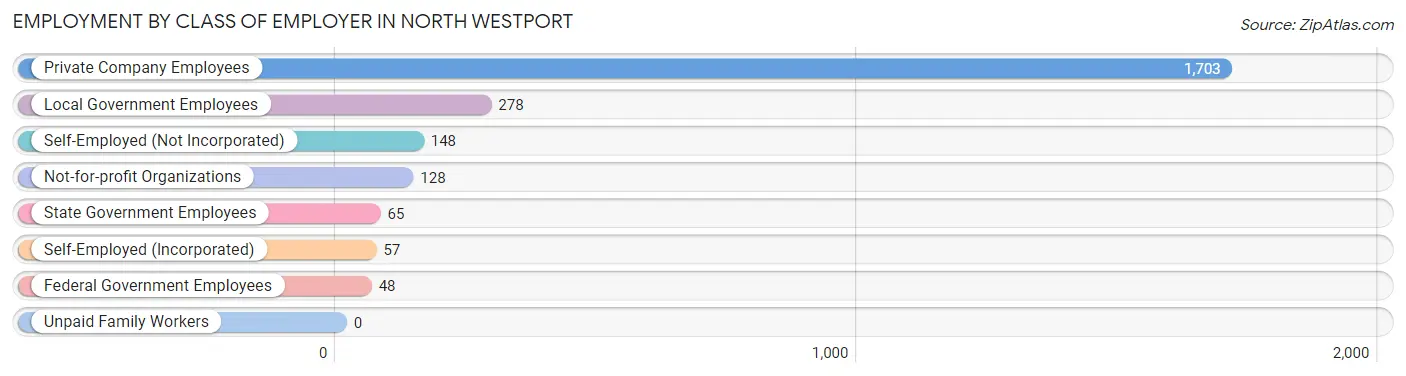
Employment by Class of Employer in North Westport
Among the 2,427 employed individuals in North Westport, private company employees (1,703 | 70.2%), local government employees (278 | 11.5%), and self-employed (not incorporated) (148 | 6.1%) make up the most common classes of employment.
| Employer Class | # Employees | % Employees |
| Private Company Employees | 1,703 | 70.2% |
| Self-Employed (Incorporated) | 57 | 2.4% |
| Self-Employed (Not Incorporated) | 148 | 6.1% |
| Not-for-profit Organizations | 128 | 5.3% |
| Local Government Employees | 278 | 11.5% |
| State Government Employees | 65 | 2.7% |
| Federal Government Employees | 48 | 2.0% |
| Unpaid Family Workers | 0 | 0.0% |
| Total | 2,427 | 100.0% |
Employment Status by Age in North Westport
According to the labor force statistics for North Westport, out of the total population over 16 years of age (3,899), 63.7% or 2,484 individuals are in the labor force, with 1.7% or 42 of them unemployed. The age group with the highest labor force participation rate is 25 to 29 years, with 100.0% or 231 individuals in the labor force. Within the labor force, the 16 to 19 years age range has the highest percentage of unemployed individuals, with 11.9% or 20 of them being unemployed.
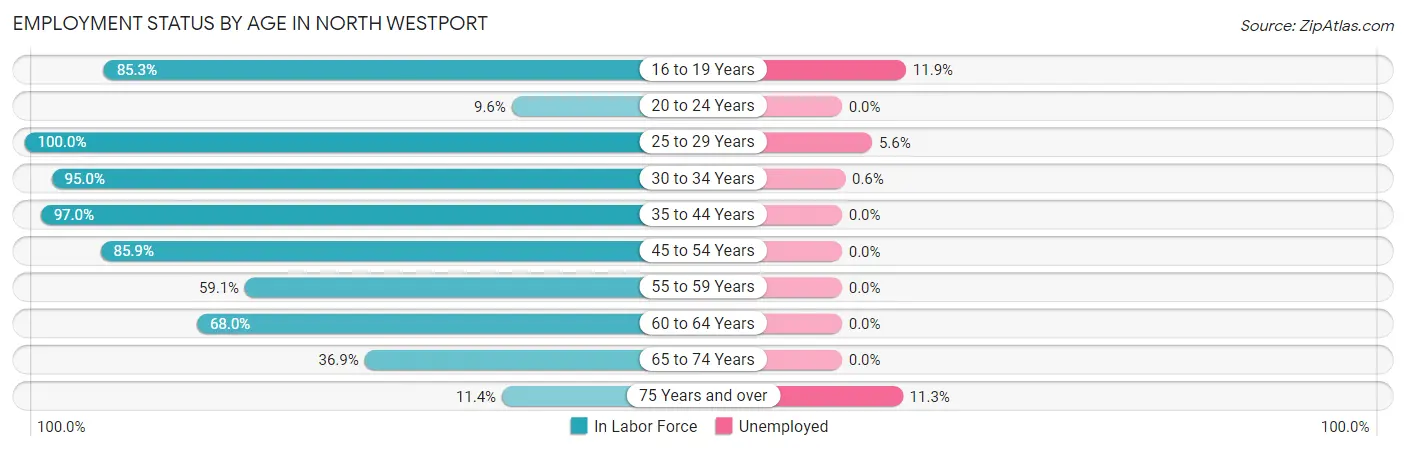
| Age Bracket | In Labor Force | Unemployed |
| 16 to 19 Years | 168 (85.3%) | 20 (11.9%) |
| 20 to 24 Years | 19 (9.6%) | 0 (0.0%) |
| 25 to 29 Years | 231 (100.0%) | 13 (5.6%) |
| 30 to 34 Years | 172 (95.0%) | 1 (0.6%) |
| 35 to 44 Years | 549 (97.0%) | 0 (0.0%) |
| 45 to 54 Years | 616 (85.9%) | 0 (0.0%) |
| 55 to 59 Years | 344 (59.1%) | 0 (0.0%) |
| 60 to 64 Years | 155 (68.0%) | 0 (0.0%) |
| 65 to 74 Years | 168 (36.9%) | 0 (0.0%) |
| 75 Years and over | 62 (11.4%) | 7 (11.3%) |
| Total | 2,484 (63.7%) | 42 (1.7%) |
Employment Status by Educational Attainment in North Westport
According to labor force statistics for North Westport, 82.5% of individuals (2,067) out of the total population between 25 and 64 years of age (2,505) are in the labor force, with 0.7% or 14 of them being unemployed. The group with the highest labor force participation rate are those with the educational attainment of bachelor's degree or higher, with 96.2% or 507 individuals in the labor force. Within the labor force, individuals with bachelor's degree or higher education have the highest percentage of unemployment, with 2.6% or 13 of them being unemployed.
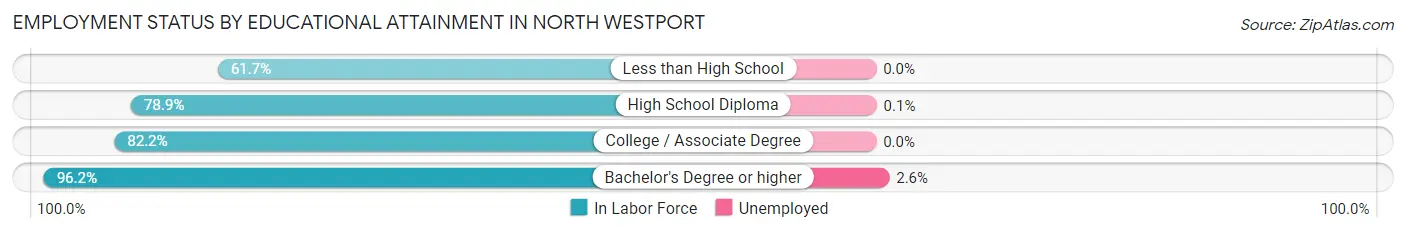
| Educational Attainment | In Labor Force | Unemployed |
| Less than High School | 87 (61.7%) | 0 (0.0%) |
| High School Diploma | 887 (78.9%) | 1 (0.1%) |
| College / Associate Degree | 586 (82.2%) | 0 (0.0%) |
| Bachelor's Degree or higher | 507 (96.2%) | 14 (2.6%) |
| Total | 2,067 (82.5%) | 18 (0.7%) |
Employment Occupations by Sex in North Westport
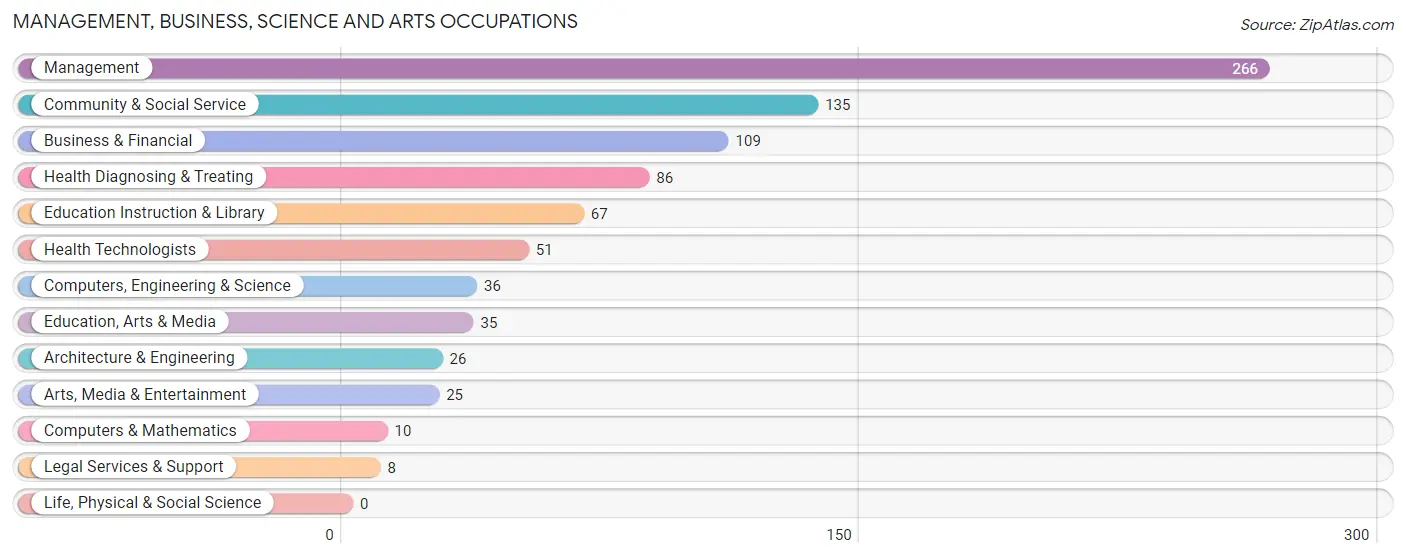
Management, Business, Science and Arts Occupations
The most common Management, Business, Science and Arts occupations in North Westport are Management (266 | 10.9%), Community & Social Service (135 | 5.5%), Business & Financial (109 | 4.5%), Health Diagnosing & Treating (86 | 3.5%), and Education Instruction & Library (67 | 2.7%).
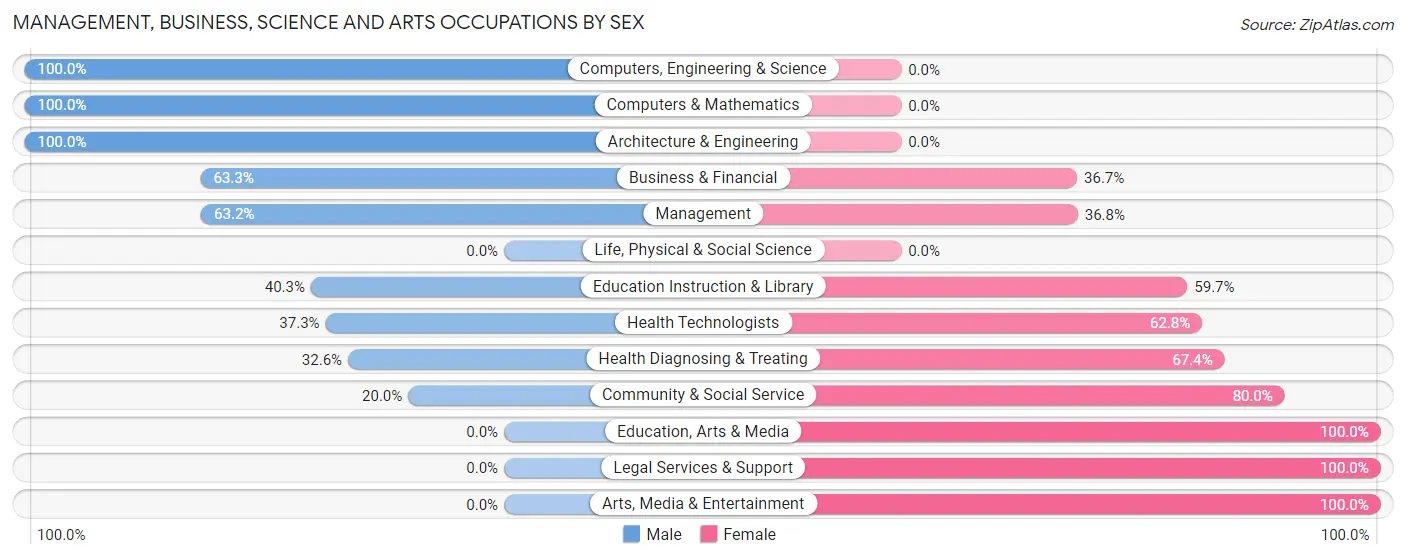
Management, Business, Science and Arts Occupations by Sex
Within the Management, Business, Science and Arts occupations in North Westport, the most male-oriented occupations are Computers, Engineering & Science (100.0%), Computers & Mathematics (100.0%), and Architecture & Engineering (100.0%), while the most female-oriented occupations are Education, Arts & Media (100.0%), Legal Services & Support (100.0%), and Arts, Media & Entertainment (100.0%).
| Occupation | Male | Female |
| Management | 168 (63.2%) | 98 (36.8%) |
| Business & Financial | 69 (63.3%) | 40 (36.7%) |
| Computers, Engineering & Science | 36 (100.0%) | 0 (0.0%) |
| Computers & Mathematics | 10 (100.0%) | 0 (0.0%) |
| Architecture & Engineering | 26 (100.0%) | 0 (0.0%) |
| Life, Physical & Social Science | 0 (0.0%) | 0 (0.0%) |
| Community & Social Service | 27 (20.0%) | 108 (80.0%) |
| Education, Arts & Media | 0 (0.0%) | 35 (100.0%) |
| Legal Services & Support | 0 (0.0%) | 8 (100.0%) |
| Education Instruction & Library | 27 (40.3%) | 40 (59.7%) |
| Arts, Media & Entertainment | 0 (0.0%) | 25 (100.0%) |
| Health Diagnosing & Treating | 28 (32.6%) | 58 (67.4%) |
| Health Technologists | 19 (37.2%) | 32 (62.7%) |
| Total (Category) | 328 (51.9%) | 304 (48.1%) |
| Total (Overall) | 1,317 (53.9%) | 1,126 (46.1%) |
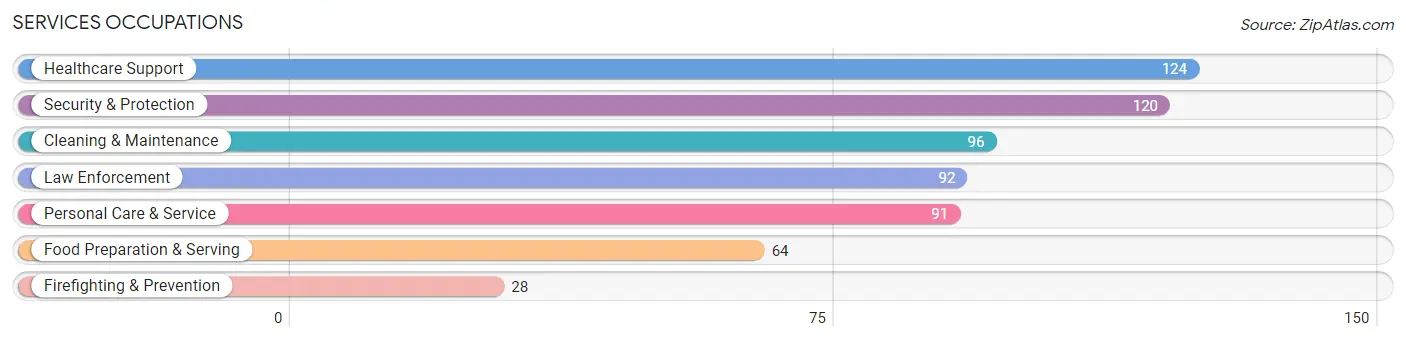
Services Occupations
The most common Services occupations in North Westport are Healthcare Support (124 | 5.1%), Security & Protection (120 | 4.9%), Cleaning & Maintenance (96 | 3.9%), Law Enforcement (92 | 3.8%), and Personal Care & Service (91 | 3.7%).
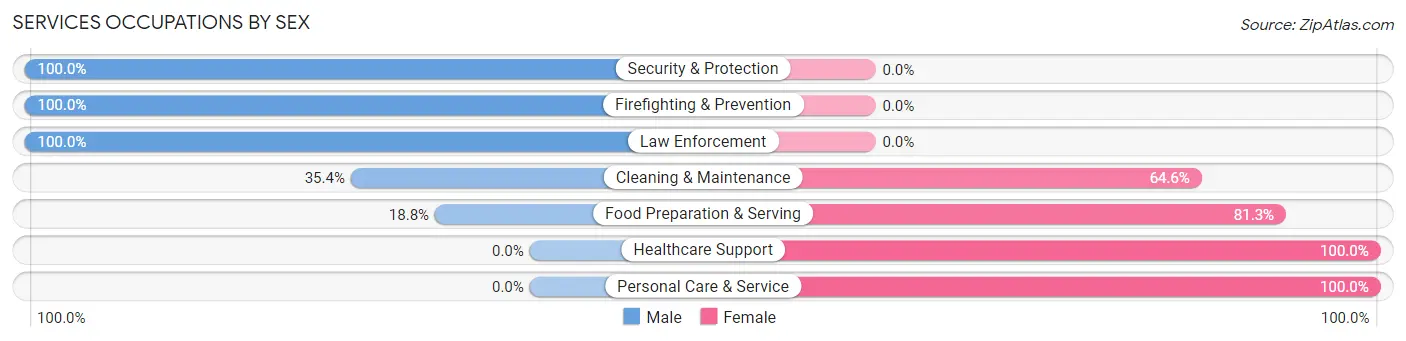
Services Occupations by Sex
Within the Services occupations in North Westport, the most male-oriented occupations are Security & Protection (100.0%), Firefighting & Prevention (100.0%), and Law Enforcement (100.0%), while the most female-oriented occupations are Healthcare Support (100.0%), Personal Care & Service (100.0%), and Food Preparation & Serving (81.2%).
| Occupation | Male | Female |
| Healthcare Support | 0 (0.0%) | 124 (100.0%) |
| Security & Protection | 120 (100.0%) | 0 (0.0%) |
| Firefighting & Prevention | 28 (100.0%) | 0 (0.0%) |
| Law Enforcement | 92 (100.0%) | 0 (0.0%) |
| Food Preparation & Serving | 12 (18.8%) | 52 (81.2%) |
| Cleaning & Maintenance | 34 (35.4%) | 62 (64.6%) |
| Personal Care & Service | 0 (0.0%) | 91 (100.0%) |
| Total (Category) | 166 (33.5%) | 329 (66.5%) |
| Total (Overall) | 1,317 (53.9%) | 1,126 (46.1%) |
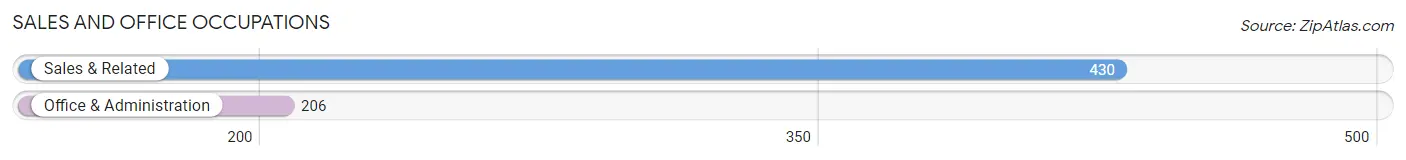
Sales and Office Occupations
The most common Sales and Office occupations in North Westport are Sales & Related (430 | 17.6%), and Office & Administration (206 | 8.4%).
Sales and Office Occupations by Sex

| Occupation | Male | Female |
| Sales & Related | 150 (34.9%) | 280 (65.1%) |
| Office & Administration | 19 (9.2%) | 187 (90.8%) |
| Total (Category) | 169 (26.6%) | 467 (73.4%) |
| Total (Overall) | 1,317 (53.9%) | 1,126 (46.1%) |
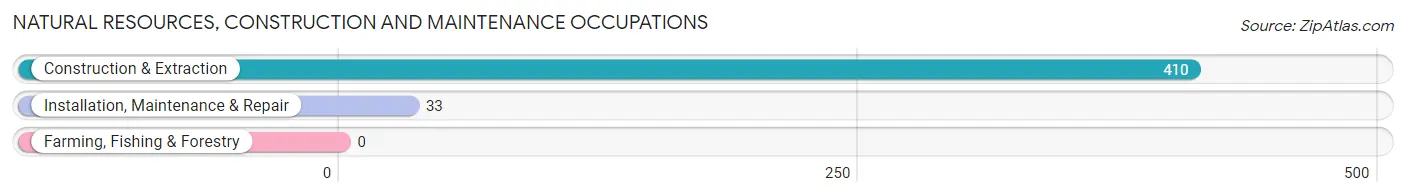
Natural Resources, Construction and Maintenance Occupations
The most common Natural Resources, Construction and Maintenance occupations in North Westport are Construction & Extraction (410 | 16.8%), and Installation, Maintenance & Repair (33 | 1.3%).
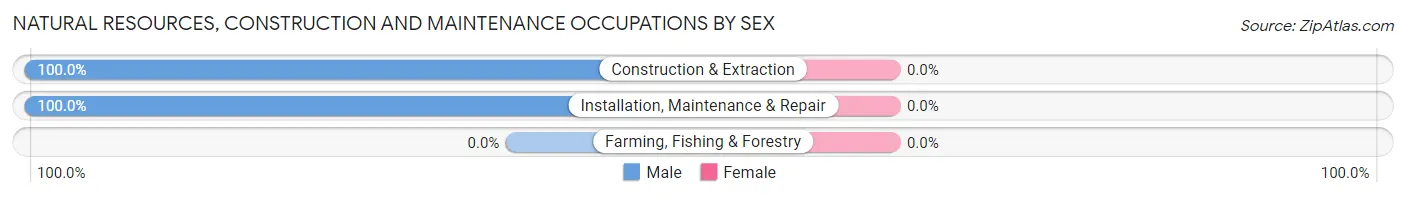
Natural Resources, Construction and Maintenance Occupations by Sex
| Occupation | Male | Female |
| Farming, Fishing & Forestry | 0 (0.0%) | 0 (0.0%) |
| Construction & Extraction | 410 (100.0%) | 0 (0.0%) |
| Installation, Maintenance & Repair | 33 (100.0%) | 0 (0.0%) |
| Total (Category) | 443 (100.0%) | 0 (0.0%) |
| Total (Overall) | 1,317 (53.9%) | 1,126 (46.1%) |
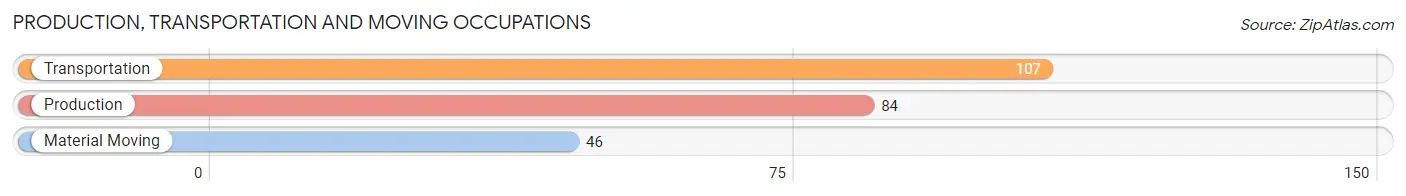
Production, Transportation and Moving Occupations
The most common Production, Transportation and Moving occupations in North Westport are Transportation (107 | 4.4%), Production (84 | 3.4%), and Material Moving (46 | 1.9%).
Production, Transportation and Moving Occupations by Sex
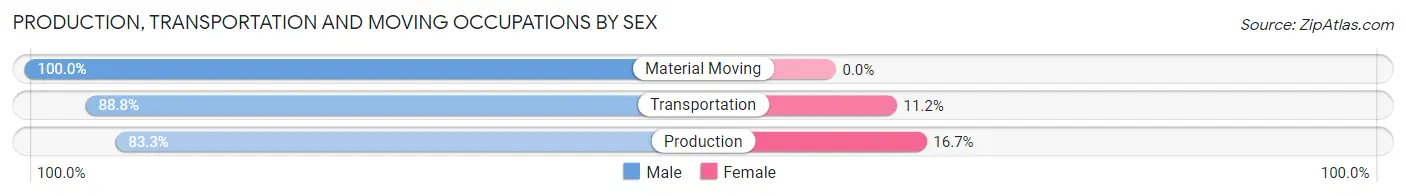
| Occupation | Male | Female |
| Production | 70 (83.3%) | 14 (16.7%) |
| Transportation | 95 (88.8%) | 12 (11.2%) |
| Material Moving | 46 (100.0%) | 0 (0.0%) |
| Total (Category) | 211 (89.0%) | 26 (11.0%) |
| Total (Overall) | 1,317 (53.9%) | 1,126 (46.1%) |
Employment Industries by Sex in North Westport
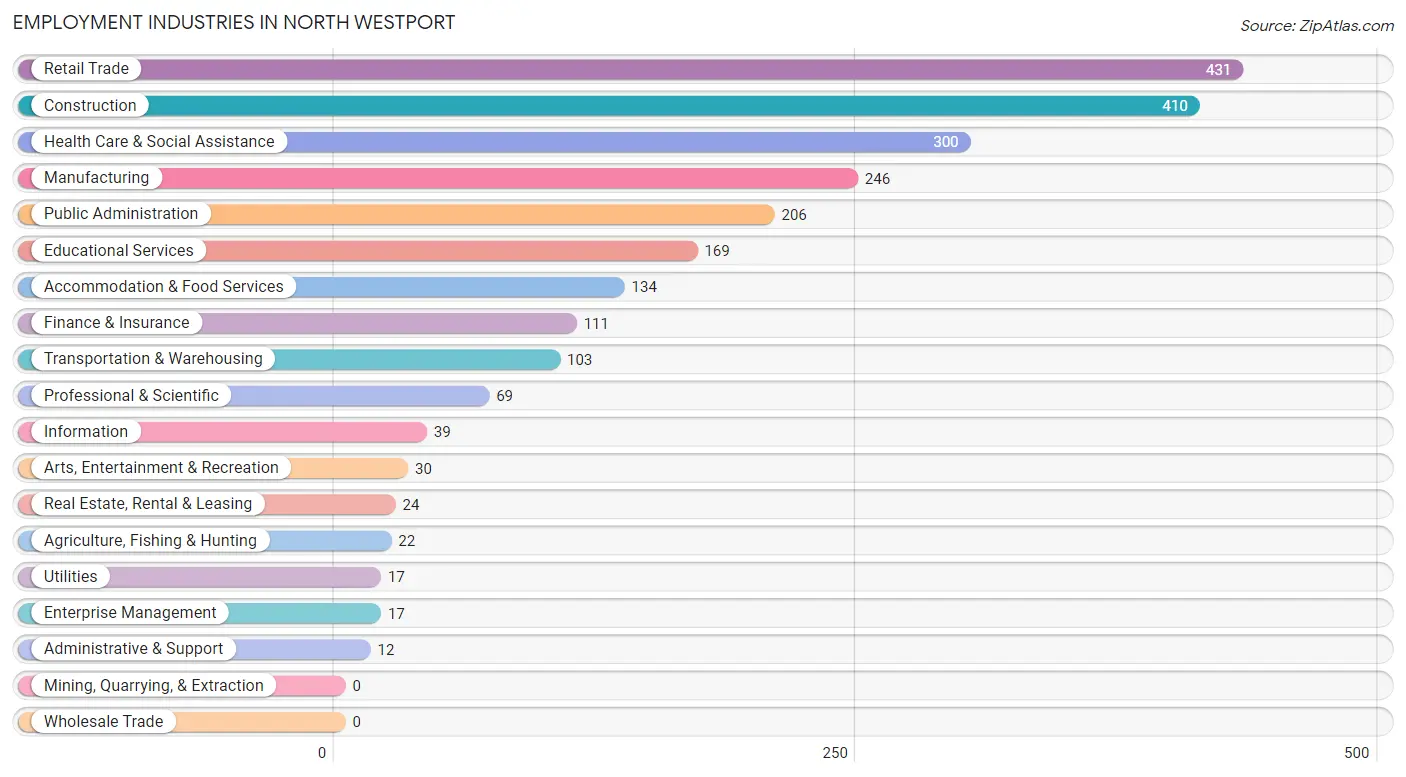
Employment Industries in North Westport
The major employment industries in North Westport include Retail Trade (431 | 17.6%), Construction (410 | 16.8%), Health Care & Social Assistance (300 | 12.3%), Manufacturing (246 | 10.1%), and Public Administration (206 | 8.4%).
Employment Industries by Sex in North Westport
The North Westport industries that see more men than women are Agriculture, Fishing & Hunting (100.0%), Utilities (100.0%), and Information (100.0%), whereas the industries that tend to have a higher number of women are Real Estate, Rental & Leasing (100.0%), Arts, Entertainment & Recreation (100.0%), and Accommodation & Food Services (91.0%).
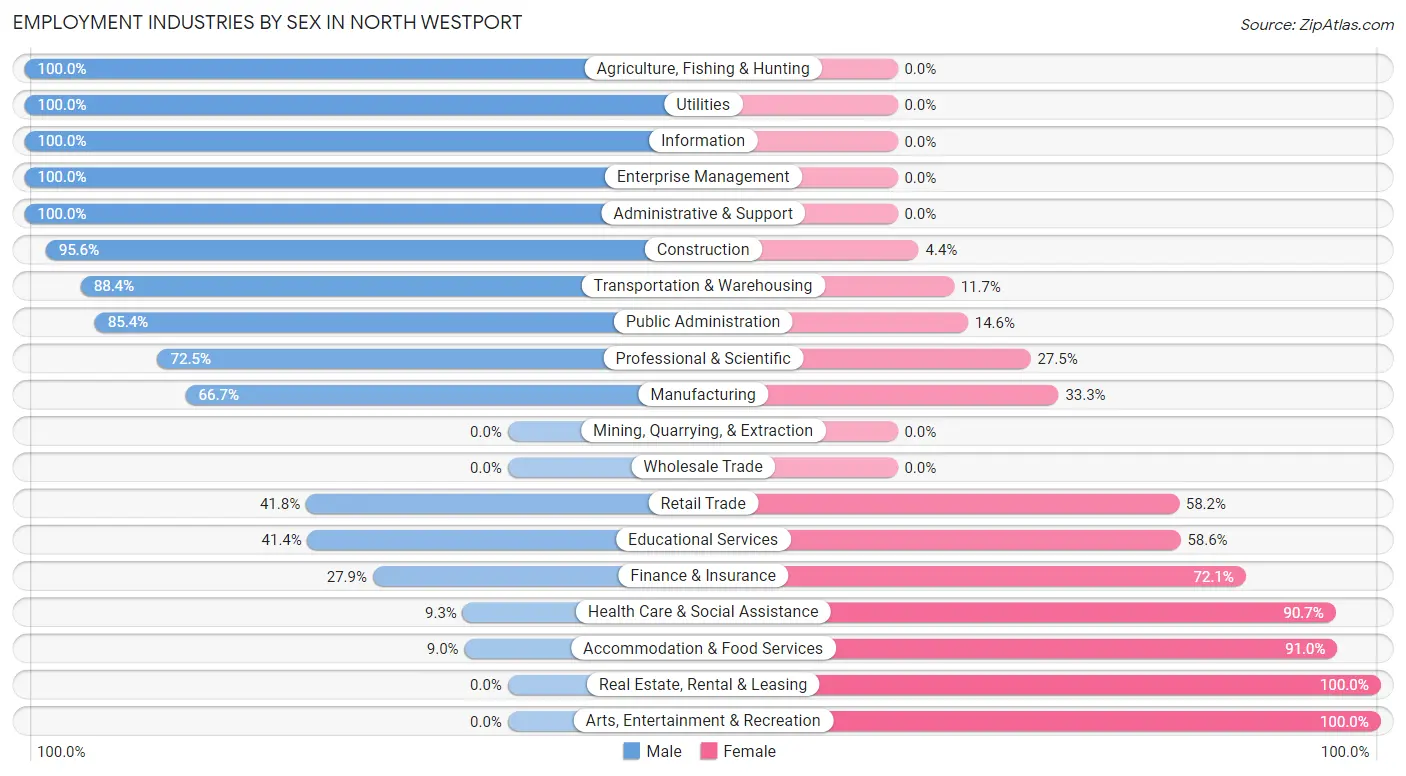
| Industry | Male | Female |
| Agriculture, Fishing & Hunting | 22 (100.0%) | 0 (0.0%) |
| Mining, Quarrying, & Extraction | 0 (0.0%) | 0 (0.0%) |
| Construction | 392 (95.6%) | 18 (4.4%) |
| Manufacturing | 164 (66.7%) | 82 (33.3%) |
| Wholesale Trade | 0 (0.0%) | 0 (0.0%) |
| Retail Trade | 180 (41.8%) | 251 (58.2%) |
| Transportation & Warehousing | 91 (88.3%) | 12 (11.7%) |
| Utilities | 17 (100.0%) | 0 (0.0%) |
| Information | 39 (100.0%) | 0 (0.0%) |
| Finance & Insurance | 31 (27.9%) | 80 (72.1%) |
| Real Estate, Rental & Leasing | 0 (0.0%) | 24 (100.0%) |
| Professional & Scientific | 50 (72.5%) | 19 (27.5%) |
| Enterprise Management | 17 (100.0%) | 0 (0.0%) |
| Administrative & Support | 12 (100.0%) | 0 (0.0%) |
| Educational Services | 70 (41.4%) | 99 (58.6%) |
| Health Care & Social Assistance | 28 (9.3%) | 272 (90.7%) |
| Arts, Entertainment & Recreation | 0 (0.0%) | 30 (100.0%) |
| Accommodation & Food Services | 12 (9.0%) | 122 (91.0%) |
| Public Administration | 176 (85.4%) | 30 (14.6%) |
| Total | 1,317 (53.9%) | 1,126 (46.1%) |
Education in North Westport
School Enrollment in North Westport
The most common levels of schooling among the 912 students in North Westport are college / undergraduate (284 | 31.1%), middle school (183 | 20.1%), and high school (166 | 18.2%).
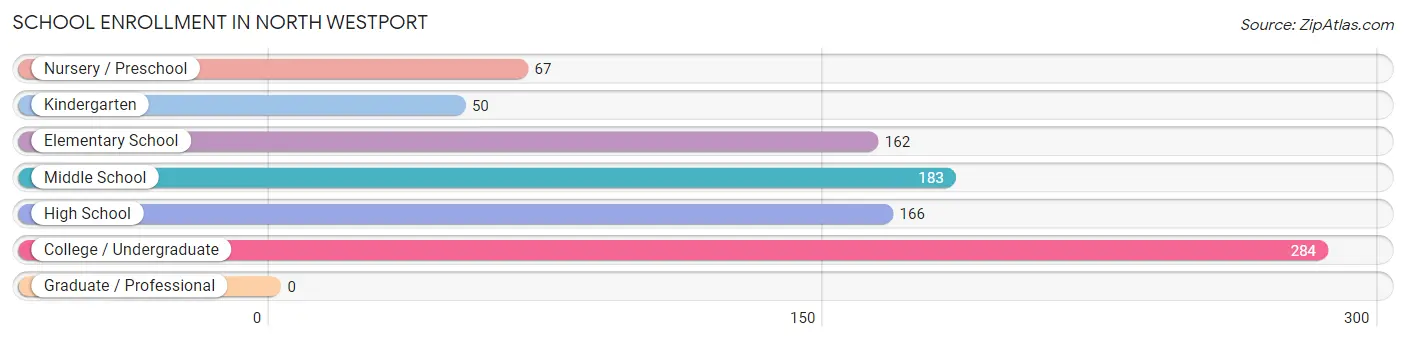
| School Level | # Students | % Students |
| Nursery / Preschool | 67 | 7.3% |
| Kindergarten | 50 | 5.5% |
| Elementary School | 162 | 17.8% |
| Middle School | 183 | 20.1% |
| High School | 166 | 18.2% |
| College / Undergraduate | 284 | 31.1% |
| Graduate / Professional | 0 | 0.0% |
| Total | 912 | 100.0% |
School Enrollment by Age by Funding Source in North Westport
Out of a total of 912 students who are enrolled in schools in North Westport, 254 (27.9%) attend a private institution, while the remaining 658 (72.1%) are enrolled in public schools. The age group of 20 to 24 year olds has the highest likelihood of being enrolled in private schools, with 105 (59.0% in the age bracket) enrolled. Conversely, the age group of 15 to 17 year olds has the lowest likelihood of being enrolled in a private school, with 130 (100.0% in the age bracket) attending a public institution.
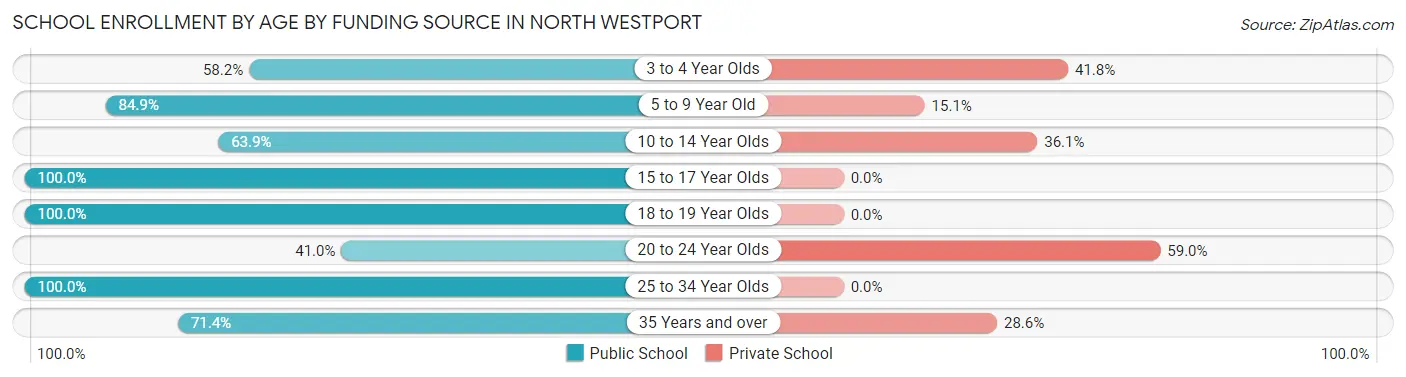
| Age Bracket | Public School | Private School |
| 3 to 4 Year Olds | 39 (58.2%) | 28 (41.8%) |
| 5 to 9 Year Old | 180 (84.9%) | 32 (15.1%) |
| 10 to 14 Year Olds | 140 (63.9%) | 79 (36.1%) |
| 15 to 17 Year Olds | 130 (100.0%) | 0 (0.0%) |
| 18 to 19 Year Olds | 46 (100.0%) | 0 (0.0%) |
| 20 to 24 Year Olds | 73 (41.0%) | 105 (59.0%) |
| 25 to 34 Year Olds | 25 (100.0%) | 0 (0.0%) |
| 35 Years and over | 25 (71.4%) | 10 (28.6%) |
| Total | 658 (72.1%) | 254 (27.9%) |
Educational Attainment by Field of Study in North Westport
Business (147 | 24.0%), science & technology (83 | 13.6%), education (70 | 11.4%), arts & humanities (70 | 11.4%), and social sciences (60 | 9.8%) are the most common fields of study among 612 individuals in North Westport who have obtained a bachelor's degree or higher.
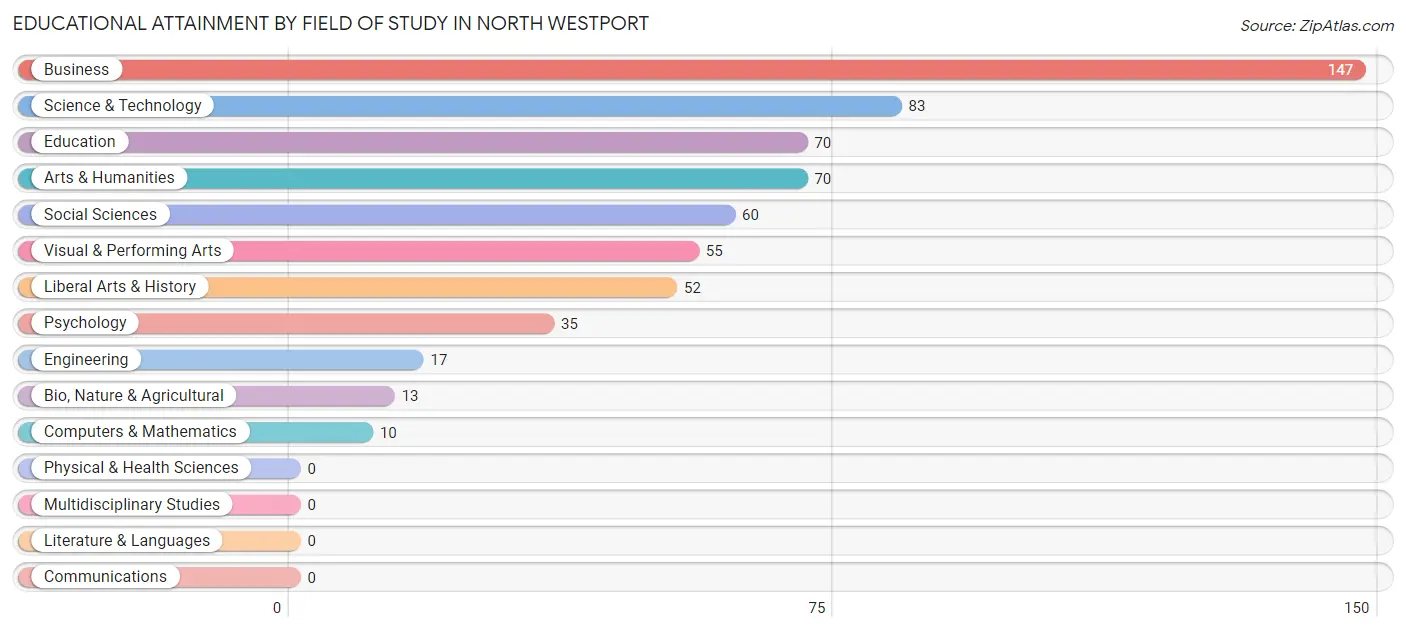
| Field of Study | # Graduates | % Graduates |
| Computers & Mathematics | 10 | 1.6% |
| Bio, Nature & Agricultural | 13 | 2.1% |
| Physical & Health Sciences | 0 | 0.0% |
| Psychology | 35 | 5.7% |
| Social Sciences | 60 | 9.8% |
| Engineering | 17 | 2.8% |
| Multidisciplinary Studies | 0 | 0.0% |
| Science & Technology | 83 | 13.6% |
| Business | 147 | 24.0% |
| Education | 70 | 11.4% |
| Literature & Languages | 0 | 0.0% |
| Liberal Arts & History | 52 | 8.5% |
| Visual & Performing Arts | 55 | 9.0% |
| Communications | 0 | 0.0% |
| Arts & Humanities | 70 | 11.4% |
| Total | 612 | 100.0% |
Transportation & Commute in North Westport
Vehicle Availability by Sex in North Westport
The most prevalent vehicle ownership categories in North Westport are males with 3 vehicles (449, accounting for 34.1%) and females with 3 vehicles (490, making up 40.5%).
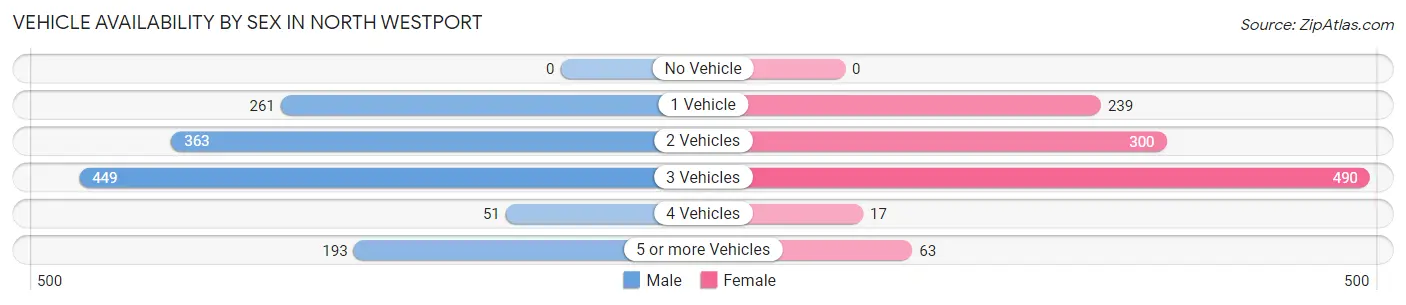
| Vehicles Available | Male | Female |
| No Vehicle | 0 (0.0%) | 0 (0.0%) |
| 1 Vehicle | 261 (19.8%) | 239 (21.5%) |
| 2 Vehicles | 363 (27.6%) | 300 (27.1%) |
| 3 Vehicles | 449 (34.1%) | 490 (44.2%) |
| 4 Vehicles | 51 (3.9%) | 17 (1.5%) |
| 5 or more Vehicles | 193 (14.6%) | 63 (5.7%) |
| Total | 1,317 (100.0%) | 1,109 (100.0%) |
Commute Time in North Westport
The most frequently occuring commute durations in North Westport are 10 to 14 minutes (584 commuters, 24.3%), 15 to 19 minutes (451 commuters, 18.7%), and 45 to 59 minutes (267 commuters, 11.1%).
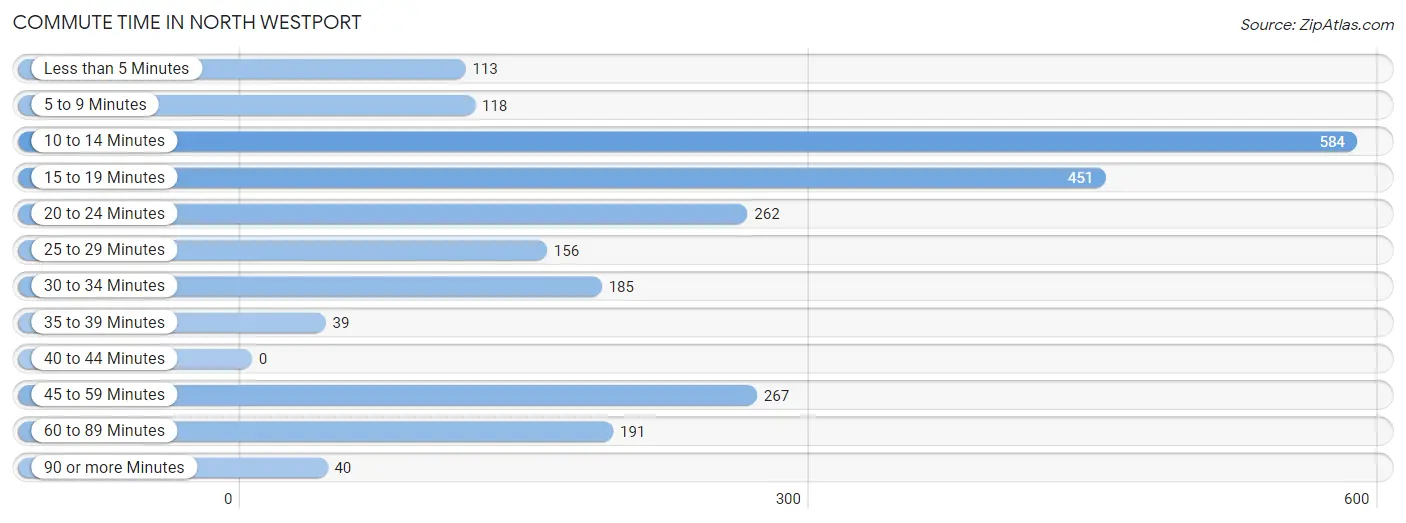
| Commute Time | # Commuters | % Commuters |
| Less than 5 Minutes | 113 | 4.7% |
| 5 to 9 Minutes | 118 | 4.9% |
| 10 to 14 Minutes | 584 | 24.3% |
| 15 to 19 Minutes | 451 | 18.7% |
| 20 to 24 Minutes | 262 | 10.9% |
| 25 to 29 Minutes | 156 | 6.5% |
| 30 to 34 Minutes | 185 | 7.7% |
| 35 to 39 Minutes | 39 | 1.6% |
| 40 to 44 Minutes | 0 | 0.0% |
| 45 to 59 Minutes | 267 | 11.1% |
| 60 to 89 Minutes | 191 | 7.9% |
| 90 or more Minutes | 40 | 1.7% |
Commute Time by Sex in North Westport
The most common commute times in North Westport are 10 to 14 minutes (345 commuters, 26.5%) for males and 15 to 19 minutes (240 commuters, 21.8%) for females.
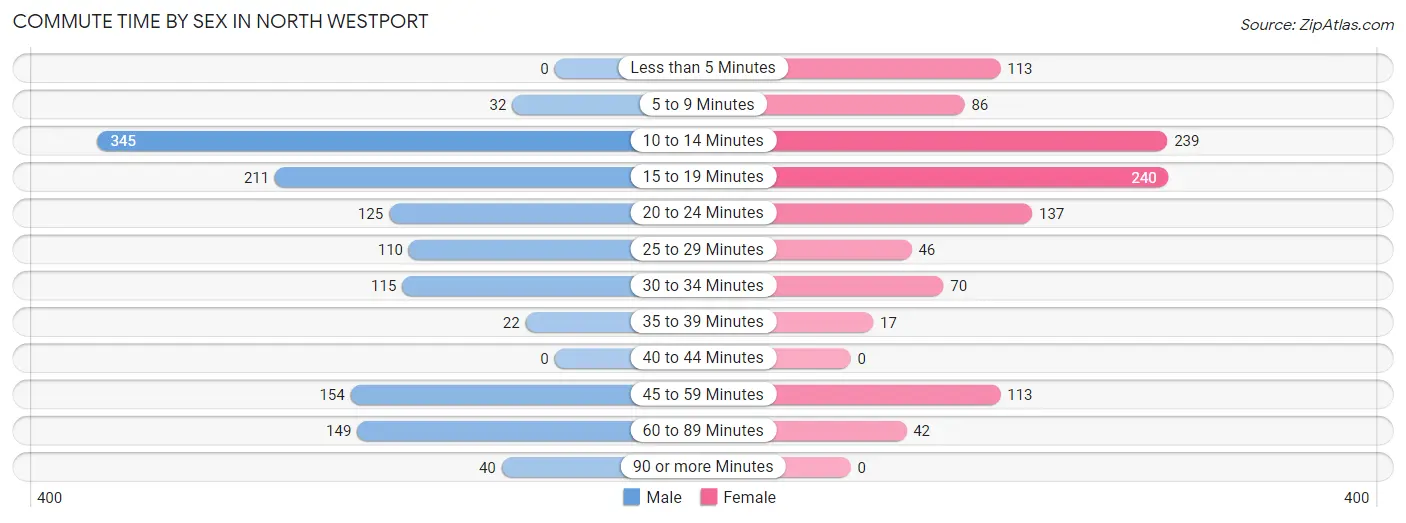
| Commute Time | Male | Female |
| Less than 5 Minutes | 0 (0.0%) | 113 (10.2%) |
| 5 to 9 Minutes | 32 (2.5%) | 86 (7.8%) |
| 10 to 14 Minutes | 345 (26.5%) | 239 (21.7%) |
| 15 to 19 Minutes | 211 (16.2%) | 240 (21.8%) |
| 20 to 24 Minutes | 125 (9.6%) | 137 (12.4%) |
| 25 to 29 Minutes | 110 (8.4%) | 46 (4.2%) |
| 30 to 34 Minutes | 115 (8.8%) | 70 (6.4%) |
| 35 to 39 Minutes | 22 (1.7%) | 17 (1.5%) |
| 40 to 44 Minutes | 0 (0.0%) | 0 (0.0%) |
| 45 to 59 Minutes | 154 (11.8%) | 113 (10.2%) |
| 60 to 89 Minutes | 149 (11.4%) | 42 (3.8%) |
| 90 or more Minutes | 40 (3.1%) | 0 (0.0%) |
Time of Departure to Work by Sex in North Westport
The most frequent times of departure to work in North Westport are 12:00 AM to 4:59 AM (231, 17.7%) for males and 7:00 AM to 7:29 AM (250, 22.7%) for females.
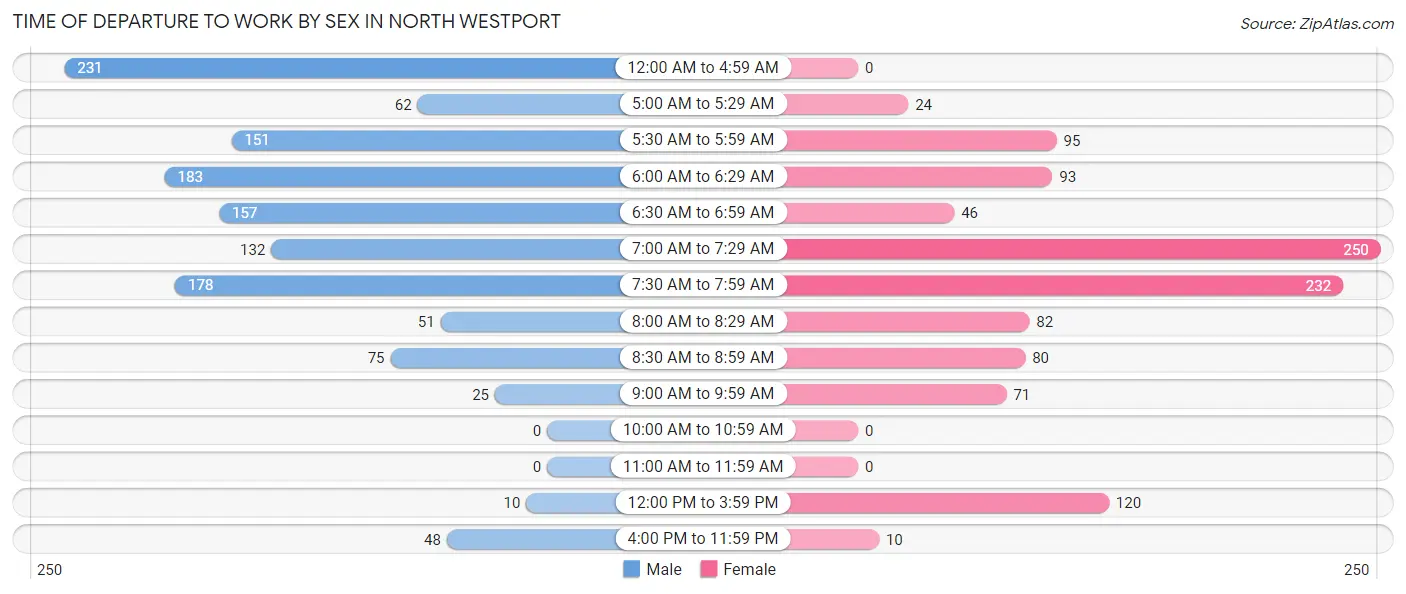
| Time of Departure | Male | Female |
| 12:00 AM to 4:59 AM | 231 (17.7%) | 0 (0.0%) |
| 5:00 AM to 5:29 AM | 62 (4.8%) | 24 (2.2%) |
| 5:30 AM to 5:59 AM | 151 (11.6%) | 95 (8.6%) |
| 6:00 AM to 6:29 AM | 183 (14.0%) | 93 (8.4%) |
| 6:30 AM to 6:59 AM | 157 (12.0%) | 46 (4.2%) |
| 7:00 AM to 7:29 AM | 132 (10.1%) | 250 (22.7%) |
| 7:30 AM to 7:59 AM | 178 (13.7%) | 232 (21.0%) |
| 8:00 AM to 8:29 AM | 51 (3.9%) | 82 (7.4%) |
| 8:30 AM to 8:59 AM | 75 (5.8%) | 80 (7.2%) |
| 9:00 AM to 9:59 AM | 25 (1.9%) | 71 (6.4%) |
| 10:00 AM to 10:59 AM | 0 (0.0%) | 0 (0.0%) |
| 11:00 AM to 11:59 AM | 0 (0.0%) | 0 (0.0%) |
| 12:00 PM to 3:59 PM | 10 (0.8%) | 120 (10.9%) |
| 4:00 PM to 11:59 PM | 48 (3.7%) | 10 (0.9%) |
| Total | 1,303 (100.0%) | 1,103 (100.0%) |
Housing Occupancy in North Westport
Occupancy by Ownership in North Westport
Of the total 1,931 dwellings in North Westport, owner-occupied units account for 1,497 (77.5%), while renter-occupied units make up 434 (22.5%).
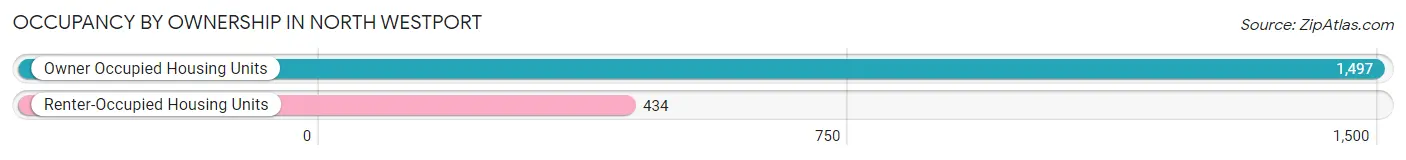
| Occupancy | # Housing Units | % Housing Units |
| Owner Occupied Housing Units | 1,497 | 77.5% |
| Renter-Occupied Housing Units | 434 | 22.5% |
| Total Occupied Housing Units | 1,931 | 100.0% |
Occupancy by Household Size in North Westport
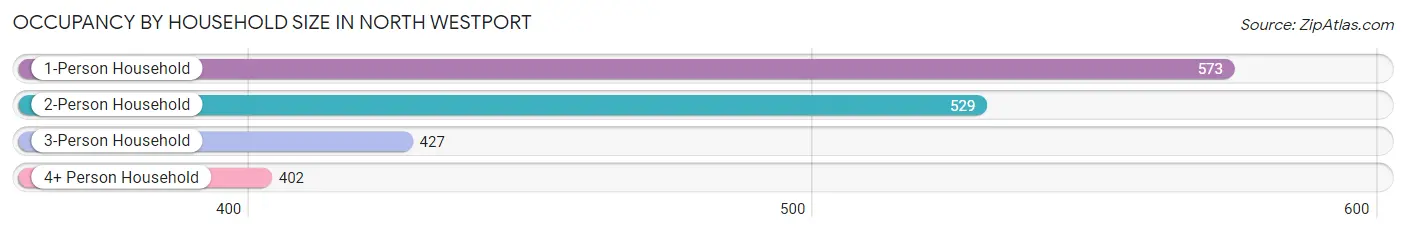
| Household Size | # Housing Units | % Housing Units |
| 1-Person Household | 573 | 29.7% |
| 2-Person Household | 529 | 27.4% |
| 3-Person Household | 427 | 22.1% |
| 4+ Person Household | 402 | 20.8% |
| Total Housing Units | 1,931 | 100.0% |
Occupancy by Ownership by Household Size in North Westport
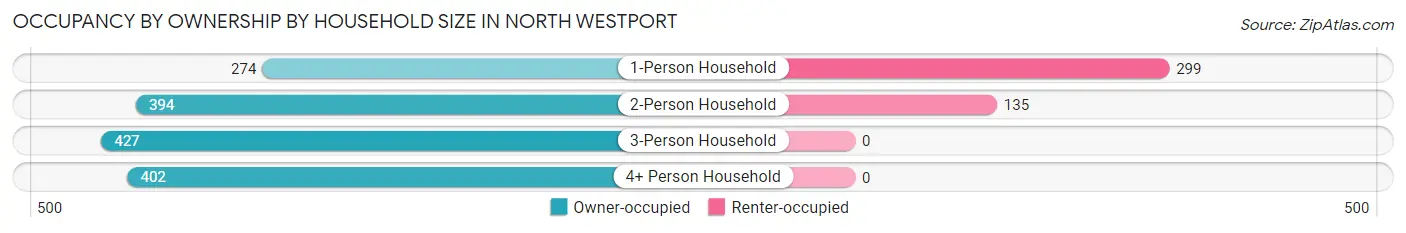
| Household Size | Owner-occupied | Renter-occupied |
| 1-Person Household | 274 (47.8%) | 299 (52.2%) |
| 2-Person Household | 394 (74.5%) | 135 (25.5%) |
| 3-Person Household | 427 (100.0%) | 0 (0.0%) |
| 4+ Person Household | 402 (100.0%) | 0 (0.0%) |
| Total Housing Units | 1,497 (77.5%) | 434 (22.5%) |
Occupancy by Educational Attainment in North Westport
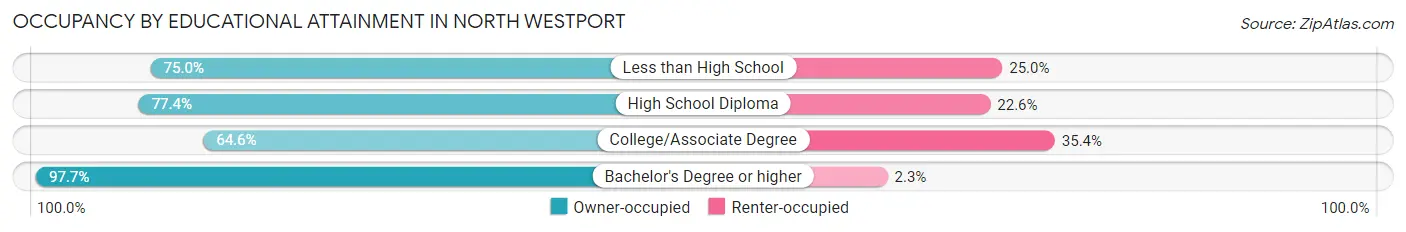
| Household Size | Owner-occupied | Renter-occupied |
| Less than High School | 171 (75.0%) | 57 (25.0%) |
| High School Diploma | 663 (77.4%) | 194 (22.6%) |
| College/Associate Degree | 319 (64.6%) | 175 (35.4%) |
| Bachelor's Degree or higher | 344 (97.7%) | 8 (2.3%) |
Occupancy by Age of Householder in North Westport
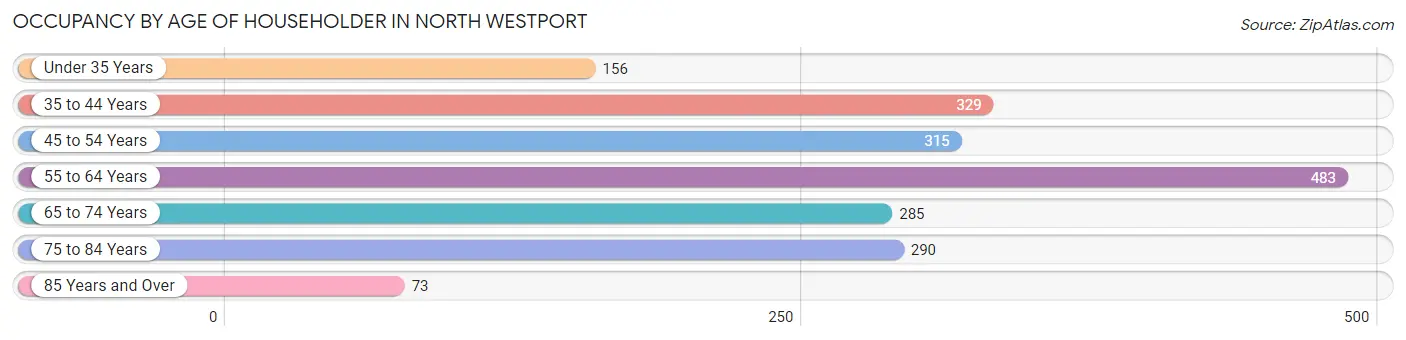
| Age Bracket | # Households | % Households |
| Under 35 Years | 156 | 8.1% |
| 35 to 44 Years | 329 | 17.0% |
| 45 to 54 Years | 315 | 16.3% |
| 55 to 64 Years | 483 | 25.0% |
| 65 to 74 Years | 285 | 14.8% |
| 75 to 84 Years | 290 | 15.0% |
| 85 Years and Over | 73 | 3.8% |
| Total | 1,931 | 100.0% |
Housing Finances in North Westport
Median Income by Occupancy in North Westport
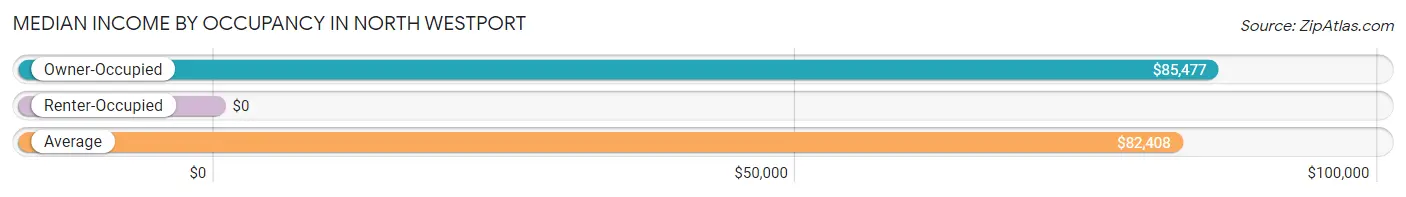
| Occupancy Type | # Households | Median Income |
| Owner-Occupied | 1,497 (77.5%) | $85,477 |
| Renter-Occupied | 434 (22.5%) | $0 |
| Average | 1,931 (100.0%) | $82,408 |
Occupancy by Householder Income Bracket in North Westport
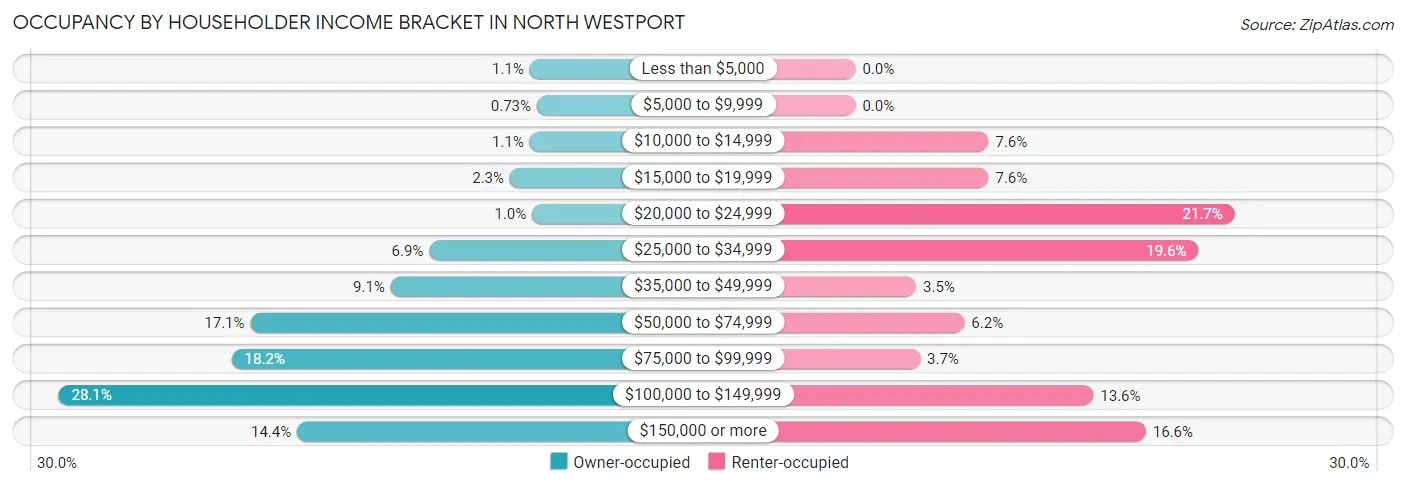
| Income Bracket | Owner-occupied | Renter-occupied |
| Less than $5,000 | 17 (1.1%) | 0 (0.0%) |
| $5,000 to $9,999 | 11 (0.7%) | 0 (0.0%) |
| $10,000 to $14,999 | 17 (1.1%) | 33 (7.6%) |
| $15,000 to $19,999 | 34 (2.3%) | 33 (7.6%) |
| $20,000 to $24,999 | 15 (1.0%) | 94 (21.7%) |
| $25,000 to $34,999 | 103 (6.9%) | 85 (19.6%) |
| $35,000 to $49,999 | 136 (9.1%) | 15 (3.5%) |
| $50,000 to $74,999 | 256 (17.1%) | 27 (6.2%) |
| $75,000 to $99,999 | 272 (18.2%) | 16 (3.7%) |
| $100,000 to $149,999 | 420 (28.1%) | 59 (13.6%) |
| $150,000 or more | 216 (14.4%) | 72 (16.6%) |
| Total | 1,497 (100.0%) | 434 (100.0%) |
Monthly Housing Cost Tiers in North Westport
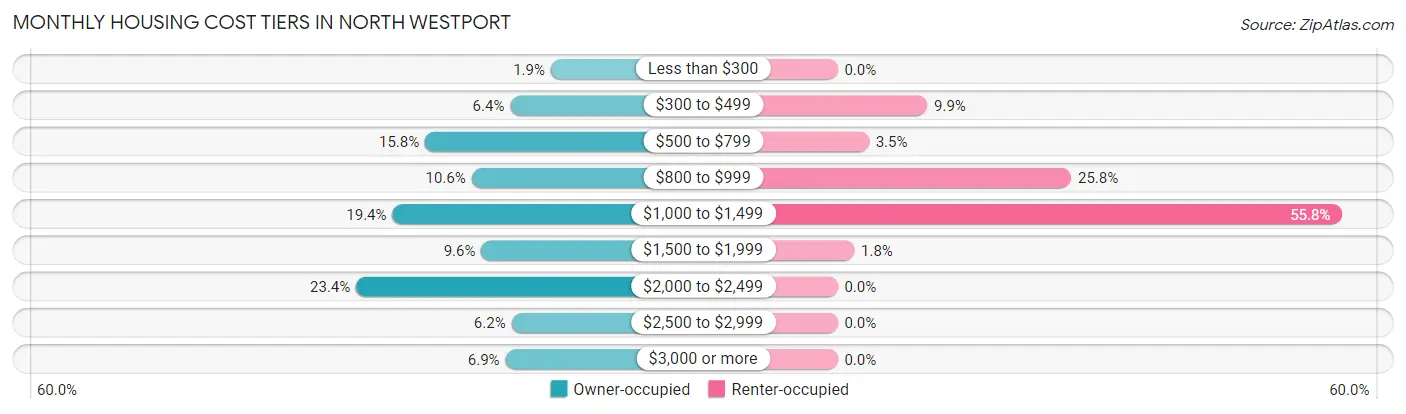
| Monthly Cost | Owner-occupied | Renter-occupied |
| Less than $300 | 28 (1.9%) | 0 (0.0%) |
| $300 to $499 | 95 (6.4%) | 43 (9.9%) |
| $500 to $799 | 236 (15.8%) | 15 (3.5%) |
| $800 to $999 | 159 (10.6%) | 112 (25.8%) |
| $1,000 to $1,499 | 290 (19.4%) | 242 (55.8%) |
| $1,500 to $1,999 | 143 (9.6%) | 8 (1.8%) |
| $2,000 to $2,499 | 350 (23.4%) | 0 (0.0%) |
| $2,500 to $2,999 | 93 (6.2%) | 0 (0.0%) |
| $3,000 or more | 103 (6.9%) | 0 (0.0%) |
| Total | 1,497 (100.0%) | 434 (100.0%) |
Physical Housing Characteristics in North Westport
Housing Structures in North Westport

| Structure Type | # Housing Units | % Housing Units |
| Single Unit, Detached | 1,451 | 75.1% |
| Single Unit, Attached | 54 | 2.8% |
| 2 Unit Apartments | 216 | 11.2% |
| 3 or 4 Unit Apartments | 25 | 1.3% |
| 5 to 9 Unit Apartments | 43 | 2.2% |
| 10 or more Apartments | 142 | 7.3% |
| Mobile Home / Other | 0 | 0.0% |
| Total | 1,931 | 100.0% |
Housing Structures by Occupancy in North Westport
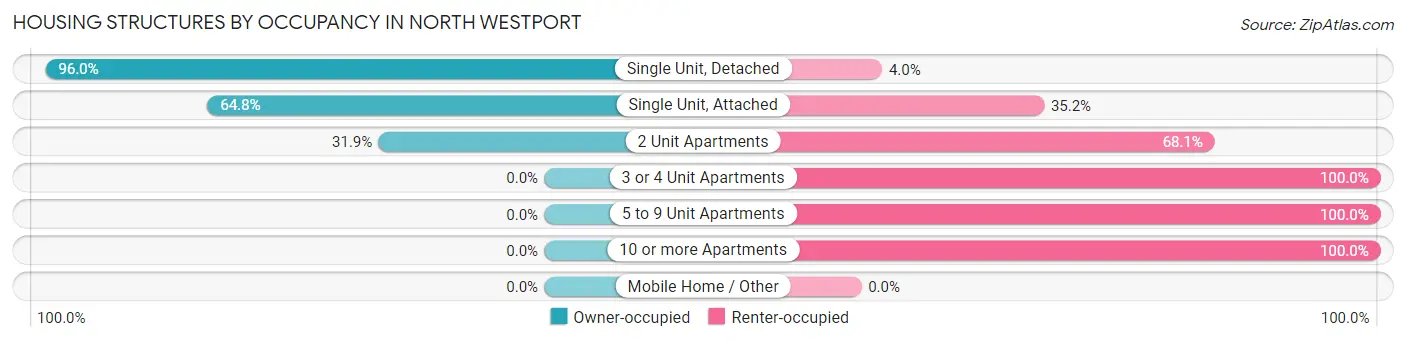
| Structure Type | Owner-occupied | Renter-occupied |
| Single Unit, Detached | 1,393 (96.0%) | 58 (4.0%) |
| Single Unit, Attached | 35 (64.8%) | 19 (35.2%) |
| 2 Unit Apartments | 69 (31.9%) | 147 (68.1%) |
| 3 or 4 Unit Apartments | 0 (0.0%) | 25 (100.0%) |
| 5 to 9 Unit Apartments | 0 (0.0%) | 43 (100.0%) |
| 10 or more Apartments | 0 (0.0%) | 142 (100.0%) |
| Mobile Home / Other | 0 (0.0%) | 0 (0.0%) |
| Total | 1,497 (77.5%) | 434 (22.5%) |
Housing Structures by Number of Rooms in North Westport
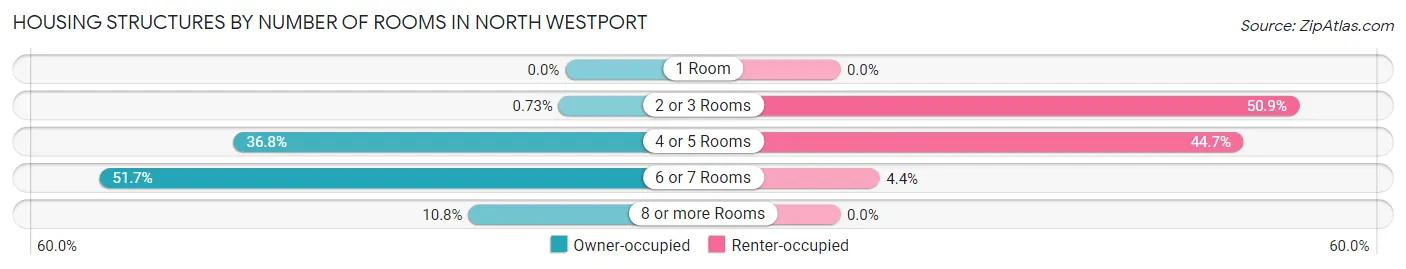
| Number of Rooms | Owner-occupied | Renter-occupied |
| 1 Room | 0 (0.0%) | 0 (0.0%) |
| 2 or 3 Rooms | 11 (0.7%) | 221 (50.9%) |
| 4 or 5 Rooms | 551 (36.8%) | 194 (44.7%) |
| 6 or 7 Rooms | 774 (51.7%) | 19 (4.4%) |
| 8 or more Rooms | 161 (10.7%) | 0 (0.0%) |
| Total | 1,497 (100.0%) | 434 (100.0%) |
Housing Structure by Heating Type in North Westport
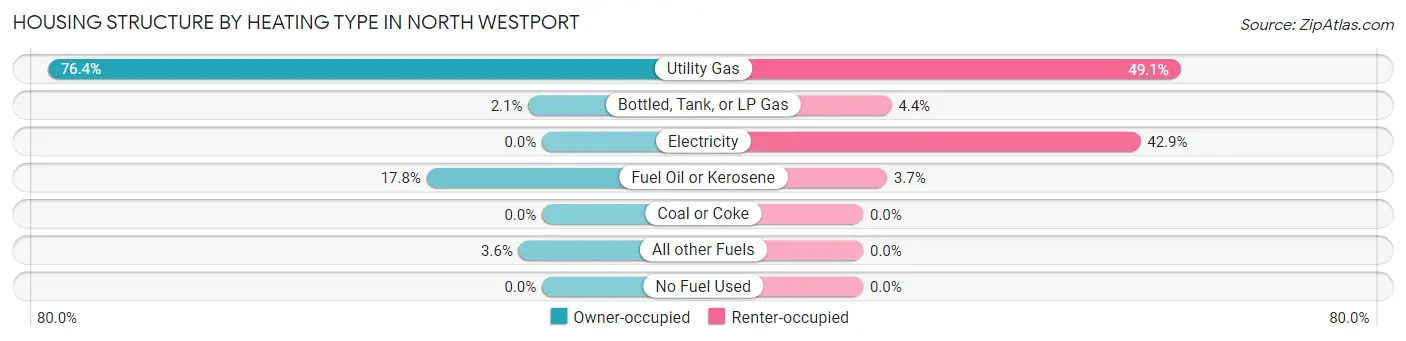
| Heating Type | Owner-occupied | Renter-occupied |
| Utility Gas | 1,144 (76.4%) | 213 (49.1%) |
| Bottled, Tank, or LP Gas | 32 (2.1%) | 19 (4.4%) |
| Electricity | 0 (0.0%) | 186 (42.9%) |
| Fuel Oil or Kerosene | 267 (17.8%) | 16 (3.7%) |
| Coal or Coke | 0 (0.0%) | 0 (0.0%) |
| All other Fuels | 54 (3.6%) | 0 (0.0%) |
| No Fuel Used | 0 (0.0%) | 0 (0.0%) |
| Total | 1,497 (100.0%) | 434 (100.0%) |
Household Vehicle Usage in North Westport
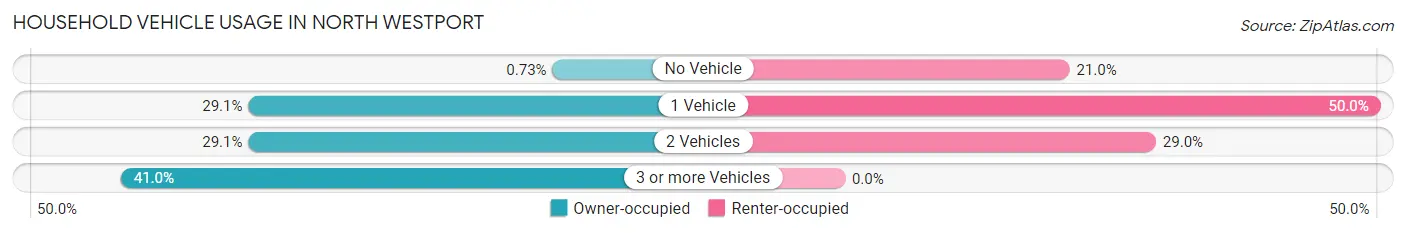
| Vehicles per Household | Owner-occupied | Renter-occupied |
| No Vehicle | 11 (0.7%) | 91 (21.0%) |
| 1 Vehicle | 436 (29.1%) | 217 (50.0%) |
| 2 Vehicles | 436 (29.1%) | 126 (29.0%) |
| 3 or more Vehicles | 614 (41.0%) | 0 (0.0%) |
| Total | 1,497 (100.0%) | 434 (100.0%) |
Real Estate & Mortgages in North Westport
Real Estate and Mortgage Overview in North Westport
| Characteristic | Without Mortgage | With Mortgage |
| Housing Units | 542 | 955 |
| Median Property Value | $305,400 | $372,300 |
| Median Household Income | $85,464 | $187 |
| Monthly Housing Costs | $732 | $103 |
| Real Estate Taxes | $2,550 | $0 |
Property Value by Mortgage Status in North Westport
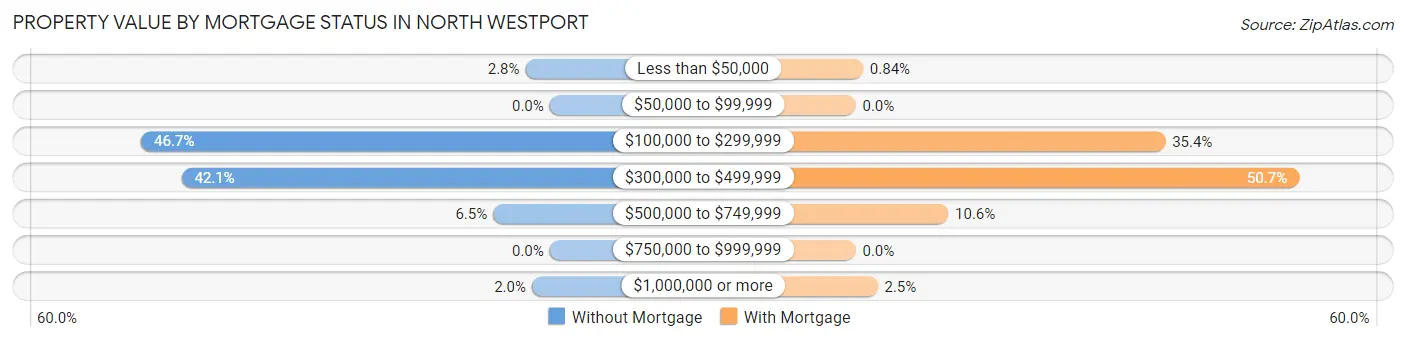
| Property Value | Without Mortgage | With Mortgage |
| Less than $50,000 | 15 (2.8%) | 8 (0.8%) |
| $50,000 to $99,999 | 0 (0.0%) | 0 (0.0%) |
| $100,000 to $299,999 | 253 (46.7%) | 338 (35.4%) |
| $300,000 to $499,999 | 228 (42.1%) | 484 (50.7%) |
| $500,000 to $749,999 | 35 (6.5%) | 101 (10.6%) |
| $750,000 to $999,999 | 0 (0.0%) | 0 (0.0%) |
| $1,000,000 or more | 11 (2.0%) | 24 (2.5%) |
| Total | 542 (100.0%) | 955 (100.0%) |
Household Income by Mortgage Status in North Westport
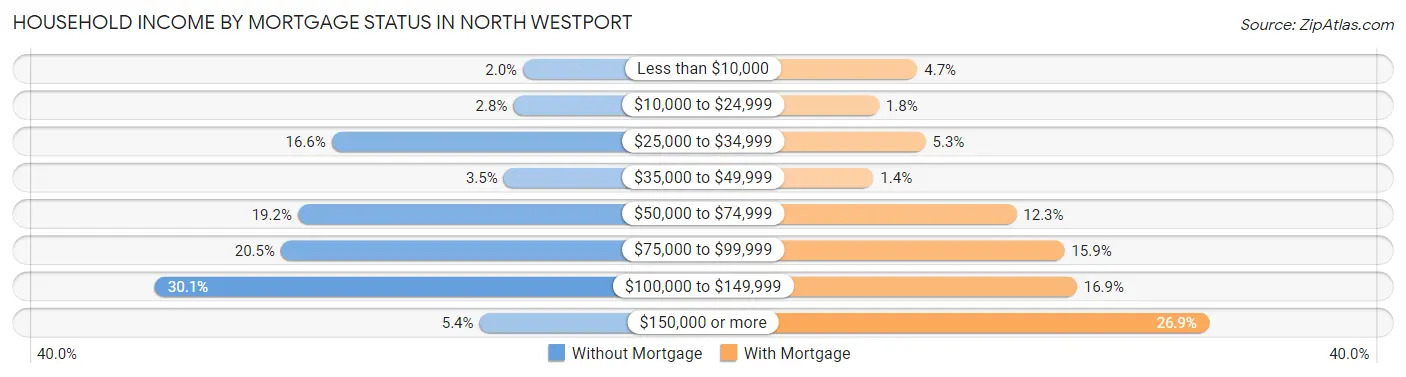
| Household Income | Without Mortgage | With Mortgage |
| Less than $10,000 | 11 (2.0%) | 45 (4.7%) |
| $10,000 to $24,999 | 15 (2.8%) | 17 (1.8%) |
| $25,000 to $34,999 | 90 (16.6%) | 51 (5.3%) |
| $35,000 to $49,999 | 19 (3.5%) | 13 (1.4%) |
| $50,000 to $74,999 | 104 (19.2%) | 117 (12.2%) |
| $75,000 to $99,999 | 111 (20.5%) | 152 (15.9%) |
| $100,000 to $149,999 | 163 (30.1%) | 161 (16.9%) |
| $150,000 or more | 29 (5.3%) | 257 (26.9%) |
| Total | 542 (100.0%) | 955 (100.0%) |
Property Value to Household Income Ratio in North Westport
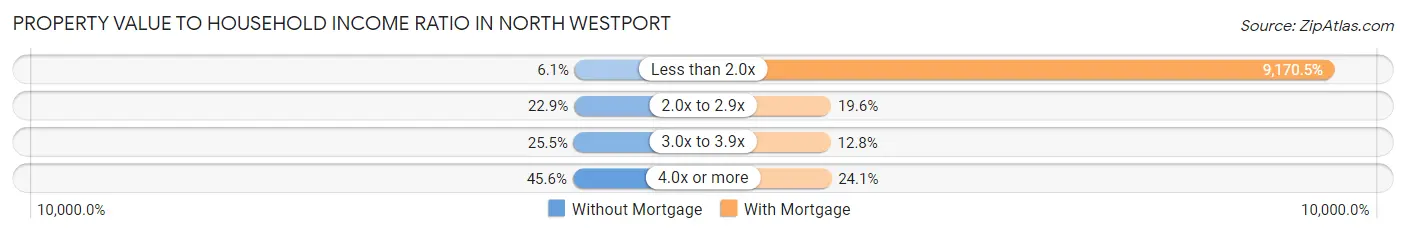
| Value-to-Income Ratio | Without Mortgage | With Mortgage |
| Less than 2.0x | 33 (6.1%) | 87,578 (9,170.5%) |
| 2.0x to 2.9x | 124 (22.9%) | 187 (19.6%) |
| 3.0x to 3.9x | 138 (25.5%) | 122 (12.8%) |
| 4.0x or more | 247 (45.6%) | 230 (24.1%) |
| Total | 542 (100.0%) | 955 (100.0%) |
Real Estate Taxes by Mortgage Status in North Westport
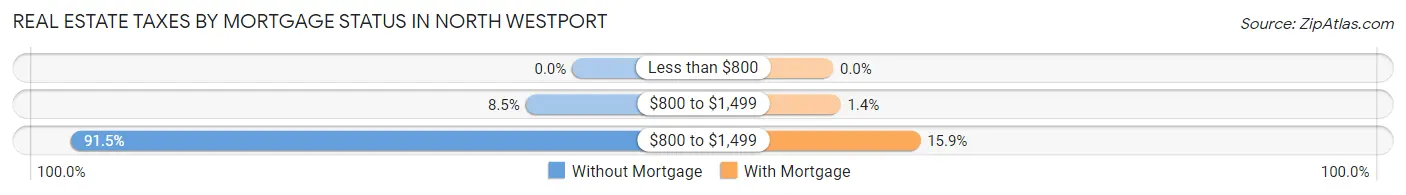
| Property Taxes | Without Mortgage | With Mortgage |
| Less than $800 | 0 (0.0%) | 0 (0.0%) |
| $800 to $1,499 | 46 (8.5%) | 13 (1.4%) |
| $800 to $1,499 | 496 (91.5%) | 152 (15.9%) |
| Total | 542 (100.0%) | 955 (100.0%) |
Health & Disability in North Westport
Health Insurance Coverage by Age in North Westport
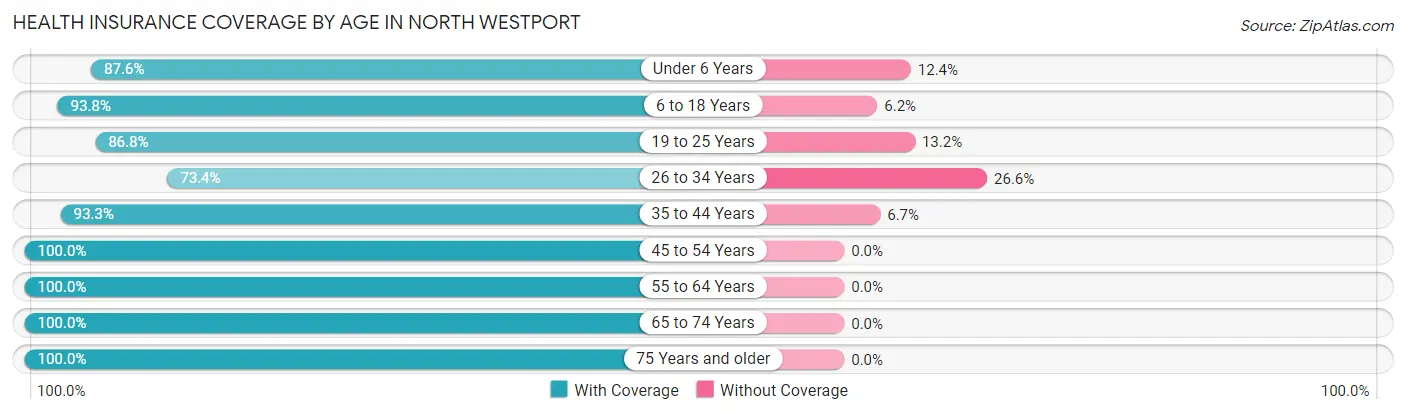
| Age Bracket | With Coverage | Without Coverage |
| Under 6 Years | 247 (87.6%) | 35 (12.4%) |
| 6 to 18 Years | 548 (93.8%) | 36 (6.2%) |
| 19 to 25 Years | 303 (86.8%) | 46 (13.2%) |
| 26 to 34 Years | 259 (73.4%) | 94 (26.6%) |
| 35 to 44 Years | 528 (93.3%) | 38 (6.7%) |
| 45 to 54 Years | 717 (100.0%) | 0 (0.0%) |
| 55 to 64 Years | 810 (100.0%) | 0 (0.0%) |
| 65 to 74 Years | 455 (100.0%) | 0 (0.0%) |
| 75 Years and older | 544 (100.0%) | 0 (0.0%) |
| Total | 4,411 (94.7%) | 249 (5.3%) |
Health Insurance Coverage by Citizenship Status in North Westport
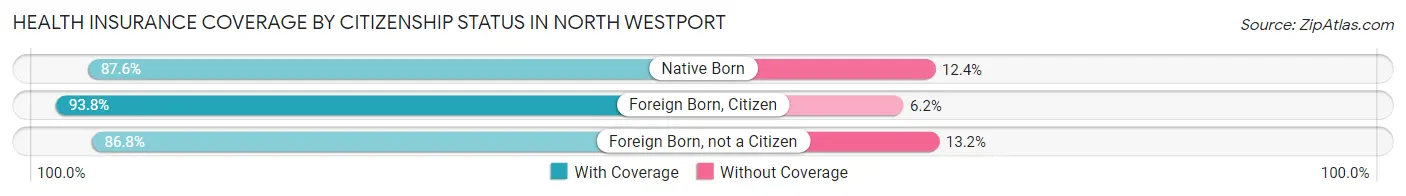
| Citizenship Status | With Coverage | Without Coverage |
| Native Born | 247 (87.6%) | 35 (12.4%) |
| Foreign Born, Citizen | 548 (93.8%) | 36 (6.2%) |
| Foreign Born, not a Citizen | 303 (86.8%) | 46 (13.2%) |
Health Insurance Coverage by Household Income in North Westport
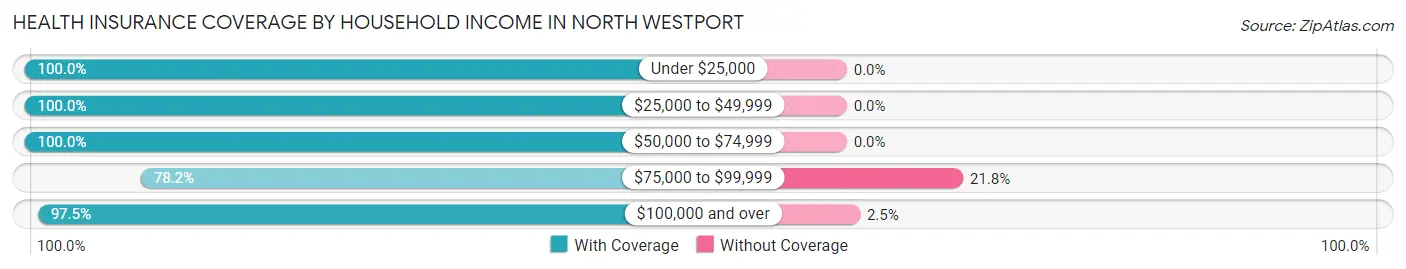
| Household Income | With Coverage | Without Coverage |
| Under $25,000 | 313 (100.0%) | 0 (0.0%) |
| $25,000 to $49,999 | 541 (100.0%) | 0 (0.0%) |
| $50,000 to $74,999 | 652 (100.0%) | 0 (0.0%) |
| $75,000 to $99,999 | 693 (78.2%) | 193 (21.8%) |
| $100,000 and over | 2,207 (97.5%) | 56 (2.5%) |
Public vs Private Health Insurance Coverage by Age in North Westport
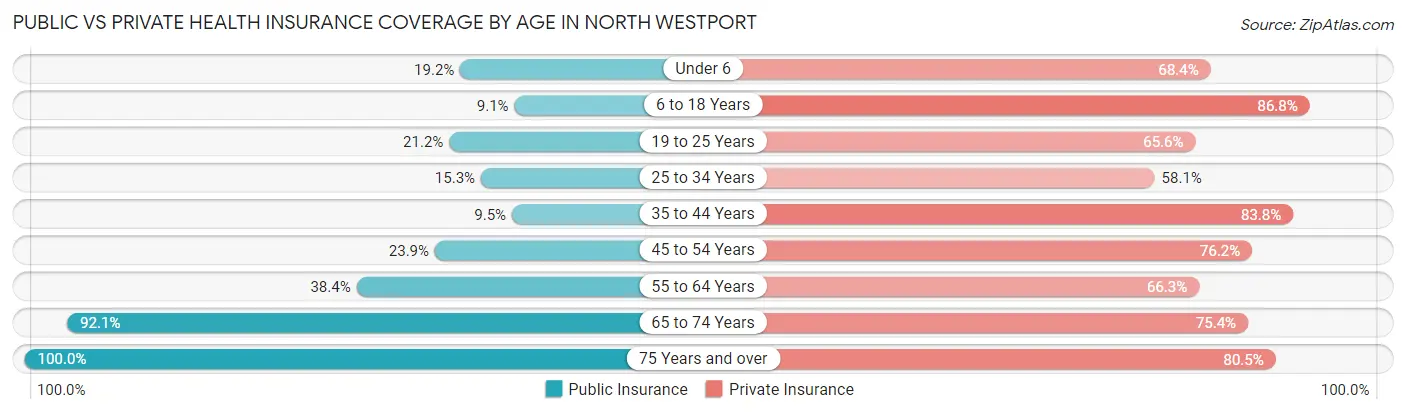
| Age Bracket | Public Insurance | Private Insurance |
| Under 6 | 54 (19.2%) | 193 (68.4%) |
| 6 to 18 Years | 53 (9.1%) | 507 (86.8%) |
| 19 to 25 Years | 74 (21.2%) | 229 (65.6%) |
| 25 to 34 Years | 54 (15.3%) | 205 (58.1%) |
| 35 to 44 Years | 54 (9.5%) | 474 (83.8%) |
| 45 to 54 Years | 171 (23.8%) | 546 (76.1%) |
| 55 to 64 Years | 311 (38.4%) | 537 (66.3%) |
| 65 to 74 Years | 419 (92.1%) | 343 (75.4%) |
| 75 Years and over | 544 (100.0%) | 438 (80.5%) |
| Total | 1,734 (37.2%) | 3,472 (74.5%) |
Disability Status by Sex by Age in North Westport
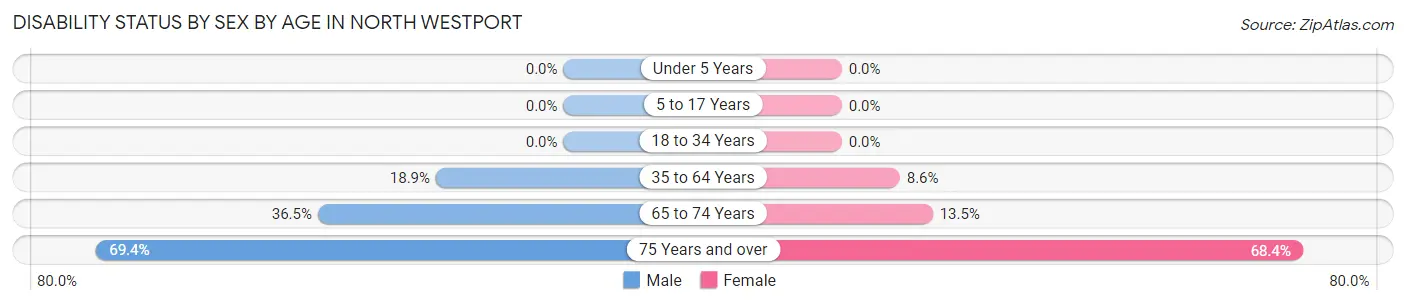
| Age Bracket | Male | Female |
| Under 5 Years | 0 (0.0%) | 0 (0.0%) |
| 5 to 17 Years | 0 (0.0%) | 0 (0.0%) |
| 18 to 34 Years | 0 (0.0%) | 0 (0.0%) |
| 35 to 64 Years | 227 (18.9%) | 77 (8.6%) |
| 65 to 74 Years | 66 (36.5%) | 37 (13.5%) |
| 75 Years and over | 129 (69.4%) | 245 (68.4%) |
Disability Class by Sex by Age in North Westport
Disability Class: Hearing Difficulty
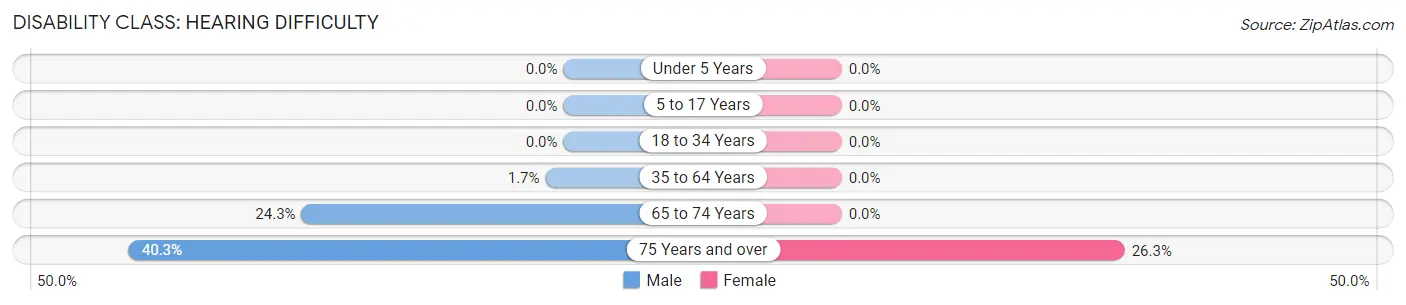
| Age Bracket | Male | Female |
| Under 5 Years | 0 (0.0%) | 0 (0.0%) |
| 5 to 17 Years | 0 (0.0%) | 0 (0.0%) |
| 18 to 34 Years | 0 (0.0%) | 0 (0.0%) |
| 35 to 64 Years | 20 (1.7%) | 0 (0.0%) |
| 65 to 74 Years | 44 (24.3%) | 0 (0.0%) |
| 75 Years and over | 75 (40.3%) | 94 (26.3%) |
Disability Class: Vision Difficulty
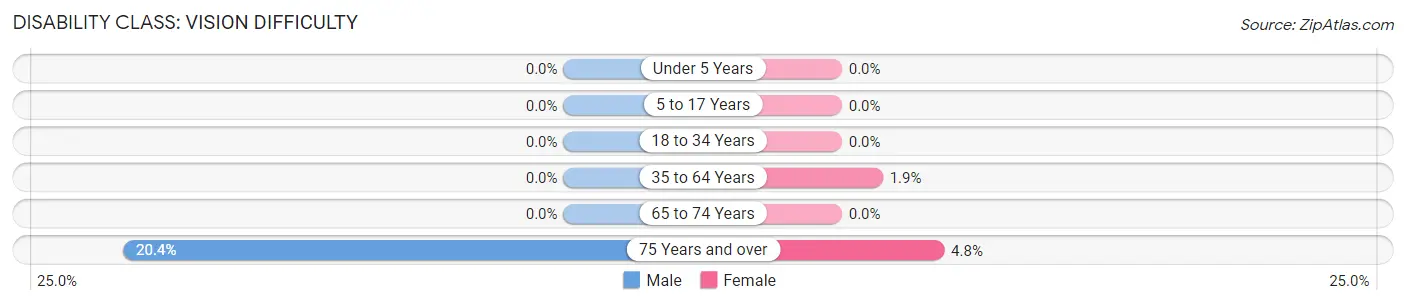
| Age Bracket | Male | Female |
| Under 5 Years | 0 (0.0%) | 0 (0.0%) |
| 5 to 17 Years | 0 (0.0%) | 0 (0.0%) |
| 18 to 34 Years | 0 (0.0%) | 0 (0.0%) |
| 35 to 64 Years | 0 (0.0%) | 17 (1.9%) |
| 65 to 74 Years | 0 (0.0%) | 0 (0.0%) |
| 75 Years and over | 38 (20.4%) | 17 (4.8%) |
Disability Class: Cognitive Difficulty
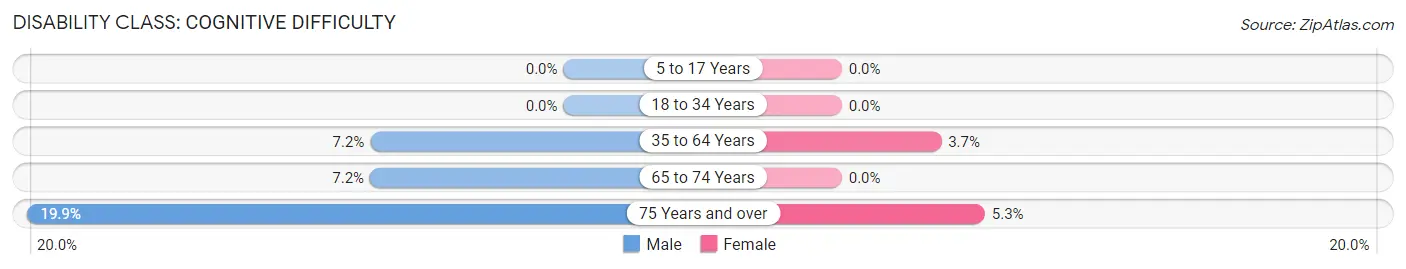
| Age Bracket | Male | Female |
| 5 to 17 Years | 0 (0.0%) | 0 (0.0%) |
| 18 to 34 Years | 0 (0.0%) | 0 (0.0%) |
| 35 to 64 Years | 86 (7.2%) | 33 (3.7%) |
| 65 to 74 Years | 13 (7.2%) | 0 (0.0%) |
| 75 Years and over | 37 (19.9%) | 19 (5.3%) |
Disability Class: Ambulatory Difficulty
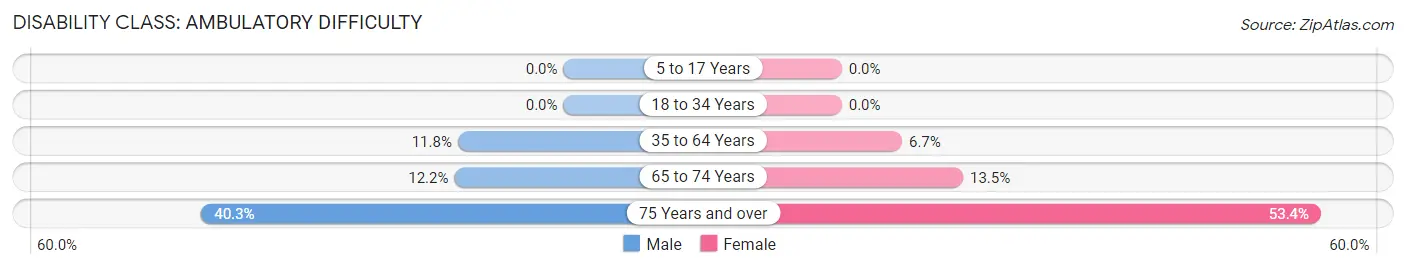
| Age Bracket | Male | Female |
| 5 to 17 Years | 0 (0.0%) | 0 (0.0%) |
| 18 to 34 Years | 0 (0.0%) | 0 (0.0%) |
| 35 to 64 Years | 141 (11.8%) | 60 (6.7%) |
| 65 to 74 Years | 22 (12.1%) | 37 (13.5%) |
| 75 Years and over | 75 (40.3%) | 191 (53.3%) |
Disability Class: Self-Care Difficulty
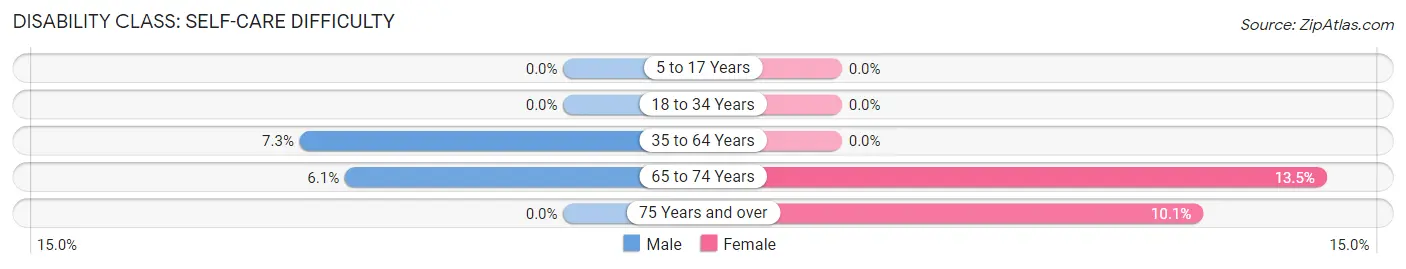
| Age Bracket | Male | Female |
| 5 to 17 Years | 0 (0.0%) | 0 (0.0%) |
| 18 to 34 Years | 0 (0.0%) | 0 (0.0%) |
| 35 to 64 Years | 88 (7.3%) | 0 (0.0%) |
| 65 to 74 Years | 11 (6.1%) | 37 (13.5%) |
| 75 Years and over | 0 (0.0%) | 36 (10.1%) |
Technology Access in North Westport
Computing Device Access in North Westport
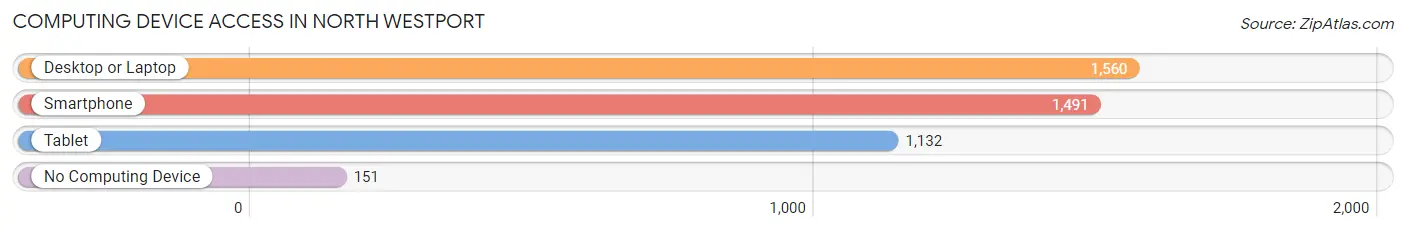
| Device Type | # Households | % Households |
| Desktop or Laptop | 1,560 | 80.8% |
| Smartphone | 1,491 | 77.2% |
| Tablet | 1,132 | 58.6% |
| No Computing Device | 151 | 7.8% |
| Total | 1,931 | 100.0% |
Internet Access in North Westport
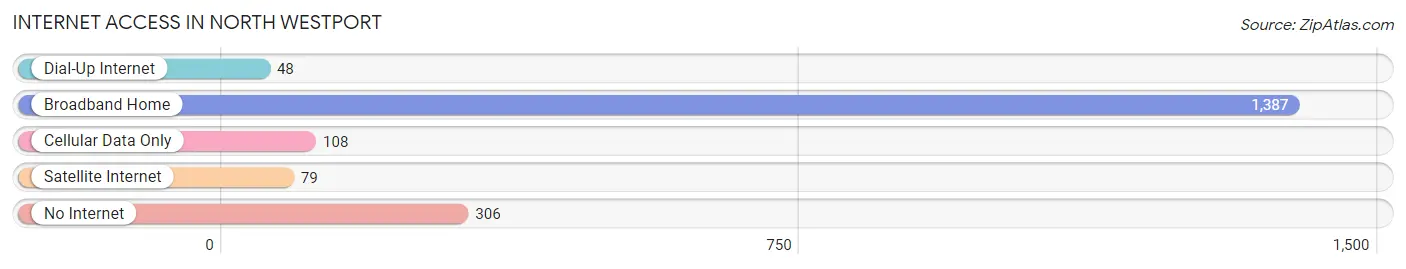
| Internet Type | # Households | % Households |
| Dial-Up Internet | 48 | 2.5% |
| Broadband Home | 1,387 | 71.8% |
| Cellular Data Only | 108 | 5.6% |
| Satellite Internet | 79 | 4.1% |
| No Internet | 306 | 15.9% |
| Total | 1,931 | 100.0% |
North Westport Summary
North Westport is a small town located in Bristol County, Massachusetts. It is situated on the eastern shore of Buzzards Bay, approximately 40 miles south of Boston. The town has a population of approximately 4,000 people and covers an area of 8.3 square miles.
History
North Westport was first settled in 1670 by a group of English settlers from Plymouth Colony. The town was originally part of the town of Dartmouth, but was incorporated as its own town in 1787. The town was named after Westport, England, which was the hometown of many of the original settlers.
In the 19th century, North Westport was a thriving agricultural community. The town was known for its cranberry bogs, which were a major source of income for the town. The town also had a thriving fishing industry, with many of the townspeople working as fishermen.
In the 20th century, North Westport began to transition away from its agricultural roots. The town began to attract more tourists, and the fishing industry began to decline. The town also began to attract more retirees, who were drawn to the town's quiet atmosphere and beautiful scenery.
Geography
North Westport is located on the eastern shore of Buzzards Bay, approximately 40 miles south of Boston. The town is bordered by the towns of Dartmouth to the north, Westport to the east, and Tiverton, Rhode Island to the south. The town is situated on a peninsula, with the Atlantic Ocean to the east and the Westport River to the west.
The town is mostly rural, with a few small villages scattered throughout. The town is home to several small lakes, including Little Pond, Long Pond, and Round Pond. The town also has several beaches, including Horseneck Beach, Gooseberry Beach, and East Beach.
Economy
North Westport's economy is largely based on tourism. The town is home to several popular tourist attractions, including Horseneck Beach, Gooseberry Beach, and the Westport River. The town also has several small businesses, including restaurants, shops, and galleries.
The town also has a thriving fishing industry, with many of the townspeople working as fishermen. The town is also home to several cranberry bogs, which are a major source of income for the town.
Demographics
As of the 2010 census, North Westport had a population of 4,000 people. The town has a median household income of $60,000, and the median age is 44. The town is predominantly white (94%), with small percentages of African American (2%), Asian (2%), and Hispanic (2%) residents.
Conclusion
North Westport is a small town located in Bristol County, Massachusetts. It is situated on the eastern shore of Buzzards Bay, approximately 40 miles south of Boston. The town has a population of approximately 4,000 people and covers an area of 8.3 square miles. The town's economy is largely based on tourism, fishing, and cranberry farming. The town is predominantly white, with small percentages of African American, Asian, and Hispanic residents.
Common Questions
What is Per Capita Income in North Westport?
Per Capita income in North Westport is $45,606.
What is the Median Family Income in North Westport?
Median Family Income in North Westport is $87,230.
What is the Median Household income in North Westport?
Median Household Income in North Westport is $82,408.
What is Income or Wage Gap in North Westport?
Income or Wage Gap in North Westport is 49.0%.
Women in North Westport earn 51.0 cents for every dollar earned by a man.
What is Inequality or Gini Index in North Westport?
Inequality or Gini Index in North Westport is 0.48.
What is the Total Population of North Westport?
Total Population of North Westport is 4,660.
What is the Total Male Population of North Westport?
Total Male Population of North Westport is 2,236.
What is the Total Female Population of North Westport?
Total Female Population of North Westport is 2,424.
What is the Ratio of Males per 100 Females in North Westport?
There are 92.24 Males per 100 Females in North Westport.
What is the Ratio of Females per 100 Males in North Westport?
There are 108.41 Females per 100 Males in North Westport.
What is the Median Population Age in North Westport?
Median Population Age in North Westport is 49.3 Years.
What is the Average Family Size in North Westport
Average Family Size in North Westport is 3.0 People.
What is the Average Household Size in North Westport
Average Household Size in North Westport is 2.4 People.
How Large is the Labor Force in North Westport?
There are 2,484 People in the Labor Forcein in North Westport.
What is the Percentage of People in the Labor Force in North Westport?
63.7% of People are in the Labor Force in North Westport.
What is the Unemployment Rate in North Westport?
Unemployment Rate in North Westport is 1.7%.