Cities with the Highest Percentage of Swedish Population in Massachusetts
RELATED REPORTS & OPTIONS
Swedish
Massachusetts
Compare Cities
Map of Cities with the Highest Percentage of Swedish Population in Massachusetts
0.00%
15.00%
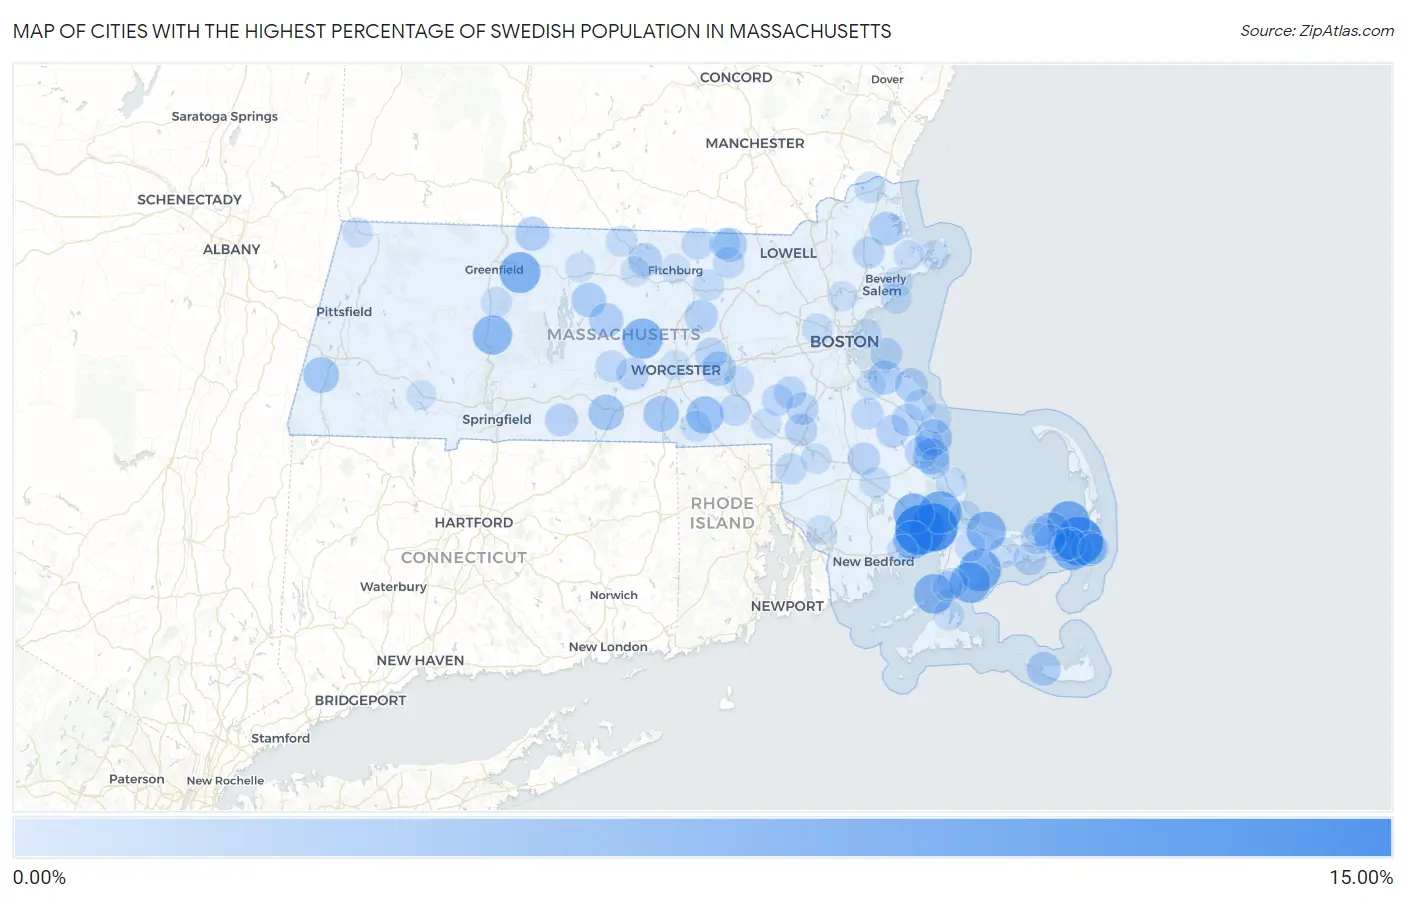
Cities with the Highest Percentage of Swedish Population in Massachusetts
| City | Swedish | vs State | vs National | |
| 1. | Weweantic | 12.12% | 1.42%(+10.7)#1 | 1.05%(+11.1)#439 |
| 2. | East Harwich | 11.59% | 1.42%(+10.2)#2 | 1.05%(+10.5)#487 |
| 3. | Onset | 11.24% | 1.42%(+9.82)#3 | 1.05%(+10.2)#526 |
| 4. | Brewster | 8.40% | 1.42%(+6.98)#4 | 1.05%(+7.35)#863 |
| 5. | White Island Shores | 8.32% | 1.42%(+6.91)#5 | 1.05%(+7.27)#879 |
| 6. | Mashpee Neck | 8.11% | 1.42%(+6.69)#6 | 1.05%(+7.06)#920 |
| 7. | Oak Bluffs | 7.96% | 1.42%(+6.54)#7 | 1.05%(+6.91)#951 |
| 8. | Millers Falls | 7.35% | 1.42%(+5.94)#8 | 1.05%(+6.30)#1,110 |
| 9. | Seconsett Island | 7.30% | 1.42%(+5.88)#9 | 1.05%(+6.25)#1,126 |
| 10. | West Wareham | 7.29% | 1.42%(+5.88)#10 | 1.05%(+6.25)#1,127 |
| 11. | Rutland | 7.16% | 1.42%(+5.74)#11 | 1.05%(+6.11)#1,167 |
| 12. | Harwich Port | 7.15% | 1.42%(+5.73)#12 | 1.05%(+6.10)#1,170 |
| 13. | Woods Hole | 6.75% | 1.42%(+5.34)#13 | 1.05%(+5.71)#1,273 |
| 14. | East Sandwich | 6.58% | 1.42%(+5.16)#14 | 1.05%(+5.53)#1,329 |
| 15. | Hatfield | 6.54% | 1.42%(+5.12)#15 | 1.05%(+5.49)#1,345 |
| 16. | Marion Center | 6.12% | 1.42%(+4.71)#16 | 1.05%(+5.07)#1,501 |
| 17. | East Dennis | 5.60% | 1.42%(+4.19)#17 | 1.05%(+4.56)#1,701 |
| 18. | Whitinsville | 5.54% | 1.42%(+4.13)#18 | 1.05%(+4.49)#1,727 |
| 19. | Duxbury | 5.05% | 1.42%(+3.64)#19 | 1.05%(+4.01)#1,959 |
| 20. | North Plymouth | 4.84% | 1.42%(+3.43)#20 | 1.05%(+3.80)#2,094 |
| 21. | Housatonic | 4.67% | 1.42%(+3.25)#21 | 1.05%(+3.62)#2,198 |
| 22. | Oxford | 4.66% | 1.42%(+3.24)#22 | 1.05%(+3.61)#2,205 |
| 23. | Fiskdale | 4.63% | 1.42%(+3.22)#23 | 1.05%(+3.59)#2,225 |
| 24. | West Chatham | 4.53% | 1.42%(+3.12)#24 | 1.05%(+3.48)#2,285 |
| 25. | Petersham | 4.00% | 1.42%(+2.58)#25 | 1.05%(+2.95)#2,647 |
| 26. | Westborough | 3.97% | 1.42%(+2.56)#26 | 1.05%(+2.92)#2,679 |
| 27. | Barre | 3.87% | 1.42%(+2.46)#27 | 1.05%(+2.82)#2,767 |
| 28. | Northfield | 3.85% | 1.42%(+2.44)#28 | 1.05%(+2.81)#2,783 |
| 29. | East Pepperell | 3.80% | 1.42%(+2.39)#29 | 1.05%(+2.75)#2,826 |
| 30. | Hingham | 3.78% | 1.42%(+2.37)#30 | 1.05%(+2.73)#2,857 |
| 31. | Madaket | 3.77% | 1.42%(+2.36)#31 | 1.05%(+2.73)#2,869 |
| 32. | Rowley | 3.71% | 1.42%(+2.30)#32 | 1.05%(+2.67)#2,917 |
| 33. | South Ashburnham | 3.53% | 1.42%(+2.11)#33 | 1.05%(+2.48)#3,135 |
| 34. | South Lancaster | 3.47% | 1.42%(+2.06)#34 | 1.05%(+2.42)#3,194 |
| 35. | North Scituate | 3.42% | 1.42%(+2.00)#35 | 1.05%(+2.37)#3,265 |
| 36. | West Yarmouth | 3.28% | 1.42%(+1.86)#36 | 1.05%(+2.23)#3,421 |
| 37. | Northwest Harwich | 3.24% | 1.42%(+1.82)#37 | 1.05%(+2.19)#3,474 |
| 38. | Monson Center | 3.11% | 1.42%(+1.69)#38 | 1.05%(+2.06)#3,647 |
| 39. | Foxborough | 3.06% | 1.42%(+1.64)#39 | 1.05%(+2.01)#3,723 |
| 40. | Kingston | 3.05% | 1.42%(+1.64)#40 | 1.05%(+2.01)#3,729 |
| 41. | Bridgewater Town | 3.05% | 1.42%(+1.64)#41 | 1.05%(+2.00)#3,737 |
| 42. | Spencer | 3.03% | 1.42%(+1.62)#42 | 1.05%(+1.99)#3,756 |
| 43. | Hanson | 3.02% | 1.42%(+1.60)#43 | 1.05%(+1.97)#3,780 |
| 44. | Northborough | 2.97% | 1.42%(+1.55)#44 | 1.05%(+1.92)#3,860 |
| 45. | Walpole | 2.95% | 1.42%(+1.53)#45 | 1.05%(+1.90)#3,880 |
| 46. | North Pembroke | 2.93% | 1.42%(+1.52)#46 | 1.05%(+1.89)#3,900 |
| 47. | Medfield | 2.83% | 1.42%(+1.42)#47 | 1.05%(+1.78)#4,078 |
| 48. | Hull | 2.72% | 1.42%(+1.30)#48 | 1.05%(+1.67)#4,260 |
| 49. | Topsfield | 2.68% | 1.42%(+1.26)#49 | 1.05%(+1.63)#4,322 |
| 50. | Harwich Center | 2.68% | 1.42%(+1.26)#50 | 1.05%(+1.63)#4,326 |
| 51. | Townsend | 2.65% | 1.42%(+1.24)#51 | 1.05%(+1.60)#4,366 |
| 52. | North Brookfield | 2.63% | 1.42%(+1.21)#52 | 1.05%(+1.58)#4,418 |
| 53. | Abington | 2.61% | 1.42%(+1.19)#53 | 1.05%(+1.56)#4,447 |
| 54. | Millis Clicquot | 2.52% | 1.42%(+1.11)#54 | 1.05%(+1.47)#4,610 |
| 55. | Hopedale | 2.51% | 1.42%(+1.10)#55 | 1.05%(+1.47)#4,632 |
| 56. | Groton | 2.51% | 1.42%(+1.10)#56 | 1.05%(+1.47)#4,633 |
| 57. | Teaticket | 2.50% | 1.42%(+1.08)#57 | 1.05%(+1.45)#4,670 |
| 58. | Attleboro | 2.47% | 1.42%(+1.05)#58 | 1.05%(+1.42)#4,736 |
| 59. | Amesbury Town | 2.46% | 1.42%(+1.04)#59 | 1.05%(+1.41)#4,755 |
| 60. | Sagamore | 2.45% | 1.42%(+1.03)#60 | 1.05%(+1.40)#4,779 |
| 61. | Marshfield Hills | 2.44% | 1.42%(+1.03)#61 | 1.05%(+1.39)#4,793 |
| 62. | Pepperell | 2.40% | 1.42%(+0.988)#62 | 1.05%(+1.36)#4,859 |
| 63. | Yarmouth Port | 2.38% | 1.42%(+0.962)#63 | 1.05%(+1.33)#4,903 |
| 64. | North Attleborough | 2.31% | 1.42%(+0.897)#64 | 1.05%(+1.26)#5,037 |
| 65. | Shirley | 2.28% | 1.42%(+0.865)#65 | 1.05%(+1.23)#5,098 |
| 66. | The Pinehills | 2.20% | 1.42%(+0.788)#66 | 1.05%(+1.16)#5,270 |
| 67. | Belmont | 2.20% | 1.42%(+0.788)#67 | 1.05%(+1.16)#5,271 |
| 68. | South Deerfield | 2.20% | 1.42%(+0.786)#68 | 1.05%(+1.15)#5,277 |
| 69. | Winchendon | 2.20% | 1.42%(+0.781)#69 | 1.05%(+1.15)#5,289 |
| 70. | East Douglas | 2.19% | 1.42%(+0.770)#70 | 1.05%(+1.14)#5,321 |
| 71. | Middleborough Center | 2.16% | 1.42%(+0.749)#71 | 1.05%(+1.12)#5,370 |
| 72. | Chatham | 2.14% | 1.42%(+0.722)#72 | 1.05%(+1.09)#5,427 |
| 73. | Marblehead | 2.14% | 1.42%(+0.722)#73 | 1.05%(+1.09)#5,428 |
| 74. | South Dennis | 2.13% | 1.42%(+0.713)#74 | 1.05%(+1.08)#5,444 |
| 75. | Hopkinton | 2.09% | 1.42%(+0.676)#75 | 1.05%(+1.04)#5,527 |
| 76. | Forestdale | 2.07% | 1.42%(+0.655)#76 | 1.05%(+1.02)#5,583 |
| 77. | Norton Center | 2.05% | 1.42%(+0.639)#77 | 1.05%(+1.01)#5,622 |
| 78. | Vineyard Haven | 2.03% | 1.42%(+0.612)#78 | 1.05%(+0.979)#5,707 |
| 79. | Barnstable Town | 2.02% | 1.42%(+0.608)#79 | 1.05%(+0.975)#5,717 |
| 80. | Mattapoisett Center | 2.00% | 1.42%(+0.588)#80 | 1.05%(+0.955)#5,773 |
| 81. | Falmouth | 1.98% | 1.42%(+0.567)#81 | 1.05%(+0.935)#5,839 |
| 82. | Wakefield | 1.97% | 1.42%(+0.558)#82 | 1.05%(+0.925)#5,869 |
| 83. | South Duxbury | 1.94% | 1.42%(+0.520)#83 | 1.05%(+0.888)#5,991 |
| 84. | Ocean Bluff Brant Rock | 1.92% | 1.42%(+0.504)#84 | 1.05%(+0.871)#6,042 |
| 85. | Beverly | 1.90% | 1.42%(+0.487)#85 | 1.05%(+0.854)#6,090 |
| 86. | Dennis | 1.90% | 1.42%(+0.481)#86 | 1.05%(+0.848)#6,106 |
| 87. | Franklin Town | 1.89% | 1.42%(+0.479)#87 | 1.05%(+0.846)#6,114 |
| 88. | Gloucester | 1.89% | 1.42%(+0.472)#88 | 1.05%(+0.839)#6,131 |
| 89. | Amherst | 1.88% | 1.42%(+0.468)#89 | 1.05%(+0.835)#6,148 |
| 90. | Plymouth | 1.87% | 1.42%(+0.454)#90 | 1.05%(+0.821)#6,200 |
| 91. | Williamstown | 1.87% | 1.42%(+0.452)#91 | 1.05%(+0.819)#6,205 |
| 92. | Essex | 1.86% | 1.42%(+0.446)#92 | 1.05%(+0.813)#6,218 |
| 93. | Winthrop Town | 1.84% | 1.42%(+0.423)#93 | 1.05%(+0.791)#6,283 |
| 94. | Gardner | 1.80% | 1.42%(+0.381)#94 | 1.05%(+0.749)#6,401 |
| 95. | Athol | 1.79% | 1.42%(+0.377)#95 | 1.05%(+0.744)#6,420 |
| 96. | Worcester | 1.79% | 1.42%(+0.376)#96 | 1.05%(+0.744)#6,421 |
| 97. | Fitchburg | 1.73% | 1.42%(+0.317)#97 | 1.05%(+0.684)#6,599 |
| 98. | Weymouth Town | 1.73% | 1.42%(+0.312)#98 | 1.05%(+0.679)#6,621 |
| 99. | Blandford | 1.72% | 1.42%(+0.304)#99 | 1.05%(+0.671)#6,637 |
| 100. | Somerset | 1.72% | 1.42%(+0.303)#100 | 1.05%(+0.671)#6,638 |
Common Questions
What are the Top 10 Cities with the Highest Percentage of Swedish Population in Massachusetts?
Top 10 Cities with the Highest Percentage of Swedish Population in Massachusetts are:
#1
12.12%
#2
11.59%
#3
11.24%
#4
8.40%
#5
8.32%
#6
8.11%
#7
7.35%
#8
7.30%
#9
7.29%
#10
7.16%
What city has the Highest Percentage of Swedish Population in Massachusetts?
Weweantic has the Highest Percentage of Swedish Population in Massachusetts with 12.12%.
What is the Percentage of Swedish Population in the State of Massachusetts?
Percentage of Swedish Population in Massachusetts is 1.42%.
What is the Percentage of Swedish Population in the United States?
Percentage of Swedish Population in the United States is 1.05%.