North Plymouth, MA Map & Demographics
North Plymouth Map
North Plymouth Overview
$36,124
PER CAPITA INCOME
$106,400
AVG FAMILY INCOME
$59,696
AVG HOUSEHOLD INCOME
26.0%
WAGE / INCOME GAP [ % ]
74.0¢/ $1
WAGE / INCOME GAP [ $ ]
0.44
INEQUALITY / GINI INDEX
4,418
TOTAL POPULATION
2,220
MALE POPULATION
2,198
FEMALE POPULATION
101.00
MALES / 100 FEMALES
99.01
FEMALES / 100 MALES
41.0
MEDIAN AGE
3.0
AVG FAMILY SIZE
2.2
AVG HOUSEHOLD SIZE
2,840
LABOR FORCE [ PEOPLE ]
74.2%
PERCENT IN LABOR FORCE
18.1%
UNEMPLOYMENT RATE
Income in North Plymouth
Income Overview in North Plymouth
Per Capita Income in North Plymouth is $36,124, while median incomes of families and households are $106,400 and $59,696 respectively.
| Characteristic | Number | Measure |
| Per Capita Income | 4,418 | $36,124 |
| Median Family Income | 968 | $106,400 |
| Mean Family Income | 968 | $105,178 |
| Median Household Income | 2,000 | $59,696 |
| Mean Household Income | 2,000 | $76,857 |
| Income Deficit | 968 | $0 |
| Wage / Income Gap (%) | 4,418 | 25.95% |
| Wage / Income Gap ($) | 4,418 | 74.05¢ per $1 |
| Gini / Inequality Index | 4,418 | 0.44 |
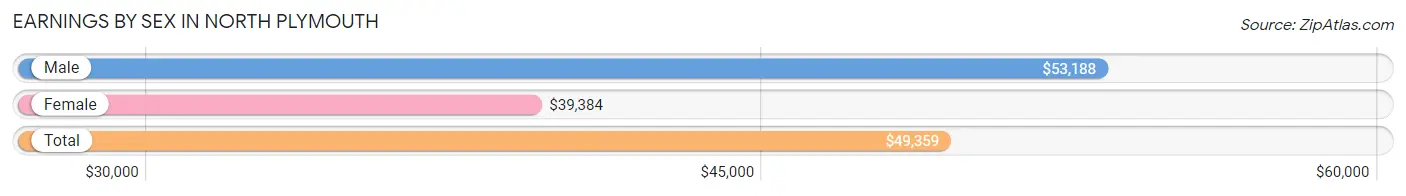
Earnings by Sex in North Plymouth
Average Earnings in North Plymouth are $49,359, $53,188 for men and $39,384 for women, a difference of 26.0%.
| Sex | Number | Average Earnings |
| Male | 1,338 (53.3%) | $53,188 |
| Female | 1,170 (46.7%) | $39,384 |
| Total | 2,508 (100.0%) | $49,359 |
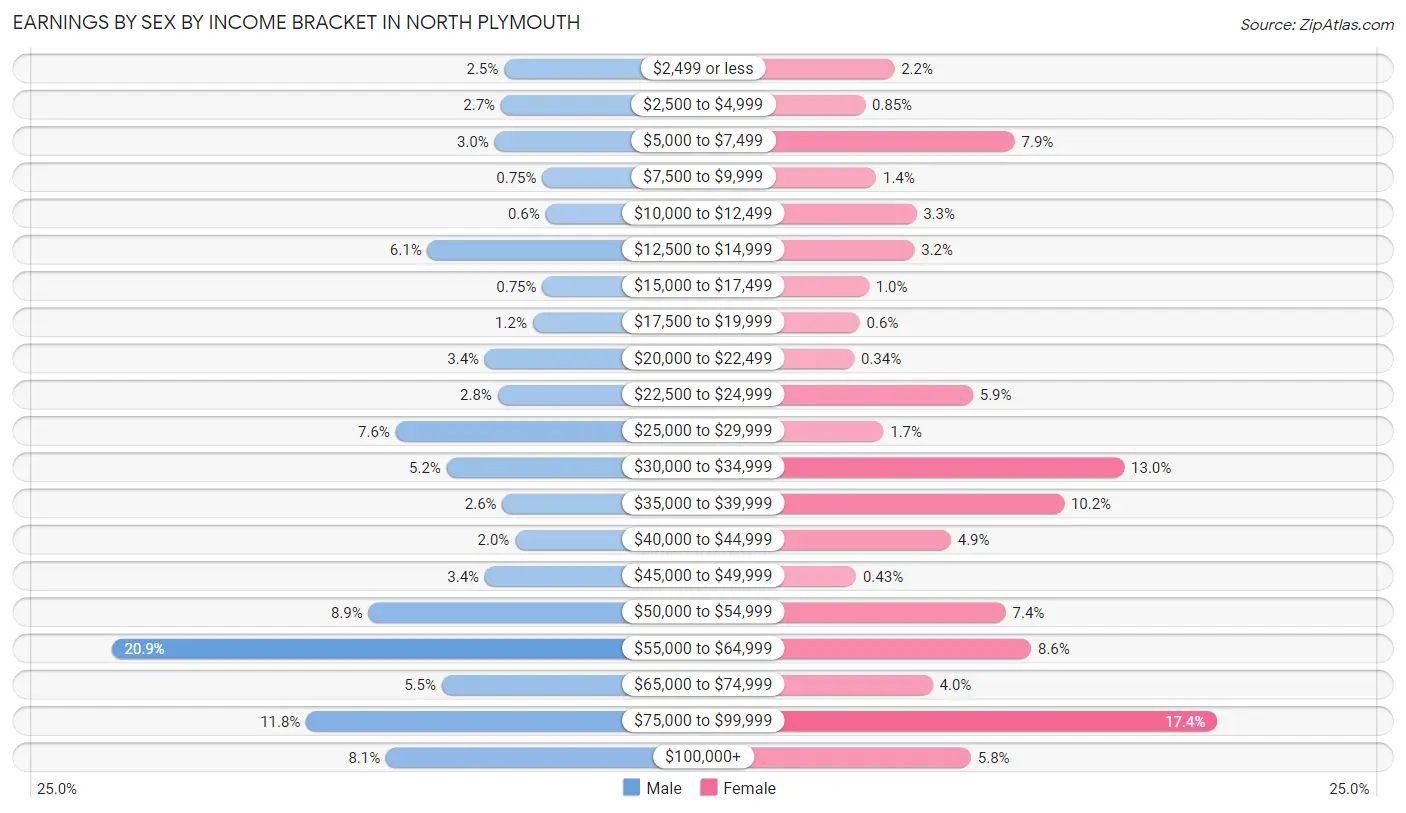
Earnings by Sex by Income Bracket in North Plymouth
The most common earnings brackets in North Plymouth are $55,000 to $64,999 for men (280 | 20.9%) and $75,000 to $99,999 for women (203 | 17.3%).
| Income | Male | Female |
| $2,499 or less | 34 (2.5%) | 26 (2.2%) |
| $2,500 to $4,999 | 36 (2.7%) | 10 (0.9%) |
| $5,000 to $7,499 | 40 (3.0%) | 92 (7.9%) |
| $7,500 to $9,999 | 10 (0.7%) | 16 (1.4%) |
| $10,000 to $12,499 | 8 (0.6%) | 38 (3.3%) |
| $12,500 to $14,999 | 82 (6.1%) | 37 (3.2%) |
| $15,000 to $17,499 | 10 (0.7%) | 12 (1.0%) |
| $17,500 to $19,999 | 16 (1.2%) | 7 (0.6%) |
| $20,000 to $22,499 | 46 (3.4%) | 4 (0.3%) |
| $22,500 to $24,999 | 38 (2.8%) | 69 (5.9%) |
| $25,000 to $29,999 | 102 (7.6%) | 20 (1.7%) |
| $30,000 to $34,999 | 70 (5.2%) | 152 (13.0%) |
| $35,000 to $39,999 | 35 (2.6%) | 119 (10.2%) |
| $40,000 to $44,999 | 27 (2.0%) | 57 (4.9%) |
| $45,000 to $49,999 | 46 (3.4%) | 5 (0.4%) |
| $50,000 to $54,999 | 119 (8.9%) | 87 (7.4%) |
| $55,000 to $64,999 | 280 (20.9%) | 101 (8.6%) |
| $65,000 to $74,999 | 73 (5.5%) | 47 (4.0%) |
| $75,000 to $99,999 | 158 (11.8%) | 203 (17.3%) |
| $100,000+ | 108 (8.1%) | 68 (5.8%) |
| Total | 1,338 (100.0%) | 1,170 (100.0%) |
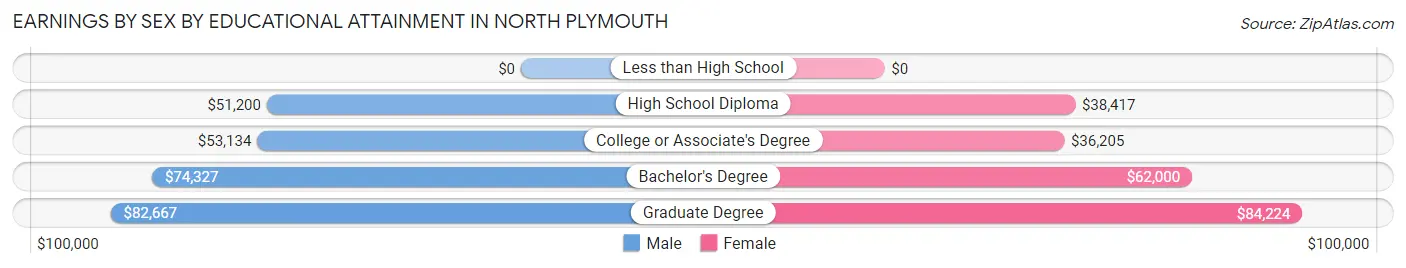
Earnings by Sex by Educational Attainment in North Plymouth
Average earnings in North Plymouth are $55,000 for men and $41,378 for women, a difference of 24.8%. Men with an educational attainment of graduate degree enjoy the highest average annual earnings of $82,667, while those with high school diploma education earn the least with $51,200. Women with an educational attainment of graduate degree earn the most with the average annual earnings of $84,224, while those with college or associate's degree education have the smallest earnings of $36,205.
| Educational Attainment | Male Income | Female Income |
| Less than High School | - | - |
| High School Diploma | $51,200 | $38,417 |
| College or Associate's Degree | $53,134 | $36,205 |
| Bachelor's Degree | $74,327 | $62,000 |
| Graduate Degree | $82,667 | $84,224 |
| Total | $55,000 | $41,378 |
Family Income in North Plymouth
Family Income Brackets in North Plymouth
According to the North Plymouth family income data, there are 284 families falling into the $100,000 to $149,999 income range, which is the most common income bracket and makes up 29.3% of all families.
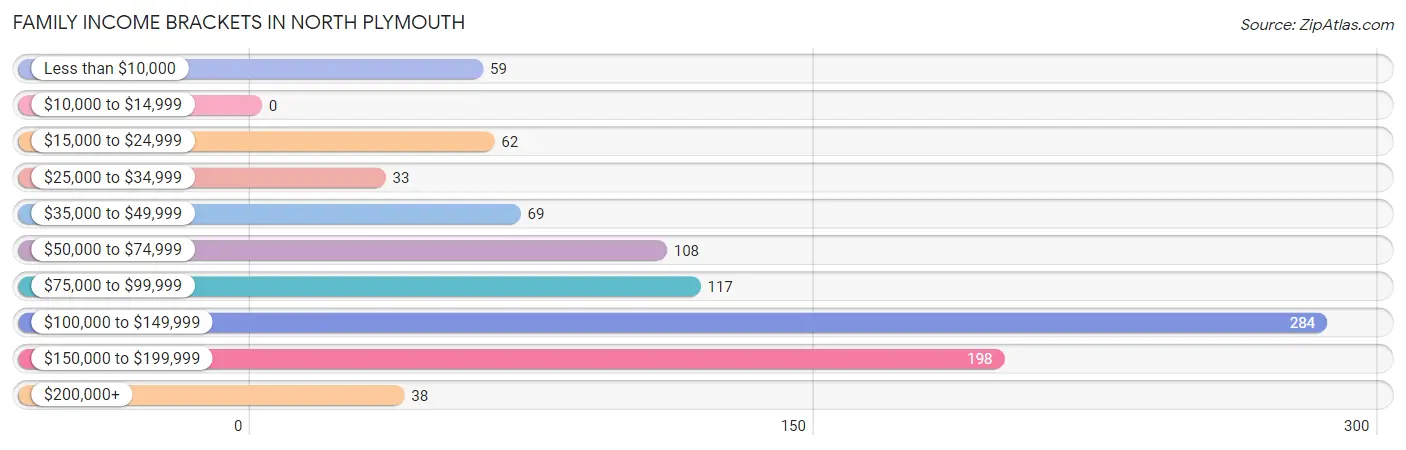
| Income Bracket | # Families | % Families |
| Less than $10,000 | 59 | 6.1% |
| $10,000 to $14,999 | 0 | 0.0% |
| $15,000 to $24,999 | 62 | 6.4% |
| $25,000 to $34,999 | 33 | 3.4% |
| $35,000 to $49,999 | 69 | 7.1% |
| $50,000 to $74,999 | 108 | 11.2% |
| $75,000 to $99,999 | 117 | 12.1% |
| $100,000 to $149,999 | 284 | 29.3% |
| $150,000 to $199,999 | 198 | 20.5% |
| $200,000+ | 38 | 3.9% |
Family Income by Famaliy Size in North Plymouth
4-person families (231 | 23.9%) account for the highest median family income in North Plymouth with $145,568 per family, while 2-person families (490 | 50.6%) have the highest median income of $53,350 per family member.
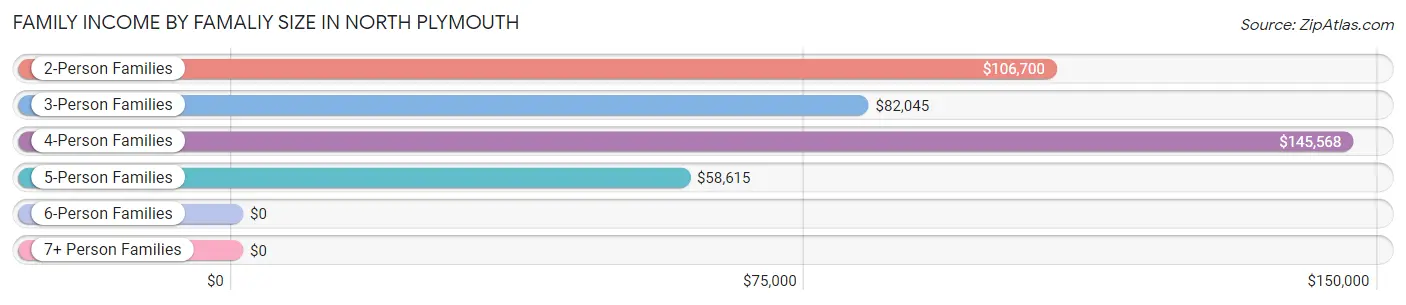
| Income Bracket | # Families | Median Income |
| 2-Person Families | 490 (50.6%) | $106,700 |
| 3-Person Families | 194 (20.0%) | $82,045 |
| 4-Person Families | 231 (23.9%) | $145,568 |
| 5-Person Families | 49 (5.1%) | $58,615 |
| 6-Person Families | 0 (0.0%) | $0 |
| 7+ Person Families | 4 (0.4%) | $0 |
| Total | 968 (100.0%) | $106,400 |
Family Income by Number of Earners in North Plymouth
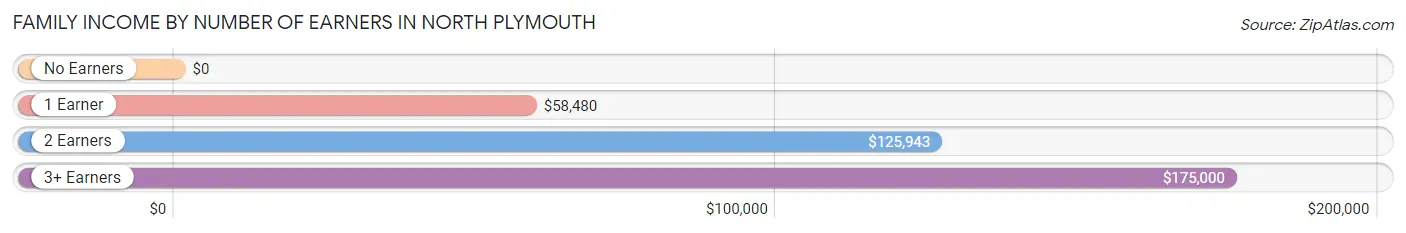
| Number of Earners | # Families | Median Income |
| No Earners | 91 (9.4%) | $0 |
| 1 Earner | 283 (29.2%) | $58,480 |
| 2 Earners | 522 (53.9%) | $125,943 |
| 3+ Earners | 72 (7.4%) | $175,000 |
| Total | 968 (100.0%) | $106,400 |
Household Income in North Plymouth
Household Income Brackets in North Plymouth
With 378 households falling in the category, the $100,000 to $149,999 income range is the most frequent in North Plymouth, accounting for 18.9% of all households. In contrast, only 50 households (2.5%) fall into the $200,000+ income bracket, making it the least populous group.
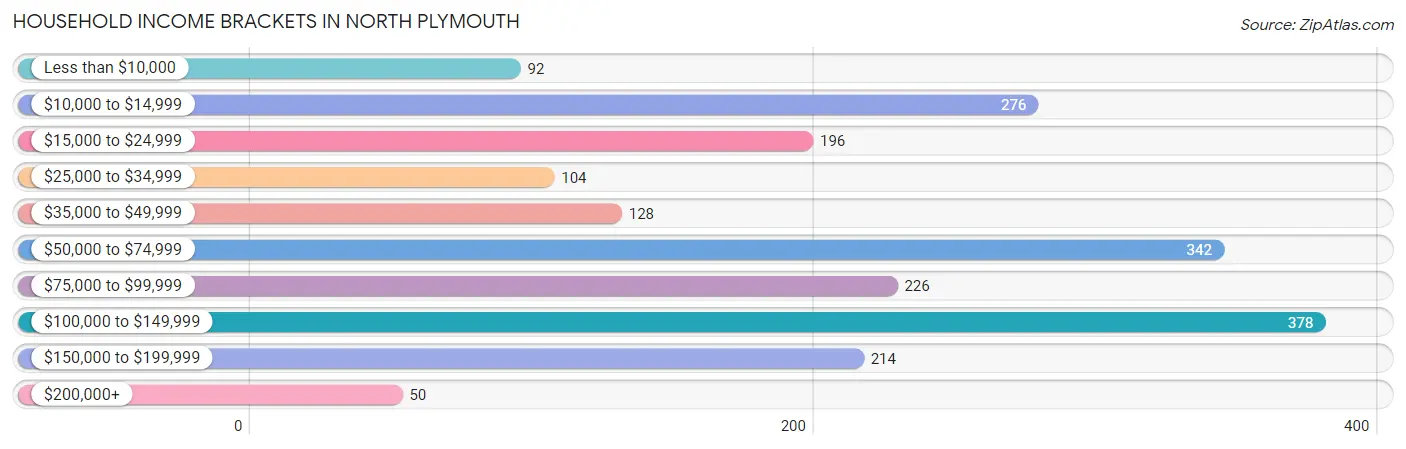
| Income Bracket | # Households | % Households |
| Less than $10,000 | 92 | 4.6% |
| $10,000 to $14,999 | 276 | 13.8% |
| $15,000 to $24,999 | 196 | 9.8% |
| $25,000 to $34,999 | 104 | 5.2% |
| $35,000 to $49,999 | 128 | 6.4% |
| $50,000 to $74,999 | 342 | 17.1% |
| $75,000 to $99,999 | 226 | 11.3% |
| $100,000 to $149,999 | 378 | 18.9% |
| $150,000 to $199,999 | 214 | 10.7% |
| $200,000+ | 50 | 2.5% |
Household Income by Householder Age in North Plymouth
The median household income in North Plymouth is $59,696, with the highest median household income of $87,115 found in the 45 to 64 years age bracket for the primary householder. A total of 708 households (35.4%) fall into this category.
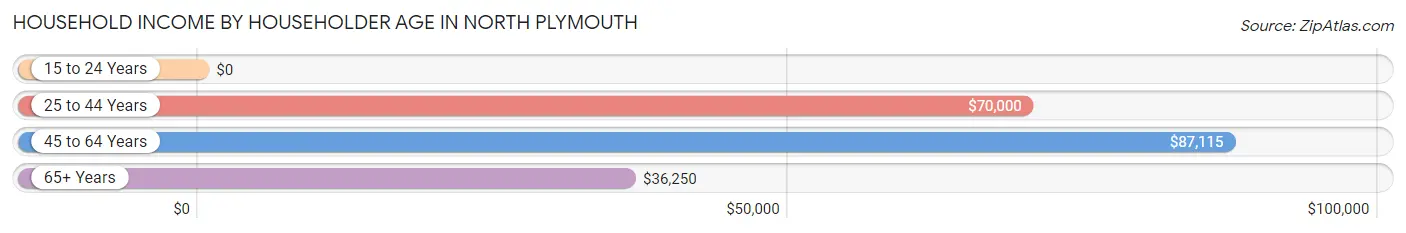
| Income Bracket | # Households | Median Income |
| 15 to 24 Years | 0 (0.0%) | $0 |
| 25 to 44 Years | 758 (37.9%) | $70,000 |
| 45 to 64 Years | 708 (35.4%) | $87,115 |
| 65+ Years | 534 (26.7%) | $36,250 |
| Total | 2,000 (100.0%) | $59,696 |
Poverty in North Plymouth
Income Below Poverty by Sex and Age in North Plymouth
With 26.3% poverty level for males and 14.6% for females among the residents of North Plymouth, 6 to 11 year old males and 18 to 24 year old females are the most vulnerable to poverty, with 52 males (100.0%) and 48 females (37.8%) in their respective age groups living below the poverty level.
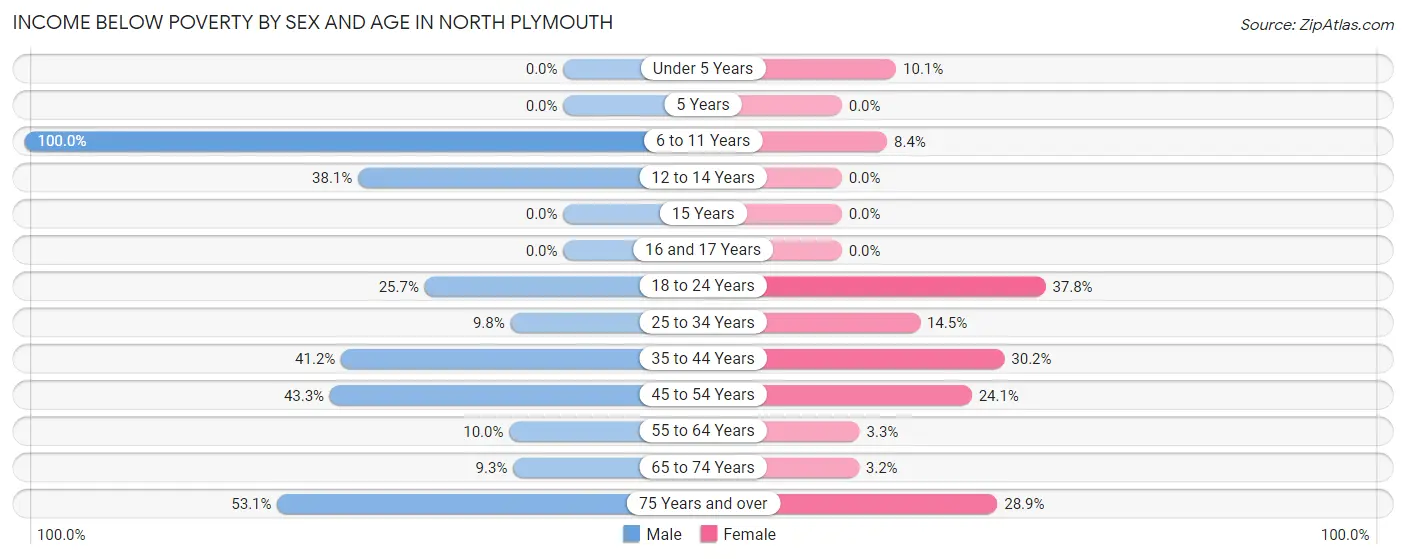
| Age Bracket | Male | Female |
| Under 5 Years | 0 (0.0%) | 13 (10.1%) |
| 5 Years | 0 (0.0%) | 0 (0.0%) |
| 6 to 11 Years | 52 (100.0%) | 9 (8.4%) |
| 12 to 14 Years | 32 (38.1%) | 0 (0.0%) |
| 15 Years | 0 (0.0%) | 0 (0.0%) |
| 16 and 17 Years | 0 (0.0%) | 0 (0.0%) |
| 18 to 24 Years | 44 (25.7%) | 48 (37.8%) |
| 25 to 34 Years | 53 (9.8%) | 64 (14.5%) |
| 35 to 44 Years | 186 (41.2%) | 70 (30.2%) |
| 45 to 54 Years | 107 (43.3%) | 54 (24.1%) |
| 55 to 64 Years | 24 (10.0%) | 13 (3.3%) |
| 65 to 74 Years | 16 (9.3%) | 8 (3.2%) |
| 75 Years and over | 69 (53.1%) | 41 (28.9%) |
| Total | 583 (26.3%) | 320 (14.6%) |
Income Above Poverty by Sex and Age in North Plymouth
According to the poverty statistics in North Plymouth, males aged under 5 years and females aged 5 years are the age groups that are most secure financially, with 100.0% of males and 100.0% of females in these age groups living above the poverty line.
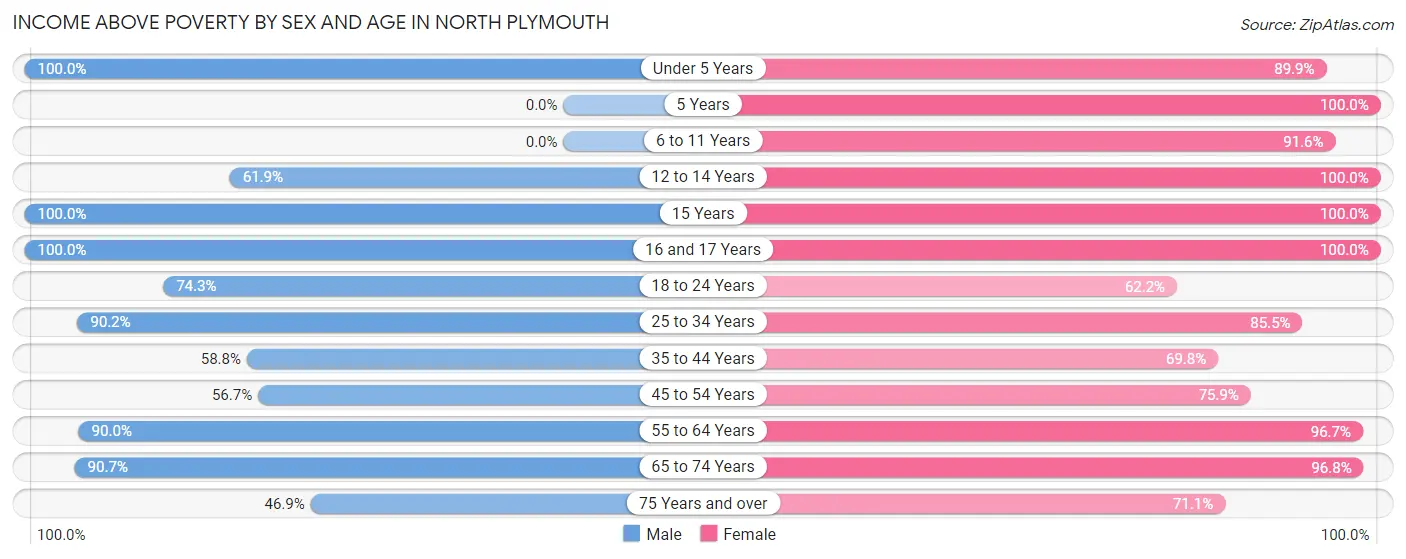
| Age Bracket | Male | Female |
| Under 5 Years | 78 (100.0%) | 116 (89.9%) |
| 5 Years | 0 (0.0%) | 41 (100.0%) |
| 6 to 11 Years | 0 (0.0%) | 98 (91.6%) |
| 12 to 14 Years | 52 (61.9%) | 44 (100.0%) |
| 15 Years | 45 (100.0%) | 4 (100.0%) |
| 16 and 17 Years | 9 (100.0%) | 55 (100.0%) |
| 18 to 24 Years | 127 (74.3%) | 79 (62.2%) |
| 25 to 34 Years | 488 (90.2%) | 377 (85.5%) |
| 35 to 44 Years | 265 (58.8%) | 162 (69.8%) |
| 45 to 54 Years | 140 (56.7%) | 170 (75.9%) |
| 55 to 64 Years | 215 (90.0%) | 381 (96.7%) |
| 65 to 74 Years | 156 (90.7%) | 244 (96.8%) |
| 75 Years and over | 61 (46.9%) | 101 (71.1%) |
| Total | 1,636 (73.7%) | 1,872 (85.4%) |
Income Below Poverty Among Married-Couple Families in North Plymouth
The poverty statistics for married-couple families in North Plymouth show that 14.0% or 96 of the total 688 families live below the poverty line. Families with 1 or 2 children have the highest poverty rate of 21.1%, comprising of 54 families. On the other hand, families with 3 or 4 children have the lowest poverty rate of 0.0%, which includes 0 families.
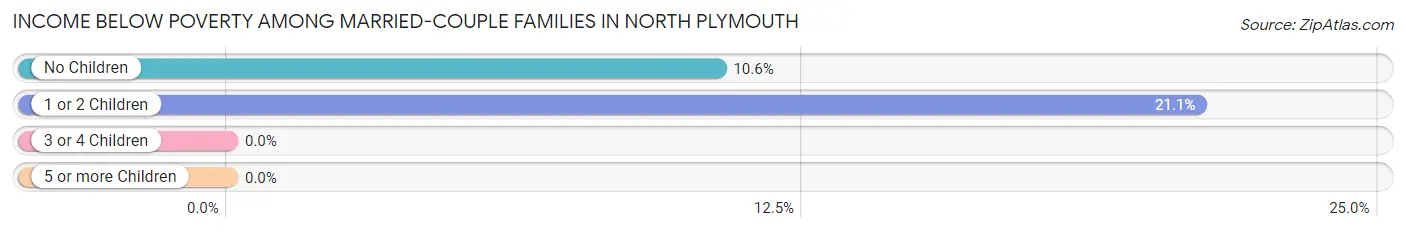
| Children | Above Poverty | Below Poverty |
| No Children | 353 (89.4%) | 42 (10.6%) |
| 1 or 2 Children | 202 (78.9%) | 54 (21.1%) |
| 3 or 4 Children | 37 (100.0%) | 0 (0.0%) |
| 5 or more Children | 0 (0.0%) | 0 (0.0%) |
| Total | 592 (86.1%) | 96 (14.0%) |
Income Below Poverty Among Single-Parent Households in North Plymouth
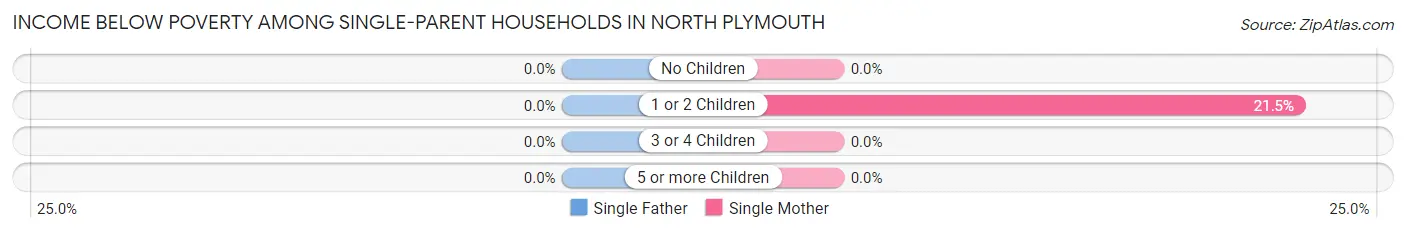
| Children | Single Father | Single Mother |
| No Children | 0 (0.0%) | 0 (0.0%) |
| 1 or 2 Children | 0 (0.0%) | 17 (21.5%) |
| 3 or 4 Children | 0 (0.0%) | 0 (0.0%) |
| 5 or more Children | 0 (0.0%) | 0 (0.0%) |
| Total | 0 (0.0%) | 17 (6.1%) |
Income Below Poverty Among Married-Couple vs Single-Parent Households in North Plymouth
The poverty data for North Plymouth shows that 96 of the married-couple family households (14.0%) and 17 of the single-parent households (6.1%) are living below the poverty level. Within the married-couple family households, those with 1 or 2 children have the highest poverty rate, with 54 households (21.1%) falling below the poverty line. Among the single-parent households, those with 1 or 2 children have the highest poverty rate, with 17 household (21.5%) living below poverty.
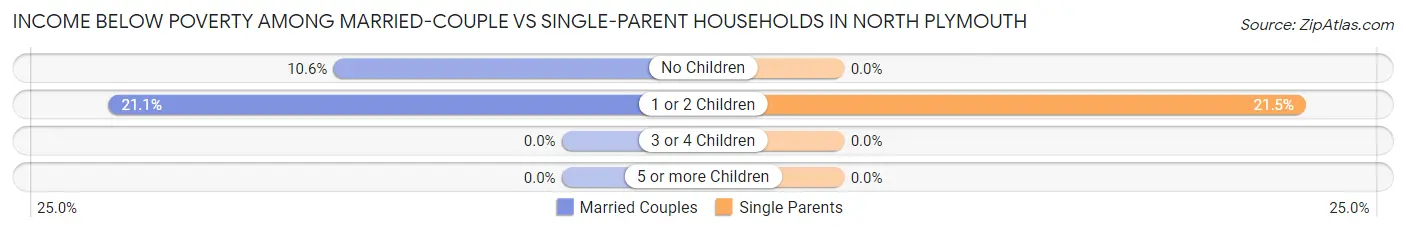
| Children | Married-Couple Families | Single-Parent Households |
| No Children | 42 (10.6%) | 0 (0.0%) |
| 1 or 2 Children | 54 (21.1%) | 17 (21.5%) |
| 3 or 4 Children | 0 (0.0%) | 0 (0.0%) |
| 5 or more Children | 0 (0.0%) | 0 (0.0%) |
| Total | 96 (14.0%) | 17 (6.1%) |
Race in North Plymouth
The most populous races in North Plymouth are White / Caucasian (3,624 | 82.0%), Some other Race (393 | 8.9%), and Two or more Races (307 | 7.0%).

| Race | # Population | % Population |
| Asian | 0 | 0.0% |
| Black / African American | 25 | 0.6% |
| Hawaiian / Pacific | 69 | 1.6% |
| Hispanic or Latino | 102 | 2.3% |
| Native / Alaskan | 0 | 0.0% |
| White / Caucasian | 3,624 | 82.0% |
| Two or more Races | 307 | 7.0% |
| Some other Race | 393 | 8.9% |
| Total | 4,418 | 100.0% |
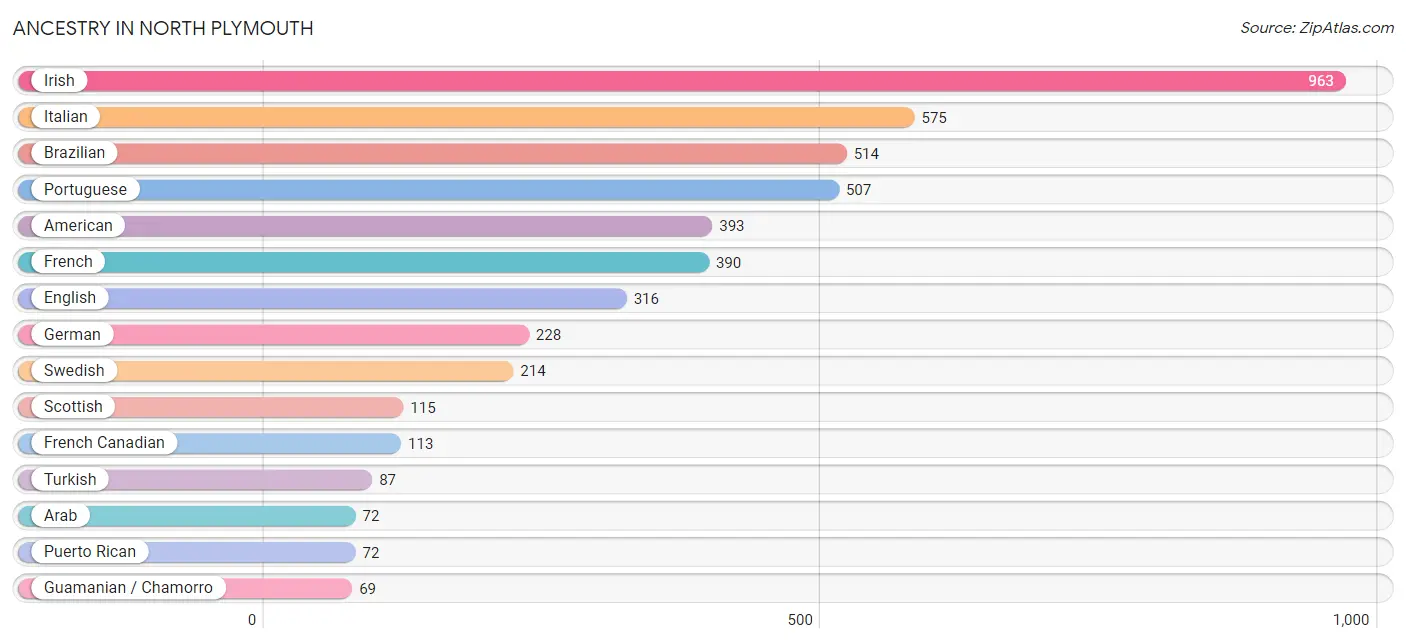
Ancestry in North Plymouth
The most populous ancestries reported in North Plymouth are Irish (963 | 21.8%), Italian (575 | 13.0%), Brazilian (514 | 11.6%), Portuguese (507 | 11.5%), and American (393 | 8.9%), together accounting for 66.8% of all North Plymouth residents.
| Ancestry | # Population | % Population |
| American | 393 | 8.9% |
| Arab | 72 | 1.6% |
| Brazilian | 514 | 11.6% |
| British | 25 | 0.6% |
| Cape Verdean | 12 | 0.3% |
| Colombian | 10 | 0.2% |
| Czechoslovakian | 10 | 0.2% |
| Dominican | 7 | 0.2% |
| Dutch | 9 | 0.2% |
| Eastern European | 25 | 0.6% |
| Egyptian | 16 | 0.4% |
| English | 316 | 7.1% |
| European | 40 | 0.9% |
| Finnish | 27 | 0.6% |
| French | 390 | 8.8% |
| French Canadian | 113 | 2.6% |
| German | 228 | 5.2% |
| Greek | 64 | 1.5% |
| Guamanian / Chamorro | 69 | 1.6% |
| Indian (Asian) | 14 | 0.3% |
| Irish | 963 | 21.8% |
| Italian | 575 | 13.0% |
| Lebanese | 49 | 1.1% |
| Lithuanian | 45 | 1.0% |
| Norwegian | 6 | 0.1% |
| Polish | 55 | 1.2% |
| Portuguese | 507 | 11.5% |
| Puerto Rican | 72 | 1.6% |
| Russian | 14 | 0.3% |
| Scotch-Irish | 22 | 0.5% |
| Scottish | 115 | 2.6% |
| South American | 10 | 0.2% |
| Spanish | 12 | 0.3% |
| Subsaharan African | 12 | 0.3% |
| Swedish | 214 | 4.8% |
| Turkish | 87 | 2.0% |
| Ukrainian | 11 | 0.3% |
| Welsh | 6 | 0.1% | View All 38 Rows |
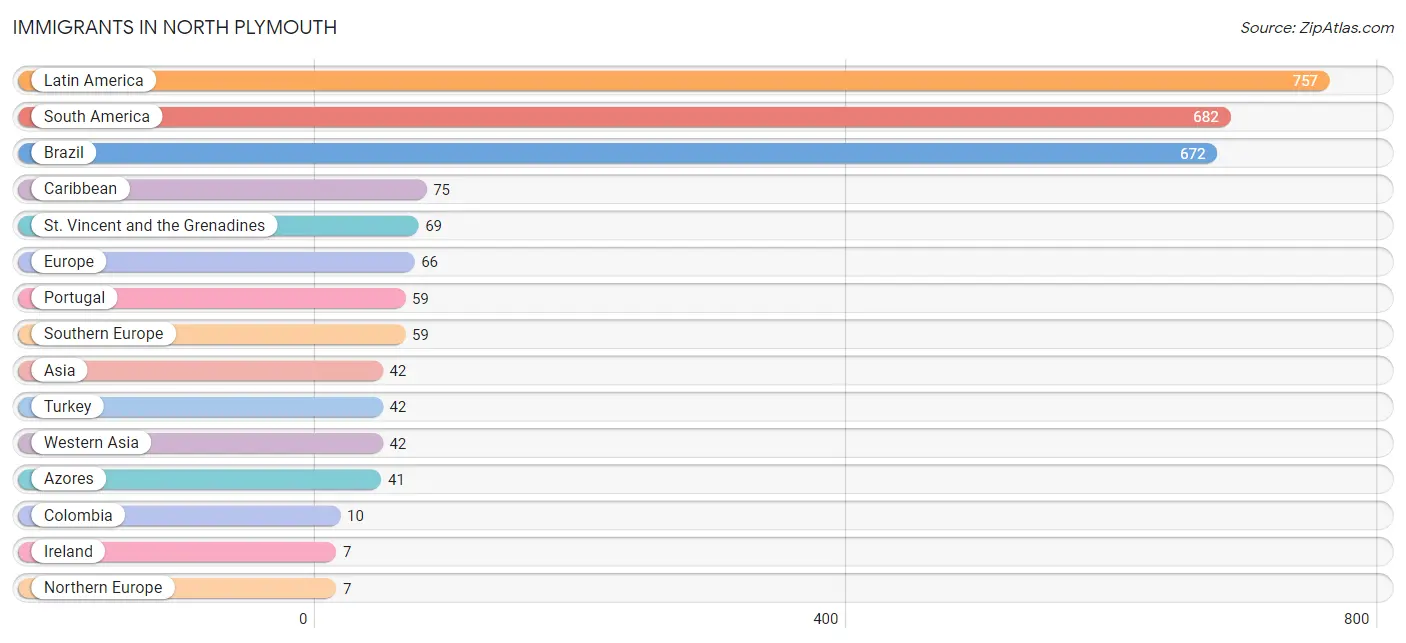
Immigrants in North Plymouth
The most numerous immigrant groups reported in North Plymouth came from Latin America (757 | 17.1%), South America (682 | 15.4%), Brazil (672 | 15.2%), Caribbean (75 | 1.7%), and St. Vincent and the Grenadines (69 | 1.6%), together accounting for 51.0% of all North Plymouth residents.
| Immigration Origin | # Population | % Population |
| Asia | 42 | 0.9% |
| Azores | 41 | 0.9% |
| Brazil | 672 | 15.2% |
| Caribbean | 75 | 1.7% |
| Colombia | 10 | 0.2% |
| Europe | 66 | 1.5% |
| Haiti | 6 | 0.1% |
| Ireland | 7 | 0.2% |
| Latin America | 757 | 17.1% |
| Northern Europe | 7 | 0.2% |
| Portugal | 59 | 1.3% |
| South America | 682 | 15.4% |
| Southern Europe | 59 | 1.3% |
| St. Vincent and the Grenadines | 69 | 1.6% |
| Turkey | 42 | 0.9% |
| Western Asia | 42 | 0.9% | View All 16 Rows |
Sex and Age in North Plymouth
Sex and Age in North Plymouth
The most populous age groups in North Plymouth are 25 to 29 Years (354 | 16.0%) for men and 25 to 29 Years (251 | 11.4%) for women.
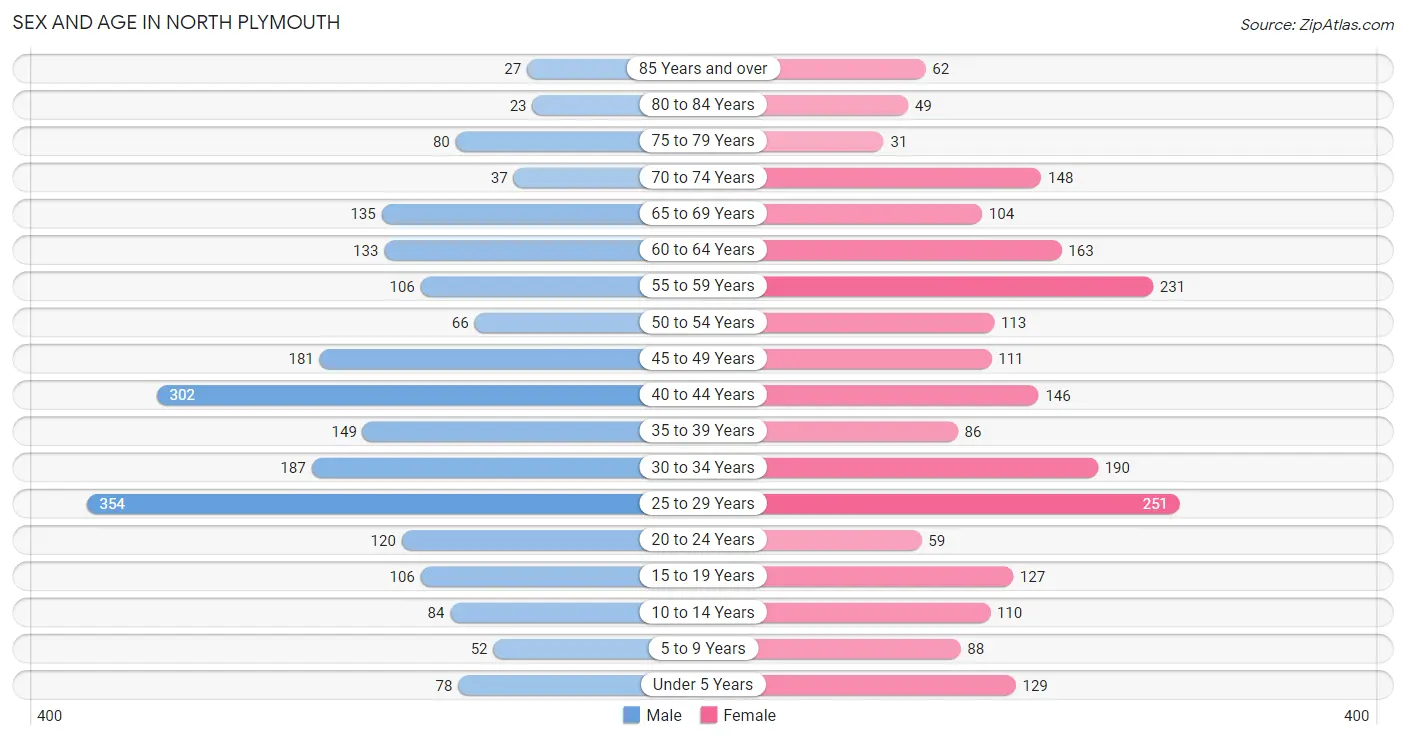
| Age Bracket | Male | Female |
| Under 5 Years | 78 (3.5%) | 129 (5.9%) |
| 5 to 9 Years | 52 (2.3%) | 88 (4.0%) |
| 10 to 14 Years | 84 (3.8%) | 110 (5.0%) |
| 15 to 19 Years | 106 (4.8%) | 127 (5.8%) |
| 20 to 24 Years | 120 (5.4%) | 59 (2.7%) |
| 25 to 29 Years | 354 (16.0%) | 251 (11.4%) |
| 30 to 34 Years | 187 (8.4%) | 190 (8.6%) |
| 35 to 39 Years | 149 (6.7%) | 86 (3.9%) |
| 40 to 44 Years | 302 (13.6%) | 146 (6.6%) |
| 45 to 49 Years | 181 (8.2%) | 111 (5.1%) |
| 50 to 54 Years | 66 (3.0%) | 113 (5.1%) |
| 55 to 59 Years | 106 (4.8%) | 231 (10.5%) |
| 60 to 64 Years | 133 (6.0%) | 163 (7.4%) |
| 65 to 69 Years | 135 (6.1%) | 104 (4.7%) |
| 70 to 74 Years | 37 (1.7%) | 148 (6.7%) |
| 75 to 79 Years | 80 (3.6%) | 31 (1.4%) |
| 80 to 84 Years | 23 (1.0%) | 49 (2.2%) |
| 85 Years and over | 27 (1.2%) | 62 (2.8%) |
| Total | 2,220 (100.0%) | 2,198 (100.0%) |
Families and Households in North Plymouth
Median Family Size in North Plymouth
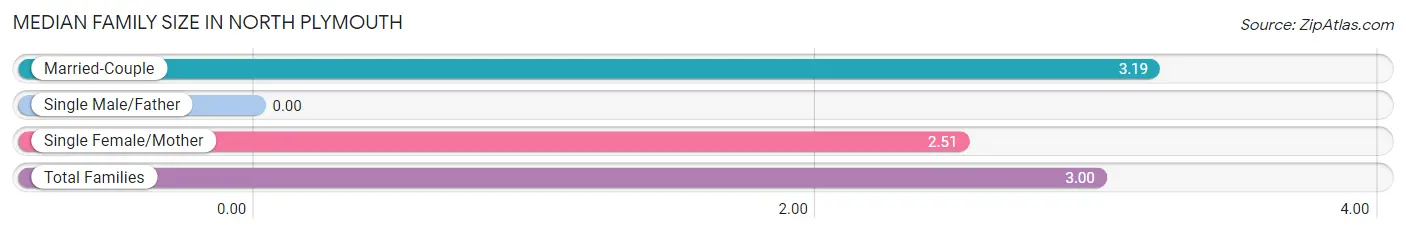
| Family Type | # Families | Family Size |
| Married-Couple | 688 (71.1%) | 3.19 |
| Single Male/Father | 0 (0.0%) | - |
| Single Female/Mother | 280 (28.9%) | 2.51 |
| Total Families | 968 (100.0%) | 3.00 |
Median Household Size in North Plymouth
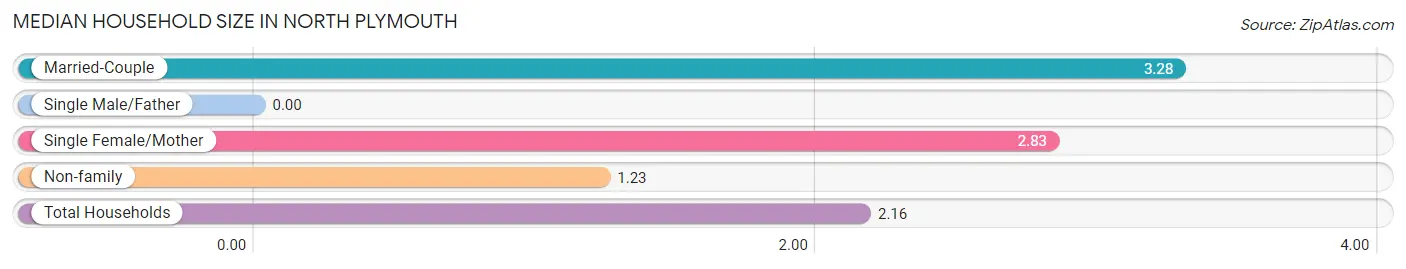
| Household Type | # Households | Household Size |
| Married-Couple | 688 (34.4%) | 3.28 |
| Single Male/Father | 0 (0.0%) | - |
| Single Female/Mother | 280 (14.0%) | 2.83 |
| Non-family | 1,032 (51.6%) | 1.23 |
| Total Households | 2,000 (100.0%) | 2.16 |
Household Size by Marriage Status in North Plymouth
Out of a total of 2,000 households in North Plymouth, 968 (48.4%) are family households, while 1,032 (51.6%) are nonfamily households. The most numerous type of family households are 2-person households, comprising 395, and the most common type of nonfamily households are 1-person households, comprising 816.
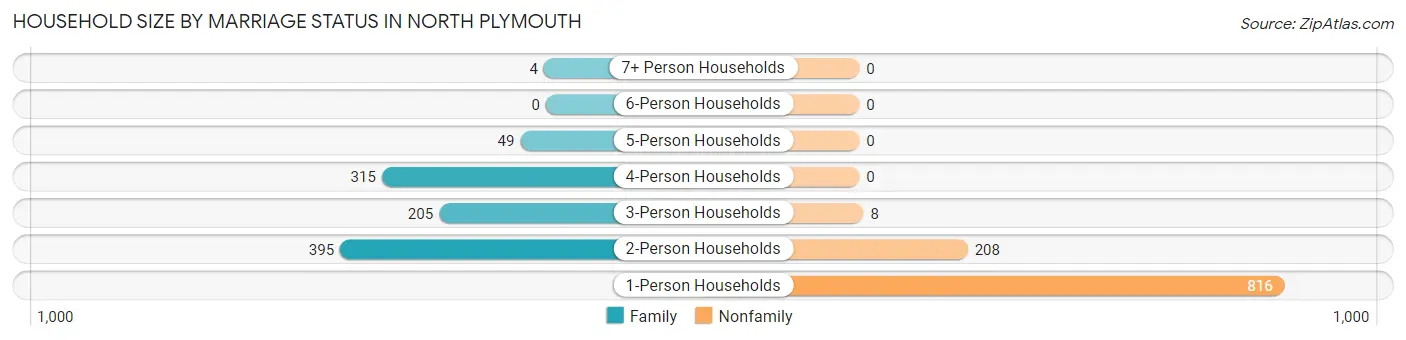
| Household Size | Family Households | Nonfamily Households |
| 1-Person Households | - | 816 (40.8%) |
| 2-Person Households | 395 (19.8%) | 208 (10.4%) |
| 3-Person Households | 205 (10.2%) | 8 (0.4%) |
| 4-Person Households | 315 (15.8%) | 0 (0.0%) |
| 5-Person Households | 49 (2.5%) | 0 (0.0%) |
| 6-Person Households | 0 (0.0%) | 0 (0.0%) |
| 7+ Person Households | 4 (0.2%) | 0 (0.0%) |
| Total | 968 (48.4%) | 1,032 (51.6%) |
Female Fertility in North Plymouth
Fertility by Age in North Plymouth
Average fertility rate in North Plymouth is 14.0 births per 1,000 women. Women in the age bracket of 20 to 34 years have the highest fertility rate with 28.0 births per 1,000 women. Women in the age bracket of 20 to 34 years acount for 100.0% of all women with births.
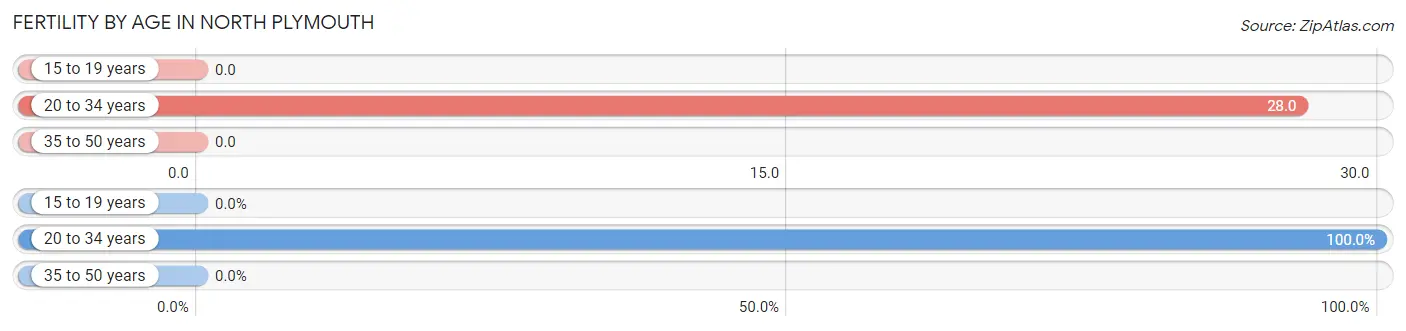
| Age Bracket | Women with Births | Births / 1,000 Women |
| 15 to 19 years | 0 (0.0%) | 0.0 |
| 20 to 34 years | 14 (100.0%) | 28.0 |
| 35 to 50 years | 0 (0.0%) | 0.0 |
| Total | 14 (100.0%) | 14.0 |
Fertility by Age by Marriage Status in North Plymouth
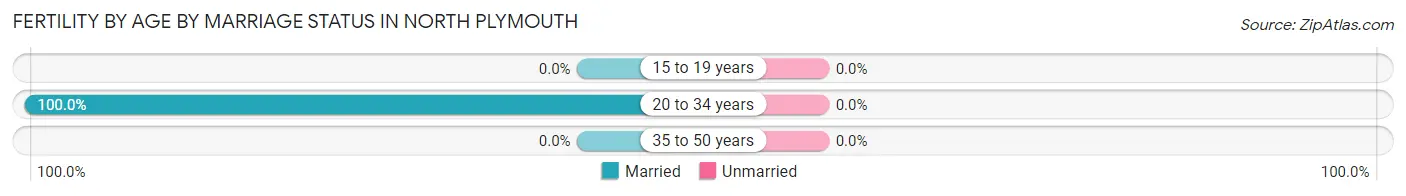
| Age Bracket | Married | Unmarried |
| 15 to 19 years | 0 (0.0%) | 0 (0.0%) |
| 20 to 34 years | 14 (100.0%) | 0 (0.0%) |
| 35 to 50 years | 0 (0.0%) | 0 (0.0%) |
| Total | 14 (100.0%) | 0 (0.0%) |
Fertility by Education in North Plymouth
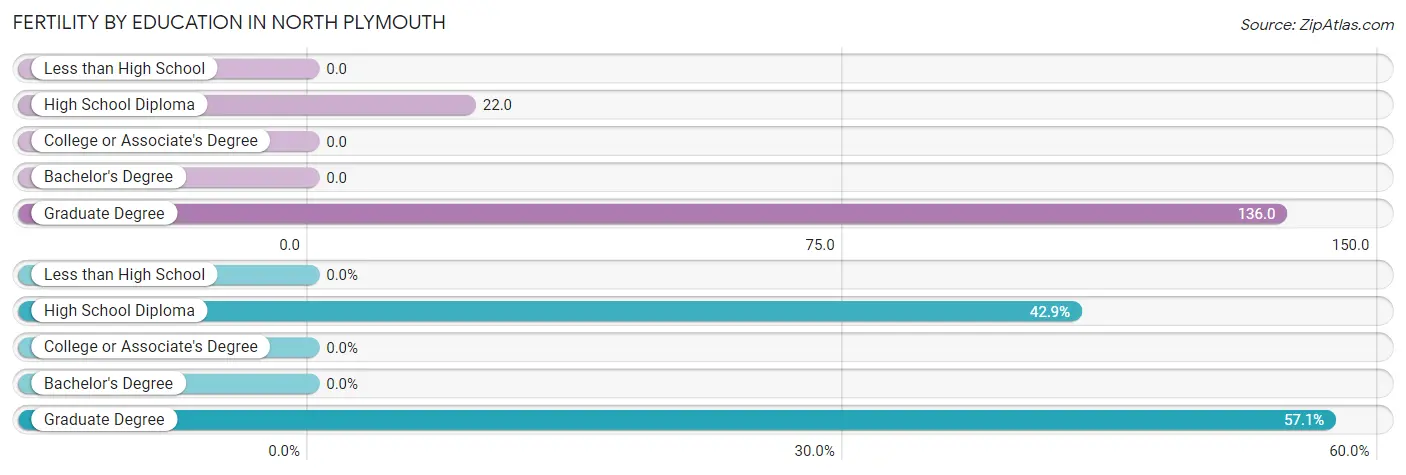
| Educational Attainment | Women with Births | Births / 1,000 Women |
| Less than High School | 0 (0.0%) | 0.0 |
| High School Diploma | 6 (42.9%) | 22.0 |
| College or Associate's Degree | 0 (0.0%) | 0.0 |
| Bachelor's Degree | 0 (0.0%) | 0.0 |
| Graduate Degree | 8 (57.1%) | 136.0 |
| Total | 14 (100.0%) | 14.0 |
Fertility by Education by Marriage Status in North Plymouth
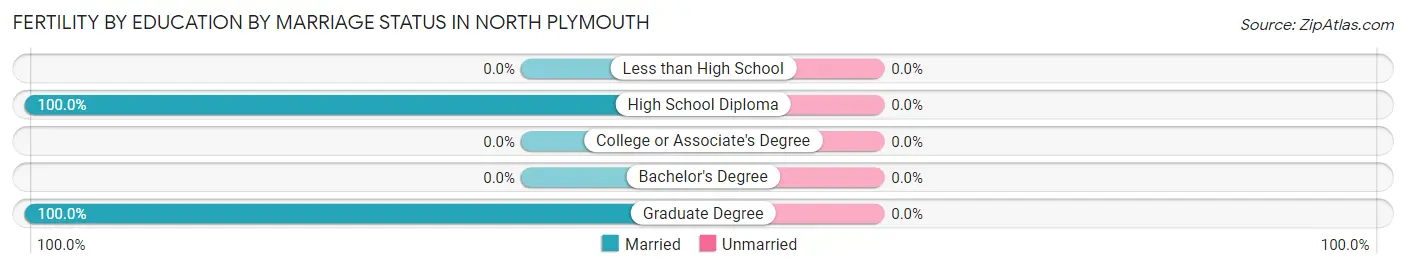
| Educational Attainment | Married | Unmarried |
| Less than High School | 0 (0.0%) | 0 (0.0%) |
| High School Diploma | 6 (100.0%) | 0 (0.0%) |
| College or Associate's Degree | 0 (0.0%) | 0 (0.0%) |
| Bachelor's Degree | 0 (0.0%) | 0 (0.0%) |
| Graduate Degree | 8 (100.0%) | 0 (0.0%) |
| Total | 14 (100.0%) | 0 (0.0%) |
Employment Characteristics in North Plymouth
Employment by Class of Employer in North Plymouth
Among the 2,313 employed individuals in North Plymouth, private company employees (1,565 | 67.7%), self-employed (not incorporated) (189 | 8.2%), and self-employed (incorporated) (177 | 7.6%) make up the most common classes of employment.
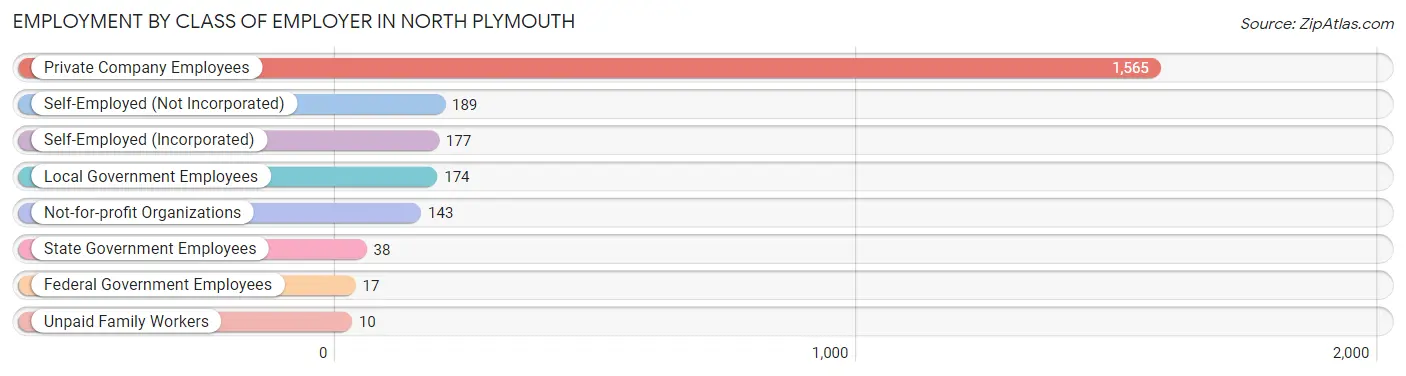
| Employer Class | # Employees | % Employees |
| Private Company Employees | 1,565 | 67.7% |
| Self-Employed (Incorporated) | 177 | 7.6% |
| Self-Employed (Not Incorporated) | 189 | 8.2% |
| Not-for-profit Organizations | 143 | 6.2% |
| Local Government Employees | 174 | 7.5% |
| State Government Employees | 38 | 1.6% |
| Federal Government Employees | 17 | 0.7% |
| Unpaid Family Workers | 10 | 0.4% |
| Total | 2,313 | 100.0% |
Employment Status by Age in North Plymouth
According to the labor force statistics for North Plymouth, out of the total population over 16 years of age (3,828), 74.2% or 2,840 individuals are in the labor force, with 18.1% or 514 of them unemployed. The age group with the highest labor force participation rate is 25 to 29 years, with 97.4% or 589 individuals in the labor force. Within the labor force, the 20 to 24 years age range has the highest percentage of unemployed individuals, with 52.5% or 85 of them being unemployed.
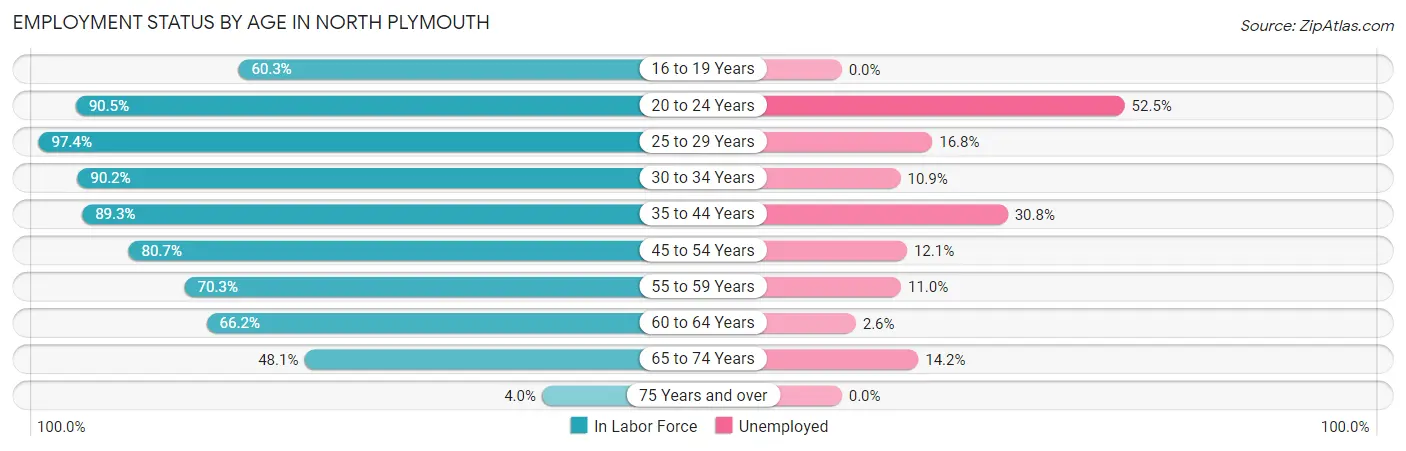
| Age Bracket | In Labor Force | Unemployed |
| 16 to 19 Years | 111 (60.3%) | 0 (0.0%) |
| 20 to 24 Years | 162 (90.5%) | 85 (52.5%) |
| 25 to 29 Years | 589 (97.4%) | 99 (16.8%) |
| 30 to 34 Years | 340 (90.2%) | 37 (10.9%) |
| 35 to 44 Years | 610 (89.3%) | 188 (30.8%) |
| 45 to 54 Years | 380 (80.7%) | 46 (12.1%) |
| 55 to 59 Years | 237 (70.3%) | 26 (11.0%) |
| 60 to 64 Years | 196 (66.2%) | 5 (2.6%) |
| 65 to 74 Years | 204 (48.1%) | 29 (14.2%) |
| 75 Years and over | 11 (4.0%) | 0 (0.0%) |
| Total | 2,840 (74.2%) | 514 (18.1%) |
Employment Status by Educational Attainment in North Plymouth
According to labor force statistics for North Plymouth, 84.9% of individuals (2,351) out of the total population between 25 and 64 years of age (2,769) are in the labor force, with 17.0% or 400 of them being unemployed. The group with the highest labor force participation rate are those with the educational attainment of bachelor's degree or higher, with 92.2% or 754 individuals in the labor force. Within the labor force, individuals with less than high school education have the highest percentage of unemployment, with 40.0% or 34 of them being unemployed.
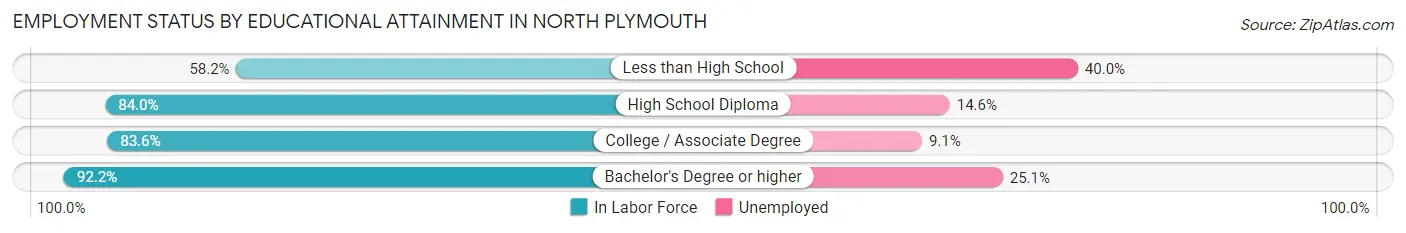
| Educational Attainment | In Labor Force | Unemployed |
| Less than High School | 85 (58.2%) | 58 (40.0%) |
| High School Diploma | 731 (84.0%) | 127 (14.6%) |
| College / Associate Degree | 782 (83.6%) | 85 (9.1%) |
| Bachelor's Degree or higher | 754 (92.2%) | 205 (25.1%) |
| Total | 2,351 (84.9%) | 471 (17.0%) |
Employment Occupations by Sex in North Plymouth
Management, Business, Science and Arts Occupations
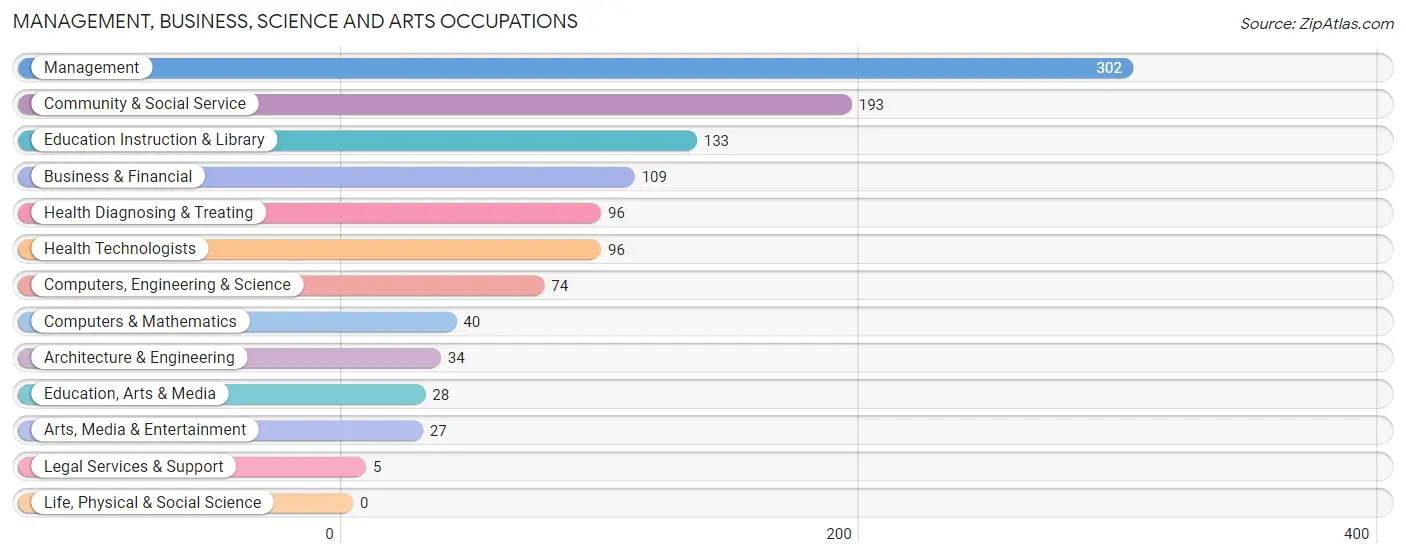
The most common Management, Business, Science and Arts occupations in North Plymouth are Management (302 | 13.0%), Community & Social Service (193 | 8.3%), Education Instruction & Library (133 | 5.7%), Business & Financial (109 | 4.7%), and Health Diagnosing & Treating (96 | 4.1%).
Management, Business, Science and Arts Occupations by Sex
Within the Management, Business, Science and Arts occupations in North Plymouth, the most male-oriented occupations are Computers & Mathematics (100.0%), Legal Services & Support (100.0%), and Arts, Media & Entertainment (100.0%), while the most female-oriented occupations are Education, Arts & Media (100.0%), Education Instruction & Library (94.7%), and Community & Social Service (79.8%).
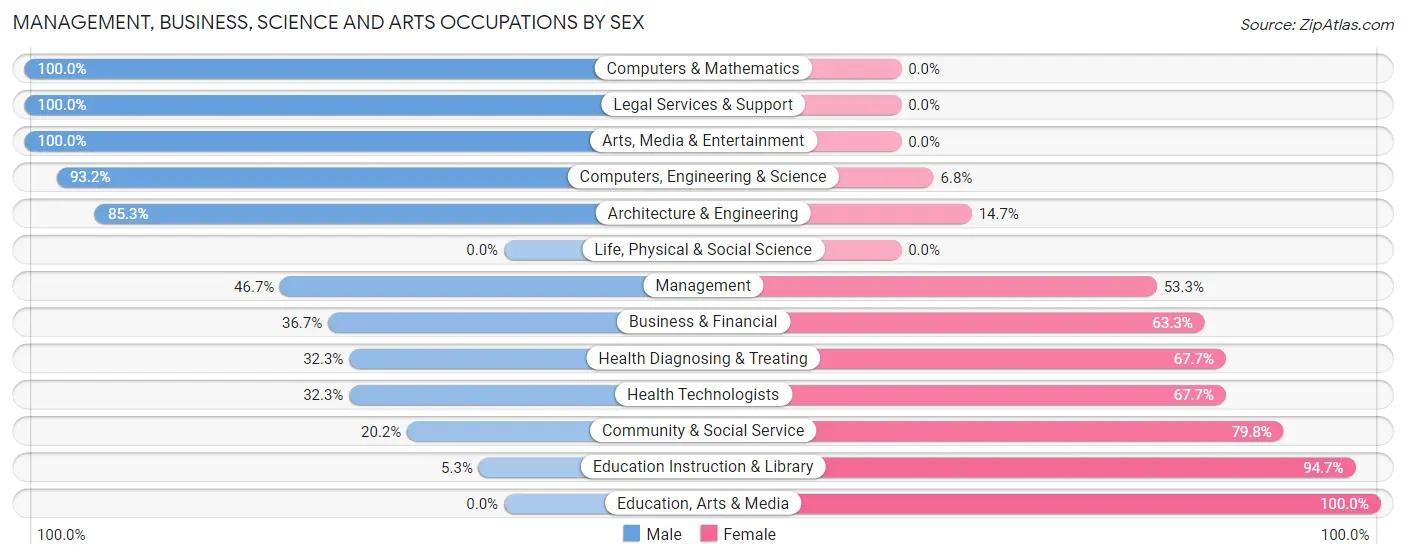
| Occupation | Male | Female |
| Management | 141 (46.7%) | 161 (53.3%) |
| Business & Financial | 40 (36.7%) | 69 (63.3%) |
| Computers, Engineering & Science | 69 (93.2%) | 5 (6.8%) |
| Computers & Mathematics | 40 (100.0%) | 0 (0.0%) |
| Architecture & Engineering | 29 (85.3%) | 5 (14.7%) |
| Life, Physical & Social Science | 0 (0.0%) | 0 (0.0%) |
| Community & Social Service | 39 (20.2%) | 154 (79.8%) |
| Education, Arts & Media | 0 (0.0%) | 28 (100.0%) |
| Legal Services & Support | 5 (100.0%) | 0 (0.0%) |
| Education Instruction & Library | 7 (5.3%) | 126 (94.7%) |
| Arts, Media & Entertainment | 27 (100.0%) | 0 (0.0%) |
| Health Diagnosing & Treating | 31 (32.3%) | 65 (67.7%) |
| Health Technologists | 31 (32.3%) | 65 (67.7%) |
| Total (Category) | 320 (41.3%) | 454 (58.7%) |
| Total (Overall) | 1,260 (54.2%) | 1,065 (45.8%) |
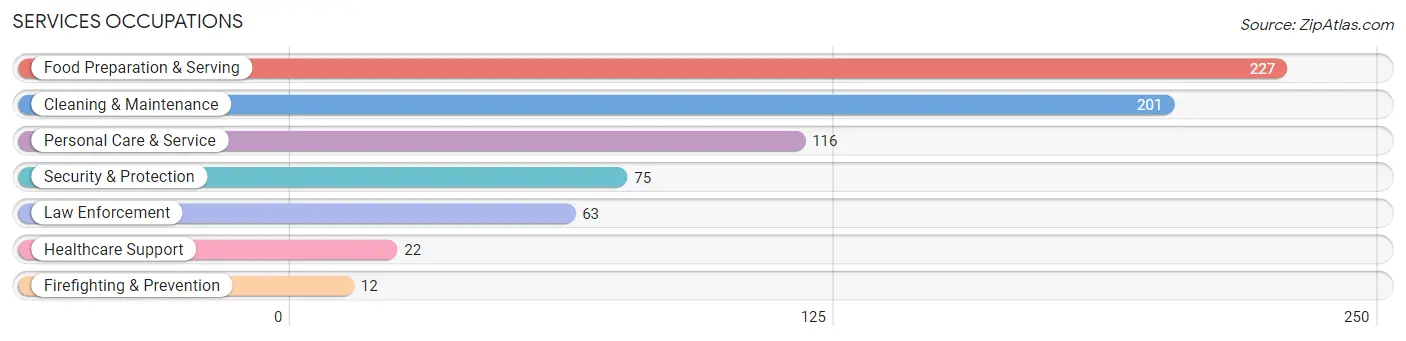
Services Occupations
The most common Services occupations in North Plymouth are Food Preparation & Serving (227 | 9.8%), Cleaning & Maintenance (201 | 8.6%), Personal Care & Service (116 | 5.0%), Security & Protection (75 | 3.2%), and Law Enforcement (63 | 2.7%).
Services Occupations by Sex
Within the Services occupations in North Plymouth, the most male-oriented occupations are Firefighting & Prevention (100.0%), Cleaning & Maintenance (73.1%), and Personal Care & Service (56.9%), while the most female-oriented occupations are Healthcare Support (100.0%), Food Preparation & Serving (66.5%), and Law Enforcement (54.0%).
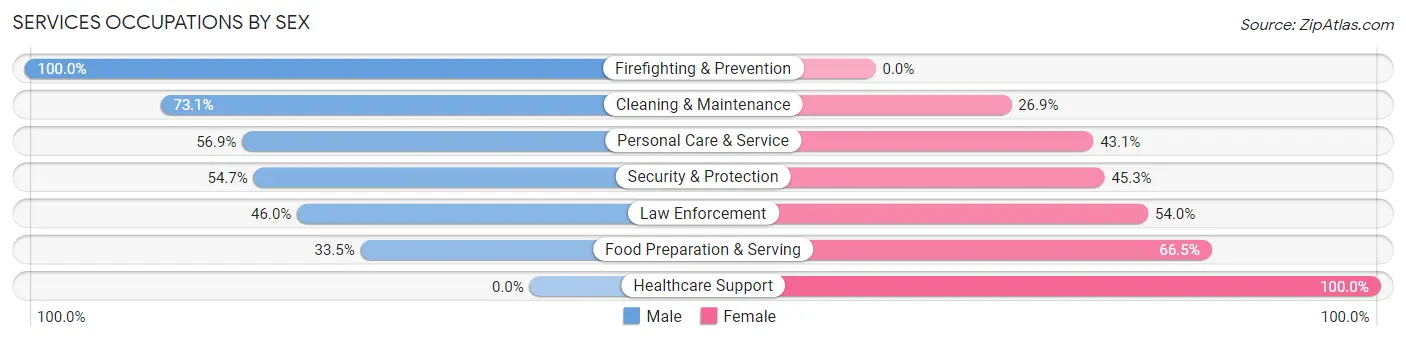
| Occupation | Male | Female |
| Healthcare Support | 0 (0.0%) | 22 (100.0%) |
| Security & Protection | 41 (54.7%) | 34 (45.3%) |
| Firefighting & Prevention | 12 (100.0%) | 0 (0.0%) |
| Law Enforcement | 29 (46.0%) | 34 (54.0%) |
| Food Preparation & Serving | 76 (33.5%) | 151 (66.5%) |
| Cleaning & Maintenance | 147 (73.1%) | 54 (26.9%) |
| Personal Care & Service | 66 (56.9%) | 50 (43.1%) |
| Total (Category) | 330 (51.5%) | 311 (48.5%) |
| Total (Overall) | 1,260 (54.2%) | 1,065 (45.8%) |
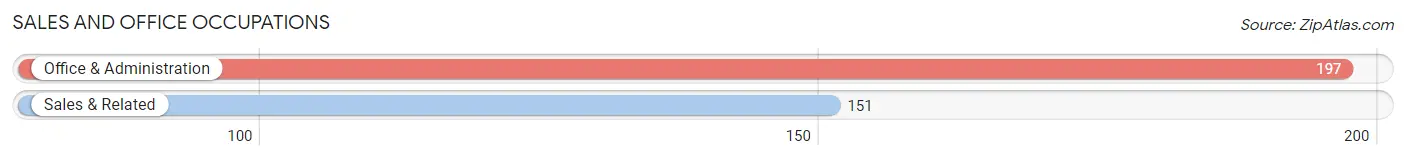
Sales and Office Occupations
The most common Sales and Office occupations in North Plymouth are Office & Administration (197 | 8.5%), and Sales & Related (151 | 6.5%).
Sales and Office Occupations by Sex
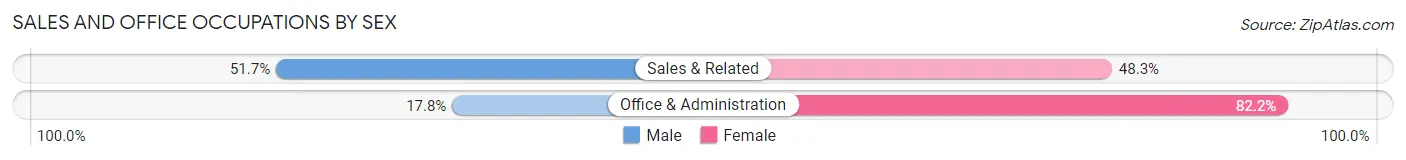
| Occupation | Male | Female |
| Sales & Related | 78 (51.7%) | 73 (48.3%) |
| Office & Administration | 35 (17.8%) | 162 (82.2%) |
| Total (Category) | 113 (32.5%) | 235 (67.5%) |
| Total (Overall) | 1,260 (54.2%) | 1,065 (45.8%) |
Natural Resources, Construction and Maintenance Occupations
The most common Natural Resources, Construction and Maintenance occupations in North Plymouth are Construction & Extraction (165 | 7.1%), and Installation, Maintenance & Repair (155 | 6.7%).
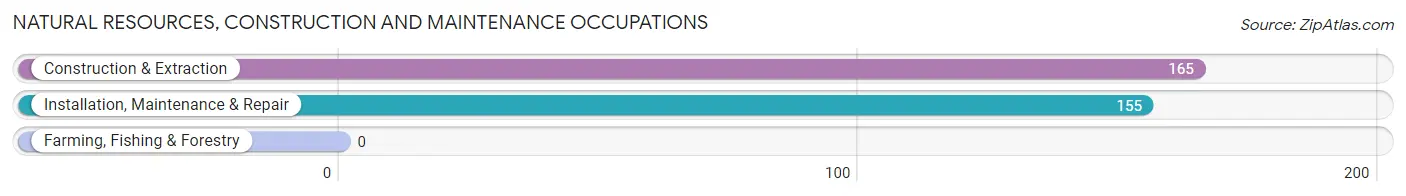
Natural Resources, Construction and Maintenance Occupations by Sex
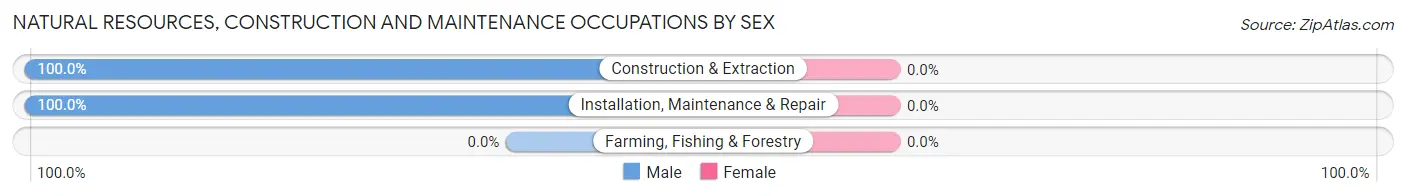
| Occupation | Male | Female |
| Farming, Fishing & Forestry | 0 (0.0%) | 0 (0.0%) |
| Construction & Extraction | 165 (100.0%) | 0 (0.0%) |
| Installation, Maintenance & Repair | 155 (100.0%) | 0 (0.0%) |
| Total (Category) | 320 (100.0%) | 0 (0.0%) |
| Total (Overall) | 1,260 (54.2%) | 1,065 (45.8%) |
Production, Transportation and Moving Occupations
The most common Production, Transportation and Moving occupations in North Plymouth are Material Moving (86 | 3.7%), Transportation (81 | 3.5%), and Production (75 | 3.2%).
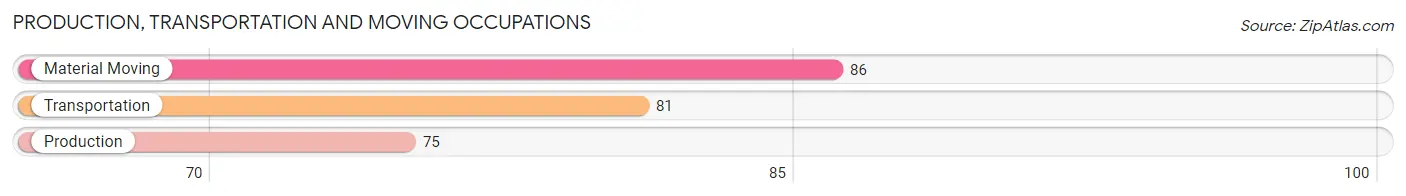
Production, Transportation and Moving Occupations by Sex
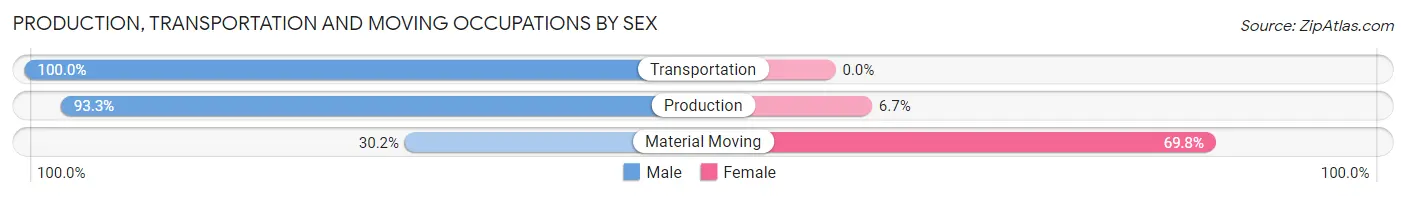
| Occupation | Male | Female |
| Production | 70 (93.3%) | 5 (6.7%) |
| Transportation | 81 (100.0%) | 0 (0.0%) |
| Material Moving | 26 (30.2%) | 60 (69.8%) |
| Total (Category) | 177 (73.1%) | 65 (26.9%) |
| Total (Overall) | 1,260 (54.2%) | 1,065 (45.8%) |
Employment Industries by Sex in North Plymouth
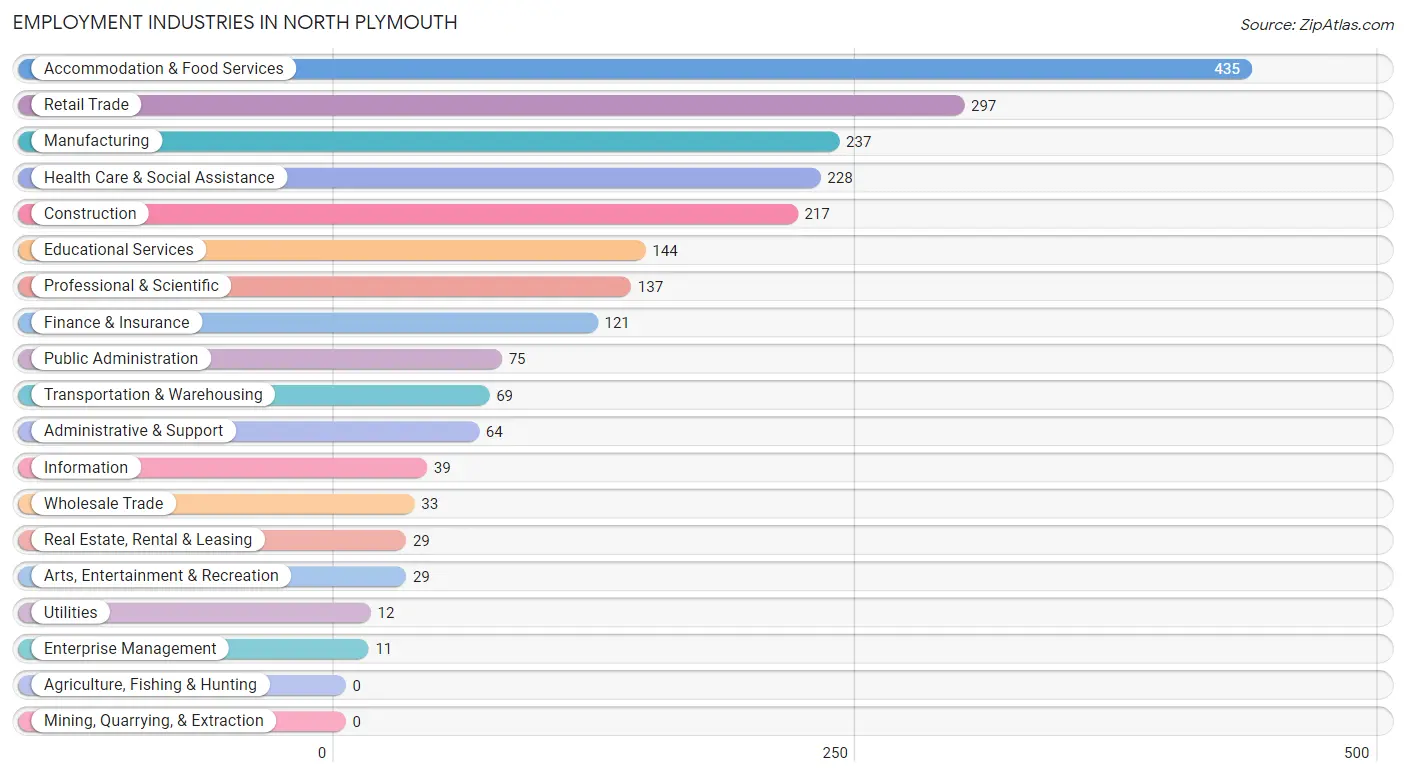
Employment Industries in North Plymouth
The major employment industries in North Plymouth include Accommodation & Food Services (435 | 18.7%), Retail Trade (297 | 12.8%), Manufacturing (237 | 10.2%), Health Care & Social Assistance (228 | 9.8%), and Construction (217 | 9.3%).
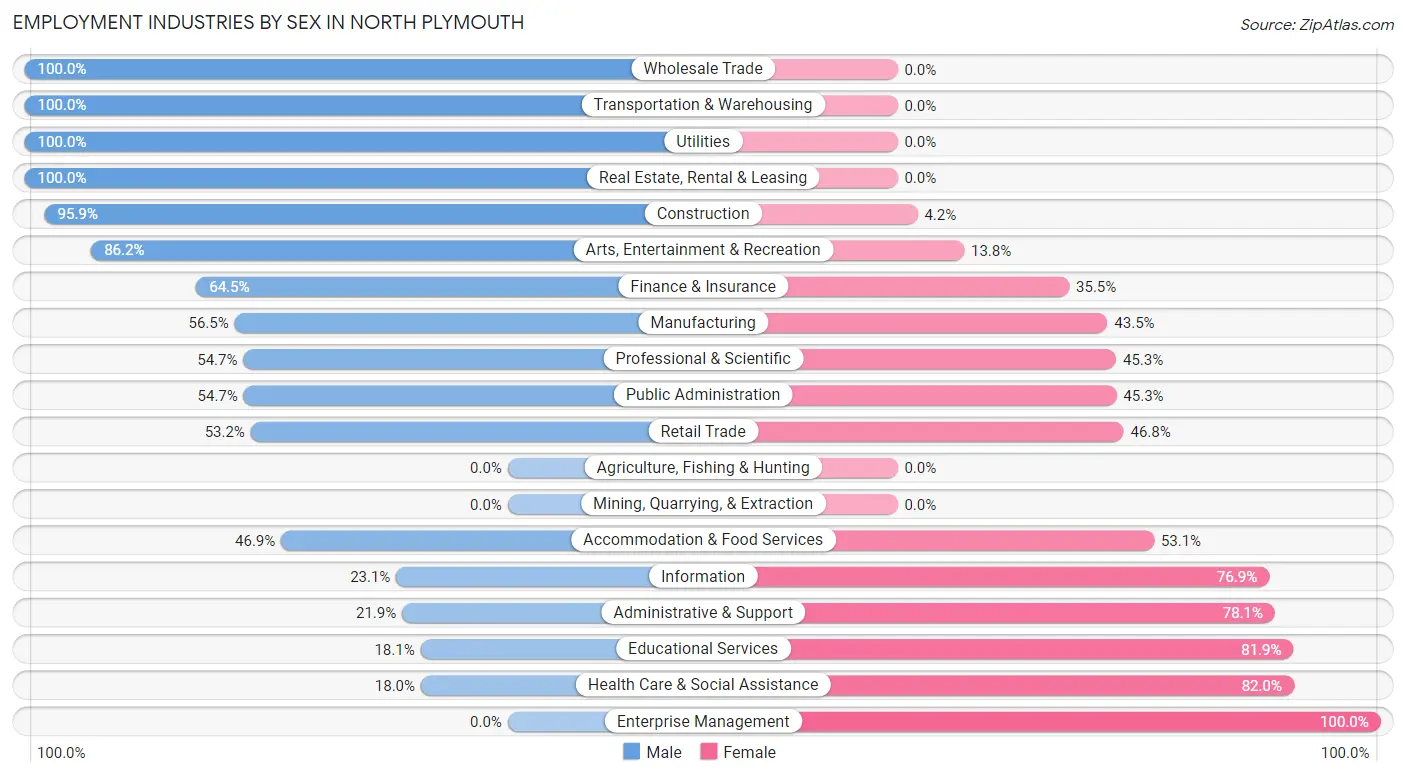
Employment Industries by Sex in North Plymouth
The North Plymouth industries that see more men than women are Wholesale Trade (100.0%), Transportation & Warehousing (100.0%), and Utilities (100.0%), whereas the industries that tend to have a higher number of women are Enterprise Management (100.0%), Health Care & Social Assistance (82.0%), and Educational Services (81.9%).
| Industry | Male | Female |
| Agriculture, Fishing & Hunting | 0 (0.0%) | 0 (0.0%) |
| Mining, Quarrying, & Extraction | 0 (0.0%) | 0 (0.0%) |
| Construction | 208 (95.9%) | 9 (4.2%) |
| Manufacturing | 134 (56.5%) | 103 (43.5%) |
| Wholesale Trade | 33 (100.0%) | 0 (0.0%) |
| Retail Trade | 158 (53.2%) | 139 (46.8%) |
| Transportation & Warehousing | 69 (100.0%) | 0 (0.0%) |
| Utilities | 12 (100.0%) | 0 (0.0%) |
| Information | 9 (23.1%) | 30 (76.9%) |
| Finance & Insurance | 78 (64.5%) | 43 (35.5%) |
| Real Estate, Rental & Leasing | 29 (100.0%) | 0 (0.0%) |
| Professional & Scientific | 75 (54.7%) | 62 (45.3%) |
| Enterprise Management | 0 (0.0%) | 11 (100.0%) |
| Administrative & Support | 14 (21.9%) | 50 (78.1%) |
| Educational Services | 26 (18.1%) | 118 (81.9%) |
| Health Care & Social Assistance | 41 (18.0%) | 187 (82.0%) |
| Arts, Entertainment & Recreation | 25 (86.2%) | 4 (13.8%) |
| Accommodation & Food Services | 204 (46.9%) | 231 (53.1%) |
| Public Administration | 41 (54.7%) | 34 (45.3%) |
| Total | 1,260 (54.2%) | 1,065 (45.8%) |
Education in North Plymouth
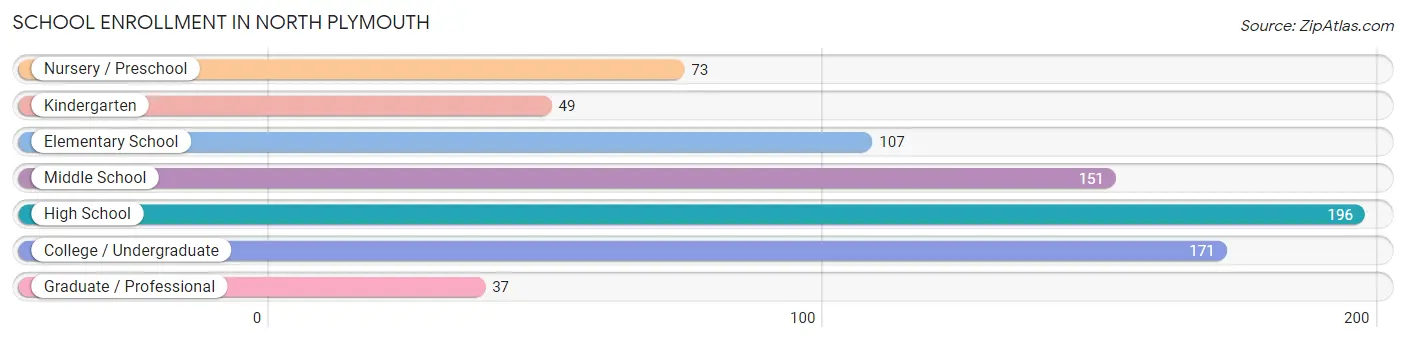
School Enrollment in North Plymouth
The most common levels of schooling among the 784 students in North Plymouth are high school (196 | 25.0%), college / undergraduate (171 | 21.8%), and middle school (151 | 19.3%).
| School Level | # Students | % Students |
| Nursery / Preschool | 73 | 9.3% |
| Kindergarten | 49 | 6.2% |
| Elementary School | 107 | 13.7% |
| Middle School | 151 | 19.3% |
| High School | 196 | 25.0% |
| College / Undergraduate | 171 | 21.8% |
| Graduate / Professional | 37 | 4.7% |
| Total | 784 | 100.0% |
School Enrollment by Age by Funding Source in North Plymouth
Out of a total of 784 students who are enrolled in schools in North Plymouth, 122 (15.6%) attend a private institution, while the remaining 662 (84.4%) are enrolled in public schools. The age group of 20 to 24 year olds has the highest likelihood of being enrolled in private schools, with 46 (79.3% in the age bracket) enrolled. Conversely, the age group of 5 to 9 year old has the lowest likelihood of being enrolled in a private school, with 140 (100.0% in the age bracket) attending a public institution.
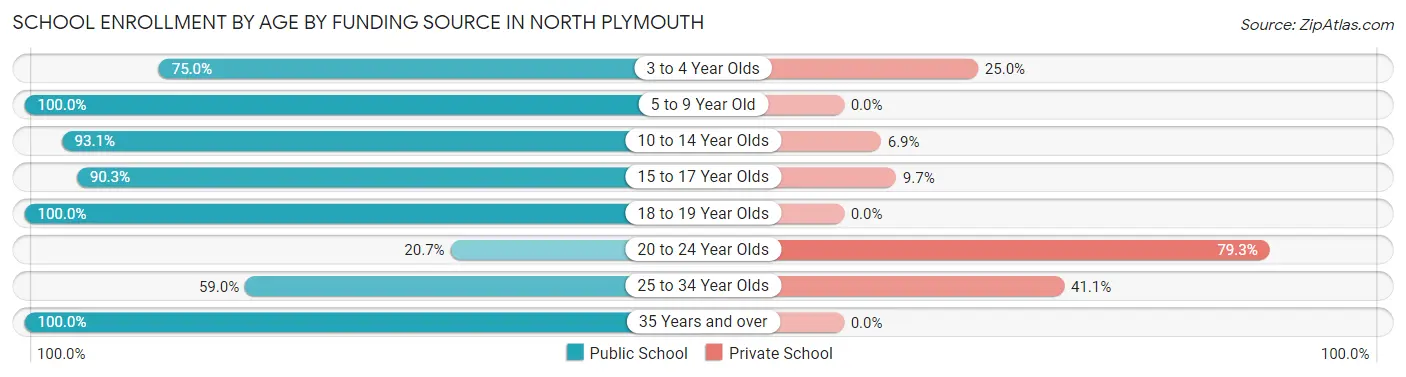
| Age Bracket | Public School | Private School |
| 3 to 4 Year Olds | 39 (75.0%) | 13 (25.0%) |
| 5 to 9 Year Old | 140 (100.0%) | 0 (0.0%) |
| 10 to 14 Year Olds | 175 (93.1%) | 13 (6.9%) |
| 15 to 17 Year Olds | 102 (90.3%) | 11 (9.7%) |
| 18 to 19 Year Olds | 100 (100.0%) | 0 (0.0%) |
| 20 to 24 Year Olds | 12 (20.7%) | 46 (79.3%) |
| 25 to 34 Year Olds | 56 (59.0%) | 39 (41.0%) |
| 35 Years and over | 38 (100.0%) | 0 (0.0%) |
| Total | 662 (84.4%) | 122 (15.6%) |
Educational Attainment by Field of Study in North Plymouth
Science & technology (286 | 23.5%), business (275 | 22.6%), bio, nature & agricultural (159 | 13.1%), education (83 | 6.8%), and social sciences (81 | 6.7%) are the most common fields of study among 1,216 individuals in North Plymouth who have obtained a bachelor's degree or higher.
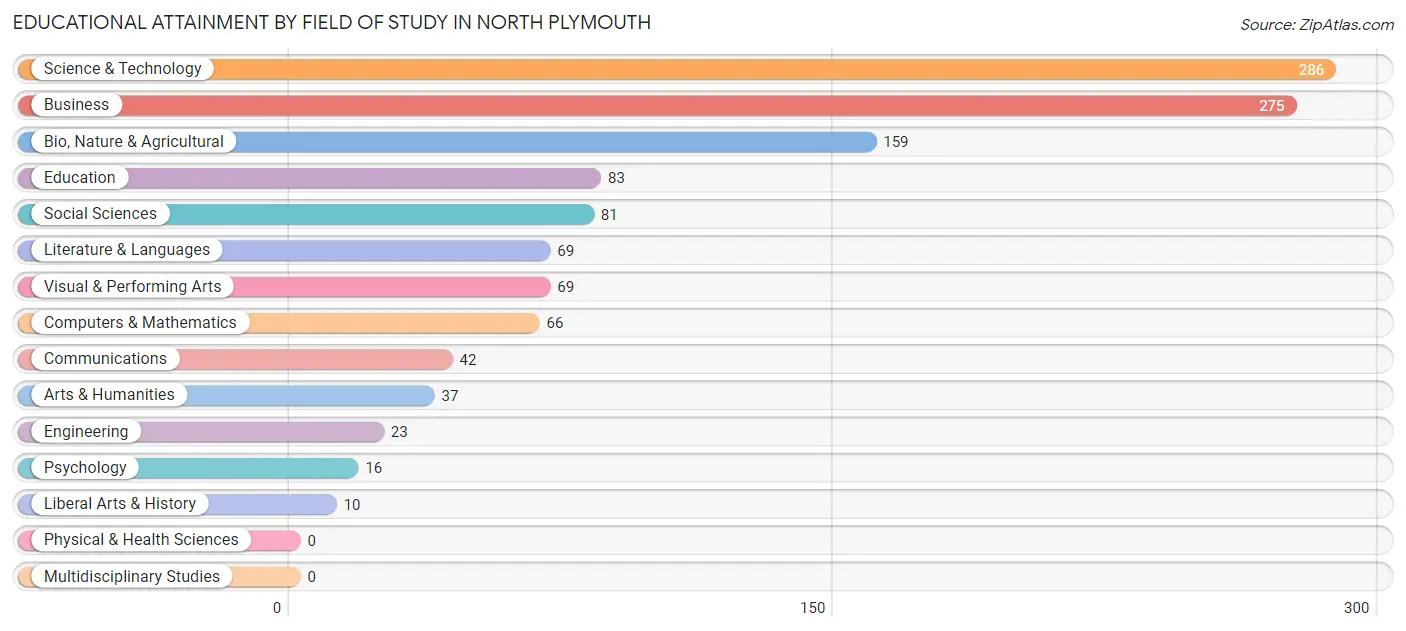
| Field of Study | # Graduates | % Graduates |
| Computers & Mathematics | 66 | 5.4% |
| Bio, Nature & Agricultural | 159 | 13.1% |
| Physical & Health Sciences | 0 | 0.0% |
| Psychology | 16 | 1.3% |
| Social Sciences | 81 | 6.7% |
| Engineering | 23 | 1.9% |
| Multidisciplinary Studies | 0 | 0.0% |
| Science & Technology | 286 | 23.5% |
| Business | 275 | 22.6% |
| Education | 83 | 6.8% |
| Literature & Languages | 69 | 5.7% |
| Liberal Arts & History | 10 | 0.8% |
| Visual & Performing Arts | 69 | 5.7% |
| Communications | 42 | 3.5% |
| Arts & Humanities | 37 | 3.0% |
| Total | 1,216 | 100.0% |
Transportation & Commute in North Plymouth
Vehicle Availability by Sex in North Plymouth
The most prevalent vehicle ownership categories in North Plymouth are males with 2 vehicles (647, accounting for 53.1%) and females with 2 vehicles (598, making up 60.8%).
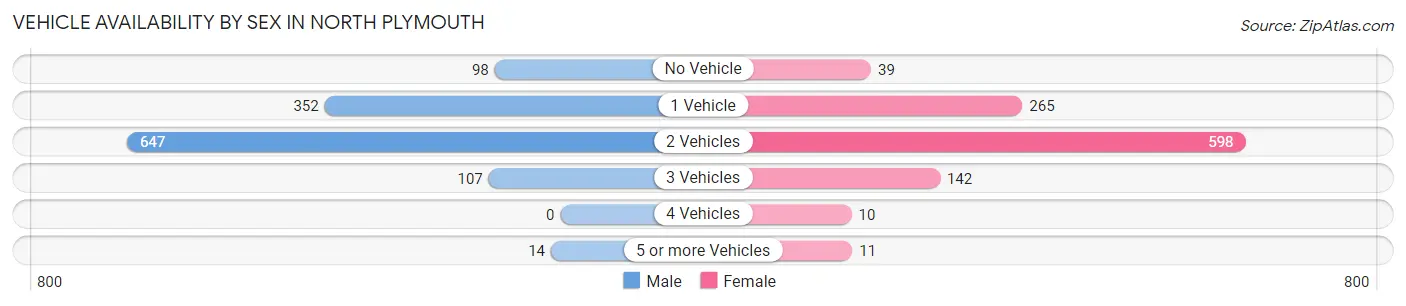
| Vehicles Available | Male | Female |
| No Vehicle | 98 (8.1%) | 39 (3.7%) |
| 1 Vehicle | 352 (28.9%) | 265 (24.9%) |
| 2 Vehicles | 647 (53.1%) | 598 (56.1%) |
| 3 Vehicles | 107 (8.8%) | 142 (13.3%) |
| 4 Vehicles | 0 (0.0%) | 10 (0.9%) |
| 5 or more Vehicles | 14 (1.1%) | 11 (1.0%) |
| Total | 1,218 (100.0%) | 1,065 (100.0%) |
Commute Time in North Plymouth
The most frequently occuring commute durations in North Plymouth are 5 to 9 minutes (438 commuters, 21.5%), 15 to 19 minutes (372 commuters, 18.3%), and 10 to 14 minutes (251 commuters, 12.3%).
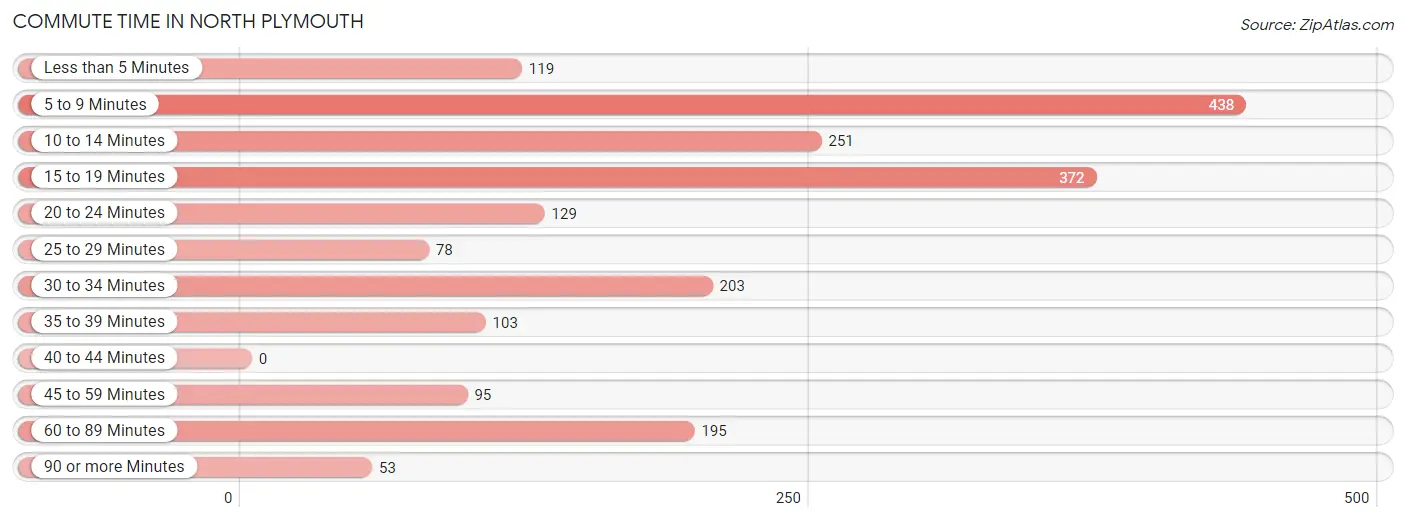
| Commute Time | # Commuters | % Commuters |
| Less than 5 Minutes | 119 | 5.8% |
| 5 to 9 Minutes | 438 | 21.5% |
| 10 to 14 Minutes | 251 | 12.3% |
| 15 to 19 Minutes | 372 | 18.3% |
| 20 to 24 Minutes | 129 | 6.3% |
| 25 to 29 Minutes | 78 | 3.8% |
| 30 to 34 Minutes | 203 | 10.0% |
| 35 to 39 Minutes | 103 | 5.1% |
| 40 to 44 Minutes | 0 | 0.0% |
| 45 to 59 Minutes | 95 | 4.7% |
| 60 to 89 Minutes | 195 | 9.6% |
| 90 or more Minutes | 53 | 2.6% |
Commute Time by Sex in North Plymouth
The most common commute times in North Plymouth are 5 to 9 minutes (223 commuters, 20.3%) for males and 5 to 9 minutes (215 commuters, 23.0%) for females.
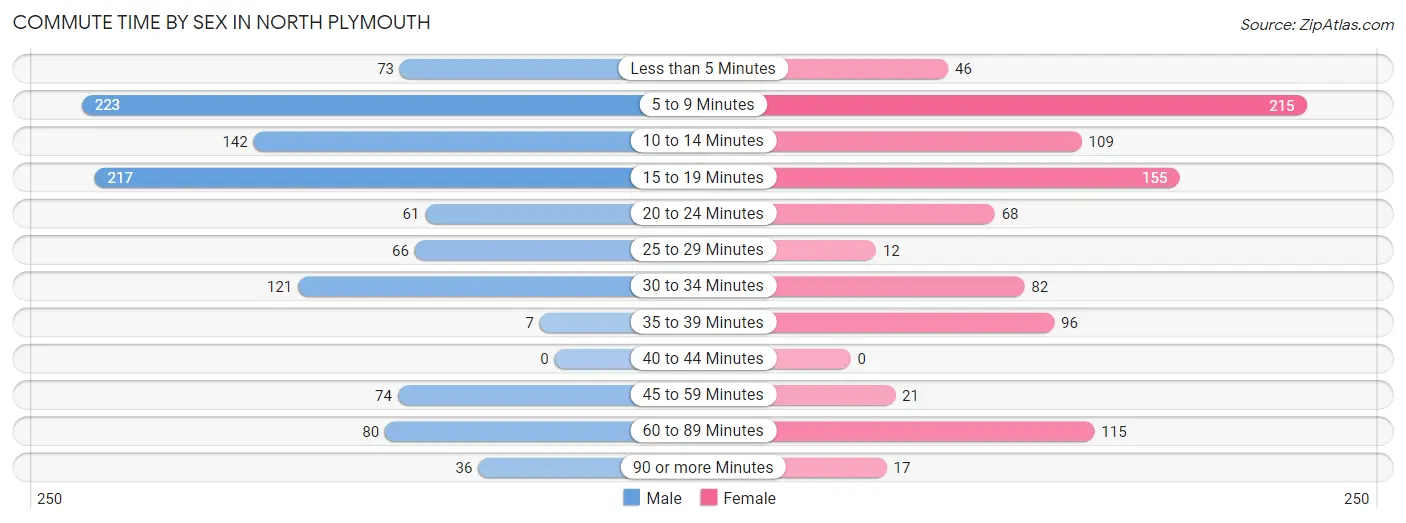
| Commute Time | Male | Female |
| Less than 5 Minutes | 73 (6.6%) | 46 (4.9%) |
| 5 to 9 Minutes | 223 (20.3%) | 215 (23.0%) |
| 10 to 14 Minutes | 142 (12.9%) | 109 (11.7%) |
| 15 to 19 Minutes | 217 (19.7%) | 155 (16.6%) |
| 20 to 24 Minutes | 61 (5.6%) | 68 (7.3%) |
| 25 to 29 Minutes | 66 (6.0%) | 12 (1.3%) |
| 30 to 34 Minutes | 121 (11.0%) | 82 (8.8%) |
| 35 to 39 Minutes | 7 (0.6%) | 96 (10.3%) |
| 40 to 44 Minutes | 0 (0.0%) | 0 (0.0%) |
| 45 to 59 Minutes | 74 (6.7%) | 21 (2.2%) |
| 60 to 89 Minutes | 80 (7.3%) | 115 (12.3%) |
| 90 or more Minutes | 36 (3.3%) | 17 (1.8%) |
Time of Departure to Work by Sex in North Plymouth
The most frequent times of departure to work in North Plymouth are 7:00 AM to 7:29 AM (146, 13.3%) for males and 9:00 AM to 9:59 AM (203, 21.7%) for females.
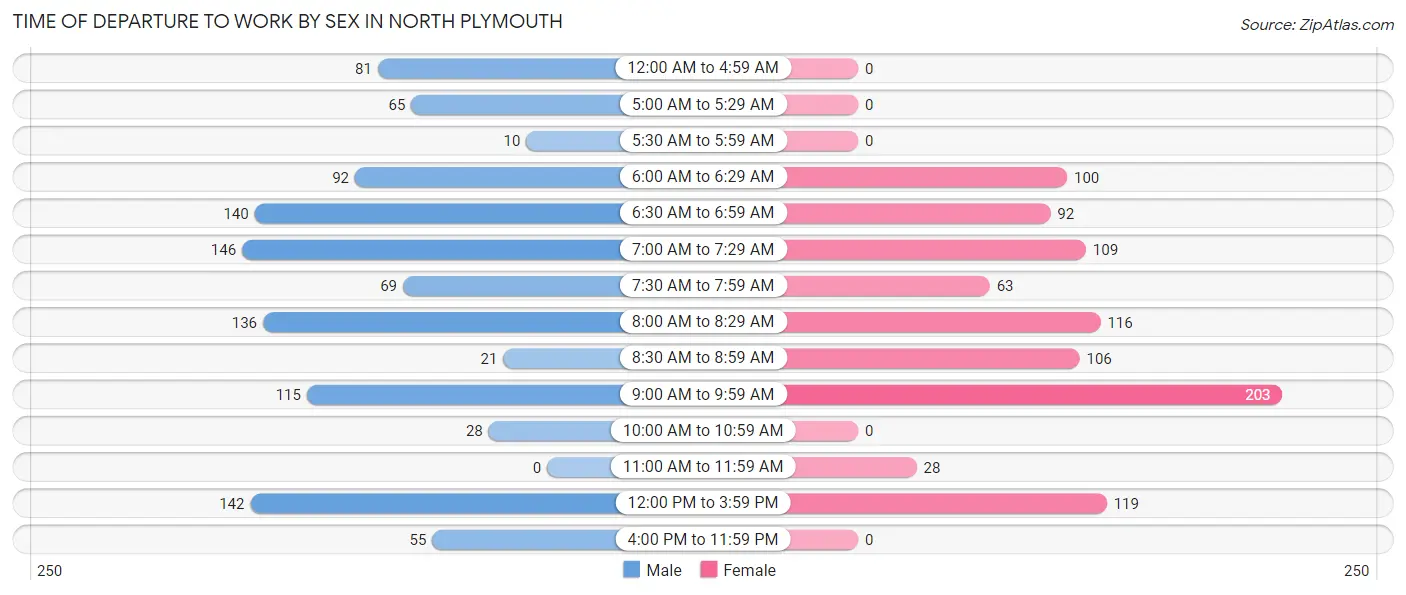
| Time of Departure | Male | Female |
| 12:00 AM to 4:59 AM | 81 (7.4%) | 0 (0.0%) |
| 5:00 AM to 5:29 AM | 65 (5.9%) | 0 (0.0%) |
| 5:30 AM to 5:59 AM | 10 (0.9%) | 0 (0.0%) |
| 6:00 AM to 6:29 AM | 92 (8.4%) | 100 (10.7%) |
| 6:30 AM to 6:59 AM | 140 (12.7%) | 92 (9.8%) |
| 7:00 AM to 7:29 AM | 146 (13.3%) | 109 (11.7%) |
| 7:30 AM to 7:59 AM | 69 (6.3%) | 63 (6.7%) |
| 8:00 AM to 8:29 AM | 136 (12.4%) | 116 (12.4%) |
| 8:30 AM to 8:59 AM | 21 (1.9%) | 106 (11.3%) |
| 9:00 AM to 9:59 AM | 115 (10.4%) | 203 (21.7%) |
| 10:00 AM to 10:59 AM | 28 (2.5%) | 0 (0.0%) |
| 11:00 AM to 11:59 AM | 0 (0.0%) | 28 (3.0%) |
| 12:00 PM to 3:59 PM | 142 (12.9%) | 119 (12.7%) |
| 4:00 PM to 11:59 PM | 55 (5.0%) | 0 (0.0%) |
| Total | 1,100 (100.0%) | 936 (100.0%) |
Housing Occupancy in North Plymouth
Occupancy by Ownership in North Plymouth
Of the total 2,000 dwellings in North Plymouth, owner-occupied units account for 874 (43.7%), while renter-occupied units make up 1,126 (56.3%).
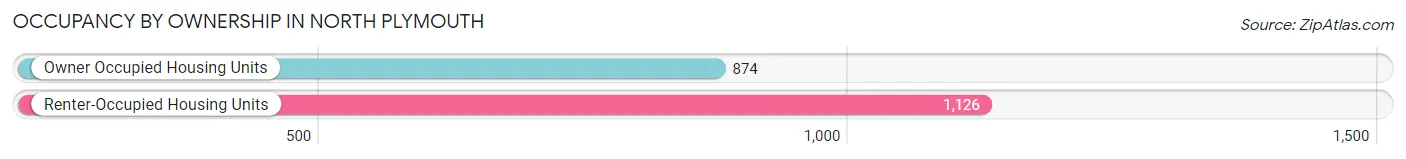
| Occupancy | # Housing Units | % Housing Units |
| Owner Occupied Housing Units | 874 | 43.7% |
| Renter-Occupied Housing Units | 1,126 | 56.3% |
| Total Occupied Housing Units | 2,000 | 100.0% |
Occupancy by Household Size in North Plymouth
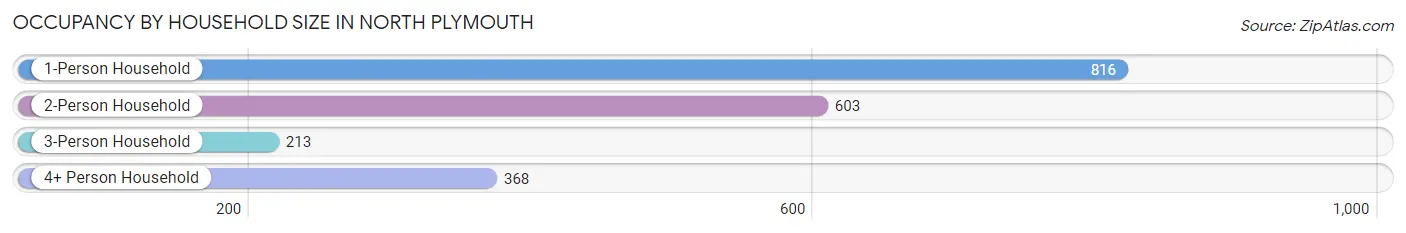
| Household Size | # Housing Units | % Housing Units |
| 1-Person Household | 816 | 40.8% |
| 2-Person Household | 603 | 30.1% |
| 3-Person Household | 213 | 10.6% |
| 4+ Person Household | 368 | 18.4% |
| Total Housing Units | 2,000 | 100.0% |
Occupancy by Ownership by Household Size in North Plymouth
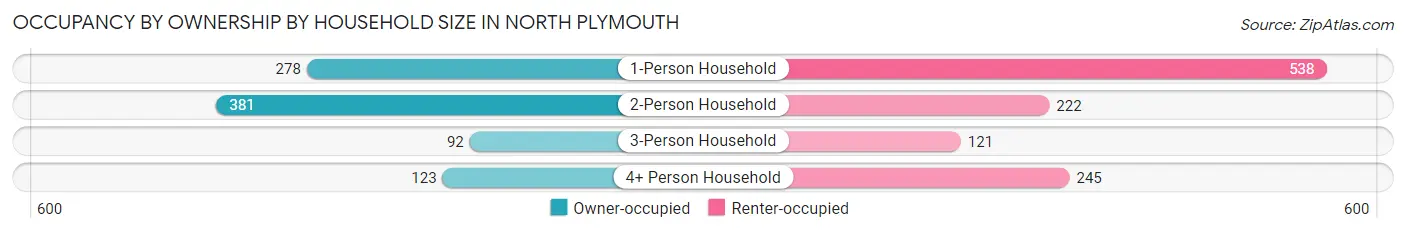
| Household Size | Owner-occupied | Renter-occupied |
| 1-Person Household | 278 (34.1%) | 538 (65.9%) |
| 2-Person Household | 381 (63.2%) | 222 (36.8%) |
| 3-Person Household | 92 (43.2%) | 121 (56.8%) |
| 4+ Person Household | 123 (33.4%) | 245 (66.6%) |
| Total Housing Units | 874 (43.7%) | 1,126 (56.3%) |
Occupancy by Educational Attainment in North Plymouth
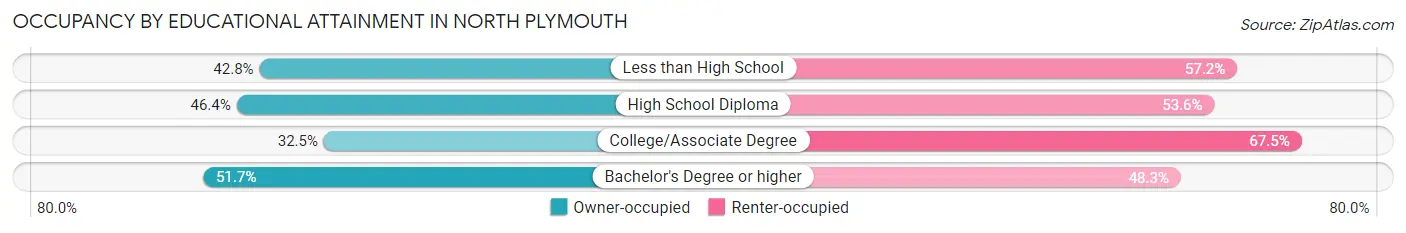
| Household Size | Owner-occupied | Renter-occupied |
| Less than High School | 65 (42.8%) | 87 (57.2%) |
| High School Diploma | 224 (46.4%) | 259 (53.6%) |
| College/Associate Degree | 205 (32.5%) | 425 (67.5%) |
| Bachelor's Degree or higher | 380 (51.7%) | 355 (48.3%) |
Occupancy by Age of Householder in North Plymouth
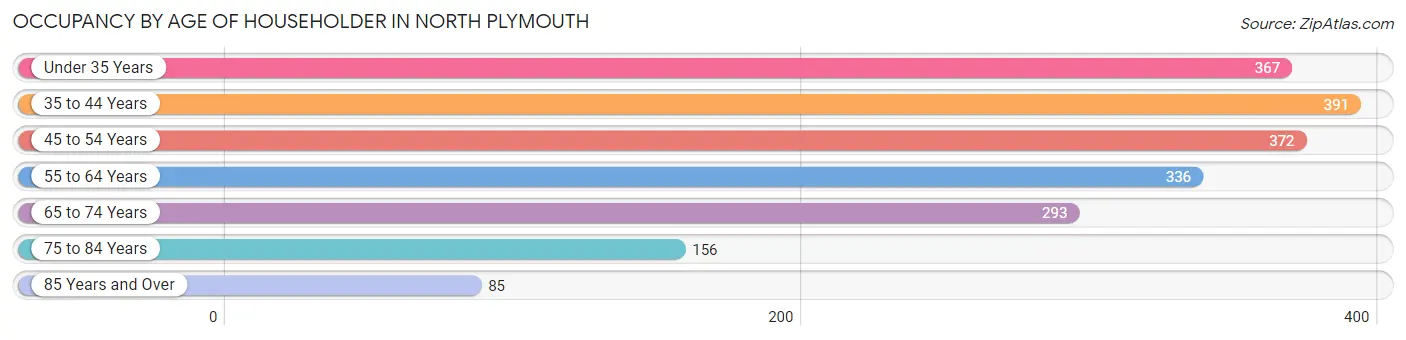
| Age Bracket | # Households | % Households |
| Under 35 Years | 367 | 18.3% |
| 35 to 44 Years | 391 | 19.6% |
| 45 to 54 Years | 372 | 18.6% |
| 55 to 64 Years | 336 | 16.8% |
| 65 to 74 Years | 293 | 14.6% |
| 75 to 84 Years | 156 | 7.8% |
| 85 Years and Over | 85 | 4.3% |
| Total | 2,000 | 100.0% |
Housing Finances in North Plymouth
Median Income by Occupancy in North Plymouth
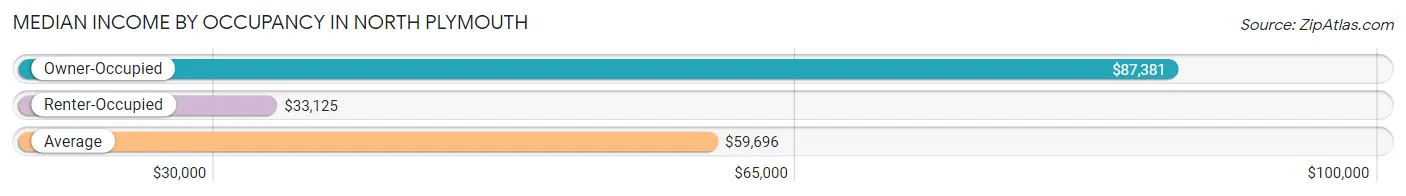
| Occupancy Type | # Households | Median Income |
| Owner-Occupied | 874 (43.7%) | $87,381 |
| Renter-Occupied | 1,126 (56.3%) | $33,125 |
| Average | 2,000 (100.0%) | $59,696 |
Occupancy by Householder Income Bracket in North Plymouth
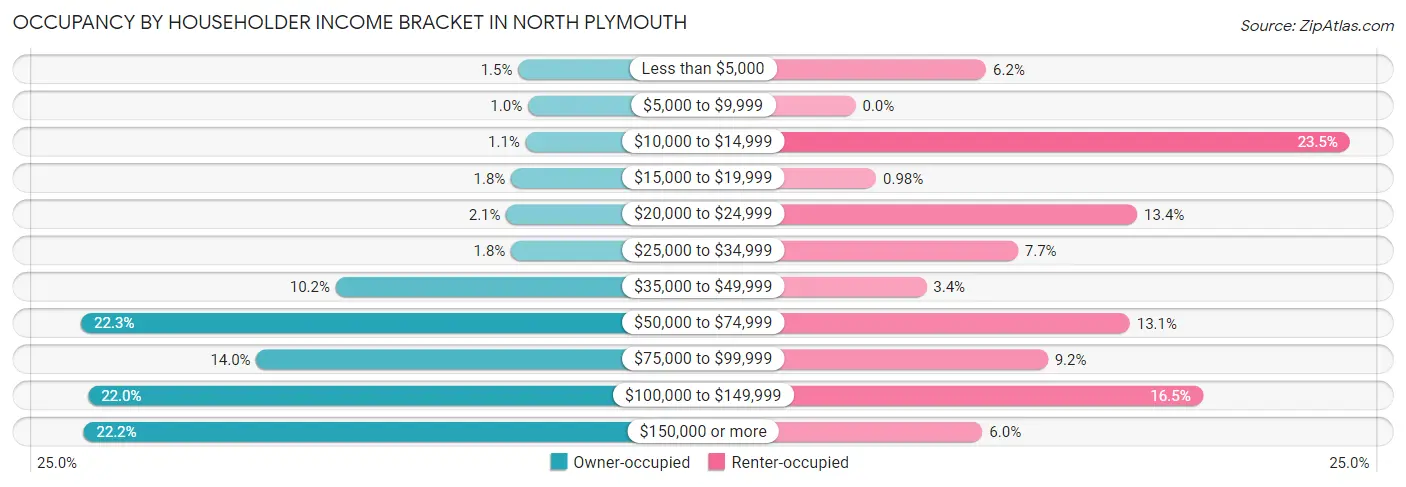
| Income Bracket | Owner-occupied | Renter-occupied |
| Less than $5,000 | 13 (1.5%) | 70 (6.2%) |
| $5,000 to $9,999 | 9 (1.0%) | 0 (0.0%) |
| $10,000 to $14,999 | 10 (1.1%) | 265 (23.5%) |
| $15,000 to $19,999 | 16 (1.8%) | 11 (1.0%) |
| $20,000 to $24,999 | 18 (2.1%) | 151 (13.4%) |
| $25,000 to $34,999 | 16 (1.8%) | 87 (7.7%) |
| $35,000 to $49,999 | 89 (10.2%) | 38 (3.4%) |
| $50,000 to $74,999 | 195 (22.3%) | 147 (13.1%) |
| $75,000 to $99,999 | 122 (14.0%) | 103 (9.1%) |
| $100,000 to $149,999 | 192 (22.0%) | 186 (16.5%) |
| $150,000 or more | 194 (22.2%) | 68 (6.0%) |
| Total | 874 (100.0%) | 1,126 (100.0%) |
Monthly Housing Cost Tiers in North Plymouth
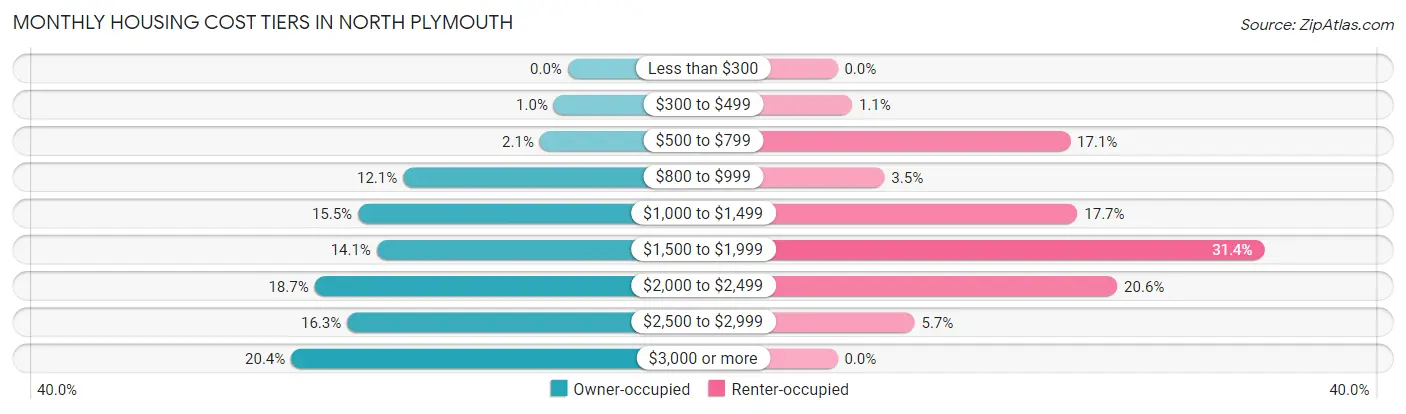
| Monthly Cost | Owner-occupied | Renter-occupied |
| Less than $300 | 0 (0.0%) | 0 (0.0%) |
| $300 to $499 | 9 (1.0%) | 12 (1.1%) |
| $500 to $799 | 18 (2.1%) | 193 (17.1%) |
| $800 to $999 | 106 (12.1%) | 39 (3.5%) |
| $1,000 to $1,499 | 135 (15.4%) | 199 (17.7%) |
| $1,500 to $1,999 | 123 (14.1%) | 354 (31.4%) |
| $2,000 to $2,499 | 163 (18.6%) | 232 (20.6%) |
| $2,500 to $2,999 | 142 (16.3%) | 64 (5.7%) |
| $3,000 or more | 178 (20.4%) | 0 (0.0%) |
| Total | 874 (100.0%) | 1,126 (100.0%) |
Physical Housing Characteristics in North Plymouth
Housing Structures in North Plymouth
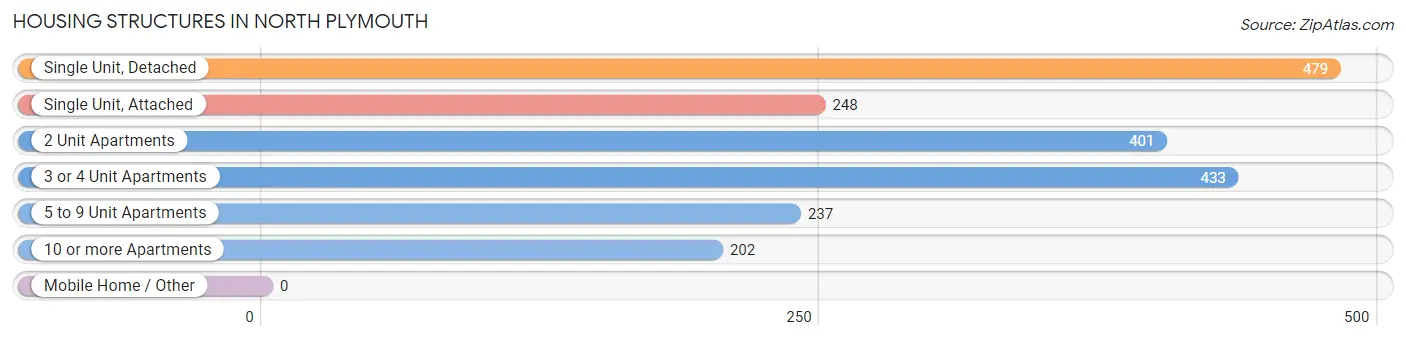
| Structure Type | # Housing Units | % Housing Units |
| Single Unit, Detached | 479 | 23.9% |
| Single Unit, Attached | 248 | 12.4% |
| 2 Unit Apartments | 401 | 20.1% |
| 3 or 4 Unit Apartments | 433 | 21.6% |
| 5 to 9 Unit Apartments | 237 | 11.8% |
| 10 or more Apartments | 202 | 10.1% |
| Mobile Home / Other | 0 | 0.0% |
| Total | 2,000 | 100.0% |
Housing Structures by Occupancy in North Plymouth
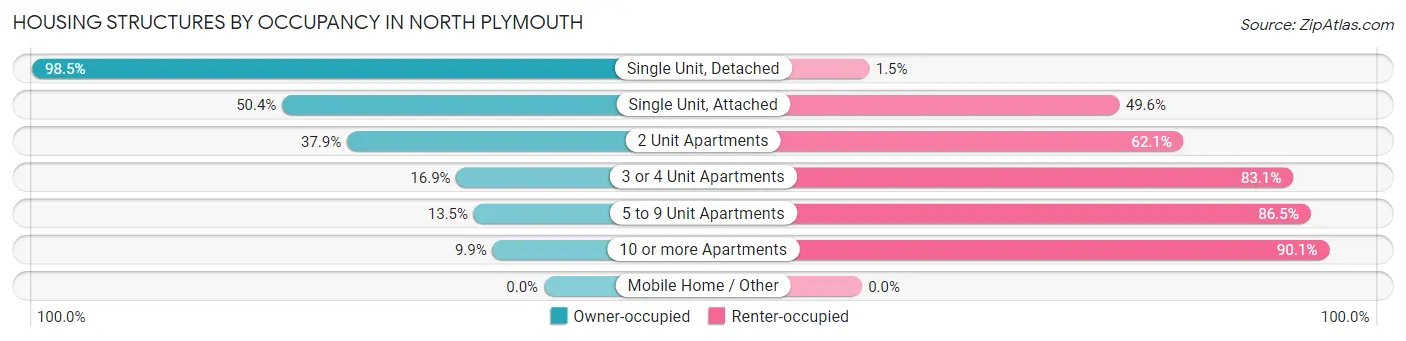
| Structure Type | Owner-occupied | Renter-occupied |
| Single Unit, Detached | 472 (98.5%) | 7 (1.5%) |
| Single Unit, Attached | 125 (50.4%) | 123 (49.6%) |
| 2 Unit Apartments | 152 (37.9%) | 249 (62.1%) |
| 3 or 4 Unit Apartments | 73 (16.9%) | 360 (83.1%) |
| 5 to 9 Unit Apartments | 32 (13.5%) | 205 (86.5%) |
| 10 or more Apartments | 20 (9.9%) | 182 (90.1%) |
| Mobile Home / Other | 0 (0.0%) | 0 (0.0%) |
| Total | 874 (43.7%) | 1,126 (56.3%) |
Housing Structures by Number of Rooms in North Plymouth
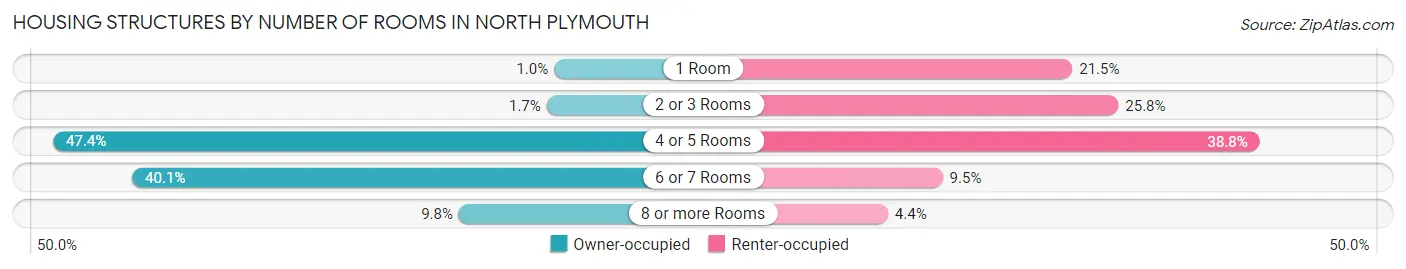
| Number of Rooms | Owner-occupied | Renter-occupied |
| 1 Room | 9 (1.0%) | 242 (21.5%) |
| 2 or 3 Rooms | 15 (1.7%) | 290 (25.8%) |
| 4 or 5 Rooms | 414 (47.4%) | 437 (38.8%) |
| 6 or 7 Rooms | 350 (40.1%) | 107 (9.5%) |
| 8 or more Rooms | 86 (9.8%) | 50 (4.4%) |
| Total | 874 (100.0%) | 1,126 (100.0%) |
Housing Structure by Heating Type in North Plymouth
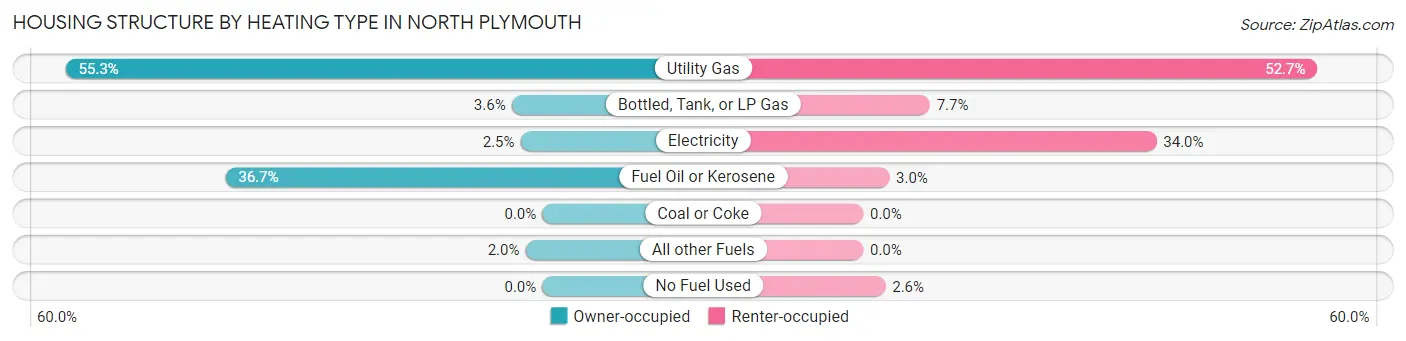
| Heating Type | Owner-occupied | Renter-occupied |
| Utility Gas | 483 (55.3%) | 593 (52.7%) |
| Bottled, Tank, or LP Gas | 31 (3.5%) | 87 (7.7%) |
| Electricity | 22 (2.5%) | 383 (34.0%) |
| Fuel Oil or Kerosene | 321 (36.7%) | 34 (3.0%) |
| Coal or Coke | 0 (0.0%) | 0 (0.0%) |
| All other Fuels | 17 (1.9%) | 0 (0.0%) |
| No Fuel Used | 0 (0.0%) | 29 (2.6%) |
| Total | 874 (100.0%) | 1,126 (100.0%) |
Household Vehicle Usage in North Plymouth
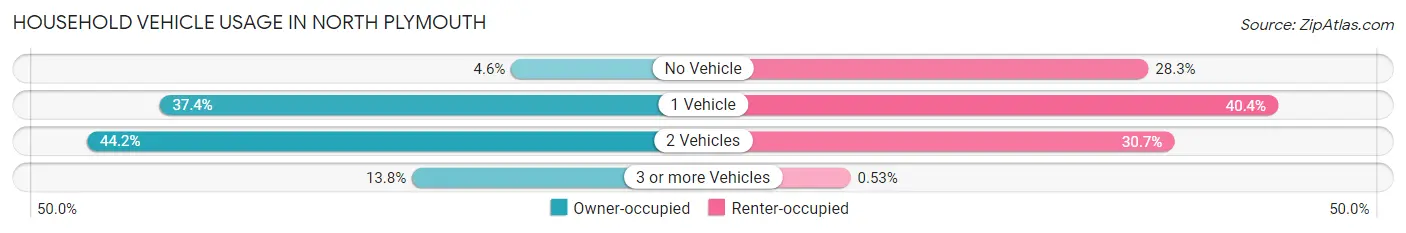
| Vehicles per Household | Owner-occupied | Renter-occupied |
| No Vehicle | 40 (4.6%) | 319 (28.3%) |
| 1 Vehicle | 327 (37.4%) | 455 (40.4%) |
| 2 Vehicles | 386 (44.2%) | 346 (30.7%) |
| 3 or more Vehicles | 121 (13.8%) | 6 (0.5%) |
| Total | 874 (100.0%) | 1,126 (100.0%) |
Real Estate & Mortgages in North Plymouth
Real Estate and Mortgage Overview in North Plymouth
| Characteristic | Without Mortgage | With Mortgage |
| Housing Units | 175 | 699 |
| Median Property Value | $407,900 | $407,400 |
| Median Household Income | $53,646 | $171 |
| Monthly Housing Costs | $977 | $178 |
| Real Estate Taxes | $6,134 | $0 |
Property Value by Mortgage Status in North Plymouth
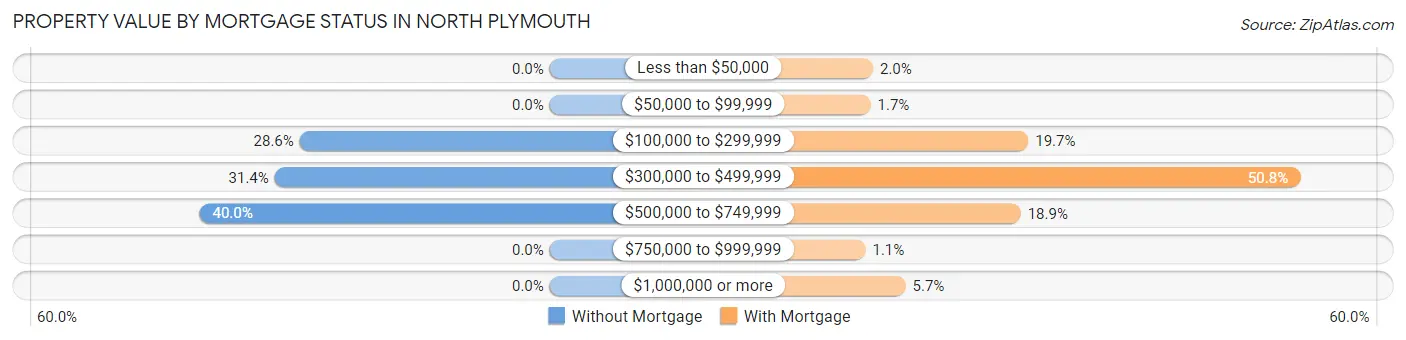
| Property Value | Without Mortgage | With Mortgage |
| Less than $50,000 | 0 (0.0%) | 14 (2.0%) |
| $50,000 to $99,999 | 0 (0.0%) | 12 (1.7%) |
| $100,000 to $299,999 | 50 (28.6%) | 138 (19.7%) |
| $300,000 to $499,999 | 55 (31.4%) | 355 (50.8%) |
| $500,000 to $749,999 | 70 (40.0%) | 132 (18.9%) |
| $750,000 to $999,999 | 0 (0.0%) | 8 (1.1%) |
| $1,000,000 or more | 0 (0.0%) | 40 (5.7%) |
| Total | 175 (100.0%) | 699 (100.0%) |
Household Income by Mortgage Status in North Plymouth
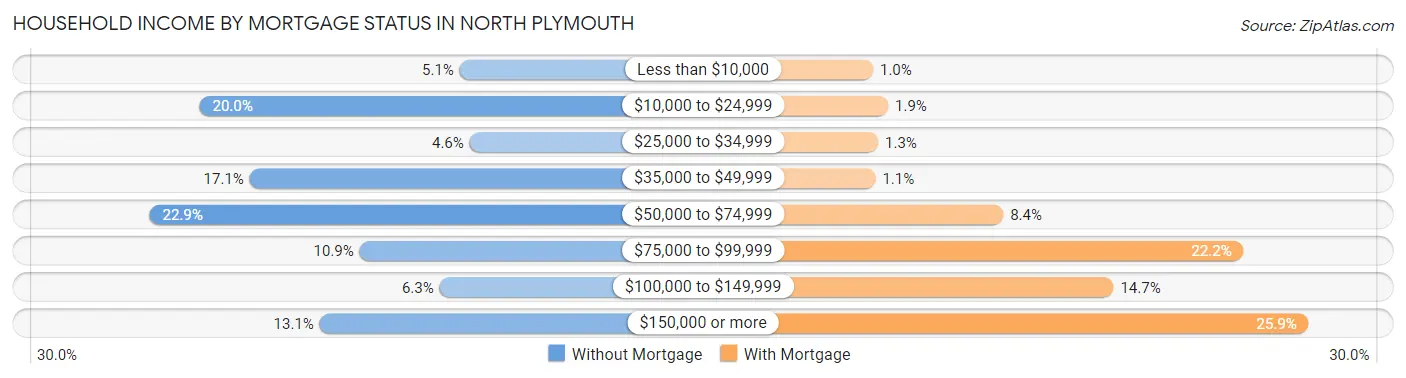
| Household Income | Without Mortgage | With Mortgage |
| Less than $10,000 | 9 (5.1%) | 7 (1.0%) |
| $10,000 to $24,999 | 35 (20.0%) | 13 (1.9%) |
| $25,000 to $34,999 | 8 (4.6%) | 9 (1.3%) |
| $35,000 to $49,999 | 30 (17.1%) | 8 (1.1%) |
| $50,000 to $74,999 | 40 (22.9%) | 59 (8.4%) |
| $75,000 to $99,999 | 19 (10.9%) | 155 (22.2%) |
| $100,000 to $149,999 | 11 (6.3%) | 103 (14.7%) |
| $150,000 or more | 23 (13.1%) | 181 (25.9%) |
| Total | 175 (100.0%) | 699 (100.0%) |
Property Value to Household Income Ratio in North Plymouth
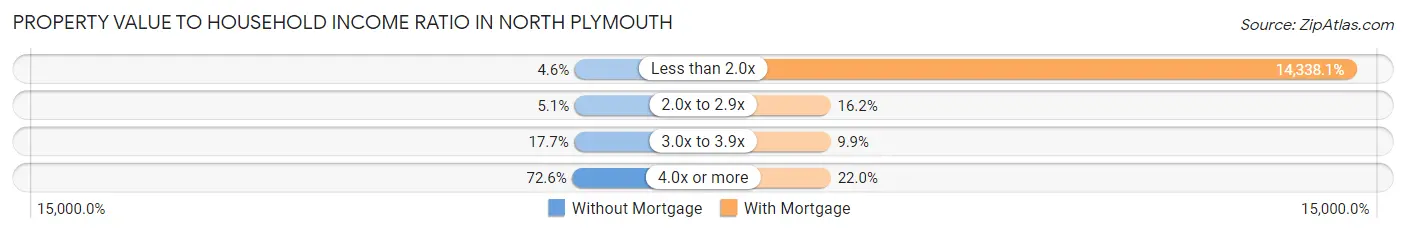
| Value-to-Income Ratio | Without Mortgage | With Mortgage |
| Less than 2.0x | 8 (4.6%) | 100,223 (14,338.1%) |
| 2.0x to 2.9x | 9 (5.1%) | 113 (16.2%) |
| 3.0x to 3.9x | 31 (17.7%) | 69 (9.9%) |
| 4.0x or more | 127 (72.6%) | 154 (22.0%) |
| Total | 175 (100.0%) | 699 (100.0%) |
Real Estate Taxes by Mortgage Status in North Plymouth
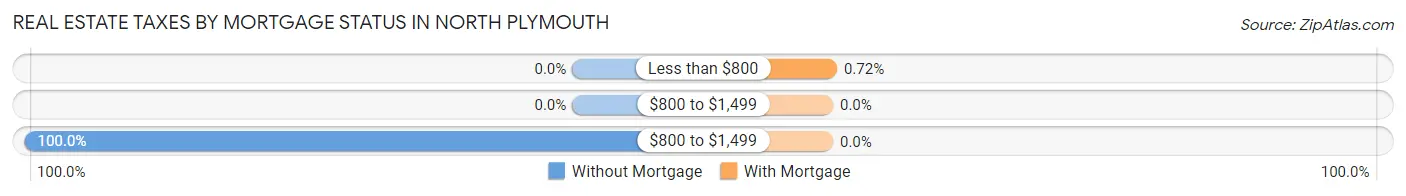
| Property Taxes | Without Mortgage | With Mortgage |
| Less than $800 | 0 (0.0%) | 5 (0.7%) |
| $800 to $1,499 | 0 (0.0%) | 0 (0.0%) |
| $800 to $1,499 | 175 (100.0%) | 0 (0.0%) |
| Total | 175 (100.0%) | 699 (100.0%) |
Health & Disability in North Plymouth
Health Insurance Coverage by Age in North Plymouth
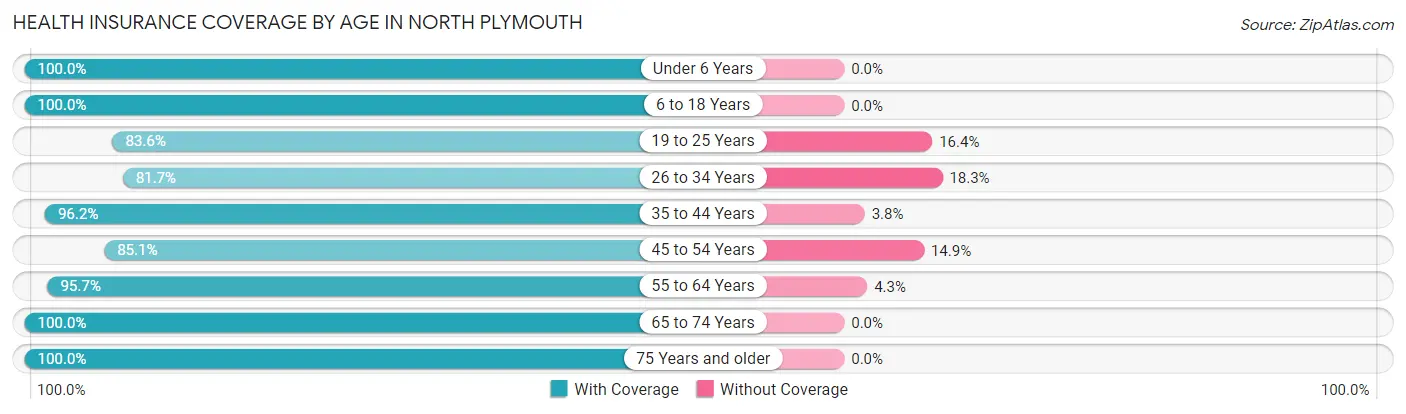
| Age Bracket | With Coverage | Without Coverage |
| Under 6 Years | 248 (100.0%) | 0 (0.0%) |
| 6 to 18 Years | 495 (100.0%) | 0 (0.0%) |
| 19 to 25 Years | 260 (83.6%) | 51 (16.4%) |
| 26 to 34 Years | 719 (81.7%) | 161 (18.3%) |
| 35 to 44 Years | 657 (96.2%) | 26 (3.8%) |
| 45 to 54 Years | 401 (85.1%) | 70 (14.9%) |
| 55 to 64 Years | 606 (95.7%) | 27 (4.3%) |
| 65 to 74 Years | 424 (100.0%) | 0 (0.0%) |
| 75 Years and older | 272 (100.0%) | 0 (0.0%) |
| Total | 4,082 (92.4%) | 335 (7.6%) |
Health Insurance Coverage by Citizenship Status in North Plymouth
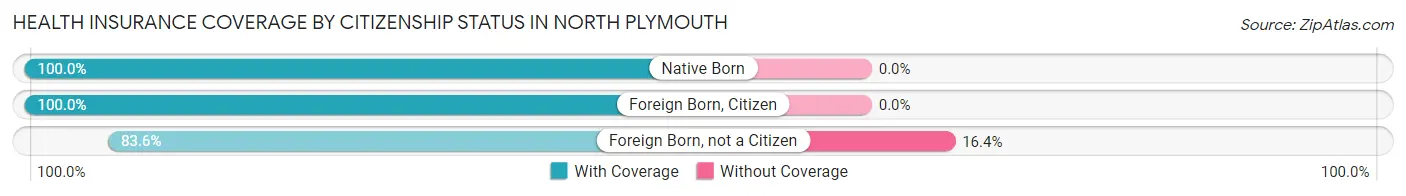
| Citizenship Status | With Coverage | Without Coverage |
| Native Born | 248 (100.0%) | 0 (0.0%) |
| Foreign Born, Citizen | 495 (100.0%) | 0 (0.0%) |
| Foreign Born, not a Citizen | 260 (83.6%) | 51 (16.4%) |
Health Insurance Coverage by Household Income in North Plymouth
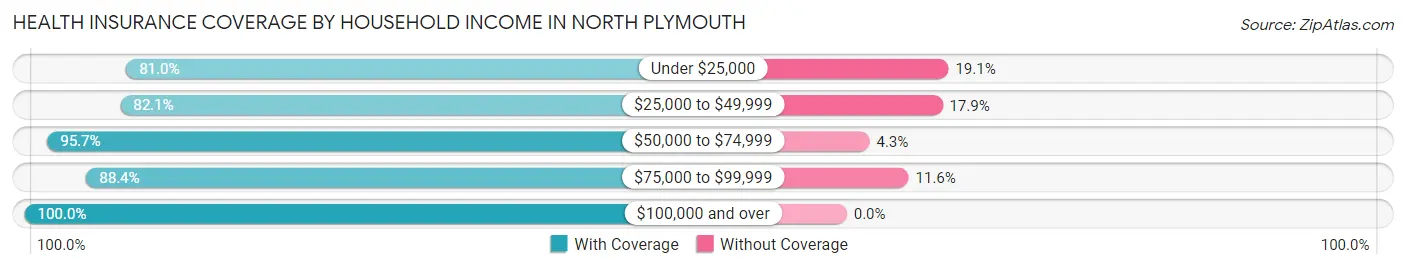
| Household Income | With Coverage | Without Coverage |
| Under $25,000 | 684 (80.9%) | 161 (19.1%) |
| $25,000 to $49,999 | 389 (82.1%) | 85 (17.9%) |
| $50,000 to $74,999 | 697 (95.7%) | 31 (4.3%) |
| $75,000 to $99,999 | 443 (88.4%) | 58 (11.6%) |
| $100,000 and over | 1,775 (100.0%) | 0 (0.0%) |
Public vs Private Health Insurance Coverage by Age in North Plymouth
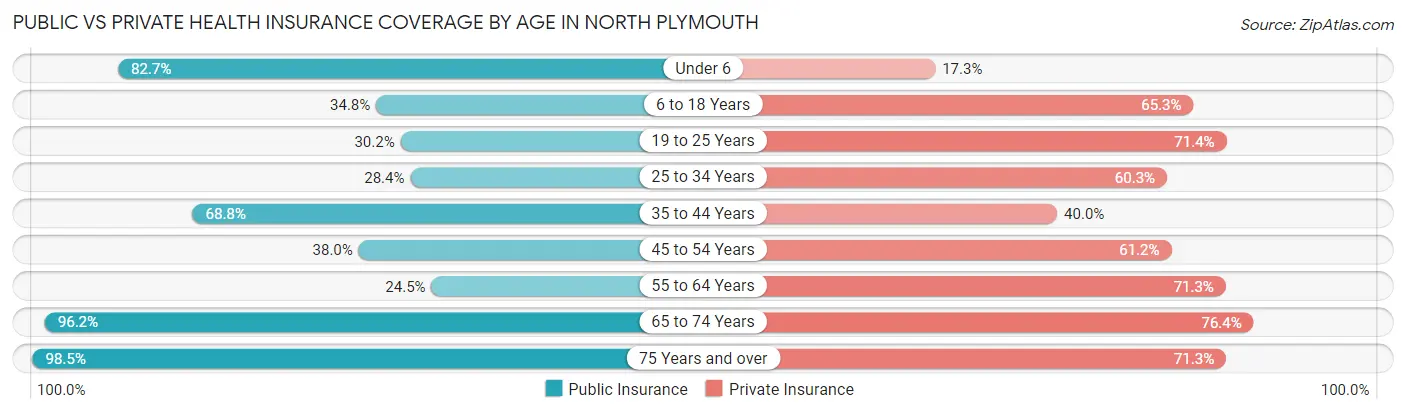
| Age Bracket | Public Insurance | Private Insurance |
| Under 6 | 205 (82.7%) | 43 (17.3%) |
| 6 to 18 Years | 172 (34.7%) | 323 (65.2%) |
| 19 to 25 Years | 94 (30.2%) | 222 (71.4%) |
| 25 to 34 Years | 250 (28.4%) | 531 (60.3%) |
| 35 to 44 Years | 470 (68.8%) | 273 (40.0%) |
| 45 to 54 Years | 179 (38.0%) | 288 (61.2%) |
| 55 to 64 Years | 155 (24.5%) | 451 (71.3%) |
| 65 to 74 Years | 408 (96.2%) | 324 (76.4%) |
| 75 Years and over | 268 (98.5%) | 194 (71.3%) |
| Total | 2,201 (49.8%) | 2,649 (60.0%) |
Disability Status by Sex by Age in North Plymouth
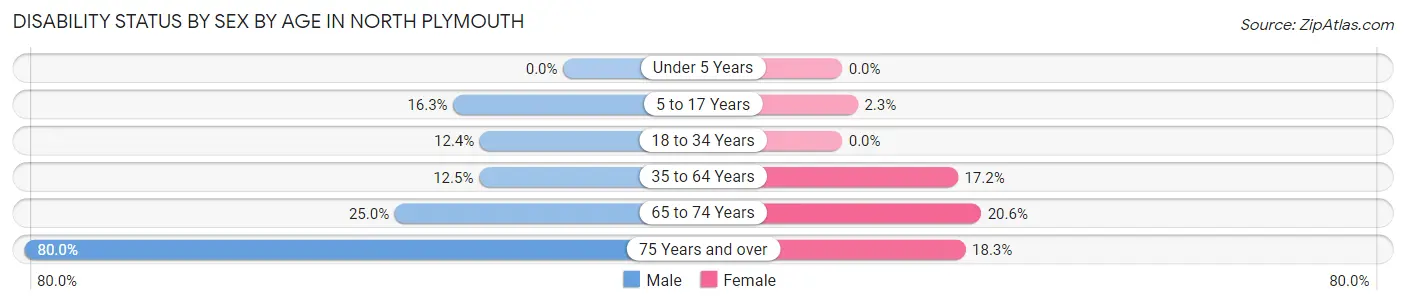
| Age Bracket | Male | Female |
| Under 5 Years | 0 (0.0%) | 0 (0.0%) |
| 5 to 17 Years | 31 (16.3%) | 6 (2.3%) |
| 18 to 34 Years | 88 (12.4%) | 0 (0.0%) |
| 35 to 64 Years | 117 (12.5%) | 146 (17.2%) |
| 65 to 74 Years | 43 (25.0%) | 52 (20.6%) |
| 75 Years and over | 104 (80.0%) | 26 (18.3%) |
Disability Class by Sex by Age in North Plymouth
Disability Class: Hearing Difficulty
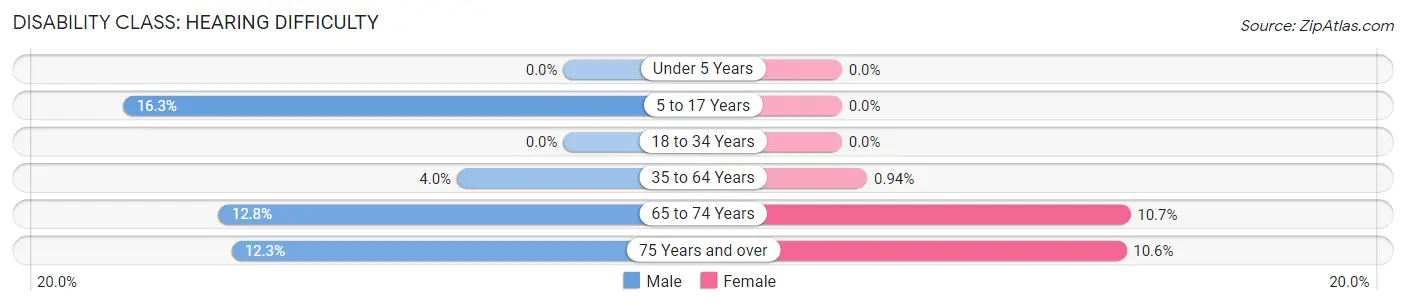
| Age Bracket | Male | Female |
| Under 5 Years | 0 (0.0%) | 0 (0.0%) |
| 5 to 17 Years | 31 (16.3%) | 0 (0.0%) |
| 18 to 34 Years | 0 (0.0%) | 0 (0.0%) |
| 35 to 64 Years | 37 (4.0%) | 8 (0.9%) |
| 65 to 74 Years | 22 (12.8%) | 27 (10.7%) |
| 75 Years and over | 16 (12.3%) | 15 (10.6%) |
Disability Class: Vision Difficulty
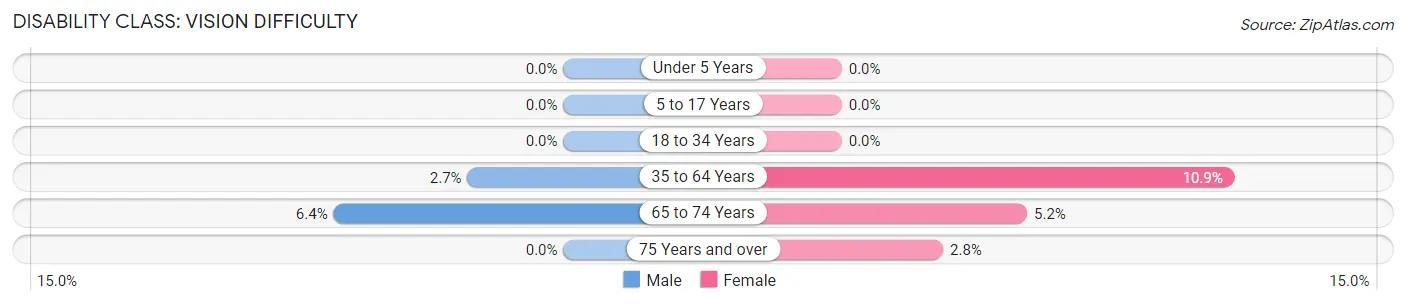
| Age Bracket | Male | Female |
| Under 5 Years | 0 (0.0%) | 0 (0.0%) |
| 5 to 17 Years | 0 (0.0%) | 0 (0.0%) |
| 18 to 34 Years | 0 (0.0%) | 0 (0.0%) |
| 35 to 64 Years | 25 (2.7%) | 93 (10.9%) |
| 65 to 74 Years | 11 (6.4%) | 13 (5.2%) |
| 75 Years and over | 0 (0.0%) | 4 (2.8%) |
Disability Class: Cognitive Difficulty
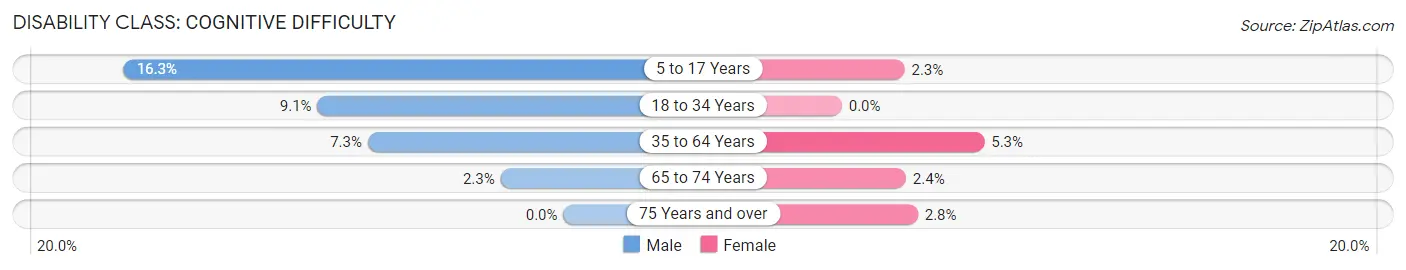
| Age Bracket | Male | Female |
| 5 to 17 Years | 31 (16.3%) | 6 (2.3%) |
| 18 to 34 Years | 65 (9.1%) | 0 (0.0%) |
| 35 to 64 Years | 68 (7.3%) | 45 (5.3%) |
| 65 to 74 Years | 4 (2.3%) | 6 (2.4%) |
| 75 Years and over | 0 (0.0%) | 4 (2.8%) |
Disability Class: Ambulatory Difficulty
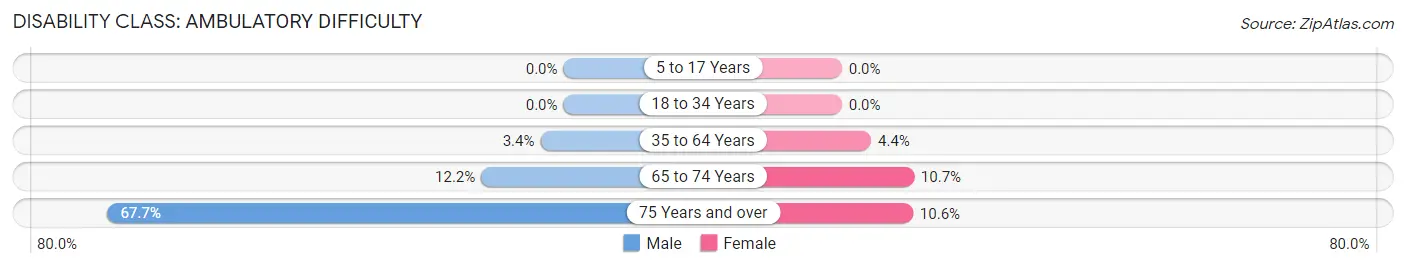
| Age Bracket | Male | Female |
| 5 to 17 Years | 0 (0.0%) | 0 (0.0%) |
| 18 to 34 Years | 0 (0.0%) | 0 (0.0%) |
| 35 to 64 Years | 32 (3.4%) | 37 (4.3%) |
| 65 to 74 Years | 21 (12.2%) | 27 (10.7%) |
| 75 Years and over | 88 (67.7%) | 15 (10.6%) |
Disability Class: Self-Care Difficulty
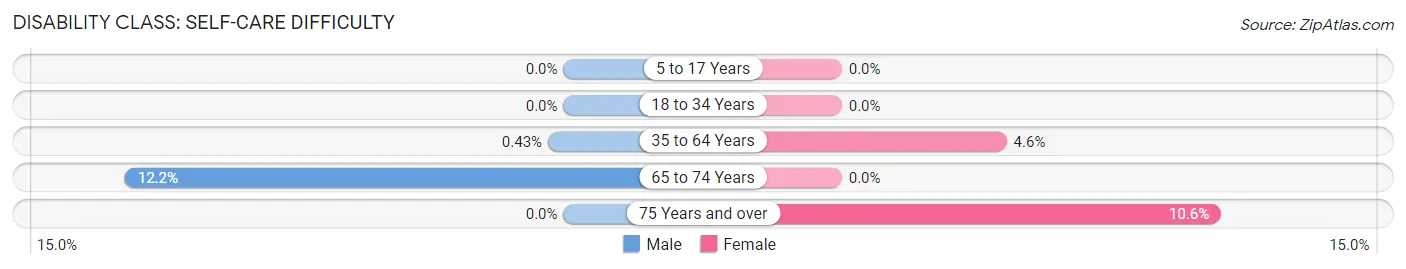
| Age Bracket | Male | Female |
| 5 to 17 Years | 0 (0.0%) | 0 (0.0%) |
| 18 to 34 Years | 0 (0.0%) | 0 (0.0%) |
| 35 to 64 Years | 4 (0.4%) | 39 (4.6%) |
| 65 to 74 Years | 21 (12.2%) | 0 (0.0%) |
| 75 Years and over | 0 (0.0%) | 15 (10.6%) |
Technology Access in North Plymouth
Computing Device Access in North Plymouth
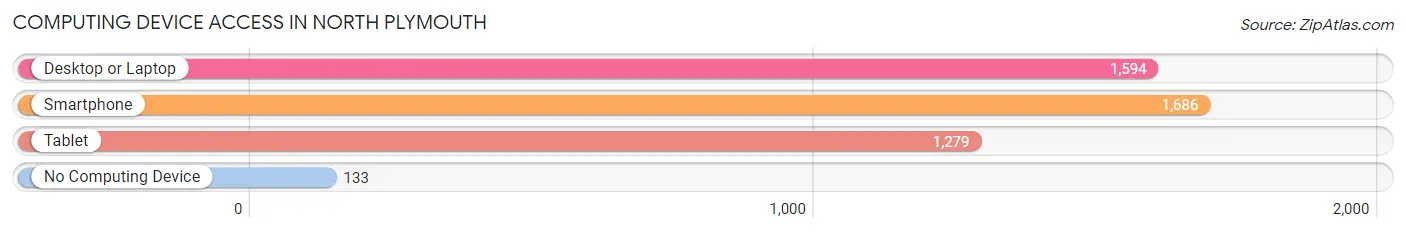
| Device Type | # Households | % Households |
| Desktop or Laptop | 1,594 | 79.7% |
| Smartphone | 1,686 | 84.3% |
| Tablet | 1,279 | 63.9% |
| No Computing Device | 133 | 6.7% |
| Total | 2,000 | 100.0% |
Internet Access in North Plymouth
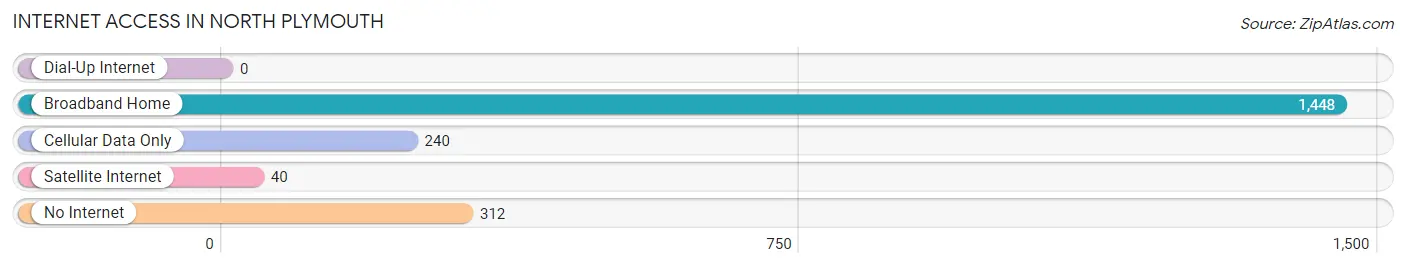
| Internet Type | # Households | % Households |
| Dial-Up Internet | 0 | 0.0% |
| Broadband Home | 1,448 | 72.4% |
| Cellular Data Only | 240 | 12.0% |
| Satellite Internet | 40 | 2.0% |
| No Internet | 312 | 15.6% |
| Total | 2,000 | 100.0% |
North Plymouth Summary
Plymouth, Massachusetts is a town located in Plymouth County, Massachusetts, United States. It is the largest town in the county and the second largest in the state. Plymouth is located on the south shore of Massachusetts, approximately 40 miles south of Boston. The town is bordered by the towns of Carver, Kingston, Duxbury, and Marshfield. Plymouth is known as “America’s Hometown” and is the site of the first Thanksgiving.
History
Plymouth was founded in 1620 by the Pilgrims, who were a group of English Separatists seeking religious freedom. The Pilgrims arrived on the Mayflower and established the Plymouth Colony, which was the first permanent English settlement in what is now the United States. The town was named after the English port of Plymouth, from which the Pilgrims had set sail.
The town of Plymouth was incorporated in 1685 and was the first town in the United States to be incorporated by a royal charter. The town was the site of several important events in American history, including the first Thanksgiving in 1621, the signing of the Mayflower Compact in 1620, and the first public school in the United States in 1635.
Geography
Plymouth is located in southeastern Massachusetts, approximately 40 miles south of Boston. The town is bordered by the towns of Carver, Kingston, Duxbury, and Marshfield. The town is situated on the south shore of Massachusetts, and is located on the western side of Plymouth Bay. The town is home to several bodies of water, including Plymouth Harbor, Plymouth Beach, and Plymouth Pond.
The town has a total area of 58.2 square miles, of which 56.2 square miles is land and 2.0 square miles is water. The town is located in a region of rolling hills and wooded areas. The highest point in the town is located at the summit of Burial Hill, which is located in the center of town and is the site of the first cemetery in the United States.
Economy
Plymouth is a major tourist destination, and the town’s economy is largely based on tourism. The town is home to several attractions, including Plymouth Rock, the Mayflower II, and Plimoth Plantation. The town is also home to several museums, including the Pilgrim Hall Museum, the National Monument to the Forefathers, and the Plymouth County Historical Museum.
The town is also home to several large employers, including the Pilgrim Nuclear Power Station, the Pilgrim Medical Center, and the Plymouth County Sheriff’s Office. The town is also home to several educational institutions, including Plymouth State University, the University of Massachusetts at Dartmouth, and the Massachusetts Maritime Academy.
Demographics
As of the 2010 census, the town of Plymouth had a population of 58,851. The population was spread out, with 25.3% under the age of 18, 8.2% from 18 to 24, 28.2% from 25 to 44, 24.7% from 45 to 64, and 13.6% who were 65 years of age or older. The median age was 38.7 years.
The racial makeup of the town was 94.2% White, 1.7% African American, 0.3% Native American, 1.3% Asian, 0.1% Pacific Islander, 1.2% from other races, and 1.3% from two or more races. Hispanic or Latino of any race were 3.2% of the population.
The median income for a household in the town was $63,945, and the median income for a family was $76,845. The per capita income for the town was $30,945. About 4.2% of families and 6.3% of the population were below the poverty line, including 8.2% of those under age 18 and 4.2% of those age 65 or over.
Common Questions
What is Per Capita Income in North Plymouth?
Per Capita income in North Plymouth is $36,124.
What is the Median Family Income in North Plymouth?
Median Family Income in North Plymouth is $106,400.
What is the Median Household income in North Plymouth?
Median Household Income in North Plymouth is $59,696.
What is Income or Wage Gap in North Plymouth?
Income or Wage Gap in North Plymouth is 26.0%.
Women in North Plymouth earn 74.0 cents for every dollar earned by a man.
What is Inequality or Gini Index in North Plymouth?
Inequality or Gini Index in North Plymouth is 0.44.
What is the Total Population of North Plymouth?
Total Population of North Plymouth is 4,418.
What is the Total Male Population of North Plymouth?
Total Male Population of North Plymouth is 2,220.
What is the Total Female Population of North Plymouth?
Total Female Population of North Plymouth is 2,198.
What is the Ratio of Males per 100 Females in North Plymouth?
There are 101.00 Males per 100 Females in North Plymouth.
What is the Ratio of Females per 100 Males in North Plymouth?
There are 99.01 Females per 100 Males in North Plymouth.
What is the Median Population Age in North Plymouth?
Median Population Age in North Plymouth is 41.0 Years.
What is the Average Family Size in North Plymouth
Average Family Size in North Plymouth is 3.0 People.
What is the Average Household Size in North Plymouth
Average Household Size in North Plymouth is 2.2 People.
How Large is the Labor Force in North Plymouth?
There are 2,840 People in the Labor Forcein in North Plymouth.
What is the Percentage of People in the Labor Force in North Plymouth?
74.2% of People are in the Labor Force in North Plymouth.
What is the Unemployment Rate in North Plymouth?
Unemployment Rate in North Plymouth is 18.1%.