Wareham Center, MA Map & Demographics
Wareham Center Map
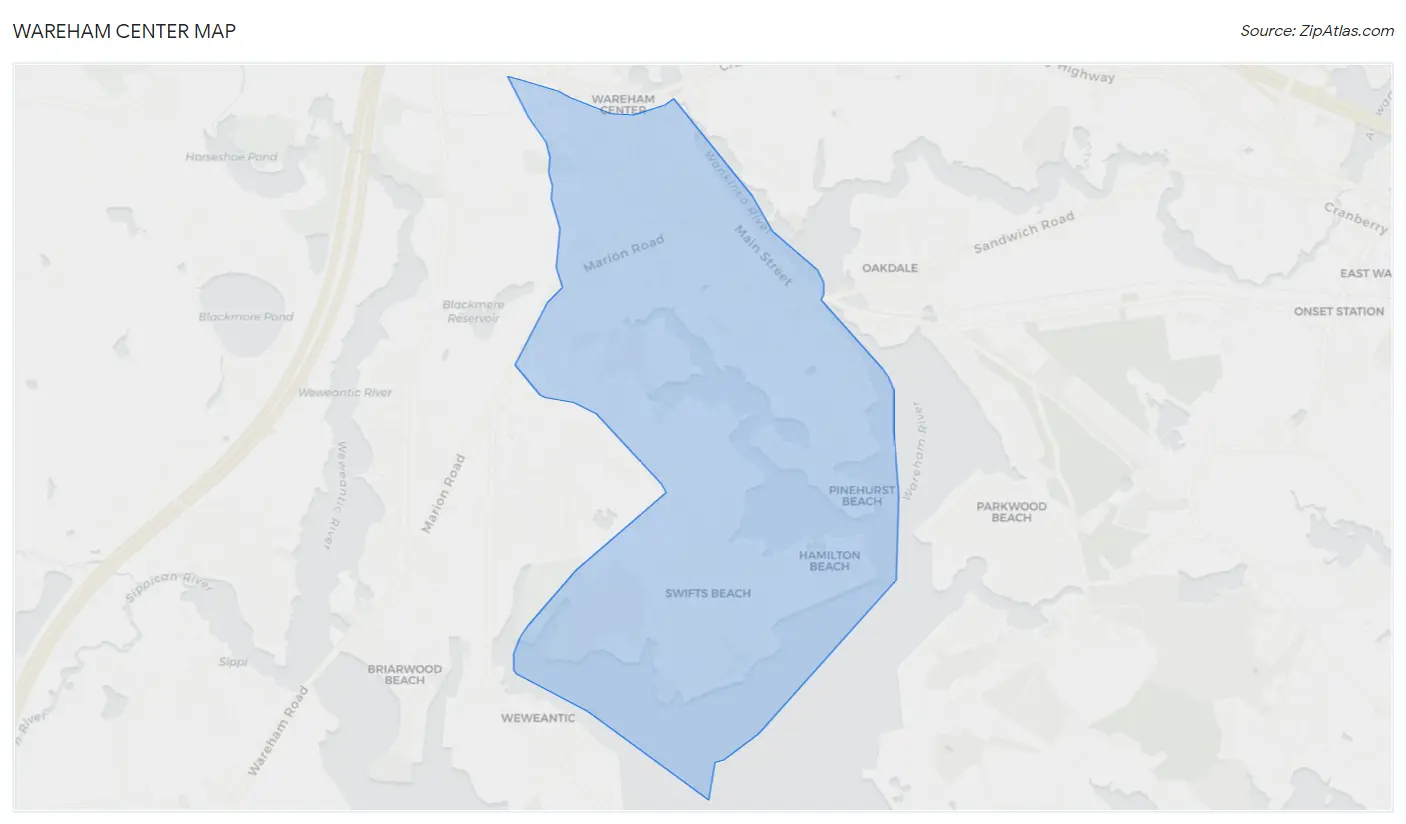
Wareham Center Overview
$39,693
PER CAPITA INCOME
$79,881
AVG FAMILY INCOME
$69,286
AVG HOUSEHOLD INCOME
0.36
INEQUALITY / GINI INDEX
2,654
TOTAL POPULATION
1,315
MALE POPULATION
1,339
FEMALE POPULATION
98.21
MALES / 100 FEMALES
101.83
FEMALES / 100 MALES
53.8
MEDIAN AGE
2.5
AVG FAMILY SIZE
2.0
AVG HOUSEHOLD SIZE
1,230
LABOR FORCE [ PEOPLE ]
51.8%
PERCENT IN LABOR FORCE
4.9%
UNEMPLOYMENT RATE
Income in Wareham Center
Income Overview in Wareham Center
Per Capita Income in Wareham Center is $39,693, while median incomes of families and households are $79,881 and $69,286 respectively.
| Characteristic | Number | Measure |
| Per Capita Income | 2,654 | $39,693 |
| Median Family Income | 762 | $79,881 |
| Mean Family Income | 762 | $91,224 |
| Median Household Income | 1,264 | $69,286 |
| Mean Household Income | 1,264 | $78,021 |
| Income Deficit | 762 | $0 |
| Wage / Income Gap (%) | 2,654 | 0.00% |
| Wage / Income Gap ($) | 2,654 | 100.00¢ per $1 |
| Gini / Inequality Index | 2,654 | 0.36 |
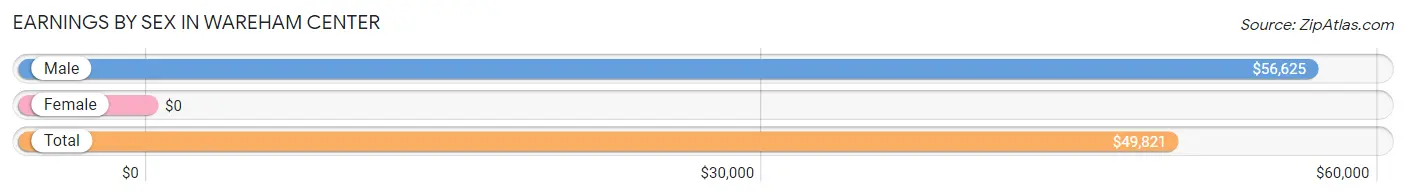
Earnings by Sex in Wareham Center
| Sex | Number | Average Earnings |
| Male | 665 (50.4%) | $56,625 |
| Female | 654 (49.6%) | $0 |
| Total | 1,319 (100.0%) | $49,821 |
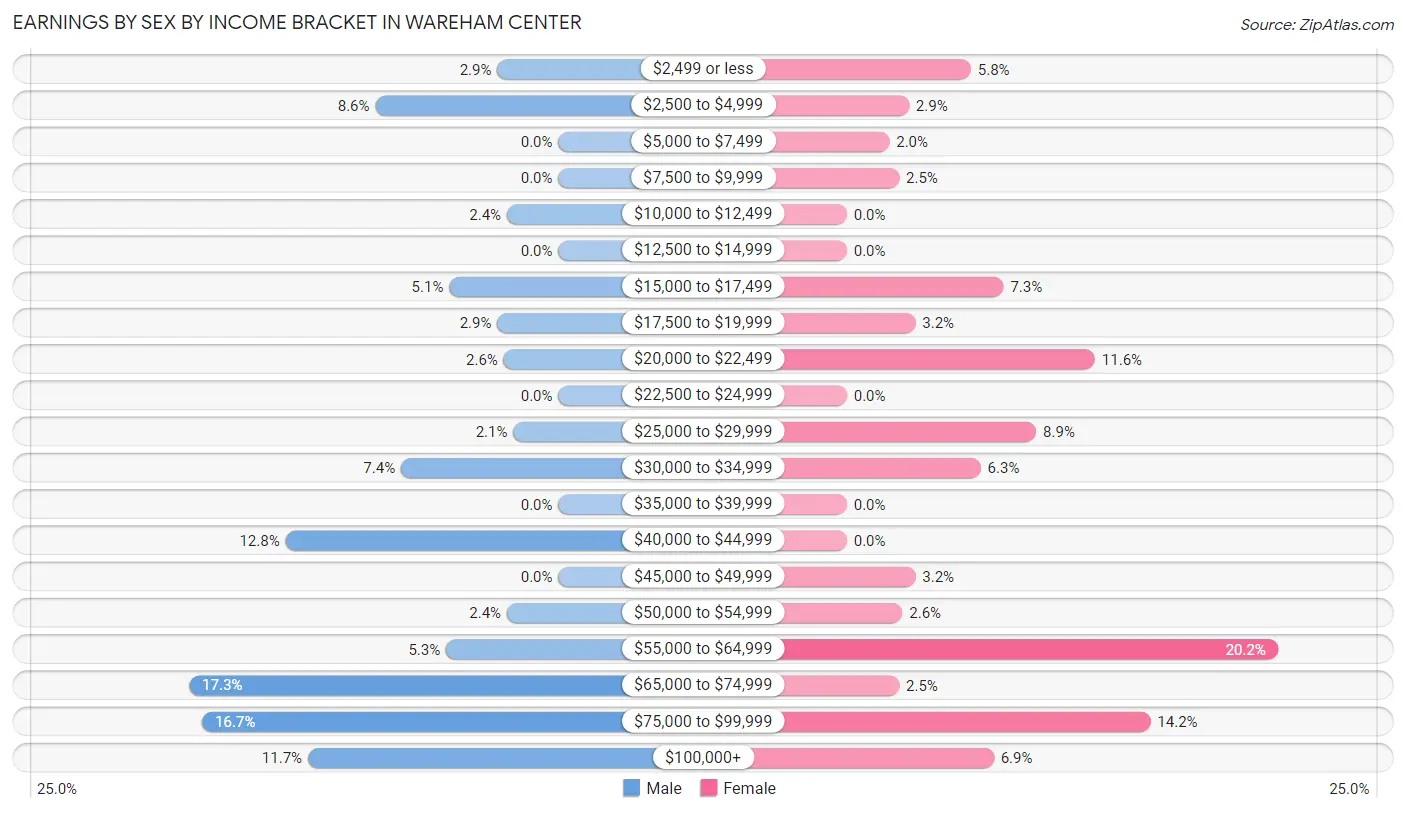
Earnings by Sex by Income Bracket in Wareham Center
The most common earnings brackets in Wareham Center are $65,000 to $74,999 for men (115 | 17.3%) and $55,000 to $64,999 for women (132 | 20.2%).
| Income | Male | Female |
| $2,499 or less | 19 (2.9%) | 38 (5.8%) |
| $2,500 to $4,999 | 57 (8.6%) | 19 (2.9%) |
| $5,000 to $7,499 | 0 (0.0%) | 13 (2.0%) |
| $7,500 to $9,999 | 0 (0.0%) | 16 (2.5%) |
| $10,000 to $12,499 | 16 (2.4%) | 0 (0.0%) |
| $12,500 to $14,999 | 0 (0.0%) | 0 (0.0%) |
| $15,000 to $17,499 | 34 (5.1%) | 48 (7.3%) |
| $17,500 to $19,999 | 19 (2.9%) | 21 (3.2%) |
| $20,000 to $22,499 | 17 (2.6%) | 76 (11.6%) |
| $22,500 to $24,999 | 0 (0.0%) | 0 (0.0%) |
| $25,000 to $29,999 | 14 (2.1%) | 58 (8.9%) |
| $30,000 to $34,999 | 49 (7.4%) | 41 (6.3%) |
| $35,000 to $39,999 | 0 (0.0%) | 0 (0.0%) |
| $40,000 to $44,999 | 85 (12.8%) | 0 (0.0%) |
| $45,000 to $49,999 | 0 (0.0%) | 21 (3.2%) |
| $50,000 to $54,999 | 16 (2.4%) | 17 (2.6%) |
| $55,000 to $64,999 | 35 (5.3%) | 132 (20.2%) |
| $65,000 to $74,999 | 115 (17.3%) | 16 (2.5%) |
| $75,000 to $99,999 | 111 (16.7%) | 93 (14.2%) |
| $100,000+ | 78 (11.7%) | 45 (6.9%) |
| Total | 665 (100.0%) | 654 (100.0%) |
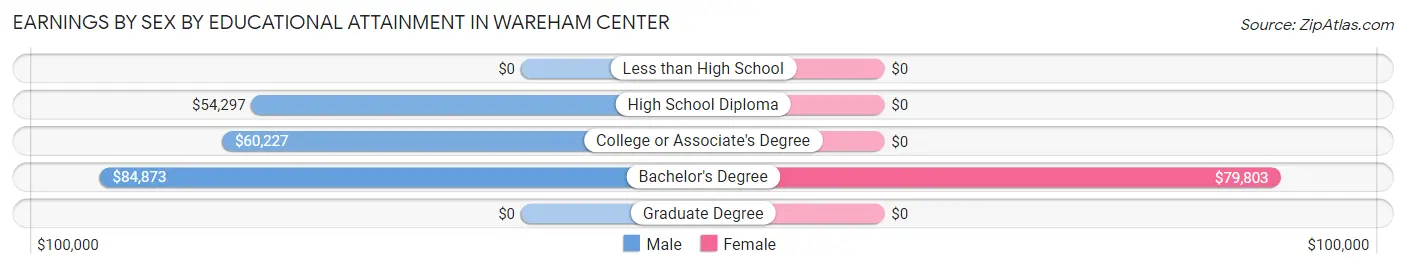
Earnings by Sex by Educational Attainment in Wareham Center
Average earnings in Wareham Center are $68,185 for men and $56,033 for women, a difference of 17.8%. Men with an educational attainment of bachelor's degree enjoy the highest average annual earnings of $84,873, while those with high school diploma education earn the least with $54,297. Women with an educational attainment of bachelor's degree earn the most with the average annual earnings of $79,803, while those with bachelor's degree education have the smallest earnings of $79,803.
| Educational Attainment | Male Income | Female Income |
| Less than High School | - | - |
| High School Diploma | $54,297 | $0 |
| College or Associate's Degree | $60,227 | $0 |
| Bachelor's Degree | $84,873 | $79,803 |
| Graduate Degree | - | - |
| Total | $68,185 | $56,033 |
Family Income in Wareham Center
Family Income Brackets in Wareham Center
According to the Wareham Center family income data, there are 191 families falling into the $50,000 to $74,999 income range, which is the most common income bracket and makes up 25.1% of all families.
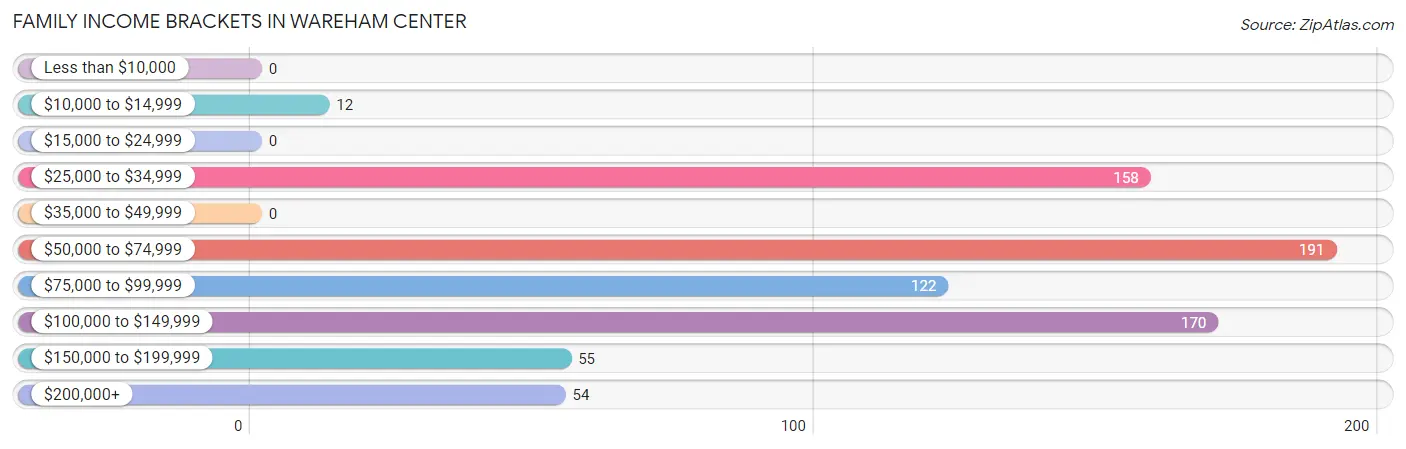
| Income Bracket | # Families | % Families |
| Less than $10,000 | 0 | 0.0% |
| $10,000 to $14,999 | 12 | 1.6% |
| $15,000 to $24,999 | 0 | 0.0% |
| $25,000 to $34,999 | 158 | 20.7% |
| $35,000 to $49,999 | 0 | 0.0% |
| $50,000 to $74,999 | 191 | 25.1% |
| $75,000 to $99,999 | 122 | 16.0% |
| $100,000 to $149,999 | 170 | 22.3% |
| $150,000 to $199,999 | 55 | 7.2% |
| $200,000+ | 54 | 7.1% |
Family Income by Famaliy Size in Wareham Center
3-person families (91 | 11.9%) account for the highest median family income in Wareham Center with $147,670 per family, while 3-person families (91 | 11.9%) have the highest median income of $49,223 per family member.
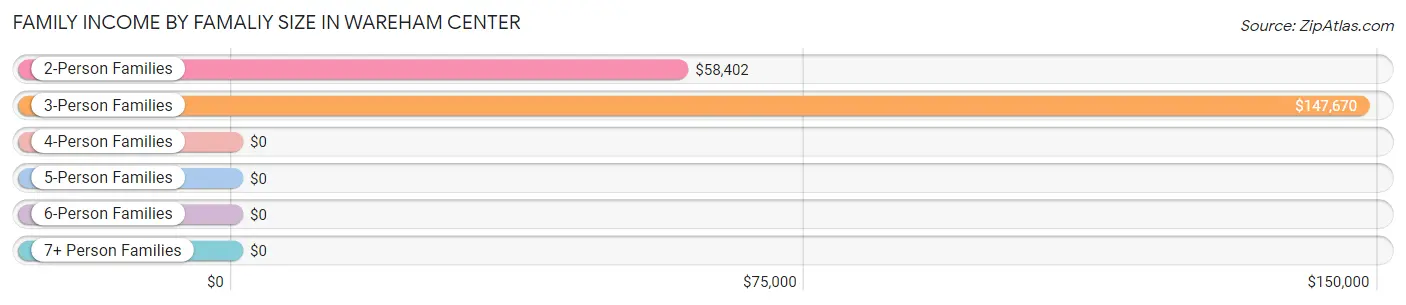
| Income Bracket | # Families | Median Income |
| 2-Person Families | 552 (72.4%) | $58,402 |
| 3-Person Families | 91 (11.9%) | $147,670 |
| 4-Person Families | 52 (6.8%) | $0 |
| 5-Person Families | 67 (8.8%) | $0 |
| 6-Person Families | 0 (0.0%) | $0 |
| 7+ Person Families | 0 (0.0%) | $0 |
| Total | 762 (100.0%) | $79,881 |
Family Income by Number of Earners in Wareham Center
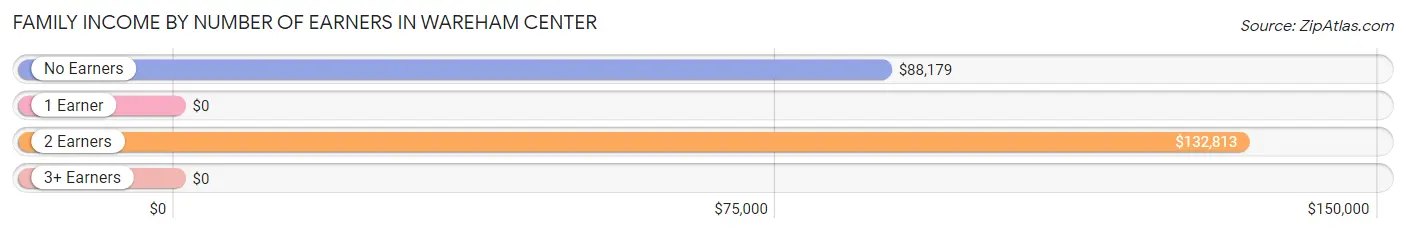
| Number of Earners | # Families | Median Income |
| No Earners | 221 (29.0%) | $88,179 |
| 1 Earner | 237 (31.1%) | $0 |
| 2 Earners | 237 (31.1%) | $132,813 |
| 3+ Earners | 67 (8.8%) | $0 |
| Total | 762 (100.0%) | $79,881 |
Household Income in Wareham Center
Household Income Brackets in Wareham Center
With 283 households falling in the category, the $50,000 to $74,999 income range is the most frequent in Wareham Center, accounting for 22.4% of all households. In contrast, only 28 households (2.2%) fall into the $10,000 to $14,999 income bracket, making it the least populous group.
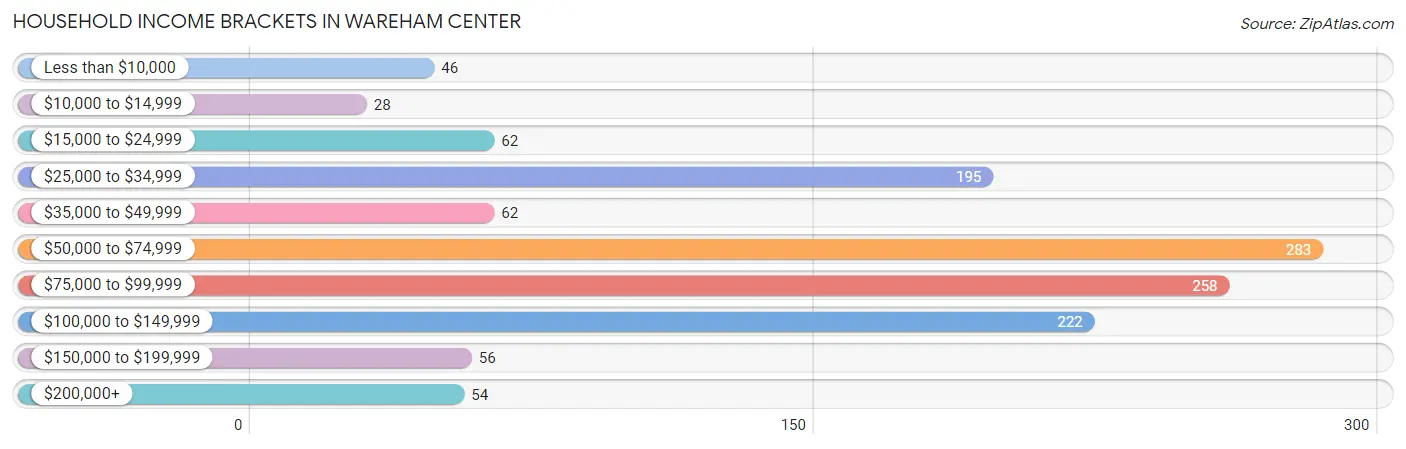
| Income Bracket | # Households | % Households |
| Less than $10,000 | 46 | 3.6% |
| $10,000 to $14,999 | 28 | 2.2% |
| $15,000 to $24,999 | 62 | 4.9% |
| $25,000 to $34,999 | 195 | 15.4% |
| $35,000 to $49,999 | 62 | 4.9% |
| $50,000 to $74,999 | 283 | 22.4% |
| $75,000 to $99,999 | 258 | 20.4% |
| $100,000 to $149,999 | 222 | 17.6% |
| $150,000 to $199,999 | 56 | 4.4% |
| $200,000+ | 54 | 4.3% |
Household Income by Householder Age in Wareham Center
The median household income in Wareham Center is $69,286, with the highest median household income of $100,823 found in the 25 to 44 years age bracket for the primary householder. A total of 129 households (10.2%) fall into this category.
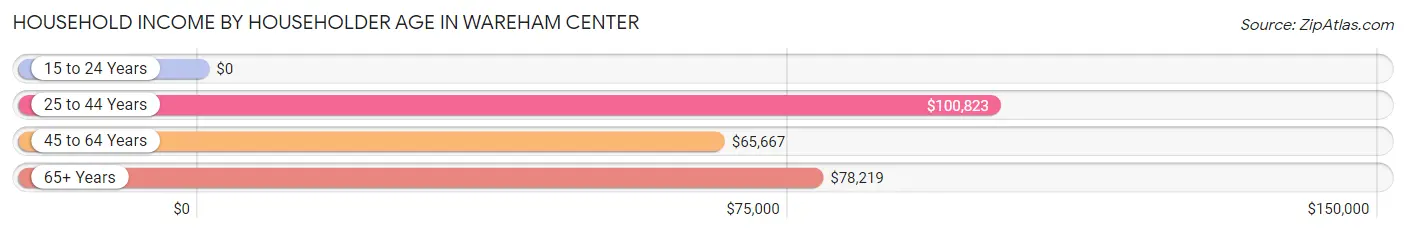
| Income Bracket | # Households | Median Income |
| 15 to 24 Years | 0 (0.0%) | $0 |
| 25 to 44 Years | 129 (10.2%) | $100,823 |
| 45 to 64 Years | 706 (55.8%) | $65,667 |
| 65+ Years | 429 (33.9%) | $78,219 |
| Total | 1,264 (100.0%) | $69,286 |
Poverty in Wareham Center
Income Below Poverty by Sex and Age in Wareham Center
With 5.9% poverty level for males and 7.9% for females among the residents of Wareham Center, 25 to 34 year old males and 65 to 74 year old females are the most vulnerable to poverty, with 24 males (34.8%) and 45 females (15.7%) in their respective age groups living below the poverty level.
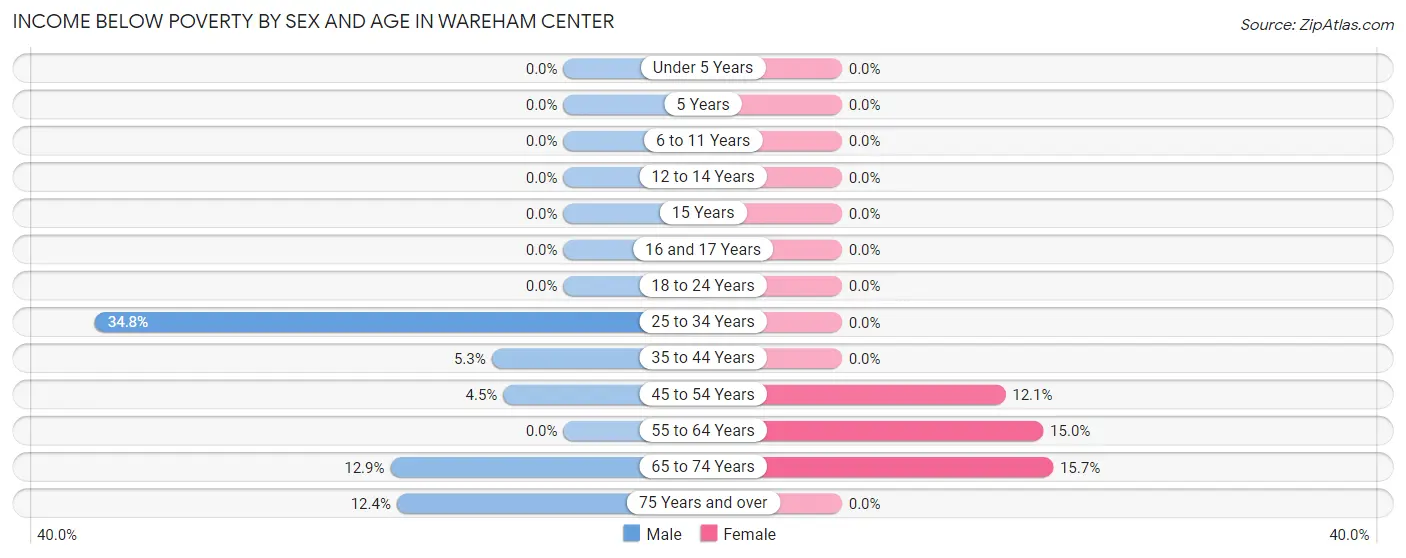
| Age Bracket | Male | Female |
| Under 5 Years | 0 (0.0%) | 0 (0.0%) |
| 5 Years | 0 (0.0%) | 0 (0.0%) |
| 6 to 11 Years | 0 (0.0%) | 0 (0.0%) |
| 12 to 14 Years | 0 (0.0%) | 0 (0.0%) |
| 15 Years | 0 (0.0%) | 0 (0.0%) |
| 16 and 17 Years | 0 (0.0%) | 0 (0.0%) |
| 18 to 24 Years | 0 (0.0%) | 0 (0.0%) |
| 25 to 34 Years | 24 (34.8%) | 0 (0.0%) |
| 35 to 44 Years | 4 (5.3%) | 0 (0.0%) |
| 45 to 54 Years | 13 (4.5%) | 42 (12.1%) |
| 55 to 64 Years | 0 (0.0%) | 16 (14.9%) |
| 65 to 74 Years | 23 (12.9%) | 45 (15.7%) |
| 75 Years and over | 12 (12.4%) | 0 (0.0%) |
| Total | 76 (5.9%) | 103 (7.9%) |
Income Above Poverty by Sex and Age in Wareham Center
According to the poverty statistics in Wareham Center, males aged under 5 years and females aged under 5 years are the age groups that are most secure financially, with 100.0% of males and 100.0% of females in these age groups living above the poverty line.
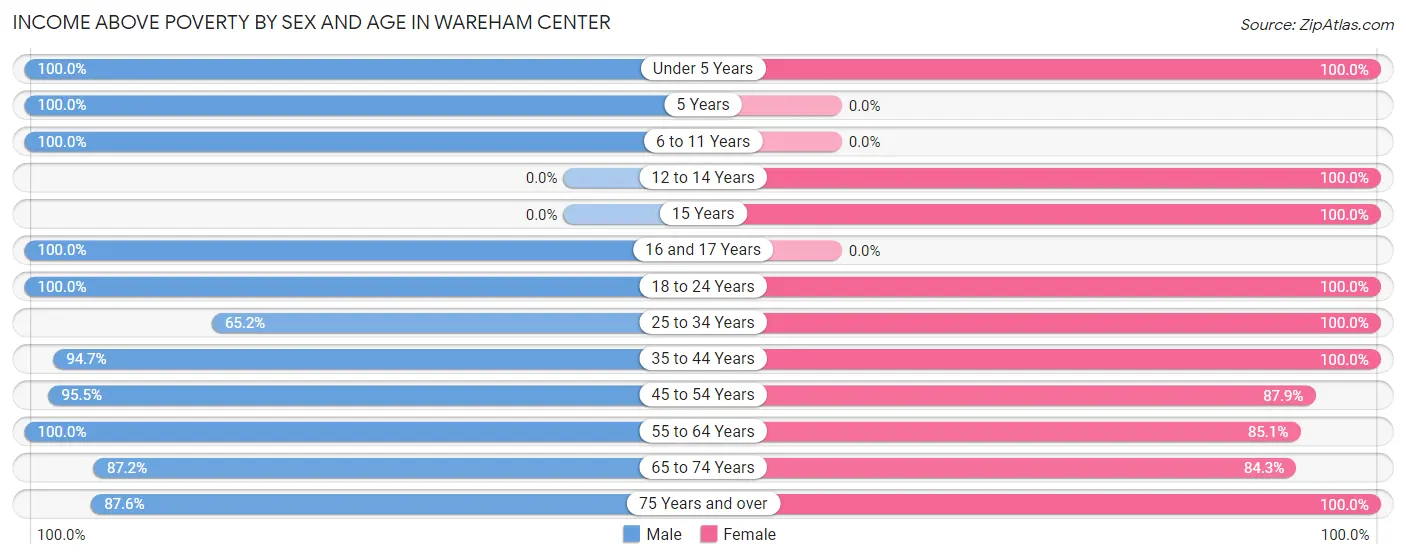
| Age Bracket | Male | Female |
| Under 5 Years | 116 (100.0%) | 49 (100.0%) |
| 5 Years | 40 (100.0%) | 0 (0.0%) |
| 6 to 11 Years | 43 (100.0%) | 0 (0.0%) |
| 12 to 14 Years | 0 (0.0%) | 17 (100.0%) |
| 15 Years | 0 (0.0%) | 15 (100.0%) |
| 16 and 17 Years | 14 (100.0%) | 0 (0.0%) |
| 18 to 24 Years | 106 (100.0%) | 127 (100.0%) |
| 25 to 34 Years | 45 (65.2%) | 135 (100.0%) |
| 35 to 44 Years | 71 (94.7%) | 48 (100.0%) |
| 45 to 54 Years | 278 (95.5%) | 304 (87.9%) |
| 55 to 64 Years | 265 (100.0%) | 91 (85.1%) |
| 65 to 74 Years | 156 (87.2%) | 242 (84.3%) |
| 75 Years and over | 85 (87.6%) | 168 (100.0%) |
| Total | 1,219 (94.1%) | 1,196 (92.1%) |
Income Below Poverty Among Married-Couple Families in Wareham Center
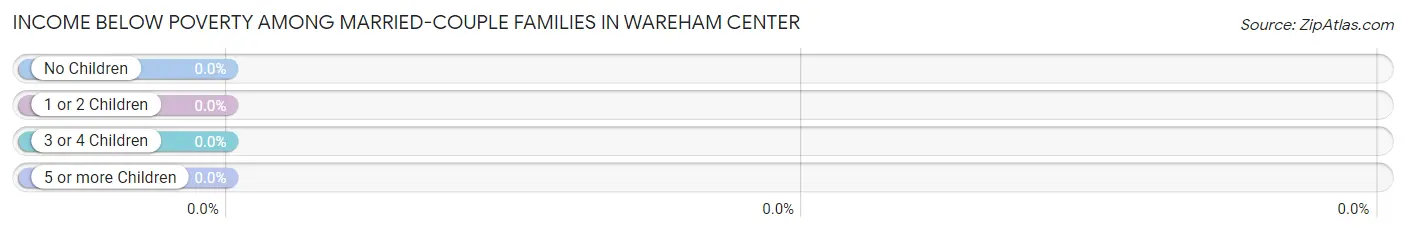
| Children | Above Poverty | Below Poverty |
| No Children | 408 (100.0%) | 0 (0.0%) |
| 1 or 2 Children | 47 (100.0%) | 0 (0.0%) |
| 3 or 4 Children | 52 (100.0%) | 0 (0.0%) |
| 5 or more Children | 0 (0.0%) | 0 (0.0%) |
| Total | 507 (100.0%) | 0 (0.0%) |
Income Below Poverty Among Single-Parent Households in Wareham Center
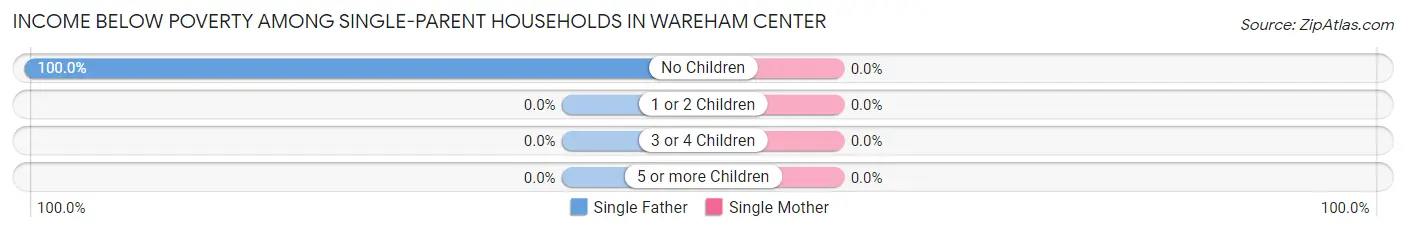
| Children | Single Father | Single Mother |
| No Children | 12 (100.0%) | 0 (0.0%) |
| 1 or 2 Children | 0 (0.0%) | 0 (0.0%) |
| 3 or 4 Children | 0 (0.0%) | 0 (0.0%) |
| 5 or more Children | 0 (0.0%) | 0 (0.0%) |
| Total | 12 (100.0%) | 0 (0.0%) |
Income Below Poverty Among Married-Couple vs Single-Parent Households in Wareham Center
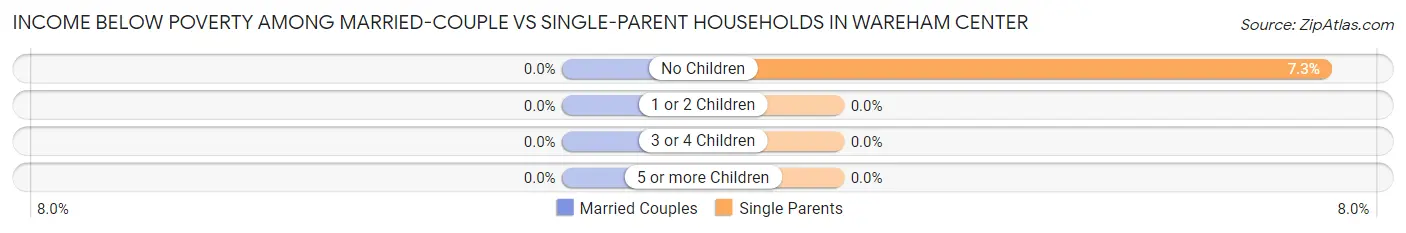
| Children | Married-Couple Families | Single-Parent Households |
| No Children | 0 (0.0%) | 12 (7.3%) |
| 1 or 2 Children | 0 (0.0%) | 0 (0.0%) |
| 3 or 4 Children | 0 (0.0%) | 0 (0.0%) |
| 5 or more Children | 0 (0.0%) | 0 (0.0%) |
| Total | 0 (0.0%) | 12 (4.7%) |
Race in Wareham Center
The most populous races in Wareham Center are White / Caucasian (2,496 | 94.1%), Two or more Races (117 | 4.4%), and Black / African American (24 | 0.9%).
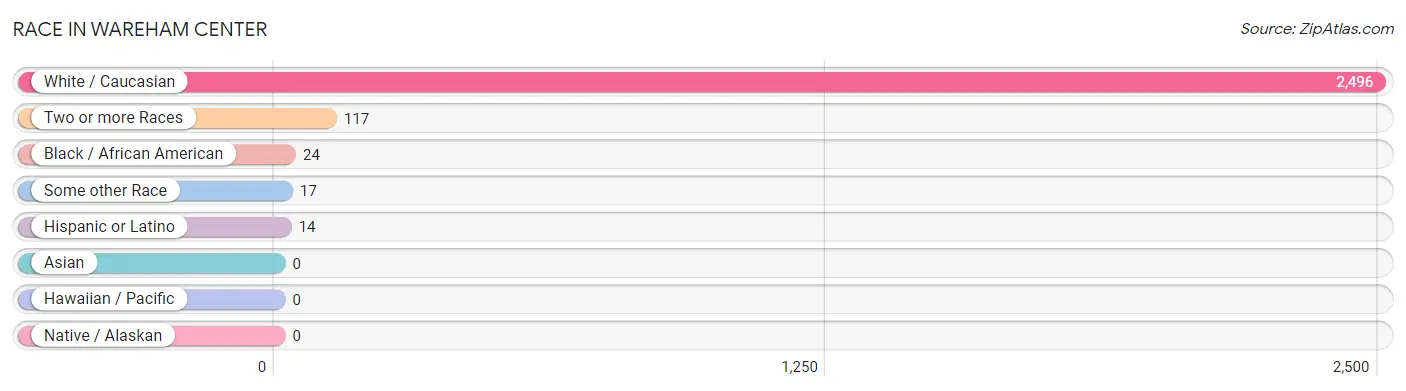
| Race | # Population | % Population |
| Asian | 0 | 0.0% |
| Black / African American | 24 | 0.9% |
| Hawaiian / Pacific | 0 | 0.0% |
| Hispanic or Latino | 14 | 0.5% |
| Native / Alaskan | 0 | 0.0% |
| White / Caucasian | 2,496 | 94.1% |
| Two or more Races | 117 | 4.4% |
| Some other Race | 17 | 0.6% |
| Total | 2,654 | 100.0% |
Ancestry in Wareham Center
The most populous ancestries reported in Wareham Center are Irish (675 | 25.4%), English (582 | 21.9%), Scottish (446 | 16.8%), Portuguese (444 | 16.7%), and French (253 | 9.5%), together accounting for 90.4% of all Wareham Center residents.
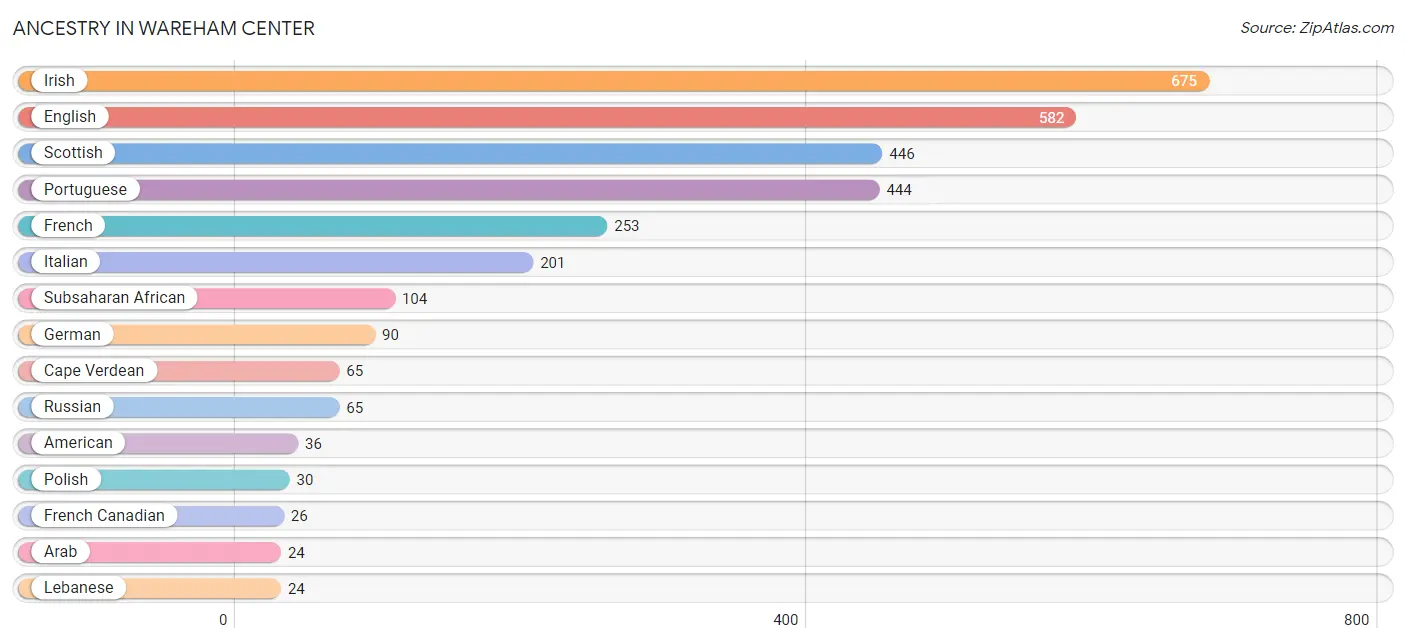
| Ancestry | # Population | % Population |
| American | 36 | 1.4% |
| Arab | 24 | 0.9% |
| Cape Verdean | 65 | 2.5% |
| English | 582 | 21.9% |
| European | 22 | 0.8% |
| French | 253 | 9.5% |
| French Canadian | 26 | 1.0% |
| German | 90 | 3.4% |
| Irish | 675 | 25.4% |
| Italian | 201 | 7.6% |
| Lebanese | 24 | 0.9% |
| Polish | 30 | 1.1% |
| Portuguese | 444 | 16.7% |
| Russian | 65 | 2.5% |
| Scotch-Irish | 15 | 0.6% |
| Scottish | 446 | 16.8% |
| Subsaharan African | 104 | 3.9% |
| Swedish | 16 | 0.6% | View All 18 Rows |
Immigrants in Wareham Center
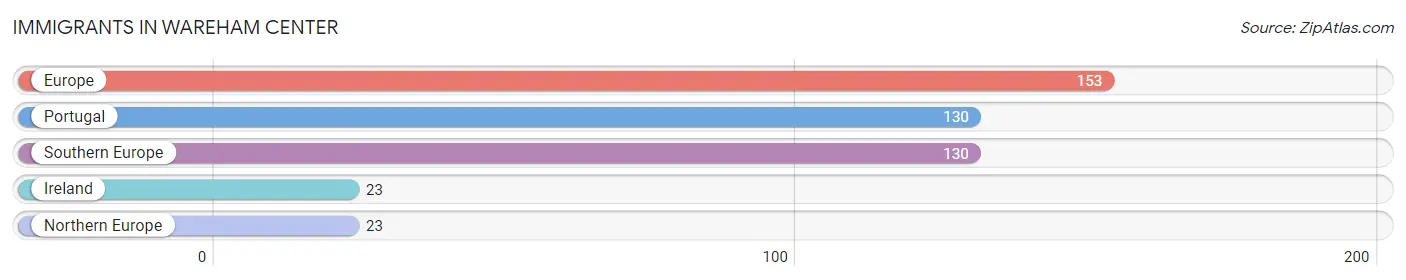
The most numerous immigrant groups reported in Wareham Center came from Europe (153 | 5.8%), Portugal (130 | 4.9%), Southern Europe (130 | 4.9%), Ireland (23 | 0.9%), and Northern Europe (23 | 0.9%), together accounting for 17.3% of all Wareham Center residents.
| Immigration Origin | # Population | % Population |
| Europe | 153 | 5.8% |
| Ireland | 23 | 0.9% |
| Northern Europe | 23 | 0.9% |
| Portugal | 130 | 4.9% |
| Southern Europe | 130 | 4.9% | View All 5 Rows |
Sex and Age in Wareham Center
Sex and Age in Wareham Center
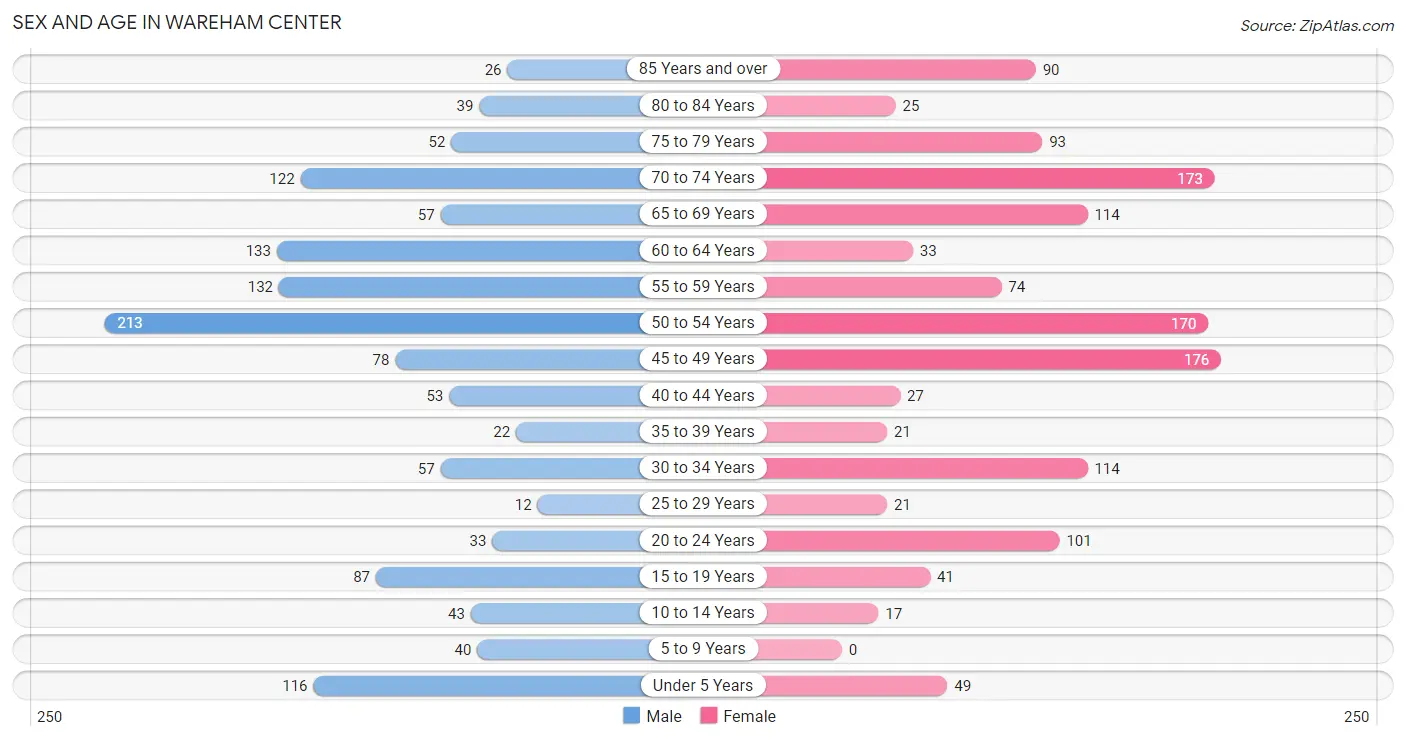
The most populous age groups in Wareham Center are 50 to 54 Years (213 | 16.2%) for men and 45 to 49 Years (176 | 13.1%) for women.
| Age Bracket | Male | Female |
| Under 5 Years | 116 (8.8%) | 49 (3.7%) |
| 5 to 9 Years | 40 (3.0%) | 0 (0.0%) |
| 10 to 14 Years | 43 (3.3%) | 17 (1.3%) |
| 15 to 19 Years | 87 (6.6%) | 41 (3.1%) |
| 20 to 24 Years | 33 (2.5%) | 101 (7.5%) |
| 25 to 29 Years | 12 (0.9%) | 21 (1.6%) |
| 30 to 34 Years | 57 (4.3%) | 114 (8.5%) |
| 35 to 39 Years | 22 (1.7%) | 21 (1.6%) |
| 40 to 44 Years | 53 (4.0%) | 27 (2.0%) |
| 45 to 49 Years | 78 (5.9%) | 176 (13.1%) |
| 50 to 54 Years | 213 (16.2%) | 170 (12.7%) |
| 55 to 59 Years | 132 (10.0%) | 74 (5.5%) |
| 60 to 64 Years | 133 (10.1%) | 33 (2.5%) |
| 65 to 69 Years | 57 (4.3%) | 114 (8.5%) |
| 70 to 74 Years | 122 (9.3%) | 173 (12.9%) |
| 75 to 79 Years | 52 (4.0%) | 93 (7.0%) |
| 80 to 84 Years | 39 (3.0%) | 25 (1.9%) |
| 85 Years and over | 26 (2.0%) | 90 (6.7%) |
| Total | 1,315 (100.0%) | 1,339 (100.0%) |
Families and Households in Wareham Center
Median Family Size in Wareham Center
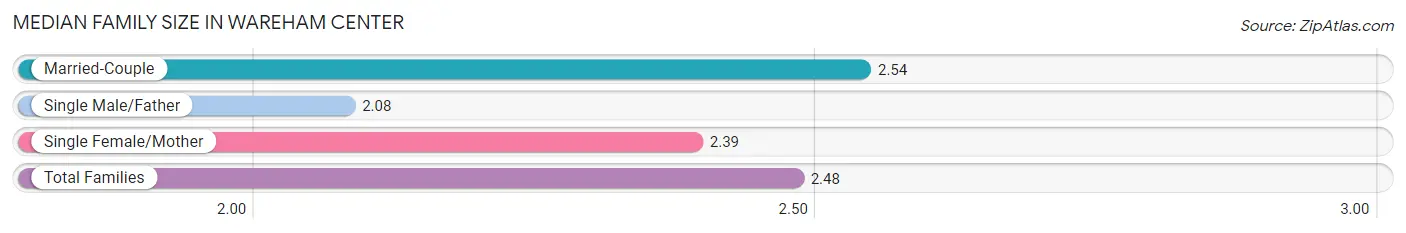
The median family size in Wareham Center is 2.48 persons per family, with married-couple families (507 | 66.5%) accounting for the largest median family size of 2.54 persons per family. On the other hand, single male/father families (12 | 1.6%) represent the smallest median family size with 2.08 persons per family.
| Family Type | # Families | Family Size |
| Married-Couple | 507 (66.5%) | 2.54 |
| Single Male/Father | 12 (1.6%) | 2.08 |
| Single Female/Mother | 243 (31.9%) | 2.39 |
| Total Families | 762 (100.0%) | 2.48 |
Median Household Size in Wareham Center
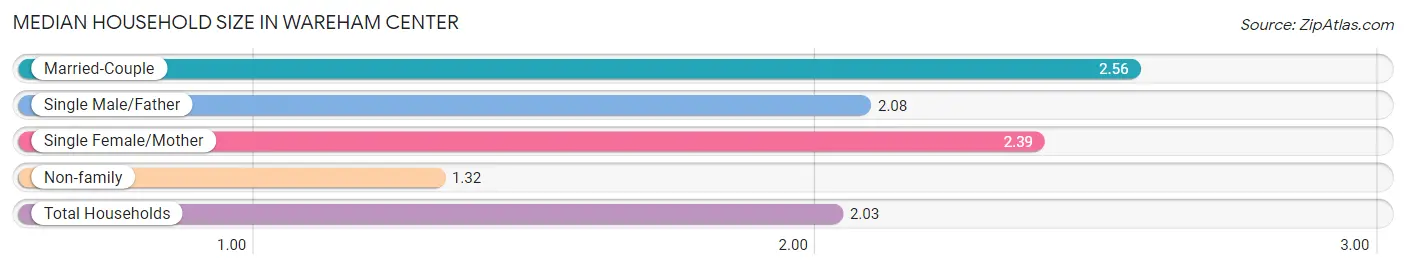
The median household size in Wareham Center is 2.03 persons per household, with married-couple households (507 | 40.1%) accounting for the largest median household size of 2.56 persons per household. non-family households (502 | 39.7%) represent the smallest median household size with 1.32 persons per household.
| Household Type | # Households | Household Size |
| Married-Couple | 507 (40.1%) | 2.56 |
| Single Male/Father | 12 (0.9%) | 2.08 |
| Single Female/Mother | 243 (19.2%) | 2.39 |
| Non-family | 502 (39.7%) | 1.32 |
| Total Households | 1,264 (100.0%) | 2.03 |
Household Size by Marriage Status in Wareham Center
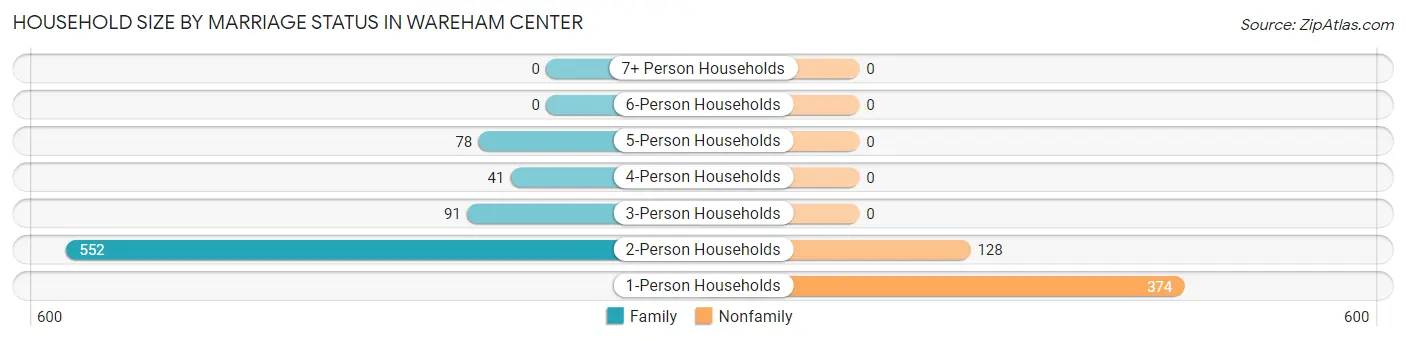
Out of a total of 1,264 households in Wareham Center, 762 (60.3%) are family households, while 502 (39.7%) are nonfamily households. The most numerous type of family households are 2-person households, comprising 552, and the most common type of nonfamily households are 1-person households, comprising 374.
| Household Size | Family Households | Nonfamily Households |
| 1-Person Households | - | 374 (29.6%) |
| 2-Person Households | 552 (43.7%) | 128 (10.1%) |
| 3-Person Households | 91 (7.2%) | 0 (0.0%) |
| 4-Person Households | 41 (3.2%) | 0 (0.0%) |
| 5-Person Households | 78 (6.2%) | 0 (0.0%) |
| 6-Person Households | 0 (0.0%) | 0 (0.0%) |
| 7+ Person Households | 0 (0.0%) | 0 (0.0%) |
| Total | 762 (60.3%) | 502 (39.7%) |
Female Fertility in Wareham Center
Fertility by Age in Wareham Center
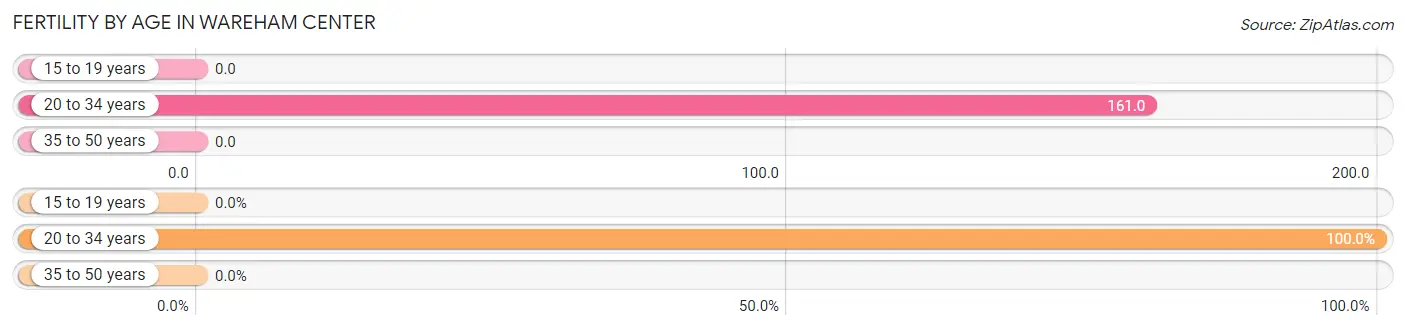
Average fertility rate in Wareham Center is 76.0 births per 1,000 women. Women in the age bracket of 20 to 34 years have the highest fertility rate with 161.0 births per 1,000 women. Women in the age bracket of 20 to 34 years acount for 100.0% of all women with births.
| Age Bracket | Women with Births | Births / 1,000 Women |
| 15 to 19 years | 0 (0.0%) | 0.0 |
| 20 to 34 years | 38 (100.0%) | 161.0 |
| 35 to 50 years | 0 (0.0%) | 0.0 |
| Total | 38 (100.0%) | 76.0 |
Fertility by Age by Marriage Status in Wareham Center
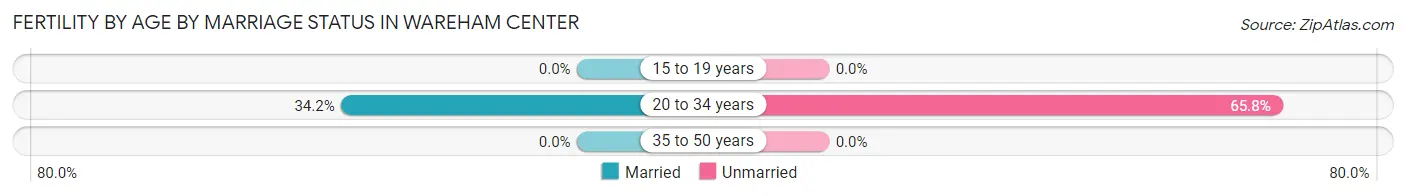
34.2% of women with births (38) in Wareham Center are married. The highest percentage of unmarried women with births falls into 20 to 34 years age bracket with 65.8% of them unmarried at the time of birth, while the lowest percentage of unmarried women with births belong to 20 to 34 years age bracket with 65.8% of them unmarried.
| Age Bracket | Married | Unmarried |
| 15 to 19 years | 0 (0.0%) | 0 (0.0%) |
| 20 to 34 years | 13 (34.2%) | 25 (65.8%) |
| 35 to 50 years | 0 (0.0%) | 0 (0.0%) |
| Total | 13 (34.2%) | 25 (65.8%) |
Fertility by Education in Wareham Center
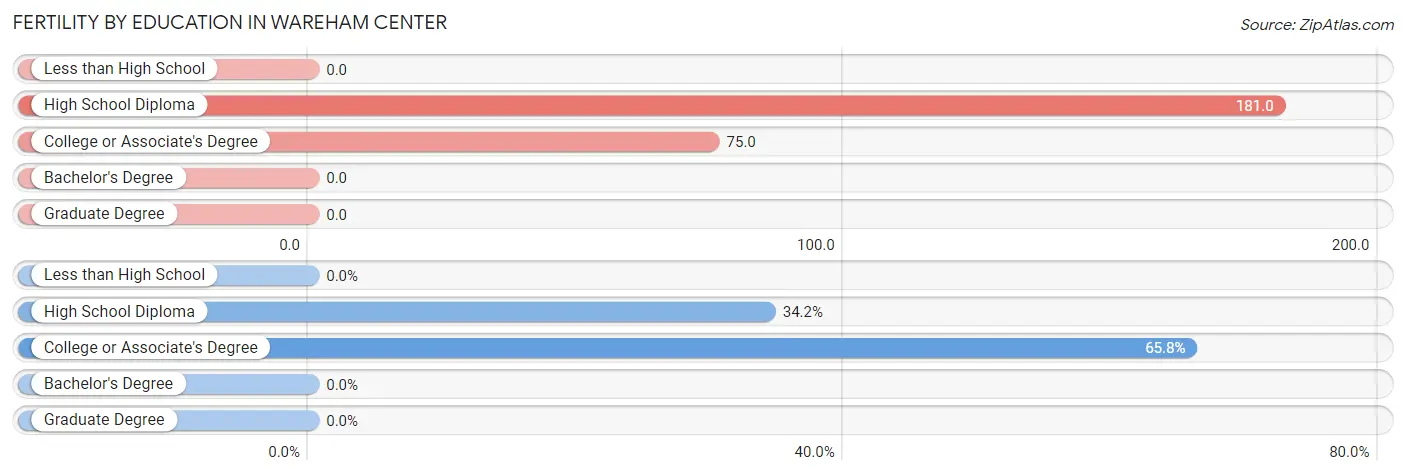
| Educational Attainment | Women with Births | Births / 1,000 Women |
| Less than High School | 0 (0.0%) | 0.0 |
| High School Diploma | 13 (34.2%) | 181.0 |
| College or Associate's Degree | 25 (65.8%) | 75.0 |
| Bachelor's Degree | 0 (0.0%) | 0.0 |
| Graduate Degree | 0 (0.0%) | 0.0 |
| Total | 38 (100.0%) | 76.0 |
Fertility by Education by Marriage Status in Wareham Center
65.8% of women with births in Wareham Center are unmarried. Women with the educational attainment of high school diploma are most likely to be married with 100.0% of them married at childbirth, while women with the educational attainment of college or associate's degree are least likely to be married with 100.0% of them unmarried at childbirth.
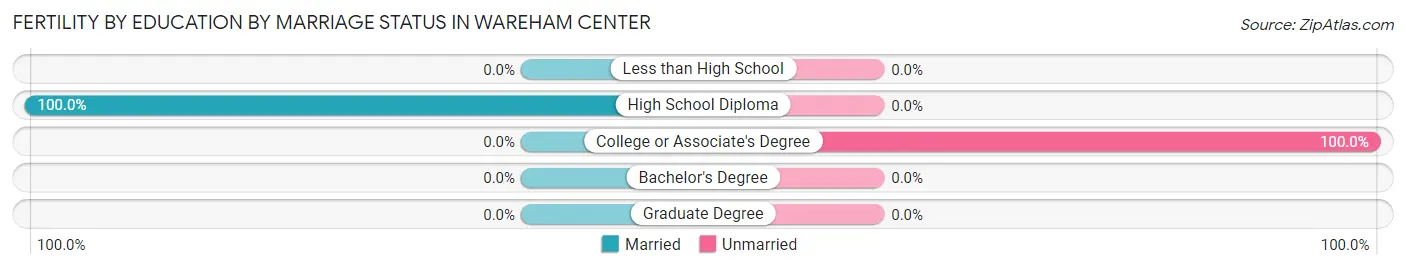
| Educational Attainment | Married | Unmarried |
| Less than High School | 0 (0.0%) | 0 (0.0%) |
| High School Diploma | 13 (100.0%) | 0 (0.0%) |
| College or Associate's Degree | 0 (0.0%) | 25 (100.0%) |
| Bachelor's Degree | 0 (0.0%) | 0 (0.0%) |
| Graduate Degree | 0 (0.0%) | 0 (0.0%) |
| Total | 13 (34.2%) | 25 (65.8%) |
Employment Characteristics in Wareham Center
Employment by Class of Employer in Wareham Center
Among the 1,170 employed individuals in Wareham Center, private company employees (780 | 66.7%), local government employees (181 | 15.5%), and not-for-profit organizations (151 | 12.9%) make up the most common classes of employment.
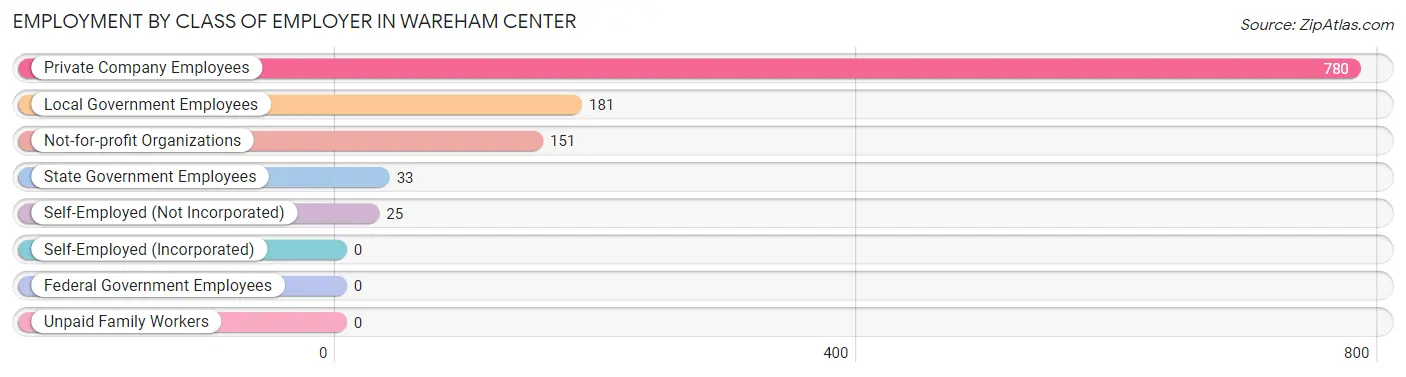
| Employer Class | # Employees | % Employees |
| Private Company Employees | 780 | 66.7% |
| Self-Employed (Incorporated) | 0 | 0.0% |
| Self-Employed (Not Incorporated) | 25 | 2.1% |
| Not-for-profit Organizations | 151 | 12.9% |
| Local Government Employees | 181 | 15.5% |
| State Government Employees | 33 | 2.8% |
| Federal Government Employees | 0 | 0.0% |
| Unpaid Family Workers | 0 | 0.0% |
| Total | 1,170 | 100.0% |
Employment Status by Age in Wareham Center
According to the labor force statistics for Wareham Center, out of the total population over 16 years of age (2,374), 51.8% or 1,230 individuals are in the labor force, with 4.9% or 60 of them unemployed. The age group with the highest labor force participation rate is 20 to 24 years, with 100.0% or 134 individuals in the labor force. Within the labor force, the 20 to 24 years age range has the highest percentage of unemployed individuals, with 18.7% or 25 of them being unemployed.
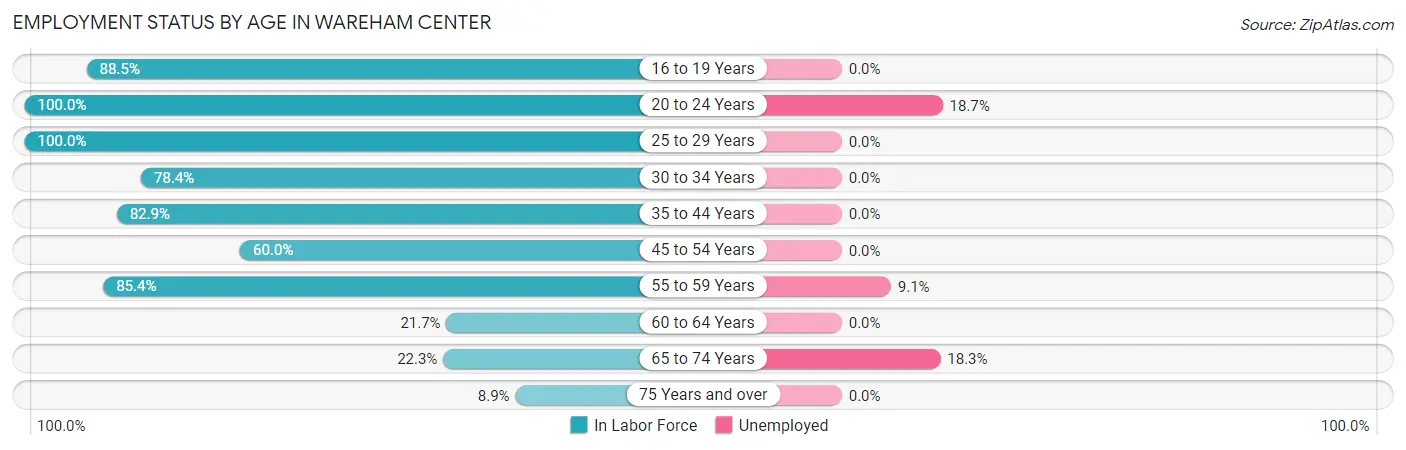
| Age Bracket | In Labor Force | Unemployed |
| 16 to 19 Years | 100 (88.5%) | 0 (0.0%) |
| 20 to 24 Years | 134 (100.0%) | 25 (18.7%) |
| 25 to 29 Years | 33 (100.0%) | 0 (0.0%) |
| 30 to 34 Years | 134 (78.4%) | 0 (0.0%) |
| 35 to 44 Years | 102 (82.9%) | 0 (0.0%) |
| 45 to 54 Years | 382 (60.0%) | 0 (0.0%) |
| 55 to 59 Years | 176 (85.4%) | 16 (9.1%) |
| 60 to 64 Years | 36 (21.7%) | 0 (0.0%) |
| 65 to 74 Years | 104 (22.3%) | 19 (18.3%) |
| 75 Years and over | 29 (8.9%) | 0 (0.0%) |
| Total | 1,230 (51.8%) | 60 (4.9%) |
Employment Status by Educational Attainment in Wareham Center
According to labor force statistics for Wareham Center, 64.6% of individuals (863) out of the total population between 25 and 64 years of age (1,336) are in the labor force, with 1.9% or 16 of them being unemployed. The group with the highest labor force participation rate are those with the educational attainment of bachelor's degree or higher, with 83.4% or 171 individuals in the labor force. Within the labor force, individuals with college / associate degree education have the highest percentage of unemployment, with 3.6% or 16 of them being unemployed.
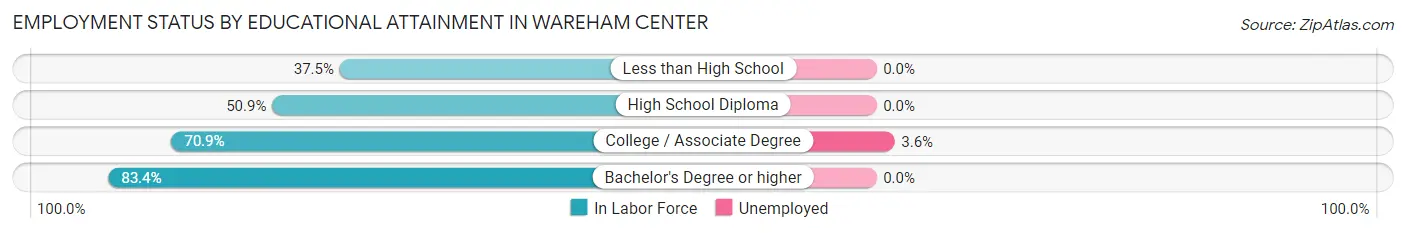
| Educational Attainment | In Labor Force | Unemployed |
| Less than High School | 21 (37.5%) | 0 (0.0%) |
| High School Diploma | 231 (50.9%) | 0 (0.0%) |
| College / Associate Degree | 440 (70.9%) | 22 (3.6%) |
| Bachelor's Degree or higher | 171 (83.4%) | 0 (0.0%) |
| Total | 863 (64.6%) | 25 (1.9%) |
Employment Occupations by Sex in Wareham Center
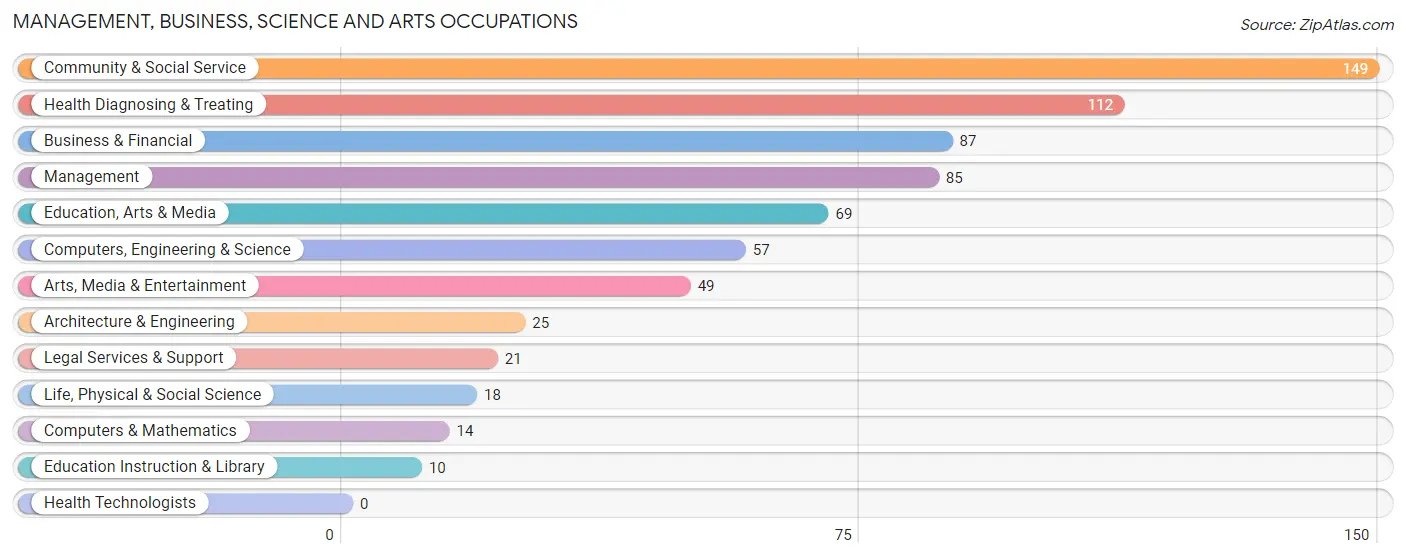
Management, Business, Science and Arts Occupations
The most common Management, Business, Science and Arts occupations in Wareham Center are Community & Social Service (149 | 12.7%), Health Diagnosing & Treating (112 | 9.6%), Business & Financial (87 | 7.4%), Management (85 | 7.3%), and Education, Arts & Media (69 | 5.9%).
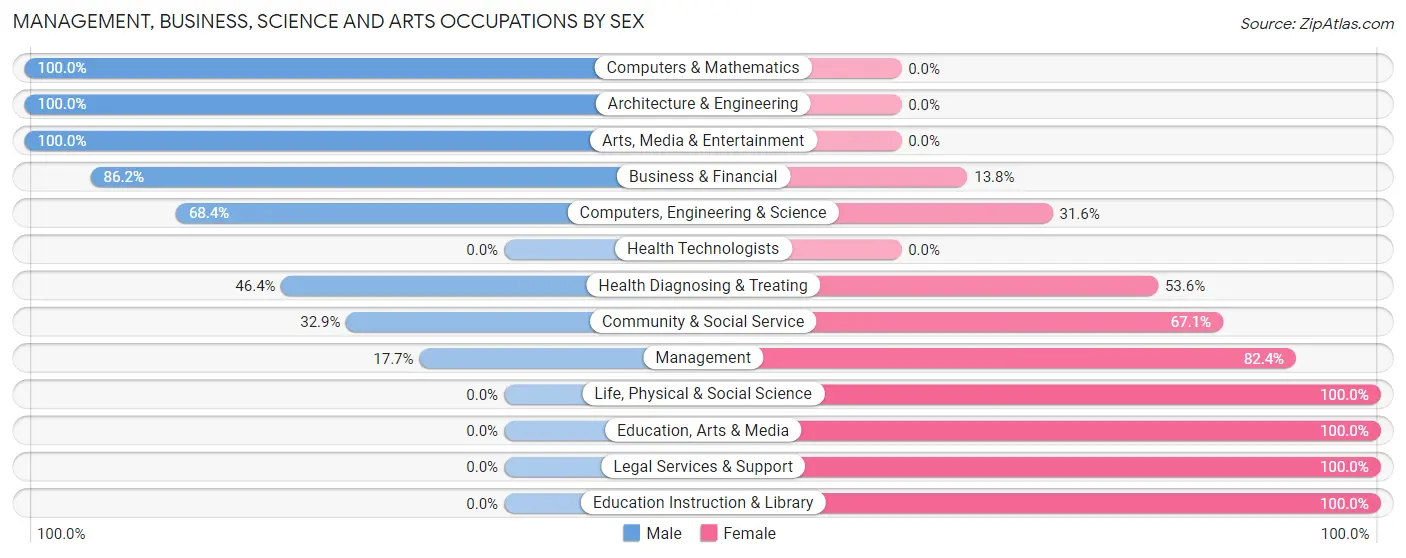
Management, Business, Science and Arts Occupations by Sex
Within the Management, Business, Science and Arts occupations in Wareham Center, the most male-oriented occupations are Computers & Mathematics (100.0%), Architecture & Engineering (100.0%), and Arts, Media & Entertainment (100.0%), while the most female-oriented occupations are Life, Physical & Social Science (100.0%), Education, Arts & Media (100.0%), and Legal Services & Support (100.0%).
| Occupation | Male | Female |
| Management | 15 (17.6%) | 70 (82.4%) |
| Business & Financial | 75 (86.2%) | 12 (13.8%) |
| Computers, Engineering & Science | 39 (68.4%) | 18 (31.6%) |
| Computers & Mathematics | 14 (100.0%) | 0 (0.0%) |
| Architecture & Engineering | 25 (100.0%) | 0 (0.0%) |
| Life, Physical & Social Science | 0 (0.0%) | 18 (100.0%) |
| Community & Social Service | 49 (32.9%) | 100 (67.1%) |
| Education, Arts & Media | 0 (0.0%) | 69 (100.0%) |
| Legal Services & Support | 0 (0.0%) | 21 (100.0%) |
| Education Instruction & Library | 0 (0.0%) | 10 (100.0%) |
| Arts, Media & Entertainment | 49 (100.0%) | 0 (0.0%) |
| Health Diagnosing & Treating | 52 (46.4%) | 60 (53.6%) |
| Health Technologists | 0 (0.0%) | 0 (0.0%) |
| Total (Category) | 230 (46.9%) | 260 (53.1%) |
| Total (Overall) | 631 (53.9%) | 539 (46.1%) |
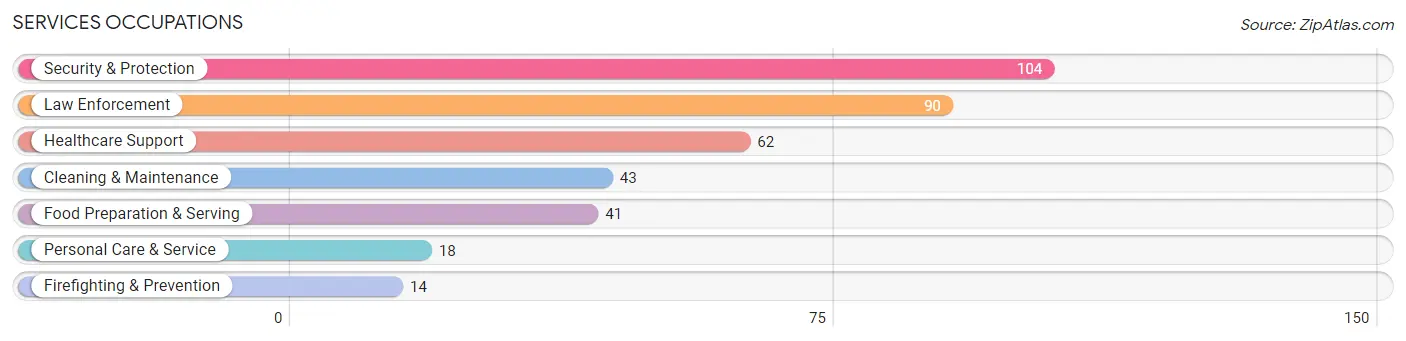
Services Occupations
The most common Services occupations in Wareham Center are Security & Protection (104 | 8.9%), Law Enforcement (90 | 7.7%), Healthcare Support (62 | 5.3%), Cleaning & Maintenance (43 | 3.7%), and Food Preparation & Serving (41 | 3.5%).
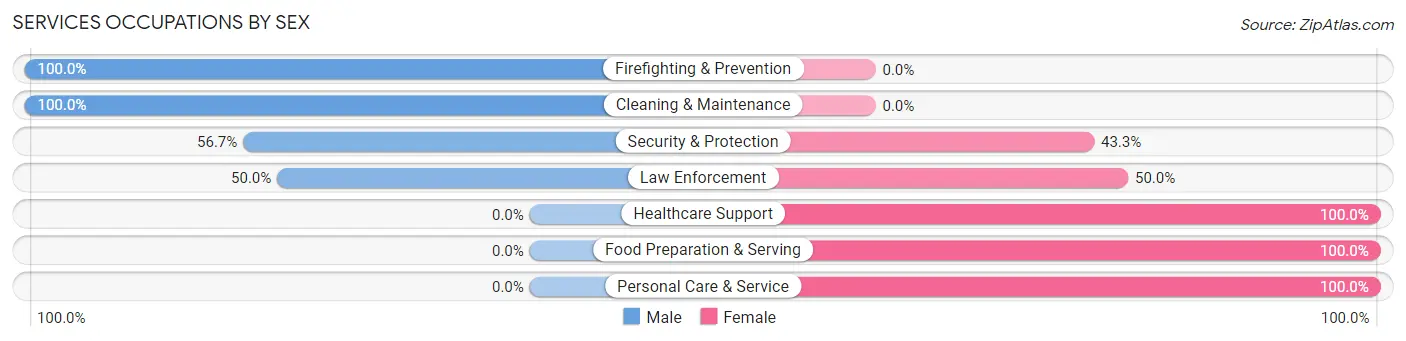
Services Occupations by Sex
Within the Services occupations in Wareham Center, the most male-oriented occupations are Firefighting & Prevention (100.0%), Cleaning & Maintenance (100.0%), and Security & Protection (56.7%), while the most female-oriented occupations are Healthcare Support (100.0%), Food Preparation & Serving (100.0%), and Personal Care & Service (100.0%).
| Occupation | Male | Female |
| Healthcare Support | 0 (0.0%) | 62 (100.0%) |
| Security & Protection | 59 (56.7%) | 45 (43.3%) |
| Firefighting & Prevention | 14 (100.0%) | 0 (0.0%) |
| Law Enforcement | 45 (50.0%) | 45 (50.0%) |
| Food Preparation & Serving | 0 (0.0%) | 41 (100.0%) |
| Cleaning & Maintenance | 43 (100.0%) | 0 (0.0%) |
| Personal Care & Service | 0 (0.0%) | 18 (100.0%) |
| Total (Category) | 102 (38.1%) | 166 (61.9%) |
| Total (Overall) | 631 (53.9%) | 539 (46.1%) |
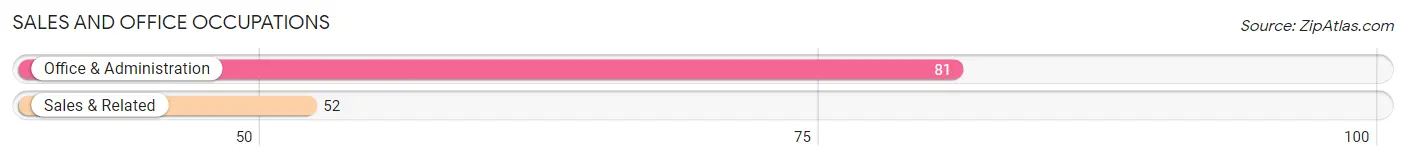
Sales and Office Occupations
The most common Sales and Office occupations in Wareham Center are Office & Administration (81 | 6.9%), and Sales & Related (52 | 4.4%).
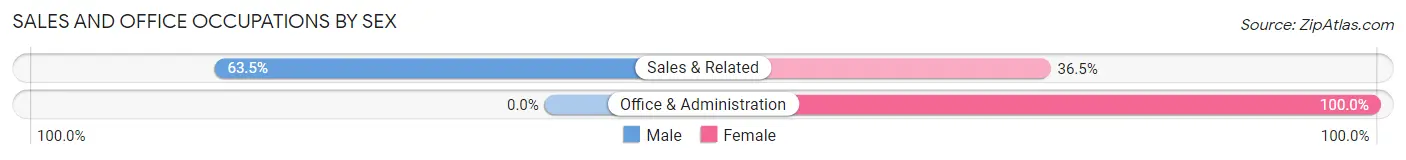
Sales and Office Occupations by Sex
| Occupation | Male | Female |
| Sales & Related | 33 (63.5%) | 19 (36.5%) |
| Office & Administration | 0 (0.0%) | 81 (100.0%) |
| Total (Category) | 33 (24.8%) | 100 (75.2%) |
| Total (Overall) | 631 (53.9%) | 539 (46.1%) |
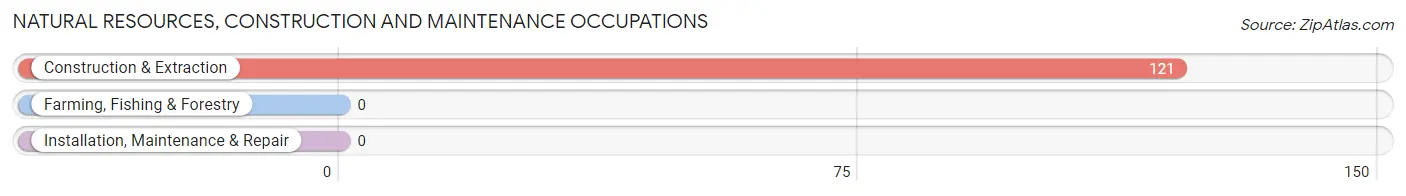
Natural Resources, Construction and Maintenance Occupations
The most common Natural Resources, Construction and Maintenance occupations in Wareham Center are , and Construction & Extraction (121 | 10.3%).
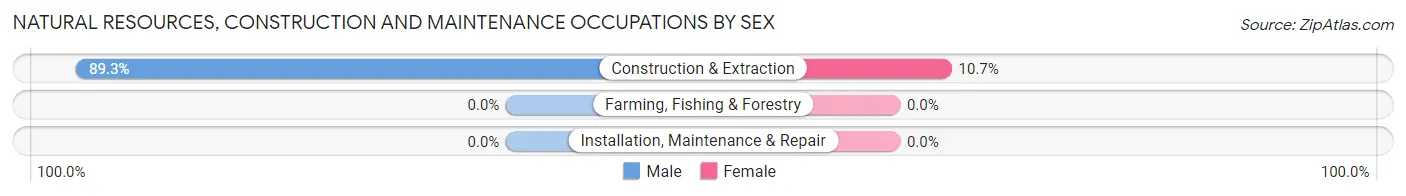
Natural Resources, Construction and Maintenance Occupations by Sex
| Occupation | Male | Female |
| Farming, Fishing & Forestry | 0 (0.0%) | 0 (0.0%) |
| Construction & Extraction | 108 (89.3%) | 13 (10.7%) |
| Installation, Maintenance & Repair | 0 (0.0%) | 0 (0.0%) |
| Total (Category) | 108 (89.3%) | 13 (10.7%) |
| Total (Overall) | 631 (53.9%) | 539 (46.1%) |
Production, Transportation and Moving Occupations
The most common Production, Transportation and Moving occupations in Wareham Center are Material Moving (96 | 8.2%), Production (47 | 4.0%), and Transportation (15 | 1.3%).
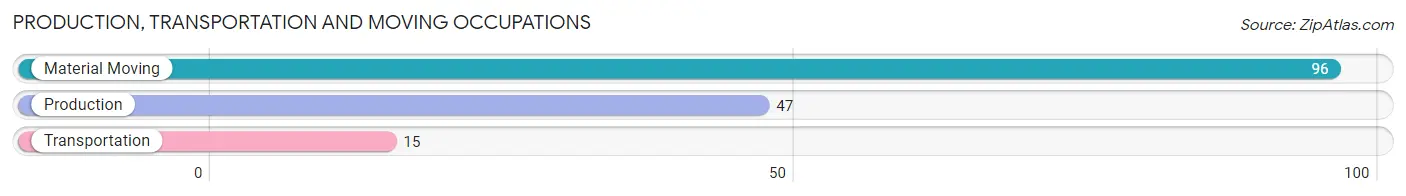
Production, Transportation and Moving Occupations by Sex
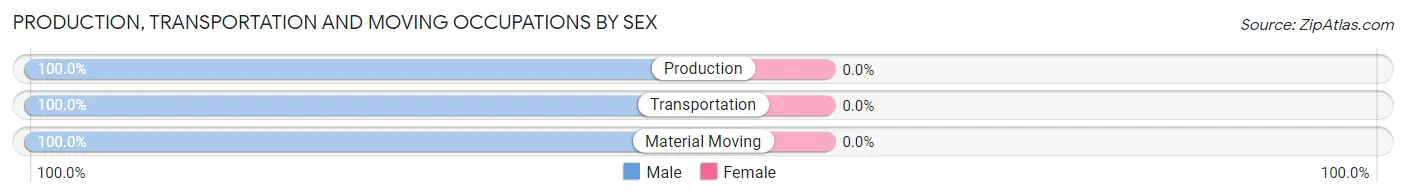
| Occupation | Male | Female |
| Production | 47 (100.0%) | 0 (0.0%) |
| Transportation | 15 (100.0%) | 0 (0.0%) |
| Material Moving | 96 (100.0%) | 0 (0.0%) |
| Total (Category) | 158 (100.0%) | 0 (0.0%) |
| Total (Overall) | 631 (53.9%) | 539 (46.1%) |
Employment Industries by Sex in Wareham Center
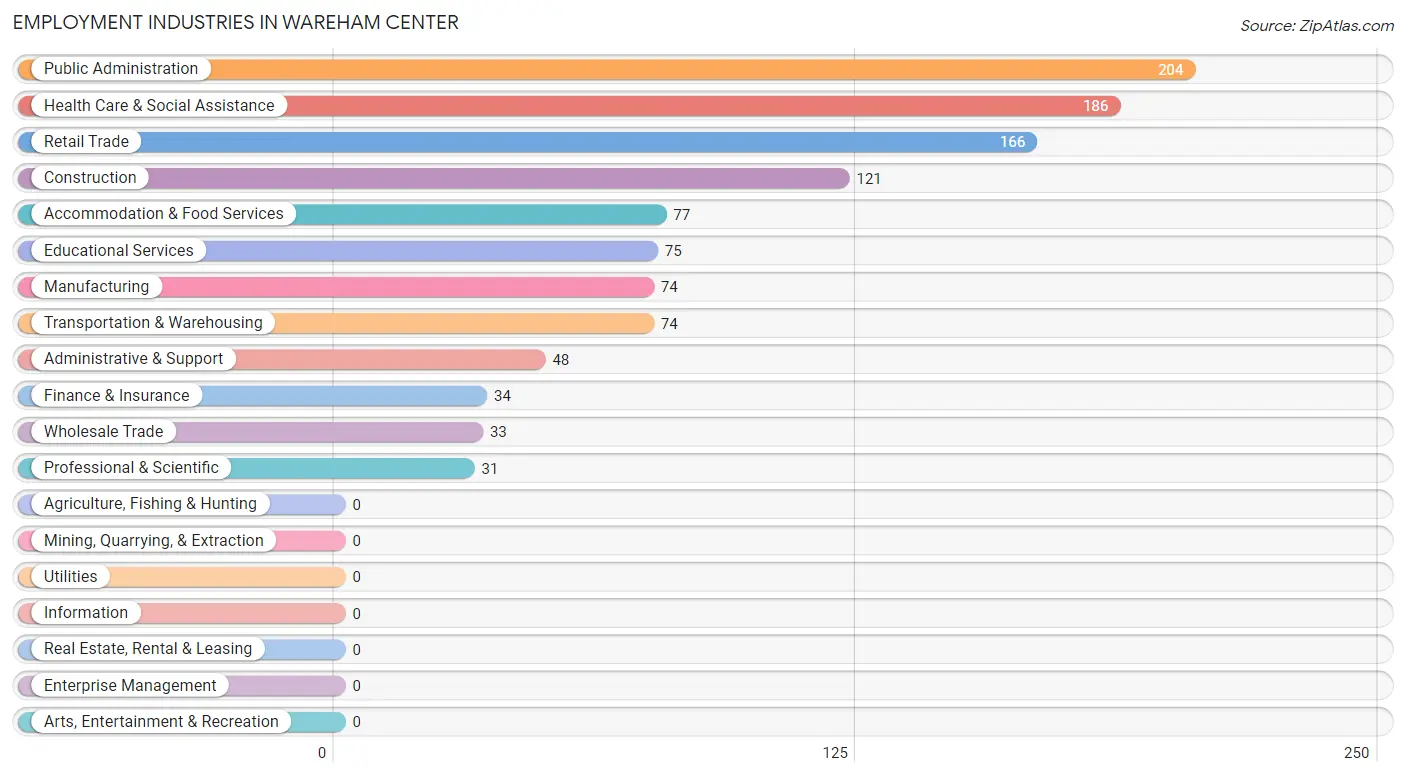
Employment Industries in Wareham Center
The major employment industries in Wareham Center include Public Administration (204 | 17.4%), Health Care & Social Assistance (186 | 15.9%), Retail Trade (166 | 14.2%), Construction (121 | 10.3%), and Accommodation & Food Services (77 | 6.6%).
Employment Industries by Sex in Wareham Center
The Wareham Center industries that see more men than women are Transportation & Warehousing (100.0%), Construction (89.3%), and Educational Services (86.7%), whereas the industries that tend to have a higher number of women are Wholesale Trade (100.0%), Finance & Insurance (100.0%), and Professional & Scientific (100.0%).
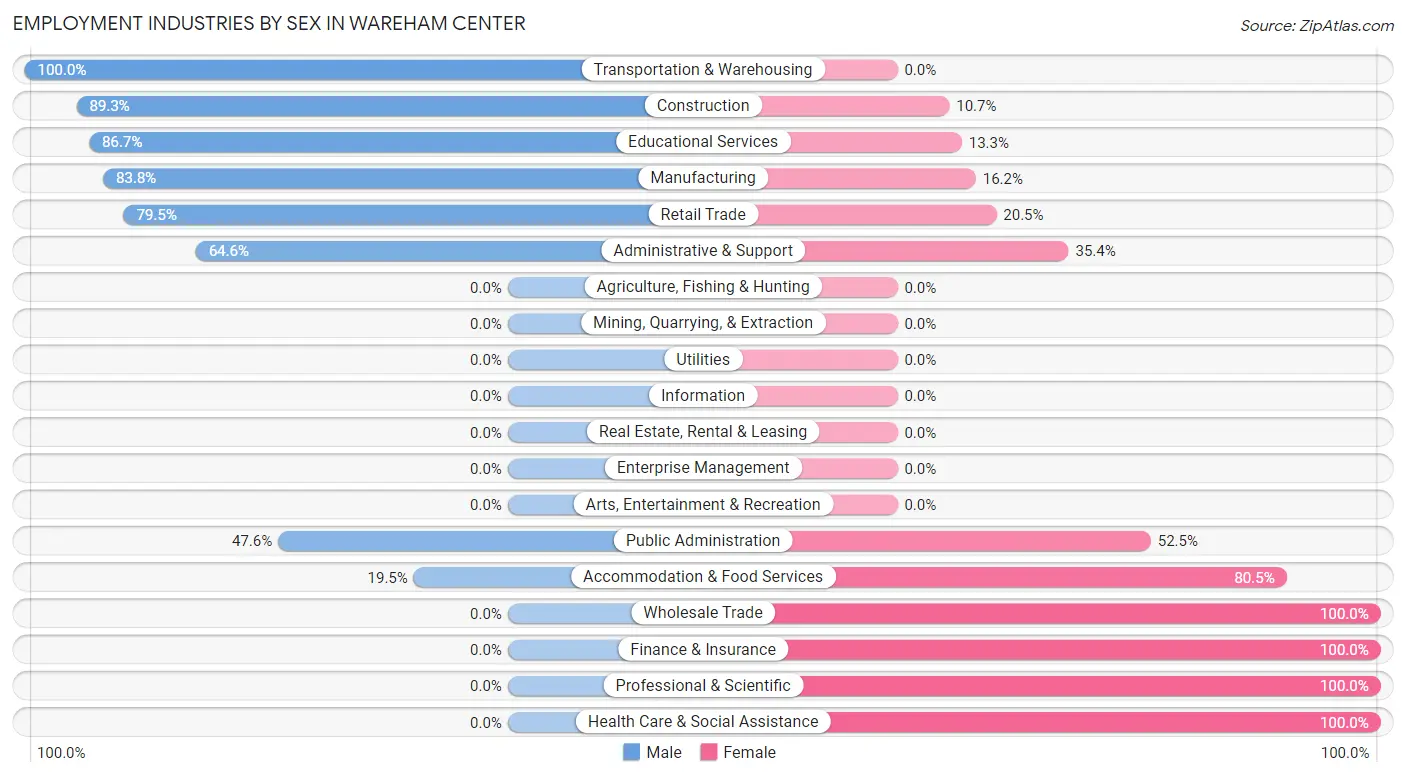
| Industry | Male | Female |
| Agriculture, Fishing & Hunting | 0 (0.0%) | 0 (0.0%) |
| Mining, Quarrying, & Extraction | 0 (0.0%) | 0 (0.0%) |
| Construction | 108 (89.3%) | 13 (10.7%) |
| Manufacturing | 62 (83.8%) | 12 (16.2%) |
| Wholesale Trade | 0 (0.0%) | 33 (100.0%) |
| Retail Trade | 132 (79.5%) | 34 (20.5%) |
| Transportation & Warehousing | 74 (100.0%) | 0 (0.0%) |
| Utilities | 0 (0.0%) | 0 (0.0%) |
| Information | 0 (0.0%) | 0 (0.0%) |
| Finance & Insurance | 0 (0.0%) | 34 (100.0%) |
| Real Estate, Rental & Leasing | 0 (0.0%) | 0 (0.0%) |
| Professional & Scientific | 0 (0.0%) | 31 (100.0%) |
| Enterprise Management | 0 (0.0%) | 0 (0.0%) |
| Administrative & Support | 31 (64.6%) | 17 (35.4%) |
| Educational Services | 65 (86.7%) | 10 (13.3%) |
| Health Care & Social Assistance | 0 (0.0%) | 186 (100.0%) |
| Arts, Entertainment & Recreation | 0 (0.0%) | 0 (0.0%) |
| Accommodation & Food Services | 15 (19.5%) | 62 (80.5%) |
| Public Administration | 97 (47.5%) | 107 (52.4%) |
| Total | 631 (53.9%) | 539 (46.1%) |
Education in Wareham Center
School Enrollment in Wareham Center
The most common levels of schooling among the 365 students in Wareham Center are college / undergraduate (159 | 43.6%), high school (93 | 25.5%), and middle school (43 | 11.8%).
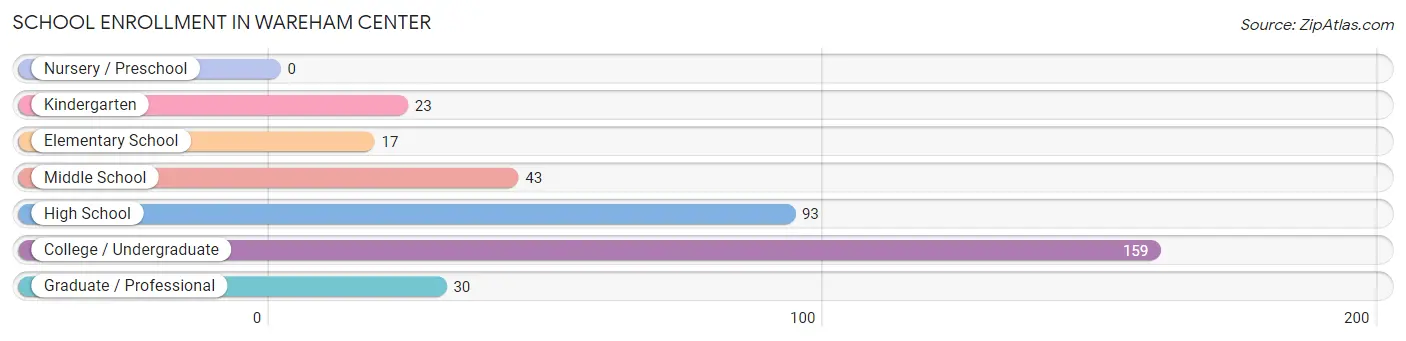
| School Level | # Students | % Students |
| Nursery / Preschool | 0 | 0.0% |
| Kindergarten | 23 | 6.3% |
| Elementary School | 17 | 4.7% |
| Middle School | 43 | 11.8% |
| High School | 93 | 25.5% |
| College / Undergraduate | 159 | 43.6% |
| Graduate / Professional | 30 | 8.2% |
| Total | 365 | 100.0% |
School Enrollment by Age by Funding Source in Wareham Center
Out of a total of 365 students who are enrolled in schools in Wareham Center, 91 (24.9%) attend a private institution, while the remaining 274 (75.1%) are enrolled in public schools. The age group of 20 to 24 year olds has the highest likelihood of being enrolled in private schools, with 77 (64.2% in the age bracket) enrolled. Conversely, the age group of 5 to 9 year old has the lowest likelihood of being enrolled in a private school, with 40 (100.0% in the age bracket) attending a public institution.
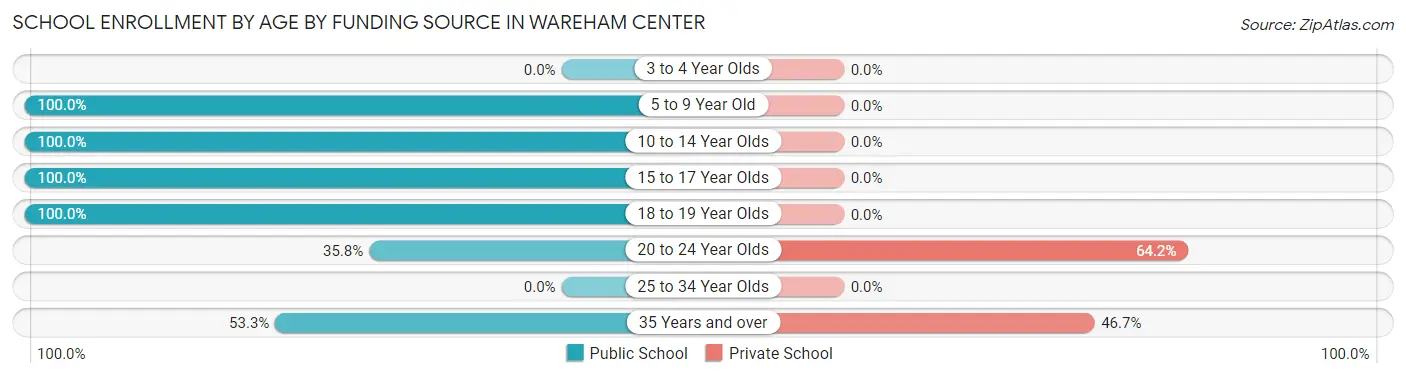
| Age Bracket | Public School | Private School |
| 3 to 4 Year Olds | 0 (0.0%) | 0 (0.0%) |
| 5 to 9 Year Old | 40 (100.0%) | 0 (0.0%) |
| 10 to 14 Year Olds | 60 (100.0%) | 0 (0.0%) |
| 15 to 17 Year Olds | 29 (100.0%) | 0 (0.0%) |
| 18 to 19 Year Olds | 86 (100.0%) | 0 (0.0%) |
| 20 to 24 Year Olds | 43 (35.8%) | 77 (64.2%) |
| 25 to 34 Year Olds | 0 (0.0%) | 0 (0.0%) |
| 35 Years and over | 16 (53.3%) | 14 (46.7%) |
| Total | 274 (75.1%) | 91 (24.9%) |
Educational Attainment by Field of Study in Wareham Center
Education (188 | 38.4%), business (85 | 17.3%), communications (74 | 15.1%), social sciences (45 | 9.2%), and arts & humanities (38 | 7.8%) are the most common fields of study among 490 individuals in Wareham Center who have obtained a bachelor's degree or higher.
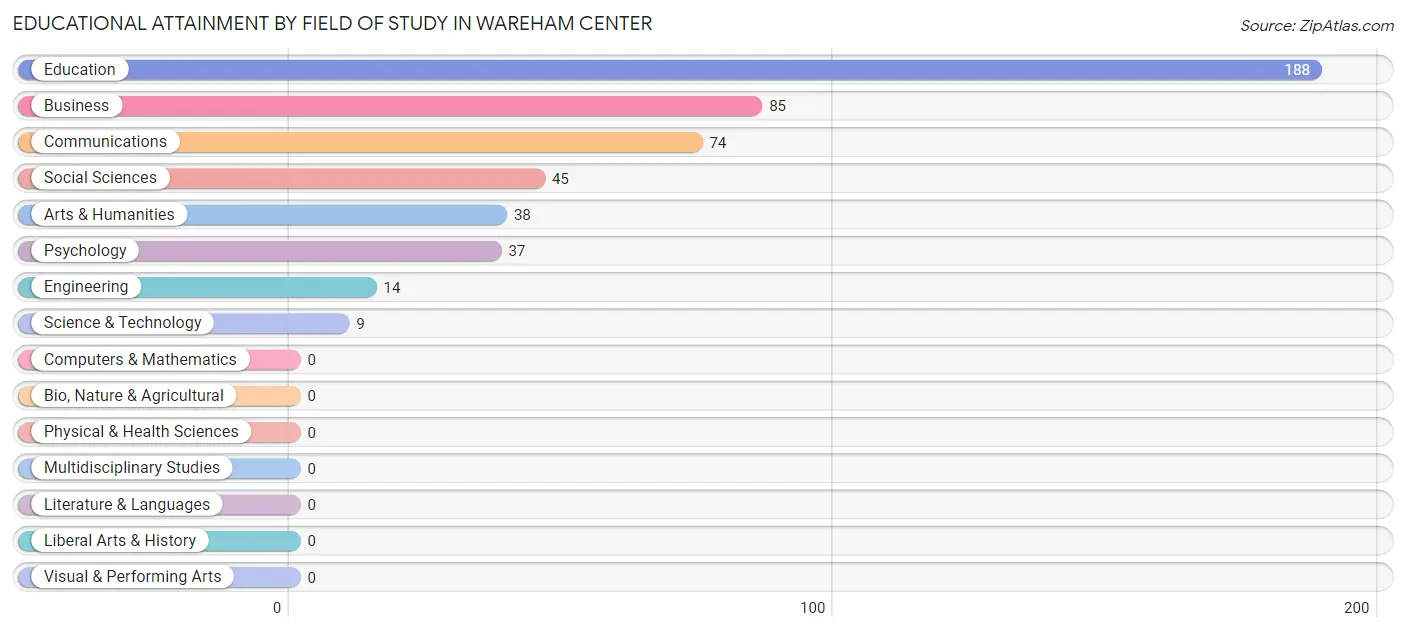
| Field of Study | # Graduates | % Graduates |
| Computers & Mathematics | 0 | 0.0% |
| Bio, Nature & Agricultural | 0 | 0.0% |
| Physical & Health Sciences | 0 | 0.0% |
| Psychology | 37 | 7.5% |
| Social Sciences | 45 | 9.2% |
| Engineering | 14 | 2.9% |
| Multidisciplinary Studies | 0 | 0.0% |
| Science & Technology | 9 | 1.8% |
| Business | 85 | 17.3% |
| Education | 188 | 38.4% |
| Literature & Languages | 0 | 0.0% |
| Liberal Arts & History | 0 | 0.0% |
| Visual & Performing Arts | 0 | 0.0% |
| Communications | 74 | 15.1% |
| Arts & Humanities | 38 | 7.8% |
| Total | 490 | 100.0% |
Transportation & Commute in Wareham Center
Vehicle Availability by Sex in Wareham Center
The most prevalent vehicle ownership categories in Wareham Center are males with 2 vehicles (280, accounting for 44.7%) and females with 2 vehicles (237, making up 51.9%).
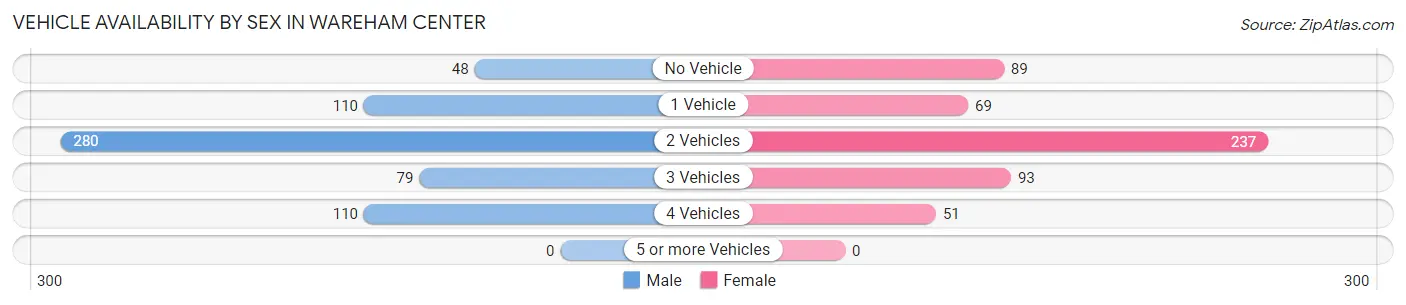
| Vehicles Available | Male | Female |
| No Vehicle | 48 (7.7%) | 89 (16.5%) |
| 1 Vehicle | 110 (17.5%) | 69 (12.8%) |
| 2 Vehicles | 280 (44.7%) | 237 (44.0%) |
| 3 Vehicles | 79 (12.6%) | 93 (17.2%) |
| 4 Vehicles | 110 (17.5%) | 51 (9.5%) |
| 5 or more Vehicles | 0 (0.0%) | 0 (0.0%) |
| Total | 627 (100.0%) | 539 (100.0%) |
Commute Time in Wareham Center
The most frequently occuring commute durations in Wareham Center are 5 to 9 minutes (294 commuters, 30.5%), 30 to 34 minutes (168 commuters, 17.4%), and 60 to 89 minutes (122 commuters, 12.7%).
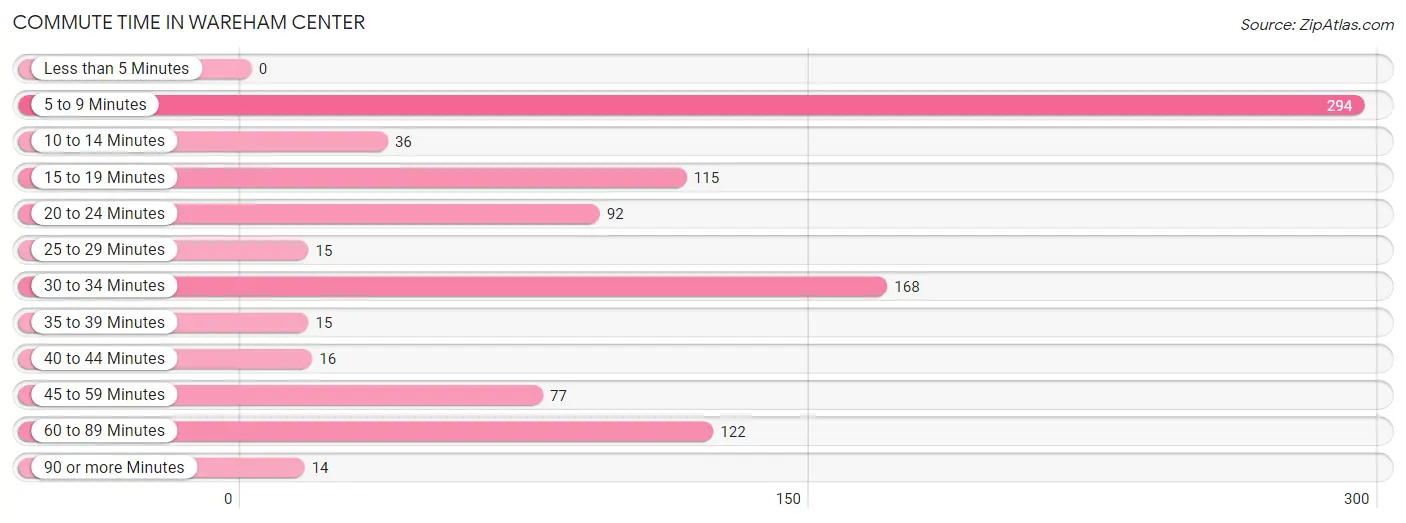
| Commute Time | # Commuters | % Commuters |
| Less than 5 Minutes | 0 | 0.0% |
| 5 to 9 Minutes | 294 | 30.5% |
| 10 to 14 Minutes | 36 | 3.7% |
| 15 to 19 Minutes | 115 | 11.9% |
| 20 to 24 Minutes | 92 | 9.5% |
| 25 to 29 Minutes | 15 | 1.6% |
| 30 to 34 Minutes | 168 | 17.4% |
| 35 to 39 Minutes | 15 | 1.6% |
| 40 to 44 Minutes | 16 | 1.7% |
| 45 to 59 Minutes | 77 | 8.0% |
| 60 to 89 Minutes | 122 | 12.7% |
| 90 or more Minutes | 14 | 1.5% |
Commute Time by Sex in Wareham Center
The most common commute times in Wareham Center are 5 to 9 minutes (182 commuters, 32.8%) for males and 5 to 9 minutes (112 commuters, 27.4%) for females.
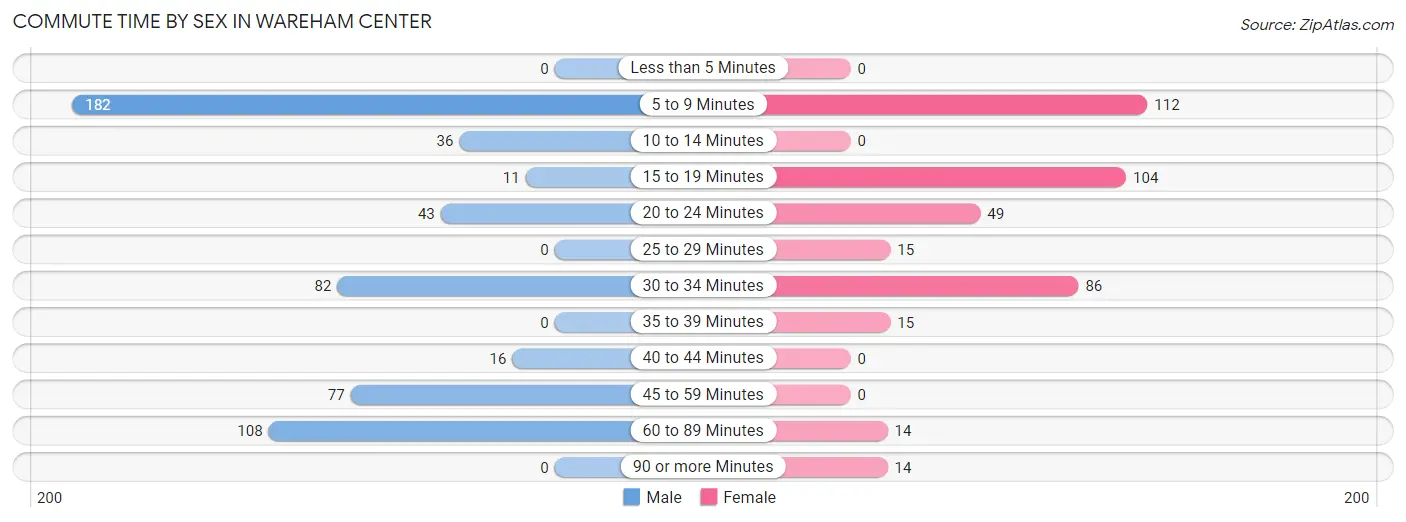
| Commute Time | Male | Female |
| Less than 5 Minutes | 0 (0.0%) | 0 (0.0%) |
| 5 to 9 Minutes | 182 (32.8%) | 112 (27.4%) |
| 10 to 14 Minutes | 36 (6.5%) | 0 (0.0%) |
| 15 to 19 Minutes | 11 (2.0%) | 104 (25.4%) |
| 20 to 24 Minutes | 43 (7.7%) | 49 (12.0%) |
| 25 to 29 Minutes | 0 (0.0%) | 15 (3.7%) |
| 30 to 34 Minutes | 82 (14.8%) | 86 (21.0%) |
| 35 to 39 Minutes | 0 (0.0%) | 15 (3.7%) |
| 40 to 44 Minutes | 16 (2.9%) | 0 (0.0%) |
| 45 to 59 Minutes | 77 (13.9%) | 0 (0.0%) |
| 60 to 89 Minutes | 108 (19.5%) | 14 (3.4%) |
| 90 or more Minutes | 0 (0.0%) | 14 (3.4%) |
Time of Departure to Work by Sex in Wareham Center
The most frequent times of departure to work in Wareham Center are 6:00 AM to 6:29 AM (348, 62.7%) for males and 4:00 PM to 11:59 PM (87, 21.3%) for females.
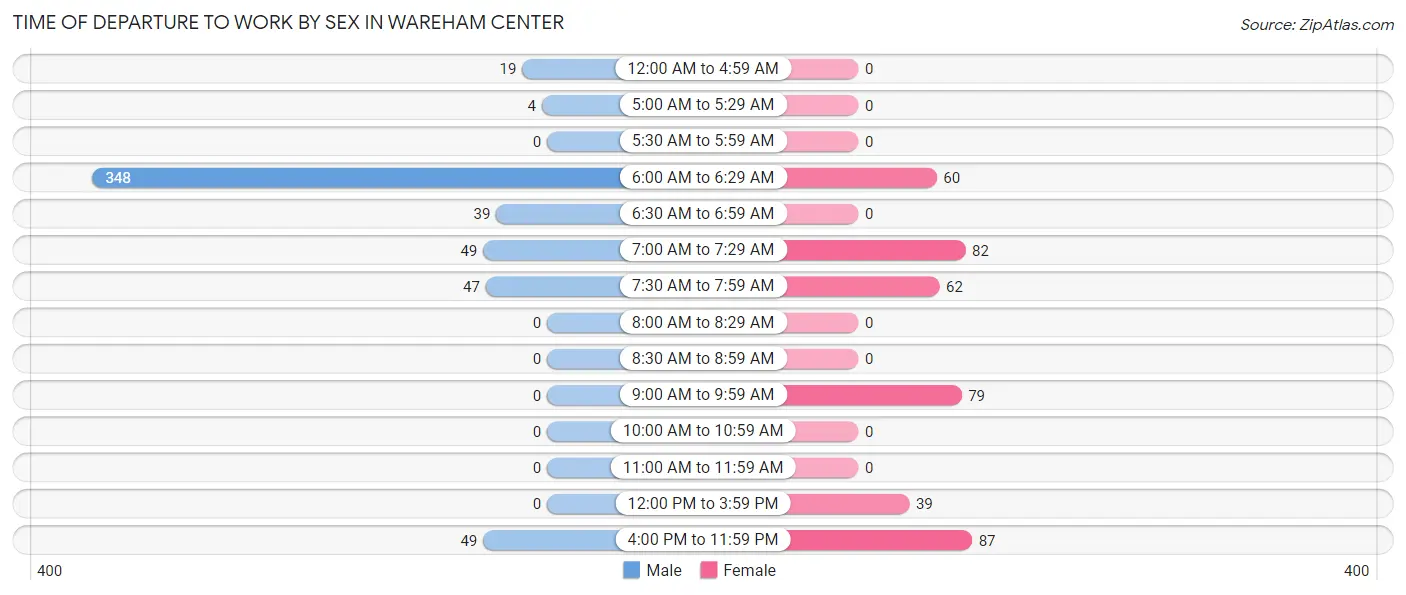
| Time of Departure | Male | Female |
| 12:00 AM to 4:59 AM | 19 (3.4%) | 0 (0.0%) |
| 5:00 AM to 5:29 AM | 4 (0.7%) | 0 (0.0%) |
| 5:30 AM to 5:59 AM | 0 (0.0%) | 0 (0.0%) |
| 6:00 AM to 6:29 AM | 348 (62.7%) | 60 (14.7%) |
| 6:30 AM to 6:59 AM | 39 (7.0%) | 0 (0.0%) |
| 7:00 AM to 7:29 AM | 49 (8.8%) | 82 (20.1%) |
| 7:30 AM to 7:59 AM | 47 (8.5%) | 62 (15.2%) |
| 8:00 AM to 8:29 AM | 0 (0.0%) | 0 (0.0%) |
| 8:30 AM to 8:59 AM | 0 (0.0%) | 0 (0.0%) |
| 9:00 AM to 9:59 AM | 0 (0.0%) | 79 (19.3%) |
| 10:00 AM to 10:59 AM | 0 (0.0%) | 0 (0.0%) |
| 11:00 AM to 11:59 AM | 0 (0.0%) | 0 (0.0%) |
| 12:00 PM to 3:59 PM | 0 (0.0%) | 39 (9.5%) |
| 4:00 PM to 11:59 PM | 49 (8.8%) | 87 (21.3%) |
| Total | 555 (100.0%) | 409 (100.0%) |
Housing Occupancy in Wareham Center
Occupancy by Ownership in Wareham Center
Of the total 1,264 dwellings in Wareham Center, owner-occupied units account for 848 (67.1%), while renter-occupied units make up 416 (32.9%).
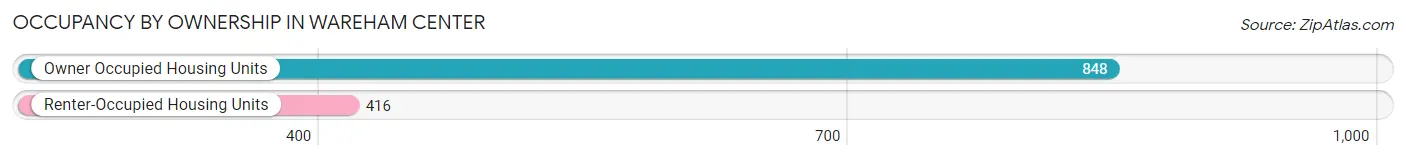
| Occupancy | # Housing Units | % Housing Units |
| Owner Occupied Housing Units | 848 | 67.1% |
| Renter-Occupied Housing Units | 416 | 32.9% |
| Total Occupied Housing Units | 1,264 | 100.0% |
Occupancy by Household Size in Wareham Center
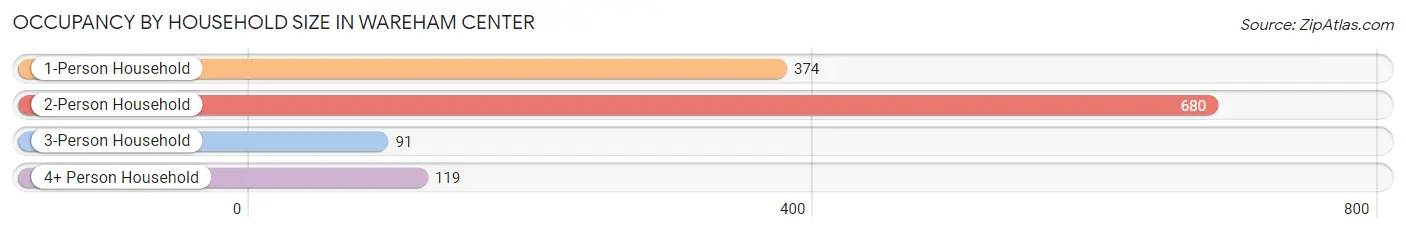
| Household Size | # Housing Units | % Housing Units |
| 1-Person Household | 374 | 29.6% |
| 2-Person Household | 680 | 53.8% |
| 3-Person Household | 91 | 7.2% |
| 4+ Person Household | 119 | 9.4% |
| Total Housing Units | 1,264 | 100.0% |
Occupancy by Ownership by Household Size in Wareham Center
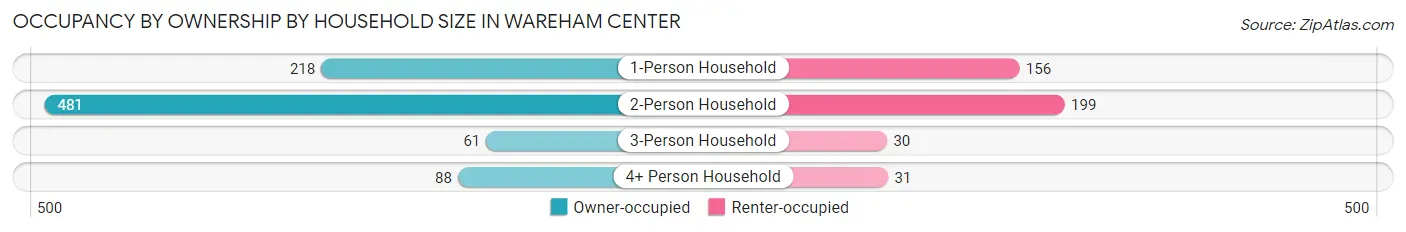
| Household Size | Owner-occupied | Renter-occupied |
| 1-Person Household | 218 (58.3%) | 156 (41.7%) |
| 2-Person Household | 481 (70.7%) | 199 (29.3%) |
| 3-Person Household | 61 (67.0%) | 30 (33.0%) |
| 4+ Person Household | 88 (74.0%) | 31 (26.1%) |
| Total Housing Units | 848 (67.1%) | 416 (32.9%) |
Occupancy by Educational Attainment in Wareham Center
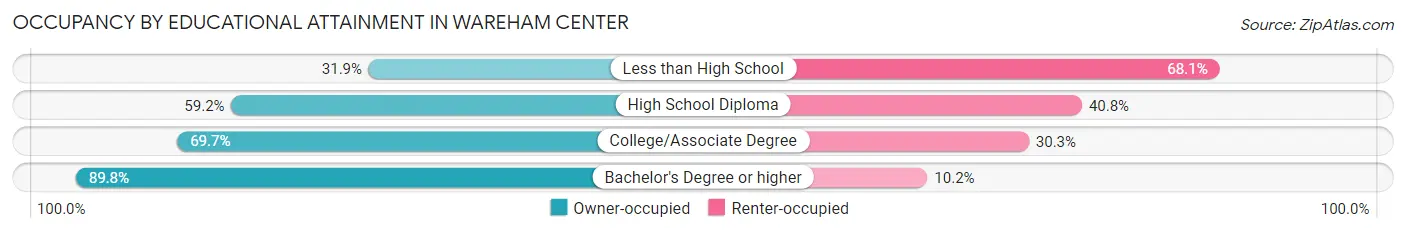
| Household Size | Owner-occupied | Renter-occupied |
| Less than High School | 46 (31.9%) | 98 (68.1%) |
| High School Diploma | 238 (59.2%) | 164 (40.8%) |
| College/Associate Degree | 281 (69.7%) | 122 (30.3%) |
| Bachelor's Degree or higher | 283 (89.8%) | 32 (10.2%) |
Occupancy by Age of Householder in Wareham Center
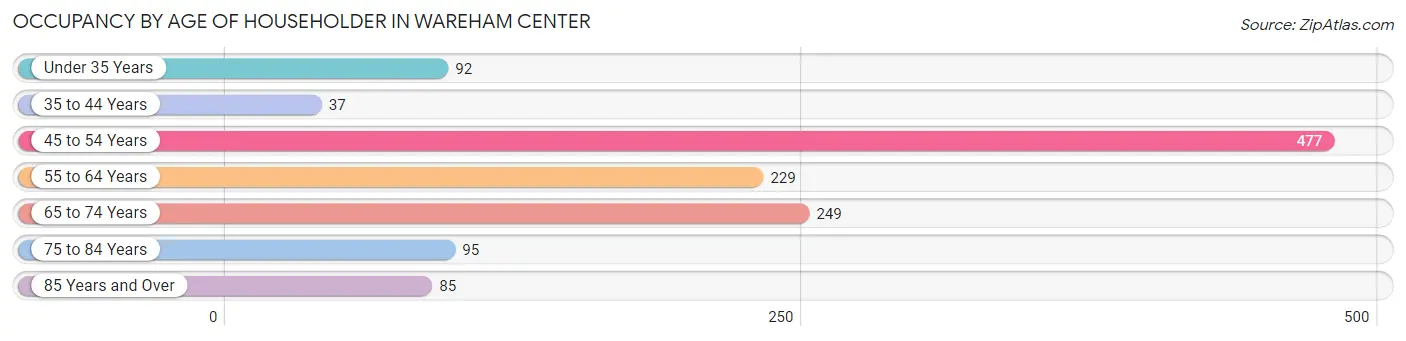
| Age Bracket | # Households | % Households |
| Under 35 Years | 92 | 7.3% |
| 35 to 44 Years | 37 | 2.9% |
| 45 to 54 Years | 477 | 37.7% |
| 55 to 64 Years | 229 | 18.1% |
| 65 to 74 Years | 249 | 19.7% |
| 75 to 84 Years | 95 | 7.5% |
| 85 Years and Over | 85 | 6.7% |
| Total | 1,264 | 100.0% |
Housing Finances in Wareham Center
Median Income by Occupancy in Wareham Center
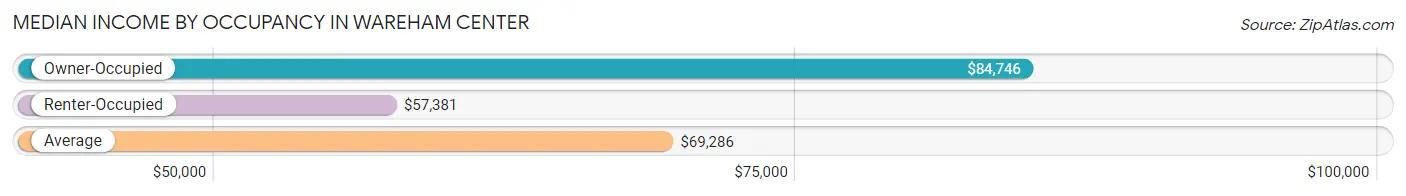
| Occupancy Type | # Households | Median Income |
| Owner-Occupied | 848 (67.1%) | $84,746 |
| Renter-Occupied | 416 (32.9%) | $57,381 |
| Average | 1,264 (100.0%) | $69,286 |
Occupancy by Householder Income Bracket in Wareham Center
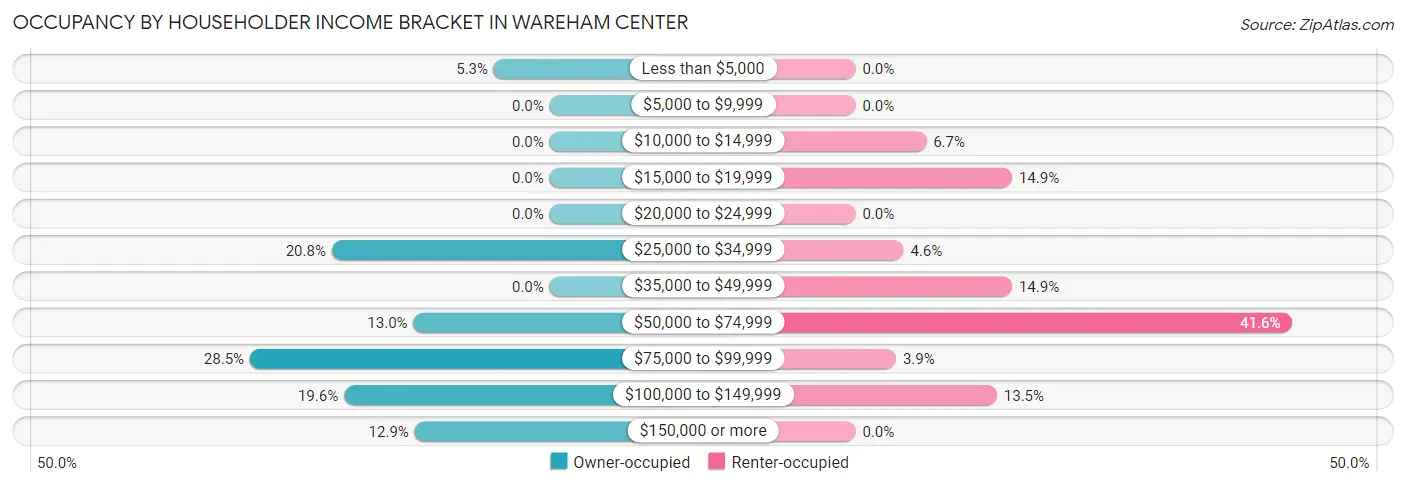
| Income Bracket | Owner-occupied | Renter-occupied |
| Less than $5,000 | 45 (5.3%) | 0 (0.0%) |
| $5,000 to $9,999 | 0 (0.0%) | 0 (0.0%) |
| $10,000 to $14,999 | 0 (0.0%) | 28 (6.7%) |
| $15,000 to $19,999 | 0 (0.0%) | 62 (14.9%) |
| $20,000 to $24,999 | 0 (0.0%) | 0 (0.0%) |
| $25,000 to $34,999 | 176 (20.7%) | 19 (4.6%) |
| $35,000 to $49,999 | 0 (0.0%) | 62 (14.9%) |
| $50,000 to $74,999 | 110 (13.0%) | 173 (41.6%) |
| $75,000 to $99,999 | 242 (28.5%) | 16 (3.8%) |
| $100,000 to $149,999 | 166 (19.6%) | 56 (13.5%) |
| $150,000 or more | 109 (12.9%) | 0 (0.0%) |
| Total | 848 (100.0%) | 416 (100.0%) |
Monthly Housing Cost Tiers in Wareham Center
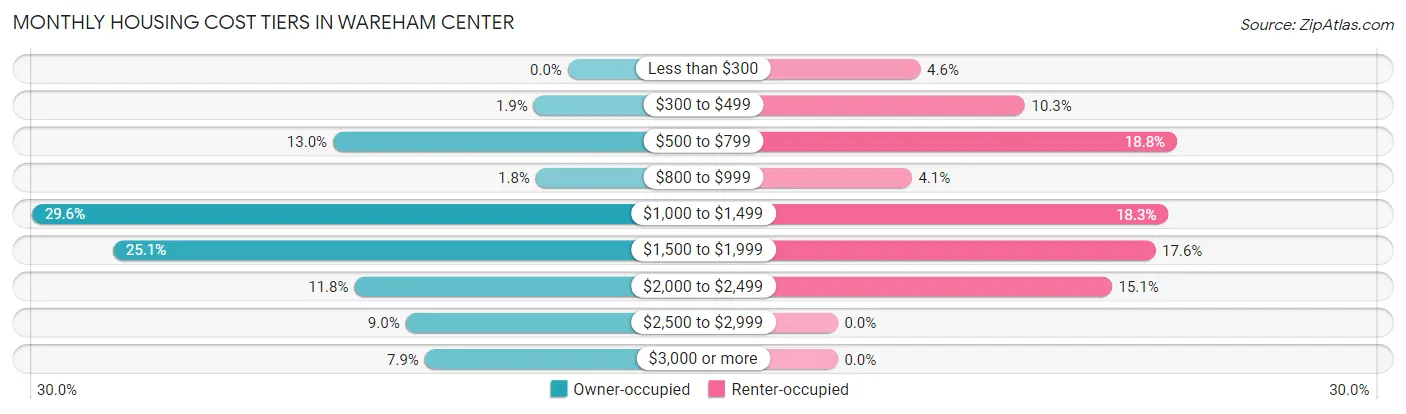
| Monthly Cost | Owner-occupied | Renter-occupied |
| Less than $300 | 0 (0.0%) | 19 (4.6%) |
| $300 to $499 | 16 (1.9%) | 43 (10.3%) |
| $500 to $799 | 110 (13.0%) | 78 (18.8%) |
| $800 to $999 | 15 (1.8%) | 17 (4.1%) |
| $1,000 to $1,499 | 251 (29.6%) | 76 (18.3%) |
| $1,500 to $1,999 | 213 (25.1%) | 73 (17.5%) |
| $2,000 to $2,499 | 100 (11.8%) | 63 (15.1%) |
| $2,500 to $2,999 | 76 (9.0%) | 0 (0.0%) |
| $3,000 or more | 67 (7.9%) | 0 (0.0%) |
| Total | 848 (100.0%) | 416 (100.0%) |
Physical Housing Characteristics in Wareham Center
Housing Structures in Wareham Center
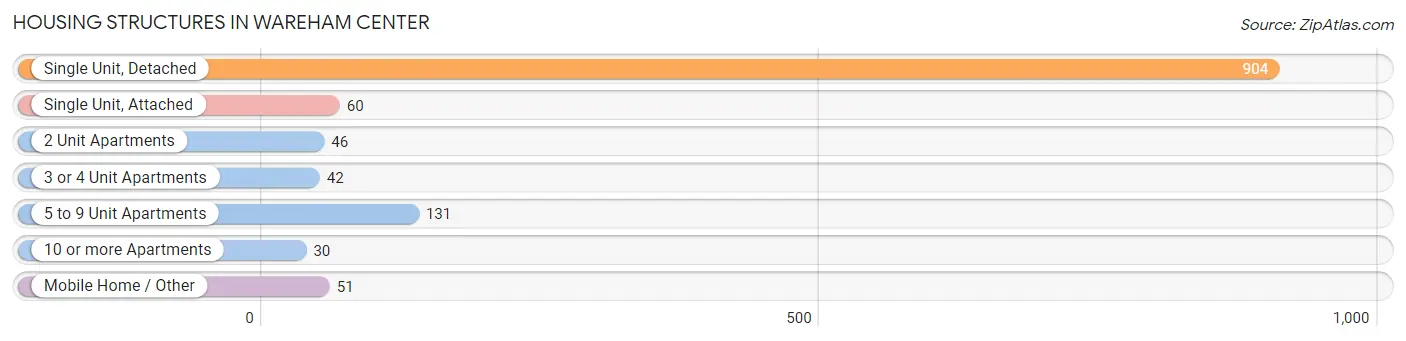
| Structure Type | # Housing Units | % Housing Units |
| Single Unit, Detached | 904 | 71.5% |
| Single Unit, Attached | 60 | 4.8% |
| 2 Unit Apartments | 46 | 3.6% |
| 3 or 4 Unit Apartments | 42 | 3.3% |
| 5 to 9 Unit Apartments | 131 | 10.4% |
| 10 or more Apartments | 30 | 2.4% |
| Mobile Home / Other | 51 | 4.0% |
| Total | 1,264 | 100.0% |
Housing Structures by Occupancy in Wareham Center
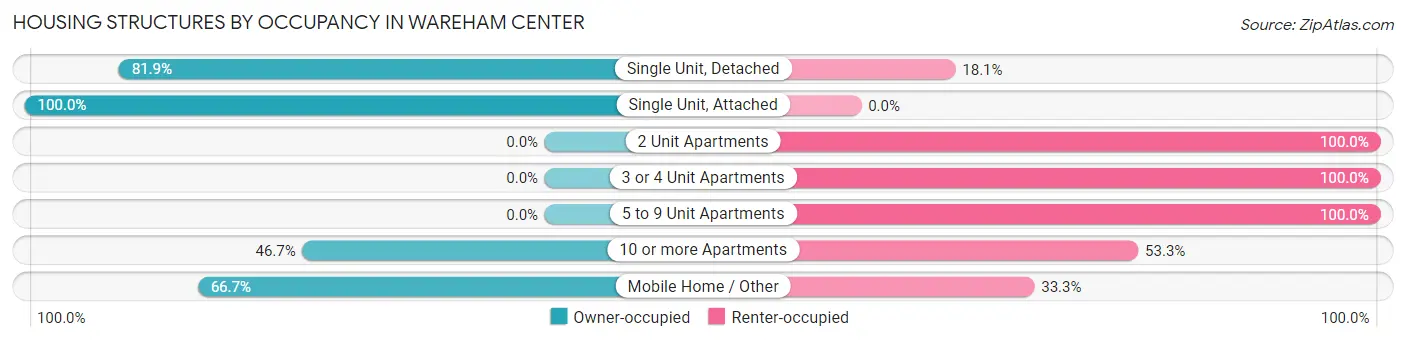
| Structure Type | Owner-occupied | Renter-occupied |
| Single Unit, Detached | 740 (81.9%) | 164 (18.1%) |
| Single Unit, Attached | 60 (100.0%) | 0 (0.0%) |
| 2 Unit Apartments | 0 (0.0%) | 46 (100.0%) |
| 3 or 4 Unit Apartments | 0 (0.0%) | 42 (100.0%) |
| 5 to 9 Unit Apartments | 0 (0.0%) | 131 (100.0%) |
| 10 or more Apartments | 14 (46.7%) | 16 (53.3%) |
| Mobile Home / Other | 34 (66.7%) | 17 (33.3%) |
| Total | 848 (67.1%) | 416 (32.9%) |
Housing Structures by Number of Rooms in Wareham Center
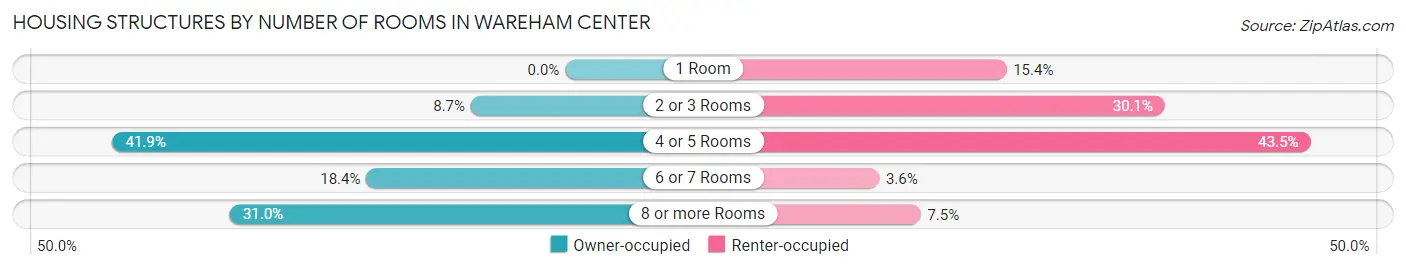
| Number of Rooms | Owner-occupied | Renter-occupied |
| 1 Room | 0 (0.0%) | 64 (15.4%) |
| 2 or 3 Rooms | 74 (8.7%) | 125 (30.0%) |
| 4 or 5 Rooms | 355 (41.9%) | 181 (43.5%) |
| 6 or 7 Rooms | 156 (18.4%) | 15 (3.6%) |
| 8 or more Rooms | 263 (31.0%) | 31 (7.4%) |
| Total | 848 (100.0%) | 416 (100.0%) |
Housing Structure by Heating Type in Wareham Center
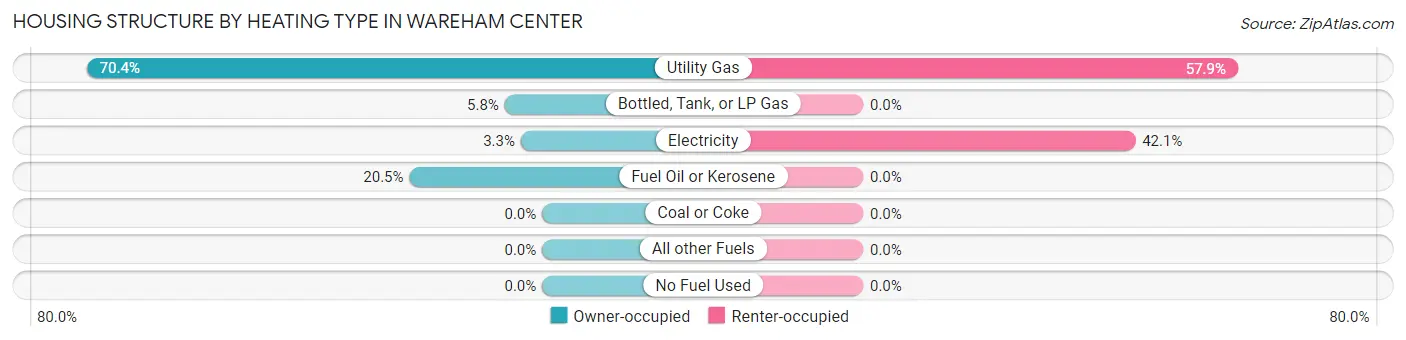
| Heating Type | Owner-occupied | Renter-occupied |
| Utility Gas | 597 (70.4%) | 241 (57.9%) |
| Bottled, Tank, or LP Gas | 49 (5.8%) | 0 (0.0%) |
| Electricity | 28 (3.3%) | 175 (42.1%) |
| Fuel Oil or Kerosene | 174 (20.5%) | 0 (0.0%) |
| Coal or Coke | 0 (0.0%) | 0 (0.0%) |
| All other Fuels | 0 (0.0%) | 0 (0.0%) |
| No Fuel Used | 0 (0.0%) | 0 (0.0%) |
| Total | 848 (100.0%) | 416 (100.0%) |
Household Vehicle Usage in Wareham Center
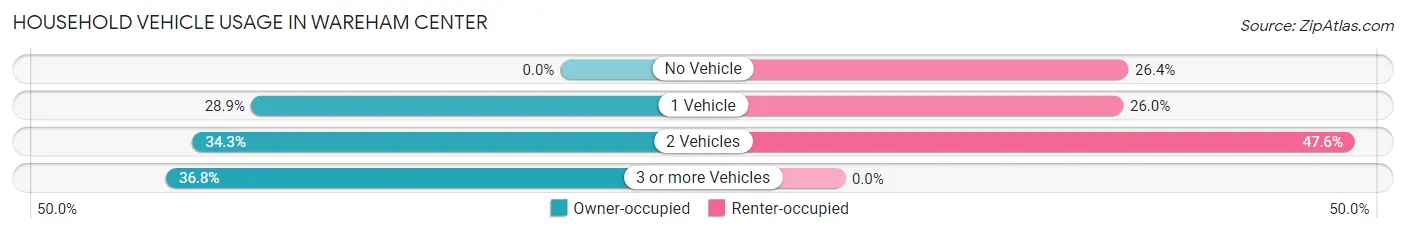
| Vehicles per Household | Owner-occupied | Renter-occupied |
| No Vehicle | 0 (0.0%) | 110 (26.4%) |
| 1 Vehicle | 245 (28.9%) | 108 (26.0%) |
| 2 Vehicles | 291 (34.3%) | 198 (47.6%) |
| 3 or more Vehicles | 312 (36.8%) | 0 (0.0%) |
| Total | 848 (100.0%) | 416 (100.0%) |
Real Estate & Mortgages in Wareham Center
Real Estate and Mortgage Overview in Wareham Center
| Characteristic | Without Mortgage | With Mortgage |
| Housing Units | 254 | 594 |
| Median Property Value | $440,300 | $381,800 |
| Median Household Income | $88,098 | $61 |
| Monthly Housing Costs | $807 | $67 |
| Real Estate Taxes | $4,753 | $19 |
Property Value by Mortgage Status in Wareham Center
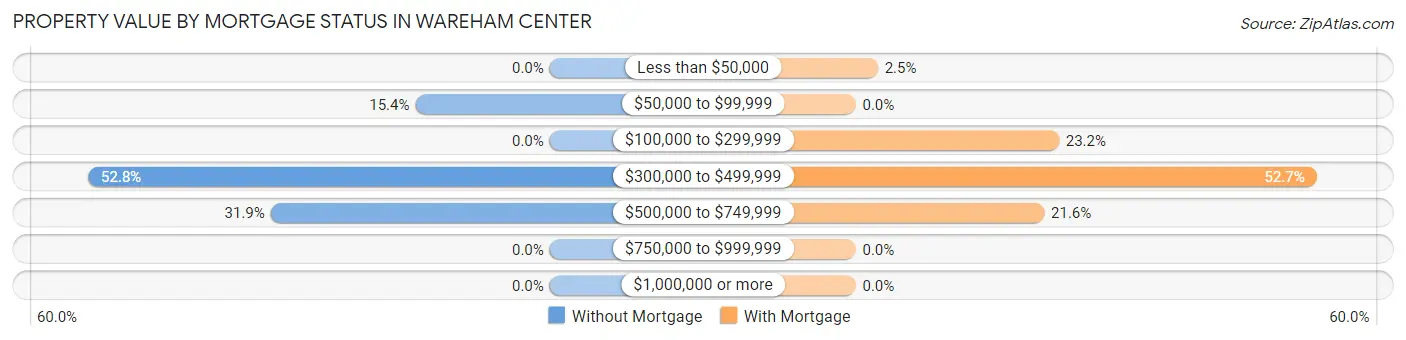
| Property Value | Without Mortgage | With Mortgage |
| Less than $50,000 | 0 (0.0%) | 15 (2.5%) |
| $50,000 to $99,999 | 39 (15.3%) | 0 (0.0%) |
| $100,000 to $299,999 | 0 (0.0%) | 138 (23.2%) |
| $300,000 to $499,999 | 134 (52.8%) | 313 (52.7%) |
| $500,000 to $749,999 | 81 (31.9%) | 128 (21.5%) |
| $750,000 to $999,999 | 0 (0.0%) | 0 (0.0%) |
| $1,000,000 or more | 0 (0.0%) | 0 (0.0%) |
| Total | 254 (100.0%) | 594 (100.0%) |
Household Income by Mortgage Status in Wareham Center
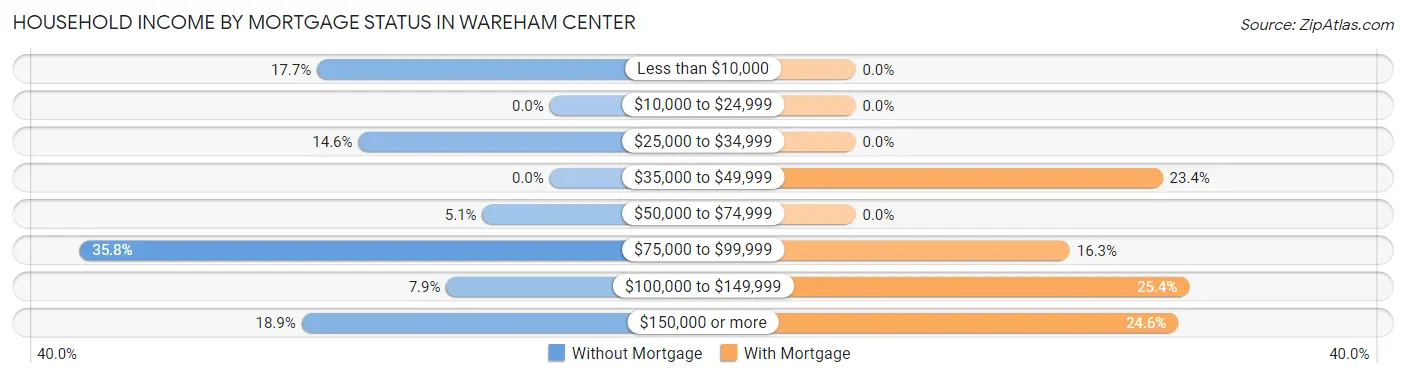
| Household Income | Without Mortgage | With Mortgage |
| Less than $10,000 | 45 (17.7%) | 0 (0.0%) |
| $10,000 to $24,999 | 0 (0.0%) | 0 (0.0%) |
| $25,000 to $34,999 | 37 (14.6%) | 0 (0.0%) |
| $35,000 to $49,999 | 0 (0.0%) | 139 (23.4%) |
| $50,000 to $74,999 | 13 (5.1%) | 0 (0.0%) |
| $75,000 to $99,999 | 91 (35.8%) | 97 (16.3%) |
| $100,000 to $149,999 | 20 (7.9%) | 151 (25.4%) |
| $150,000 or more | 48 (18.9%) | 146 (24.6%) |
| Total | 254 (100.0%) | 594 (100.0%) |
Property Value to Household Income Ratio in Wareham Center
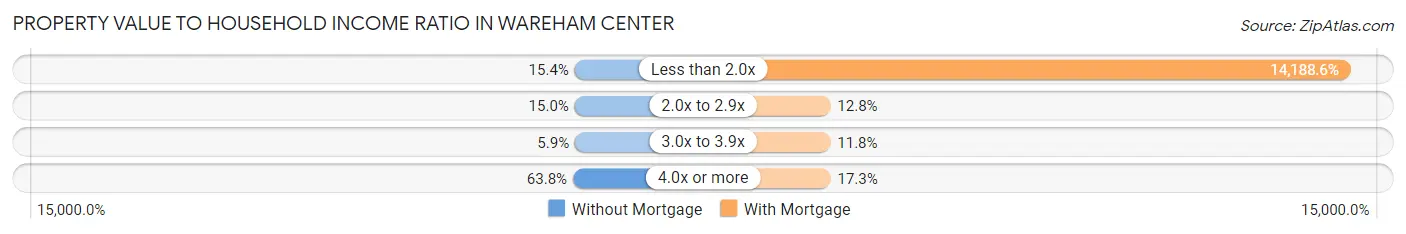
| Value-to-Income Ratio | Without Mortgage | With Mortgage |
| Less than 2.0x | 39 (15.3%) | 84,280 (14,188.6%) |
| 2.0x to 2.9x | 38 (15.0%) | 76 (12.8%) |
| 3.0x to 3.9x | 15 (5.9%) | 70 (11.8%) |
| 4.0x or more | 162 (63.8%) | 103 (17.3%) |
| Total | 254 (100.0%) | 594 (100.0%) |
Real Estate Taxes by Mortgage Status in Wareham Center
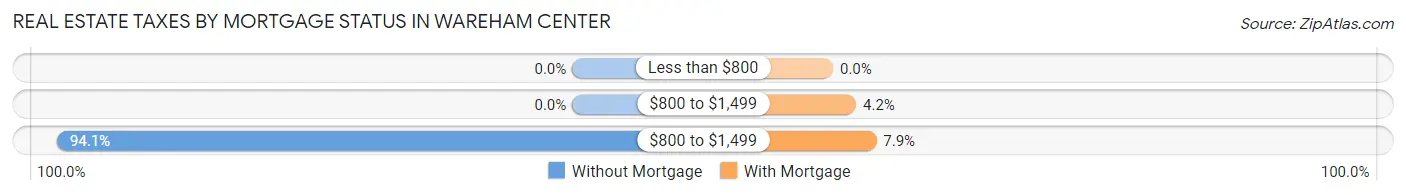
| Property Taxes | Without Mortgage | With Mortgage |
| Less than $800 | 0 (0.0%) | 0 (0.0%) |
| $800 to $1,499 | 0 (0.0%) | 25 (4.2%) |
| $800 to $1,499 | 239 (94.1%) | 47 (7.9%) |
| Total | 254 (100.0%) | 594 (100.0%) |
Health & Disability in Wareham Center
Health Insurance Coverage by Age in Wareham Center
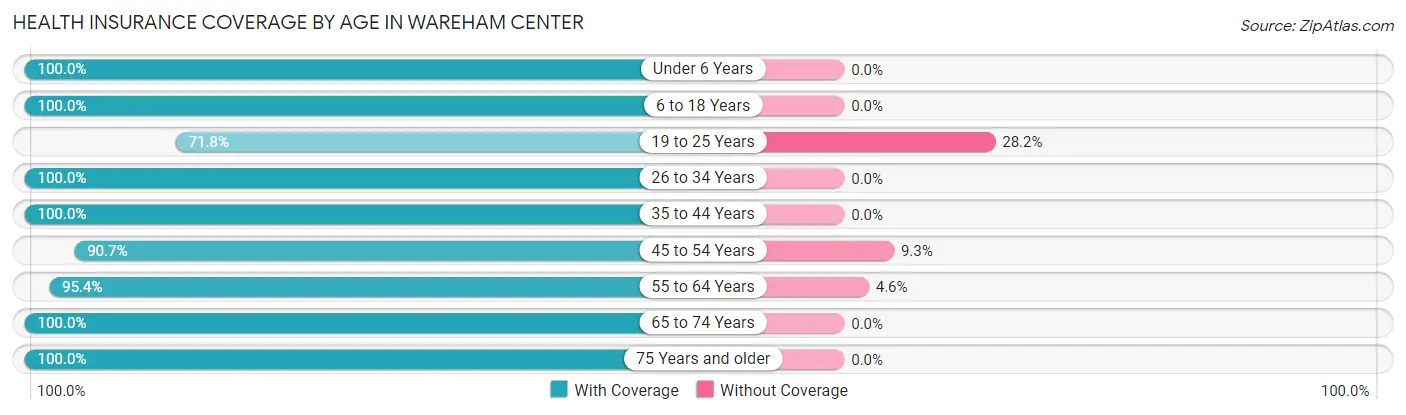
| Age Bracket | With Coverage | Without Coverage |
| Under 6 Years | 205 (100.0%) | 0 (0.0%) |
| 6 to 18 Years | 149 (100.0%) | 0 (0.0%) |
| 19 to 25 Years | 148 (71.8%) | 58 (28.2%) |
| 26 to 34 Years | 171 (100.0%) | 0 (0.0%) |
| 35 to 44 Years | 123 (100.0%) | 0 (0.0%) |
| 45 to 54 Years | 578 (90.7%) | 59 (9.3%) |
| 55 to 64 Years | 355 (95.4%) | 17 (4.6%) |
| 65 to 74 Years | 466 (100.0%) | 0 (0.0%) |
| 75 Years and older | 265 (100.0%) | 0 (0.0%) |
| Total | 2,460 (94.8%) | 134 (5.2%) |
Health Insurance Coverage by Citizenship Status in Wareham Center
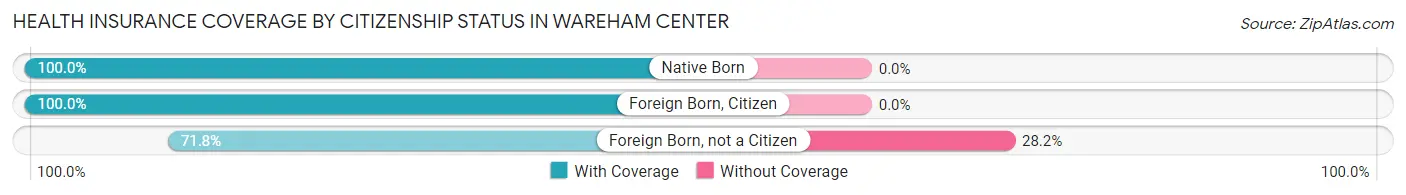
| Citizenship Status | With Coverage | Without Coverage |
| Native Born | 205 (100.0%) | 0 (0.0%) |
| Foreign Born, Citizen | 149 (100.0%) | 0 (0.0%) |
| Foreign Born, not a Citizen | 148 (71.8%) | 58 (28.2%) |
Health Insurance Coverage by Household Income in Wareham Center
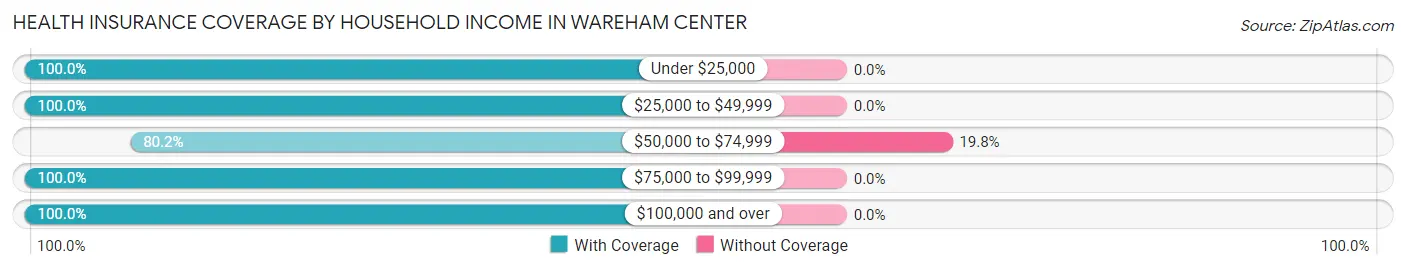
| Household Income | With Coverage | Without Coverage |
| Under $25,000 | 148 (100.0%) | 0 (0.0%) |
| $25,000 to $49,999 | 327 (100.0%) | 0 (0.0%) |
| $50,000 to $74,999 | 543 (80.2%) | 134 (19.8%) |
| $75,000 to $99,999 | 383 (100.0%) | 0 (0.0%) |
| $100,000 and over | 1,032 (100.0%) | 0 (0.0%) |
Public vs Private Health Insurance Coverage by Age in Wareham Center
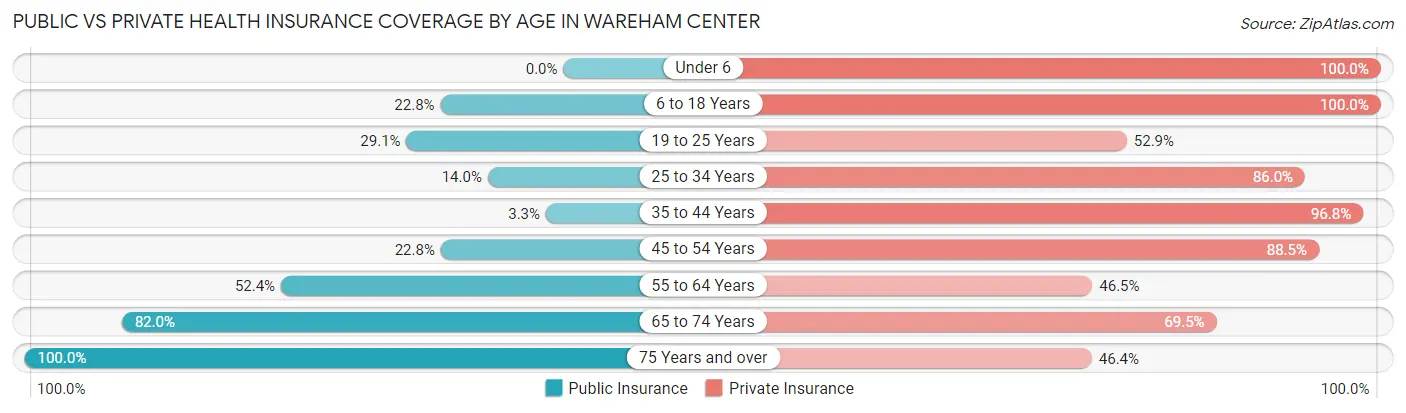
| Age Bracket | Public Insurance | Private Insurance |
| Under 6 | 0 (0.0%) | 205 (100.0%) |
| 6 to 18 Years | 34 (22.8%) | 149 (100.0%) |
| 19 to 25 Years | 60 (29.1%) | 109 (52.9%) |
| 25 to 34 Years | 24 (14.0%) | 147 (86.0%) |
| 35 to 44 Years | 4 (3.3%) | 119 (96.8%) |
| 45 to 54 Years | 145 (22.8%) | 564 (88.5%) |
| 55 to 64 Years | 195 (52.4%) | 173 (46.5%) |
| 65 to 74 Years | 382 (82.0%) | 324 (69.5%) |
| 75 Years and over | 265 (100.0%) | 123 (46.4%) |
| Total | 1,109 (42.7%) | 1,913 (73.8%) |
Disability Status by Sex by Age in Wareham Center
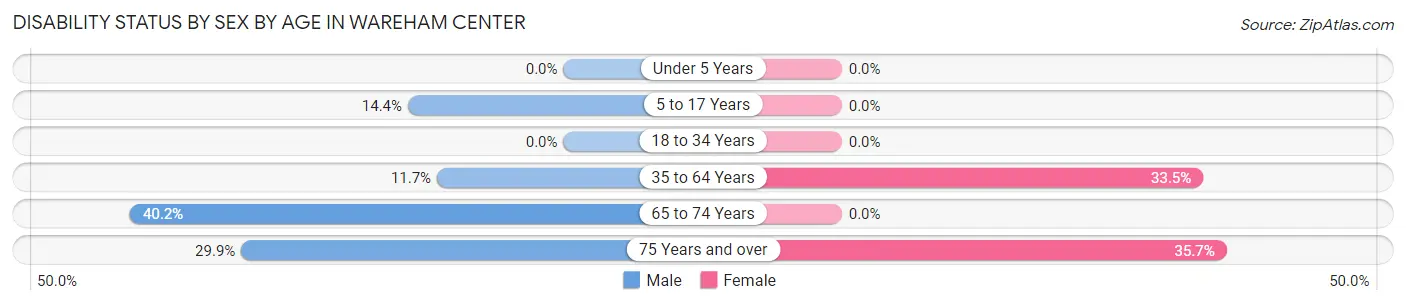
| Age Bracket | Male | Female |
| Under 5 Years | 0 (0.0%) | 0 (0.0%) |
| 5 to 17 Years | 14 (14.4%) | 0 (0.0%) |
| 18 to 34 Years | 0 (0.0%) | 0 (0.0%) |
| 35 to 64 Years | 74 (11.7%) | 168 (33.5%) |
| 65 to 74 Years | 72 (40.2%) | 0 (0.0%) |
| 75 Years and over | 29 (29.9%) | 60 (35.7%) |
Disability Class by Sex by Age in Wareham Center
Disability Class: Hearing Difficulty
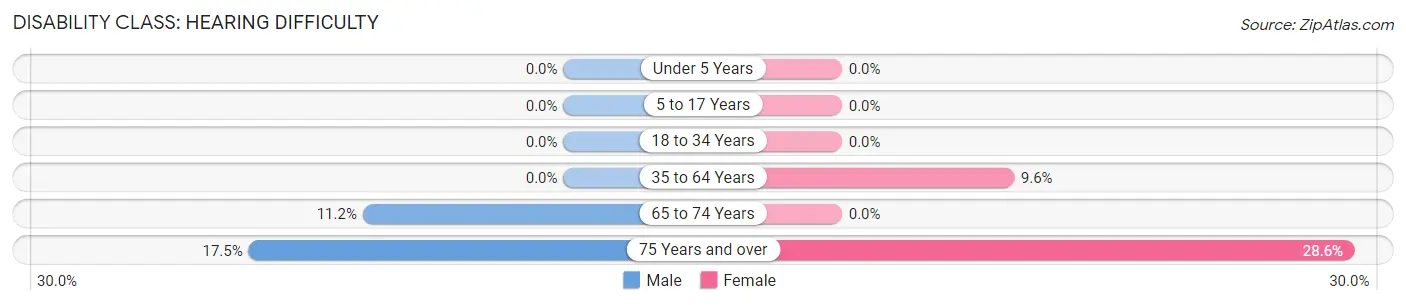
| Age Bracket | Male | Female |
| Under 5 Years | 0 (0.0%) | 0 (0.0%) |
| 5 to 17 Years | 0 (0.0%) | 0 (0.0%) |
| 18 to 34 Years | 0 (0.0%) | 0 (0.0%) |
| 35 to 64 Years | 0 (0.0%) | 48 (9.6%) |
| 65 to 74 Years | 20 (11.2%) | 0 (0.0%) |
| 75 Years and over | 17 (17.5%) | 48 (28.6%) |
Disability Class: Vision Difficulty
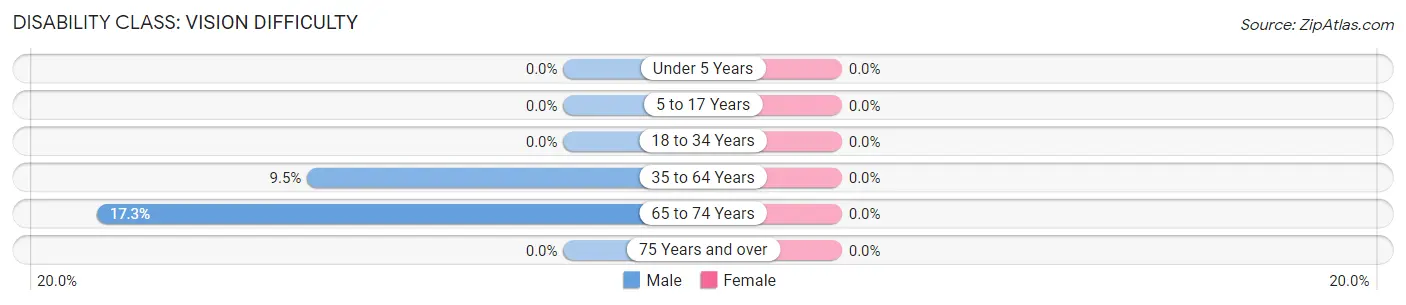
| Age Bracket | Male | Female |
| Under 5 Years | 0 (0.0%) | 0 (0.0%) |
| 5 to 17 Years | 0 (0.0%) | 0 (0.0%) |
| 18 to 34 Years | 0 (0.0%) | 0 (0.0%) |
| 35 to 64 Years | 60 (9.5%) | 0 (0.0%) |
| 65 to 74 Years | 31 (17.3%) | 0 (0.0%) |
| 75 Years and over | 0 (0.0%) | 0 (0.0%) |
Disability Class: Cognitive Difficulty
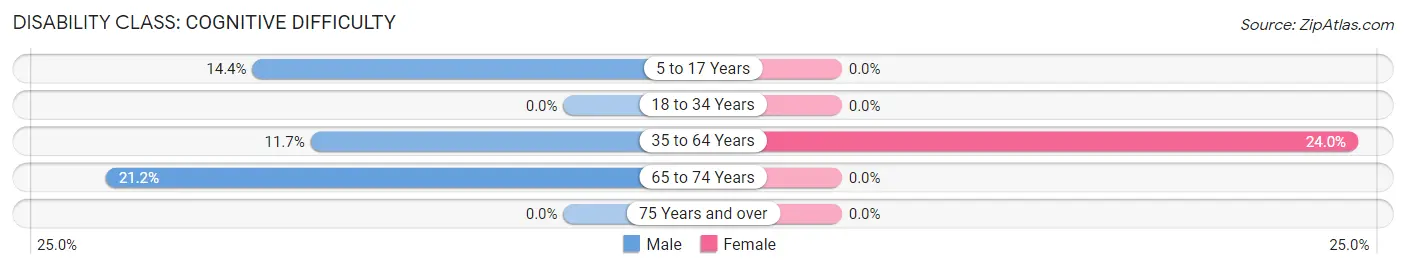
| Age Bracket | Male | Female |
| 5 to 17 Years | 14 (14.4%) | 0 (0.0%) |
| 18 to 34 Years | 0 (0.0%) | 0 (0.0%) |
| 35 to 64 Years | 74 (11.7%) | 120 (23.9%) |
| 65 to 74 Years | 38 (21.2%) | 0 (0.0%) |
| 75 Years and over | 0 (0.0%) | 0 (0.0%) |
Disability Class: Ambulatory Difficulty
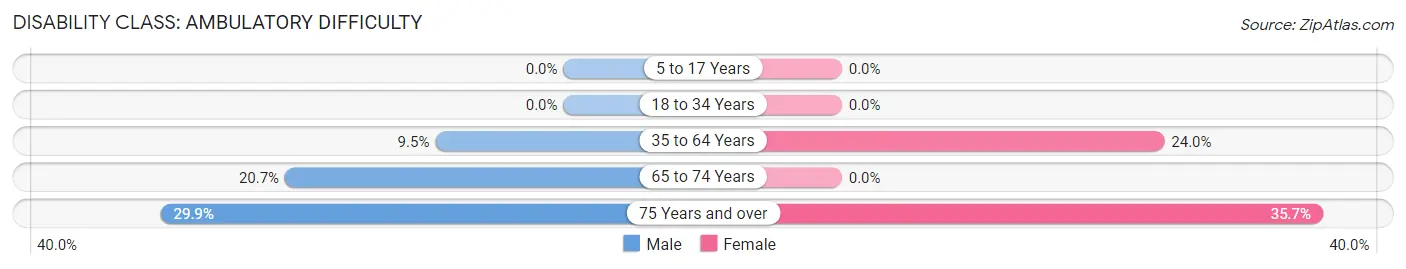
| Age Bracket | Male | Female |
| 5 to 17 Years | 0 (0.0%) | 0 (0.0%) |
| 18 to 34 Years | 0 (0.0%) | 0 (0.0%) |
| 35 to 64 Years | 60 (9.5%) | 120 (23.9%) |
| 65 to 74 Years | 37 (20.7%) | 0 (0.0%) |
| 75 Years and over | 29 (29.9%) | 60 (35.7%) |
Disability Class: Self-Care Difficulty
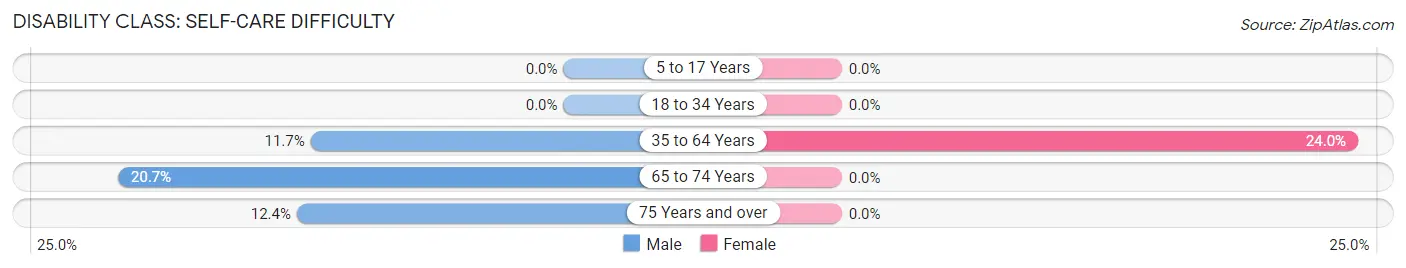
| Age Bracket | Male | Female |
| 5 to 17 Years | 0 (0.0%) | 0 (0.0%) |
| 18 to 34 Years | 0 (0.0%) | 0 (0.0%) |
| 35 to 64 Years | 74 (11.7%) | 120 (23.9%) |
| 65 to 74 Years | 37 (20.7%) | 0 (0.0%) |
| 75 Years and over | 12 (12.4%) | 0 (0.0%) |
Technology Access in Wareham Center
Computing Device Access in Wareham Center
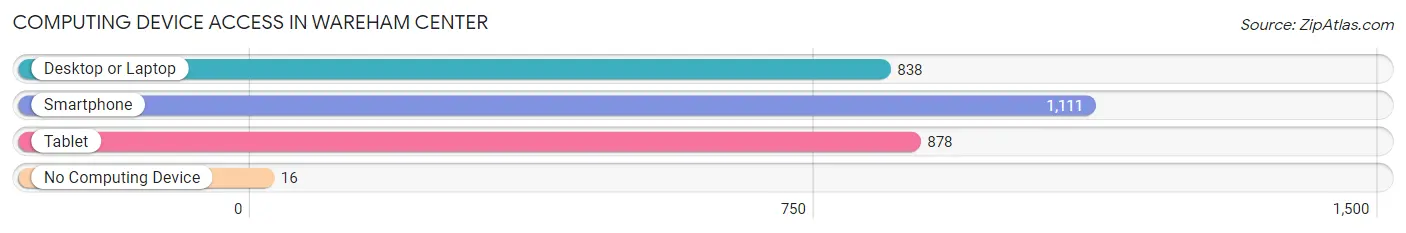
| Device Type | # Households | % Households |
| Desktop or Laptop | 838 | 66.3% |
| Smartphone | 1,111 | 87.9% |
| Tablet | 878 | 69.5% |
| No Computing Device | 16 | 1.3% |
| Total | 1,264 | 100.0% |
Internet Access in Wareham Center
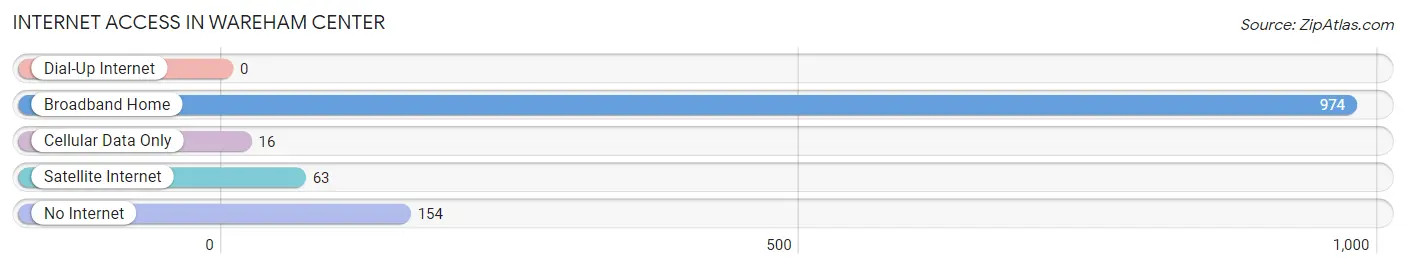
| Internet Type | # Households | % Households |
| Dial-Up Internet | 0 | 0.0% |
| Broadband Home | 974 | 77.1% |
| Cellular Data Only | 16 | 1.3% |
| Satellite Internet | 63 | 5.0% |
| No Internet | 154 | 12.2% |
| Total | 1,264 | 100.0% |
Wareham Center Summary
Introduction
The town of Wareham Center, Massachusetts is located in Plymouth County, in the southeastern part of the state. It is bordered by the towns of Marion, Rochester, and Carver. The town has a population of approximately 8,000 people and is part of the greater Wareham area, which includes the towns of Onset, East Wareham, and West Wareham. The town is known for its rich history, beautiful geography, and vibrant economy.
History
The area that is now Wareham Center was first settled in 1678 by a group of English settlers from the Plymouth Colony. The town was originally known as Agawam, and was part of the Plymouth Colony until 1691, when it was incorporated as a separate town. The town was renamed Wareham in 1739, after the town of Wareham in England.
The town of Wareham Center was originally part of the town of Wareham, but was separated in 1848. The town was named after the Wareham Center Meeting House, which was built in 1820. The meeting house was the center of the town's religious and social life, and was the site of many important events in the town's history.
Geography
Wareham Center is located in southeastern Massachusetts, in Plymouth County. The town is bordered by the towns of Marion, Rochester, and Carver. The town is located on the western shore of Buzzards Bay, and is part of the greater Wareham area, which includes the towns of Onset, East Wareham, and West Wareham.
The town is located in a rural area, and is known for its beautiful scenery. The town is home to several parks and nature preserves, including the Wareham Center State Forest, the Wareham Center Wildlife Management Area, and the Wareham Center Conservation Area. The town is also home to several lakes, including Long Pond, Little Pond, and Great Pond.
Economy
The economy of Wareham Center is largely based on agriculture and tourism. The town is home to several farms, which produce a variety of crops, including corn, potatoes, and apples. The town is also home to several wineries, which produce a variety of wines.
The town is also a popular tourist destination, and is home to several attractions, including the Wareham Center Historical Society Museum, the Wareham Center Nature Center, and the Wareham Center State Forest. The town is also home to several restaurants, shops, and other businesses.
Demographics
As of the 2010 census, the population of Wareham Center was 8,000. The town has a median household income of $60,000, and a median home value of $250,000. The town is predominantly white, with a small minority population. The town is also home to a large number of retirees, with nearly 20% of the population over the age of 65.
Conclusion
Wareham Center is a small town in southeastern Massachusetts, with a population of 8,000 people. The town is known for its rich history, beautiful geography, and vibrant economy. The town is home to several farms, wineries, and tourist attractions, and is a popular destination for retirees. The town has a median household income of $60,000, and a median home value of $250,000.
Common Questions
What is Per Capita Income in Wareham Center?
Per Capita income in Wareham Center is $39,693.
What is the Median Family Income in Wareham Center?
Median Family Income in Wareham Center is $79,881.
What is the Median Household income in Wareham Center?
Median Household Income in Wareham Center is $69,286.
What is Inequality or Gini Index in Wareham Center?
Inequality or Gini Index in Wareham Center is 0.36.
What is the Total Population of Wareham Center?
Total Population of Wareham Center is 2,654.
What is the Total Male Population of Wareham Center?
Total Male Population of Wareham Center is 1,315.
What is the Total Female Population of Wareham Center?
Total Female Population of Wareham Center is 1,339.
What is the Ratio of Males per 100 Females in Wareham Center?
There are 98.21 Males per 100 Females in Wareham Center.
What is the Ratio of Females per 100 Males in Wareham Center?
There are 101.83 Females per 100 Males in Wareham Center.
What is the Median Population Age in Wareham Center?
Median Population Age in Wareham Center is 53.8 Years.
What is the Average Family Size in Wareham Center
Average Family Size in Wareham Center is 2.5 People.
What is the Average Household Size in Wareham Center
Average Household Size in Wareham Center is 2.0 People.
How Large is the Labor Force in Wareham Center?
There are 1,230 People in the Labor Forcein in Wareham Center.
What is the Percentage of People in the Labor Force in Wareham Center?
51.8% of People are in the Labor Force in Wareham Center.
What is the Unemployment Rate in Wareham Center?
Unemployment Rate in Wareham Center is 4.9%.