Bridgewater Town, MA Map & Demographics
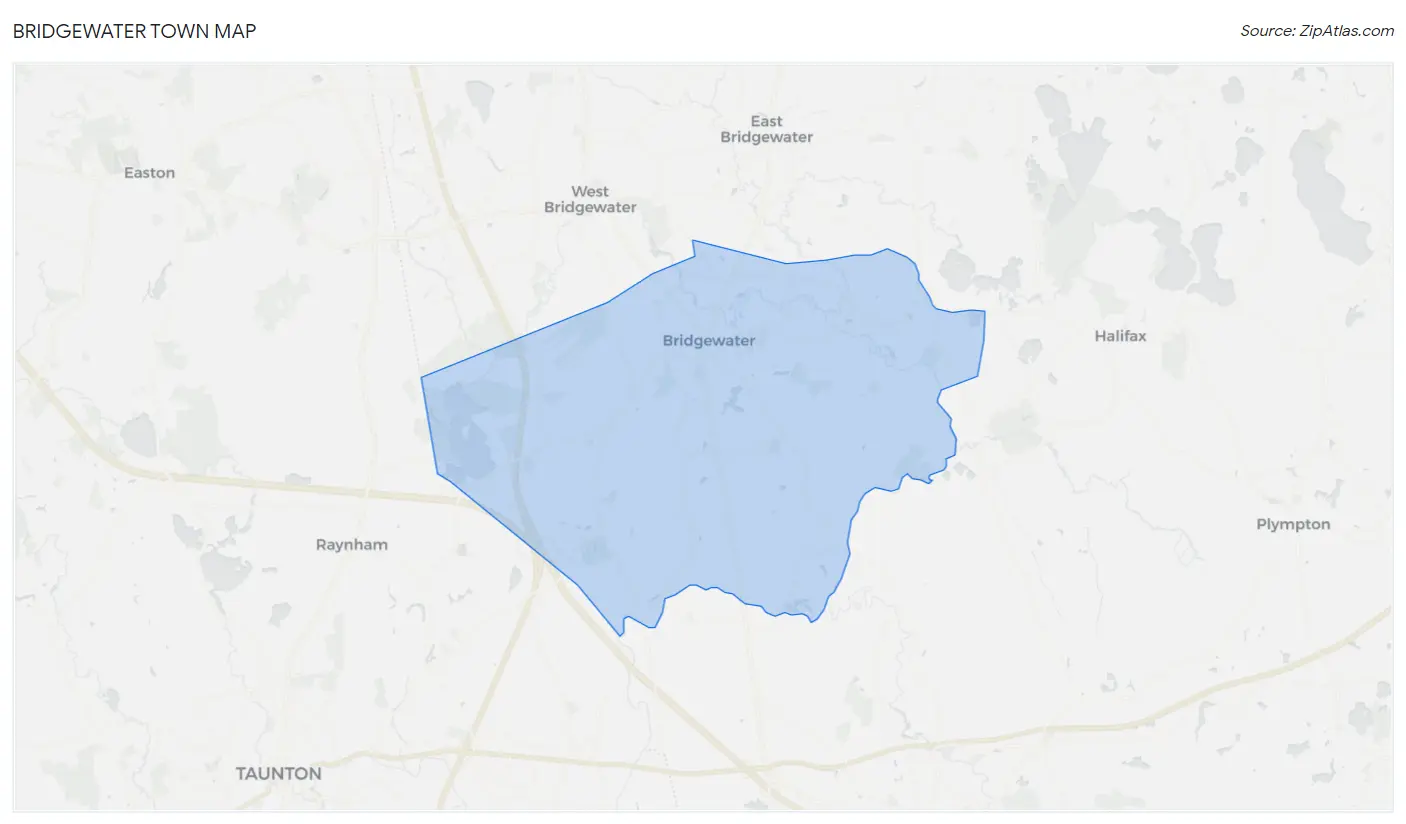
Bridgewater Town Map
Bridgewater Town Overview
$46,448
PER CAPITA INCOME
$127,279
AVG FAMILY INCOME
$110,354
AVG HOUSEHOLD INCOME
33.6%
WAGE / INCOME GAP [ % ]
66.4¢/ $1
WAGE / INCOME GAP [ $ ]
0.42
INEQUALITY / GINI INDEX
28,531
TOTAL POPULATION
14,950
MALE POPULATION
13,581
FEMALE POPULATION
110.08
MALES / 100 FEMALES
90.84
FEMALES / 100 MALES
35.8
MEDIAN AGE
3.1
AVG FAMILY SIZE
2.7
AVG HOUSEHOLD SIZE
15,481
LABOR FORCE [ PEOPLE ]
63.7%
PERCENT IN LABOR FORCE
4.8%
UNEMPLOYMENT RATE
Income in Bridgewater Town
Income Overview in Bridgewater Town
Per Capita Income in Bridgewater Town is $46,448, while median incomes of families and households are $127,279 and $110,354 respectively.
| Characteristic | Number | Measure |
| Per Capita Income | 28,531 | $46,448 |
| Median Family Income | 6,615 | $127,279 |
| Mean Family Income | 6,615 | $152,347 |
| Median Household Income | 9,194 | $110,354 |
| Mean Household Income | 9,194 | $136,791 |
| Income Deficit | 6,615 | $0 |
| Wage / Income Gap (%) | 28,531 | 33.64% |
| Wage / Income Gap ($) | 28,531 | 66.36¢ per $1 |
| Gini / Inequality Index | 28,531 | 0.42 |
Earnings by Sex in Bridgewater Town
Average Earnings in Bridgewater Town are $46,685, $55,573 for men and $36,879 for women, a difference of 33.6%.
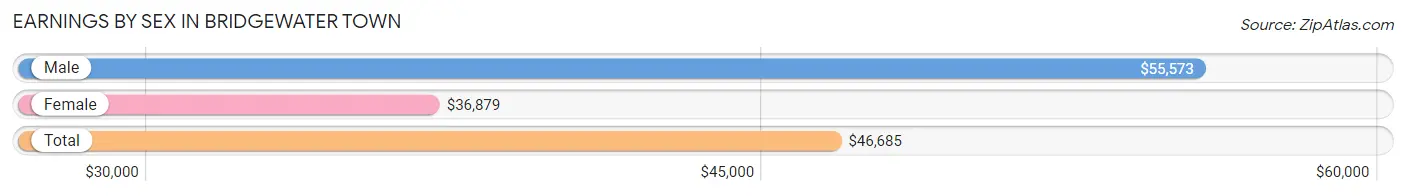
| Sex | Number | Average Earnings |
| Male | 9,391 (53.9%) | $55,573 |
| Female | 8,046 (46.1%) | $36,879 |
| Total | 17,437 (100.0%) | $46,685 |
Earnings by Sex by Income Bracket in Bridgewater Town
The most common earnings brackets in Bridgewater Town are $100,000+ for men (2,408 | 25.6%) and $100,000+ for women (1,143 | 14.2%).
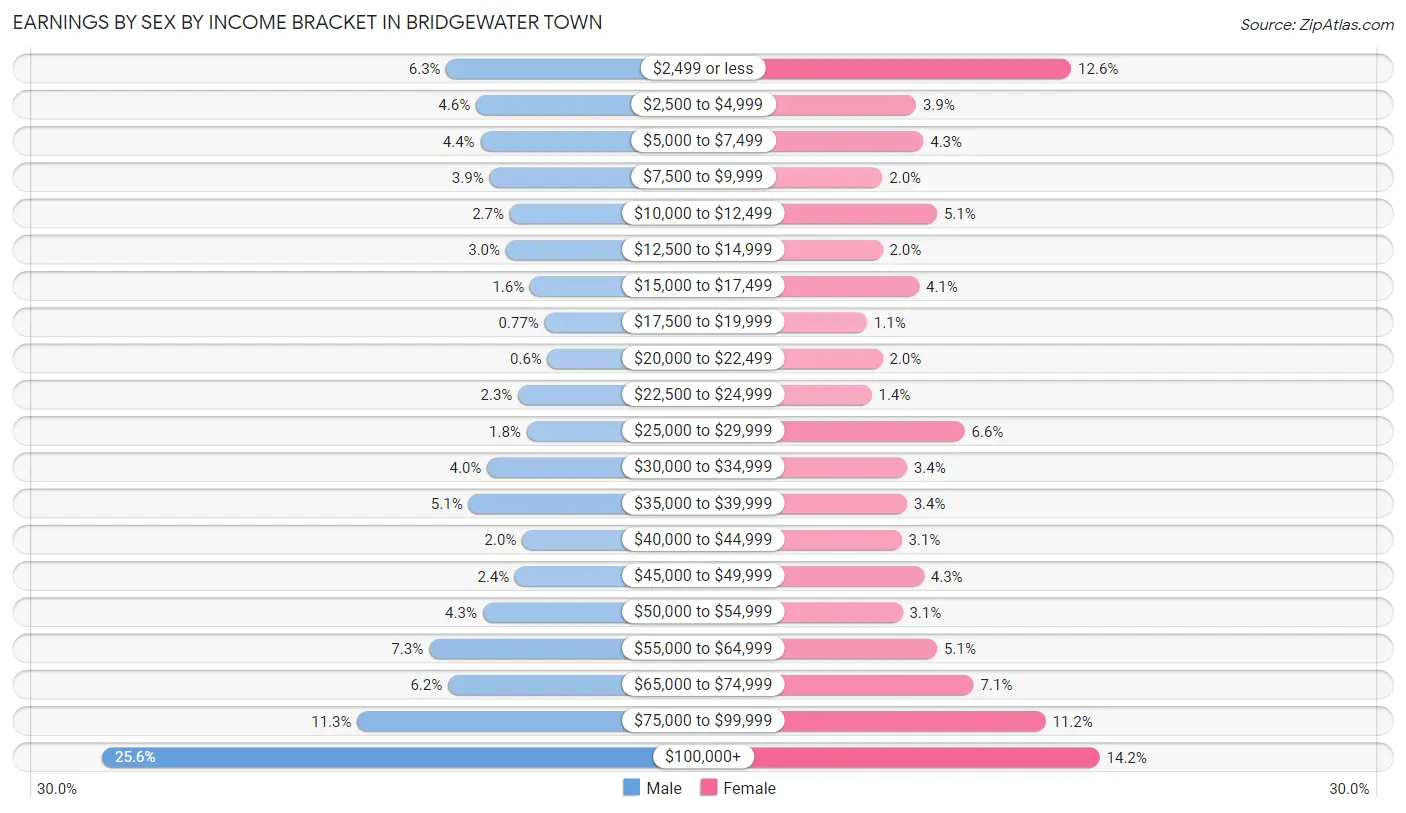
| Income | Male | Female |
| $2,499 or less | 591 (6.3%) | 1,015 (12.6%) |
| $2,500 to $4,999 | 435 (4.6%) | 313 (3.9%) |
| $5,000 to $7,499 | 411 (4.4%) | 346 (4.3%) |
| $7,500 to $9,999 | 363 (3.9%) | 161 (2.0%) |
| $10,000 to $12,499 | 256 (2.7%) | 408 (5.1%) |
| $12,500 to $14,999 | 277 (2.9%) | 162 (2.0%) |
| $15,000 to $17,499 | 149 (1.6%) | 327 (4.1%) |
| $17,500 to $19,999 | 72 (0.8%) | 91 (1.1%) |
| $20,000 to $22,499 | 56 (0.6%) | 162 (2.0%) |
| $22,500 to $24,999 | 212 (2.3%) | 112 (1.4%) |
| $25,000 to $29,999 | 167 (1.8%) | 533 (6.6%) |
| $30,000 to $34,999 | 376 (4.0%) | 272 (3.4%) |
| $35,000 to $39,999 | 474 (5.1%) | 271 (3.4%) |
| $40,000 to $44,999 | 191 (2.0%) | 248 (3.1%) |
| $45,000 to $49,999 | 228 (2.4%) | 348 (4.3%) |
| $50,000 to $54,999 | 399 (4.3%) | 252 (3.1%) |
| $55,000 to $64,999 | 683 (7.3%) | 409 (5.1%) |
| $65,000 to $74,999 | 582 (6.2%) | 574 (7.1%) |
| $75,000 to $99,999 | 1,061 (11.3%) | 899 (11.2%) |
| $100,000+ | 2,408 (25.6%) | 1,143 (14.2%) |
| Total | 9,391 (100.0%) | 8,046 (100.0%) |
Earnings by Sex by Educational Attainment in Bridgewater Town
Average earnings in Bridgewater Town are $72,682 for men and $63,170 for women, a difference of 13.1%. Men with an educational attainment of graduate degree enjoy the highest average annual earnings of $103,198, while those with high school diploma education earn the least with $51,918. Women with an educational attainment of graduate degree earn the most with the average annual earnings of $77,000, while those with college or associate's degree education have the smallest earnings of $37,578.
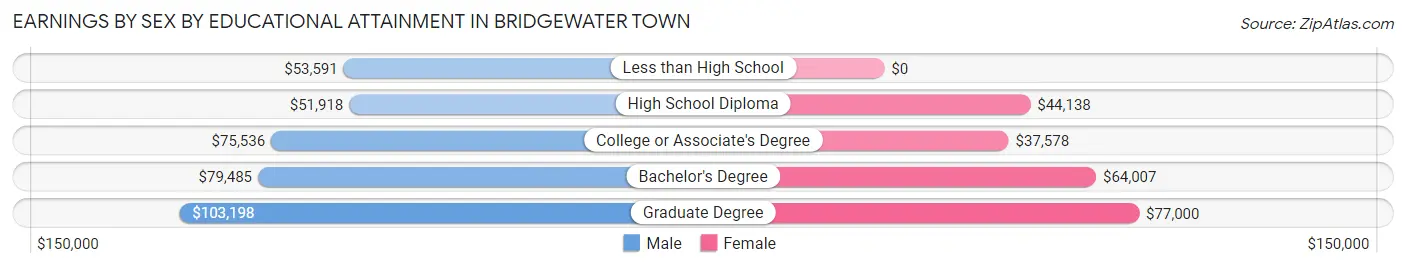
| Educational Attainment | Male Income | Female Income |
| Less than High School | $53,591 | $0 |
| High School Diploma | $51,918 | $44,138 |
| College or Associate's Degree | $75,536 | $37,578 |
| Bachelor's Degree | $79,485 | $64,007 |
| Graduate Degree | $103,198 | $77,000 |
| Total | $72,682 | $63,170 |
Family Income in Bridgewater Town
Family Income Brackets in Bridgewater Town
According to the Bridgewater Town family income data, there are 1,793 families falling into the $100,000 to $149,999 income range, which is the most common income bracket and makes up 27.1% of all families. Conversely, the $10,000 to $14,999 income bracket is the least frequent group with only 13 families (0.2%) belonging to this category.
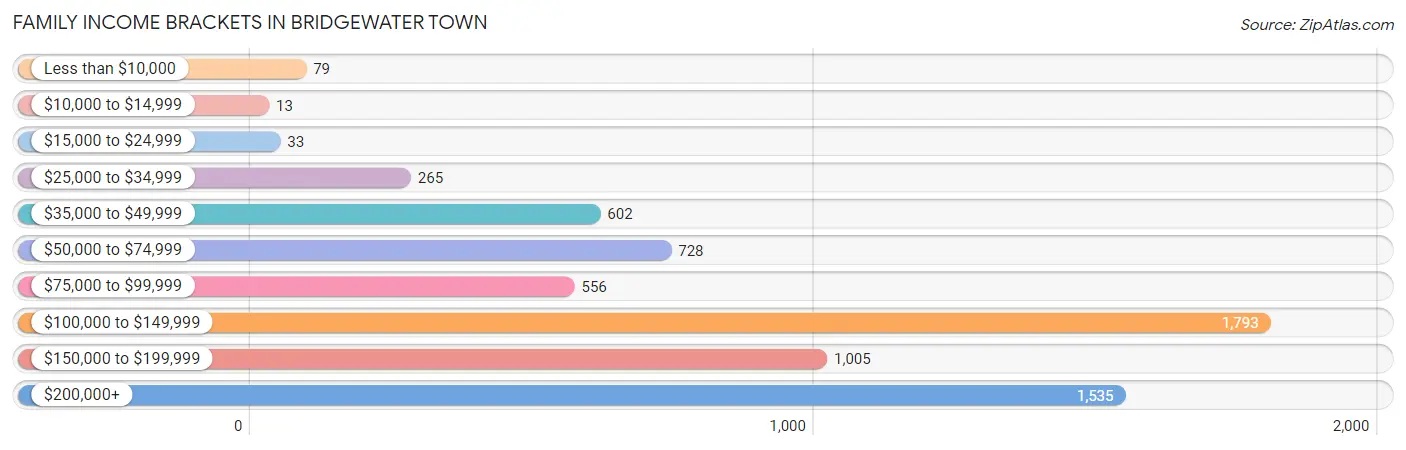
| Income Bracket | # Families | % Families |
| Less than $10,000 | 79 | 1.2% |
| $10,000 to $14,999 | 13 | 0.2% |
| $15,000 to $24,999 | 33 | 0.5% |
| $25,000 to $34,999 | 265 | 4.0% |
| $35,000 to $49,999 | 602 | 9.1% |
| $50,000 to $74,999 | 728 | 11.0% |
| $75,000 to $99,999 | 556 | 8.4% |
| $100,000 to $149,999 | 1,793 | 27.1% |
| $150,000 to $199,999 | 1,005 | 15.2% |
| $200,000+ | 1,535 | 23.2% |
Family Income by Famaliy Size in Bridgewater Town
5-person families (632 | 9.6%) account for the highest median family income in Bridgewater Town with $203,462 per family, while 2-person families (3,256 | 49.2%) have the highest median income of $52,212 per family member.
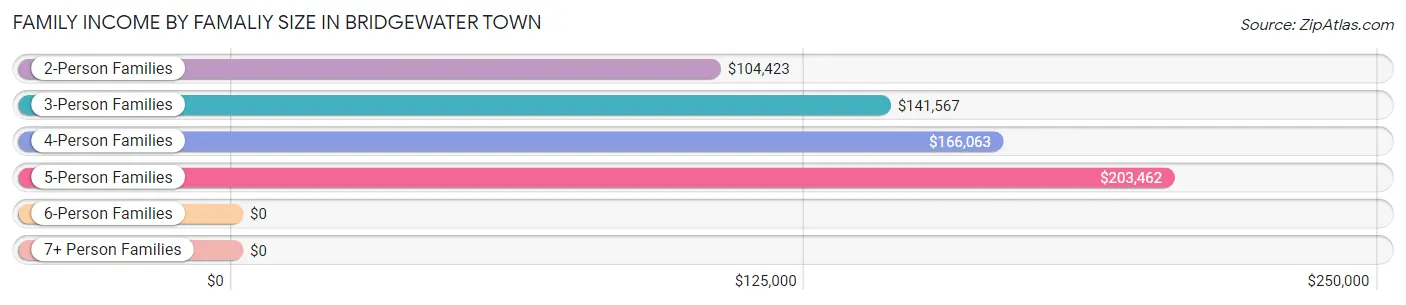
| Income Bracket | # Families | Median Income |
| 2-Person Families | 3,256 (49.2%) | $104,423 |
| 3-Person Families | 1,385 (20.9%) | $141,567 |
| 4-Person Families | 1,172 (17.7%) | $166,063 |
| 5-Person Families | 632 (9.6%) | $203,462 |
| 6-Person Families | 148 (2.2%) | $0 |
| 7+ Person Families | 22 (0.3%) | $0 |
| Total | 6,615 (100.0%) | $127,279 |
Family Income by Number of Earners in Bridgewater Town
The median family income in Bridgewater Town is $127,279, with families comprising 3+ earners (1,194) having the highest median family income of $217,458, while families with no earners (1,013) have the lowest median family income of $59,727, accounting for 18.0% and 15.3% of families, respectively.
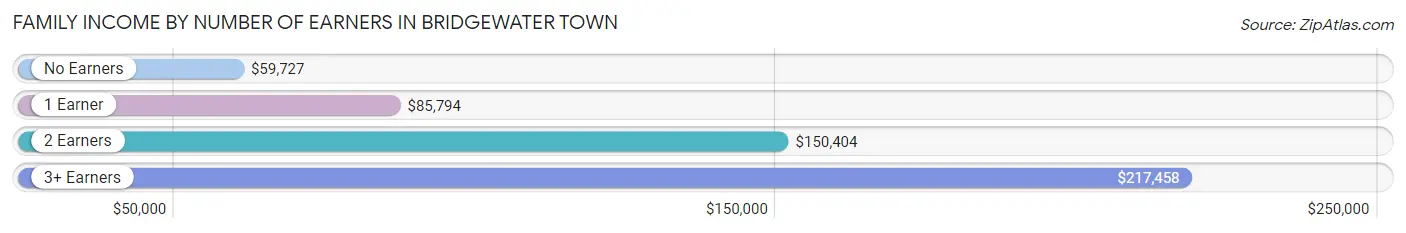
| Number of Earners | # Families | Median Income |
| No Earners | 1,013 (15.3%) | $59,727 |
| 1 Earner | 1,692 (25.6%) | $85,794 |
| 2 Earners | 2,716 (41.1%) | $150,404 |
| 3+ Earners | 1,194 (18.0%) | $217,458 |
| Total | 6,615 (100.0%) | $127,279 |
Household Income in Bridgewater Town
Household Income Brackets in Bridgewater Town
With 2,308 households falling in the category, the $100,000 to $149,999 income range is the most frequent in Bridgewater Town, accounting for 25.1% of all households. In contrast, only 83 households (0.9%) fall into the $10,000 to $14,999 income bracket, making it the least populous group.
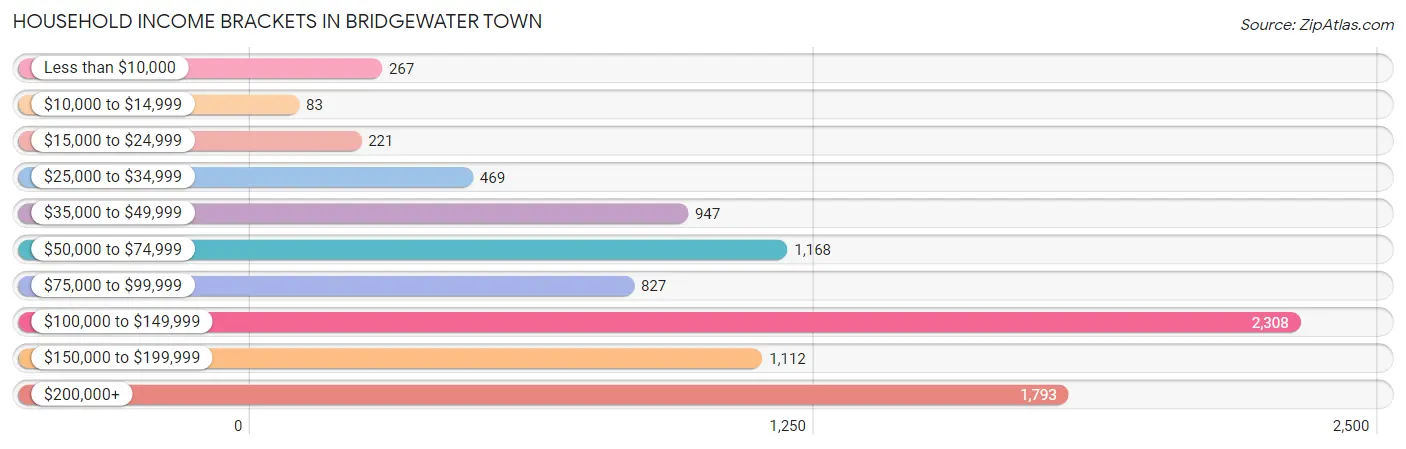
| Income Bracket | # Households | % Households |
| Less than $10,000 | 267 | 2.9% |
| $10,000 to $14,999 | 83 | 0.9% |
| $15,000 to $24,999 | 221 | 2.4% |
| $25,000 to $34,999 | 469 | 5.1% |
| $35,000 to $49,999 | 947 | 10.3% |
| $50,000 to $74,999 | 1,168 | 12.7% |
| $75,000 to $99,999 | 827 | 9.0% |
| $100,000 to $149,999 | 2,308 | 25.1% |
| $150,000 to $199,999 | 1,112 | 12.1% |
| $200,000+ | 1,793 | 19.5% |
Household Income by Householder Age in Bridgewater Town
The median household income in Bridgewater Town is $110,354, with the highest median household income of $145,394 found in the 45 to 64 years age bracket for the primary householder. A total of 3,338 households (36.3%) fall into this category. Meanwhile, the 15 to 24 years age bracket for the primary householder has the lowest median household income of $42,175, with 335 households (3.6%) in this group.
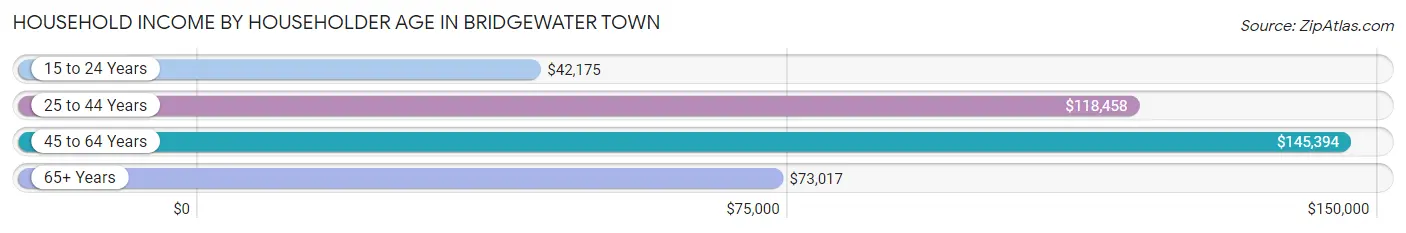
| Income Bracket | # Households | Median Income |
| 15 to 24 Years | 335 (3.6%) | $42,175 |
| 25 to 44 Years | 2,827 (30.7%) | $118,458 |
| 45 to 64 Years | 3,338 (36.3%) | $145,394 |
| 65+ Years | 2,694 (29.3%) | $73,017 |
| Total | 9,194 (100.0%) | $110,354 |
Poverty in Bridgewater Town
Income Below Poverty by Sex and Age in Bridgewater Town
With 4.4% poverty level for males and 4.4% for females among the residents of Bridgewater Town, 18 to 24 year old males and 75 year old and over females are the most vulnerable to poverty, with 228 males (17.1%) and 185 females (20.7%) in their respective age groups living below the poverty level.
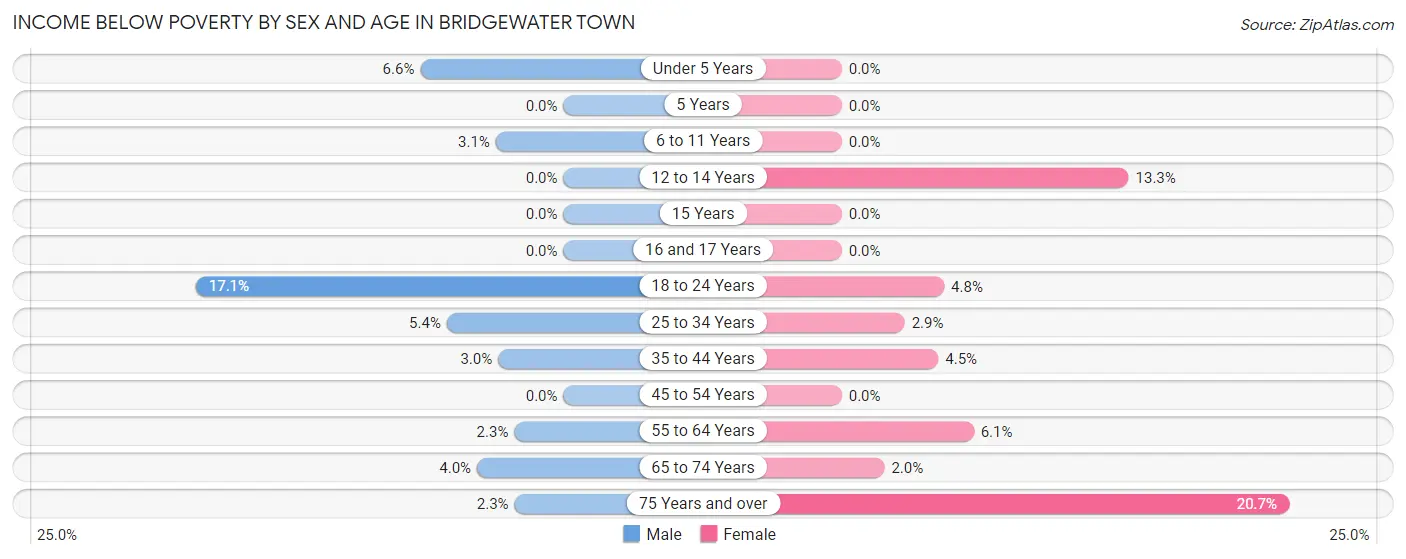
| Age Bracket | Male | Female |
| Under 5 Years | 43 (6.6%) | 0 (0.0%) |
| 5 Years | 0 (0.0%) | 0 (0.0%) |
| 6 to 11 Years | 34 (3.1%) | 0 (0.0%) |
| 12 to 14 Years | 0 (0.0%) | 43 (13.3%) |
| 15 Years | 0 (0.0%) | 0 (0.0%) |
| 16 and 17 Years | 0 (0.0%) | 0 (0.0%) |
| 18 to 24 Years | 228 (17.1%) | 56 (4.8%) |
| 25 to 34 Years | 96 (5.4%) | 47 (2.9%) |
| 35 to 44 Years | 47 (3.0%) | 57 (4.5%) |
| 45 to 54 Years | 0 (0.0%) | 0 (0.0%) |
| 55 to 64 Years | 35 (2.3%) | 100 (6.1%) |
| 65 to 74 Years | 54 (4.0%) | 33 (2.0%) |
| 75 Years and over | 15 (2.3%) | 185 (20.7%) |
| Total | 552 (4.4%) | 521 (4.4%) |
Income Above Poverty by Sex and Age in Bridgewater Town
According to the poverty statistics in Bridgewater Town, males aged 5 years and females aged under 5 years are the age groups that are most secure financially, with 100.0% of males and 100.0% of females in these age groups living above the poverty line.
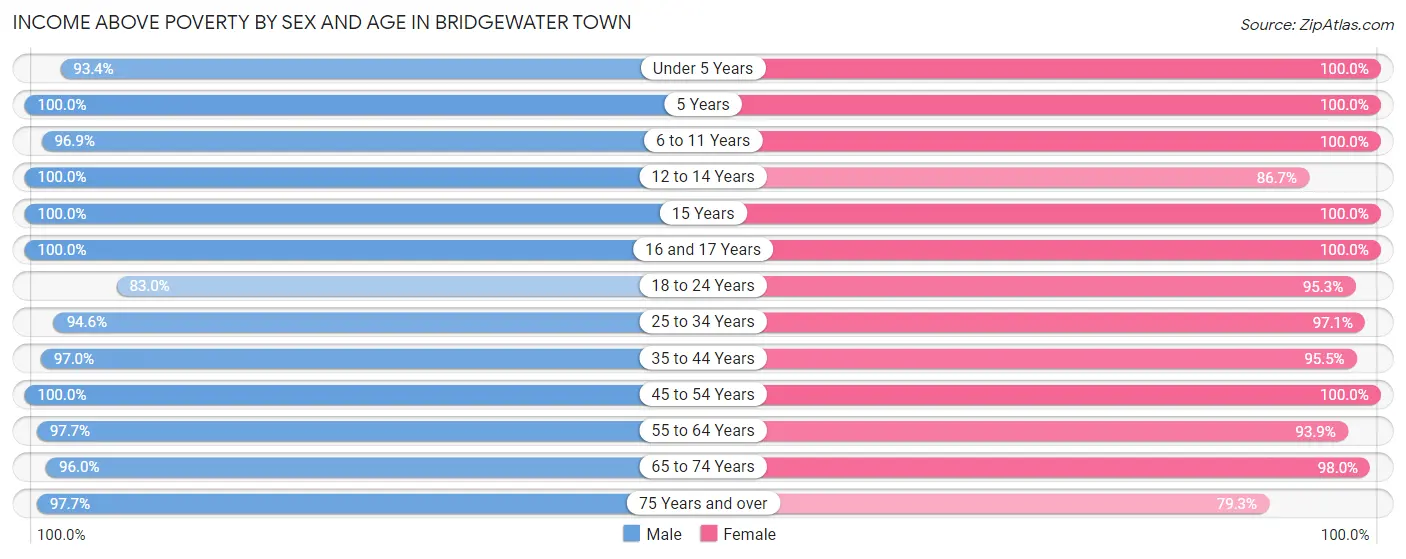
| Age Bracket | Male | Female |
| Under 5 Years | 605 (93.4%) | 612 (100.0%) |
| 5 Years | 36 (100.0%) | 232 (100.0%) |
| 6 to 11 Years | 1,050 (96.9%) | 473 (100.0%) |
| 12 to 14 Years | 449 (100.0%) | 280 (86.7%) |
| 15 Years | 173 (100.0%) | 67 (100.0%) |
| 16 and 17 Years | 398 (100.0%) | 326 (100.0%) |
| 18 to 24 Years | 1,109 (83.0%) | 1,122 (95.3%) |
| 25 to 34 Years | 1,679 (94.6%) | 1,560 (97.1%) |
| 35 to 44 Years | 1,506 (97.0%) | 1,214 (95.5%) |
| 45 to 54 Years | 1,477 (100.0%) | 1,559 (100.0%) |
| 55 to 64 Years | 1,501 (97.7%) | 1,534 (93.9%) |
| 65 to 74 Years | 1,291 (96.0%) | 1,633 (98.0%) |
| 75 Years and over | 646 (97.7%) | 707 (79.3%) |
| Total | 11,920 (95.6%) | 11,319 (95.6%) |
Income Below Poverty Among Married-Couple Families in Bridgewater Town
The poverty statistics for married-couple families in Bridgewater Town show that 1.2% or 59 of the total 5,057 families live below the poverty line. Families with 1 or 2 children have the highest poverty rate of 2.5%, comprising of 35 families. On the other hand, families with 3 or 4 children have the lowest poverty rate of 0.0%, which includes 0 families.
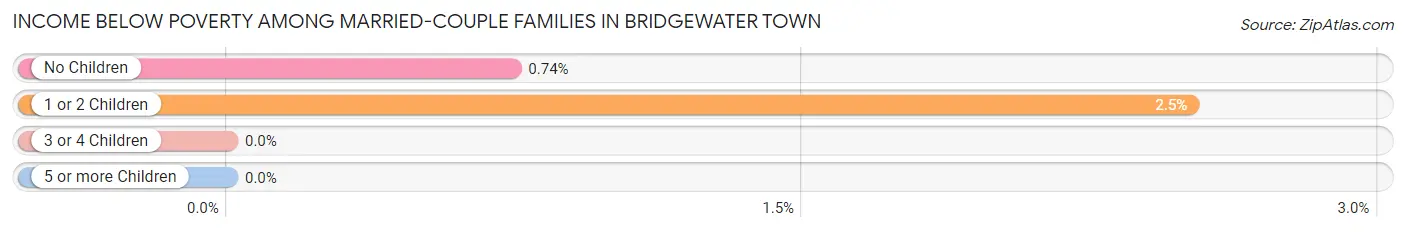
| Children | Above Poverty | Below Poverty |
| No Children | 3,225 (99.3%) | 24 (0.7%) |
| 1 or 2 Children | 1,358 (97.5%) | 35 (2.5%) |
| 3 or 4 Children | 402 (100.0%) | 0 (0.0%) |
| 5 or more Children | 13 (100.0%) | 0 (0.0%) |
| Total | 4,998 (98.8%) | 59 (1.2%) |
Income Below Poverty Among Single-Parent Households in Bridgewater Town
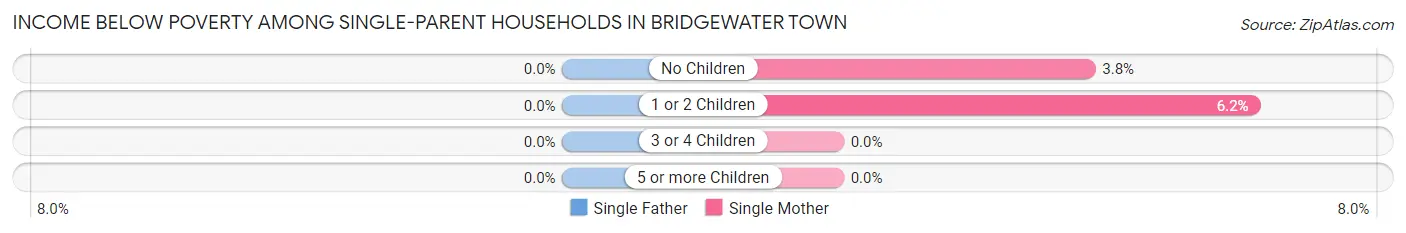
| Children | Single Father | Single Mother |
| No Children | 0 (0.0%) | 10 (3.7%) |
| 1 or 2 Children | 0 (0.0%) | 40 (6.2%) |
| 3 or 4 Children | 0 (0.0%) | 0 (0.0%) |
| 5 or more Children | 0 (0.0%) | 0 (0.0%) |
| Total | 0 (0.0%) | 50 (5.1%) |
Income Below Poverty Among Married-Couple vs Single-Parent Households in Bridgewater Town
The poverty data for Bridgewater Town shows that 59 of the married-couple family households (1.2%) and 50 of the single-parent households (3.2%) are living below the poverty level. Within the married-couple family households, those with 1 or 2 children have the highest poverty rate, with 35 households (2.5%) falling below the poverty line. Among the single-parent households, those with 1 or 2 children have the highest poverty rate, with 40 household (4.8%) living below poverty.
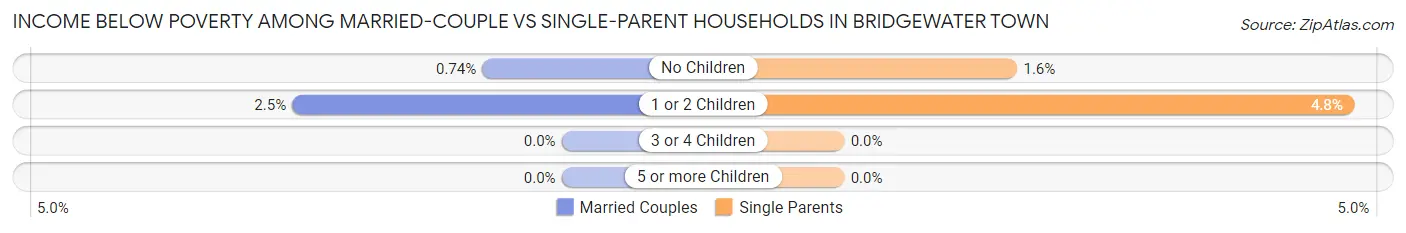
| Children | Married-Couple Families | Single-Parent Households |
| No Children | 24 (0.7%) | 10 (1.6%) |
| 1 or 2 Children | 35 (2.5%) | 40 (4.8%) |
| 3 or 4 Children | 0 (0.0%) | 0 (0.0%) |
| 5 or more Children | 0 (0.0%) | 0 (0.0%) |
| Total | 59 (1.2%) | 50 (3.2%) |
Race in Bridgewater Town
The most populous races in Bridgewater Town are White / Caucasian (24,165 | 84.7%), Black / African American (1,601 | 5.6%), and Two or more Races (1,226 | 4.3%).
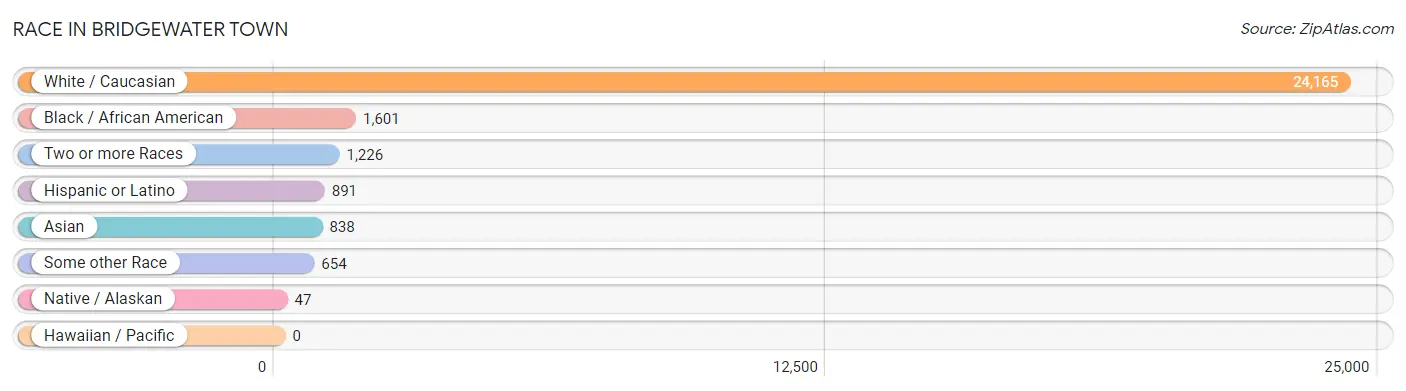
| Race | # Population | % Population |
| Asian | 838 | 2.9% |
| Black / African American | 1,601 | 5.6% |
| Hawaiian / Pacific | 0 | 0.0% |
| Hispanic or Latino | 891 | 3.1% |
| Native / Alaskan | 47 | 0.2% |
| White / Caucasian | 24,165 | 84.7% |
| Two or more Races | 1,226 | 4.3% |
| Some other Race | 654 | 2.3% |
| Total | 28,531 | 100.0% |
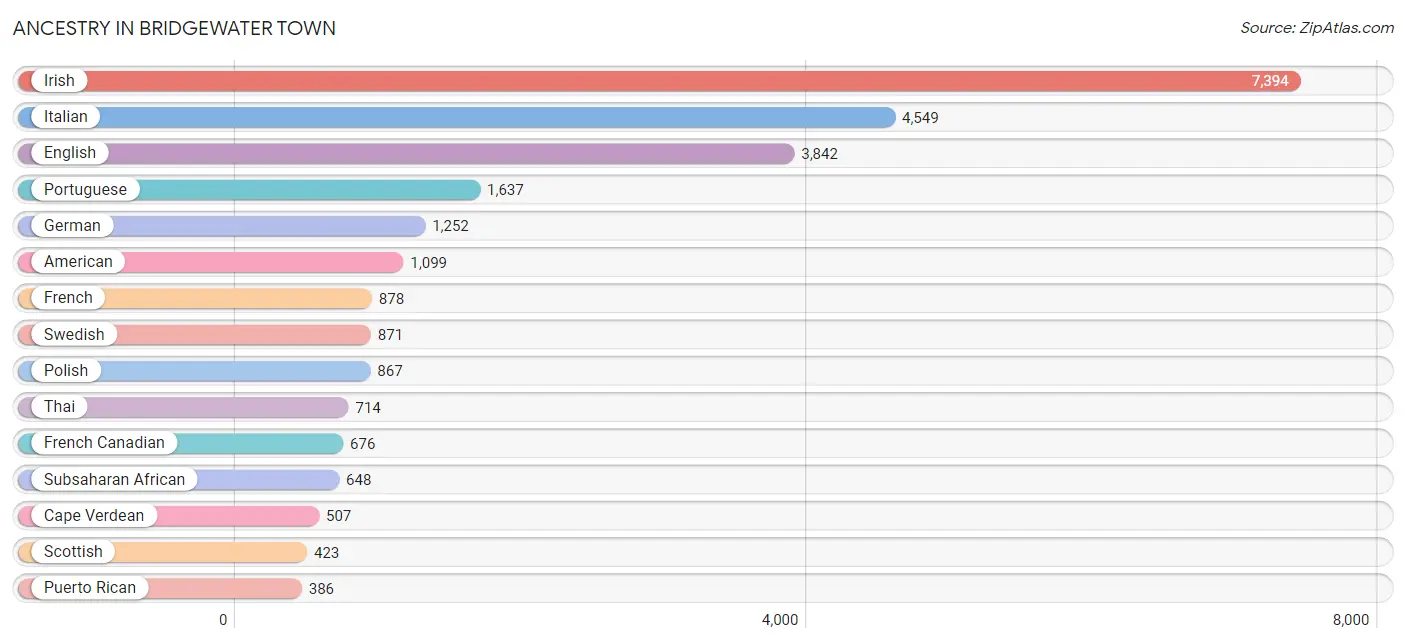
Ancestry in Bridgewater Town
The most populous ancestries reported in Bridgewater Town are Irish (7,394 | 25.9%), Italian (4,549 | 15.9%), English (3,842 | 13.5%), Portuguese (1,637 | 5.7%), and German (1,252 | 4.4%), together accounting for 65.5% of all Bridgewater Town residents.
| Ancestry | # Population | % Population |
| African | 102 | 0.4% |
| Albanian | 27 | 0.1% |
| American | 1,099 | 3.8% |
| Arab | 280 | 1.0% |
| Armenian | 215 | 0.7% |
| Australian | 6 | 0.0% |
| Austrian | 26 | 0.1% |
| Barbadian | 92 | 0.3% |
| Bhutanese | 99 | 0.4% |
| Brazilian | 261 | 0.9% |
| British | 50 | 0.2% |
| Burmese | 103 | 0.4% |
| Canadian | 35 | 0.1% |
| Cape Verdean | 507 | 1.8% |
| Celtic | 10 | 0.0% |
| Central American | 178 | 0.6% |
| Central American Indian | 13 | 0.1% |
| Cherokee | 6 | 0.0% |
| Chippewa | 6 | 0.0% |
| Colombian | 46 | 0.2% |
| Cuban | 57 | 0.2% |
| Danish | 107 | 0.4% |
| Dominican | 81 | 0.3% |
| Dutch | 167 | 0.6% |
| Eastern European | 18 | 0.1% |
| Ecuadorian | 13 | 0.1% |
| English | 3,842 | 13.5% |
| Ethiopian | 8 | 0.0% |
| European | 17 | 0.1% |
| Finnish | 106 | 0.4% |
| French | 878 | 3.1% |
| French American Indian | 5 | 0.0% |
| French Canadian | 676 | 2.4% |
| German | 1,252 | 4.4% |
| Ghanaian | 21 | 0.1% |
| Greek | 102 | 0.4% |
| Guamanian / Chamorro | 73 | 0.3% |
| Haitian | 309 | 1.1% |
| Honduran | 53 | 0.2% |
| Hungarian | 10 | 0.0% |
| Indian (Asian) | 103 | 0.4% |
| Irish | 7,394 | 25.9% |
| Italian | 4,549 | 15.9% |
| Jamaican | 19 | 0.1% |
| Korean | 152 | 0.5% |
| Lebanese | 225 | 0.8% |
| Lithuanian | 122 | 0.4% |
| Mexican | 58 | 0.2% |
| Mexican American Indian | 11 | 0.0% |
| Mongolian | 10 | 0.0% |
| Native Hawaiian | 73 | 0.3% |
| Norwegian | 42 | 0.2% |
| Pakistani | 4 | 0.0% |
| Palestinian | 1 | 0.0% |
| Panamanian | 38 | 0.1% |
| Peruvian | 9 | 0.0% |
| Polish | 867 | 3.0% |
| Portuguese | 1,637 | 5.7% |
| Puerto Rican | 386 | 1.3% |
| Romanian | 114 | 0.4% |
| Russian | 189 | 0.7% |
| Salvadoran | 87 | 0.3% |
| Samoan | 73 | 0.3% |
| Scotch-Irish | 303 | 1.1% |
| Scottish | 423 | 1.5% |
| Serbian | 56 | 0.2% |
| Slovak | 20 | 0.1% |
| South American | 68 | 0.2% |
| Spaniard | 20 | 0.1% |
| Sri Lankan | 74 | 0.3% |
| Subsaharan African | 648 | 2.3% |
| Sudanese | 4 | 0.0% |
| Swedish | 871 | 3.0% |
| Thai | 714 | 2.5% |
| Trinidadian and Tobagonian | 42 | 0.2% |
| Ukrainian | 22 | 0.1% |
| Welsh | 89 | 0.3% |
| West Indian | 9 | 0.0% | View All 78 Rows |
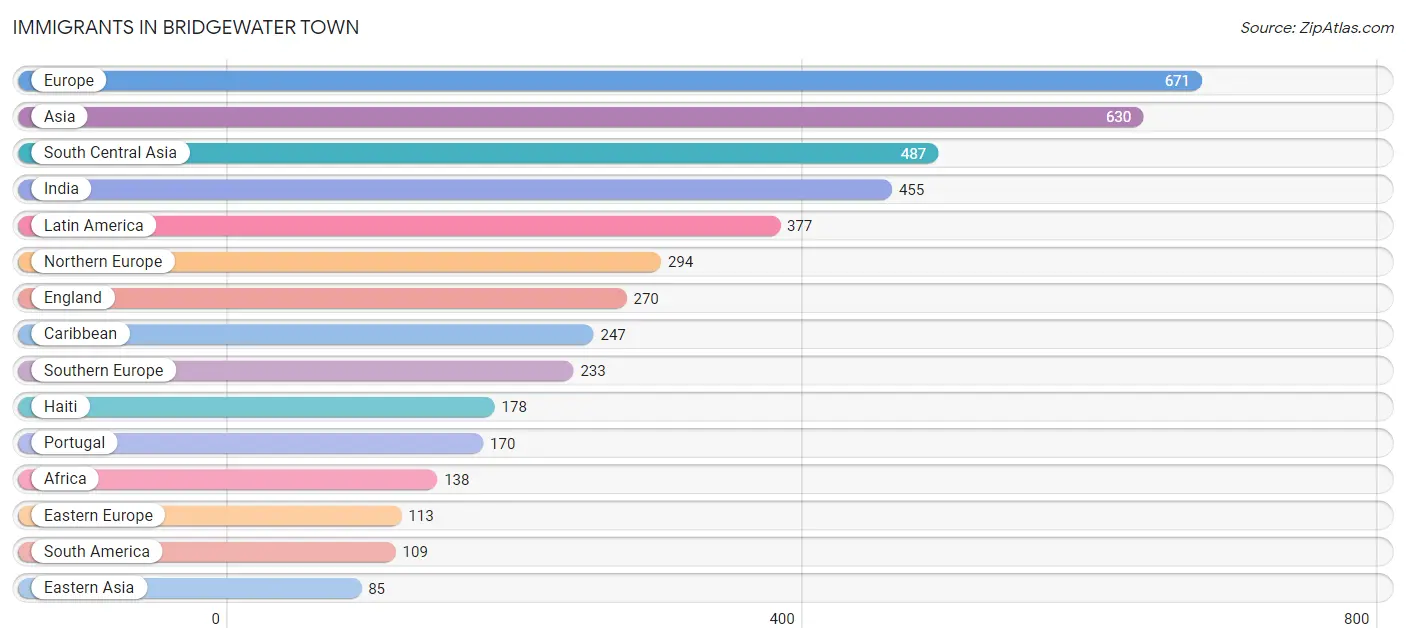
Immigrants in Bridgewater Town
The most numerous immigrant groups reported in Bridgewater Town came from Europe (671 | 2.4%), Asia (630 | 2.2%), South Central Asia (487 | 1.7%), India (455 | 1.6%), and Latin America (377 | 1.3%), together accounting for 9.2% of all Bridgewater Town residents.
| Immigration Origin | # Population | % Population |
| Africa | 138 | 0.5% |
| Asia | 630 | 2.2% |
| Australia | 6 | 0.0% |
| Azores | 9 | 0.0% |
| Brazil | 78 | 0.3% |
| Cabo Verde | 24 | 0.1% |
| Cambodia | 5 | 0.0% |
| Canada | 5 | 0.0% |
| Caribbean | 247 | 0.9% |
| Central America | 21 | 0.1% |
| China | 73 | 0.3% |
| Colombia | 31 | 0.1% |
| Cuba | 46 | 0.2% |
| Dominican Republic | 23 | 0.1% |
| Eastern Africa | 28 | 0.1% |
| Eastern Asia | 85 | 0.3% |
| Eastern Europe | 113 | 0.4% |
| El Salvador | 5 | 0.0% |
| England | 270 | 0.9% |
| Ethiopia | 7 | 0.0% |
| Europe | 671 | 2.4% |
| Germany | 21 | 0.1% |
| Ghana | 41 | 0.1% |
| Greece | 9 | 0.0% |
| Haiti | 178 | 0.6% |
| Honduras | 8 | 0.0% |
| Hungary | 10 | 0.0% |
| India | 455 | 1.6% |
| Iran | 1 | 0.0% |
| Ireland | 10 | 0.0% |
| Italy | 54 | 0.2% |
| Kenya | 6 | 0.0% |
| Korea | 12 | 0.0% |
| Latin America | 377 | 1.3% |
| Latvia | 9 | 0.0% |
| Malaysia | 10 | 0.0% |
| Mexico | 8 | 0.0% |
| Moldova | 25 | 0.1% |
| Netherlands | 10 | 0.0% |
| Northern Africa | 13 | 0.1% |
| Northern Europe | 294 | 1.0% |
| Oceania | 6 | 0.0% |
| Pakistan | 31 | 0.1% |
| Philippines | 18 | 0.1% |
| Poland | 8 | 0.0% |
| Portugal | 170 | 0.6% |
| Romania | 61 | 0.2% |
| Saudi Arabia | 4 | 0.0% |
| South Africa | 14 | 0.1% |
| South America | 109 | 0.4% |
| South Central Asia | 487 | 1.7% |
| South Eastern Asia | 53 | 0.2% |
| Southern Europe | 233 | 0.8% |
| Vietnam | 20 | 0.1% |
| Western Africa | 83 | 0.3% |
| Western Asia | 4 | 0.0% |
| Western Europe | 31 | 0.1% | View All 57 Rows |
Sex and Age in Bridgewater Town
Sex and Age in Bridgewater Town
The most populous age groups in Bridgewater Town are 20 to 24 Years (1,753 | 11.7%) for men and 20 to 24 Years (1,644 | 12.1%) for women.
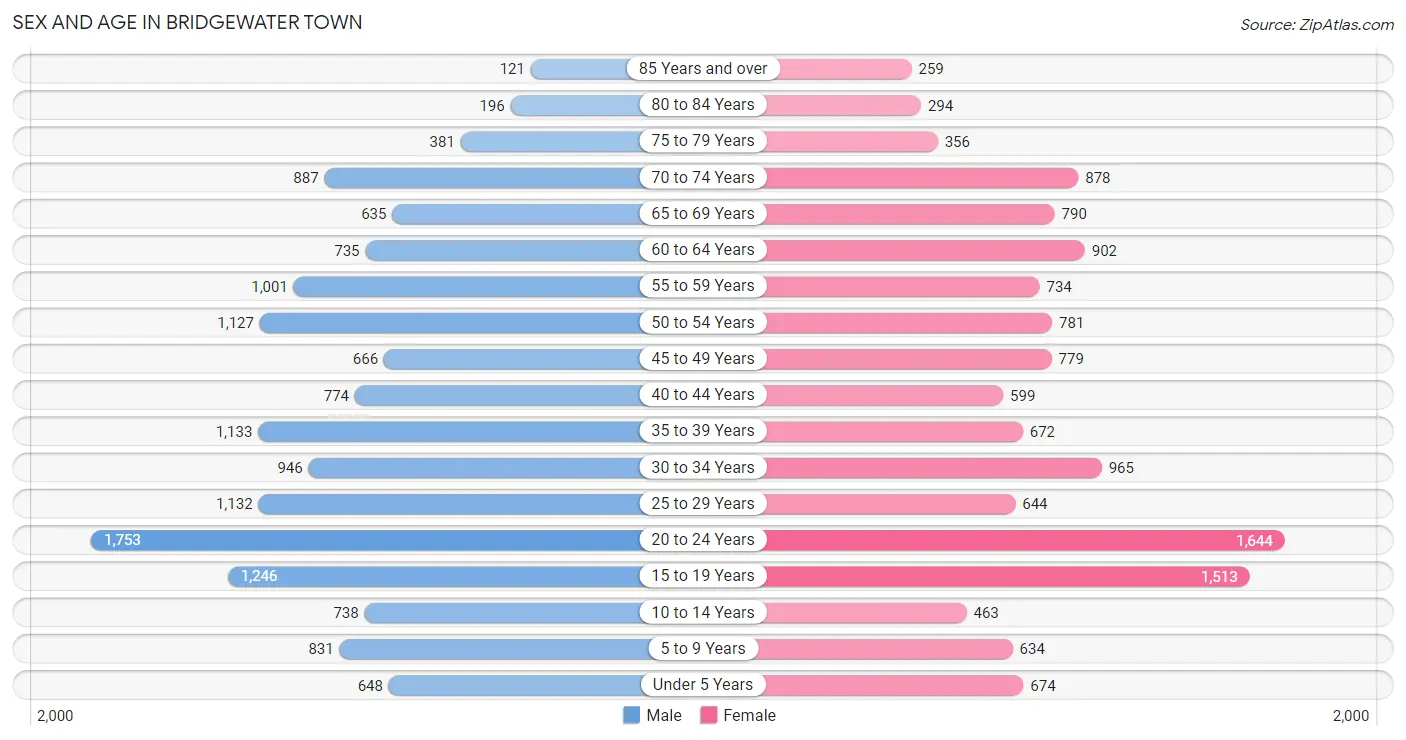
| Age Bracket | Male | Female |
| Under 5 Years | 648 (4.3%) | 674 (5.0%) |
| 5 to 9 Years | 831 (5.6%) | 634 (4.7%) |
| 10 to 14 Years | 738 (4.9%) | 463 (3.4%) |
| 15 to 19 Years | 1,246 (8.3%) | 1,513 (11.1%) |
| 20 to 24 Years | 1,753 (11.7%) | 1,644 (12.1%) |
| 25 to 29 Years | 1,132 (7.6%) | 644 (4.7%) |
| 30 to 34 Years | 946 (6.3%) | 965 (7.1%) |
| 35 to 39 Years | 1,133 (7.6%) | 672 (5.0%) |
| 40 to 44 Years | 774 (5.2%) | 599 (4.4%) |
| 45 to 49 Years | 666 (4.4%) | 779 (5.7%) |
| 50 to 54 Years | 1,127 (7.5%) | 781 (5.8%) |
| 55 to 59 Years | 1,001 (6.7%) | 734 (5.4%) |
| 60 to 64 Years | 735 (4.9%) | 902 (6.6%) |
| 65 to 69 Years | 635 (4.3%) | 790 (5.8%) |
| 70 to 74 Years | 887 (5.9%) | 878 (6.5%) |
| 75 to 79 Years | 381 (2.5%) | 356 (2.6%) |
| 80 to 84 Years | 196 (1.3%) | 294 (2.2%) |
| 85 Years and over | 121 (0.8%) | 259 (1.9%) |
| Total | 14,950 (100.0%) | 13,581 (100.0%) |
Families and Households in Bridgewater Town
Median Family Size in Bridgewater Town
The median family size in Bridgewater Town is 3.07 persons per family, with married-couple families (5,057 | 76.4%) accounting for the largest median family size of 3.23 persons per family. On the other hand, single male/father families (571 | 8.6%) represent the smallest median family size with 2.34 persons per family.
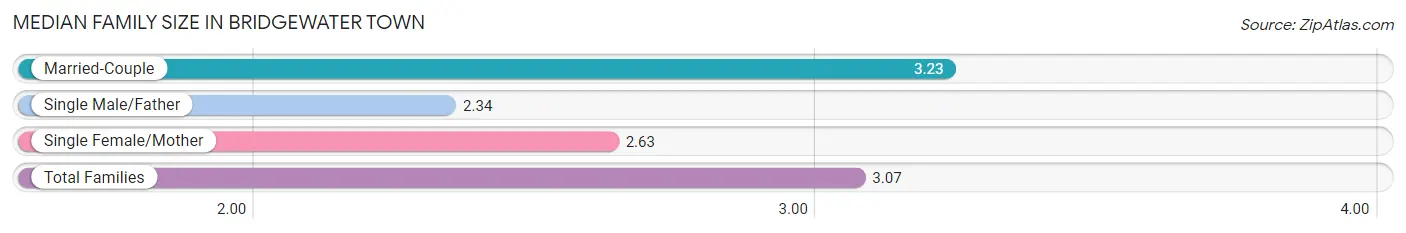
| Family Type | # Families | Family Size |
| Married-Couple | 5,057 (76.4%) | 3.23 |
| Single Male/Father | 571 (8.6%) | 2.34 |
| Single Female/Mother | 987 (14.9%) | 2.63 |
| Total Families | 6,615 (100.0%) | 3.07 |
Median Household Size in Bridgewater Town
The median household size in Bridgewater Town is 2.66 persons per household, with married-couple households (5,057 | 55.0%) accounting for the largest median household size of 3.26 persons per household. non-family households (2,579 | 28.1%) represent the smallest median household size with 1.42 persons per household.
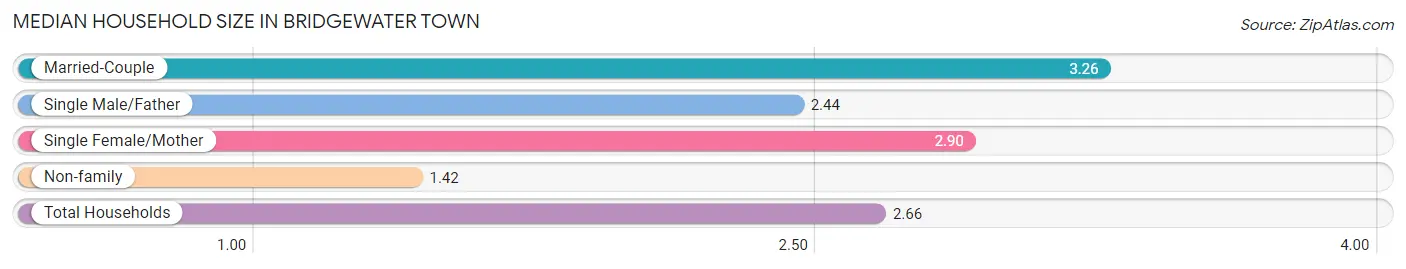
| Household Type | # Households | Household Size |
| Married-Couple | 5,057 (55.0%) | 3.26 |
| Single Male/Father | 571 (6.2%) | 2.44 |
| Single Female/Mother | 987 (10.7%) | 2.90 |
| Non-family | 2,579 (28.1%) | 1.42 |
| Total Households | 9,194 (100.0%) | 2.66 |
Household Size by Marriage Status in Bridgewater Town
Out of a total of 9,194 households in Bridgewater Town, 6,615 (72.0%) are family households, while 2,579 (28.1%) are nonfamily households. The most numerous type of family households are 2-person households, comprising 2,965, and the most common type of nonfamily households are 1-person households, comprising 1,759.
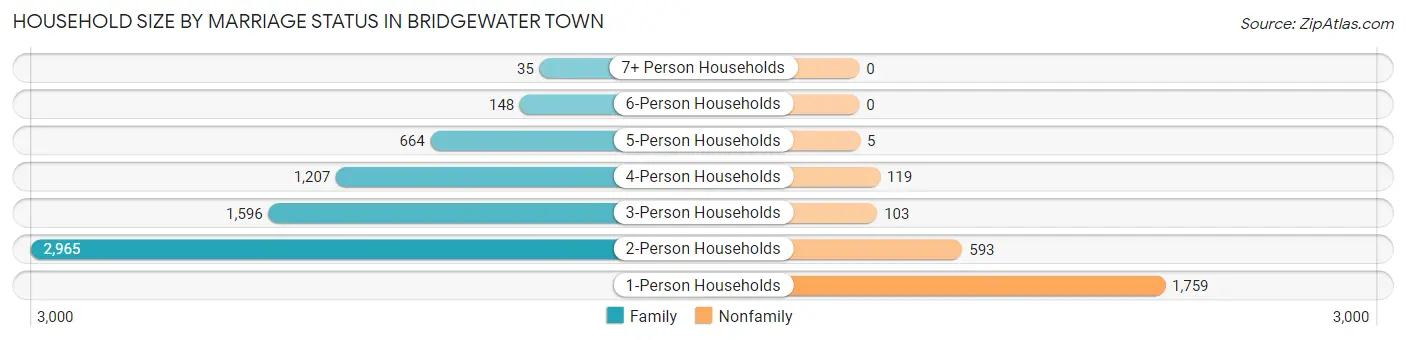
| Household Size | Family Households | Nonfamily Households |
| 1-Person Households | - | 1,759 (19.1%) |
| 2-Person Households | 2,965 (32.3%) | 593 (6.5%) |
| 3-Person Households | 1,596 (17.4%) | 103 (1.1%) |
| 4-Person Households | 1,207 (13.1%) | 119 (1.3%) |
| 5-Person Households | 664 (7.2%) | 5 (0.1%) |
| 6-Person Households | 148 (1.6%) | 0 (0.0%) |
| 7+ Person Households | 35 (0.4%) | 0 (0.0%) |
| Total | 6,615 (72.0%) | 2,579 (28.1%) |
Female Fertility in Bridgewater Town
Fertility by Age in Bridgewater Town
Average fertility rate in Bridgewater Town is 30.0 births per 1,000 women. Women in the age bracket of 20 to 34 years have the highest fertility rate with 38.0 births per 1,000 women. Women in the age bracket of 20 to 34 years acount for 59.3% of all women with births.
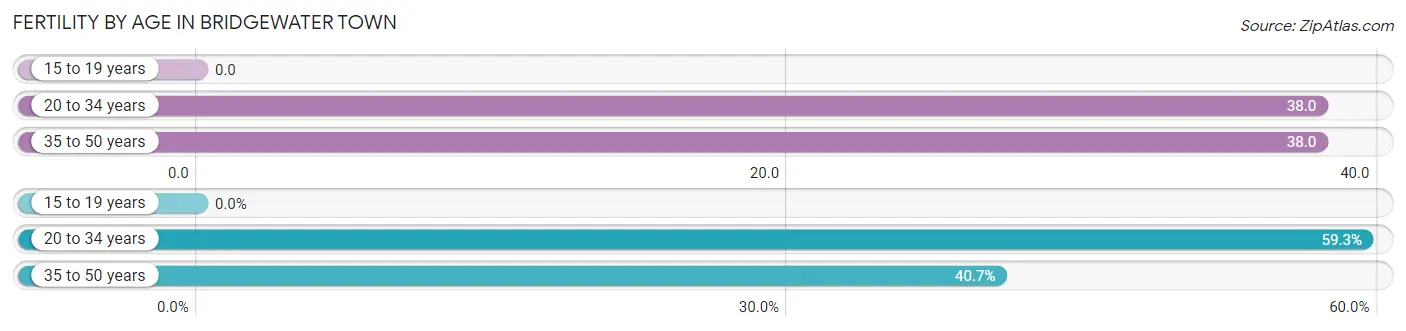
| Age Bracket | Women with Births | Births / 1,000 Women |
| 15 to 19 years | 0 (0.0%) | 0.0 |
| 20 to 34 years | 124 (59.3%) | 38.0 |
| 35 to 50 years | 85 (40.7%) | 38.0 |
| Total | 209 (100.0%) | 30.0 |
Fertility by Age by Marriage Status in Bridgewater Town
86.1% of women with births (209) in Bridgewater Town are married. The highest percentage of unmarried women with births falls into 20 to 34 years age bracket with 19.4% of them unmarried at the time of birth, while the lowest percentage of unmarried women with births belong to 35 to 50 years age bracket with 5.9% of them unmarried.
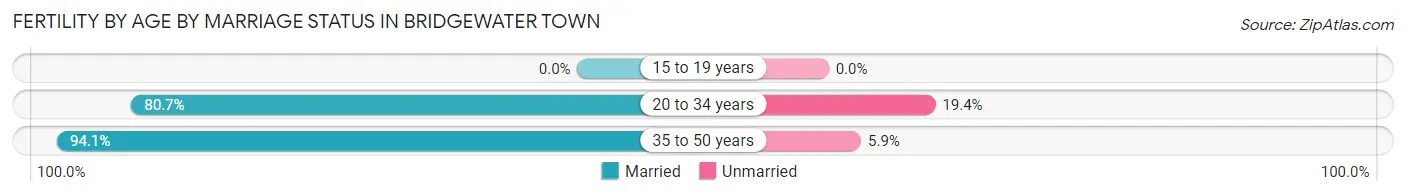
| Age Bracket | Married | Unmarried |
| 15 to 19 years | 0 (0.0%) | 0 (0.0%) |
| 20 to 34 years | 100 (80.6%) | 24 (19.4%) |
| 35 to 50 years | 80 (94.1%) | 5 (5.9%) |
| Total | 180 (86.1%) | 29 (13.9%) |
Fertility by Education in Bridgewater Town
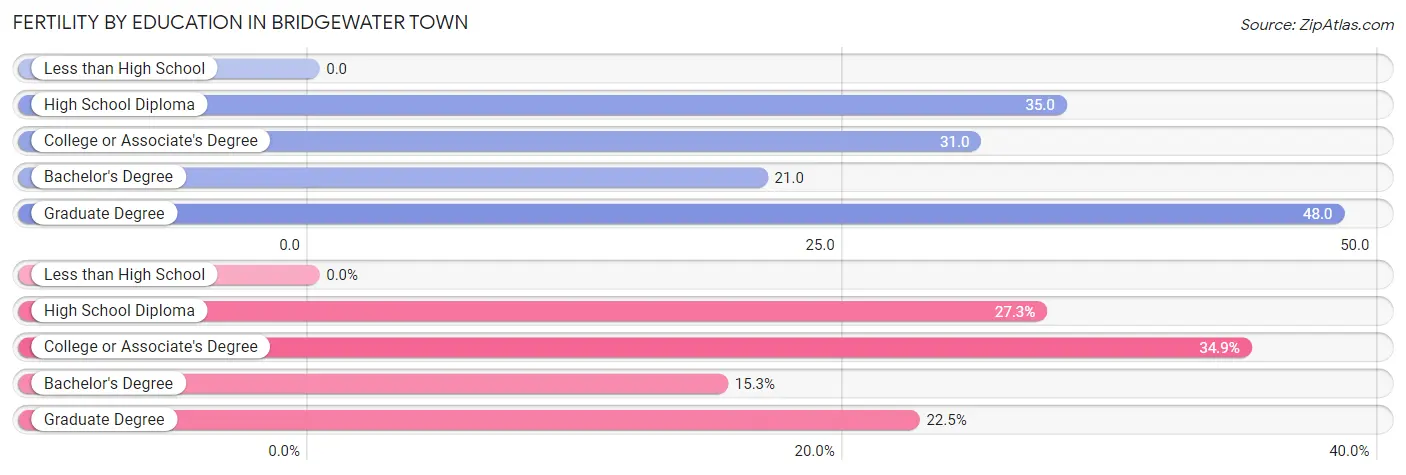
| Educational Attainment | Women with Births | Births / 1,000 Women |
| Less than High School | 0 (0.0%) | 0.0 |
| High School Diploma | 57 (27.3%) | 35.0 |
| College or Associate's Degree | 73 (34.9%) | 31.0 |
| Bachelor's Degree | 32 (15.3%) | 21.0 |
| Graduate Degree | 47 (22.5%) | 48.0 |
| Total | 209 (100.0%) | 30.0 |
Fertility by Education by Marriage Status in Bridgewater Town
13.9% of women with births in Bridgewater Town are unmarried. Women with the educational attainment of bachelor's degree are most likely to be married with 100.0% of them married at childbirth, while women with the educational attainment of high school diploma are least likely to be married with 31.6% of them unmarried at childbirth.
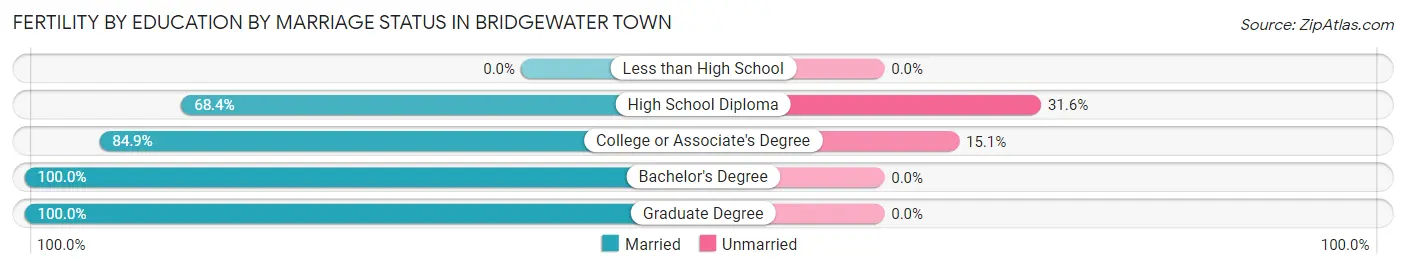
| Educational Attainment | Married | Unmarried |
| Less than High School | 0 (0.0%) | 0 (0.0%) |
| High School Diploma | 39 (68.4%) | 18 (31.6%) |
| College or Associate's Degree | 62 (84.9%) | 11 (15.1%) |
| Bachelor's Degree | 32 (100.0%) | 0 (0.0%) |
| Graduate Degree | 47 (100.0%) | 0 (0.0%) |
| Total | 180 (86.1%) | 29 (13.9%) |
Employment Characteristics in Bridgewater Town
Employment by Class of Employer in Bridgewater Town
Among the 14,486 employed individuals in Bridgewater Town, private company employees (9,846 | 68.0%), not-for-profit organizations (1,343 | 9.3%), and local government employees (1,065 | 7.3%) make up the most common classes of employment.
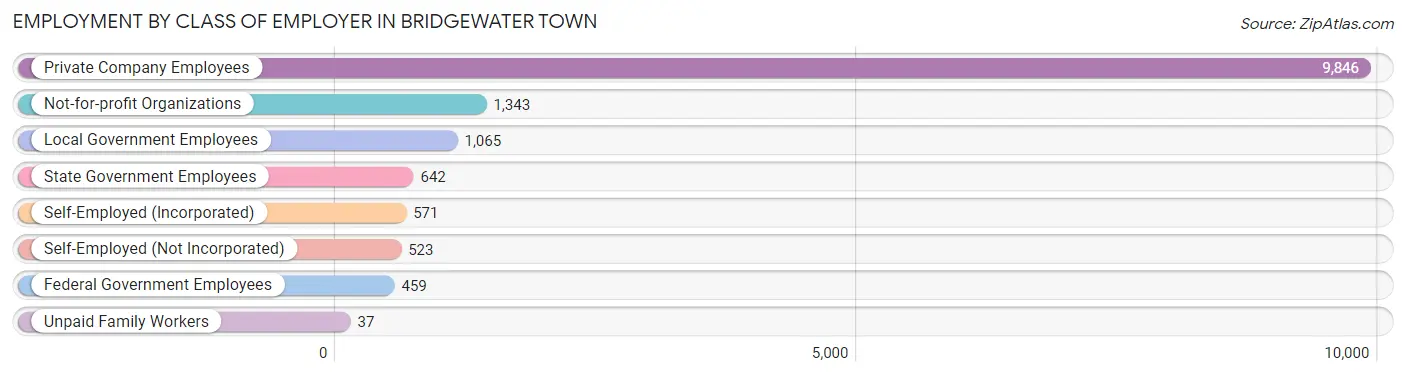
| Employer Class | # Employees | % Employees |
| Private Company Employees | 9,846 | 68.0% |
| Self-Employed (Incorporated) | 571 | 3.9% |
| Self-Employed (Not Incorporated) | 523 | 3.6% |
| Not-for-profit Organizations | 1,343 | 9.3% |
| Local Government Employees | 1,065 | 7.3% |
| State Government Employees | 642 | 4.4% |
| Federal Government Employees | 459 | 3.2% |
| Unpaid Family Workers | 37 | 0.3% |
| Total | 14,486 | 100.0% |
Employment Status by Age in Bridgewater Town
According to the labor force statistics for Bridgewater Town, out of the total population over 16 years of age (24,303), 63.7% or 15,481 individuals are in the labor force, with 4.8% or 743 of them unemployed. The age group with the highest labor force participation rate is 45 to 54 years, with 85.2% or 2,857 individuals in the labor force. Within the labor force, the 75 years and over age range has the highest percentage of unemployed individuals, with 9.8% or 16 of them being unemployed.
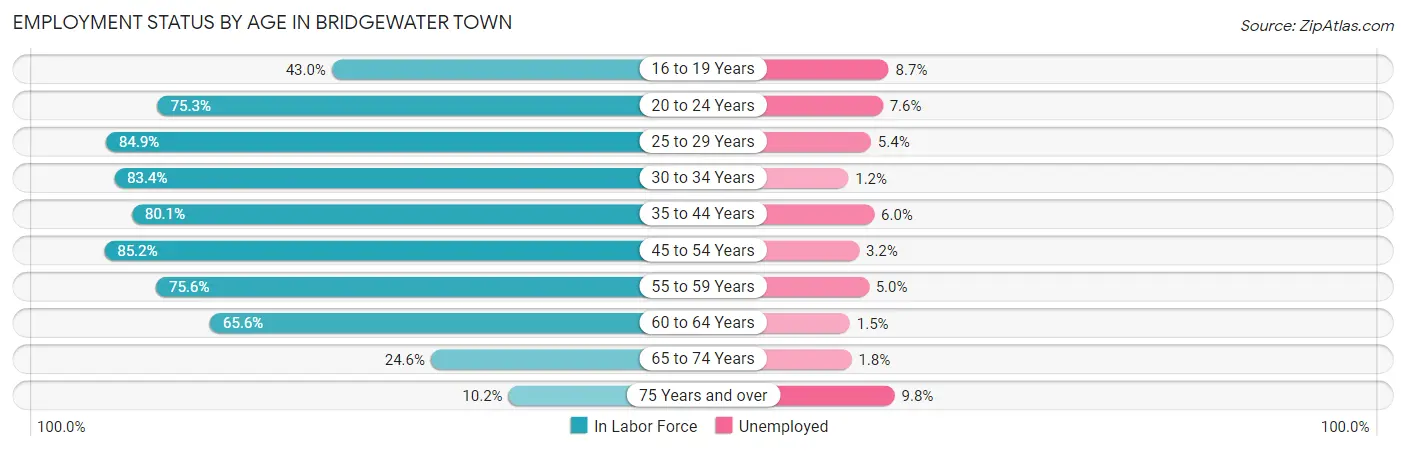
| Age Bracket | In Labor Force | Unemployed |
| 16 to 19 Years | 1,083 (43.0%) | 94 (8.7%) |
| 20 to 24 Years | 2,558 (75.3%) | 194 (7.6%) |
| 25 to 29 Years | 1,508 (84.9%) | 81 (5.4%) |
| 30 to 34 Years | 1,594 (83.4%) | 19 (1.2%) |
| 35 to 44 Years | 2,546 (80.1%) | 153 (6.0%) |
| 45 to 54 Years | 2,857 (85.2%) | 91 (3.2%) |
| 55 to 59 Years | 1,312 (75.6%) | 66 (5.0%) |
| 60 to 64 Years | 1,074 (65.6%) | 16 (1.5%) |
| 65 to 74 Years | 785 (24.6%) | 14 (1.8%) |
| 75 Years and over | 164 (10.2%) | 16 (9.8%) |
| Total | 15,481 (63.7%) | 743 (4.8%) |
Employment Status by Educational Attainment in Bridgewater Town
According to labor force statistics for Bridgewater Town, 80.1% of individuals (10,886) out of the total population between 25 and 64 years of age (13,590) are in the labor force, with 3.9% or 425 of them being unemployed. The group with the highest labor force participation rate are those with the educational attainment of bachelor's degree or higher, with 92.1% or 5,571 individuals in the labor force. Within the labor force, individuals with less than high school education have the highest percentage of unemployment, with 35.5% or 82 of them being unemployed.
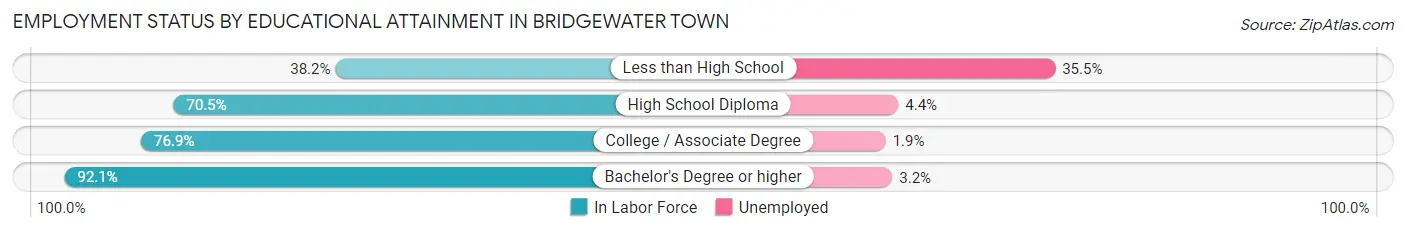
| Educational Attainment | In Labor Force | Unemployed |
| Less than High School | 231 (38.2%) | 214 (35.5%) |
| High School Diploma | 2,749 (70.5%) | 172 (4.4%) |
| College / Associate Degree | 2,336 (76.9%) | 58 (1.9%) |
| Bachelor's Degree or higher | 5,571 (92.1%) | 194 (3.2%) |
| Total | 10,886 (80.1%) | 530 (3.9%) |
Employment Occupations by Sex in Bridgewater Town
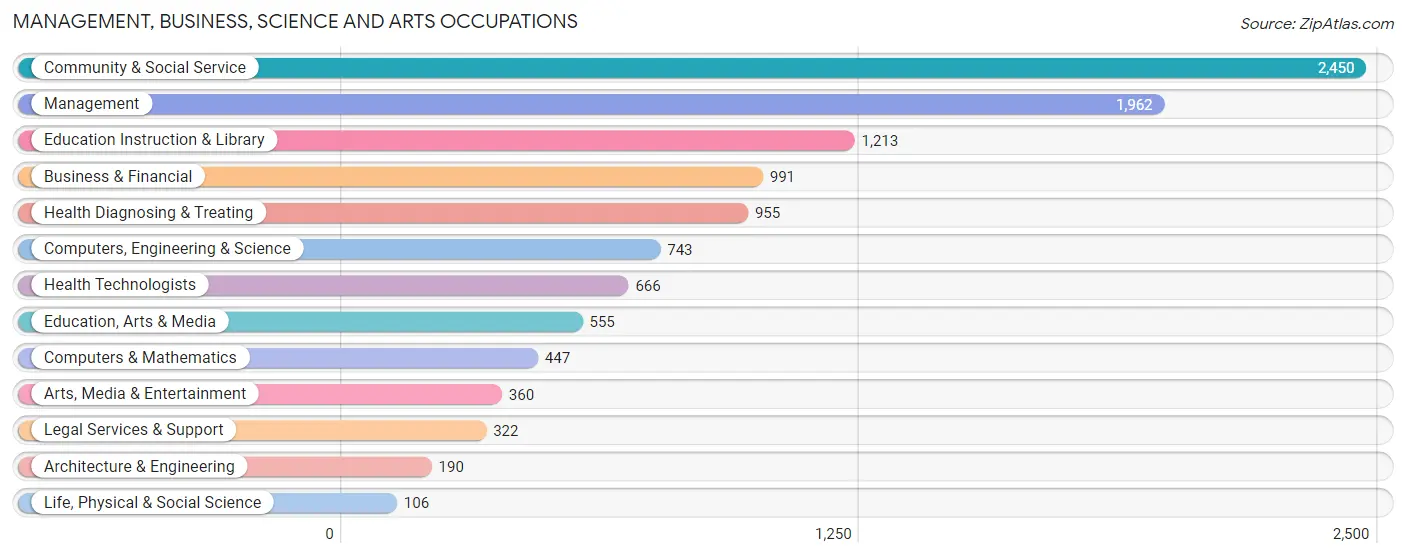
Management, Business, Science and Arts Occupations
The most common Management, Business, Science and Arts occupations in Bridgewater Town are Community & Social Service (2,450 | 16.7%), Management (1,962 | 13.4%), Education Instruction & Library (1,213 | 8.3%), Business & Financial (991 | 6.8%), and Health Diagnosing & Treating (955 | 6.5%).
Management, Business, Science and Arts Occupations by Sex
Within the Management, Business, Science and Arts occupations in Bridgewater Town, the most male-oriented occupations are Architecture & Engineering (95.8%), Arts, Media & Entertainment (81.7%), and Computers & Mathematics (77.0%), while the most female-oriented occupations are Education, Arts & Media (90.3%), Health Technologists (87.8%), and Health Diagnosing & Treating (79.5%).
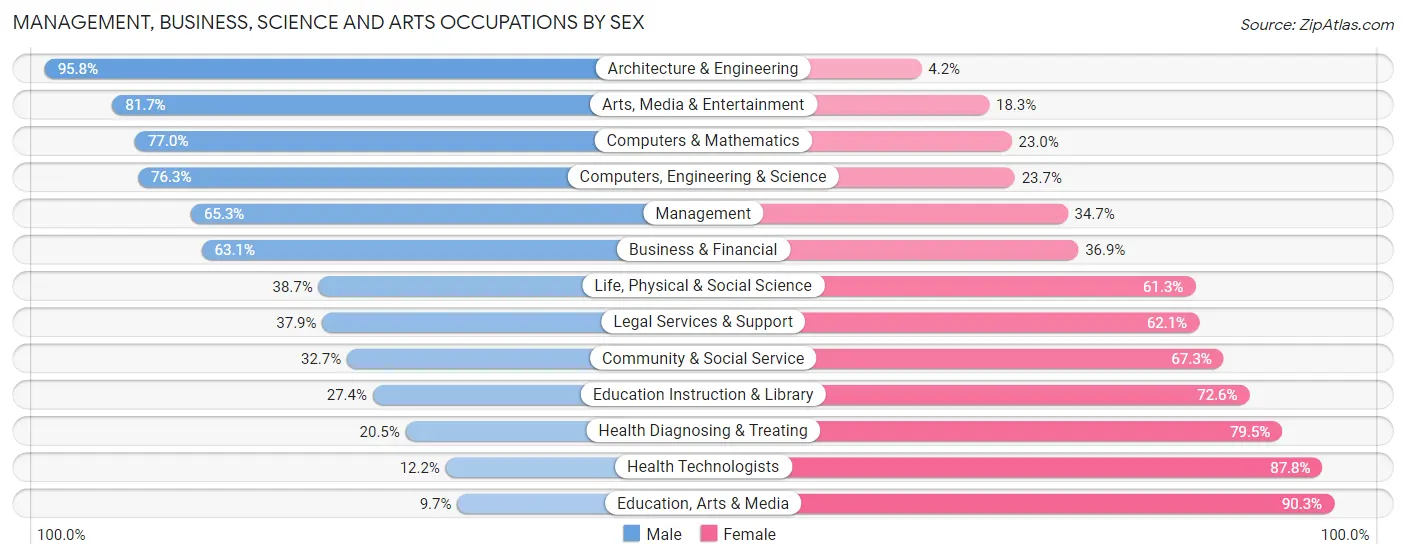
| Occupation | Male | Female |
| Management | 1,281 (65.3%) | 681 (34.7%) |
| Business & Financial | 625 (63.1%) | 366 (36.9%) |
| Computers, Engineering & Science | 567 (76.3%) | 176 (23.7%) |
| Computers & Mathematics | 344 (77.0%) | 103 (23.0%) |
| Architecture & Engineering | 182 (95.8%) | 8 (4.2%) |
| Life, Physical & Social Science | 41 (38.7%) | 65 (61.3%) |
| Community & Social Service | 802 (32.7%) | 1,648 (67.3%) |
| Education, Arts & Media | 54 (9.7%) | 501 (90.3%) |
| Legal Services & Support | 122 (37.9%) | 200 (62.1%) |
| Education Instruction & Library | 332 (27.4%) | 881 (72.6%) |
| Arts, Media & Entertainment | 294 (81.7%) | 66 (18.3%) |
| Health Diagnosing & Treating | 196 (20.5%) | 759 (79.5%) |
| Health Technologists | 81 (12.2%) | 585 (87.8%) |
| Total (Category) | 3,471 (48.9%) | 3,630 (51.1%) |
| Total (Overall) | 7,688 (52.3%) | 7,004 (47.7%) |
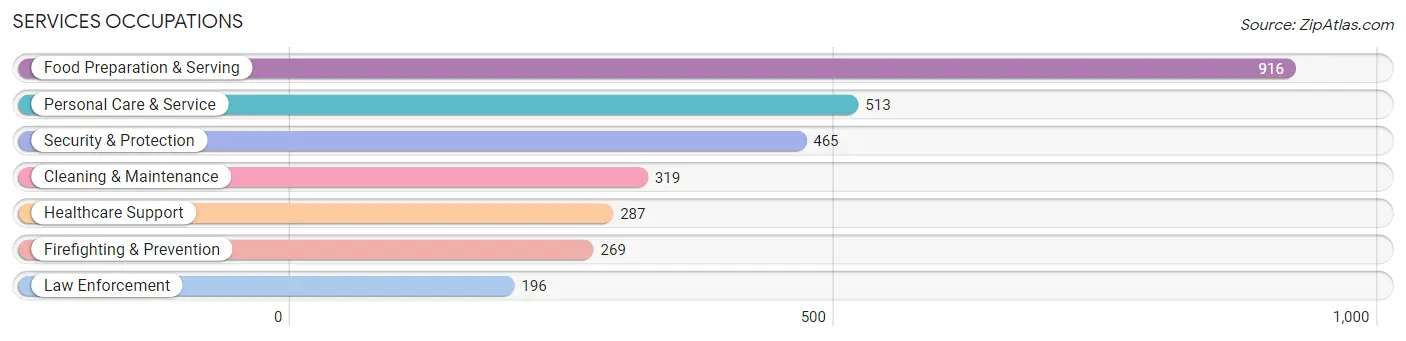
Services Occupations
The most common Services occupations in Bridgewater Town are Food Preparation & Serving (916 | 6.2%), Personal Care & Service (513 | 3.5%), Security & Protection (465 | 3.2%), Cleaning & Maintenance (319 | 2.2%), and Healthcare Support (287 | 1.9%).
Services Occupations by Sex
Within the Services occupations in Bridgewater Town, the most male-oriented occupations are Law Enforcement (81.6%), Security & Protection (71.4%), and Firefighting & Prevention (63.9%), while the most female-oriented occupations are Healthcare Support (87.8%), Personal Care & Service (75.6%), and Food Preparation & Serving (66.7%).
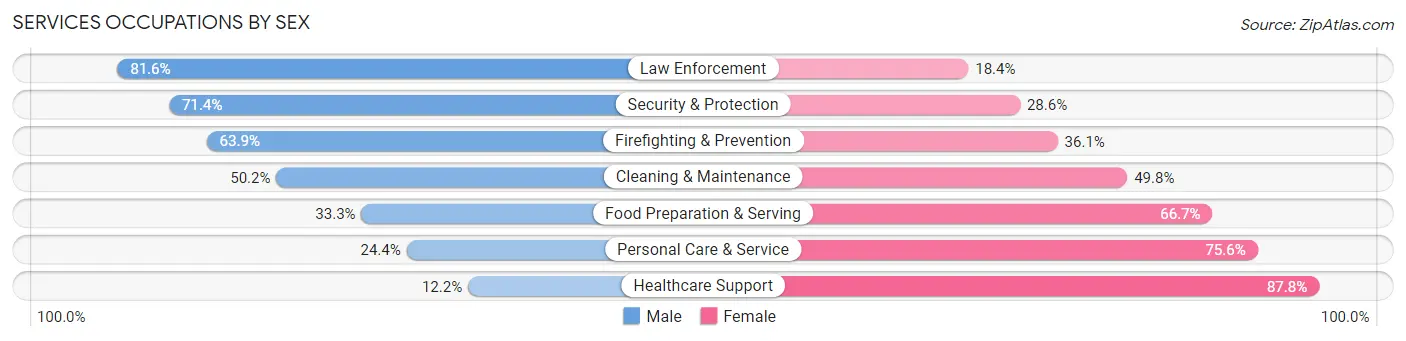
| Occupation | Male | Female |
| Healthcare Support | 35 (12.2%) | 252 (87.8%) |
| Security & Protection | 332 (71.4%) | 133 (28.6%) |
| Firefighting & Prevention | 172 (63.9%) | 97 (36.1%) |
| Law Enforcement | 160 (81.6%) | 36 (18.4%) |
| Food Preparation & Serving | 305 (33.3%) | 611 (66.7%) |
| Cleaning & Maintenance | 160 (50.2%) | 159 (49.8%) |
| Personal Care & Service | 125 (24.4%) | 388 (75.6%) |
| Total (Category) | 957 (38.3%) | 1,543 (61.7%) |
| Total (Overall) | 7,688 (52.3%) | 7,004 (47.7%) |
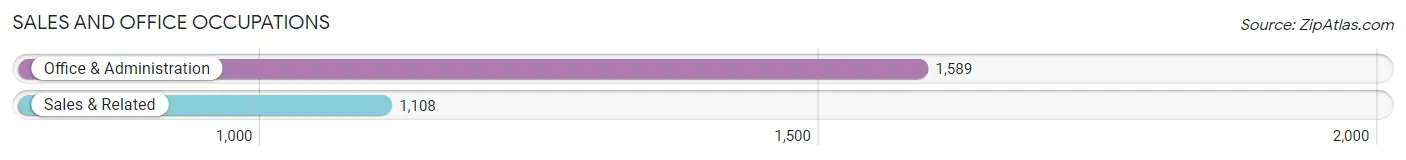
Sales and Office Occupations
The most common Sales and Office occupations in Bridgewater Town are Office & Administration (1,589 | 10.8%), and Sales & Related (1,108 | 7.5%).
Sales and Office Occupations by Sex
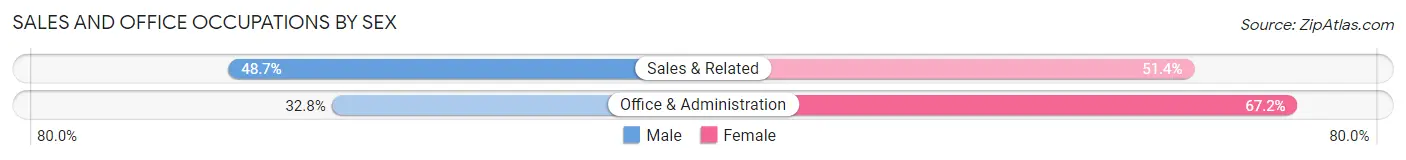
| Occupation | Male | Female |
| Sales & Related | 539 (48.6%) | 569 (51.3%) |
| Office & Administration | 521 (32.8%) | 1,068 (67.2%) |
| Total (Category) | 1,060 (39.3%) | 1,637 (60.7%) |
| Total (Overall) | 7,688 (52.3%) | 7,004 (47.7%) |
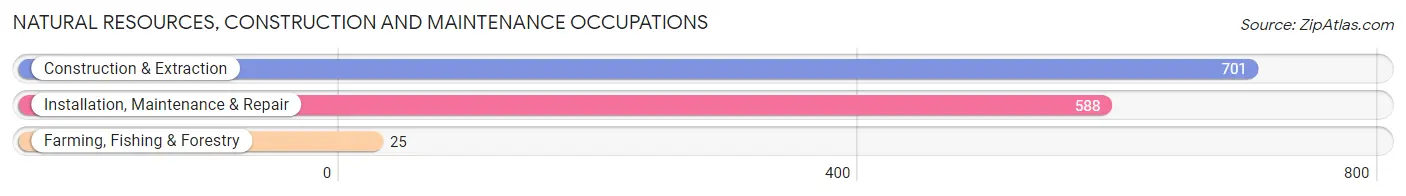
Natural Resources, Construction and Maintenance Occupations
The most common Natural Resources, Construction and Maintenance occupations in Bridgewater Town are Construction & Extraction (701 | 4.8%), Installation, Maintenance & Repair (588 | 4.0%), and Farming, Fishing & Forestry (25 | 0.2%).
Natural Resources, Construction and Maintenance Occupations by Sex
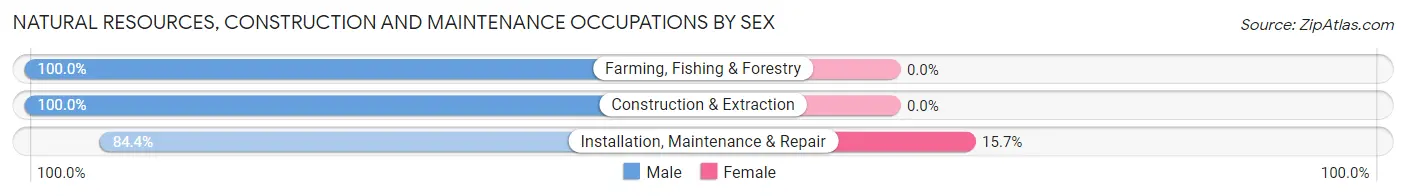
| Occupation | Male | Female |
| Farming, Fishing & Forestry | 25 (100.0%) | 0 (0.0%) |
| Construction & Extraction | 701 (100.0%) | 0 (0.0%) |
| Installation, Maintenance & Repair | 496 (84.4%) | 92 (15.7%) |
| Total (Category) | 1,222 (93.0%) | 92 (7.0%) |
| Total (Overall) | 7,688 (52.3%) | 7,004 (47.7%) |
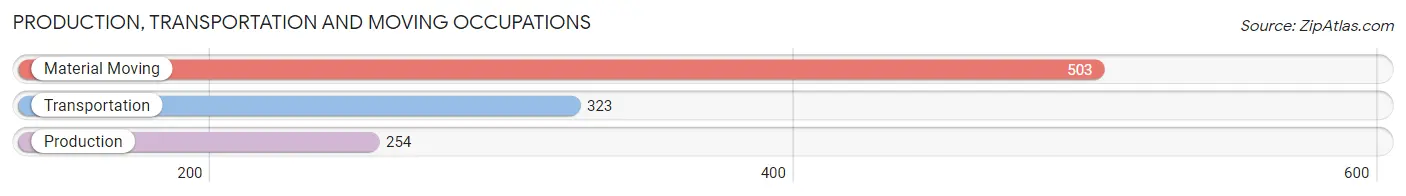
Production, Transportation and Moving Occupations
The most common Production, Transportation and Moving occupations in Bridgewater Town are Material Moving (503 | 3.4%), Transportation (323 | 2.2%), and Production (254 | 1.7%).
Production, Transportation and Moving Occupations by Sex
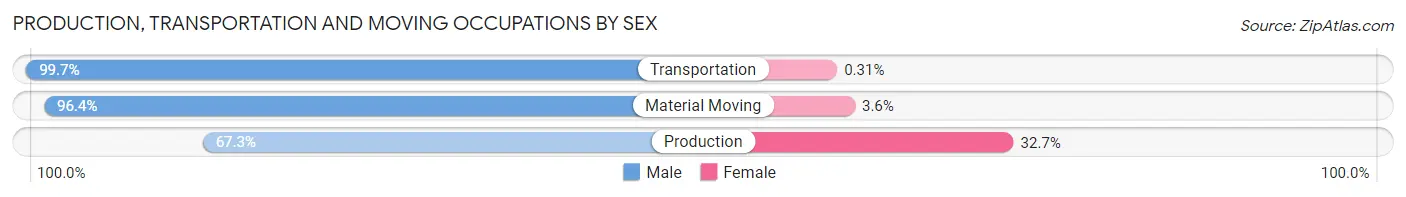
| Occupation | Male | Female |
| Production | 171 (67.3%) | 83 (32.7%) |
| Transportation | 322 (99.7%) | 1 (0.3%) |
| Material Moving | 485 (96.4%) | 18 (3.6%) |
| Total (Category) | 978 (90.6%) | 102 (9.4%) |
| Total (Overall) | 7,688 (52.3%) | 7,004 (47.7%) |
Employment Industries by Sex in Bridgewater Town
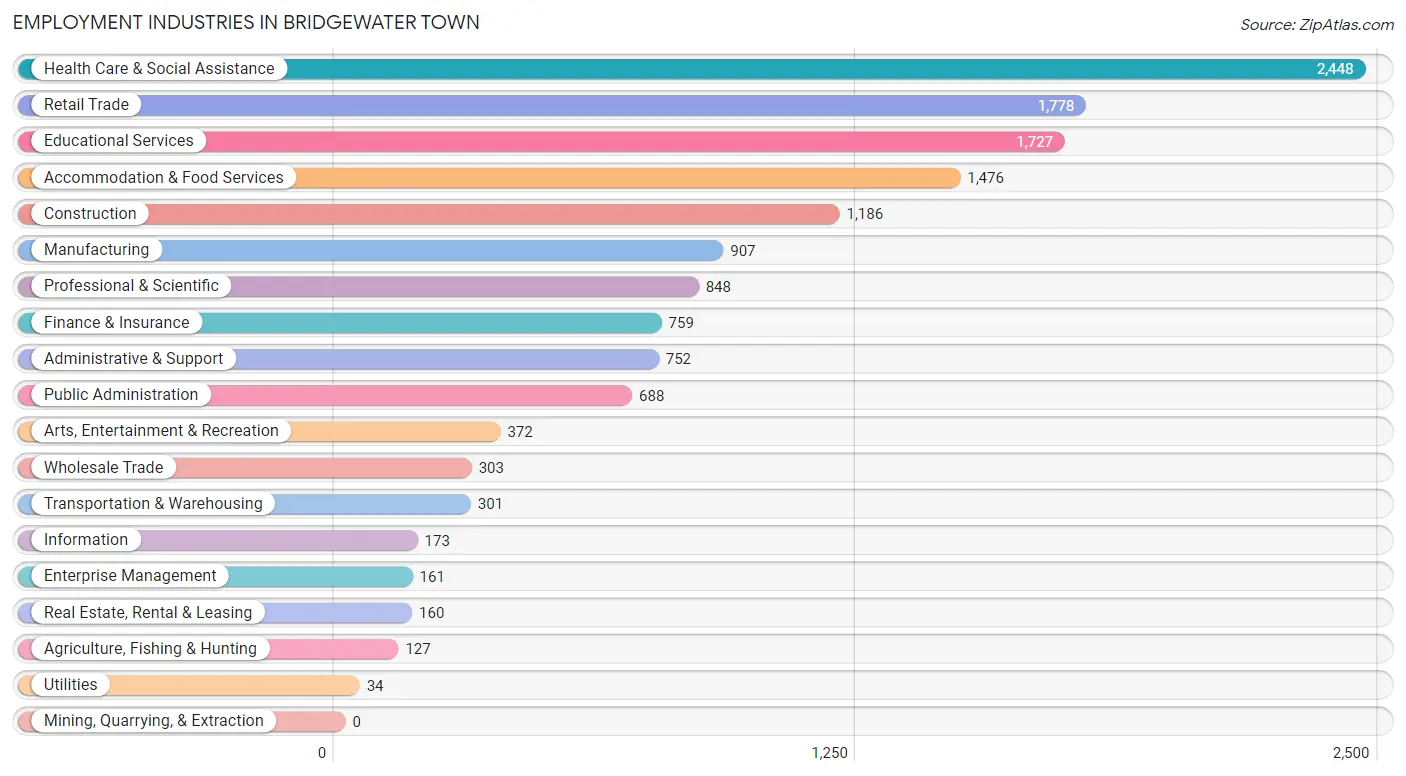
Employment Industries in Bridgewater Town
The major employment industries in Bridgewater Town include Health Care & Social Assistance (2,448 | 16.7%), Retail Trade (1,778 | 12.1%), Educational Services (1,727 | 11.7%), Accommodation & Food Services (1,476 | 10.1%), and Construction (1,186 | 8.1%).
Employment Industries by Sex in Bridgewater Town
The Bridgewater Town industries that see more men than women are Utilities (100.0%), Transportation & Warehousing (87.7%), and Real Estate, Rental & Leasing (85.6%), whereas the industries that tend to have a higher number of women are Health Care & Social Assistance (79.3%), Educational Services (68.7%), and Agriculture, Fishing & Hunting (66.9%).
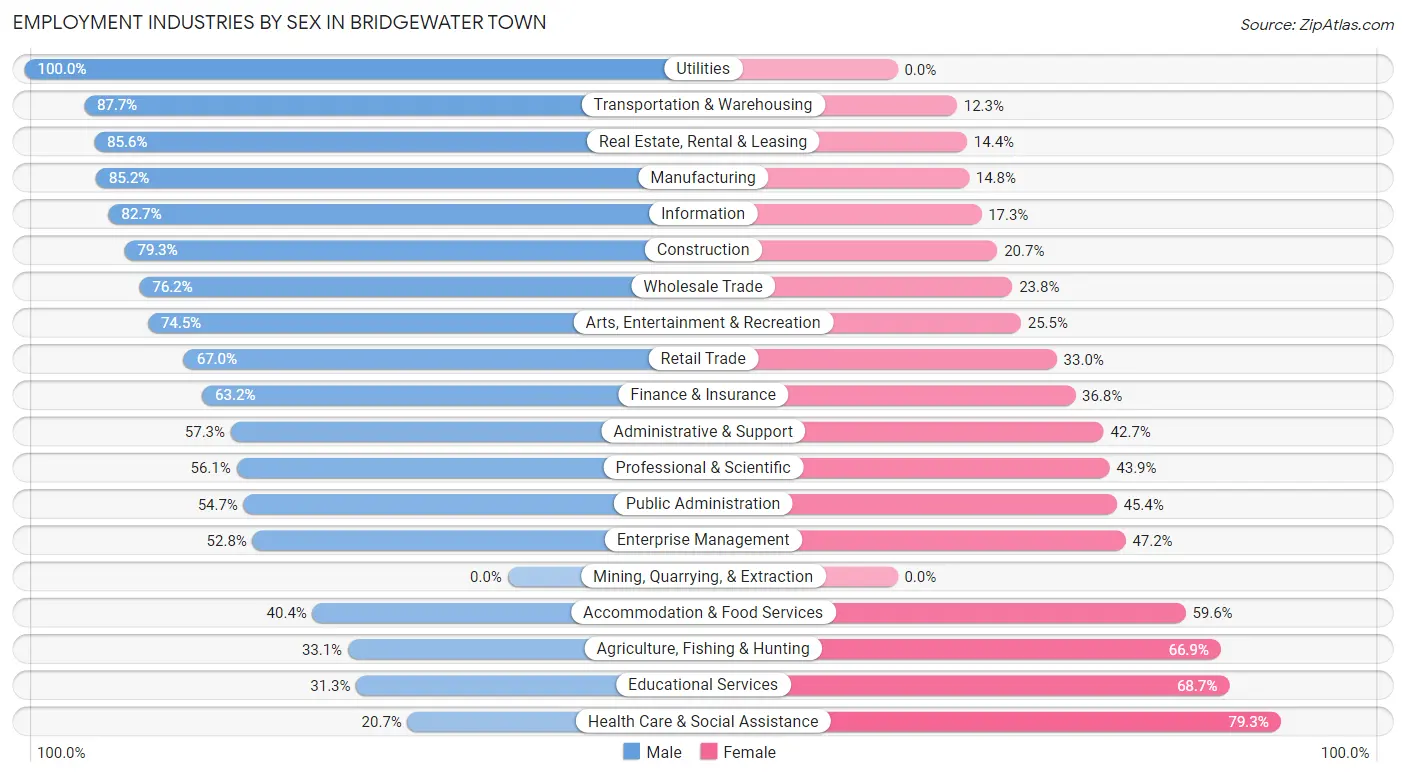
| Industry | Male | Female |
| Agriculture, Fishing & Hunting | 42 (33.1%) | 85 (66.9%) |
| Mining, Quarrying, & Extraction | 0 (0.0%) | 0 (0.0%) |
| Construction | 941 (79.3%) | 245 (20.7%) |
| Manufacturing | 773 (85.2%) | 134 (14.8%) |
| Wholesale Trade | 231 (76.2%) | 72 (23.8%) |
| Retail Trade | 1,192 (67.0%) | 586 (33.0%) |
| Transportation & Warehousing | 264 (87.7%) | 37 (12.3%) |
| Utilities | 34 (100.0%) | 0 (0.0%) |
| Information | 143 (82.7%) | 30 (17.3%) |
| Finance & Insurance | 480 (63.2%) | 279 (36.8%) |
| Real Estate, Rental & Leasing | 137 (85.6%) | 23 (14.4%) |
| Professional & Scientific | 476 (56.1%) | 372 (43.9%) |
| Enterprise Management | 85 (52.8%) | 76 (47.2%) |
| Administrative & Support | 431 (57.3%) | 321 (42.7%) |
| Educational Services | 541 (31.3%) | 1,186 (68.7%) |
| Health Care & Social Assistance | 507 (20.7%) | 1,941 (79.3%) |
| Arts, Entertainment & Recreation | 277 (74.5%) | 95 (25.5%) |
| Accommodation & Food Services | 596 (40.4%) | 880 (59.6%) |
| Public Administration | 376 (54.6%) | 312 (45.4%) |
| Total | 7,688 (52.3%) | 7,004 (47.7%) |
Education in Bridgewater Town
School Enrollment in Bridgewater Town
The most common levels of schooling among the 8,551 students in Bridgewater Town are college / undergraduate (4,142 | 48.4%), high school (1,245 | 14.6%), and elementary school (1,022 | 11.9%).
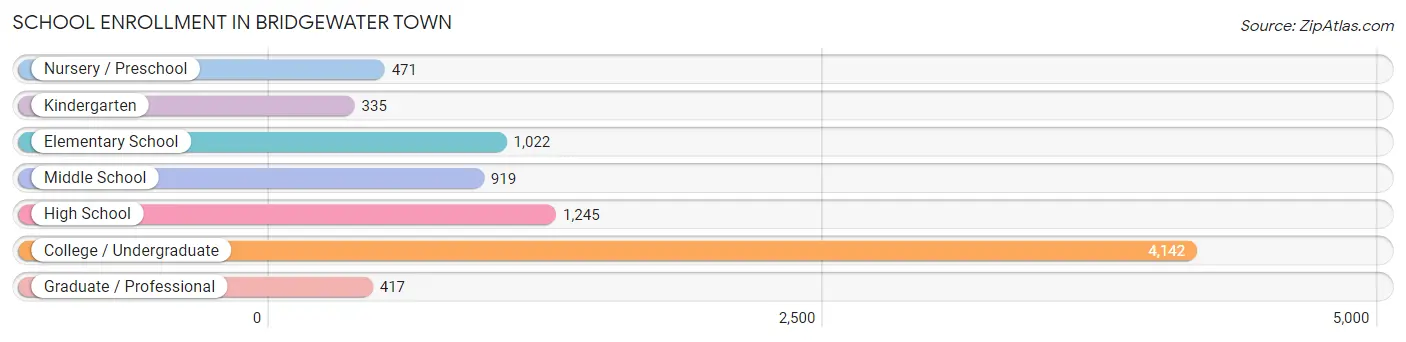
| School Level | # Students | % Students |
| Nursery / Preschool | 471 | 5.5% |
| Kindergarten | 335 | 3.9% |
| Elementary School | 1,022 | 11.9% |
| Middle School | 919 | 10.7% |
| High School | 1,245 | 14.6% |
| College / Undergraduate | 4,142 | 48.4% |
| Graduate / Professional | 417 | 4.9% |
| Total | 8,551 | 100.0% |
School Enrollment by Age by Funding Source in Bridgewater Town
Out of a total of 8,551 students who are enrolled in schools in Bridgewater Town, 1,129 (13.2%) attend a private institution, while the remaining 7,422 (86.8%) are enrolled in public schools. The age group of 35 years and over has the highest likelihood of being enrolled in private schools, with 178 (78.8% in the age bracket) enrolled. Conversely, the age group of 10 to 14 year olds has the lowest likelihood of being enrolled in a private school, with 1,109 (96.4% in the age bracket) attending a public institution.
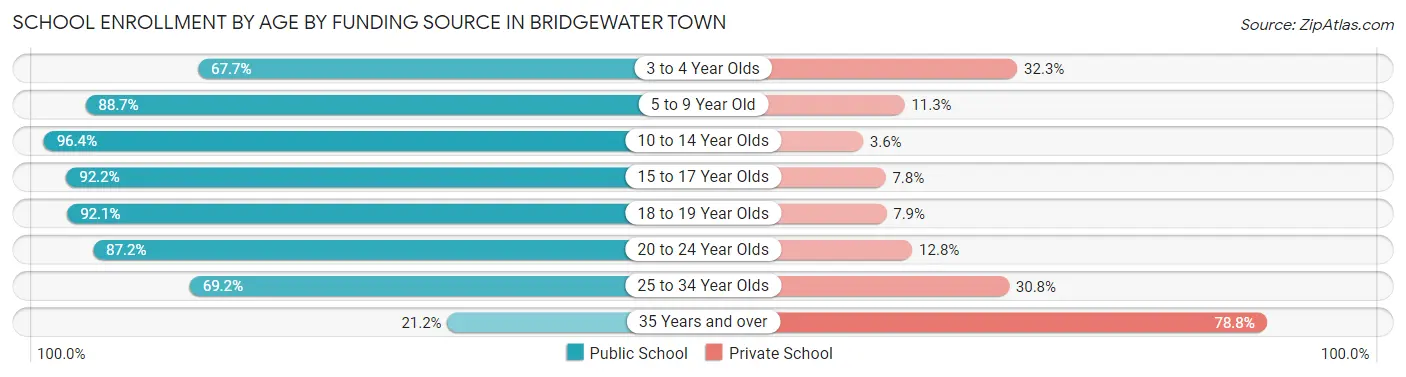
| Age Bracket | Public School | Private School |
| 3 to 4 Year Olds | 287 (67.7%) | 137 (32.3%) |
| 5 to 9 Year Old | 1,159 (88.7%) | 148 (11.3%) |
| 10 to 14 Year Olds | 1,109 (96.4%) | 41 (3.6%) |
| 15 to 17 Year Olds | 877 (92.2%) | 74 (7.8%) |
| 18 to 19 Year Olds | 1,542 (92.1%) | 133 (7.9%) |
| 20 to 24 Year Olds | 2,175 (87.2%) | 318 (12.8%) |
| 25 to 34 Year Olds | 225 (69.2%) | 100 (30.8%) |
| 35 Years and over | 48 (21.2%) | 178 (78.8%) |
| Total | 7,422 (86.8%) | 1,129 (13.2%) |
Educational Attainment by Field of Study in Bridgewater Town
Business (2,174 | 26.7%), science & technology (910 | 11.2%), education (801 | 9.9%), arts & humanities (729 | 9.0%), and psychology (603 | 7.4%) are the most common fields of study among 8,130 individuals in Bridgewater Town who have obtained a bachelor's degree or higher.
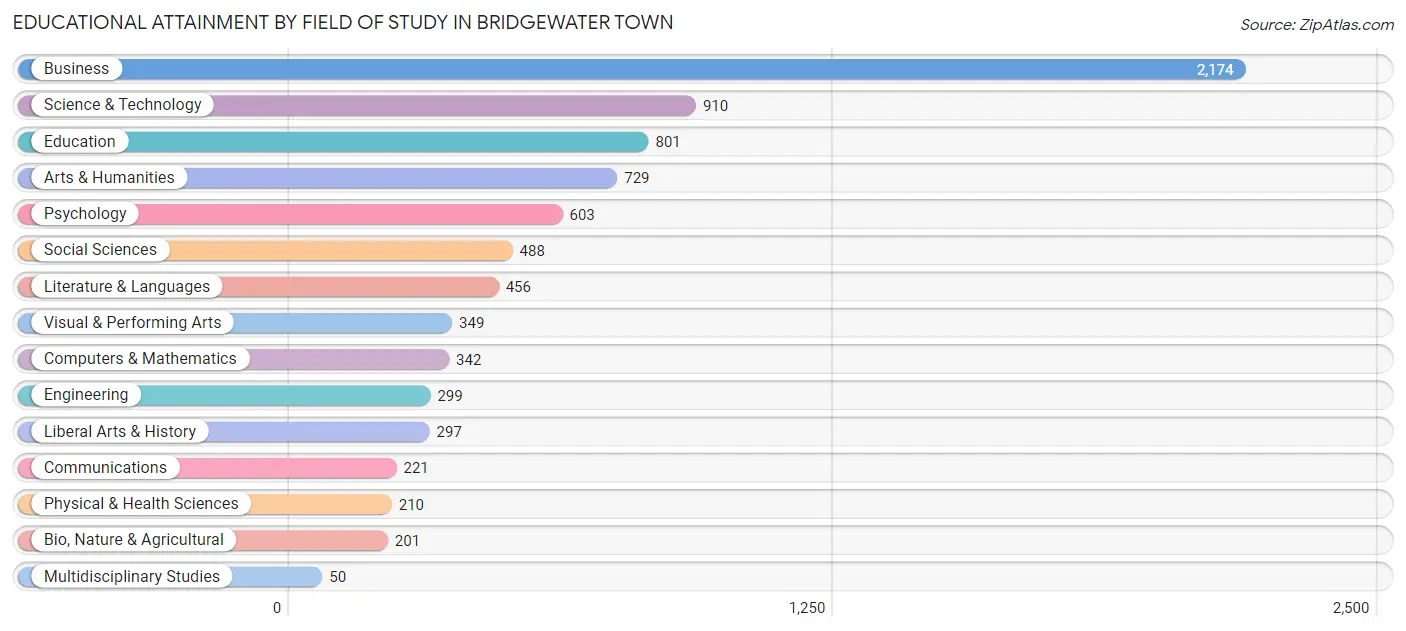
| Field of Study | # Graduates | % Graduates |
| Computers & Mathematics | 342 | 4.2% |
| Bio, Nature & Agricultural | 201 | 2.5% |
| Physical & Health Sciences | 210 | 2.6% |
| Psychology | 603 | 7.4% |
| Social Sciences | 488 | 6.0% |
| Engineering | 299 | 3.7% |
| Multidisciplinary Studies | 50 | 0.6% |
| Science & Technology | 910 | 11.2% |
| Business | 2,174 | 26.7% |
| Education | 801 | 9.9% |
| Literature & Languages | 456 | 5.6% |
| Liberal Arts & History | 297 | 3.6% |
| Visual & Performing Arts | 349 | 4.3% |
| Communications | 221 | 2.7% |
| Arts & Humanities | 729 | 9.0% |
| Total | 8,130 | 100.0% |
Transportation & Commute in Bridgewater Town
Vehicle Availability by Sex in Bridgewater Town
The most prevalent vehicle ownership categories in Bridgewater Town are males with 2 vehicles (3,221, accounting for 45.4%) and females with 2 vehicles (2,430, making up 52.3%).
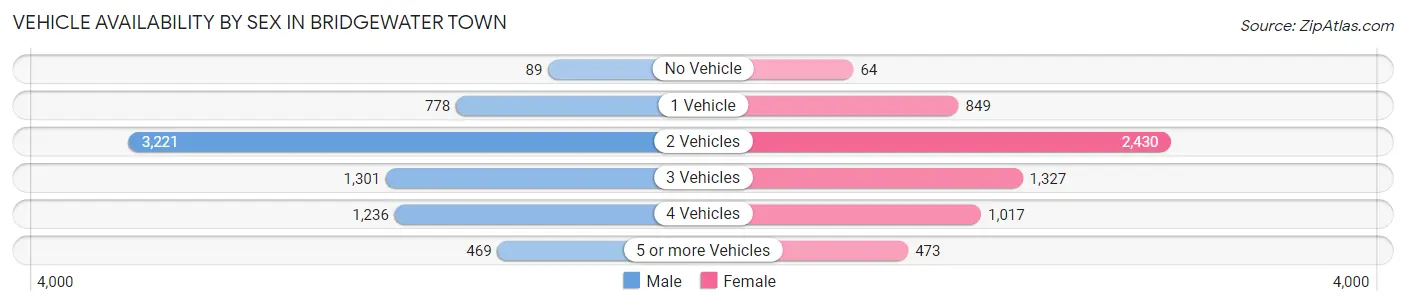
| Vehicles Available | Male | Female |
| No Vehicle | 89 (1.3%) | 64 (1.0%) |
| 1 Vehicle | 778 (11.0%) | 849 (13.8%) |
| 2 Vehicles | 3,221 (45.4%) | 2,430 (39.5%) |
| 3 Vehicles | 1,301 (18.3%) | 1,327 (21.5%) |
| 4 Vehicles | 1,236 (17.4%) | 1,017 (16.5%) |
| 5 or more Vehicles | 469 (6.6%) | 473 (7.7%) |
| Total | 7,094 (100.0%) | 6,160 (100.0%) |
Commute Time in Bridgewater Town
The most frequently occuring commute durations in Bridgewater Town are 30 to 34 minutes (1,663 commuters, 12.8%), 45 to 59 minutes (1,549 commuters, 11.9%), and 10 to 14 minutes (1,528 commuters, 11.7%).
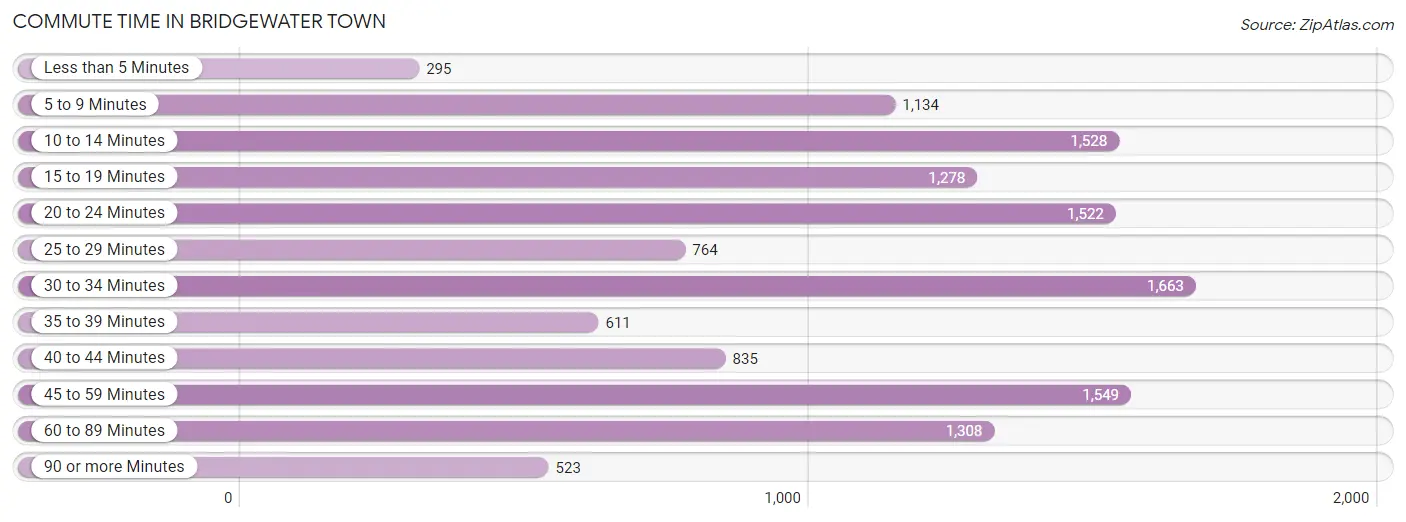
| Commute Time | # Commuters | % Commuters |
| Less than 5 Minutes | 295 | 2.3% |
| 5 to 9 Minutes | 1,134 | 8.7% |
| 10 to 14 Minutes | 1,528 | 11.7% |
| 15 to 19 Minutes | 1,278 | 9.8% |
| 20 to 24 Minutes | 1,522 | 11.7% |
| 25 to 29 Minutes | 764 | 5.9% |
| 30 to 34 Minutes | 1,663 | 12.8% |
| 35 to 39 Minutes | 611 | 4.7% |
| 40 to 44 Minutes | 835 | 6.4% |
| 45 to 59 Minutes | 1,549 | 11.9% |
| 60 to 89 Minutes | 1,308 | 10.1% |
| 90 or more Minutes | 523 | 4.0% |
Commute Time by Sex in Bridgewater Town
The most common commute times in Bridgewater Town are 30 to 34 minutes (963 commuters, 14.4%) for males and 10 to 14 minutes (946 commuters, 15.0%) for females.
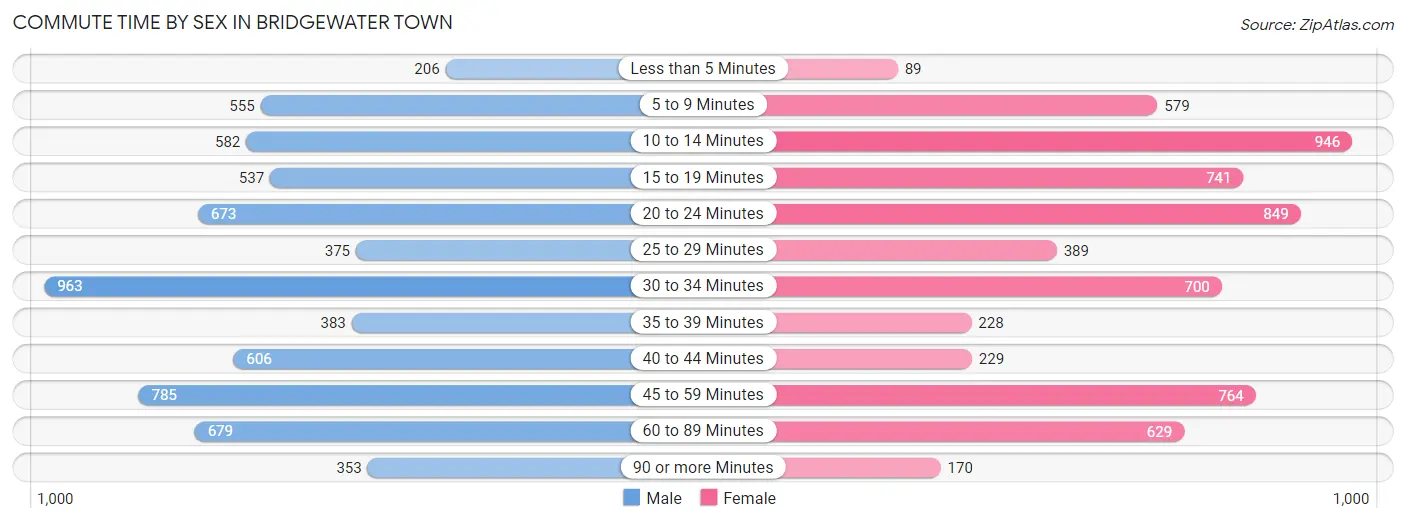
| Commute Time | Male | Female |
| Less than 5 Minutes | 206 (3.1%) | 89 (1.4%) |
| 5 to 9 Minutes | 555 (8.3%) | 579 (9.2%) |
| 10 to 14 Minutes | 582 (8.7%) | 946 (15.0%) |
| 15 to 19 Minutes | 537 (8.0%) | 741 (11.7%) |
| 20 to 24 Minutes | 673 (10.1%) | 849 (13.5%) |
| 25 to 29 Minutes | 375 (5.6%) | 389 (6.2%) |
| 30 to 34 Minutes | 963 (14.4%) | 700 (11.1%) |
| 35 to 39 Minutes | 383 (5.7%) | 228 (3.6%) |
| 40 to 44 Minutes | 606 (9.0%) | 229 (3.6%) |
| 45 to 59 Minutes | 785 (11.7%) | 764 (12.1%) |
| 60 to 89 Minutes | 679 (10.1%) | 629 (10.0%) |
| 90 or more Minutes | 353 (5.3%) | 170 (2.7%) |
Time of Departure to Work by Sex in Bridgewater Town
The most frequent times of departure to work in Bridgewater Town are 6:30 AM to 6:59 AM (940, 14.0%) for males and 7:30 AM to 7:59 AM (890, 14.1%) for females.
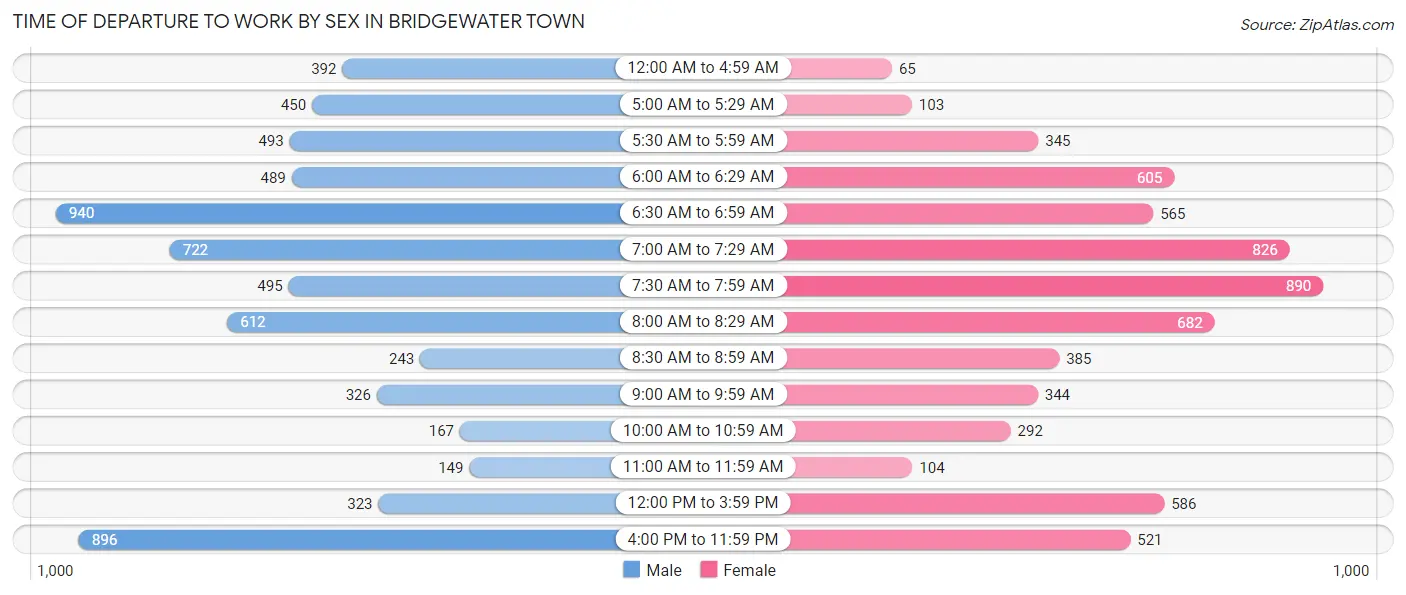
| Time of Departure | Male | Female |
| 12:00 AM to 4:59 AM | 392 (5.9%) | 65 (1.0%) |
| 5:00 AM to 5:29 AM | 450 (6.7%) | 103 (1.6%) |
| 5:30 AM to 5:59 AM | 493 (7.4%) | 345 (5.5%) |
| 6:00 AM to 6:29 AM | 489 (7.3%) | 605 (9.6%) |
| 6:30 AM to 6:59 AM | 940 (14.0%) | 565 (8.9%) |
| 7:00 AM to 7:29 AM | 722 (10.8%) | 826 (13.1%) |
| 7:30 AM to 7:59 AM | 495 (7.4%) | 890 (14.1%) |
| 8:00 AM to 8:29 AM | 612 (9.1%) | 682 (10.8%) |
| 8:30 AM to 8:59 AM | 243 (3.6%) | 385 (6.1%) |
| 9:00 AM to 9:59 AM | 326 (4.9%) | 344 (5.4%) |
| 10:00 AM to 10:59 AM | 167 (2.5%) | 292 (4.6%) |
| 11:00 AM to 11:59 AM | 149 (2.2%) | 104 (1.7%) |
| 12:00 PM to 3:59 PM | 323 (4.8%) | 586 (9.3%) |
| 4:00 PM to 11:59 PM | 896 (13.4%) | 521 (8.3%) |
| Total | 6,697 (100.0%) | 6,313 (100.0%) |
Housing Occupancy in Bridgewater Town
Occupancy by Ownership in Bridgewater Town
Of the total 9,194 dwellings in Bridgewater Town, owner-occupied units account for 6,809 (74.1%), while renter-occupied units make up 2,385 (25.9%).
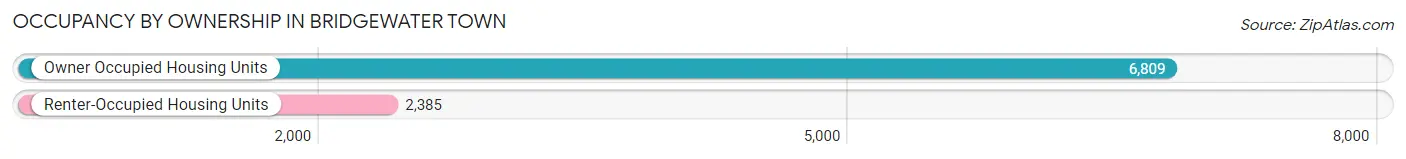
| Occupancy | # Housing Units | % Housing Units |
| Owner Occupied Housing Units | 6,809 | 74.1% |
| Renter-Occupied Housing Units | 2,385 | 25.9% |
| Total Occupied Housing Units | 9,194 | 100.0% |
Occupancy by Household Size in Bridgewater Town
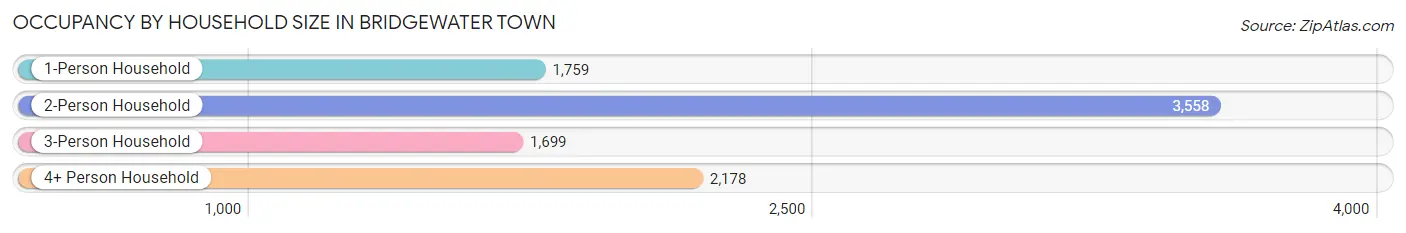
| Household Size | # Housing Units | % Housing Units |
| 1-Person Household | 1,759 | 19.1% |
| 2-Person Household | 3,558 | 38.7% |
| 3-Person Household | 1,699 | 18.5% |
| 4+ Person Household | 2,178 | 23.7% |
| Total Housing Units | 9,194 | 100.0% |
Occupancy by Ownership by Household Size in Bridgewater Town
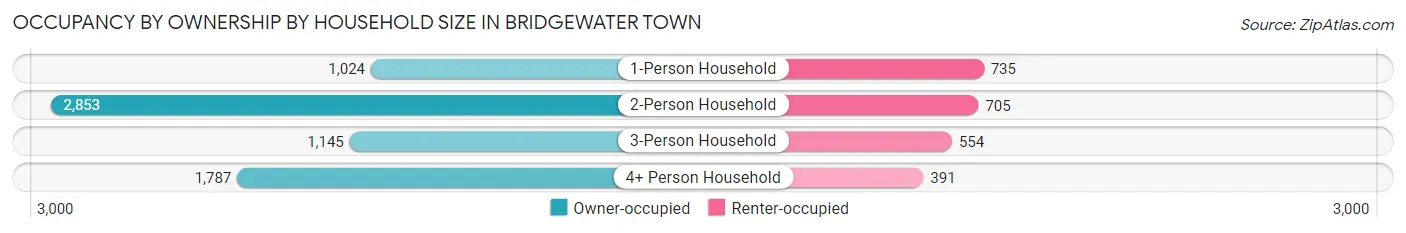
| Household Size | Owner-occupied | Renter-occupied |
| 1-Person Household | 1,024 (58.2%) | 735 (41.8%) |
| 2-Person Household | 2,853 (80.2%) | 705 (19.8%) |
| 3-Person Household | 1,145 (67.4%) | 554 (32.6%) |
| 4+ Person Household | 1,787 (82.1%) | 391 (17.9%) |
| Total Housing Units | 6,809 (74.1%) | 2,385 (25.9%) |
Occupancy by Educational Attainment in Bridgewater Town
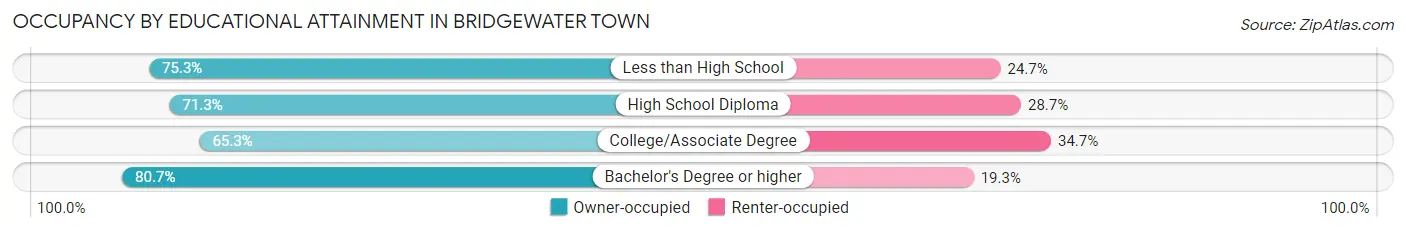
| Household Size | Owner-occupied | Renter-occupied |
| Less than High School | 168 (75.3%) | 55 (24.7%) |
| High School Diploma | 1,727 (71.3%) | 696 (28.7%) |
| College/Associate Degree | 1,566 (65.3%) | 831 (34.7%) |
| Bachelor's Degree or higher | 3,348 (80.7%) | 803 (19.3%) |
Occupancy by Age of Householder in Bridgewater Town
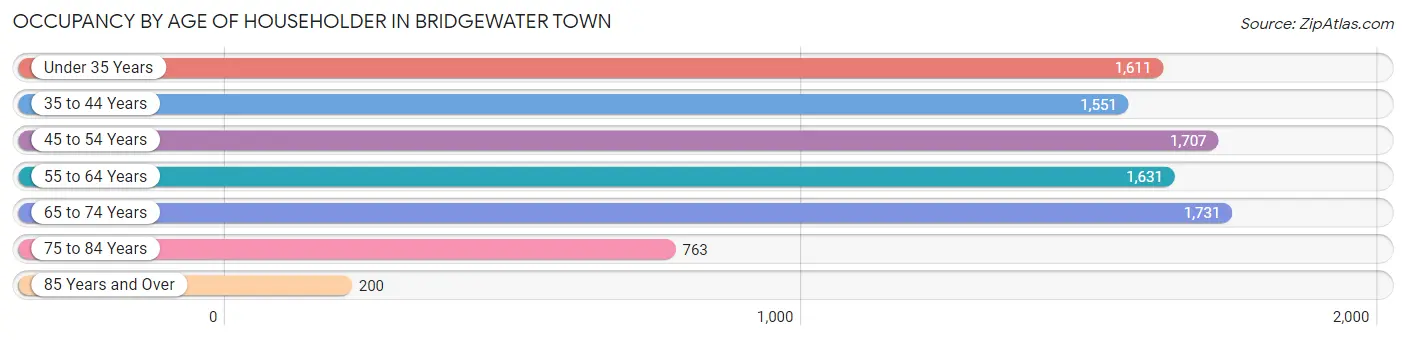
| Age Bracket | # Households | % Households |
| Under 35 Years | 1,611 | 17.5% |
| 35 to 44 Years | 1,551 | 16.9% |
| 45 to 54 Years | 1,707 | 18.6% |
| 55 to 64 Years | 1,631 | 17.7% |
| 65 to 74 Years | 1,731 | 18.8% |
| 75 to 84 Years | 763 | 8.3% |
| 85 Years and Over | 200 | 2.2% |
| Total | 9,194 | 100.0% |
Housing Finances in Bridgewater Town
Median Income by Occupancy in Bridgewater Town
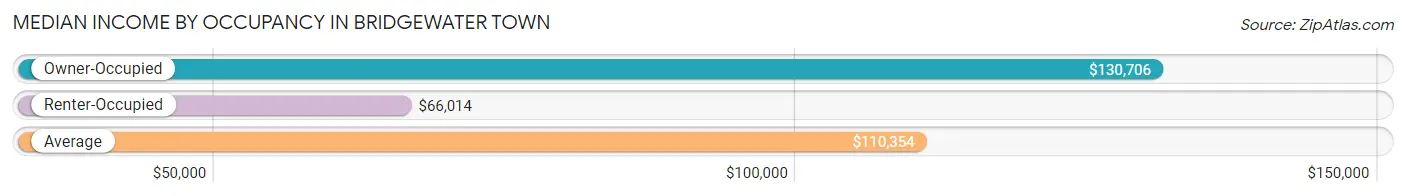
| Occupancy Type | # Households | Median Income |
| Owner-Occupied | 6,809 (74.1%) | $130,706 |
| Renter-Occupied | 2,385 (25.9%) | $66,014 |
| Average | 9,194 (100.0%) | $110,354 |
Occupancy by Householder Income Bracket in Bridgewater Town
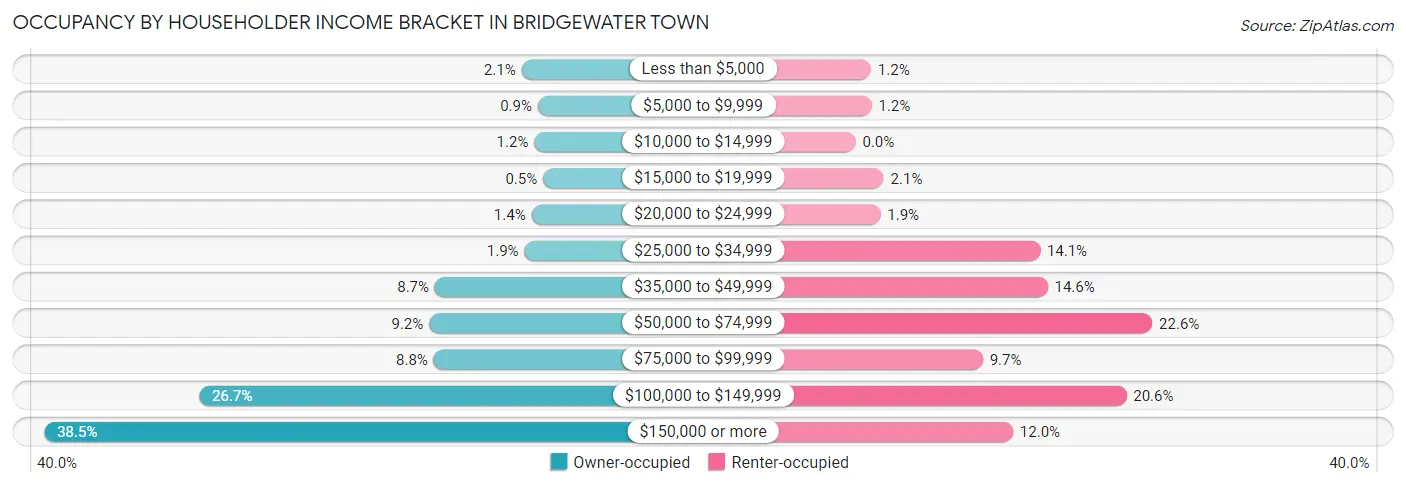
| Income Bracket | Owner-occupied | Renter-occupied |
| Less than $5,000 | 146 (2.1%) | 28 (1.2%) |
| $5,000 to $9,999 | 61 (0.9%) | 29 (1.2%) |
| $10,000 to $14,999 | 80 (1.2%) | 0 (0.0%) |
| $15,000 to $19,999 | 34 (0.5%) | 51 (2.1%) |
| $20,000 to $24,999 | 94 (1.4%) | 45 (1.9%) |
| $25,000 to $34,999 | 131 (1.9%) | 335 (14.1%) |
| $35,000 to $49,999 | 595 (8.7%) | 349 (14.6%) |
| $50,000 to $74,999 | 625 (9.2%) | 539 (22.6%) |
| $75,000 to $99,999 | 601 (8.8%) | 231 (9.7%) |
| $100,000 to $149,999 | 1,819 (26.7%) | 492 (20.6%) |
| $150,000 or more | 2,623 (38.5%) | 286 (12.0%) |
| Total | 6,809 (100.0%) | 2,385 (100.0%) |
Monthly Housing Cost Tiers in Bridgewater Town
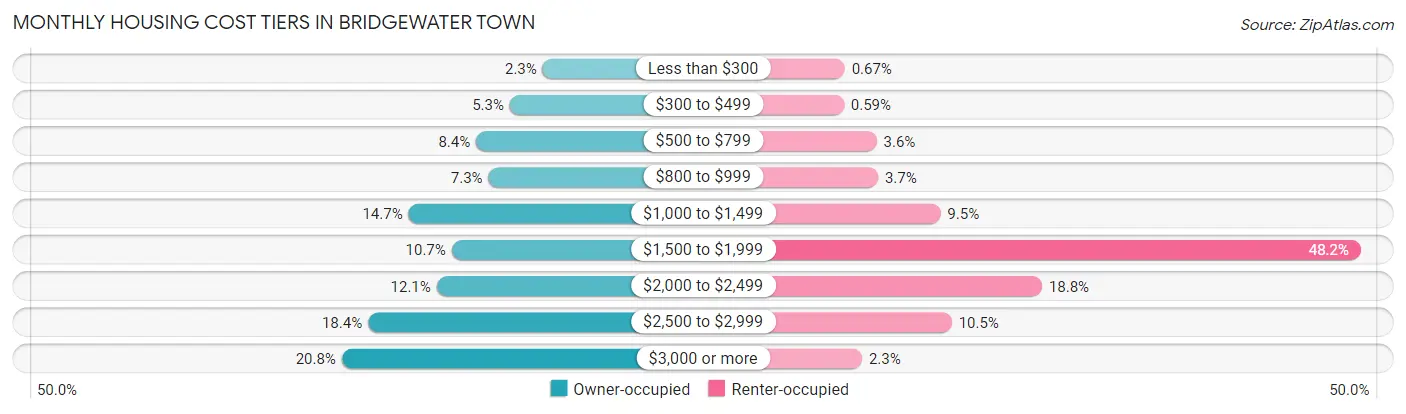
| Monthly Cost | Owner-occupied | Renter-occupied |
| Less than $300 | 157 (2.3%) | 16 (0.7%) |
| $300 to $499 | 363 (5.3%) | 14 (0.6%) |
| $500 to $799 | 575 (8.4%) | 86 (3.6%) |
| $800 to $999 | 497 (7.3%) | 89 (3.7%) |
| $1,000 to $1,499 | 998 (14.7%) | 226 (9.5%) |
| $1,500 to $1,999 | 728 (10.7%) | 1,149 (48.2%) |
| $2,000 to $2,499 | 822 (12.1%) | 449 (18.8%) |
| $2,500 to $2,999 | 1,252 (18.4%) | 251 (10.5%) |
| $3,000 or more | 1,417 (20.8%) | 54 (2.3%) |
| Total | 6,809 (100.0%) | 2,385 (100.0%) |
Physical Housing Characteristics in Bridgewater Town
Housing Structures in Bridgewater Town
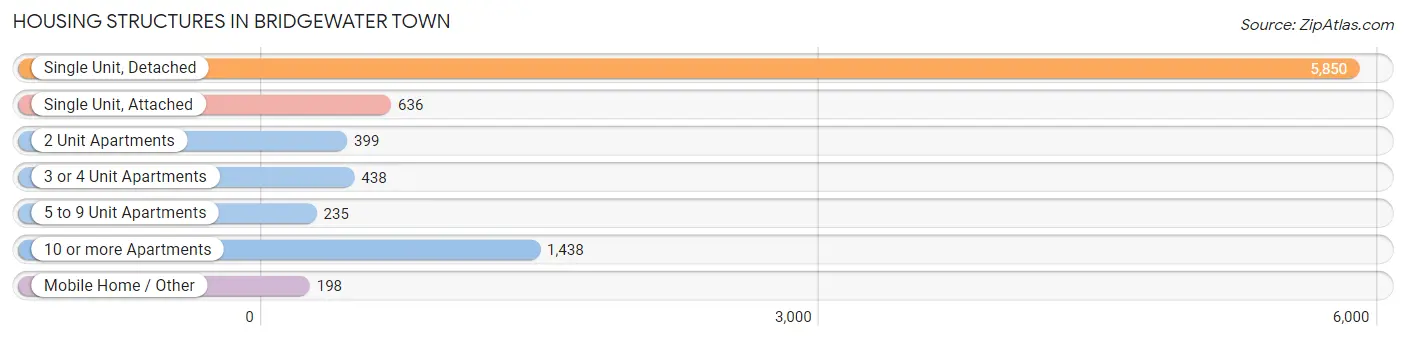
| Structure Type | # Housing Units | % Housing Units |
| Single Unit, Detached | 5,850 | 63.6% |
| Single Unit, Attached | 636 | 6.9% |
| 2 Unit Apartments | 399 | 4.3% |
| 3 or 4 Unit Apartments | 438 | 4.8% |
| 5 to 9 Unit Apartments | 235 | 2.6% |
| 10 or more Apartments | 1,438 | 15.6% |
| Mobile Home / Other | 198 | 2.1% |
| Total | 9,194 | 100.0% |
Housing Structures by Occupancy in Bridgewater Town
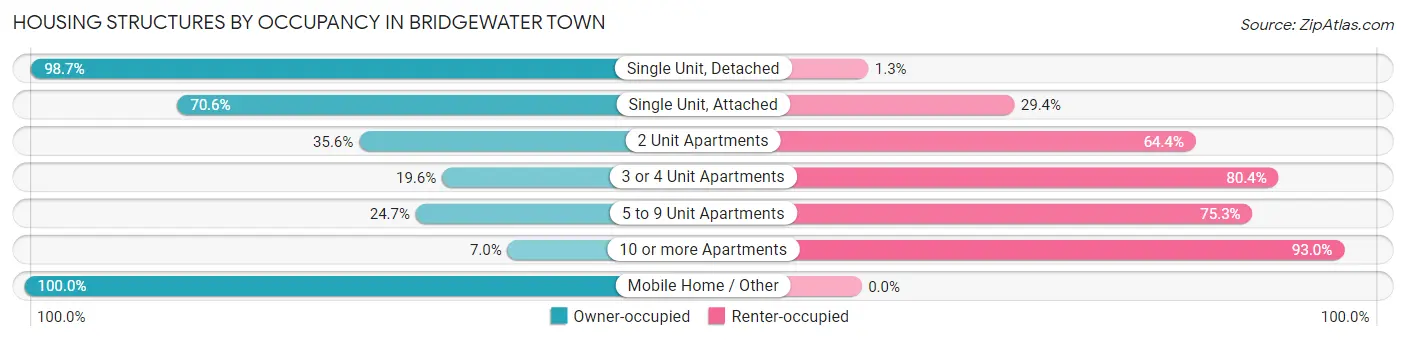
| Structure Type | Owner-occupied | Renter-occupied |
| Single Unit, Detached | 5,775 (98.7%) | 75 (1.3%) |
| Single Unit, Attached | 449 (70.6%) | 187 (29.4%) |
| 2 Unit Apartments | 142 (35.6%) | 257 (64.4%) |
| 3 or 4 Unit Apartments | 86 (19.6%) | 352 (80.4%) |
| 5 to 9 Unit Apartments | 58 (24.7%) | 177 (75.3%) |
| 10 or more Apartments | 101 (7.0%) | 1,337 (93.0%) |
| Mobile Home / Other | 198 (100.0%) | 0 (0.0%) |
| Total | 6,809 (74.1%) | 2,385 (25.9%) |
Housing Structures by Number of Rooms in Bridgewater Town
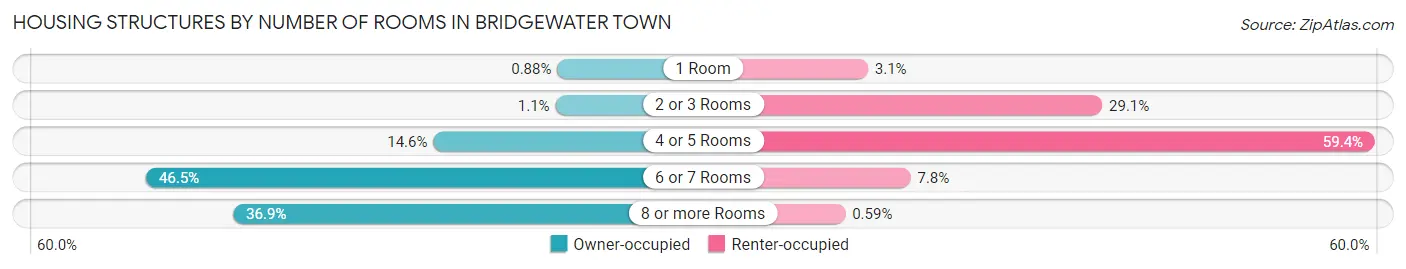
| Number of Rooms | Owner-occupied | Renter-occupied |
| 1 Room | 60 (0.9%) | 74 (3.1%) |
| 2 or 3 Rooms | 74 (1.1%) | 694 (29.1%) |
| 4 or 5 Rooms | 997 (14.6%) | 1,416 (59.4%) |
| 6 or 7 Rooms | 3,168 (46.5%) | 187 (7.8%) |
| 8 or more Rooms | 2,510 (36.9%) | 14 (0.6%) |
| Total | 6,809 (100.0%) | 2,385 (100.0%) |
Housing Structure by Heating Type in Bridgewater Town
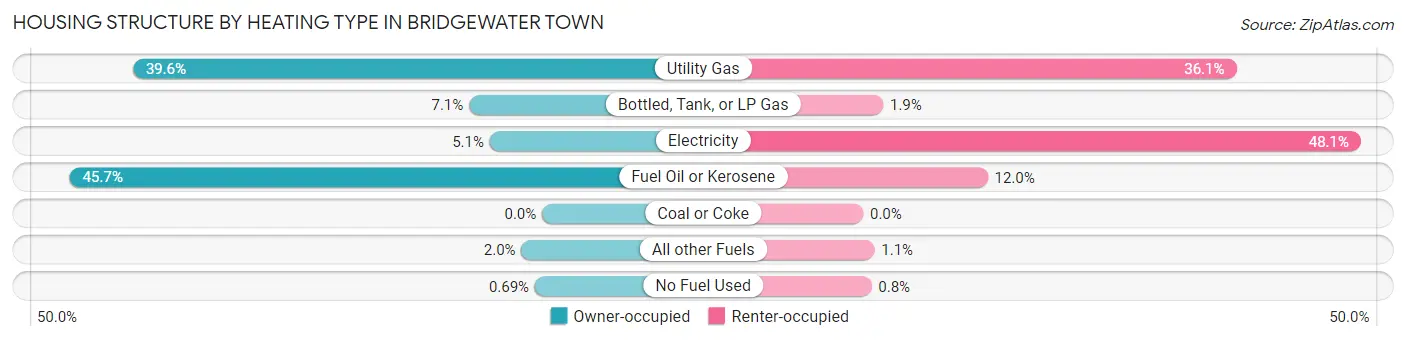
| Heating Type | Owner-occupied | Renter-occupied |
| Utility Gas | 2,693 (39.6%) | 860 (36.1%) |
| Bottled, Tank, or LP Gas | 480 (7.0%) | 46 (1.9%) |
| Electricity | 344 (5.1%) | 1,147 (48.1%) |
| Fuel Oil or Kerosene | 3,109 (45.7%) | 287 (12.0%) |
| Coal or Coke | 0 (0.0%) | 0 (0.0%) |
| All other Fuels | 136 (2.0%) | 26 (1.1%) |
| No Fuel Used | 47 (0.7%) | 19 (0.8%) |
| Total | 6,809 (100.0%) | 2,385 (100.0%) |
Household Vehicle Usage in Bridgewater Town
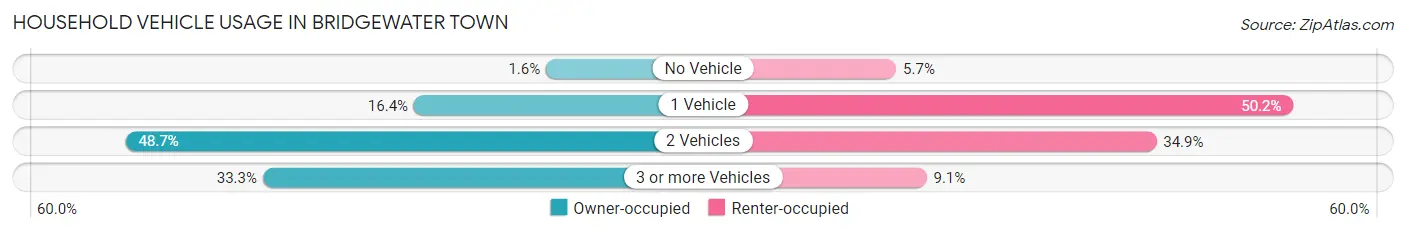
| Vehicles per Household | Owner-occupied | Renter-occupied |
| No Vehicle | 108 (1.6%) | 137 (5.7%) |
| 1 Vehicle | 1,116 (16.4%) | 1,198 (50.2%) |
| 2 Vehicles | 3,316 (48.7%) | 832 (34.9%) |
| 3 or more Vehicles | 2,269 (33.3%) | 218 (9.1%) |
| Total | 6,809 (100.0%) | 2,385 (100.0%) |
Real Estate & Mortgages in Bridgewater Town
Real Estate and Mortgage Overview in Bridgewater Town
| Characteristic | Without Mortgage | With Mortgage |
| Housing Units | 2,366 | 4,443 |
| Median Property Value | $429,300 | $491,200 |
| Median Household Income | $90,972 | $2,143 |
| Monthly Housing Costs | $866 | $1,404 |
| Real Estate Taxes | $5,917 | $116 |
Property Value by Mortgage Status in Bridgewater Town
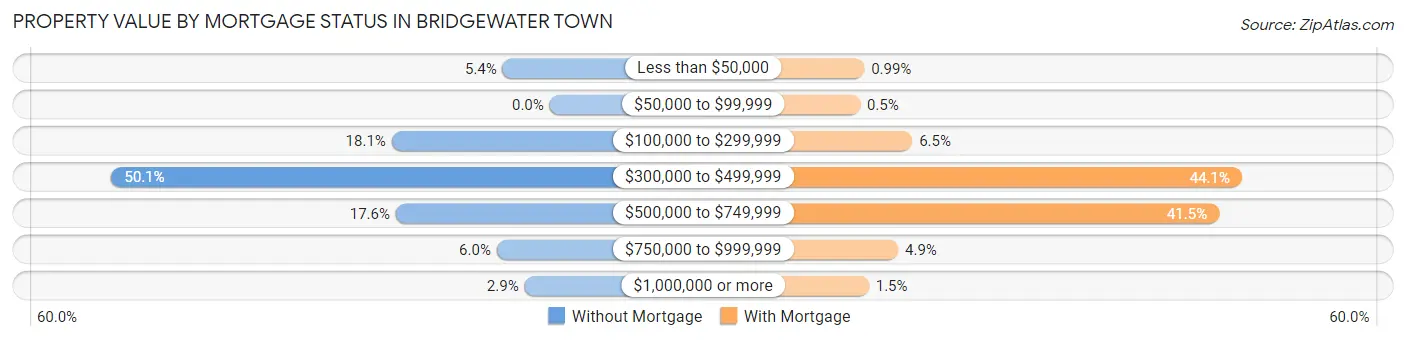
| Property Value | Without Mortgage | With Mortgage |
| Less than $50,000 | 127 (5.4%) | 44 (1.0%) |
| $50,000 to $99,999 | 0 (0.0%) | 22 (0.5%) |
| $100,000 to $299,999 | 427 (18.0%) | 288 (6.5%) |
| $300,000 to $499,999 | 1,185 (50.1%) | 1,961 (44.1%) |
| $500,000 to $749,999 | 416 (17.6%) | 1,845 (41.5%) |
| $750,000 to $999,999 | 143 (6.0%) | 216 (4.9%) |
| $1,000,000 or more | 68 (2.9%) | 67 (1.5%) |
| Total | 2,366 (100.0%) | 4,443 (100.0%) |
Household Income by Mortgage Status in Bridgewater Town
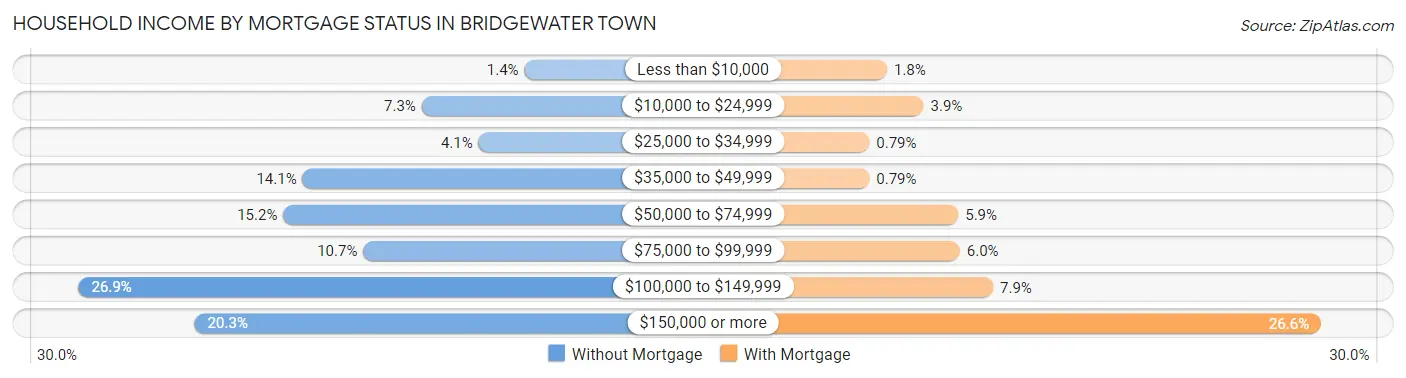
| Household Income | Without Mortgage | With Mortgage |
| Less than $10,000 | 34 (1.4%) | 80 (1.8%) |
| $10,000 to $24,999 | 173 (7.3%) | 173 (3.9%) |
| $25,000 to $34,999 | 96 (4.1%) | 35 (0.8%) |
| $35,000 to $49,999 | 334 (14.1%) | 35 (0.8%) |
| $50,000 to $74,999 | 360 (15.2%) | 261 (5.9%) |
| $75,000 to $99,999 | 252 (10.6%) | 265 (6.0%) |
| $100,000 to $149,999 | 637 (26.9%) | 349 (7.9%) |
| $150,000 or more | 480 (20.3%) | 1,182 (26.6%) |
| Total | 2,366 (100.0%) | 4,443 (100.0%) |
Property Value to Household Income Ratio in Bridgewater Town
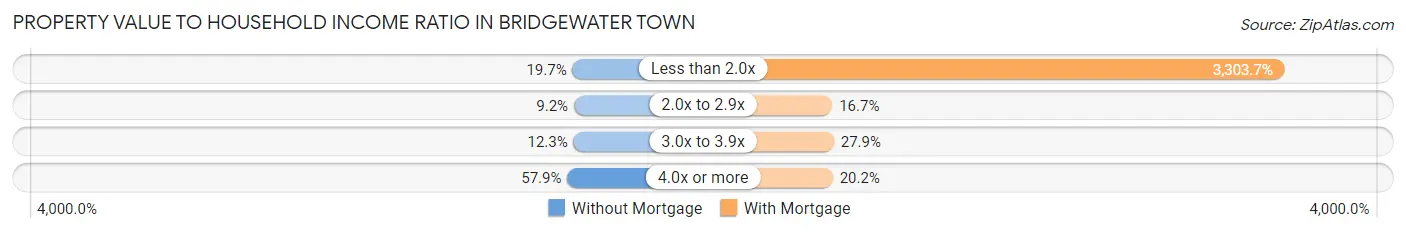
| Value-to-Income Ratio | Without Mortgage | With Mortgage |
| Less than 2.0x | 467 (19.7%) | 146,785 (3,303.7%) |
| 2.0x to 2.9x | 218 (9.2%) | 742 (16.7%) |
| 3.0x to 3.9x | 292 (12.3%) | 1,240 (27.9%) |
| 4.0x or more | 1,369 (57.9%) | 896 (20.2%) |
| Total | 2,366 (100.0%) | 4,443 (100.0%) |
Real Estate Taxes by Mortgage Status in Bridgewater Town
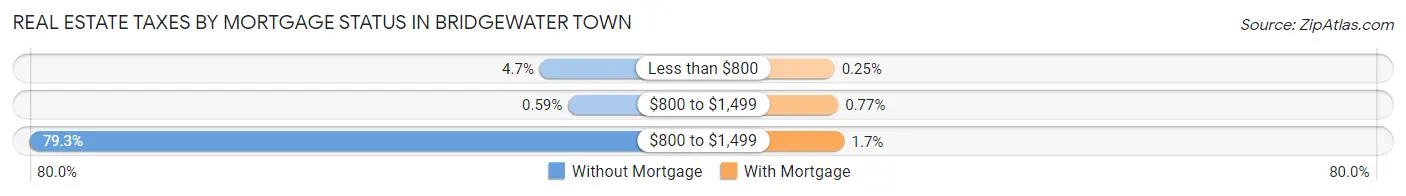
| Property Taxes | Without Mortgage | With Mortgage |
| Less than $800 | 112 (4.7%) | 11 (0.3%) |
| $800 to $1,499 | 14 (0.6%) | 34 (0.8%) |
| $800 to $1,499 | 1,875 (79.2%) | 75 (1.7%) |
| Total | 2,366 (100.0%) | 4,443 (100.0%) |
Health & Disability in Bridgewater Town
Health Insurance Coverage by Age in Bridgewater Town
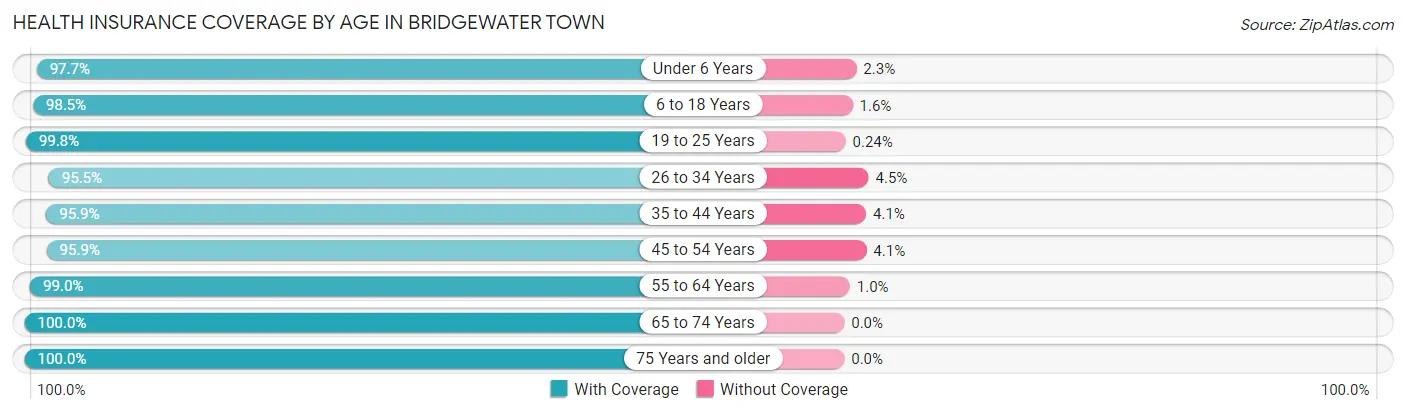
| Age Bracket | With Coverage | Without Coverage |
| Under 6 Years | 1,554 (97.7%) | 36 (2.3%) |
| 6 to 18 Years | 4,309 (98.5%) | 68 (1.5%) |
| 19 to 25 Years | 4,199 (99.8%) | 10 (0.2%) |
| 26 to 34 Years | 3,100 (95.5%) | 147 (4.5%) |
| 35 to 44 Years | 2,716 (95.9%) | 115 (4.1%) |
| 45 to 54 Years | 2,911 (95.9%) | 125 (4.1%) |
| 55 to 64 Years | 3,137 (99.0%) | 33 (1.0%) |
| 65 to 74 Years | 3,011 (100.0%) | 0 (0.0%) |
| 75 Years and older | 1,553 (100.0%) | 0 (0.0%) |
| Total | 26,490 (98.0%) | 534 (2.0%) |
Health Insurance Coverage by Citizenship Status in Bridgewater Town
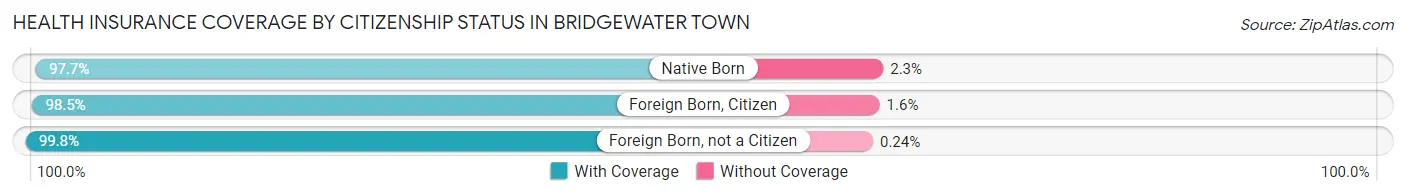
| Citizenship Status | With Coverage | Without Coverage |
| Native Born | 1,554 (97.7%) | 36 (2.3%) |
| Foreign Born, Citizen | 4,309 (98.5%) | 68 (1.5%) |
| Foreign Born, not a Citizen | 4,199 (99.8%) | 10 (0.2%) |
Health Insurance Coverage by Household Income in Bridgewater Town
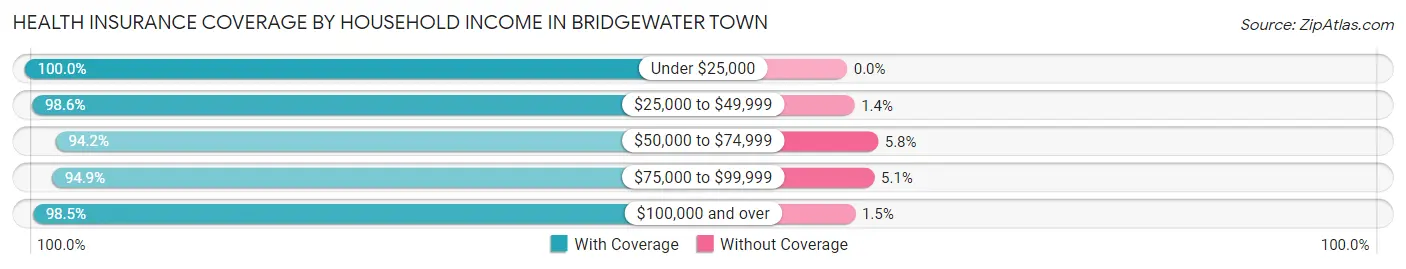
| Household Income | With Coverage | Without Coverage |
| Under $25,000 | 749 (100.0%) | 0 (0.0%) |
| $25,000 to $49,999 | 2,903 (98.6%) | 41 (1.4%) |
| $50,000 to $74,999 | 2,303 (94.2%) | 142 (5.8%) |
| $75,000 to $99,999 | 1,634 (94.9%) | 88 (5.1%) |
| $100,000 and over | 16,249 (98.5%) | 253 (1.5%) |
Public vs Private Health Insurance Coverage by Age in Bridgewater Town
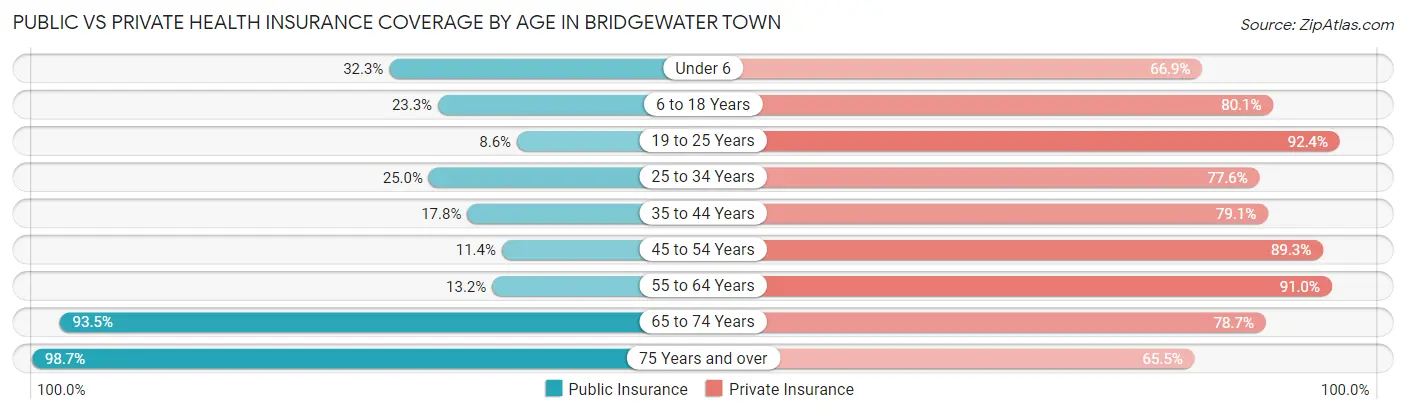
| Age Bracket | Public Insurance | Private Insurance |
| Under 6 | 514 (32.3%) | 1,064 (66.9%) |
| 6 to 18 Years | 1,019 (23.3%) | 3,505 (80.1%) |
| 19 to 25 Years | 363 (8.6%) | 3,891 (92.4%) |
| 25 to 34 Years | 811 (25.0%) | 2,518 (77.5%) |
| 35 to 44 Years | 505 (17.8%) | 2,240 (79.1%) |
| 45 to 54 Years | 347 (11.4%) | 2,712 (89.3%) |
| 55 to 64 Years | 419 (13.2%) | 2,883 (90.9%) |
| 65 to 74 Years | 2,815 (93.5%) | 2,369 (78.7%) |
| 75 Years and over | 1,532 (98.7%) | 1,017 (65.5%) |
| Total | 8,325 (30.8%) | 22,199 (82.2%) |
Disability Status by Sex by Age in Bridgewater Town
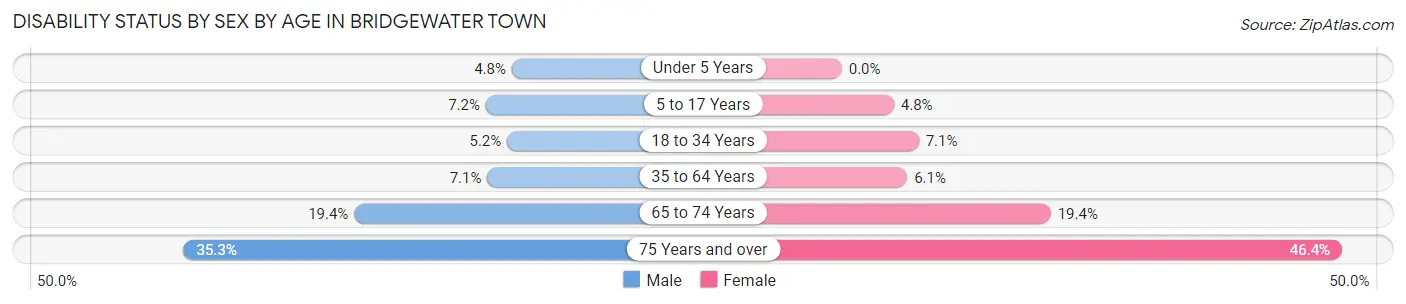
| Age Bracket | Male | Female |
| Under 5 Years | 31 (4.8%) | 0 (0.0%) |
| 5 to 17 Years | 154 (7.2%) | 72 (4.8%) |
| 18 to 34 Years | 214 (5.2%) | 312 (7.1%) |
| 35 to 64 Years | 323 (7.1%) | 271 (6.1%) |
| 65 to 74 Years | 261 (19.4%) | 323 (19.4%) |
| 75 Years and over | 233 (35.2%) | 414 (46.4%) |
Disability Class by Sex by Age in Bridgewater Town
Disability Class: Hearing Difficulty
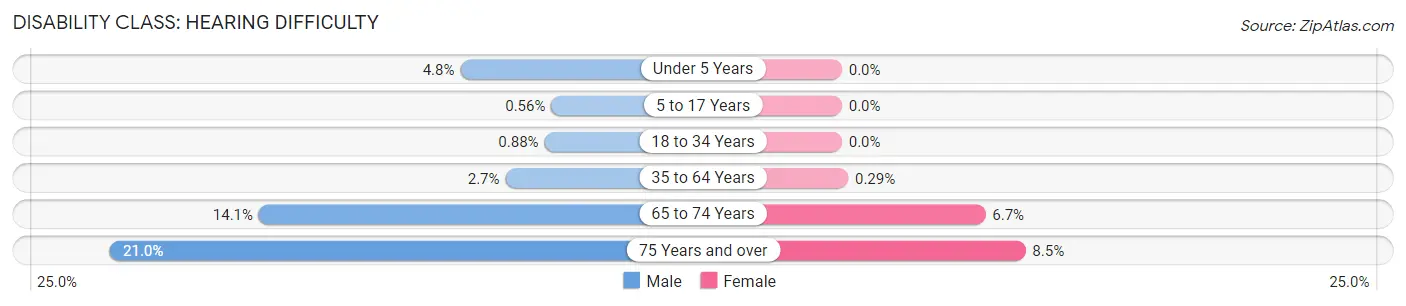
| Age Bracket | Male | Female |
| Under 5 Years | 31 (4.8%) | 0 (0.0%) |
| 5 to 17 Years | 12 (0.6%) | 0 (0.0%) |
| 18 to 34 Years | 36 (0.9%) | 0 (0.0%) |
| 35 to 64 Years | 123 (2.7%) | 13 (0.3%) |
| 65 to 74 Years | 190 (14.1%) | 111 (6.7%) |
| 75 Years and over | 139 (21.0%) | 76 (8.5%) |
Disability Class: Vision Difficulty
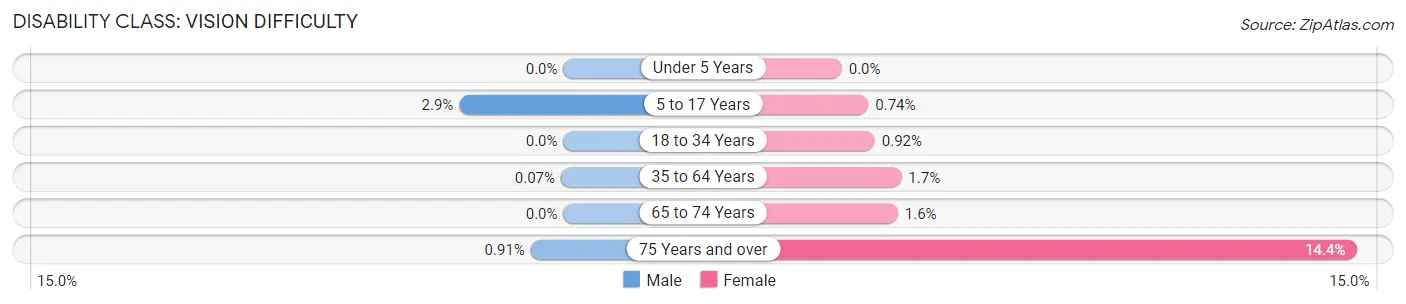
| Age Bracket | Male | Female |
| Under 5 Years | 0 (0.0%) | 0 (0.0%) |
| 5 to 17 Years | 62 (2.9%) | 11 (0.7%) |
| 18 to 34 Years | 0 (0.0%) | 40 (0.9%) |
| 35 to 64 Years | 3 (0.1%) | 74 (1.7%) |
| 65 to 74 Years | 0 (0.0%) | 26 (1.6%) |
| 75 Years and over | 6 (0.9%) | 128 (14.3%) |
Disability Class: Cognitive Difficulty
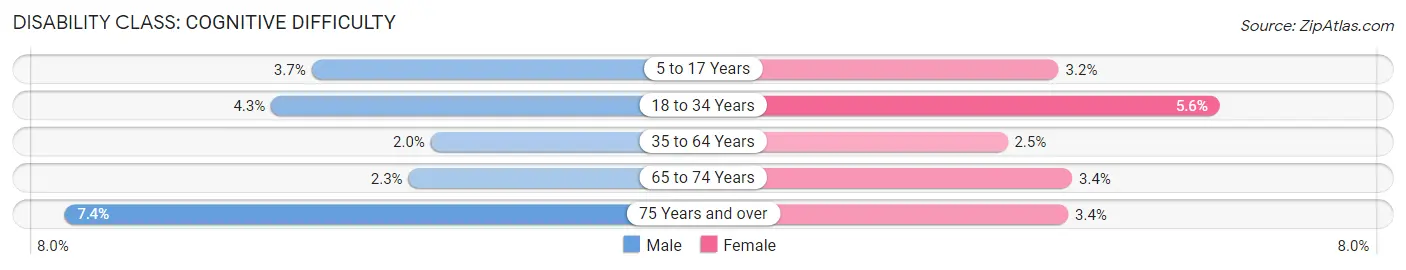
| Age Bracket | Male | Female |
| 5 to 17 Years | 80 (3.7%) | 48 (3.2%) |
| 18 to 34 Years | 178 (4.3%) | 245 (5.6%) |
| 35 to 64 Years | 90 (2.0%) | 110 (2.5%) |
| 65 to 74 Years | 31 (2.3%) | 57 (3.4%) |
| 75 Years and over | 49 (7.4%) | 30 (3.4%) |
Disability Class: Ambulatory Difficulty
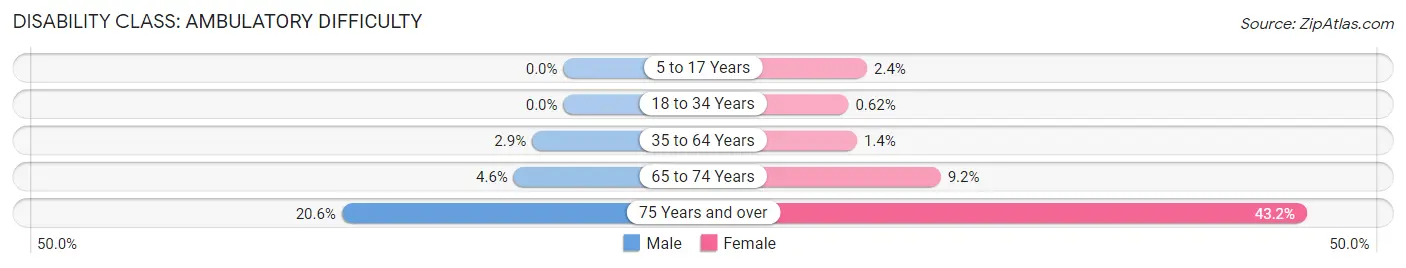
| Age Bracket | Male | Female |
| 5 to 17 Years | 0 (0.0%) | 35 (2.4%) |
| 18 to 34 Years | 0 (0.0%) | 27 (0.6%) |
| 35 to 64 Years | 133 (2.9%) | 63 (1.4%) |
| 65 to 74 Years | 62 (4.6%) | 153 (9.2%) |
| 75 Years and over | 136 (20.6%) | 385 (43.2%) |
Disability Class: Self-Care Difficulty
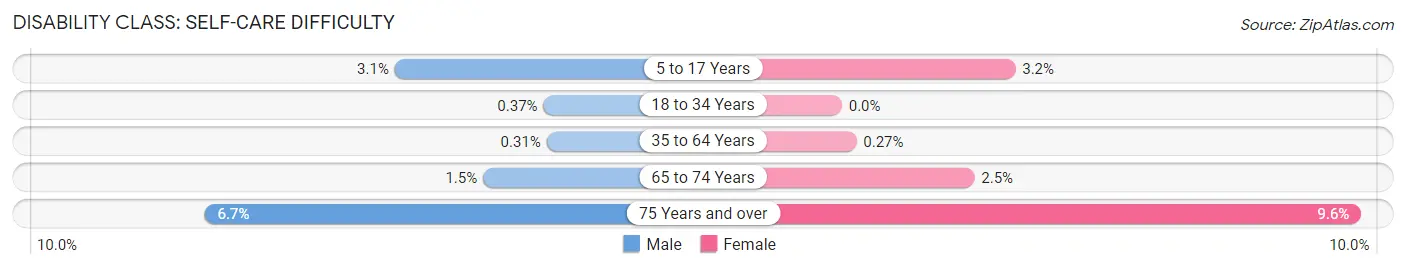
| Age Bracket | Male | Female |
| 5 to 17 Years | 67 (3.1%) | 48 (3.2%) |
| 18 to 34 Years | 15 (0.4%) | 0 (0.0%) |
| 35 to 64 Years | 14 (0.3%) | 12 (0.3%) |
| 65 to 74 Years | 20 (1.5%) | 41 (2.5%) |
| 75 Years and over | 44 (6.7%) | 86 (9.6%) |
Technology Access in Bridgewater Town
Computing Device Access in Bridgewater Town
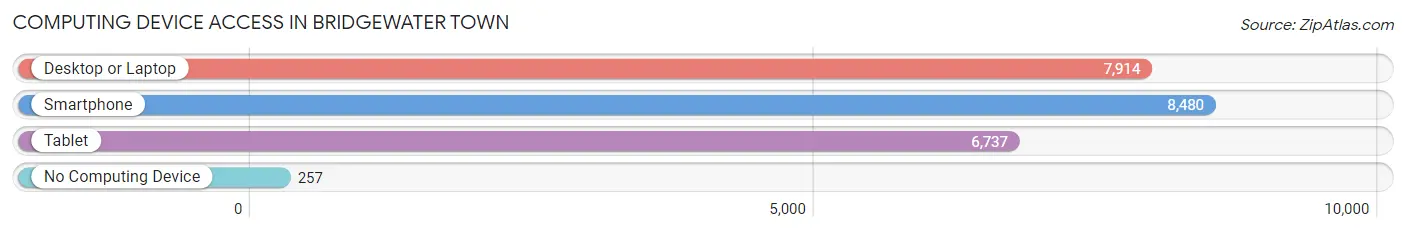
| Device Type | # Households | % Households |
| Desktop or Laptop | 7,914 | 86.1% |
| Smartphone | 8,480 | 92.2% |
| Tablet | 6,737 | 73.3% |
| No Computing Device | 257 | 2.8% |
| Total | 9,194 | 100.0% |
Internet Access in Bridgewater Town
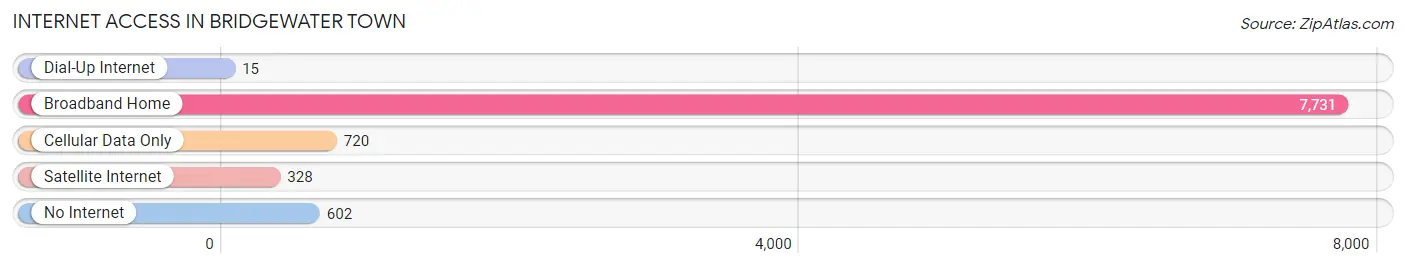
| Internet Type | # Households | % Households |
| Dial-Up Internet | 15 | 0.2% |
| Broadband Home | 7,731 | 84.1% |
| Cellular Data Only | 720 | 7.8% |
| Satellite Internet | 328 | 3.6% |
| No Internet | 602 | 6.6% |
| Total | 9,194 | 100.0% |
Bridgewater Town Summary
Bridgewater Town, Massachusetts is a town located in Plymouth County, Massachusetts, United States. It is located about 25 miles south of Boston and is part of the Greater Boston metropolitan area. As of the 2010 census, the town had a population of 26,563.
History
Bridgewater Town was first settled in 1650 by a group of English settlers from the Plymouth Colony. The town was originally part of the town of Duxbury, but was incorporated as its own town in 1656. The town was named after the River Bride, which runs through the town.
In the late 1700s, Bridgewater Town was a major center for the production of iron and brass products. The town was also home to several mills, including a paper mill, a grist mill, and a saw mill.
In the early 1800s, Bridgewater Town was a major center for the production of shoes. The town was home to several shoe factories, including the Bridgewater Shoe Company, which was founded in 1820.
Geography
Bridgewater Town is located in southeastern Massachusetts, about 25 miles south of Boston. It is bordered by the towns of West Bridgewater to the north, East Bridgewater to the east, Halifax to the south, and Raynham to the west. The town is located on the Taunton River, which runs through the town.
The town has a total area of 24.2 square miles, of which 23.7 square miles is land and 0.5 square miles is water. Bridgewater Town is located in the southeastern part of the state, and is part of the Greater Boston metropolitan area.
Economy
Bridgewater Town is home to several major employers, including Bridgewater State University, Bridgewater State Hospital, and the Bridgewater State Correctional Facility. The town is also home to several large companies, including Bridgewater Savings Bank, Bridgewater Credit Union, and Bridgewater Technologies.
The town is also home to several small businesses, including restaurants, retail stores, and professional services.
Demographics
As of the 2010 census, there were 26,563 people, 9,945 households, and 6,845 families living in Bridgewater Town. The population density was 1,097.3 people per square mile. The racial makeup of the town was 92.3% White, 3.2% African American, 0.3% Native American, 1.7% Asian, 0.1% Pacific Islander, 1.2% from other races, and 1.4% from two or more races. Hispanic or Latino of any race were 3.3% of the population.
The median income for a household in Bridgewater Town was $68,945, and the median income for a family was $81,945. The per capita income for the town was $30,945. About 4.2% of families and 6.3% of the population were below the poverty line, including 8.2% of those under age 18 and 4.3% of those age 65 or over.
Common Questions
What is Per Capita Income in Bridgewater Town?
Per Capita income in Bridgewater Town is $46,448.
What is the Median Family Income in Bridgewater Town?
Median Family Income in Bridgewater Town is $127,279.
What is the Median Household income in Bridgewater Town?
Median Household Income in Bridgewater Town is $110,354.
What is Income or Wage Gap in Bridgewater Town?
Income or Wage Gap in Bridgewater Town is 33.6%.
Women in Bridgewater Town earn 66.4 cents for every dollar earned by a man.
What is Inequality or Gini Index in Bridgewater Town?
Inequality or Gini Index in Bridgewater Town is 0.42.
What is the Total Population of Bridgewater Town?
Total Population of Bridgewater Town is 28,531.
What is the Total Male Population of Bridgewater Town?
Total Male Population of Bridgewater Town is 14,950.
What is the Total Female Population of Bridgewater Town?
Total Female Population of Bridgewater Town is 13,581.
What is the Ratio of Males per 100 Females in Bridgewater Town?
There are 110.08 Males per 100 Females in Bridgewater Town.
What is the Ratio of Females per 100 Males in Bridgewater Town?
There are 90.84 Females per 100 Males in Bridgewater Town.
What is the Median Population Age in Bridgewater Town?
Median Population Age in Bridgewater Town is 35.8 Years.
What is the Average Family Size in Bridgewater Town
Average Family Size in Bridgewater Town is 3.1 People.
What is the Average Household Size in Bridgewater Town
Average Household Size in Bridgewater Town is 2.7 People.
How Large is the Labor Force in Bridgewater Town?
There are 15,481 People in the Labor Forcein in Bridgewater Town.
What is the Percentage of People in the Labor Force in Bridgewater Town?
63.7% of People are in the Labor Force in Bridgewater Town.
What is the Unemployment Rate in Bridgewater Town?
Unemployment Rate in Bridgewater Town is 4.8%.