Raynham Center, MA Map & Demographics
Raynham Center Map
Raynham Center Overview
$42,622
PER CAPITA INCOME
$112,150
AVG FAMILY INCOME
$98,984
AVG HOUSEHOLD INCOME
32.0%
WAGE / INCOME GAP [ % ]
68.0¢/ $1
WAGE / INCOME GAP [ $ ]
0.48
INEQUALITY / GINI INDEX
5,074
TOTAL POPULATION
2,155
MALE POPULATION
2,919
FEMALE POPULATION
73.83
MALES / 100 FEMALES
135.45
FEMALES / 100 MALES
37.1
MEDIAN AGE
3.4
AVG FAMILY SIZE
3.1
AVG HOUSEHOLD SIZE
2,744
LABOR FORCE [ PEOPLE ]
71.6%
PERCENT IN LABOR FORCE
7.4%
UNEMPLOYMENT RATE
Raynham Center Area Codes
Income in Raynham Center
Income Overview in Raynham Center
Per Capita Income in Raynham Center is $42,622, while median incomes of families and households are $112,150 and $98,984 respectively.
| Characteristic | Number | Measure |
| Per Capita Income | 5,074 | $42,622 |
| Median Family Income | 1,359 | $112,150 |
| Mean Family Income | 1,359 | $135,785 |
| Median Household Income | 1,648 | $98,984 |
| Mean Household Income | 1,648 | $127,576 |
| Income Deficit | 1,359 | $0 |
| Wage / Income Gap (%) | 5,074 | 32.02% |
| Wage / Income Gap ($) | 5,074 | 67.98¢ per $1 |
| Gini / Inequality Index | 5,074 | 0.48 |
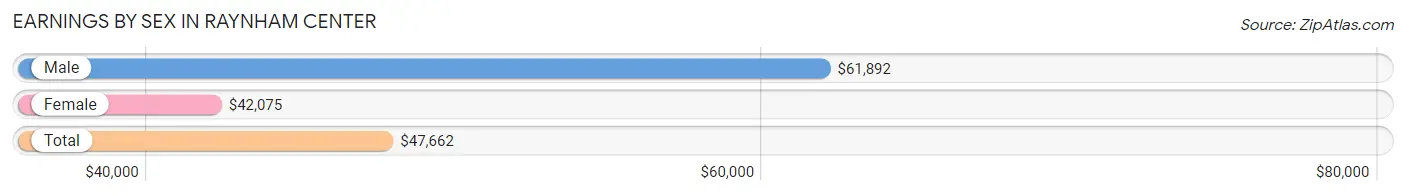
Earnings by Sex in Raynham Center
Average Earnings in Raynham Center are $47,662, $61,892 for men and $42,075 for women, a difference of 32.0%.
| Sex | Number | Average Earnings |
| Male | 1,336 (48.0%) | $61,892 |
| Female | 1,449 (52.0%) | $42,075 |
| Total | 2,785 (100.0%) | $47,662 |
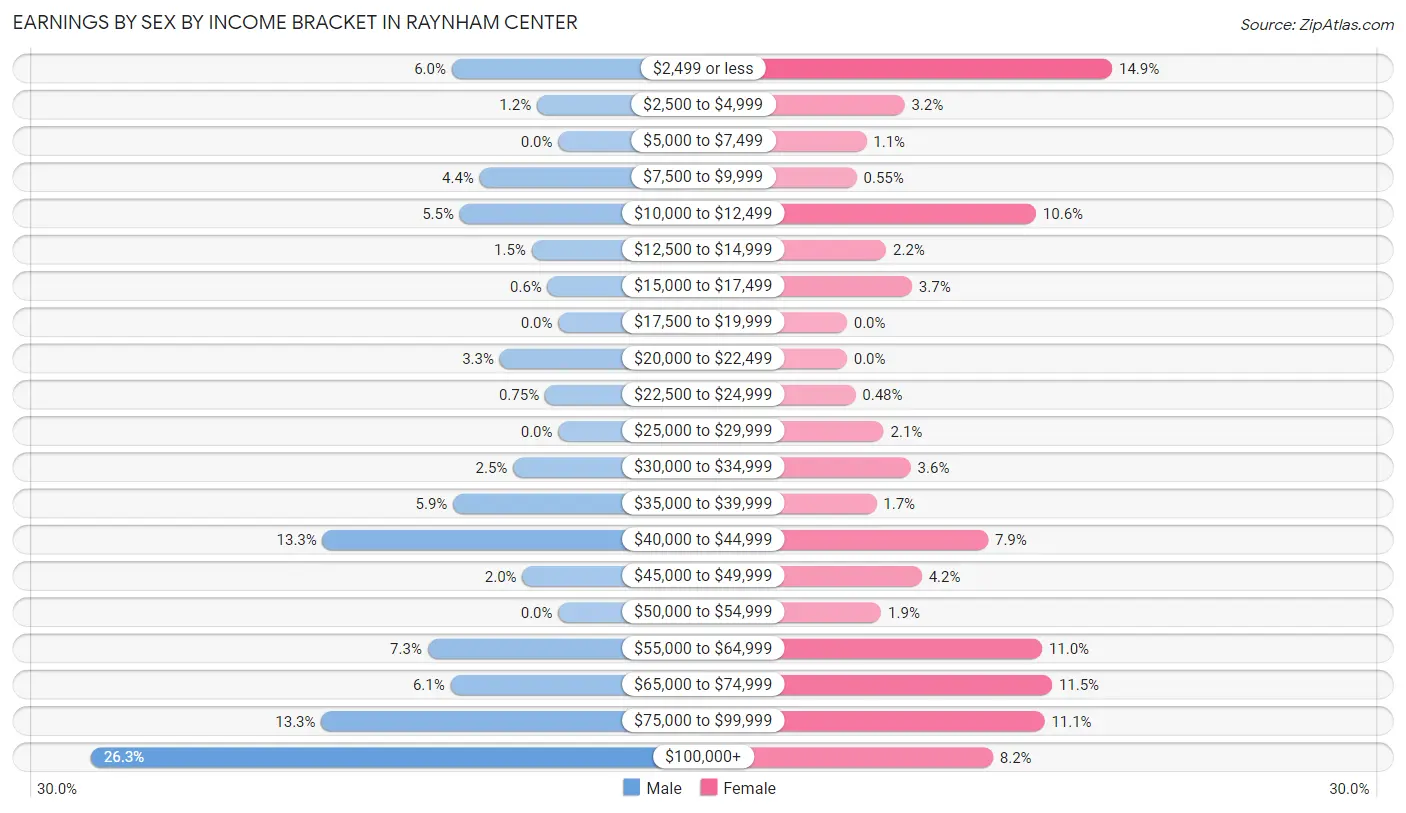
Earnings by Sex by Income Bracket in Raynham Center
The most common earnings brackets in Raynham Center are $100,000+ for men (351 | 26.3%) and $2,499 or less for women (216 | 14.9%).
| Income | Male | Female |
| $2,499 or less | 80 (6.0%) | 216 (14.9%) |
| $2,500 to $4,999 | 16 (1.2%) | 47 (3.2%) |
| $5,000 to $7,499 | 0 (0.0%) | 16 (1.1%) |
| $7,500 to $9,999 | 59 (4.4%) | 8 (0.5%) |
| $10,000 to $12,499 | 74 (5.5%) | 154 (10.6%) |
| $12,500 to $14,999 | 20 (1.5%) | 32 (2.2%) |
| $15,000 to $17,499 | 8 (0.6%) | 53 (3.7%) |
| $17,500 to $19,999 | 0 (0.0%) | 0 (0.0%) |
| $20,000 to $22,499 | 44 (3.3%) | 0 (0.0%) |
| $22,500 to $24,999 | 10 (0.7%) | 7 (0.5%) |
| $25,000 to $29,999 | 0 (0.0%) | 30 (2.1%) |
| $30,000 to $34,999 | 34 (2.5%) | 52 (3.6%) |
| $35,000 to $39,999 | 79 (5.9%) | 24 (1.7%) |
| $40,000 to $44,999 | 177 (13.3%) | 115 (7.9%) |
| $45,000 to $49,999 | 27 (2.0%) | 61 (4.2%) |
| $50,000 to $54,999 | 0 (0.0%) | 28 (1.9%) |
| $55,000 to $64,999 | 98 (7.3%) | 159 (11.0%) |
| $65,000 to $74,999 | 81 (6.1%) | 167 (11.5%) |
| $75,000 to $99,999 | 178 (13.3%) | 161 (11.1%) |
| $100,000+ | 351 (26.3%) | 119 (8.2%) |
| Total | 1,336 (100.0%) | 1,449 (100.0%) |
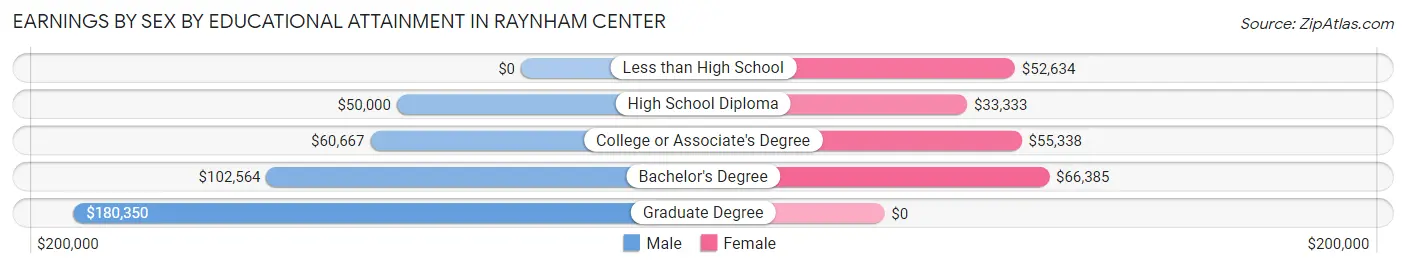
Earnings by Sex by Educational Attainment in Raynham Center
Average earnings in Raynham Center are $62,832 for men and $53,036 for women, a difference of 15.6%. Men with an educational attainment of graduate degree enjoy the highest average annual earnings of $180,350, while those with high school diploma education earn the least with $50,000. Women with an educational attainment of bachelor's degree earn the most with the average annual earnings of $66,385, while those with high school diploma education have the smallest earnings of $33,333.
| Educational Attainment | Male Income | Female Income |
| Less than High School | - | - |
| High School Diploma | $50,000 | $33,333 |
| College or Associate's Degree | $60,667 | $55,338 |
| Bachelor's Degree | $102,564 | $66,385 |
| Graduate Degree | $180,350 | $0 |
| Total | $62,832 | $53,036 |
Family Income in Raynham Center
Family Income Brackets in Raynham Center
According to the Raynham Center family income data, there are 319 families falling into the $100,000 to $149,999 income range, which is the most common income bracket and makes up 23.5% of all families.
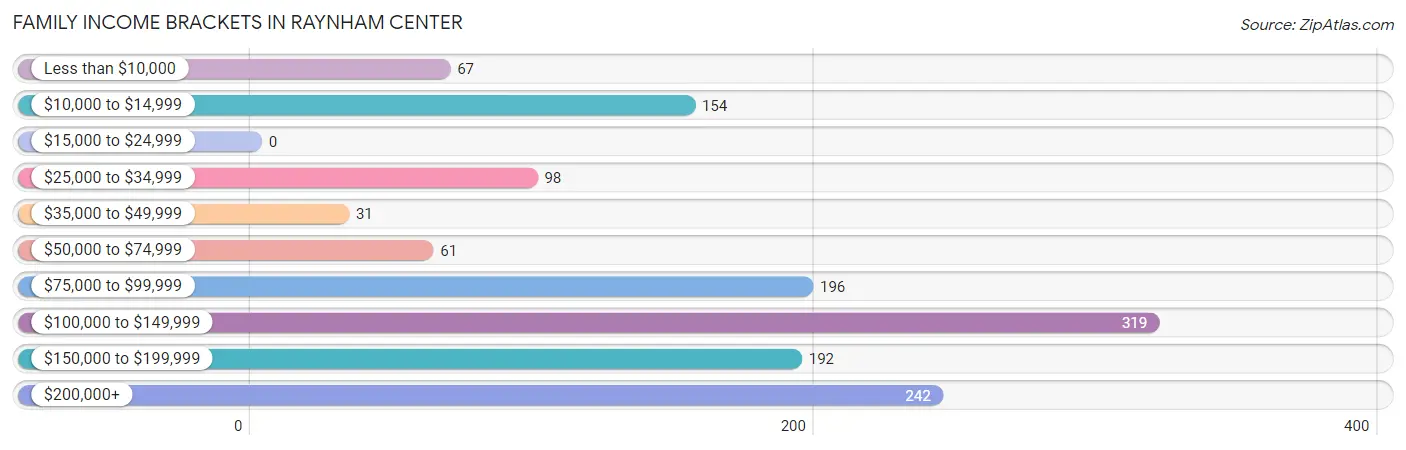
| Income Bracket | # Families | % Families |
| Less than $10,000 | 67 | 4.9% |
| $10,000 to $14,999 | 154 | 11.3% |
| $15,000 to $24,999 | 0 | 0.0% |
| $25,000 to $34,999 | 98 | 7.2% |
| $35,000 to $49,999 | 31 | 2.3% |
| $50,000 to $74,999 | 61 | 4.5% |
| $75,000 to $99,999 | 196 | 14.4% |
| $100,000 to $149,999 | 319 | 23.5% |
| $150,000 to $199,999 | 192 | 14.1% |
| $200,000+ | 242 | 17.8% |
Family Income by Famaliy Size in Raynham Center
6-person families (49 | 3.6%) account for the highest median family income in Raynham Center with $188,897 per family, while 3-person families (191 | 14.1%) have the highest median income of $56,904 per family member.
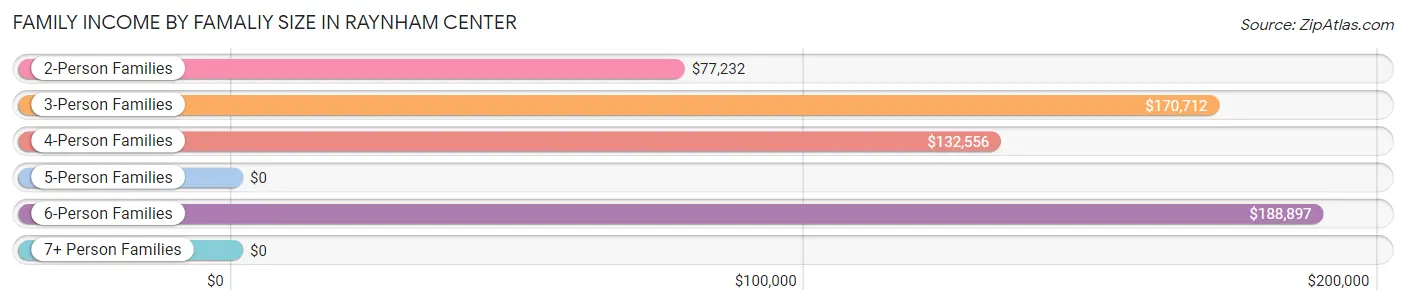
| Income Bracket | # Families | Median Income |
| 2-Person Families | 613 (45.1%) | $77,232 |
| 3-Person Families | 191 (14.1%) | $170,712 |
| 4-Person Families | 330 (24.3%) | $132,556 |
| 5-Person Families | 63 (4.6%) | $0 |
| 6-Person Families | 49 (3.6%) | $188,897 |
| 7+ Person Families | 113 (8.3%) | $0 |
| Total | 1,359 (100.0%) | $112,150 |
Family Income by Number of Earners in Raynham Center
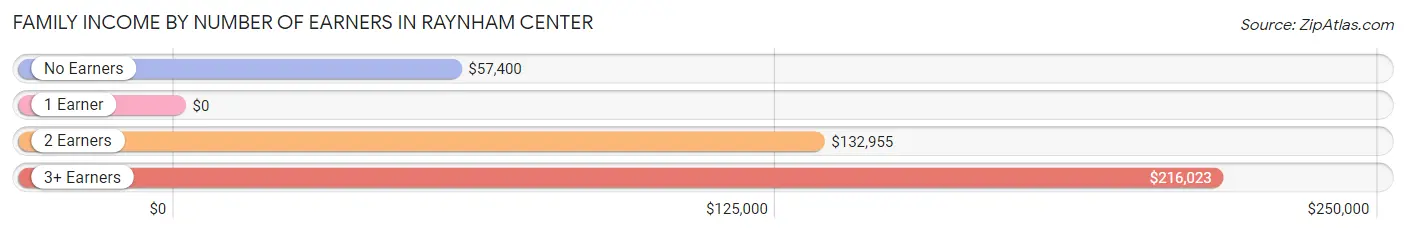
| Number of Earners | # Families | Median Income |
| No Earners | 138 (10.2%) | $57,400 |
| 1 Earner | 510 (37.5%) | $0 |
| 2 Earners | 500 (36.8%) | $132,955 |
| 3+ Earners | 211 (15.5%) | $216,023 |
| Total | 1,359 (100.0%) | $112,150 |
Household Income in Raynham Center
Household Income Brackets in Raynham Center
With 353 households falling in the category, the $100,000 to $149,999 income range is the most frequent in Raynham Center, accounting for 21.4% of all households. In contrast, only 13 households (0.8%) fall into the $25,000 to $34,999 income bracket, making it the least populous group.
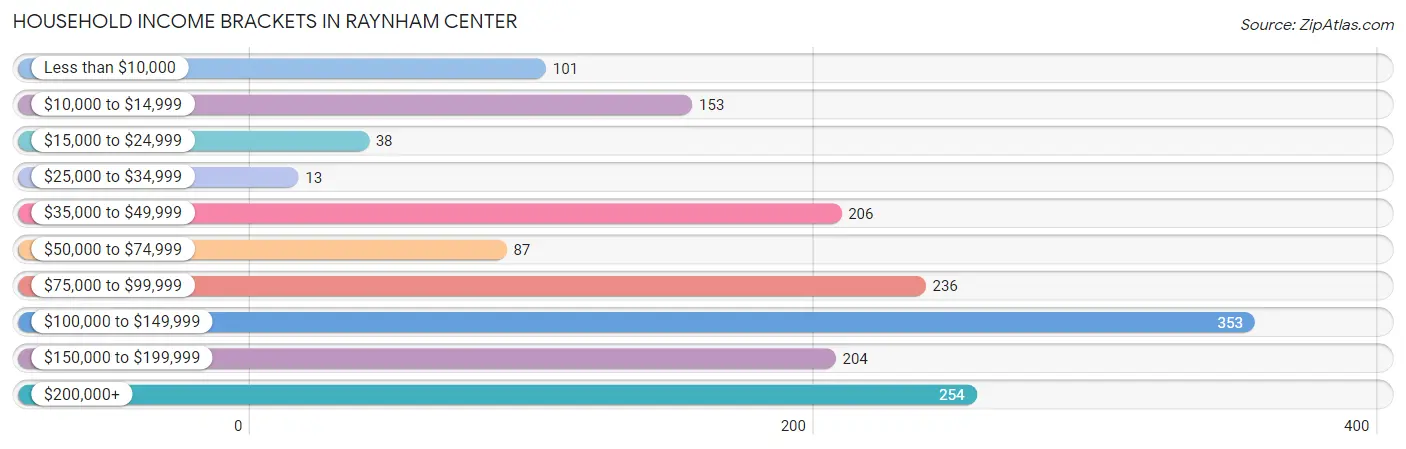
| Income Bracket | # Households | % Households |
| Less than $10,000 | 101 | 6.1% |
| $10,000 to $14,999 | 153 | 9.3% |
| $15,000 to $24,999 | 38 | 2.3% |
| $25,000 to $34,999 | 13 | 0.8% |
| $35,000 to $49,999 | 206 | 12.5% |
| $50,000 to $74,999 | 87 | 5.3% |
| $75,000 to $99,999 | 236 | 14.3% |
| $100,000 to $149,999 | 353 | 21.4% |
| $150,000 to $199,999 | 204 | 12.4% |
| $200,000+ | 254 | 15.4% |
Household Income by Householder Age in Raynham Center
The median household income in Raynham Center is $98,984, with the highest median household income of $133,036 found in the 45 to 64 years age bracket for the primary householder. A total of 450 households (27.3%) fall into this category. Meanwhile, the 15 to 24 years age bracket for the primary householder has the lowest median household income of $0, with 34 households (2.1%) in this group.
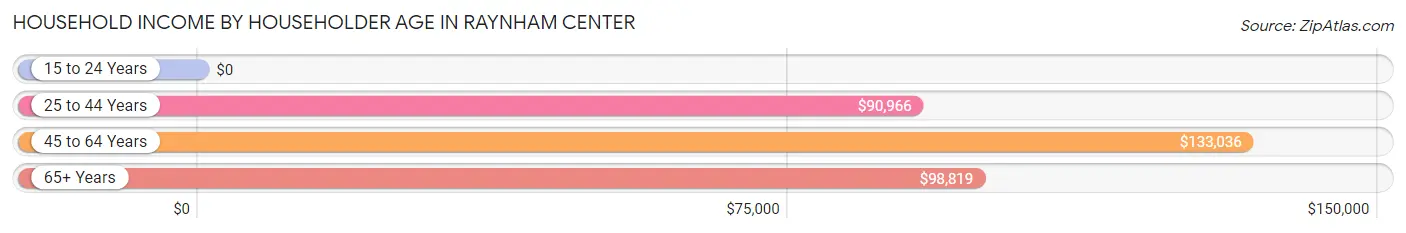
| Income Bracket | # Households | Median Income |
| 15 to 24 Years | 34 (2.1%) | $0 |
| 25 to 44 Years | 757 (45.9%) | $90,966 |
| 45 to 64 Years | 450 (27.3%) | $133,036 |
| 65+ Years | 407 (24.7%) | $98,819 |
| Total | 1,648 (100.0%) | $98,984 |
Poverty in Raynham Center
Income Below Poverty by Sex and Age in Raynham Center
With 7.0% poverty level for males and 20.7% for females among the residents of Raynham Center, 25 to 34 year old males and 18 to 24 year old females are the most vulnerable to poverty, with 62 males (21.9%) and 189 females (68.2%) in their respective age groups living below the poverty level.
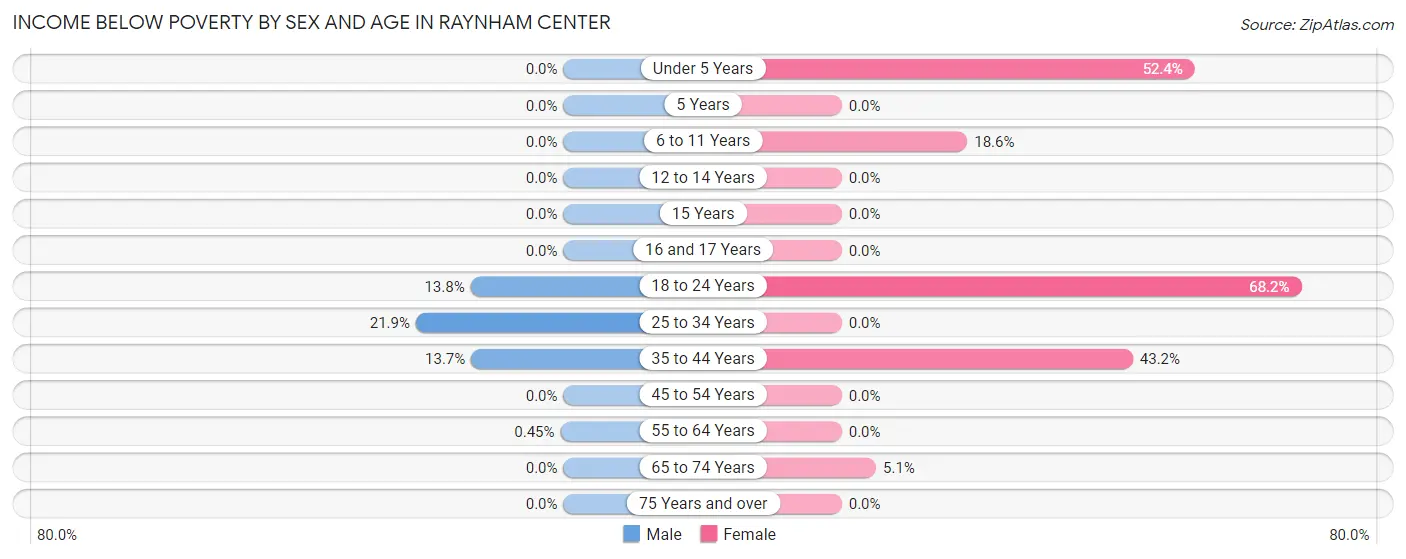
| Age Bracket | Male | Female |
| Under 5 Years | 0 (0.0%) | 120 (52.4%) |
| 5 Years | 0 (0.0%) | 0 (0.0%) |
| 6 to 11 Years | 0 (0.0%) | 77 (18.6%) |
| 12 to 14 Years | 0 (0.0%) | 0 (0.0%) |
| 15 Years | 0 (0.0%) | 0 (0.0%) |
| 16 and 17 Years | 0 (0.0%) | 0 (0.0%) |
| 18 to 24 Years | 20 (13.8%) | 189 (68.2%) |
| 25 to 34 Years | 62 (21.9%) | 0 (0.0%) |
| 35 to 44 Years | 67 (13.7%) | 204 (43.2%) |
| 45 to 54 Years | 0 (0.0%) | 0 (0.0%) |
| 55 to 64 Years | 1 (0.4%) | 0 (0.0%) |
| 65 to 74 Years | 0 (0.0%) | 14 (5.1%) |
| 75 Years and over | 0 (0.0%) | 0 (0.0%) |
| Total | 150 (7.0%) | 604 (20.7%) |
Income Above Poverty by Sex and Age in Raynham Center
According to the poverty statistics in Raynham Center, males aged under 5 years and females aged 5 years are the age groups that are most secure financially, with 100.0% of males and 100.0% of females in these age groups living above the poverty line.
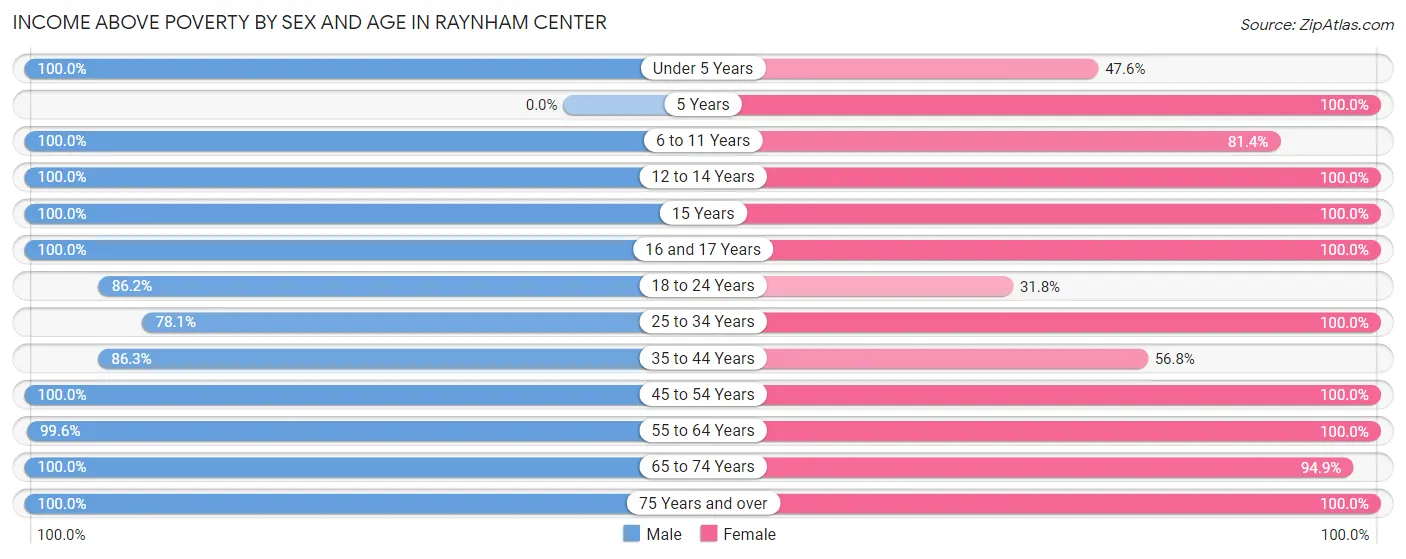
| Age Bracket | Male | Female |
| Under 5 Years | 177 (100.0%) | 109 (47.6%) |
| 5 Years | 0 (0.0%) | 92 (100.0%) |
| 6 to 11 Years | 223 (100.0%) | 336 (81.4%) |
| 12 to 14 Years | 37 (100.0%) | 46 (100.0%) |
| 15 Years | 15 (100.0%) | 9 (100.0%) |
| 16 and 17 Years | 38 (100.0%) | 74 (100.0%) |
| 18 to 24 Years | 125 (86.2%) | 88 (31.8%) |
| 25 to 34 Years | 221 (78.1%) | 357 (100.0%) |
| 35 to 44 Years | 422 (86.3%) | 268 (56.8%) |
| 45 to 54 Years | 178 (100.0%) | 284 (100.0%) |
| 55 to 64 Years | 221 (99.6%) | 260 (100.0%) |
| 65 to 74 Years | 252 (100.0%) | 261 (94.9%) |
| 75 Years and over | 96 (100.0%) | 131 (100.0%) |
| Total | 2,005 (93.0%) | 2,315 (79.3%) |
Income Below Poverty Among Married-Couple Families in Raynham Center
The poverty statistics for married-couple families in Raynham Center show that 6.9% or 67 of the total 977 families live below the poverty line. Families with 1 or 2 children have the highest poverty rate of 20.6%, comprising of 67 families. On the other hand, families with no children have the lowest poverty rate of 0.0%, which includes 0 families.
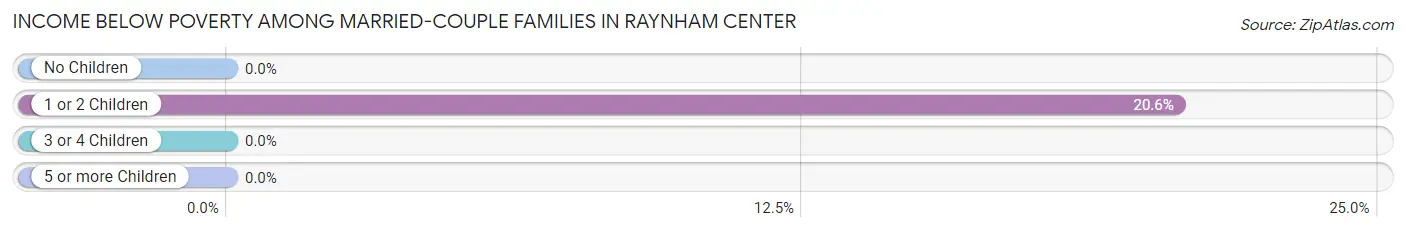
| Children | Above Poverty | Below Poverty |
| No Children | 496 (100.0%) | 0 (0.0%) |
| 1 or 2 Children | 258 (79.4%) | 67 (20.6%) |
| 3 or 4 Children | 90 (100.0%) | 0 (0.0%) |
| 5 or more Children | 66 (100.0%) | 0 (0.0%) |
| Total | 910 (93.1%) | 67 (6.9%) |
Income Below Poverty Among Single-Parent Households in Raynham Center
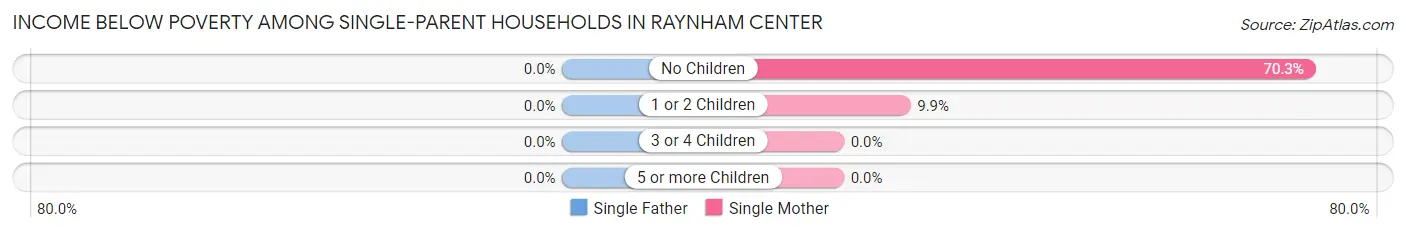
| Children | Single Father | Single Mother |
| No Children | 0 (0.0%) | 154 (70.3%) |
| 1 or 2 Children | 0 (0.0%) | 14 (9.9%) |
| 3 or 4 Children | 0 (0.0%) | 0 (0.0%) |
| 5 or more Children | 0 (0.0%) | 0 (0.0%) |
| Total | 0 (0.0%) | 168 (46.7%) |
Income Below Poverty Among Married-Couple vs Single-Parent Households in Raynham Center
The poverty data for Raynham Center shows that 67 of the married-couple family households (6.9%) and 168 of the single-parent households (44.0%) are living below the poverty level. Within the married-couple family households, those with 1 or 2 children have the highest poverty rate, with 67 households (20.6%) falling below the poverty line. Among the single-parent households, those with no children have the highest poverty rate, with 154 household (70.3%) living below poverty.
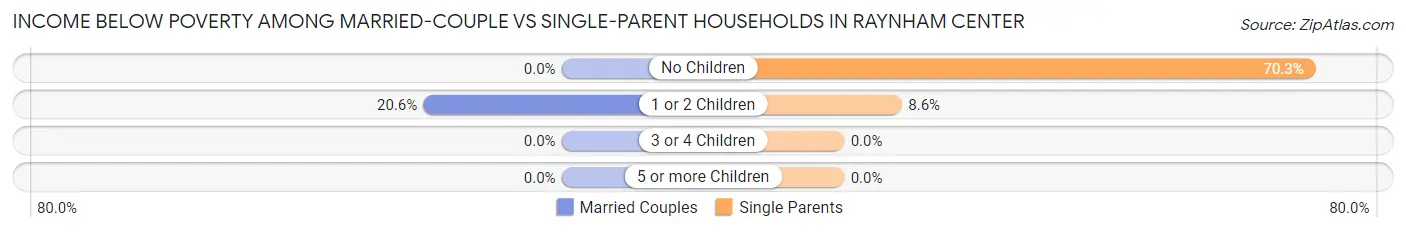
| Children | Married-Couple Families | Single-Parent Households |
| No Children | 0 (0.0%) | 154 (70.3%) |
| 1 or 2 Children | 67 (20.6%) | 14 (8.6%) |
| 3 or 4 Children | 0 (0.0%) | 0 (0.0%) |
| 5 or more Children | 0 (0.0%) | 0 (0.0%) |
| Total | 67 (6.9%) | 168 (44.0%) |
Race in Raynham Center
The most populous races in Raynham Center are White / Caucasian (3,611 | 71.2%), Some other Race (427 | 8.4%), and Black / African American (398 | 7.8%).
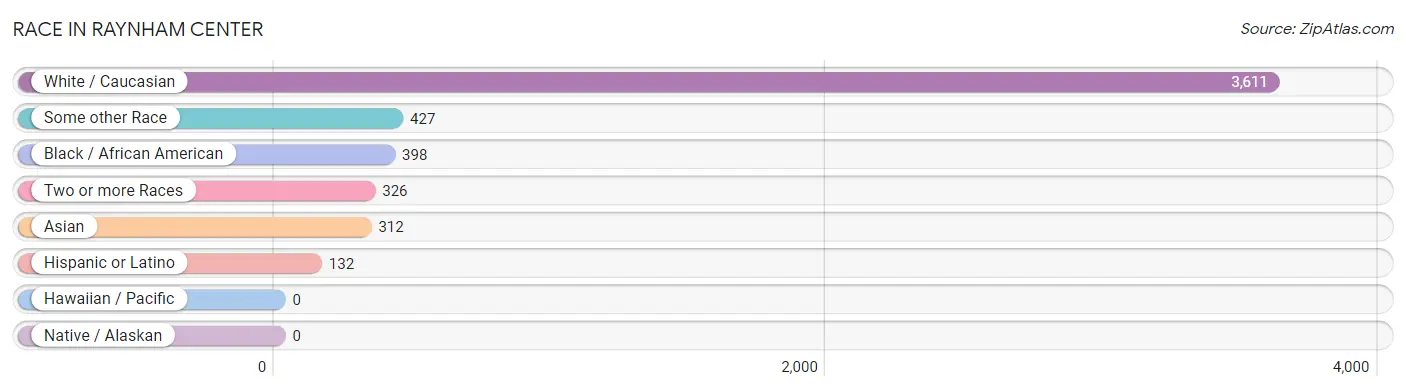
| Race | # Population | % Population |
| Asian | 312 | 6.1% |
| Black / African American | 398 | 7.8% |
| Hawaiian / Pacific | 0 | 0.0% |
| Hispanic or Latino | 132 | 2.6% |
| Native / Alaskan | 0 | 0.0% |
| White / Caucasian | 3,611 | 71.2% |
| Two or more Races | 326 | 6.4% |
| Some other Race | 427 | 8.4% |
| Total | 5,074 | 100.0% |
Ancestry in Raynham Center
The most populous ancestries reported in Raynham Center are Irish (836 | 16.5%), English (599 | 11.8%), Portuguese (464 | 9.1%), Subsaharan African (433 | 8.5%), and Cape Verdean (423 | 8.3%), together accounting for 54.3% of all Raynham Center residents.
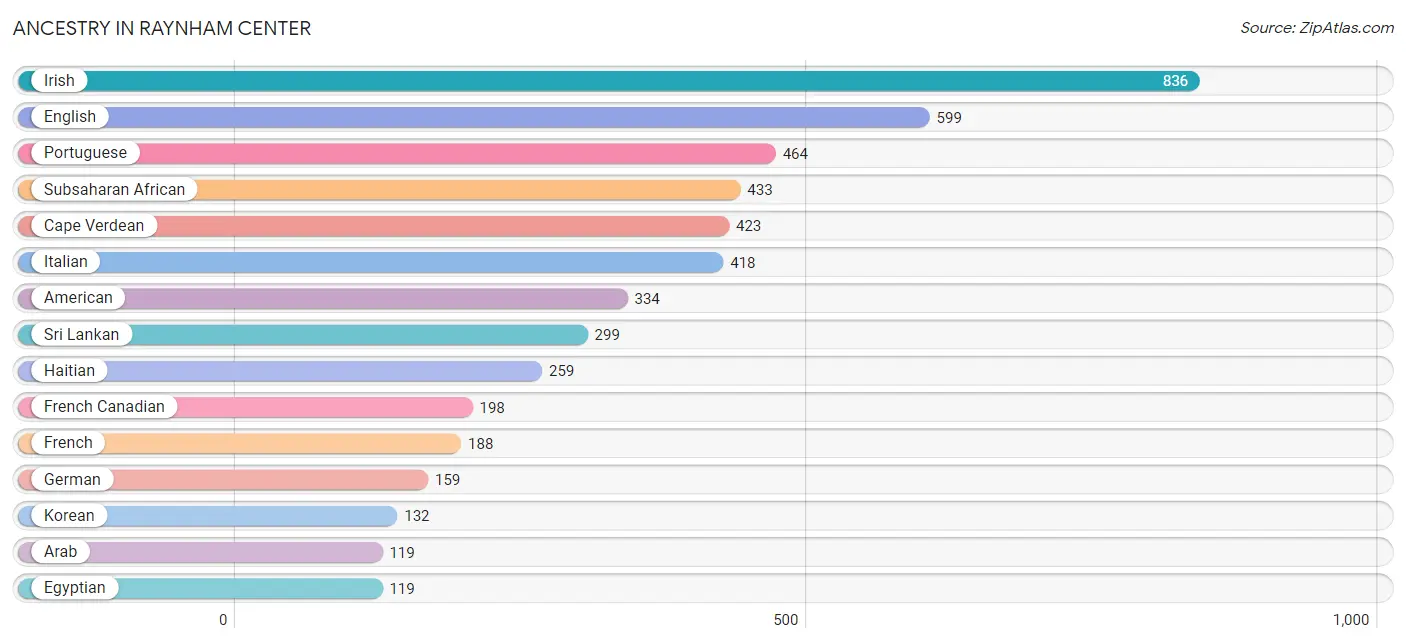
| Ancestry | # Population | % Population |
| African | 10 | 0.2% |
| American | 334 | 6.6% |
| Arab | 119 | 2.4% |
| Brazilian | 17 | 0.3% |
| Canadian | 18 | 0.4% |
| Cape Verdean | 423 | 8.3% |
| Colombian | 43 | 0.9% |
| Danish | 19 | 0.4% |
| Egyptian | 119 | 2.4% |
| English | 599 | 11.8% |
| Finnish | 26 | 0.5% |
| French | 188 | 3.7% |
| French Canadian | 198 | 3.9% |
| German | 159 | 3.1% |
| Greek | 17 | 0.3% |
| Haitian | 259 | 5.1% |
| Indian (Asian) | 32 | 0.6% |
| Irish | 836 | 16.5% |
| Italian | 418 | 8.2% |
| Korean | 132 | 2.6% |
| Northern European | 15 | 0.3% |
| Peruvian | 50 | 1.0% |
| Polish | 65 | 1.3% |
| Portuguese | 464 | 9.1% |
| Romanian | 16 | 0.3% |
| Russian | 16 | 0.3% |
| Scandinavian | 8 | 0.2% |
| Scotch-Irish | 13 | 0.3% |
| Scottish | 79 | 1.6% |
| South American | 119 | 2.4% |
| Spaniard | 13 | 0.3% |
| Sri Lankan | 299 | 5.9% |
| Subsaharan African | 433 | 8.5% |
| Swedish | 26 | 0.5% |
| Venezuelan | 26 | 0.5% | View All 35 Rows |
Immigrants in Raynham Center
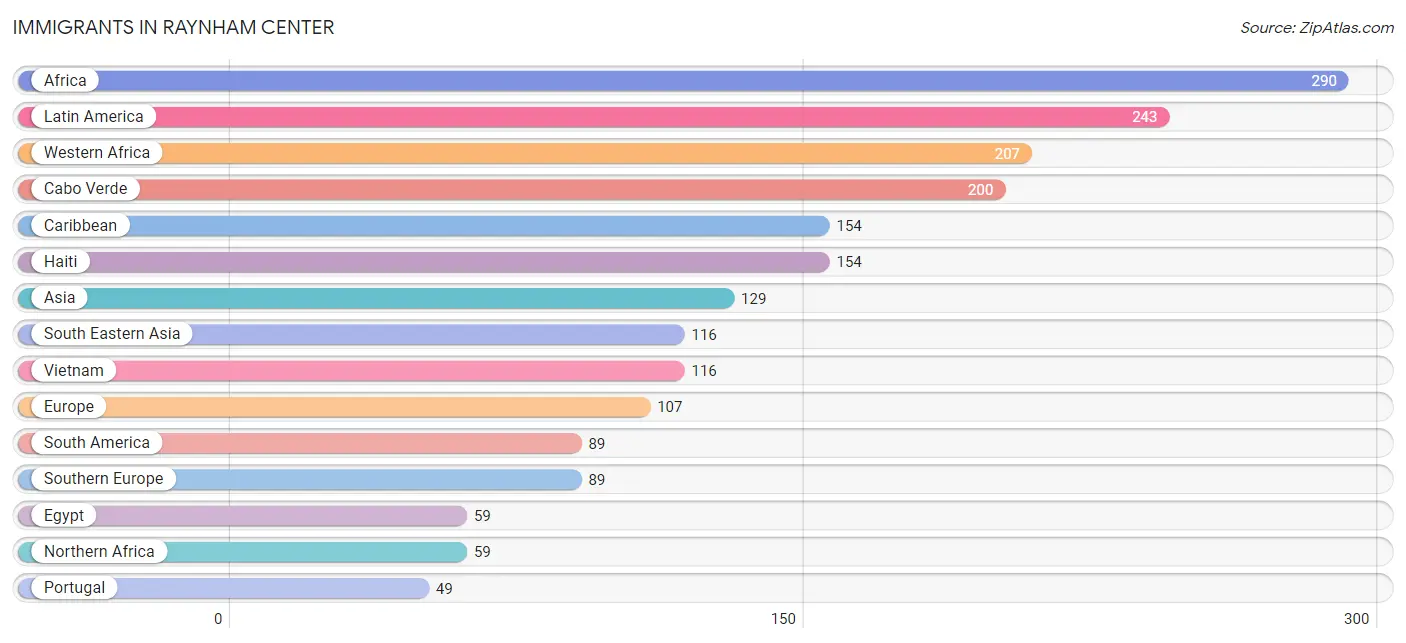
The most numerous immigrant groups reported in Raynham Center came from Africa (290 | 5.7%), Latin America (243 | 4.8%), Western Africa (207 | 4.1%), Cabo Verde (200 | 3.9%), and Caribbean (154 | 3.0%), together accounting for 21.6% of all Raynham Center residents.
| Immigration Origin | # Population | % Population |
| Africa | 290 | 5.7% |
| Asia | 129 | 2.5% |
| Brazil | 36 | 0.7% |
| Cabo Verde | 200 | 3.9% |
| Canada | 31 | 0.6% |
| Caribbean | 154 | 3.0% |
| Chile | 15 | 0.3% |
| China | 13 | 0.3% |
| Eastern Asia | 13 | 0.3% |
| Egypt | 59 | 1.2% |
| Europe | 107 | 2.1% |
| Germany | 18 | 0.4% |
| Haiti | 154 | 3.0% |
| Hong Kong | 13 | 0.3% |
| Italy | 27 | 0.5% |
| Latin America | 243 | 4.8% |
| Liberia | 7 | 0.1% |
| Middle Africa | 24 | 0.5% |
| Northern Africa | 59 | 1.2% |
| Peru | 25 | 0.5% |
| Portugal | 49 | 1.0% |
| South America | 89 | 1.8% |
| South Eastern Asia | 116 | 2.3% |
| Southern Europe | 89 | 1.8% |
| Spain | 13 | 0.3% |
| Venezuela | 13 | 0.3% |
| Vietnam | 116 | 2.3% |
| Western Africa | 207 | 4.1% |
| Western Europe | 18 | 0.4% | View All 29 Rows |
Sex and Age in Raynham Center
Sex and Age in Raynham Center
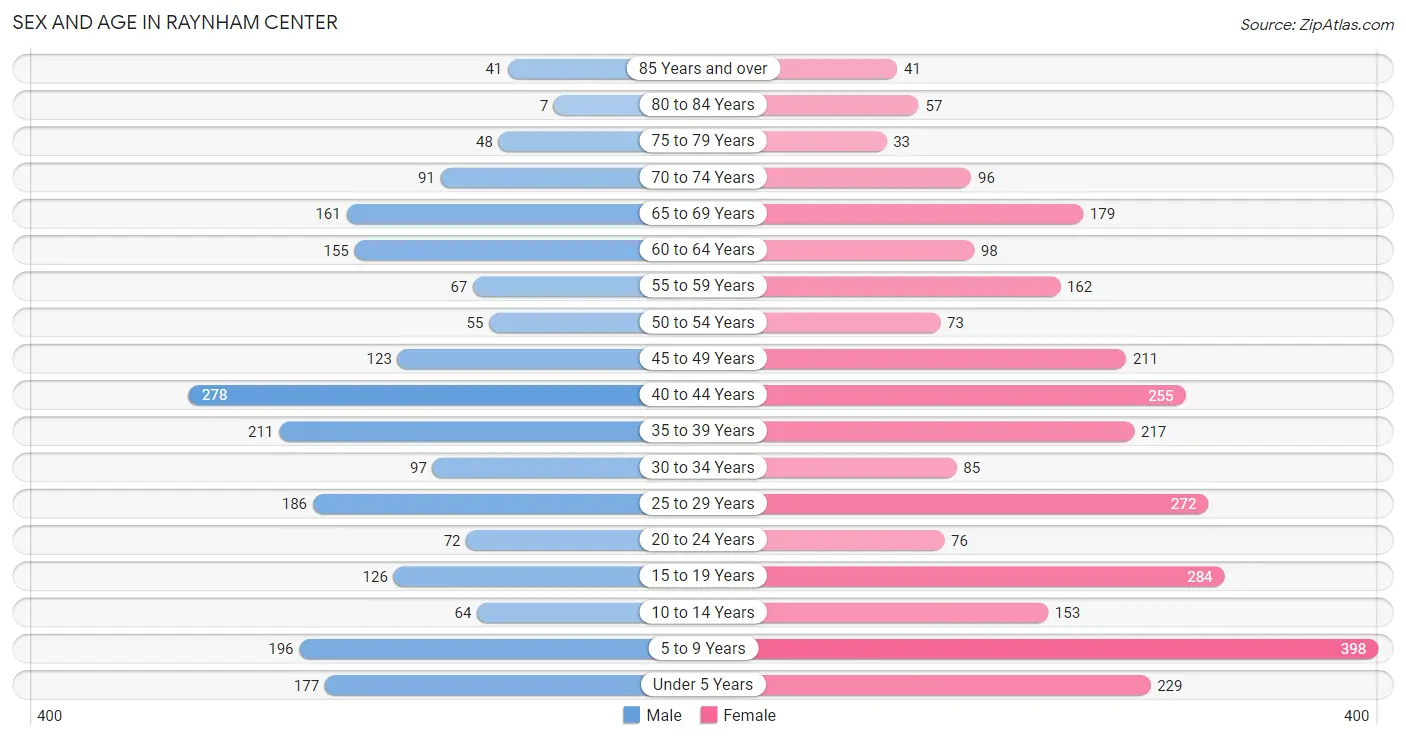
The most populous age groups in Raynham Center are 40 to 44 Years (278 | 12.9%) for men and 5 to 9 Years (398 | 13.6%) for women.
| Age Bracket | Male | Female |
| Under 5 Years | 177 (8.2%) | 229 (7.9%) |
| 5 to 9 Years | 196 (9.1%) | 398 (13.6%) |
| 10 to 14 Years | 64 (3.0%) | 153 (5.2%) |
| 15 to 19 Years | 126 (5.9%) | 284 (9.7%) |
| 20 to 24 Years | 72 (3.3%) | 76 (2.6%) |
| 25 to 29 Years | 186 (8.6%) | 272 (9.3%) |
| 30 to 34 Years | 97 (4.5%) | 85 (2.9%) |
| 35 to 39 Years | 211 (9.8%) | 217 (7.4%) |
| 40 to 44 Years | 278 (12.9%) | 255 (8.7%) |
| 45 to 49 Years | 123 (5.7%) | 211 (7.2%) |
| 50 to 54 Years | 55 (2.5%) | 73 (2.5%) |
| 55 to 59 Years | 67 (3.1%) | 162 (5.6%) |
| 60 to 64 Years | 155 (7.2%) | 98 (3.4%) |
| 65 to 69 Years | 161 (7.5%) | 179 (6.1%) |
| 70 to 74 Years | 91 (4.2%) | 96 (3.3%) |
| 75 to 79 Years | 48 (2.2%) | 33 (1.1%) |
| 80 to 84 Years | 7 (0.3%) | 57 (1.9%) |
| 85 Years and over | 41 (1.9%) | 41 (1.4%) |
| Total | 2,155 (100.0%) | 2,919 (100.0%) |
Families and Households in Raynham Center
Median Family Size in Raynham Center
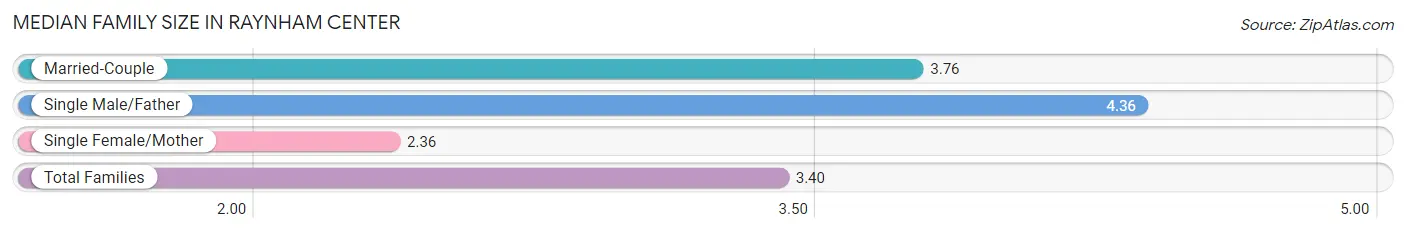
The median family size in Raynham Center is 3.40 persons per family, with single male/father families (22 | 1.6%) accounting for the largest median family size of 4.36 persons per family. On the other hand, single female/mother families (360 | 26.5%) represent the smallest median family size with 2.36 persons per family.
| Family Type | # Families | Family Size |
| Married-Couple | 977 (71.9%) | 3.76 |
| Single Male/Father | 22 (1.6%) | 4.36 |
| Single Female/Mother | 360 (26.5%) | 2.36 |
| Total Families | 1,359 (100.0%) | 3.40 |
Median Household Size in Raynham Center
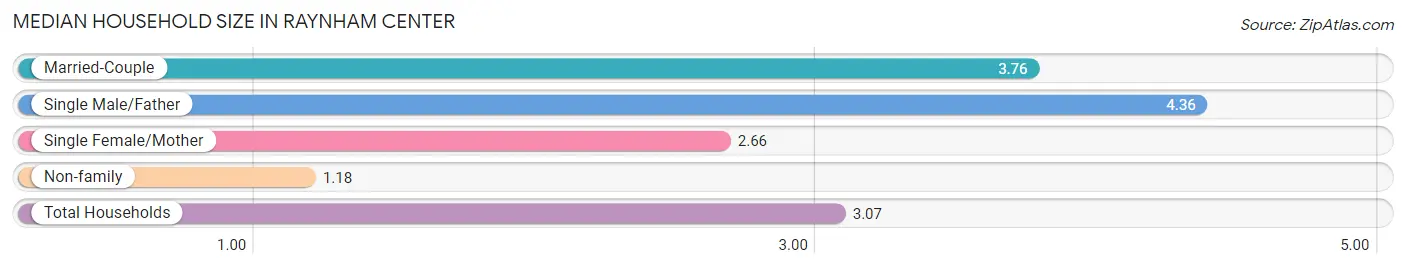
The median household size in Raynham Center is 3.07 persons per household, with single male/father households (22 | 1.3%) accounting for the largest median household size of 4.36 persons per household. non-family households (289 | 17.5%) represent the smallest median household size with 1.18 persons per household.
| Household Type | # Households | Household Size |
| Married-Couple | 977 (59.3%) | 3.76 |
| Single Male/Father | 22 (1.3%) | 4.36 |
| Single Female/Mother | 360 (21.8%) | 2.66 |
| Non-family | 289 (17.5%) | 1.18 |
| Total Households | 1,648 (100.0%) | 3.07 |
Household Size by Marriage Status in Raynham Center
Out of a total of 1,648 households in Raynham Center, 1,359 (82.5%) are family households, while 289 (17.5%) are nonfamily households. The most numerous type of family households are 2-person households, comprising 543, and the most common type of nonfamily households are 1-person households, comprising 236.
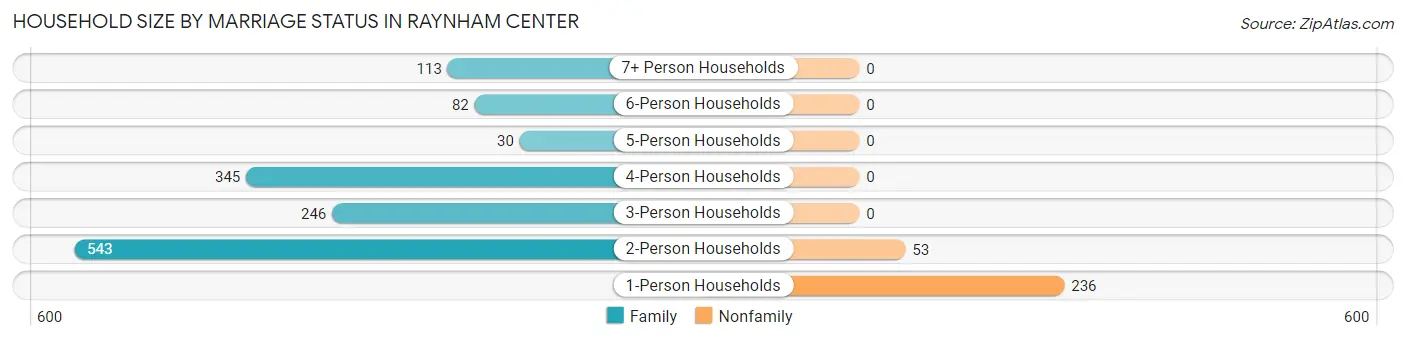
| Household Size | Family Households | Nonfamily Households |
| 1-Person Households | - | 236 (14.3%) |
| 2-Person Households | 543 (33.0%) | 53 (3.2%) |
| 3-Person Households | 246 (14.9%) | 0 (0.0%) |
| 4-Person Households | 345 (20.9%) | 0 (0.0%) |
| 5-Person Households | 30 (1.8%) | 0 (0.0%) |
| 6-Person Households | 82 (5.0%) | 0 (0.0%) |
| 7+ Person Households | 113 (6.9%) | 0 (0.0%) |
| Total | 1,359 (82.5%) | 289 (17.5%) |
Female Fertility in Raynham Center
Fertility by Age in Raynham Center
Average fertility rate in Raynham Center is 9.0 births per 1,000 women. Women in the age bracket of 20 to 34 years have the highest fertility rate with 30.0 births per 1,000 women. Women in the age bracket of 20 to 34 years acount for 100.0% of all women with births.
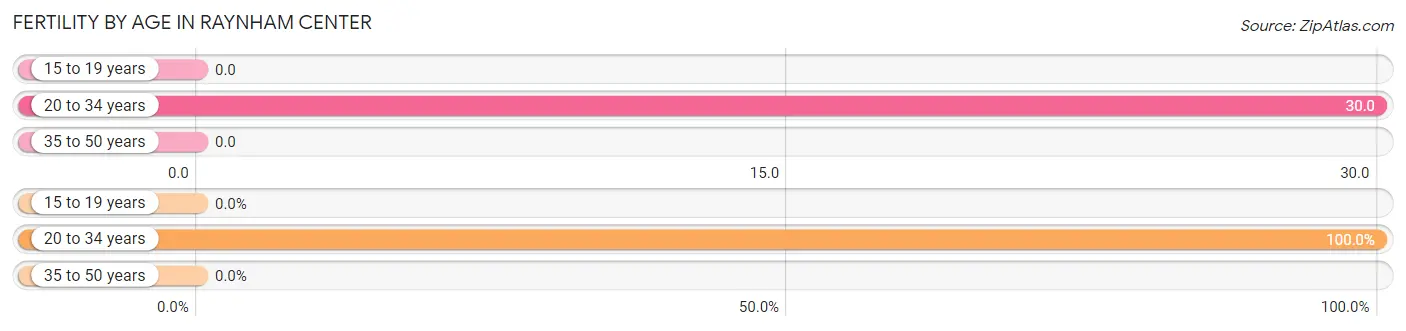
| Age Bracket | Women with Births | Births / 1,000 Women |
| 15 to 19 years | 0 (0.0%) | 0.0 |
| 20 to 34 years | 13 (100.0%) | 30.0 |
| 35 to 50 years | 0 (0.0%) | 0.0 |
| Total | 13 (100.0%) | 9.0 |
Fertility by Age by Marriage Status in Raynham Center
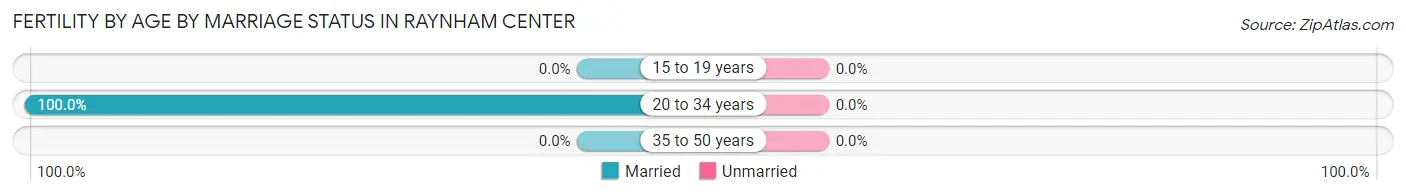
| Age Bracket | Married | Unmarried |
| 15 to 19 years | 0 (0.0%) | 0 (0.0%) |
| 20 to 34 years | 13 (100.0%) | 0 (0.0%) |
| 35 to 50 years | 0 (0.0%) | 0 (0.0%) |
| Total | 13 (100.0%) | 0 (0.0%) |
Fertility by Education in Raynham Center
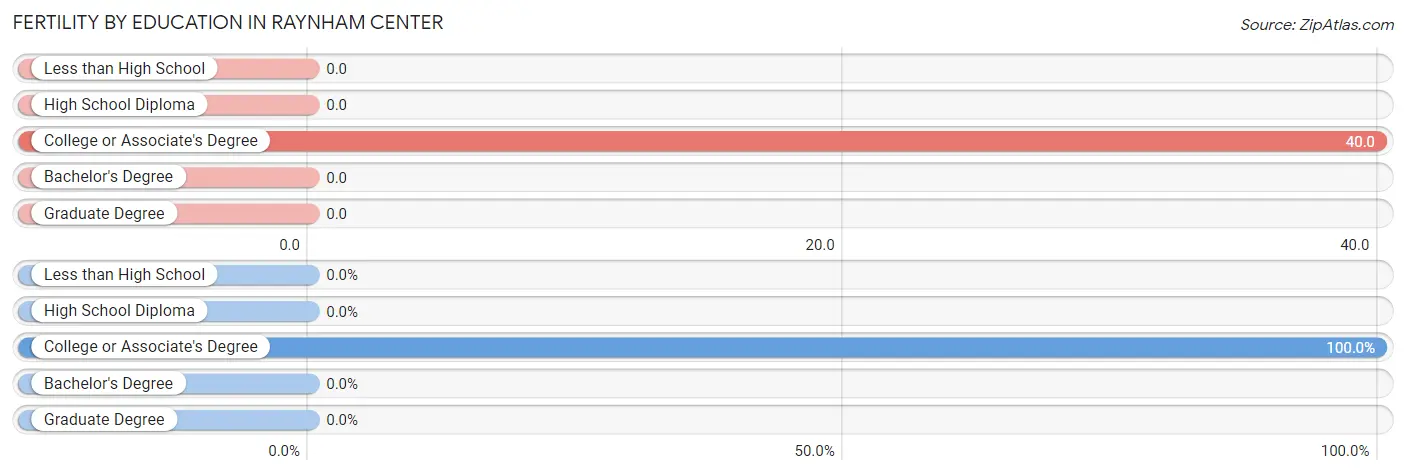
| Educational Attainment | Women with Births | Births / 1,000 Women |
| Less than High School | 0 (0.0%) | 0.0 |
| High School Diploma | 0 (0.0%) | 0.0 |
| College or Associate's Degree | 13 (100.0%) | 40.0 |
| Bachelor's Degree | 0 (0.0%) | 0.0 |
| Graduate Degree | 0 (0.0%) | 0.0 |
| Total | 13 (100.0%) | 9.0 |
Fertility by Education by Marriage Status in Raynham Center
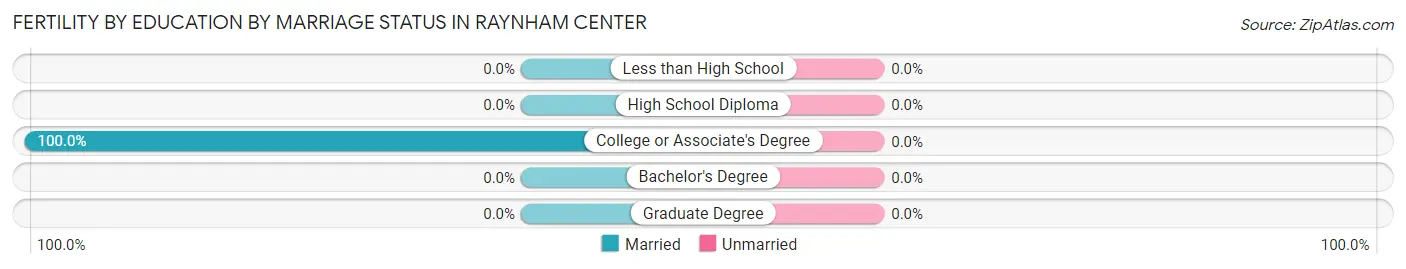
| Educational Attainment | Married | Unmarried |
| Less than High School | 0 (0.0%) | 0 (0.0%) |
| High School Diploma | 0 (0.0%) | 0 (0.0%) |
| College or Associate's Degree | 13 (100.0%) | 0 (0.0%) |
| Bachelor's Degree | 0 (0.0%) | 0 (0.0%) |
| Graduate Degree | 0 (0.0%) | 0 (0.0%) |
| Total | 13 (100.0%) | 0 (0.0%) |
Employment Characteristics in Raynham Center
Employment by Class of Employer in Raynham Center
Among the 2,480 employed individuals in Raynham Center, private company employees (1,685 | 67.9%), local government employees (324 | 13.1%), and state government employees (211 | 8.5%) make up the most common classes of employment.
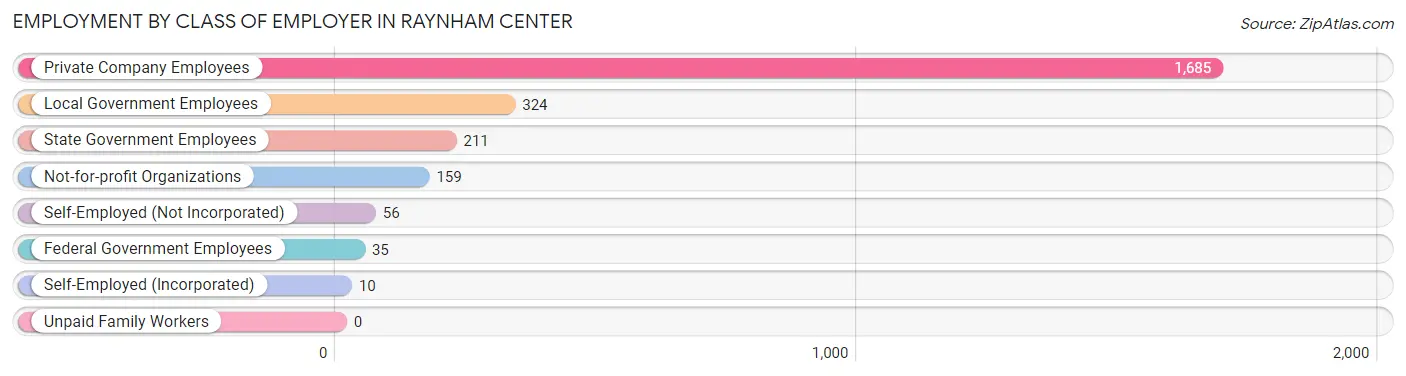
| Employer Class | # Employees | % Employees |
| Private Company Employees | 1,685 | 67.9% |
| Self-Employed (Incorporated) | 10 | 0.4% |
| Self-Employed (Not Incorporated) | 56 | 2.3% |
| Not-for-profit Organizations | 159 | 6.4% |
| Local Government Employees | 324 | 13.1% |
| State Government Employees | 211 | 8.5% |
| Federal Government Employees | 35 | 1.4% |
| Unpaid Family Workers | 0 | 0.0% |
| Total | 2,480 | 100.0% |
Employment Status by Age in Raynham Center
According to the labor force statistics for Raynham Center, out of the total population over 16 years of age (3,833), 71.6% or 2,744 individuals are in the labor force, with 7.4% or 203 of them unemployed. The age group with the highest labor force participation rate is 25 to 29 years, with 100.0% or 458 individuals in the labor force. Within the labor force, the 75 years and over age range has the highest percentage of unemployed individuals, with 75.0% or 21 of them being unemployed.
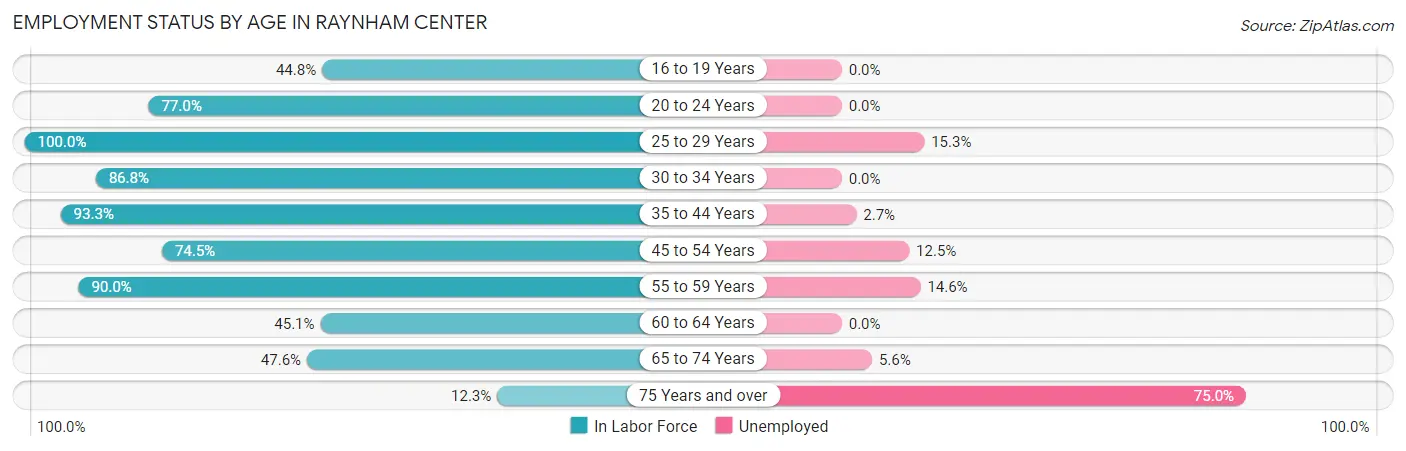
| Age Bracket | In Labor Force | Unemployed |
| 16 to 19 Years | 173 (44.8%) | 0 (0.0%) |
| 20 to 24 Years | 114 (77.0%) | 0 (0.0%) |
| 25 to 29 Years | 458 (100.0%) | 70 (15.3%) |
| 30 to 34 Years | 158 (86.8%) | 0 (0.0%) |
| 35 to 44 Years | 897 (93.3%) | 24 (2.7%) |
| 45 to 54 Years | 344 (74.5%) | 43 (12.5%) |
| 55 to 59 Years | 206 (90.0%) | 30 (14.6%) |
| 60 to 64 Years | 114 (45.1%) | 0 (0.0%) |
| 65 to 74 Years | 251 (47.6%) | 14 (5.6%) |
| 75 Years and over | 28 (12.3%) | 21 (75.0%) |
| Total | 2,744 (71.6%) | 203 (7.4%) |
Employment Status by Educational Attainment in Raynham Center
According to labor force statistics for Raynham Center, 85.5% of individuals (2,176) out of the total population between 25 and 64 years of age (2,545) are in the labor force, with 7.7% or 168 of them being unemployed. The group with the highest labor force participation rate are those with the educational attainment of less than high school, with 100.0% or 137 individuals in the labor force. Within the labor force, individuals with college / associate degree education have the highest percentage of unemployment, with 13.9% or 100 of them being unemployed.
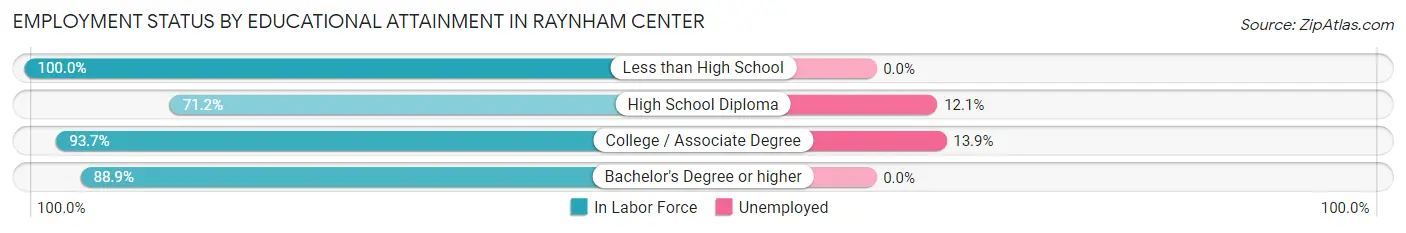
| Educational Attainment | In Labor Force | Unemployed |
| Less than High School | 137 (100.0%) | 0 (0.0%) |
| High School Diploma | 554 (71.2%) | 94 (12.1%) |
| College / Associate Degree | 718 (93.7%) | 106 (13.9%) |
| Bachelor's Degree or higher | 768 (88.9%) | 0 (0.0%) |
| Total | 2,176 (85.5%) | 196 (7.7%) |
Employment Occupations by Sex in Raynham Center
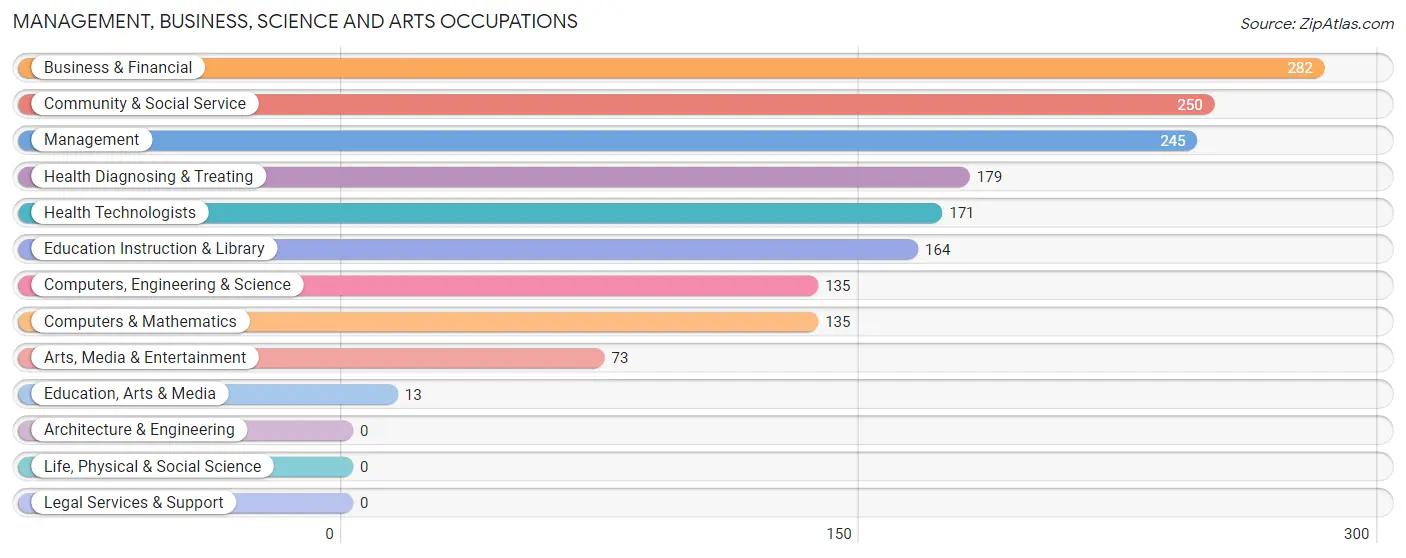
Management, Business, Science and Arts Occupations
The most common Management, Business, Science and Arts occupations in Raynham Center are Business & Financial (282 | 11.1%), Community & Social Service (250 | 9.8%), Management (245 | 9.6%), Health Diagnosing & Treating (179 | 7.0%), and Health Technologists (171 | 6.7%).
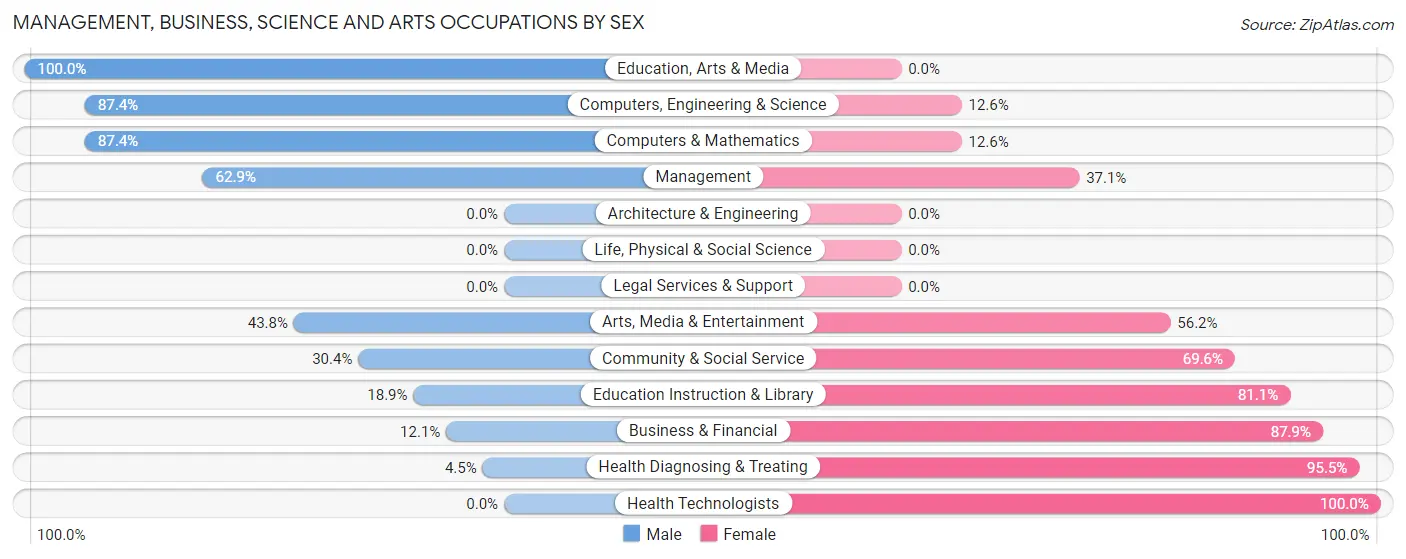
Management, Business, Science and Arts Occupations by Sex
Within the Management, Business, Science and Arts occupations in Raynham Center, the most male-oriented occupations are Education, Arts & Media (100.0%), Computers, Engineering & Science (87.4%), and Computers & Mathematics (87.4%), while the most female-oriented occupations are Health Technologists (100.0%), Health Diagnosing & Treating (95.5%), and Business & Financial (87.9%).
| Occupation | Male | Female |
| Management | 154 (62.9%) | 91 (37.1%) |
| Business & Financial | 34 (12.1%) | 248 (87.9%) |
| Computers, Engineering & Science | 118 (87.4%) | 17 (12.6%) |
| Computers & Mathematics | 118 (87.4%) | 17 (12.6%) |
| Architecture & Engineering | 0 (0.0%) | 0 (0.0%) |
| Life, Physical & Social Science | 0 (0.0%) | 0 (0.0%) |
| Community & Social Service | 76 (30.4%) | 174 (69.6%) |
| Education, Arts & Media | 13 (100.0%) | 0 (0.0%) |
| Legal Services & Support | 0 (0.0%) | 0 (0.0%) |
| Education Instruction & Library | 31 (18.9%) | 133 (81.1%) |
| Arts, Media & Entertainment | 32 (43.8%) | 41 (56.2%) |
| Health Diagnosing & Treating | 8 (4.5%) | 171 (95.5%) |
| Health Technologists | 0 (0.0%) | 171 (100.0%) |
| Total (Category) | 390 (35.7%) | 701 (64.2%) |
| Total (Overall) | 1,237 (48.7%) | 1,304 (51.3%) |
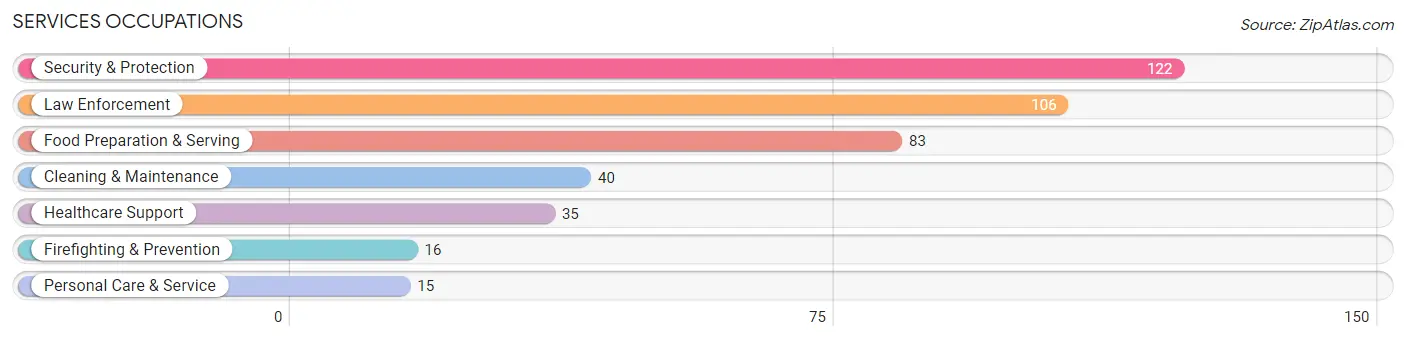
Services Occupations
The most common Services occupations in Raynham Center are Security & Protection (122 | 4.8%), Law Enforcement (106 | 4.2%), Food Preparation & Serving (83 | 3.3%), Cleaning & Maintenance (40 | 1.6%), and Healthcare Support (35 | 1.4%).
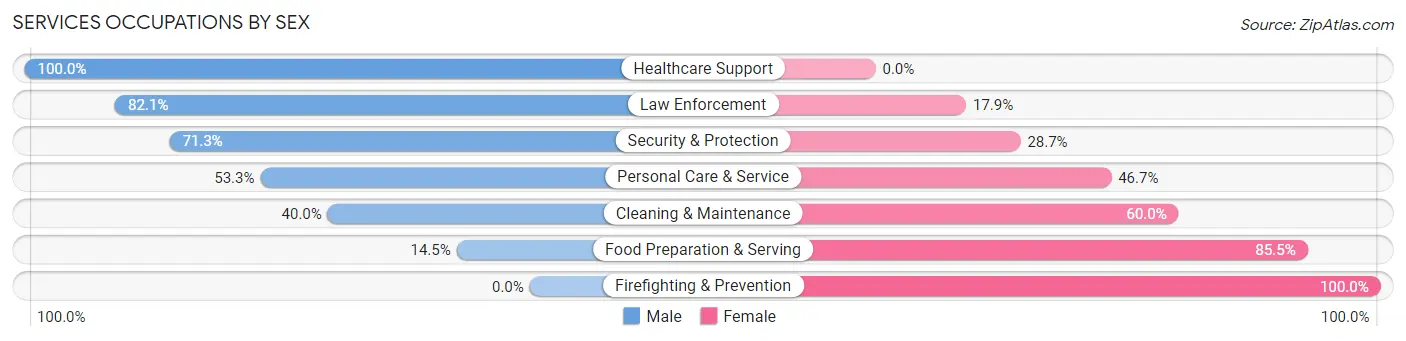
Services Occupations by Sex
Within the Services occupations in Raynham Center, the most male-oriented occupations are Healthcare Support (100.0%), Law Enforcement (82.1%), and Security & Protection (71.3%), while the most female-oriented occupations are Firefighting & Prevention (100.0%), Food Preparation & Serving (85.5%), and Cleaning & Maintenance (60.0%).
| Occupation | Male | Female |
| Healthcare Support | 35 (100.0%) | 0 (0.0%) |
| Security & Protection | 87 (71.3%) | 35 (28.7%) |
| Firefighting & Prevention | 0 (0.0%) | 16 (100.0%) |
| Law Enforcement | 87 (82.1%) | 19 (17.9%) |
| Food Preparation & Serving | 12 (14.5%) | 71 (85.5%) |
| Cleaning & Maintenance | 16 (40.0%) | 24 (60.0%) |
| Personal Care & Service | 8 (53.3%) | 7 (46.7%) |
| Total (Category) | 158 (53.6%) | 137 (46.4%) |
| Total (Overall) | 1,237 (48.7%) | 1,304 (51.3%) |
Sales and Office Occupations
The most common Sales and Office occupations in Raynham Center are Sales & Related (297 | 11.7%), and Office & Administration (272 | 10.7%).
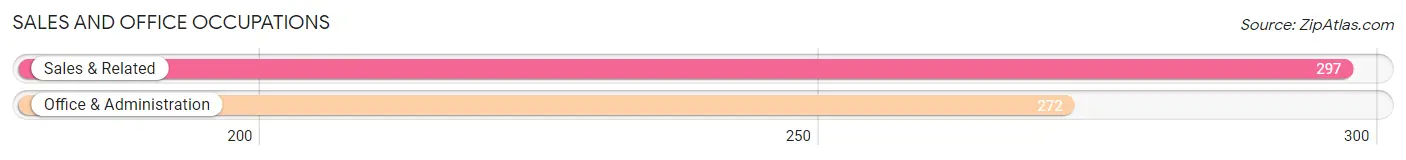
Sales and Office Occupations by Sex
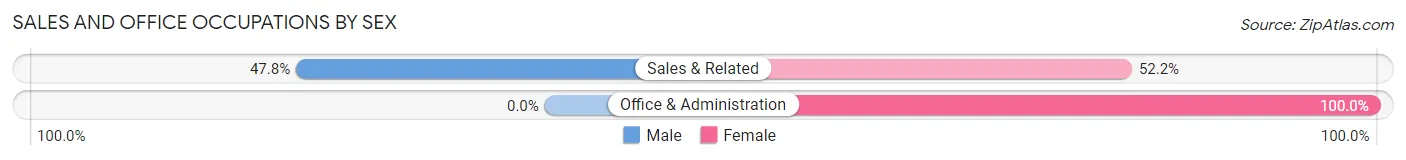
| Occupation | Male | Female |
| Sales & Related | 142 (47.8%) | 155 (52.2%) |
| Office & Administration | 0 (0.0%) | 272 (100.0%) |
| Total (Category) | 142 (25.0%) | 427 (75.0%) |
| Total (Overall) | 1,237 (48.7%) | 1,304 (51.3%) |
Natural Resources, Construction and Maintenance Occupations
The most common Natural Resources, Construction and Maintenance occupations in Raynham Center are Construction & Extraction (256 | 10.1%), and Installation, Maintenance & Repair (33 | 1.3%).
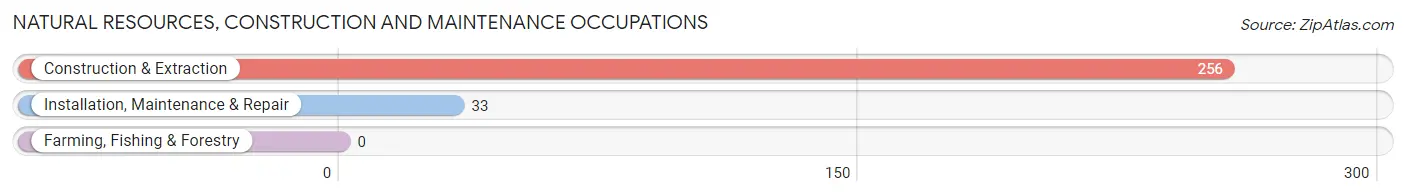
Natural Resources, Construction and Maintenance Occupations by Sex
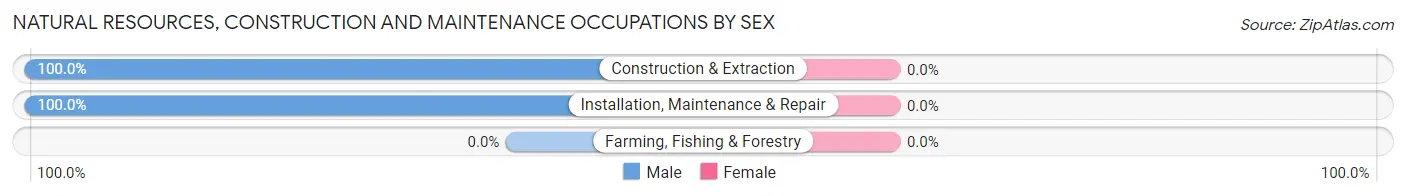
| Occupation | Male | Female |
| Farming, Fishing & Forestry | 0 (0.0%) | 0 (0.0%) |
| Construction & Extraction | 256 (100.0%) | 0 (0.0%) |
| Installation, Maintenance & Repair | 33 (100.0%) | 0 (0.0%) |
| Total (Category) | 289 (100.0%) | 0 (0.0%) |
| Total (Overall) | 1,237 (48.7%) | 1,304 (51.3%) |
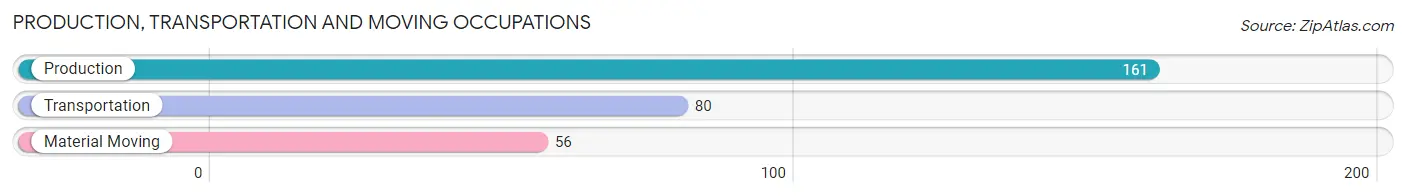
Production, Transportation and Moving Occupations
The most common Production, Transportation and Moving occupations in Raynham Center are Production (161 | 6.3%), Transportation (80 | 3.2%), and Material Moving (56 | 2.2%).
Production, Transportation and Moving Occupations by Sex
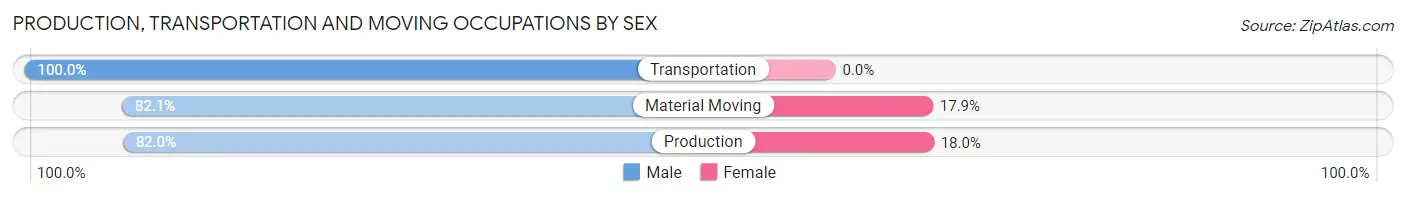
| Occupation | Male | Female |
| Production | 132 (82.0%) | 29 (18.0%) |
| Transportation | 80 (100.0%) | 0 (0.0%) |
| Material Moving | 46 (82.1%) | 10 (17.9%) |
| Total (Category) | 258 (86.9%) | 39 (13.1%) |
| Total (Overall) | 1,237 (48.7%) | 1,304 (51.3%) |
Employment Industries by Sex in Raynham Center
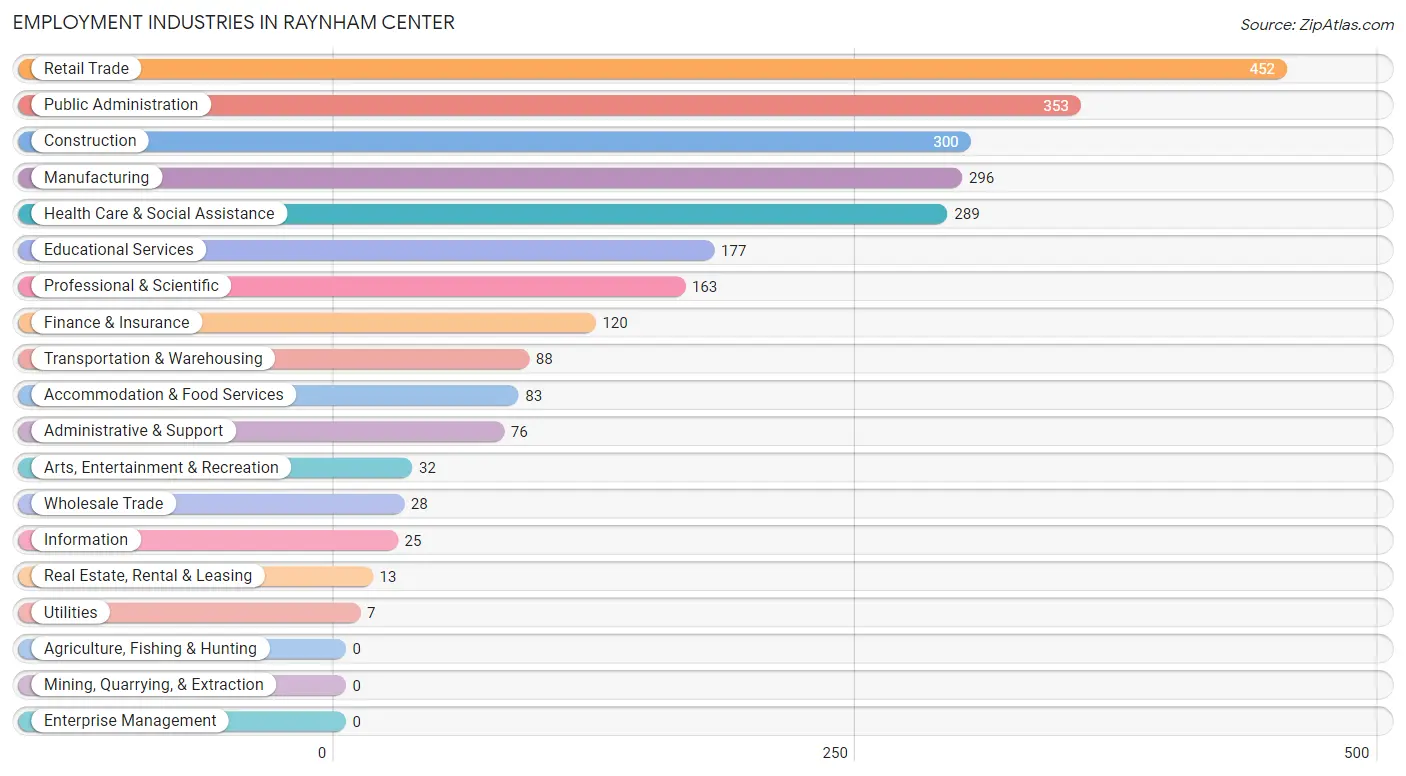
Employment Industries in Raynham Center
The major employment industries in Raynham Center include Retail Trade (452 | 17.8%), Public Administration (353 | 13.9%), Construction (300 | 11.8%), Manufacturing (296 | 11.7%), and Health Care & Social Assistance (289 | 11.4%).
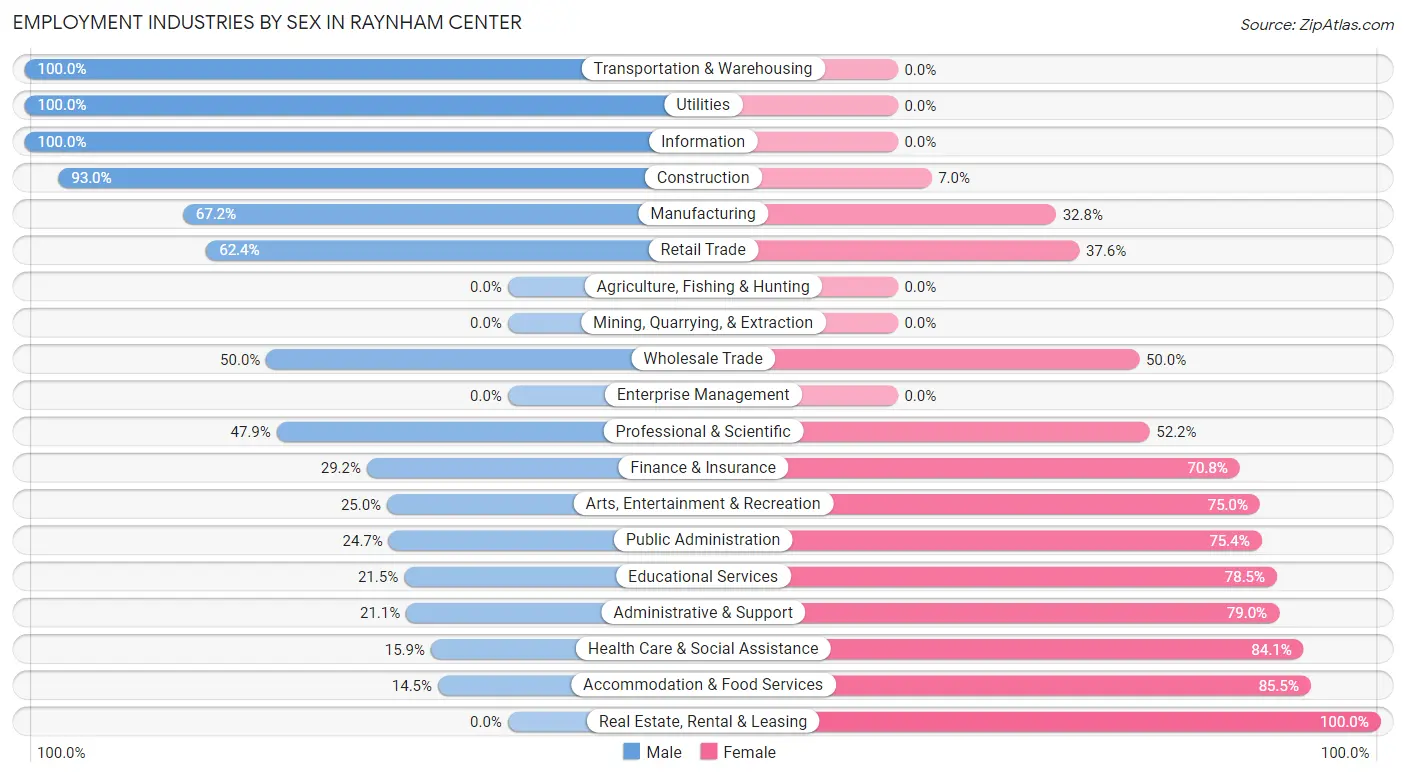
Employment Industries by Sex in Raynham Center
The Raynham Center industries that see more men than women are Transportation & Warehousing (100.0%), Utilities (100.0%), and Information (100.0%), whereas the industries that tend to have a higher number of women are Real Estate, Rental & Leasing (100.0%), Accommodation & Food Services (85.5%), and Health Care & Social Assistance (84.1%).
| Industry | Male | Female |
| Agriculture, Fishing & Hunting | 0 (0.0%) | 0 (0.0%) |
| Mining, Quarrying, & Extraction | 0 (0.0%) | 0 (0.0%) |
| Construction | 279 (93.0%) | 21 (7.0%) |
| Manufacturing | 199 (67.2%) | 97 (32.8%) |
| Wholesale Trade | 14 (50.0%) | 14 (50.0%) |
| Retail Trade | 282 (62.4%) | 170 (37.6%) |
| Transportation & Warehousing | 88 (100.0%) | 0 (0.0%) |
| Utilities | 7 (100.0%) | 0 (0.0%) |
| Information | 25 (100.0%) | 0 (0.0%) |
| Finance & Insurance | 35 (29.2%) | 85 (70.8%) |
| Real Estate, Rental & Leasing | 0 (0.0%) | 13 (100.0%) |
| Professional & Scientific | 78 (47.8%) | 85 (52.1%) |
| Enterprise Management | 0 (0.0%) | 0 (0.0%) |
| Administrative & Support | 16 (21.0%) | 60 (78.9%) |
| Educational Services | 38 (21.5%) | 139 (78.5%) |
| Health Care & Social Assistance | 46 (15.9%) | 243 (84.1%) |
| Arts, Entertainment & Recreation | 8 (25.0%) | 24 (75.0%) |
| Accommodation & Food Services | 12 (14.5%) | 71 (85.5%) |
| Public Administration | 87 (24.6%) | 266 (75.3%) |
| Total | 1,237 (48.7%) | 1,304 (51.3%) |
Education in Raynham Center
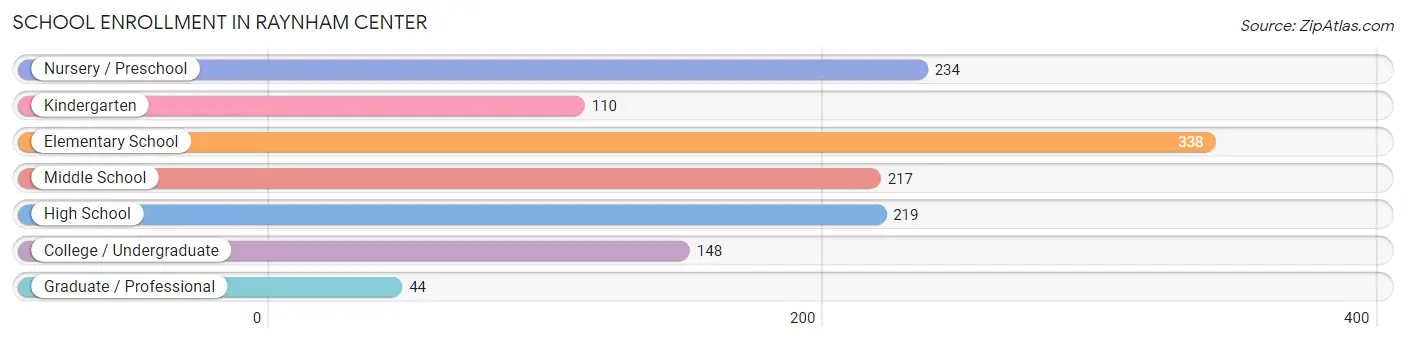
School Enrollment in Raynham Center
The most common levels of schooling among the 1,310 students in Raynham Center are elementary school (338 | 25.8%), nursery / preschool (234 | 17.9%), and high school (219 | 16.7%).
| School Level | # Students | % Students |
| Nursery / Preschool | 234 | 17.9% |
| Kindergarten | 110 | 8.4% |
| Elementary School | 338 | 25.8% |
| Middle School | 217 | 16.6% |
| High School | 219 | 16.7% |
| College / Undergraduate | 148 | 11.3% |
| Graduate / Professional | 44 | 3.4% |
| Total | 1,310 | 100.0% |
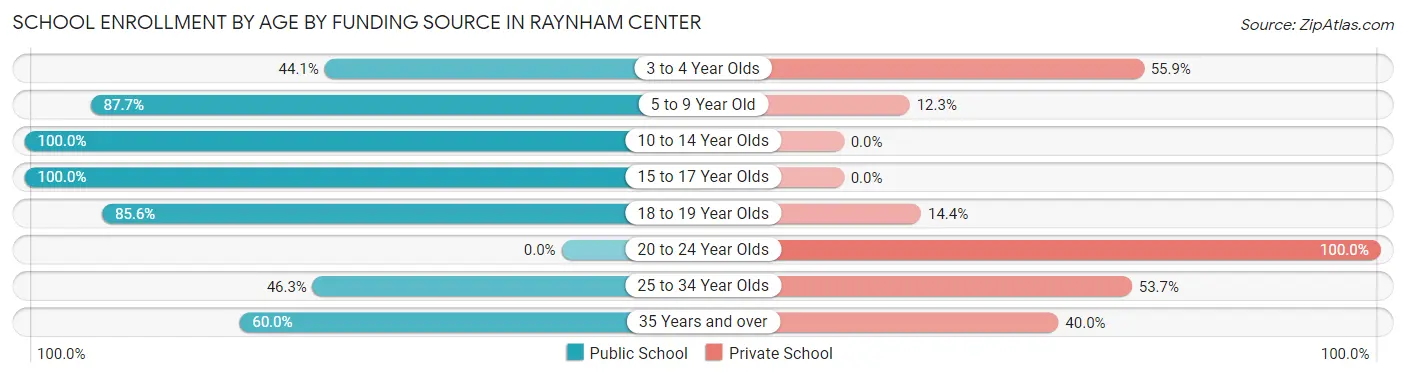
School Enrollment by Age by Funding Source in Raynham Center
Out of a total of 1,310 students who are enrolled in schools in Raynham Center, 261 (19.9%) attend a private institution, while the remaining 1,049 (80.1%) are enrolled in public schools. The age group of 20 to 24 year olds has the highest likelihood of being enrolled in private schools, with 17 (100.0% in the age bracket) enrolled. Conversely, the age group of 10 to 14 year olds has the lowest likelihood of being enrolled in a private school, with 217 (100.0% in the age bracket) attending a public institution.
| Age Bracket | Public School | Private School |
| 3 to 4 Year Olds | 75 (44.1%) | 95 (55.9%) |
| 5 to 9 Year Old | 449 (87.7%) | 63 (12.3%) |
| 10 to 14 Year Olds | 217 (100.0%) | 0 (0.0%) |
| 15 to 17 Year Olds | 136 (100.0%) | 0 (0.0%) |
| 18 to 19 Year Olds | 95 (85.6%) | 16 (14.4%) |
| 20 to 24 Year Olds | 0 (0.0%) | 17 (100.0%) |
| 25 to 34 Year Olds | 38 (46.3%) | 44 (53.7%) |
| 35 Years and over | 39 (60.0%) | 26 (40.0%) |
| Total | 1,049 (80.1%) | 261 (19.9%) |
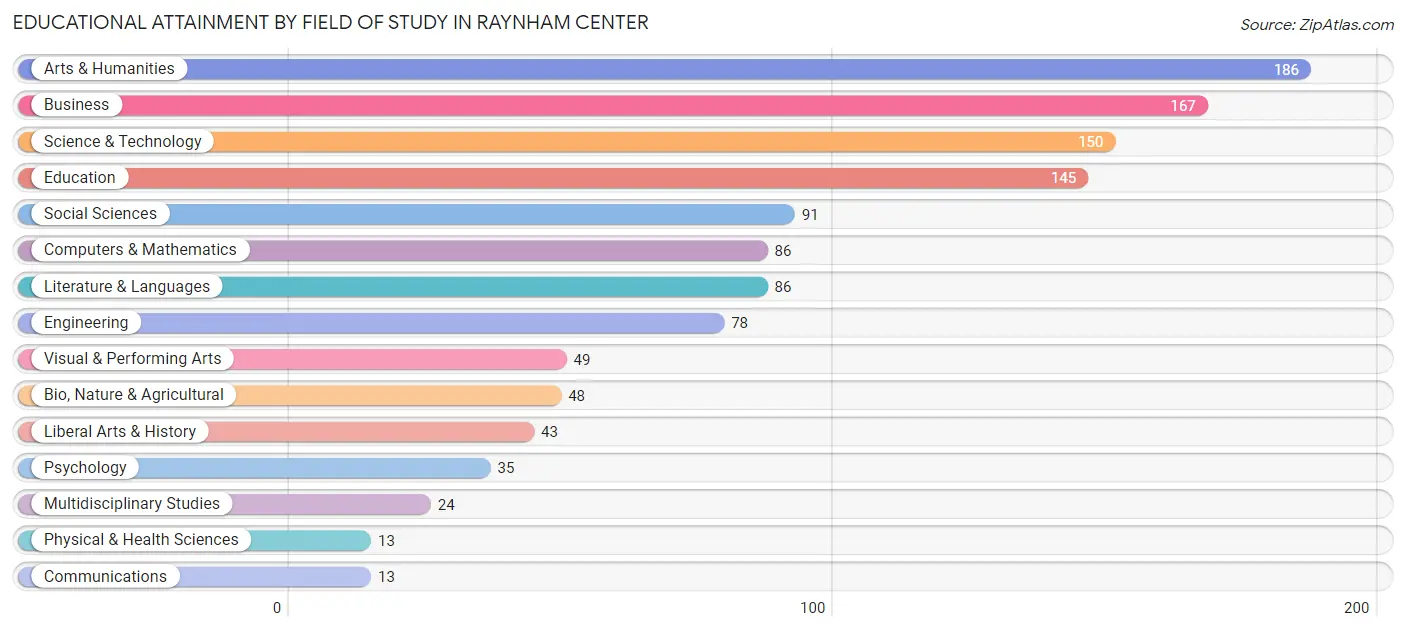
Educational Attainment by Field of Study in Raynham Center
Arts & humanities (186 | 15.3%), business (167 | 13.8%), science & technology (150 | 12.4%), education (145 | 11.9%), and social sciences (91 | 7.5%) are the most common fields of study among 1,214 individuals in Raynham Center who have obtained a bachelor's degree or higher.
| Field of Study | # Graduates | % Graduates |
| Computers & Mathematics | 86 | 7.1% |
| Bio, Nature & Agricultural | 48 | 4.0% |
| Physical & Health Sciences | 13 | 1.1% |
| Psychology | 35 | 2.9% |
| Social Sciences | 91 | 7.5% |
| Engineering | 78 | 6.4% |
| Multidisciplinary Studies | 24 | 2.0% |
| Science & Technology | 150 | 12.4% |
| Business | 167 | 13.8% |
| Education | 145 | 11.9% |
| Literature & Languages | 86 | 7.1% |
| Liberal Arts & History | 43 | 3.5% |
| Visual & Performing Arts | 49 | 4.0% |
| Communications | 13 | 1.1% |
| Arts & Humanities | 186 | 15.3% |
| Total | 1,214 | 100.0% |
Transportation & Commute in Raynham Center
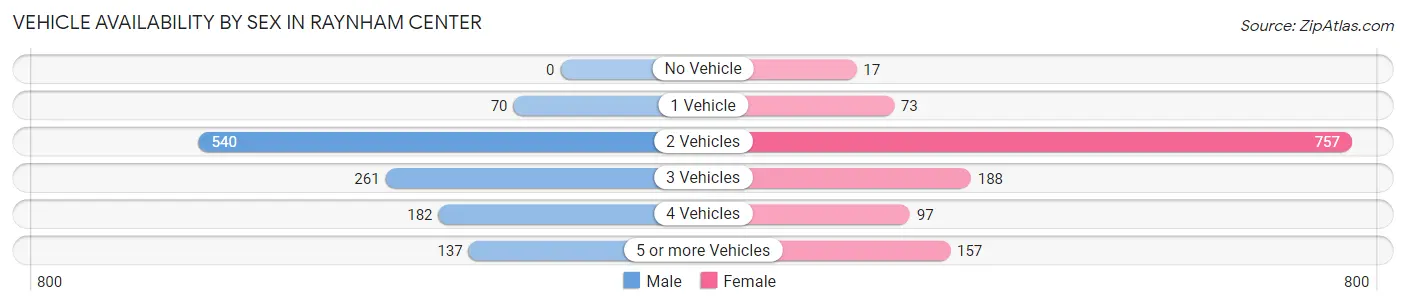
Vehicle Availability by Sex in Raynham Center
The most prevalent vehicle ownership categories in Raynham Center are males with 2 vehicles (540, accounting for 45.4%) and females with 2 vehicles (757, making up 41.9%).
| Vehicles Available | Male | Female |
| No Vehicle | 0 (0.0%) | 17 (1.3%) |
| 1 Vehicle | 70 (5.9%) | 73 (5.7%) |
| 2 Vehicles | 540 (45.4%) | 757 (58.7%) |
| 3 Vehicles | 261 (21.9%) | 188 (14.6%) |
| 4 Vehicles | 182 (15.3%) | 97 (7.5%) |
| 5 or more Vehicles | 137 (11.5%) | 157 (12.2%) |
| Total | 1,190 (100.0%) | 1,289 (100.0%) |
Commute Time in Raynham Center
The most frequently occuring commute durations in Raynham Center are 30 to 34 minutes (446 commuters, 19.3%), 45 to 59 minutes (383 commuters, 16.6%), and 25 to 29 minutes (308 commuters, 13.3%).
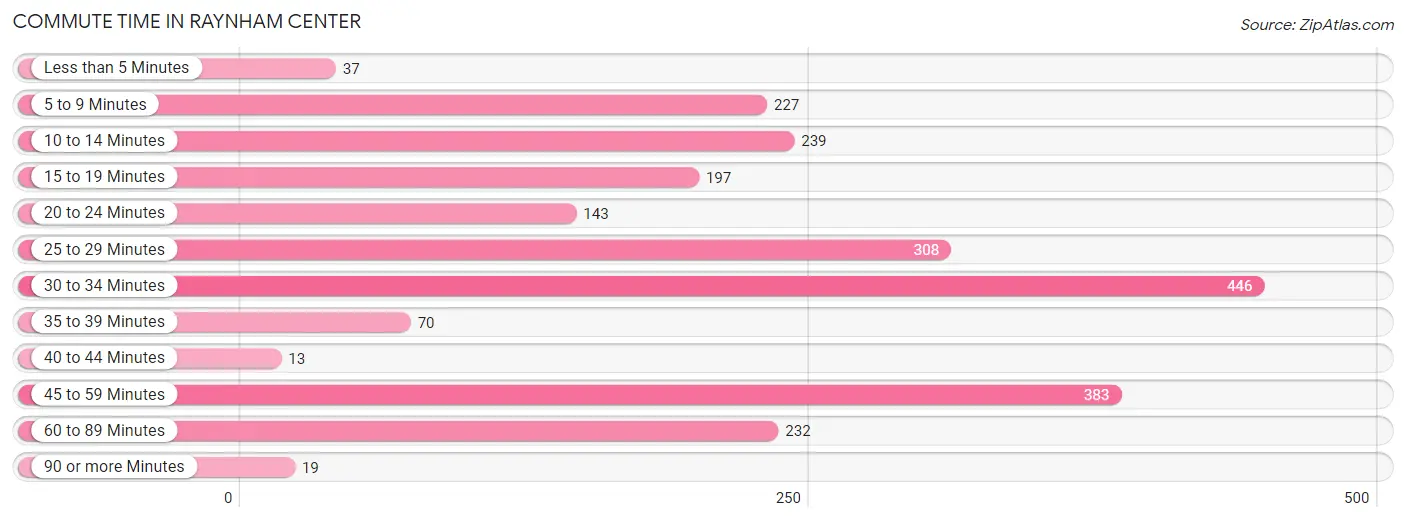
| Commute Time | # Commuters | % Commuters |
| Less than 5 Minutes | 37 | 1.6% |
| 5 to 9 Minutes | 227 | 9.8% |
| 10 to 14 Minutes | 239 | 10.3% |
| 15 to 19 Minutes | 197 | 8.5% |
| 20 to 24 Minutes | 143 | 6.2% |
| 25 to 29 Minutes | 308 | 13.3% |
| 30 to 34 Minutes | 446 | 19.3% |
| 35 to 39 Minutes | 70 | 3.0% |
| 40 to 44 Minutes | 13 | 0.6% |
| 45 to 59 Minutes | 383 | 16.6% |
| 60 to 89 Minutes | 232 | 10.0% |
| 90 or more Minutes | 19 | 0.8% |
Commute Time by Sex in Raynham Center
The most common commute times in Raynham Center are 30 to 34 minutes (289 commuters, 27.0%) for males and 45 to 59 minutes (204 commuters, 16.4%) for females.

| Commute Time | Male | Female |
| Less than 5 Minutes | 0 (0.0%) | 37 (3.0%) |
| 5 to 9 Minutes | 83 (7.7%) | 144 (11.6%) |
| 10 to 14 Minutes | 59 (5.5%) | 180 (14.5%) |
| 15 to 19 Minutes | 81 (7.6%) | 116 (9.3%) |
| 20 to 24 Minutes | 0 (0.0%) | 143 (11.5%) |
| 25 to 29 Minutes | 126 (11.7%) | 182 (14.6%) |
| 30 to 34 Minutes | 289 (27.0%) | 157 (12.6%) |
| 35 to 39 Minutes | 28 (2.6%) | 42 (3.4%) |
| 40 to 44 Minutes | 13 (1.2%) | 0 (0.0%) |
| 45 to 59 Minutes | 179 (16.7%) | 204 (16.4%) |
| 60 to 89 Minutes | 195 (18.2%) | 37 (3.0%) |
| 90 or more Minutes | 19 (1.8%) | 0 (0.0%) |
Time of Departure to Work by Sex in Raynham Center
The most frequent times of departure to work in Raynham Center are 12:00 AM to 4:59 AM (280, 26.1%) for males and 7:30 AM to 7:59 AM (301, 24.2%) for females.
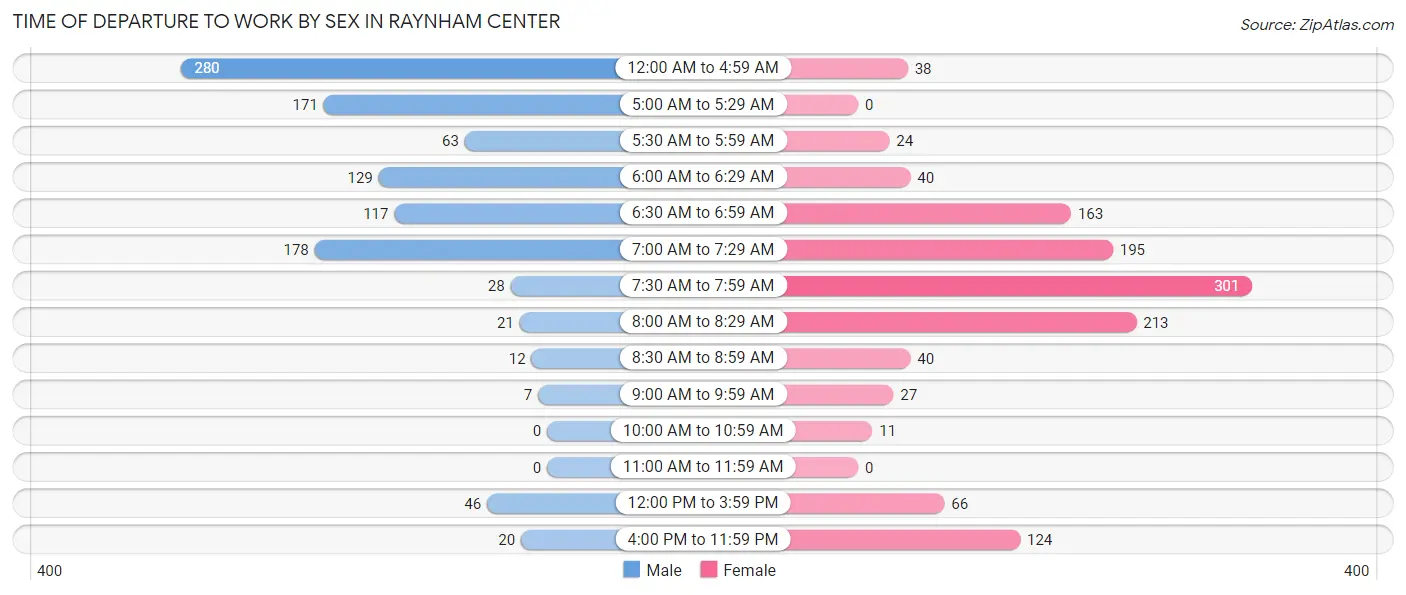
| Time of Departure | Male | Female |
| 12:00 AM to 4:59 AM | 280 (26.1%) | 38 (3.1%) |
| 5:00 AM to 5:29 AM | 171 (16.0%) | 0 (0.0%) |
| 5:30 AM to 5:59 AM | 63 (5.9%) | 24 (1.9%) |
| 6:00 AM to 6:29 AM | 129 (12.0%) | 40 (3.2%) |
| 6:30 AM to 6:59 AM | 117 (10.9%) | 163 (13.1%) |
| 7:00 AM to 7:29 AM | 178 (16.6%) | 195 (15.7%) |
| 7:30 AM to 7:59 AM | 28 (2.6%) | 301 (24.2%) |
| 8:00 AM to 8:29 AM | 21 (2.0%) | 213 (17.2%) |
| 8:30 AM to 8:59 AM | 12 (1.1%) | 40 (3.2%) |
| 9:00 AM to 9:59 AM | 7 (0.6%) | 27 (2.2%) |
| 10:00 AM to 10:59 AM | 0 (0.0%) | 11 (0.9%) |
| 11:00 AM to 11:59 AM | 0 (0.0%) | 0 (0.0%) |
| 12:00 PM to 3:59 PM | 46 (4.3%) | 66 (5.3%) |
| 4:00 PM to 11:59 PM | 20 (1.9%) | 124 (10.0%) |
| Total | 1,072 (100.0%) | 1,242 (100.0%) |
Housing Occupancy in Raynham Center
Occupancy by Ownership in Raynham Center
Of the total 1,648 dwellings in Raynham Center, owner-occupied units account for 1,099 (66.7%), while renter-occupied units make up 549 (33.3%).
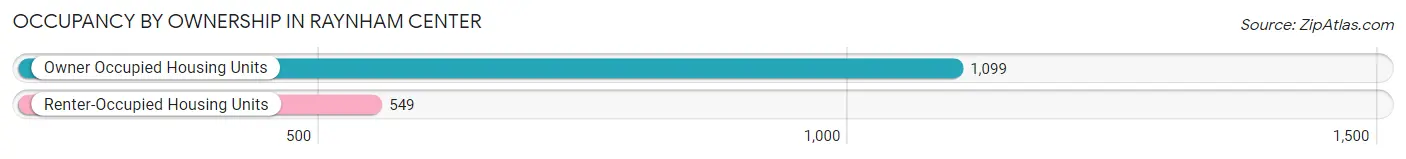
| Occupancy | # Housing Units | % Housing Units |
| Owner Occupied Housing Units | 1,099 | 66.7% |
| Renter-Occupied Housing Units | 549 | 33.3% |
| Total Occupied Housing Units | 1,648 | 100.0% |
Occupancy by Household Size in Raynham Center
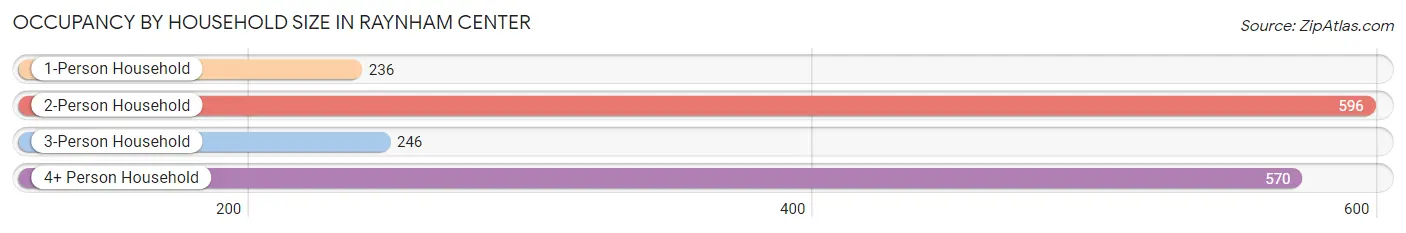
| Household Size | # Housing Units | % Housing Units |
| 1-Person Household | 236 | 14.3% |
| 2-Person Household | 596 | 36.2% |
| 3-Person Household | 246 | 14.9% |
| 4+ Person Household | 570 | 34.6% |
| Total Housing Units | 1,648 | 100.0% |
Occupancy by Ownership by Household Size in Raynham Center
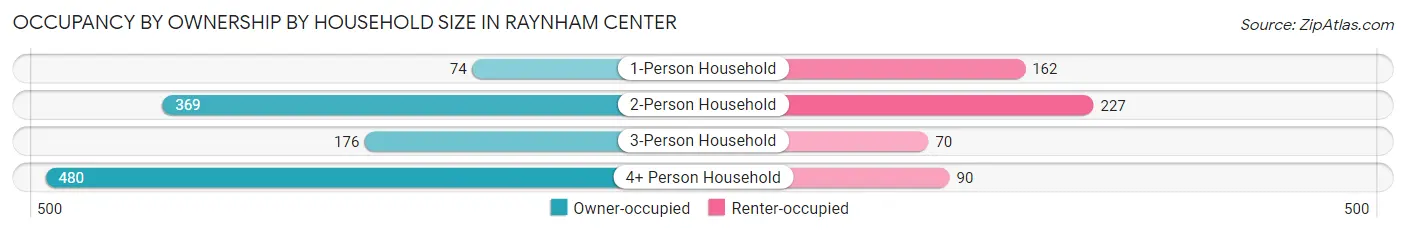
| Household Size | Owner-occupied | Renter-occupied |
| 1-Person Household | 74 (31.4%) | 162 (68.6%) |
| 2-Person Household | 369 (61.9%) | 227 (38.1%) |
| 3-Person Household | 176 (71.5%) | 70 (28.5%) |
| 4+ Person Household | 480 (84.2%) | 90 (15.8%) |
| Total Housing Units | 1,099 (66.7%) | 549 (33.3%) |
Occupancy by Educational Attainment in Raynham Center
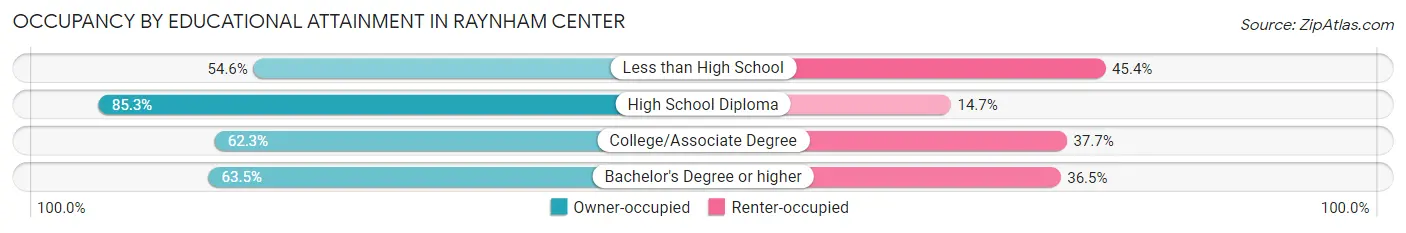
| Household Size | Owner-occupied | Renter-occupied |
| Less than High School | 95 (54.6%) | 79 (45.4%) |
| High School Diploma | 295 (85.3%) | 51 (14.7%) |
| College/Associate Degree | 368 (62.3%) | 223 (37.7%) |
| Bachelor's Degree or higher | 341 (63.5%) | 196 (36.5%) |
Occupancy by Age of Householder in Raynham Center
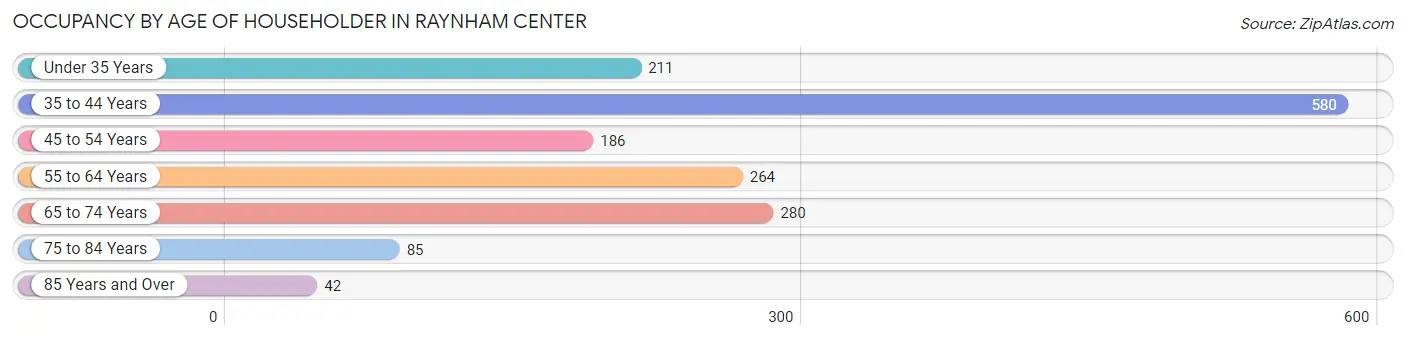
| Age Bracket | # Households | % Households |
| Under 35 Years | 211 | 12.8% |
| 35 to 44 Years | 580 | 35.2% |
| 45 to 54 Years | 186 | 11.3% |
| 55 to 64 Years | 264 | 16.0% |
| 65 to 74 Years | 280 | 17.0% |
| 75 to 84 Years | 85 | 5.2% |
| 85 Years and Over | 42 | 2.5% |
| Total | 1,648 | 100.0% |
Housing Finances in Raynham Center
Median Income by Occupancy in Raynham Center
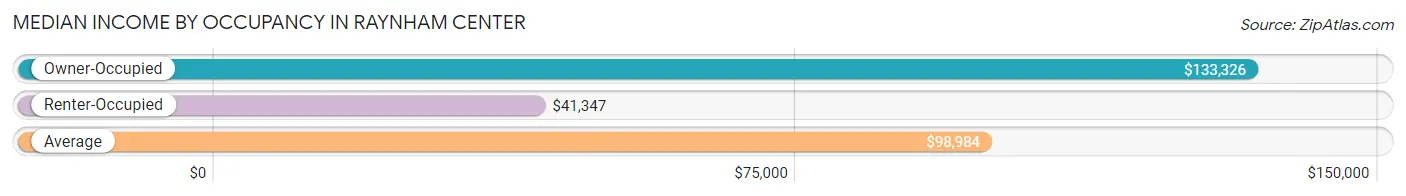
| Occupancy Type | # Households | Median Income |
| Owner-Occupied | 1,099 (66.7%) | $133,326 |
| Renter-Occupied | 549 (33.3%) | $41,347 |
| Average | 1,648 (100.0%) | $98,984 |
Occupancy by Householder Income Bracket in Raynham Center

| Income Bracket | Owner-occupied | Renter-occupied |
| Less than $5,000 | 67 (6.1%) | 34 (6.2%) |
| $5,000 to $9,999 | 0 (0.0%) | 0 (0.0%) |
| $10,000 to $14,999 | 0 (0.0%) | 154 (28.1%) |
| $15,000 to $19,999 | 0 (0.0%) | 17 (3.1%) |
| $20,000 to $24,999 | 0 (0.0%) | 21 (3.8%) |
| $25,000 to $34,999 | 14 (1.3%) | 0 (0.0%) |
| $35,000 to $49,999 | 73 (6.6%) | 133 (24.2%) |
| $50,000 to $74,999 | 51 (4.6%) | 37 (6.7%) |
| $75,000 to $99,999 | 121 (11.0%) | 115 (20.9%) |
| $100,000 to $149,999 | 332 (30.2%) | 21 (3.8%) |
| $150,000 or more | 441 (40.1%) | 17 (3.1%) |
| Total | 1,099 (100.0%) | 549 (100.0%) |
Monthly Housing Cost Tiers in Raynham Center
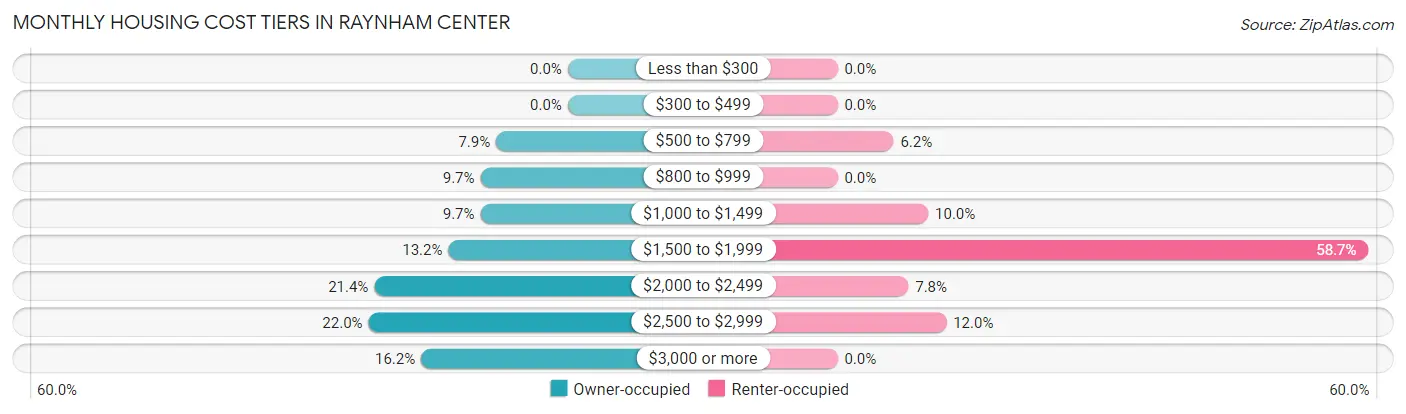
| Monthly Cost | Owner-occupied | Renter-occupied |
| Less than $300 | 0 (0.0%) | 0 (0.0%) |
| $300 to $499 | 0 (0.0%) | 0 (0.0%) |
| $500 to $799 | 87 (7.9%) | 34 (6.2%) |
| $800 to $999 | 106 (9.7%) | 0 (0.0%) |
| $1,000 to $1,499 | 106 (9.7%) | 55 (10.0%) |
| $1,500 to $1,999 | 145 (13.2%) | 322 (58.7%) |
| $2,000 to $2,499 | 235 (21.4%) | 43 (7.8%) |
| $2,500 to $2,999 | 242 (22.0%) | 66 (12.0%) |
| $3,000 or more | 178 (16.2%) | 0 (0.0%) |
| Total | 1,099 (100.0%) | 549 (100.0%) |
Physical Housing Characteristics in Raynham Center
Housing Structures in Raynham Center
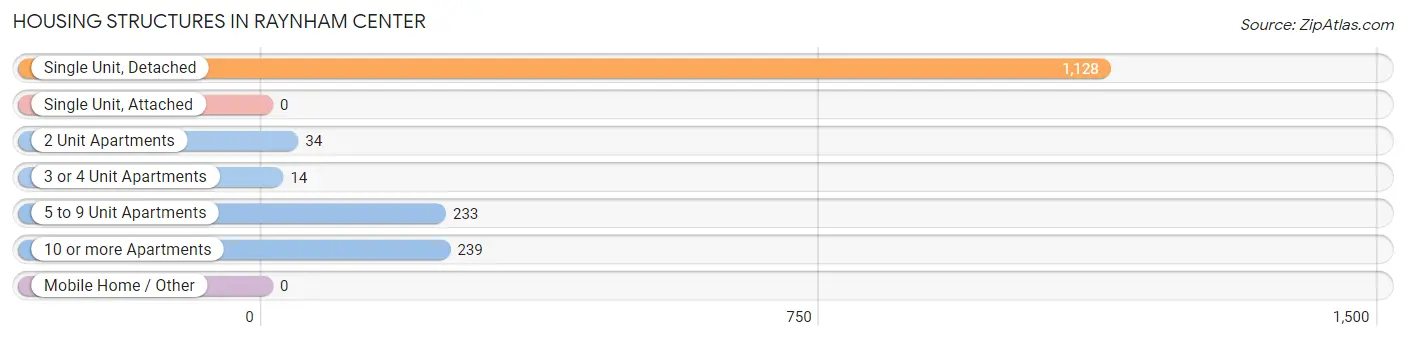
| Structure Type | # Housing Units | % Housing Units |
| Single Unit, Detached | 1,128 | 68.4% |
| Single Unit, Attached | 0 | 0.0% |
| 2 Unit Apartments | 34 | 2.1% |
| 3 or 4 Unit Apartments | 14 | 0.9% |
| 5 to 9 Unit Apartments | 233 | 14.1% |
| 10 or more Apartments | 239 | 14.5% |
| Mobile Home / Other | 0 | 0.0% |
| Total | 1,648 | 100.0% |
Housing Structures by Occupancy in Raynham Center
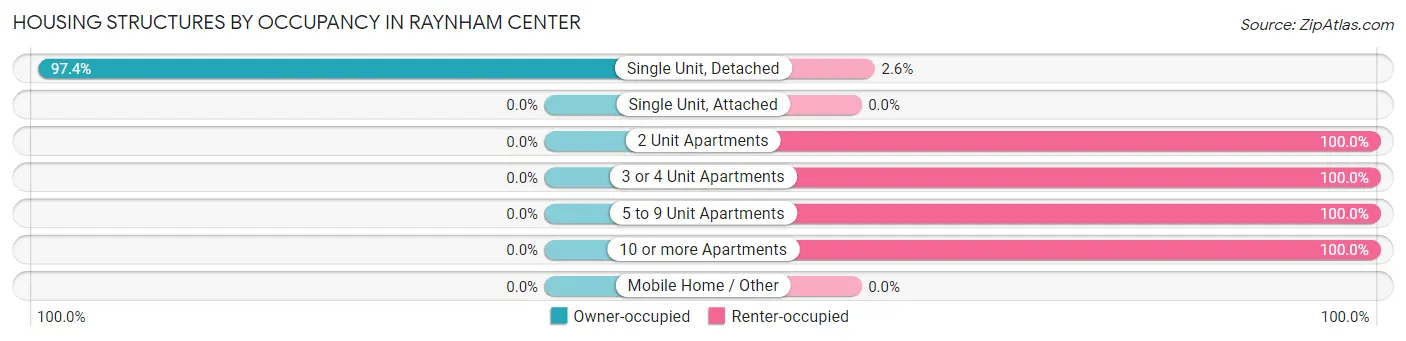
| Structure Type | Owner-occupied | Renter-occupied |
| Single Unit, Detached | 1,099 (97.4%) | 29 (2.6%) |
| Single Unit, Attached | 0 (0.0%) | 0 (0.0%) |
| 2 Unit Apartments | 0 (0.0%) | 34 (100.0%) |
| 3 or 4 Unit Apartments | 0 (0.0%) | 14 (100.0%) |
| 5 to 9 Unit Apartments | 0 (0.0%) | 233 (100.0%) |
| 10 or more Apartments | 0 (0.0%) | 239 (100.0%) |
| Mobile Home / Other | 0 (0.0%) | 0 (0.0%) |
| Total | 1,099 (66.7%) | 549 (33.3%) |
Housing Structures by Number of Rooms in Raynham Center
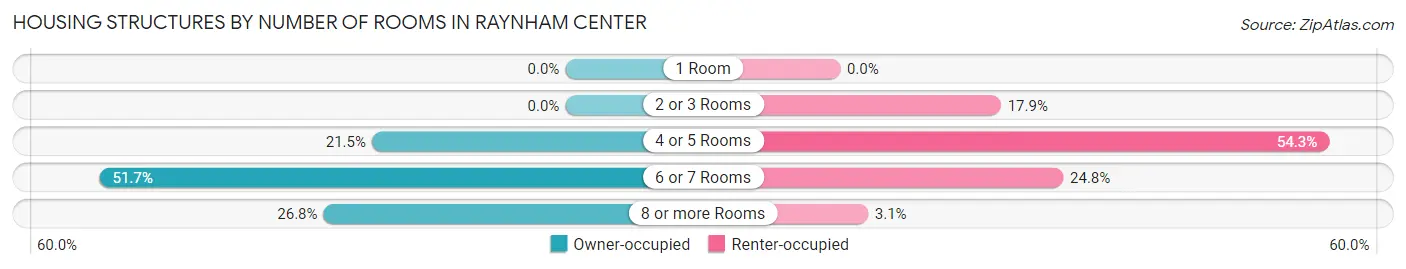
| Number of Rooms | Owner-occupied | Renter-occupied |
| 1 Room | 0 (0.0%) | 0 (0.0%) |
| 2 or 3 Rooms | 0 (0.0%) | 98 (17.8%) |
| 4 or 5 Rooms | 236 (21.5%) | 298 (54.3%) |
| 6 or 7 Rooms | 568 (51.7%) | 136 (24.8%) |
| 8 or more Rooms | 295 (26.8%) | 17 (3.1%) |
| Total | 1,099 (100.0%) | 549 (100.0%) |
Housing Structure by Heating Type in Raynham Center
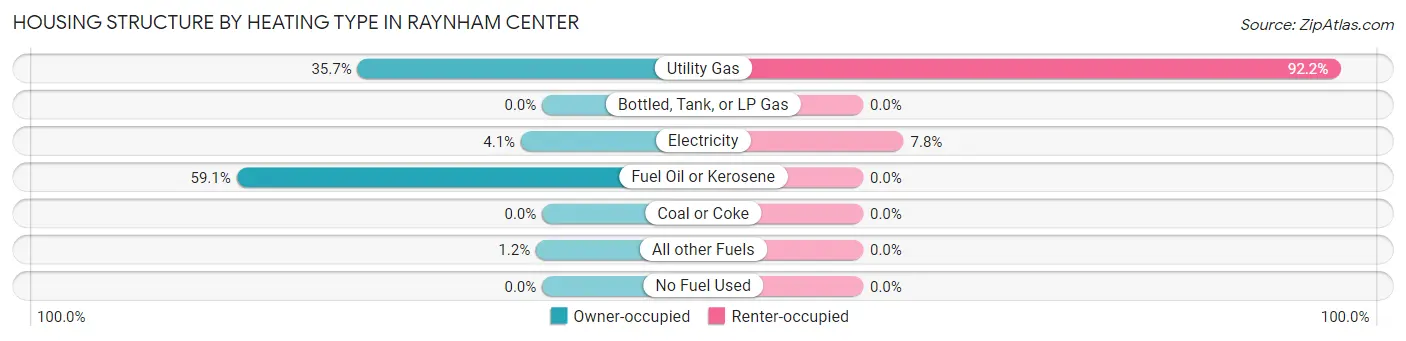
| Heating Type | Owner-occupied | Renter-occupied |
| Utility Gas | 392 (35.7%) | 506 (92.2%) |
| Bottled, Tank, or LP Gas | 0 (0.0%) | 0 (0.0%) |
| Electricity | 45 (4.1%) | 43 (7.8%) |
| Fuel Oil or Kerosene | 649 (59.1%) | 0 (0.0%) |
| Coal or Coke | 0 (0.0%) | 0 (0.0%) |
| All other Fuels | 13 (1.2%) | 0 (0.0%) |
| No Fuel Used | 0 (0.0%) | 0 (0.0%) |
| Total | 1,099 (100.0%) | 549 (100.0%) |
Household Vehicle Usage in Raynham Center
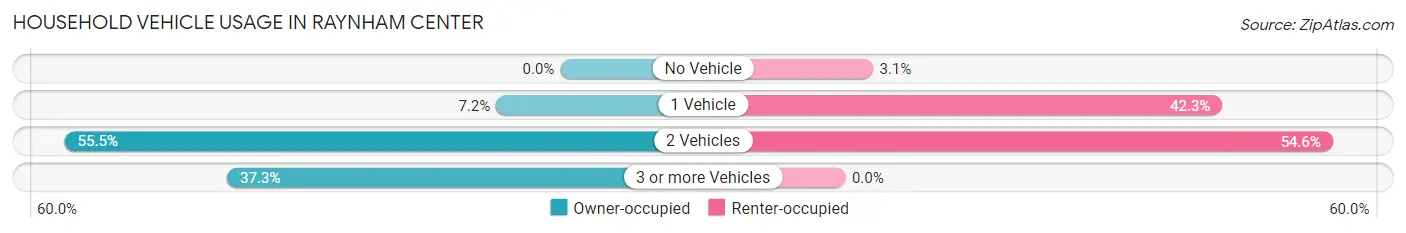
| Vehicles per Household | Owner-occupied | Renter-occupied |
| No Vehicle | 0 (0.0%) | 17 (3.1%) |
| 1 Vehicle | 79 (7.2%) | 232 (42.3%) |
| 2 Vehicles | 610 (55.5%) | 300 (54.6%) |
| 3 or more Vehicles | 410 (37.3%) | 0 (0.0%) |
| Total | 1,099 (100.0%) | 549 (100.0%) |
Real Estate & Mortgages in Raynham Center
Real Estate and Mortgage Overview in Raynham Center
| Characteristic | Without Mortgage | With Mortgage |
| Housing Units | 223 | 876 |
| Median Property Value | $471,900 | $462,200 |
| Median Household Income | $85,855 | $395 |
| Monthly Housing Costs | $898 | $178 |
| Real Estate Taxes | $6,420 | $24 |
Property Value by Mortgage Status in Raynham Center
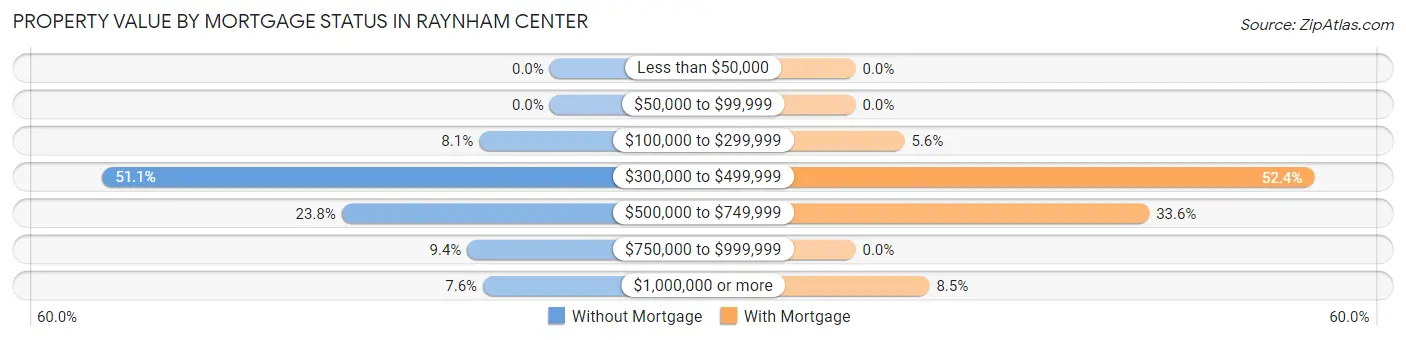
| Property Value | Without Mortgage | With Mortgage |
| Less than $50,000 | 0 (0.0%) | 0 (0.0%) |
| $50,000 to $99,999 | 0 (0.0%) | 0 (0.0%) |
| $100,000 to $299,999 | 18 (8.1%) | 49 (5.6%) |
| $300,000 to $499,999 | 114 (51.1%) | 459 (52.4%) |
| $500,000 to $749,999 | 53 (23.8%) | 294 (33.6%) |
| $750,000 to $999,999 | 21 (9.4%) | 0 (0.0%) |
| $1,000,000 or more | 17 (7.6%) | 74 (8.5%) |
| Total | 223 (100.0%) | 876 (100.0%) |
Household Income by Mortgage Status in Raynham Center
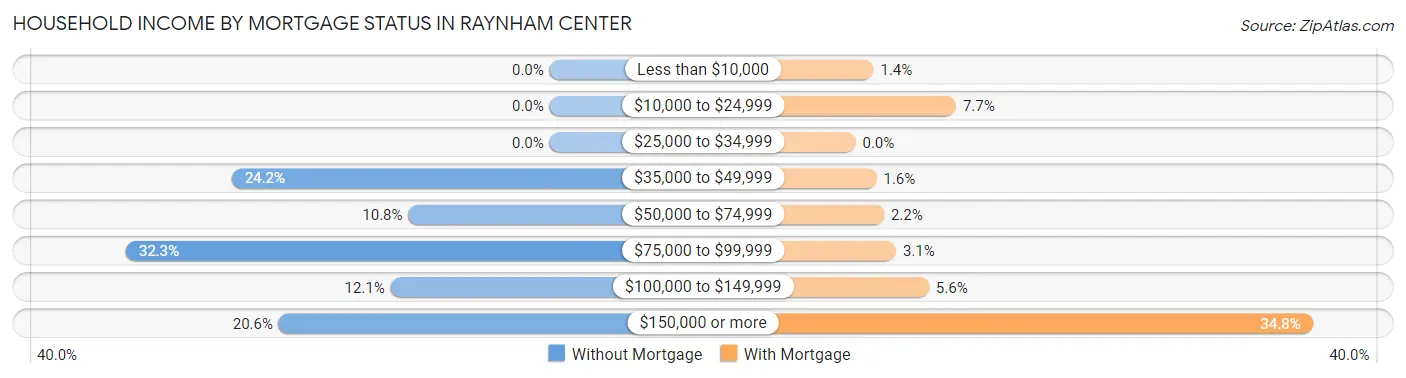
| Household Income | Without Mortgage | With Mortgage |
| Less than $10,000 | 0 (0.0%) | 12 (1.4%) |
| $10,000 to $24,999 | 0 (0.0%) | 67 (7.6%) |
| $25,000 to $34,999 | 0 (0.0%) | 0 (0.0%) |
| $35,000 to $49,999 | 54 (24.2%) | 14 (1.6%) |
| $50,000 to $74,999 | 24 (10.8%) | 19 (2.2%) |
| $75,000 to $99,999 | 72 (32.3%) | 27 (3.1%) |
| $100,000 to $149,999 | 27 (12.1%) | 49 (5.6%) |
| $150,000 or more | 46 (20.6%) | 305 (34.8%) |
| Total | 223 (100.0%) | 876 (100.0%) |
Property Value to Household Income Ratio in Raynham Center
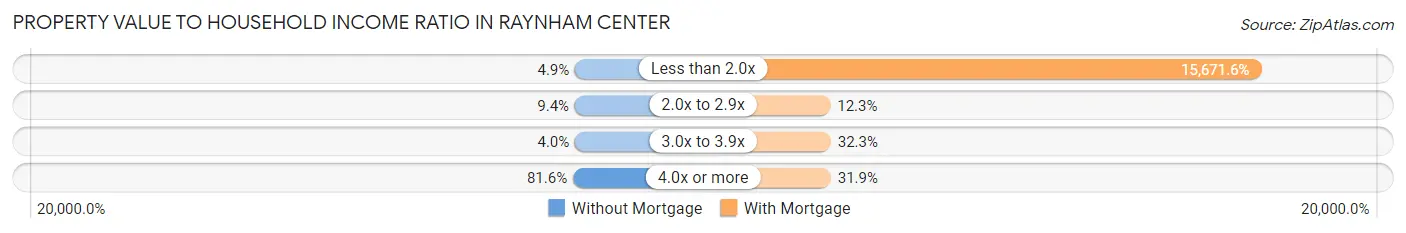
| Value-to-Income Ratio | Without Mortgage | With Mortgage |
| Less than 2.0x | 11 (4.9%) | 137,283 (15,671.6%) |
| 2.0x to 2.9x | 21 (9.4%) | 108 (12.3%) |
| 3.0x to 3.9x | 9 (4.0%) | 283 (32.3%) |
| 4.0x or more | 182 (81.6%) | 279 (31.9%) |
| Total | 223 (100.0%) | 876 (100.0%) |
Real Estate Taxes by Mortgage Status in Raynham Center
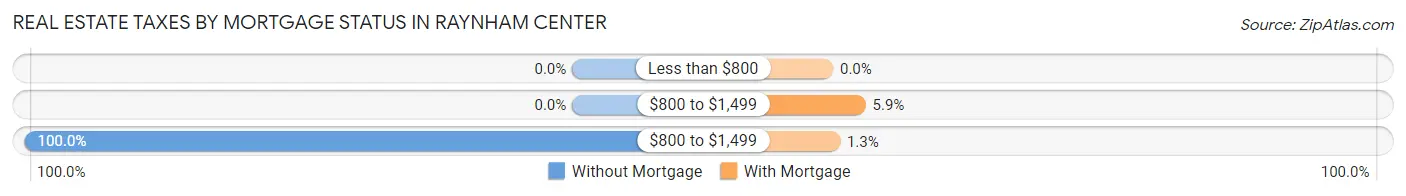
| Property Taxes | Without Mortgage | With Mortgage |
| Less than $800 | 0 (0.0%) | 0 (0.0%) |
| $800 to $1,499 | 0 (0.0%) | 52 (5.9%) |
| $800 to $1,499 | 223 (100.0%) | 11 (1.3%) |
| Total | 223 (100.0%) | 876 (100.0%) |
Health & Disability in Raynham Center
Health Insurance Coverage by Age in Raynham Center
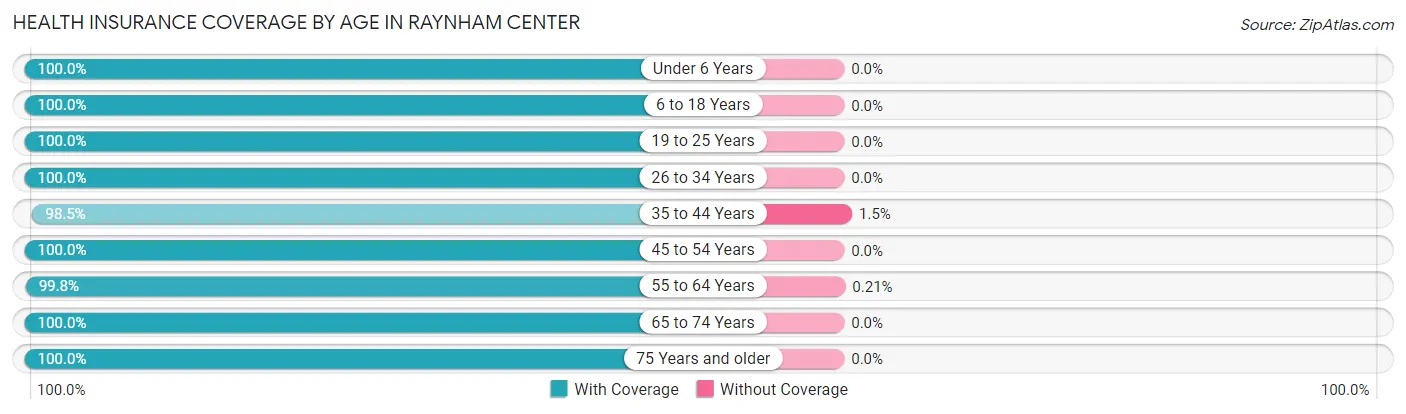
| Age Bracket | With Coverage | Without Coverage |
| Under 6 Years | 498 (100.0%) | 0 (0.0%) |
| 6 to 18 Years | 1,092 (100.0%) | 0 (0.0%) |
| 19 to 25 Years | 208 (100.0%) | 0 (0.0%) |
| 26 to 34 Years | 617 (100.0%) | 0 (0.0%) |
| 35 to 44 Years | 947 (98.5%) | 14 (1.5%) |
| 45 to 54 Years | 462 (100.0%) | 0 (0.0%) |
| 55 to 64 Years | 481 (99.8%) | 1 (0.2%) |
| 65 to 74 Years | 527 (100.0%) | 0 (0.0%) |
| 75 Years and older | 227 (100.0%) | 0 (0.0%) |
| Total | 5,059 (99.7%) | 15 (0.3%) |
Health Insurance Coverage by Citizenship Status in Raynham Center
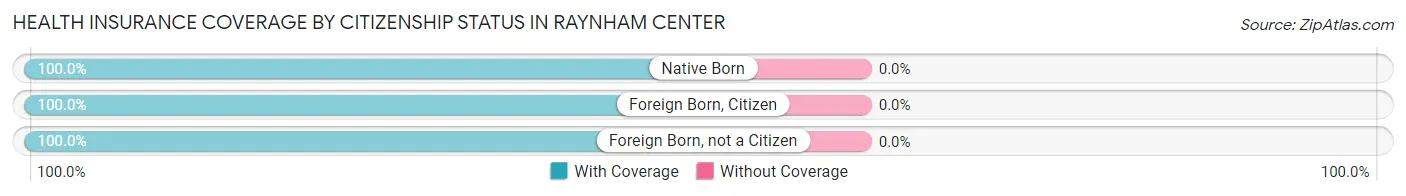
| Citizenship Status | With Coverage | Without Coverage |
| Native Born | 498 (100.0%) | 0 (0.0%) |
| Foreign Born, Citizen | 1,092 (100.0%) | 0 (0.0%) |
| Foreign Born, not a Citizen | 208 (100.0%) | 0 (0.0%) |
Health Insurance Coverage by Household Income in Raynham Center
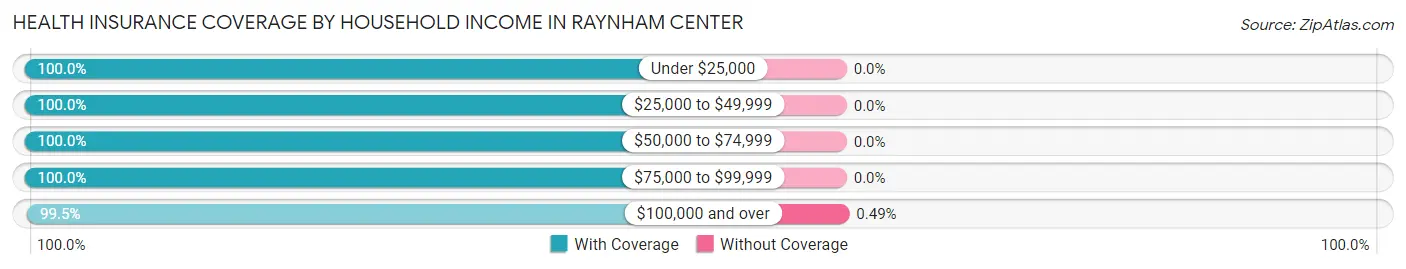
| Household Income | With Coverage | Without Coverage |
| Under $25,000 | 630 (100.0%) | 0 (0.0%) |
| $25,000 to $49,999 | 389 (100.0%) | 0 (0.0%) |
| $50,000 to $74,999 | 306 (100.0%) | 0 (0.0%) |
| $75,000 to $99,999 | 881 (100.0%) | 0 (0.0%) |
| $100,000 and over | 2,847 (99.5%) | 14 (0.5%) |
Public vs Private Health Insurance Coverage by Age in Raynham Center
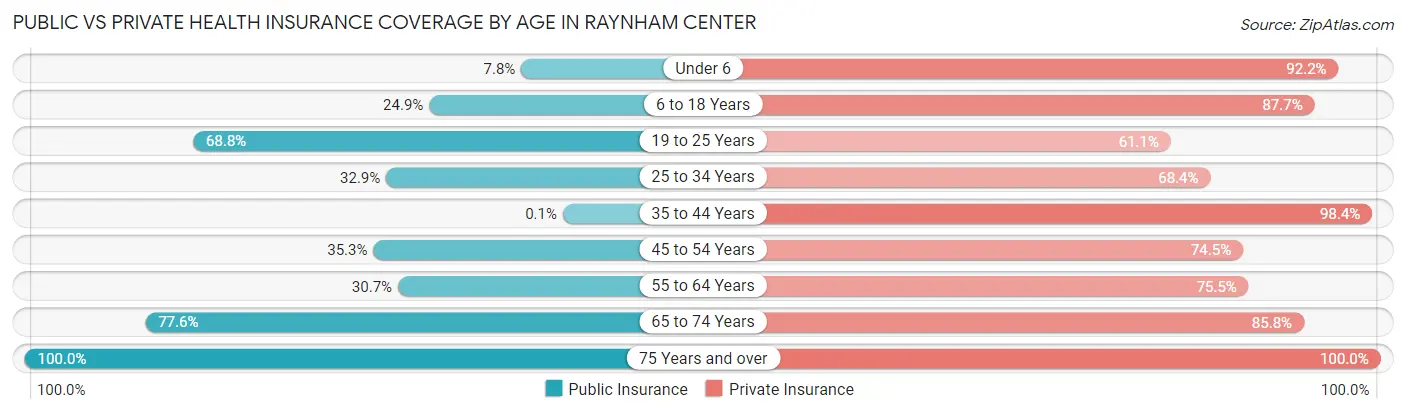
| Age Bracket | Public Insurance | Private Insurance |
| Under 6 | 39 (7.8%) | 459 (92.2%) |
| 6 to 18 Years | 272 (24.9%) | 958 (87.7%) |
| 19 to 25 Years | 143 (68.8%) | 127 (61.1%) |
| 25 to 34 Years | 203 (32.9%) | 422 (68.4%) |
| 35 to 44 Years | 1 (0.1%) | 946 (98.4%) |
| 45 to 54 Years | 163 (35.3%) | 344 (74.5%) |
| 55 to 64 Years | 148 (30.7%) | 364 (75.5%) |
| 65 to 74 Years | 409 (77.6%) | 452 (85.8%) |
| 75 Years and over | 227 (100.0%) | 227 (100.0%) |
| Total | 1,605 (31.6%) | 4,299 (84.7%) |
Disability Status by Sex by Age in Raynham Center
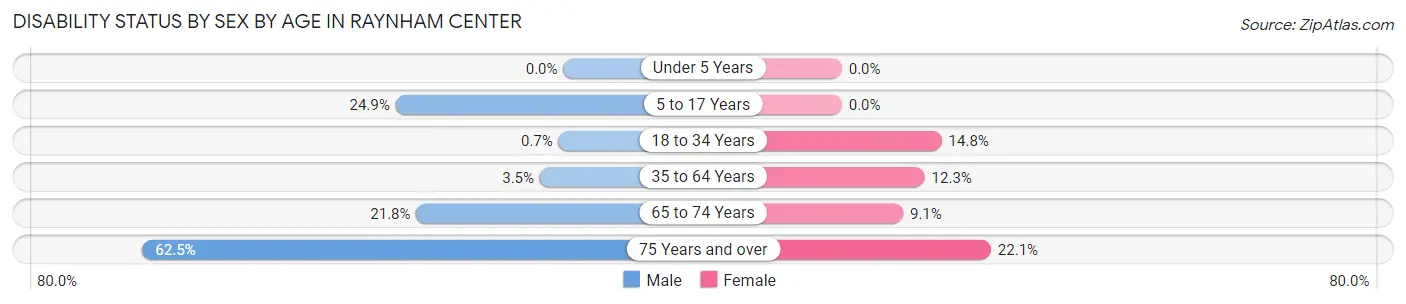
| Age Bracket | Male | Female |
| Under 5 Years | 0 (0.0%) | 0 (0.0%) |
| 5 to 17 Years | 78 (24.9%) | 0 (0.0%) |
| 18 to 34 Years | 3 (0.7%) | 94 (14.8%) |
| 35 to 64 Years | 31 (3.5%) | 125 (12.3%) |
| 65 to 74 Years | 55 (21.8%) | 25 (9.1%) |
| 75 Years and over | 60 (62.5%) | 29 (22.1%) |
Disability Class by Sex by Age in Raynham Center
Disability Class: Hearing Difficulty
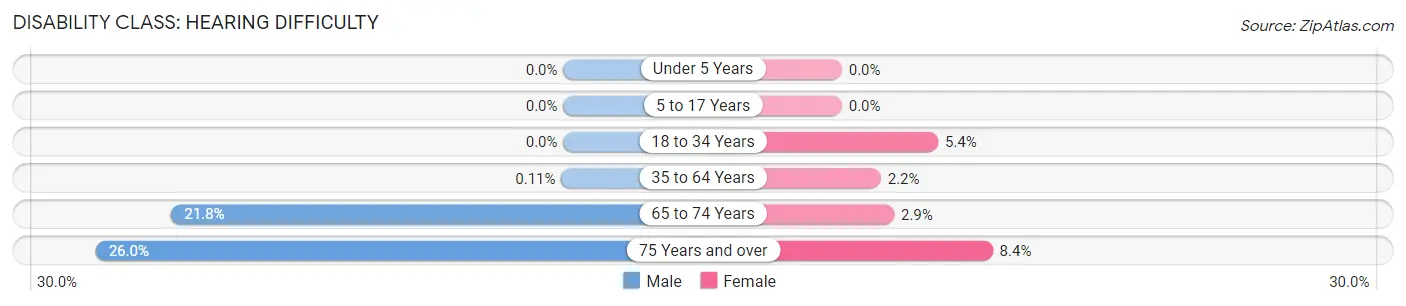
| Age Bracket | Male | Female |
| Under 5 Years | 0 (0.0%) | 0 (0.0%) |
| 5 to 17 Years | 0 (0.0%) | 0 (0.0%) |
| 18 to 34 Years | 0 (0.0%) | 34 (5.4%) |
| 35 to 64 Years | 1 (0.1%) | 22 (2.2%) |
| 65 to 74 Years | 55 (21.8%) | 8 (2.9%) |
| 75 Years and over | 25 (26.0%) | 11 (8.4%) |
Disability Class: Vision Difficulty
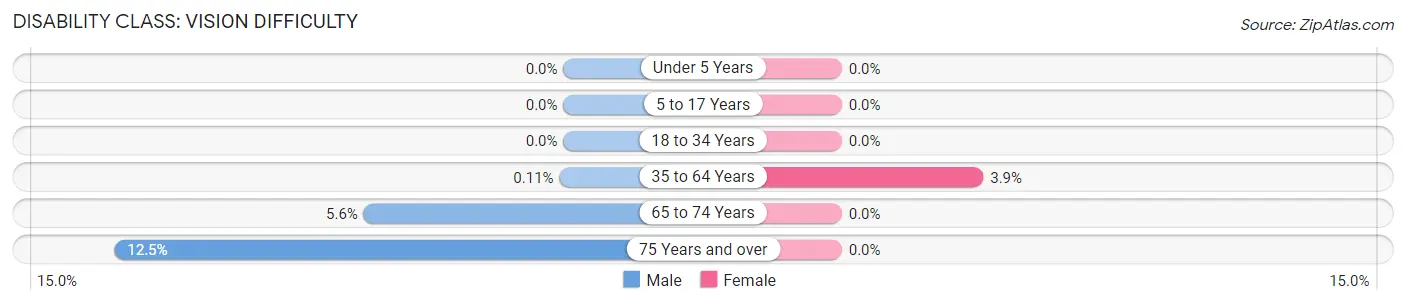
| Age Bracket | Male | Female |
| Under 5 Years | 0 (0.0%) | 0 (0.0%) |
| 5 to 17 Years | 0 (0.0%) | 0 (0.0%) |
| 18 to 34 Years | 0 (0.0%) | 0 (0.0%) |
| 35 to 64 Years | 1 (0.1%) | 40 (3.9%) |
| 65 to 74 Years | 14 (5.6%) | 0 (0.0%) |
| 75 Years and over | 12 (12.5%) | 0 (0.0%) |
Disability Class: Cognitive Difficulty
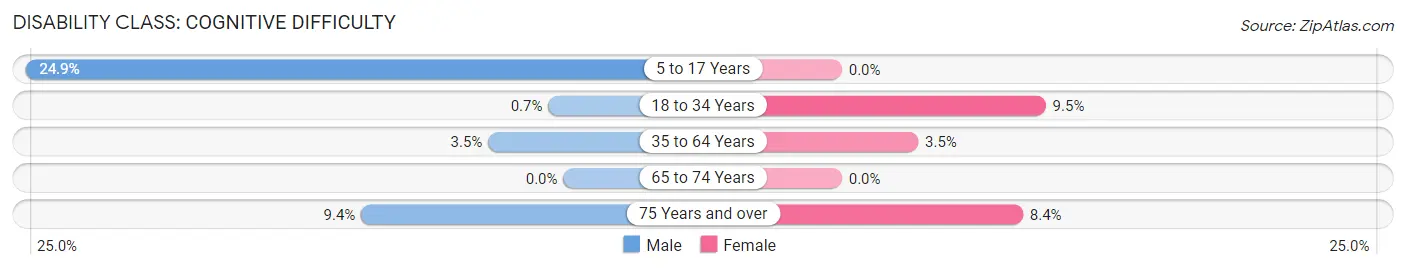
| Age Bracket | Male | Female |
| 5 to 17 Years | 78 (24.9%) | 0 (0.0%) |
| 18 to 34 Years | 3 (0.7%) | 60 (9.5%) |
| 35 to 64 Years | 31 (3.5%) | 36 (3.5%) |
| 65 to 74 Years | 0 (0.0%) | 0 (0.0%) |
| 75 Years and over | 9 (9.4%) | 11 (8.4%) |
Disability Class: Ambulatory Difficulty
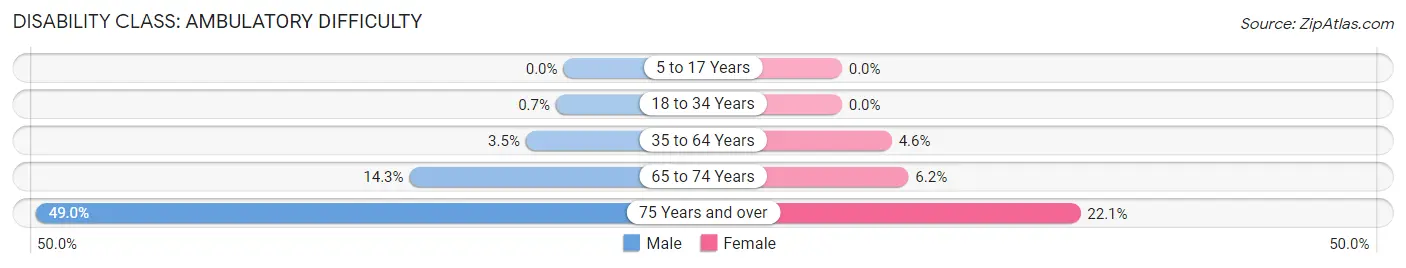
| Age Bracket | Male | Female |
| 5 to 17 Years | 0 (0.0%) | 0 (0.0%) |
| 18 to 34 Years | 3 (0.7%) | 0 (0.0%) |
| 35 to 64 Years | 31 (3.5%) | 47 (4.6%) |
| 65 to 74 Years | 36 (14.3%) | 17 (6.2%) |
| 75 Years and over | 47 (49.0%) | 29 (22.1%) |
Disability Class: Self-Care Difficulty
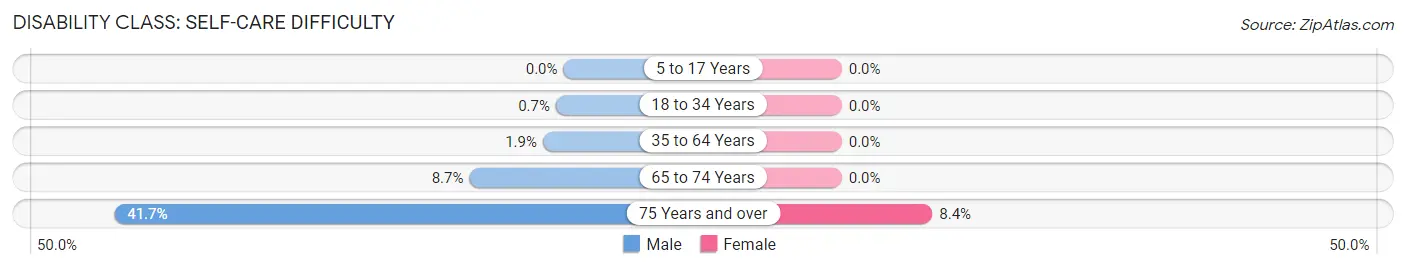
| Age Bracket | Male | Female |
| 5 to 17 Years | 0 (0.0%) | 0 (0.0%) |
| 18 to 34 Years | 3 (0.7%) | 0 (0.0%) |
| 35 to 64 Years | 17 (1.9%) | 0 (0.0%) |
| 65 to 74 Years | 22 (8.7%) | 0 (0.0%) |
| 75 Years and over | 40 (41.7%) | 11 (8.4%) |
Technology Access in Raynham Center
Computing Device Access in Raynham Center
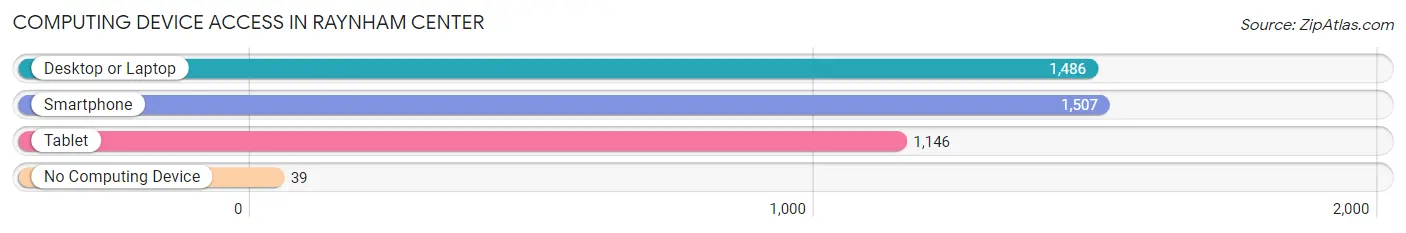
| Device Type | # Households | % Households |
| Desktop or Laptop | 1,486 | 90.2% |
| Smartphone | 1,507 | 91.4% |
| Tablet | 1,146 | 69.5% |
| No Computing Device | 39 | 2.4% |
| Total | 1,648 | 100.0% |
Internet Access in Raynham Center
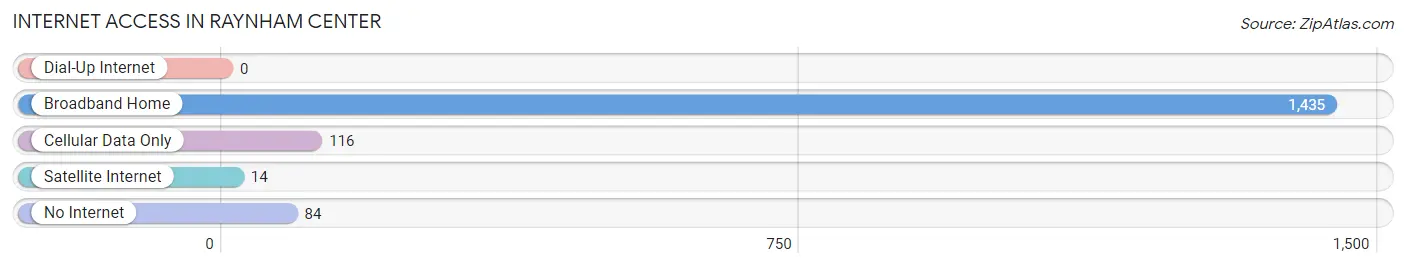
| Internet Type | # Households | % Households |
| Dial-Up Internet | 0 | 0.0% |
| Broadband Home | 1,435 | 87.1% |
| Cellular Data Only | 116 | 7.0% |
| Satellite Internet | 14 | 0.9% |
| No Internet | 84 | 5.1% |
| Total | 1,648 | 100.0% |
Raynham Center Summary
Raynham Center is a small town located in Bristol County, Massachusetts. It is situated in the southeastern part of the state, about 25 miles south of Boston. The town has a population of approximately 8,000 people and covers an area of about 8.5 square miles.
Geography
Raynham Center is located in the southeastern part of Massachusetts, about 25 miles south of Boston. It is bordered by the towns of Taunton to the north, Bridgewater to the east, Easton to the south, and Norton to the west. The town is situated in the Taunton River Valley, which is part of the larger Narragansett Bay watershed. The town is mostly flat, with some rolling hills in the northern part. The highest point in the town is located at the intersection of South Street and Pleasant Street, at an elevation of about 200 feet.
The town is home to several bodies of water, including the Taunton River, which forms the northern border of the town, and the Mill River, which flows through the center of the town. There are also several ponds and wetlands located throughout the town.
Economy
The economy of Raynham Center is largely based on manufacturing and retail. The town is home to several large manufacturing companies, including Raytheon, which produces defense and aerospace products, and Hasbro, which produces toys and games. The town is also home to several retail stores, including Walmart, Target, and Home Depot.
The town is also home to several small businesses, including restaurants, cafes, and shops. The town is also home to several medical facilities, including a hospital and several medical offices.
Demographics
As of the 2010 census, the population of Raynham Center was 8,072. The racial makeup of the town was 94.3% White, 1.7% African American, 0.3% Native American, 1.2% Asian, 0.1% Pacific Islander, 1.2% from other races, and 1.4% from two or more races. Hispanic or Latino of any race were 3.2% of the population.
The median household income in Raynham Center was $68,944, and the median family income was $76,944. The per capita income for the town was $30,944. About 4.3% of families and 5.2% of the population were below the poverty line, including 6.2% of those under age 18 and 4.2% of those age 65 or over.
History
Raynham Center was first settled in 1639 by English settlers from the Plymouth Colony. The town was originally part of Taunton, but was incorporated as its own town in 1731. The town was named after the Raynham family, who were prominent landowners in the area.
In the 19th century, the town was an agricultural center, with many farms producing dairy products, vegetables, and fruit. The town also had several mills, which produced textiles, paper, and other products.
In the 20th century, the town began to shift from an agricultural economy to a manufacturing economy. The town is now home to several large manufacturing companies, as well as several retail stores.
Common Questions
What is Per Capita Income in Raynham Center?
Per Capita income in Raynham Center is $42,622.
What is the Median Family Income in Raynham Center?
Median Family Income in Raynham Center is $112,150.
What is the Median Household income in Raynham Center?
Median Household Income in Raynham Center is $98,984.
What is Income or Wage Gap in Raynham Center?
Income or Wage Gap in Raynham Center is 32.0%.
Women in Raynham Center earn 68.0 cents for every dollar earned by a man.
What is Inequality or Gini Index in Raynham Center?
Inequality or Gini Index in Raynham Center is 0.48.
What is the Total Population of Raynham Center?
Total Population of Raynham Center is 5,074.
What is the Total Male Population of Raynham Center?
Total Male Population of Raynham Center is 2,155.
What is the Total Female Population of Raynham Center?
Total Female Population of Raynham Center is 2,919.
What is the Ratio of Males per 100 Females in Raynham Center?
There are 73.83 Males per 100 Females in Raynham Center.
What is the Ratio of Females per 100 Males in Raynham Center?
There are 135.45 Females per 100 Males in Raynham Center.
What is the Median Population Age in Raynham Center?
Median Population Age in Raynham Center is 37.1 Years.
What is the Average Family Size in Raynham Center
Average Family Size in Raynham Center is 3.4 People.
What is the Average Household Size in Raynham Center
Average Household Size in Raynham Center is 3.1 People.
How Large is the Labor Force in Raynham Center?
There are 2,744 People in the Labor Forcein in Raynham Center.
What is the Percentage of People in the Labor Force in Raynham Center?
71.6% of People are in the Labor Force in Raynham Center.
What is the Unemployment Rate in Raynham Center?
Unemployment Rate in Raynham Center is 7.4%.