Cities with the Most Births per 1,000 Women Receiving Public Assitance in Massachusetts
RELATED REPORTS & OPTIONS
Highest Birth Rate | Public Income
Massachusetts
Compare Cities
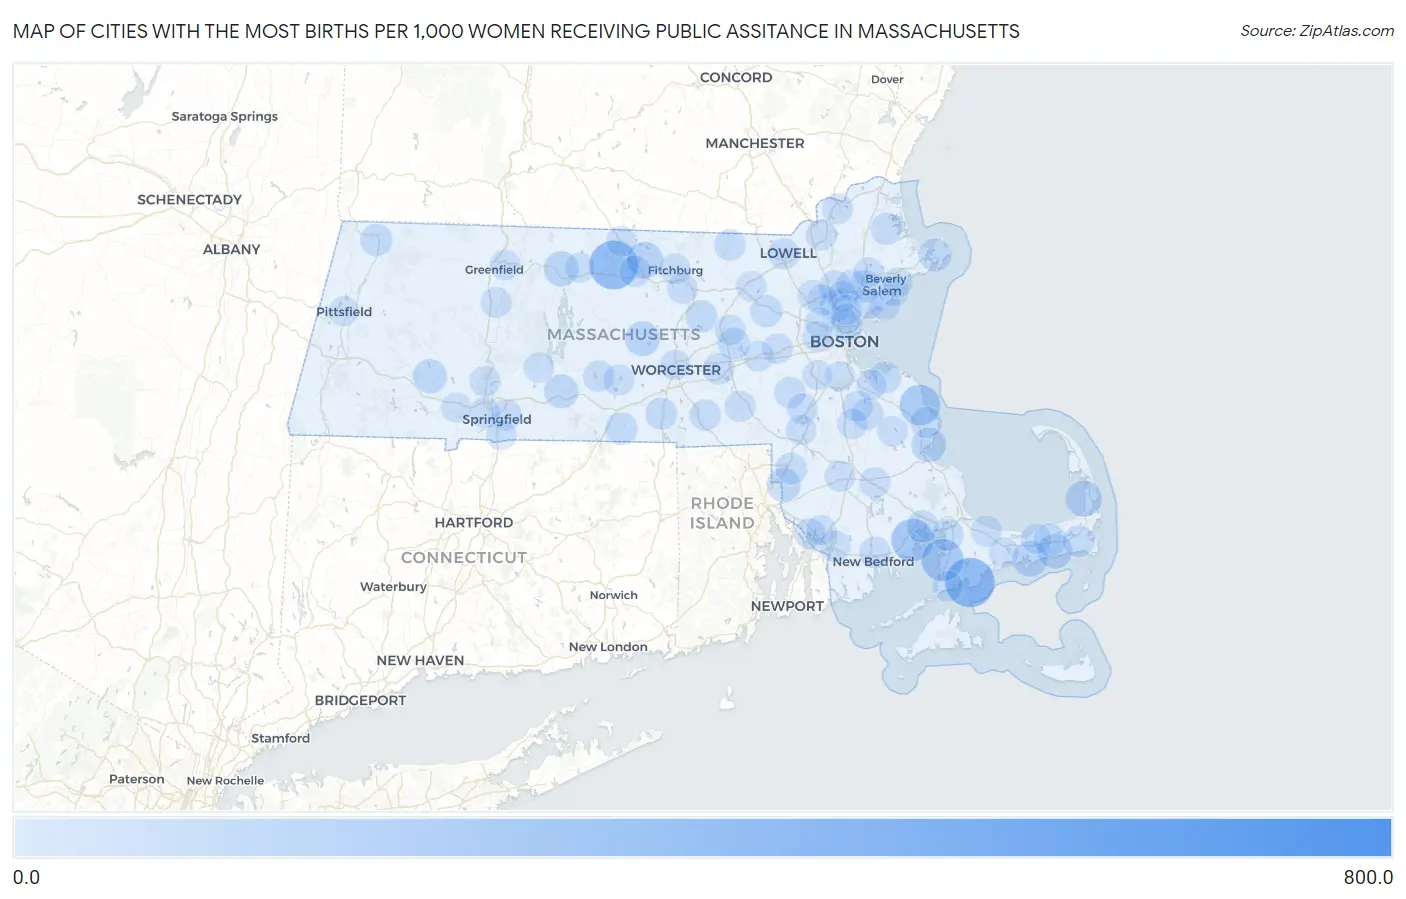
Map of Cities with the Most Births per 1,000 Women Receiving Public Assitance in Massachusetts
0.0
800.0
Cities with the Most Births per 1,000 Women Receiving Public Assitance in Massachusetts
| City | Births / 1,000 Women | vs State | vs National | |
| 1. | Green Harbor | 758.0 | 44.0(+714)#1 | 52.0(+706)#107 |
| 2. | Seconsett Island | 348.0 | 44.0(+304)#2 | 52.0(+296)#446 |
| 3. | Baldwinville | 339.0 | 44.0(+295)#3 | 52.0(+287)#466 |
| 4. | Marion Center | 237.0 | 44.0(+193)#4 | 52.0(+185)#971 |
| 5. | North Falmouth | 231.0 | 44.0(+187)#5 | 52.0(+179)#1,010 |
| 6. | Marshfield Hills | 209.0 | 44.0(+165)#6 | 52.0(+157)#1,231 |
| 7. | South Ashburnham | 140.0 | 44.0(+96.0)#7 | 52.0(+88.0)#2,592 |
| 8. | North Eastham | 139.0 | 44.0(+95.0)#8 | 52.0(+87.0)#2,625 |
| 9. | West Yarmouth | 130.0 | 44.0(+86.0)#9 | 52.0(+78.0)#2,947 |
| 10. | Orange | 121.0 | 44.0(+77.0)#10 | 52.0(+69.0)#3,357 |
| 11. | Dennis Port | 117.0 | 44.0(+73.0)#11 | 52.0(+65.0)#3,596 |
| 12. | Rutland | 115.0 | 44.0(+71.0)#12 | 52.0(+63.0)#3,697 |
| 13. | South Duxbury | 113.0 | 44.0(+69.0)#13 | 52.0(+61.0)#3,805 |
| 14. | Huntington | 109.0 | 44.0(+65.0)#14 | 52.0(+57.0)#4,094 |
| 15. | Palmer Town | 108.0 | 44.0(+64.0)#15 | 52.0(+56.0)#4,114 |
| 16. | North Seekonk | 102.0 | 44.0(+58.0)#16 | 52.0(+50.0)#4,535 |
| 17. | Gloucester | 89.0 | 44.0(+45.0)#17 | 52.0(+37.0)#5,647 |
| 18. | South Dennis | 85.0 | 44.0(+41.0)#18 | 52.0(+33.0)#6,078 |
| 19. | Greenfield | 82.0 | 44.0(+38.0)#19 | 52.0(+30.0)#6,390 |
| 20. | Southbridge Town | 81.0 | 44.0(+37.0)#20 | 52.0(+29.0)#6,520 |
| 21. | Peabody | 80.0 | 44.0(+36.0)#21 | 52.0(+28.0)#6,633 |
| 22. | Stoneham | 80.0 | 44.0(+36.0)#22 | 52.0(+28.0)#6,642 |
| 23. | North Adams | 78.0 | 44.0(+34.0)#23 | 52.0(+26.0)#6,887 |
| 24. | West Concord | 77.0 | 44.0(+33.0)#24 | 52.0(+25.0)#7,027 |
| 25. | South Lancaster | 77.0 | 44.0(+33.0)#25 | 52.0(+25.0)#7,069 |
| 26. | Hingham | 76.0 | 44.0(+32.0)#26 | 52.0(+24.0)#7,191 |
| 27. | Wareham Center | 76.0 | 44.0(+32.0)#27 | 52.0(+24.0)#7,217 |
| 28. | Monument Beach | 75.0 | 44.0(+31.0)#28 | 52.0(+23.0)#7,308 |
| 29. | Marlborough | 74.0 | 44.0(+30.0)#29 | 52.0(+22.0)#7,398 |
| 30. | Oxford | 74.0 | 44.0(+30.0)#30 | 52.0(+22.0)#7,447 |
| 31. | East Harwich | 73.0 | 44.0(+29.0)#31 | 52.0(+21.0)#7,615 |
| 32. | Rowley | 73.0 | 44.0(+29.0)#32 | 52.0(+21.0)#7,656 |
| 33. | Reading | 71.0 | 44.0(+27.0)#33 | 52.0(+19.0)#7,837 |
| 34. | Abington | 71.0 | 44.0(+27.0)#34 | 52.0(+19.0)#7,846 |
| 35. | Marshfield | 70.0 | 44.0(+26.0)#35 | 52.0(+18.0)#8,065 |
| 36. | Cedar Crest | 70.0 | 44.0(+26.0)#36 | 52.0(+18.0)#8,084 |
| 37. | Everett | 69.0 | 44.0(+25.0)#37 | 52.0(+17.0)#8,146 |
| 38. | West Warren | 69.0 | 44.0(+25.0)#38 | 52.0(+17.0)#8,255 |
| 39. | Westborough | 68.0 | 44.0(+24.0)#39 | 52.0(+16.0)#8,362 |
| 40. | Attleboro | 67.0 | 44.0(+23.0)#40 | 52.0(+15.0)#8,462 |
| 41. | New Bedford | 66.0 | 44.0(+22.0)#41 | 52.0(+14.0)#8,641 |
| 42. | West Brookfield | 66.0 | 44.0(+22.0)#42 | 52.0(+14.0)#8,738 |
| 43. | Gardner | 65.0 | 44.0(+21.0)#43 | 52.0(+13.0)#8,819 |
| 44. | Lowell | 64.0 | 44.0(+20.0)#44 | 52.0(+12.0)#8,977 |
| 45. | East Pepperell | 64.0 | 44.0(+20.0)#45 | 52.0(+12.0)#9,115 |
| 46. | Whitinsville | 63.0 | 44.0(+19.0)#46 | 52.0(+11.0)#9,248 |
| 47. | Ocean Grove | 63.0 | 44.0(+19.0)#47 | 52.0(+11.0)#9,290 |
| 48. | Medfield | 62.0 | 44.0(+18.0)#48 | 52.0(+10.00)#9,495 |
| 49. | East Sandwich | 61.0 | 44.0(+17.0)#49 | 52.0(+9.00)#9,670 |
| 50. | East Brookfield | 61.0 | 44.0(+17.0)#50 | 52.0(+9.00)#9,714 |
| 51. | Fall River | 60.0 | 44.0(+16.0)#51 | 52.0(+8.00)#9,796 |
| 52. | Lawrence | 59.0 | 44.0(+15.0)#52 | 52.0(+7.00)#9,967 |
| 53. | Milford | 58.0 | 44.0(+14.0)#53 | 52.0(+6.00)#10,221 |
| 54. | Holbrook | 58.0 | 44.0(+14.0)#54 | 52.0(+6.00)#10,253 |
| 55. | Falmouth | 58.0 | 44.0(+14.0)#55 | 52.0(+6.00)#10,303 |
| 56. | South Deerfield | 58.0 | 44.0(+14.0)#56 | 52.0(+6.00)#10,326 |
| 57. | Springfield | 57.0 | 44.0(+13.0)#57 | 52.0(+5.00)#10,388 |
| 58. | Fitchburg | 57.0 | 44.0(+13.0)#58 | 52.0(+5.00)#10,407 |
| 59. | Wakefield | 57.0 | 44.0(+13.0)#59 | 52.0(+5.00)#10,422 |
| 60. | Oak Bluffs | 57.0 | 44.0(+13.0)#60 | 52.0(+5.00)#10,524 |
| 61. | Haverhill | 56.0 | 44.0(+12.0)#61 | 52.0(+4.00)#10,600 |
| 62. | West Springfield Town | 55.0 | 44.0(+11.0)#62 | 52.0(+3.00)#10,858 |
| 63. | Walpole | 55.0 | 44.0(+11.0)#63 | 52.0(+3.00)#10,915 |
| 64. | Taunton | 54.0 | 44.0(+10.00)#64 | 52.0(+2.00)#11,069 |
| 65. | Holyoke | 54.0 | 44.0(+10.00)#65 | 52.0(+2.00)#11,078 |
| 66. | Lynnfield | 54.0 | 44.0(+10.00)#66 | 52.0(+2.00)#11,116 |
| 67. | Middleborough Center | 54.0 | 44.0(+10.00)#67 | 52.0(+2.00)#11,136 |
| 68. | Leominster | 53.0 | 44.0(+9.00)#68 | 52.0(+1.000)#11,303 |
| 69. | Woburn | 53.0 | 44.0(+9.00)#69 | 52.0(+1.000)#11,305 |
| 70. | Melrose | 53.0 | 44.0(+9.00)#70 | 52.0(+1.000)#11,313 |
| 71. | Brockton | 51.0 | 44.0(+7.00)#71 | 52.0(-1.000)#11,760 |
| 72. | Malden | 51.0 | 44.0(+7.00)#72 | 52.0(-1.000)#11,771 |
| 73. | Hudson | 51.0 | 44.0(+7.00)#73 | 52.0(-1.000)#11,811 |
| 74. | Swampscott | 51.0 | 44.0(+7.00)#74 | 52.0(-1.000)#11,813 |
| 75. | Cochituate | 51.0 | 44.0(+7.00)#75 | 52.0(-1.000)#11,847 |
| 76. | Worcester | 50.0 | 44.0(+6.00)#76 | 52.0(-2.00)#11,982 |
| 77. | Lynn | 50.0 | 44.0(+6.00)#77 | 52.0(-2.00)#11,989 |
| 78. | Weymouth Town | 50.0 | 44.0(+6.00)#78 | 52.0(-2.00)#12,002 |
| 79. | Danvers | 50.0 | 44.0(+6.00)#79 | 52.0(-2.00)#12,022 |
| 80. | Foxborough | 50.0 | 44.0(+6.00)#80 | 52.0(-2.00)#12,097 |
| 81. | Winchendon | 50.0 | 44.0(+6.00)#81 | 52.0(-2.00)#12,113 |
| 82. | Turners Falls | 50.0 | 44.0(+6.00)#82 | 52.0(-2.00)#12,123 |
| 83. | Hanson | 50.0 | 44.0(+6.00)#83 | 52.0(-2.00)#12,152 |
| 84. | Barnstable Town | 49.0 | 44.0(+5.00)#84 | 52.0(-3.00)#12,262 |
| 85. | Watertown Town | 49.0 | 44.0(+5.00)#85 | 52.0(-3.00)#12,271 |
| 86. | Longmeadow | 49.0 | 44.0(+5.00)#86 | 52.0(-3.00)#12,294 |
| 87. | Yarmouth Port | 49.0 | 44.0(+5.00)#87 | 52.0(-3.00)#12,345 |
| 88. | Framingham | 48.0 | 44.0(+4.00)#88 | 52.0(-4.00)#12,487 |
| 89. | Salem | 48.0 | 44.0(+4.00)#89 | 52.0(-4.00)#12,497 |
| 90. | Burlington | 48.0 | 44.0(+4.00)#90 | 52.0(-4.00)#12,513 |
| 91. | Littleton Common | 48.0 | 44.0(+4.00)#91 | 52.0(-4.00)#12,620 |
| 92. | Belchertown | 48.0 | 44.0(+4.00)#92 | 52.0(-4.00)#12,624 |
| 93. | Arlington | 47.0 | 44.0(+3.00)#93 | 52.0(-5.00)#12,768 |
| 94. | Athol | 47.0 | 44.0(+3.00)#94 | 52.0(-5.00)#12,832 |
| 95. | Beverly | 46.0 | 44.0(+2.00)#95 | 52.0(-6.00)#13,018 |
| 96. | Westfield | 46.0 | 44.0(+2.00)#96 | 52.0(-6.00)#13,021 |
| 97. | Pittsfield | 45.0 | 44.0(+1.000)#97 | 52.0(-7.00)#13,230 |
| 98. | Milton | 45.0 | 44.0(+1.000)#98 | 52.0(-7.00)#13,239 |
| 99. | Somerset | 45.0 | 44.0(+1.000)#99 | 52.0(-7.00)#13,260 |
| 100. | Dedham | 44.0 | 44.0(=0.000)#100 | 52.0(-8.00)#13,491 |
1
2Common Questions
What are the Top 10 Cities with the Most Births per 1,000 Women Receiving Public Assitance in Massachusetts?
Top 10 Cities with the Most Births per 1,000 Women Receiving Public Assitance in Massachusetts are:
#1
348.0
#2
339.0
#3
237.0
#4
231.0
#5
209.0
#6
140.0
#7
139.0
#8
130.0
#9
121.0
#10
117.0
What city has the Most Births per 1,000 Women Receiving Public Assitance in Massachusetts?
Seconsett Island has the Most Births per 1,000 Women Receiving Public Assitance in Massachusetts with 348.0.
What is the Number of Births per 1,000 Women Receiving Public Assitance in the State of Massachusetts?
Number of Births per 1,000 Women Receiving Public Assitance in Massachusetts is 44.0.
What is the Number of Births per 1,000 Women Receiving Public Assitance in the United States?
Number of Births per 1,000 Women Receiving Public Assitance in the United States is 52.0.