Cities with the Highest Percentage of Czech Population in Massachusetts
RELATED REPORTS & OPTIONS
Czech
Massachusetts
Compare Cities
Map of Cities with the Highest Percentage of Czech Population in Massachusetts
0.00%
4.00%
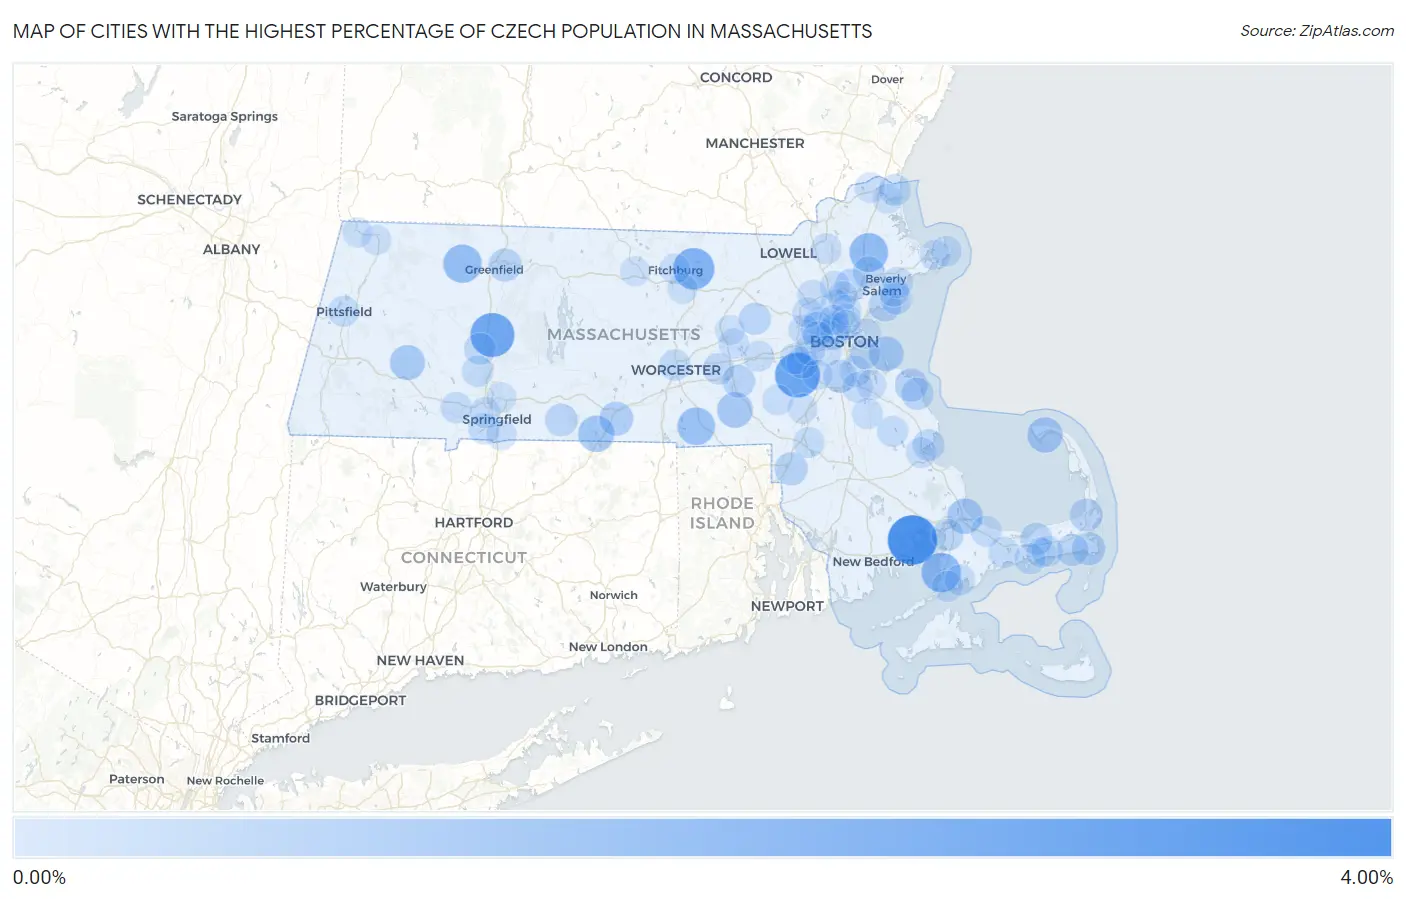
Cities with the Highest Percentage of Czech Population in Massachusetts
| City | Czech | vs State | vs National | |
| 1. | Marion Center | 3.88% | 0.18% (+3.70)#1 | 0.38% (+3.49)#918 |
| 2. | Dover | 2.95% | 0.18% (+2.77)#2 | 0.38% (+2.56)#1,274 |
| 3. | Hatfield | 2.78% | 0.18% (+2.60)#3 | 0.38% (+2.40)#1,352 |
| 4. | Lunenburg | 2.23% | 0.18% (+2.06)#4 | 0.38% (+1.85)#1,713 |
| 5. | West Falmouth | 1.84% | 0.18% (+1.66)#5 | 0.38% (+1.46)#2,107 |
| 6. | Topsfield | 1.71% | 0.18% (+1.54)#6 | 0.38% (+1.33)#2,274 |
| 7. | Shelburne Falls | 1.65% | 0.18% (+1.47)#7 | 0.38% (+1.27)#2,370 |
| 8. | East Douglas | 1.48% | 0.18% (+1.31)#8 | 0.38% (+1.10)#2,664 |
| 9. | Holland | 1.24% | 0.18% (+1.06)#9 | 0.38% (+0.857)#3,132 |
| 10. | Hopedale | 1.11% | 0.18% (+0.936)#10 | 0.38% (+0.729)#3,462 |
| 11. | Sagamore | 1.08% | 0.18% (+0.908)#11 | 0.38% (+0.701)#3,538 |
| 12. | Provincetown | 1.08% | 0.18% (+0.901)#12 | 0.38% (+0.695)#3,559 |
| 13. | Chester | 1.01% | 0.18% (+0.830)#13 | 0.38% (+0.624)#3,779 |
| 14. | Hull | 0.94% | 0.18% (+0.763)#14 | 0.38% (+0.556)#4,013 |
| 15. | Sturbridge | 0.81% | 0.18% (+0.634)#15 | 0.38% (+0.427)#4,523 |
| 16. | Belmont | 0.71% | 0.18% (+0.531)#16 | 0.38% (+0.325)#5,001 |
| 17. | West Chatham | 0.67% | 0.18% (+0.497)#17 | 0.38% (+0.291)#5,155 |
| 18. | Milton | 0.65% | 0.18% (+0.474)#18 | 0.38% (+0.268)#5,272 |
| 19. | Attleboro | 0.65% | 0.18% (+0.470)#19 | 0.38% (+0.264)#5,298 |
| 20. | North Scituate | 0.63% | 0.18% (+0.458)#20 | 0.38% (+0.252)#5,366 |
| 21. | Turners Falls | 0.63% | 0.18% (+0.449)#21 | 0.38% (+0.243)#5,419 |
| 22. | Orleans | 0.60% | 0.18% (+0.424)#22 | 0.38% (+0.218)#5,558 |
| 23. | Swampscott | 0.60% | 0.18% (+0.419)#23 | 0.38% (+0.212)#5,597 |
| 24. | Hopkinton | 0.55% | 0.18% (+0.369)#24 | 0.38% (+0.163)#5,922 |
| 25. | Monson Center | 0.54% | 0.18% (+0.362)#25 | 0.38% (+0.155)#5,969 |
| 26. | Lynnfield | 0.53% | 0.18% (+0.357)#26 | 0.38% (+0.151)#5,996 |
| 27. | Cambridge | 0.48% | 0.18% (+0.309)#27 | 0.38% (+0.102)#6,348 |
| 28. | Scituate | 0.48% | 0.18% (+0.301)#28 | 0.38% (+0.095)#6,392 |
| 29. | Danvers | 0.47% | 0.18% (+0.289)#29 | 0.38% (+0.083)#6,486 |
| 30. | Monument Beach | 0.46% | 0.18% (+0.287)#30 | 0.38% (+0.080)#6,514 |
| 31. | Harwich Port | 0.44% | 0.18% (+0.268)#31 | 0.38% (+0.061)#6,667 |
| 32. | Maynard | 0.43% | 0.18% (+0.255)#32 | 0.38% (+0.048)#6,792 |
| 33. | Needham | 0.43% | 0.18% (+0.249)#33 | 0.38% (+0.043)#6,845 |
| 34. | Yarmouth Port | 0.42% | 0.18% (+0.242)#34 | 0.38% (+0.036)#6,898 |
| 35. | Salisbury | 0.40% | 0.18% (+0.222)#35 | 0.38% (+0.016)#7,074 |
| 36. | Northampton | 0.39% | 0.18% (+0.210)#36 | 0.38% (+0.003)#7,205 |
| 37. | Marblehead | 0.38% | 0.18% (+0.207)#37 | 0.38% (+0.001)#7,220 |
| 38. | Westborough | 0.37% | 0.18% (+0.189)#38 | 0.38% (-0.018)#7,380 |
| 39. | South Duxbury | 0.35% | 0.18% (+0.176)#39 | 0.38% (-0.031)#7,521 |
| 40. | Worcester | 0.32% | 0.18% (+0.143)#40 | 0.38% (-0.063)#7,859 |
| 41. | Somerville | 0.30% | 0.18% (+0.127)#41 | 0.38% (-0.079)#8,046 |
| 42. | Westfield | 0.30% | 0.18% (+0.123)#42 | 0.38% (-0.084)#8,094 |
| 43. | Easthampton Town | 0.30% | 0.18% (+0.121)#43 | 0.38% (-0.085)#8,124 |
| 44. | West Dennis | 0.29% | 0.18% (+0.116)#44 | 0.38% (-0.090)#8,178 |
| 45. | Barnstable Town | 0.28% | 0.18% (+0.104)#45 | 0.38% (-0.103)#8,332 |
| 46. | Quincy | 0.28% | 0.18% (+0.099)#46 | 0.38% (-0.107)#8,402 |
| 47. | Arlington | 0.27% | 0.18% (+0.096)#47 | 0.38% (-0.110)#8,437 |
| 48. | Agawam Town | 0.27% | 0.18% (+0.093)#48 | 0.38% (-0.114)#8,475 |
| 49. | Beverly | 0.26% | 0.18% (+0.088)#49 | 0.38% (-0.119)#8,537 |
| 50. | Mansfield Center | 0.26% | 0.18% (+0.084)#50 | 0.38% (-0.123)#8,590 |
| 51. | Stoneham | 0.25% | 0.18% (+0.072)#51 | 0.38% (-0.135)#8,748 |
| 52. | Wellesley | 0.24% | 0.18% (+0.065)#52 | 0.38% (-0.142)#8,857 |
| 53. | Hanson | 0.24% | 0.18% (+0.063)#53 | 0.38% (-0.143)#8,878 |
| 54. | East Sandwich | 0.24% | 0.18% (+0.061)#54 | 0.38% (-0.145)#8,901 |
| 55. | Pittsfield | 0.24% | 0.18% (+0.059)#55 | 0.38% (-0.147)#8,921 |
| 56. | West Springfield Town | 0.23% | 0.18% (+0.057)#56 | 0.38% (-0.150)#8,954 |
| 57. | Falmouth | 0.23% | 0.18% (+0.055)#57 | 0.38% (-0.151)#8,965 |
| 58. | West Yarmouth | 0.23% | 0.18% (+0.053)#58 | 0.38% (-0.153)#8,990 |
| 59. | Brookline | 0.22% | 0.18% (+0.044)#59 | 0.38% (-0.163)#9,129 |
| 60. | Salem | 0.22% | 0.18% (+0.039)#60 | 0.38% (-0.167)#9,214 |
| 61. | Kingston | 0.21% | 0.18% (+0.037)#61 | 0.38% (-0.169)#9,258 |
| 62. | Andover | 0.21% | 0.18% (+0.036)#62 | 0.38% (-0.170)#9,269 |
| 63. | Amherst | 0.21% | 0.18% (+0.030)#63 | 0.38% (-0.176)#9,348 |
| 64. | East Falmouth | 0.20% | 0.18% (+0.022)#64 | 0.38% (-0.184)#9,453 |
| 65. | Boston | 0.20% | 0.18% (+0.021)#65 | 0.38% (-0.186)#9,464 |
| 66. | Millis Clicquot | 0.19% | 0.18% (+0.014)#66 | 0.38% (-0.192)#9,565 |
| 67. | Framingham | 0.18% | 0.18% (+0.006)#67 | 0.38% (-0.200)#9,708 |
| 68. | Waltham | 0.18% | 0.18% (+0.006)#68 | 0.38% (-0.200)#9,709 |
| 69. | Gloucester | 0.17% | 0.18% (-0.002)#69 | 0.38% (-0.208)#9,826 |
| 70. | Burlington | 0.17% | 0.18% (-0.004)#70 | 0.38% (-0.211)#9,864 |
| 71. | Abington | 0.17% | 0.18% (-0.006)#71 | 0.38% (-0.212)#9,885 |
| 72. | Reading | 0.17% | 0.18% (-0.007)#72 | 0.38% (-0.214)#9,910 |
| 73. | Braintree Town | 0.17% | 0.18% (-0.009)#73 | 0.38% (-0.215)#9,926 |
| 74. | Rockport | 0.16% | 0.18% (-0.015)#74 | 0.38% (-0.221)#10,001 |
| 75. | Lexington | 0.14% | 0.18% (-0.036)#75 | 0.38% (-0.242)#10,305 |
| 76. | Marlborough | 0.14% | 0.18% (-0.039)#76 | 0.38% (-0.245)#10,341 |
| 77. | Amesbury Town | 0.13% | 0.18% (-0.043)#77 | 0.38% (-0.250)#10,398 |
| 78. | Weymouth Town | 0.13% | 0.18% (-0.049)#78 | 0.38% (-0.255)#10,463 |
| 79. | Longmeadow | 0.13% | 0.18% (-0.050)#79 | 0.38% (-0.256)#10,481 |
| 80. | Newton | 0.13% | 0.18% (-0.050)#80 | 0.38% (-0.256)#10,482 |
| 81. | Fitchburg | 0.12% | 0.18% (-0.059)#81 | 0.38% (-0.265)#10,594 |
| 82. | Dedham | 0.12% | 0.18% (-0.061)#82 | 0.38% (-0.267)#10,621 |
| 83. | Leominster | 0.11% | 0.18% (-0.064)#83 | 0.38% (-0.270)#10,650 |
| 84. | Melrose | 0.10% | 0.18% (-0.075)#84 | 0.38% (-0.281)#10,766 |
| 85. | Greenfield | 0.096% | 0.18% (-0.080)#85 | 0.38% (-0.287)#10,844 |
| 86. | Walpole | 0.094% | 0.18% (-0.082)#86 | 0.38% (-0.289)#10,864 |
| 87. | Chicopee | 0.094% | 0.18% (-0.083)#87 | 0.38% (-0.289)#10,869 |
| 88. | Malden | 0.090% | 0.18% (-0.086)#88 | 0.38% (-0.293)#10,905 |
| 89. | Wakefield | 0.085% | 0.18% (-0.091)#89 | 0.38% (-0.298)#10,976 |
| 90. | South Yarmouth | 0.085% | 0.18% (-0.092)#90 | 0.38% (-0.298)#10,979 |
| 91. | Gardner | 0.081% | 0.18% (-0.096)#91 | 0.38% (-0.302)#11,018 |
| 92. | Hudson | 0.077% | 0.18% (-0.099)#92 | 0.38% (-0.305)#11,048 |
| 93. | North Adams | 0.077% | 0.18% (-0.099)#93 | 0.38% (-0.305)#11,049 |
| 94. | Medford | 0.073% | 0.18% (-0.104)#94 | 0.38% (-0.310)#11,102 |
| 95. | North Attleborough | 0.072% | 0.18% (-0.105)#95 | 0.38% (-0.311)#11,117 |
| 96. | Watertown Town | 0.071% | 0.18% (-0.105)#96 | 0.38% (-0.312)#11,127 |
| 97. | Newburyport | 0.071% | 0.18% (-0.106)#97 | 0.38% (-0.312)#11,130 |
| 98. | Winthrop Town | 0.068% | 0.18% (-0.108)#98 | 0.38% (-0.314)#11,157 |
| 99. | Williamstown | 0.067% | 0.18% (-0.110)#99 | 0.38% (-0.316)#11,178 |
| 100. | Everett | 0.066% | 0.18% (-0.111)#100 | 0.38% (-0.317)#11,190 |
Common Questions
What are the Top 10 Cities with the Highest Percentage of Czech Population in Massachusetts?
Top 10 Cities with the Highest Percentage of Czech Population in Massachusetts are:
#1
3.88%
#2
2.95%
#3
2.78%
#4
2.23%
#5
1.84%
#6
1.71%
#7
1.65%
#8
1.48%
#9
1.24%
#10
1.11%
What city has the Highest Percentage of Czech Population in Massachusetts?
Marion Center has the Highest Percentage of Czech Population in Massachusetts with 3.88%.
What is the Percentage of Czech Population in the State of Massachusetts?
Percentage of Czech Population in Massachusetts is 0.18%.
What is the Percentage of Czech Population in the United States?
Percentage of Czech Population in the United States is 0.38%.