Blandford, MA Map & Demographics
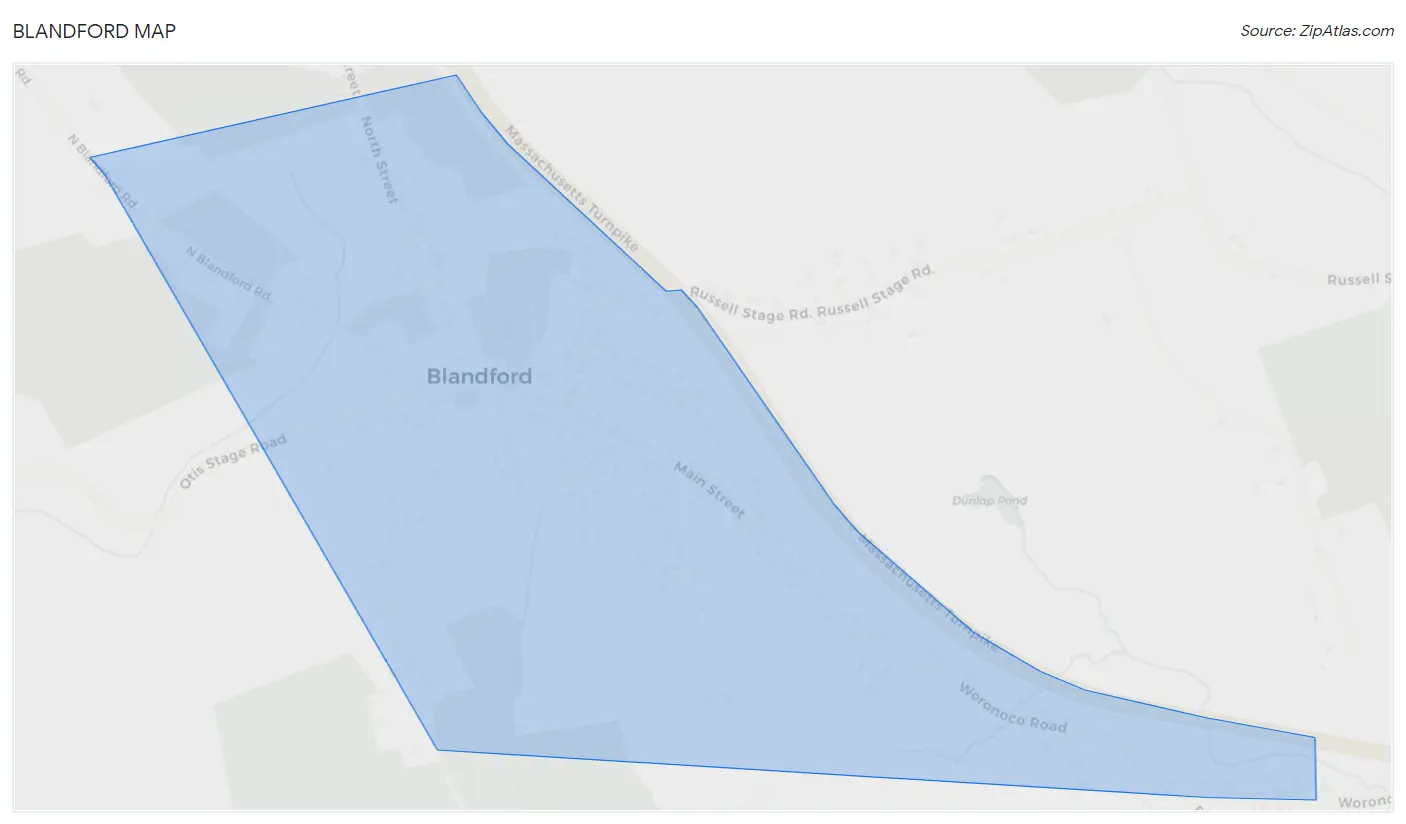
Blandford Map
Blandford Overview
$54,754
PER CAPITA INCOME
$128,333
AVG FAMILY INCOME
$90,865
AVG HOUSEHOLD INCOME
24.8%
WAGE / INCOME GAP [ % ]
75.2¢/ $1
WAGE / INCOME GAP [ $ ]
0.29
INEQUALITY / GINI INDEX
349
TOTAL POPULATION
184
MALE POPULATION
165
FEMALE POPULATION
111.52
MALES / 100 FEMALES
89.67
FEMALES / 100 MALES
48.6
MEDIAN AGE
2.9
AVG FAMILY SIZE
2.0
AVG HOUSEHOLD SIZE
178
LABOR FORCE [ PEOPLE ]
57.6%
PERCENT IN LABOR FORCE
Blandford Zip Codes
Blandford Area Codes
Income in Blandford
Income Overview in Blandford
Per Capita Income in Blandford is $54,754, while median incomes of families and households are $128,333 and $90,865 respectively.
| Characteristic | Number | Measure |
| Per Capita Income | 349 | $54,754 |
| Median Family Income | 86 | $128,333 |
| Mean Family Income | 86 | $138,910 |
| Median Household Income | 173 | $90,865 |
| Mean Household Income | 173 | $111,666 |
| Income Deficit | 86 | $0 |
| Wage / Income Gap (%) | 349 | 24.84% |
| Wage / Income Gap ($) | 349 | 75.16¢ per $1 |
| Gini / Inequality Index | 349 | 0.29 |
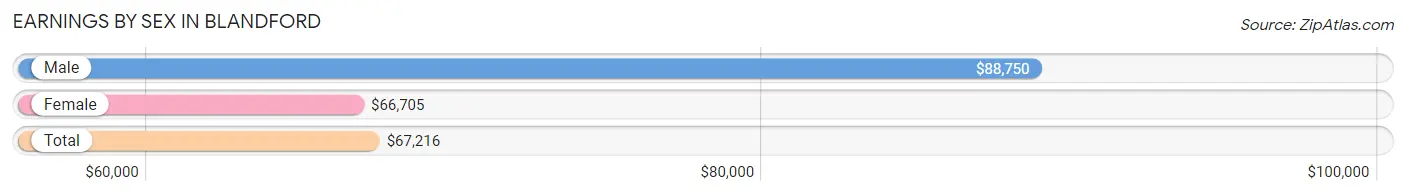
Earnings by Sex in Blandford
Average Earnings in Blandford are $67,216, $88,750 for men and $66,705 for women, a difference of 24.8%.
| Sex | Number | Average Earnings |
| Male | 117 (57.1%) | $88,750 |
| Female | 88 (42.9%) | $66,705 |
| Total | 205 (100.0%) | $67,216 |
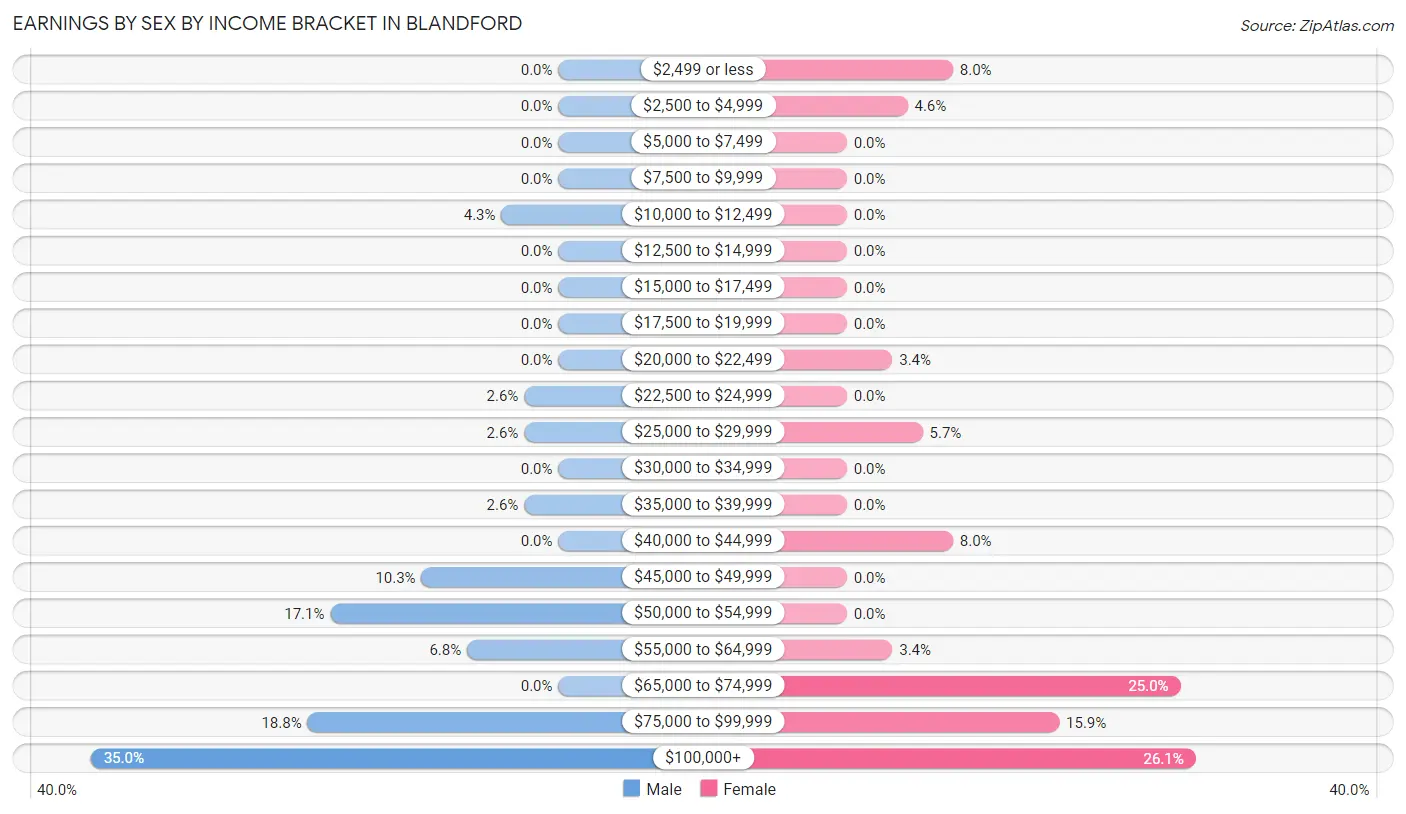
Earnings by Sex by Income Bracket in Blandford
The most common earnings brackets in Blandford are $100,000+ for men (41 | 35.0%) and $100,000+ for women (23 | 26.1%).
| Income | Male | Female |
| $2,499 or less | 0 (0.0%) | 7 (8.0%) |
| $2,500 to $4,999 | 0 (0.0%) | 4 (4.5%) |
| $5,000 to $7,499 | 0 (0.0%) | 0 (0.0%) |
| $7,500 to $9,999 | 0 (0.0%) | 0 (0.0%) |
| $10,000 to $12,499 | 5 (4.3%) | 0 (0.0%) |
| $12,500 to $14,999 | 0 (0.0%) | 0 (0.0%) |
| $15,000 to $17,499 | 0 (0.0%) | 0 (0.0%) |
| $17,500 to $19,999 | 0 (0.0%) | 0 (0.0%) |
| $20,000 to $22,499 | 0 (0.0%) | 3 (3.4%) |
| $22,500 to $24,999 | 3 (2.6%) | 0 (0.0%) |
| $25,000 to $29,999 | 3 (2.6%) | 5 (5.7%) |
| $30,000 to $34,999 | 0 (0.0%) | 0 (0.0%) |
| $35,000 to $39,999 | 3 (2.6%) | 0 (0.0%) |
| $40,000 to $44,999 | 0 (0.0%) | 7 (8.0%) |
| $45,000 to $49,999 | 12 (10.3%) | 0 (0.0%) |
| $50,000 to $54,999 | 20 (17.1%) | 0 (0.0%) |
| $55,000 to $64,999 | 8 (6.8%) | 3 (3.4%) |
| $65,000 to $74,999 | 0 (0.0%) | 22 (25.0%) |
| $75,000 to $99,999 | 22 (18.8%) | 14 (15.9%) |
| $100,000+ | 41 (35.0%) | 23 (26.1%) |
| Total | 117 (100.0%) | 88 (100.0%) |
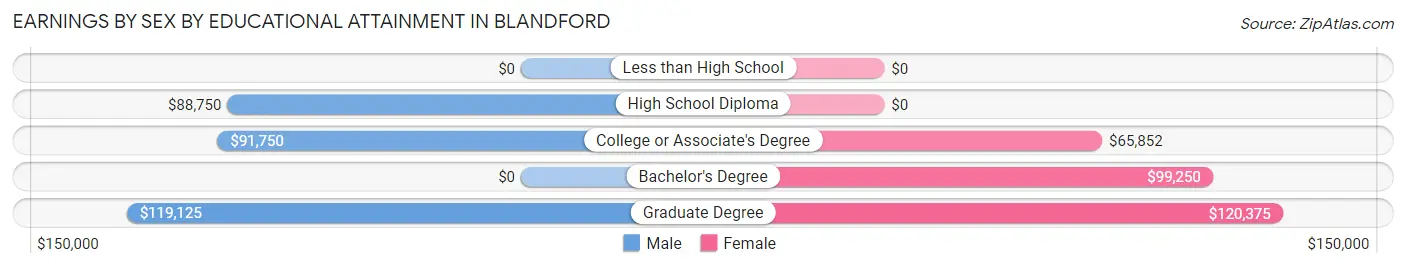
Earnings by Sex by Educational Attainment in Blandford
Average earnings in Blandford are $94,375 for men and $67,102 for women, a difference of 28.9%. Men with an educational attainment of graduate degree enjoy the highest average annual earnings of $119,125, while those with high school diploma education earn the least with $88,750. Women with an educational attainment of graduate degree earn the most with the average annual earnings of $120,375, while those with college or associate's degree education have the smallest earnings of $65,852.
| Educational Attainment | Male Income | Female Income |
| Less than High School | - | - |
| High School Diploma | $88,750 | $0 |
| College or Associate's Degree | $91,750 | $65,852 |
| Bachelor's Degree | - | - |
| Graduate Degree | $119,125 | $120,375 |
| Total | $94,375 | $67,102 |
Family Income in Blandford
Family Income Brackets in Blandford
According to the Blandford family income data, there are 25 families falling into the $200,000+ income range, which is the most common income bracket and makes up 29.1% of all families.
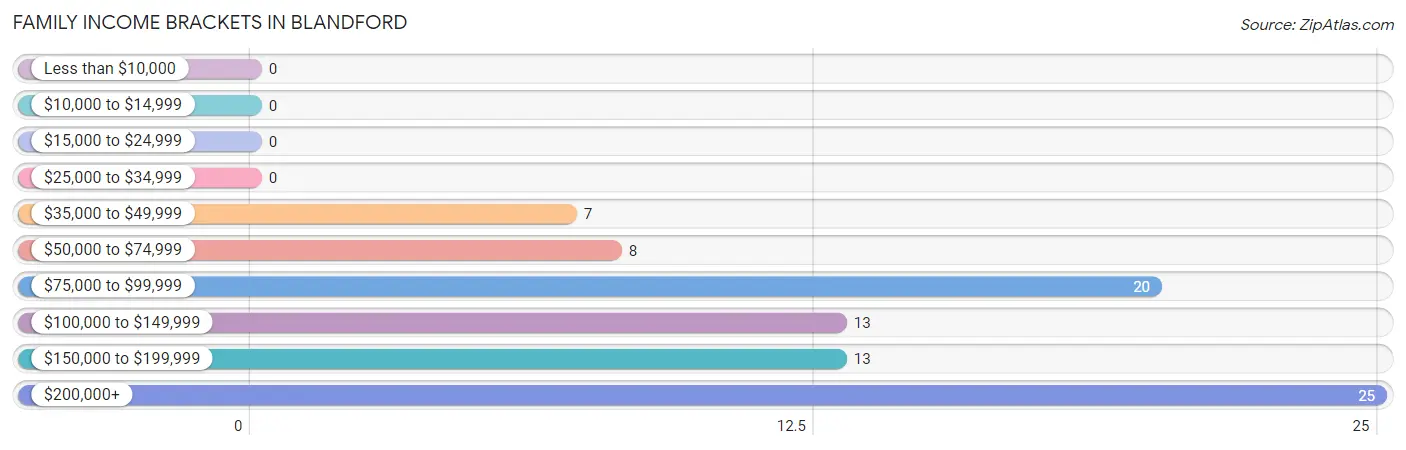
| Income Bracket | # Families | % Families |
| Less than $10,000 | 0 | 0.0% |
| $10,000 to $14,999 | 0 | 0.0% |
| $15,000 to $24,999 | 0 | 0.0% |
| $25,000 to $34,999 | 0 | 0.0% |
| $35,000 to $49,999 | 7 | 8.1% |
| $50,000 to $74,999 | 8 | 9.3% |
| $75,000 to $99,999 | 20 | 23.3% |
| $100,000 to $149,999 | 13 | 15.1% |
| $150,000 to $199,999 | 13 | 15.1% |
| $200,000+ | 25 | 29.1% |
Family Income by Famaliy Size in Blandford
4-person families (26 | 30.2%) account for the highest median family income in Blandford with $222,955 per family, while 2-person families (37 | 43.0%) have the highest median income of $59,688 per family member.
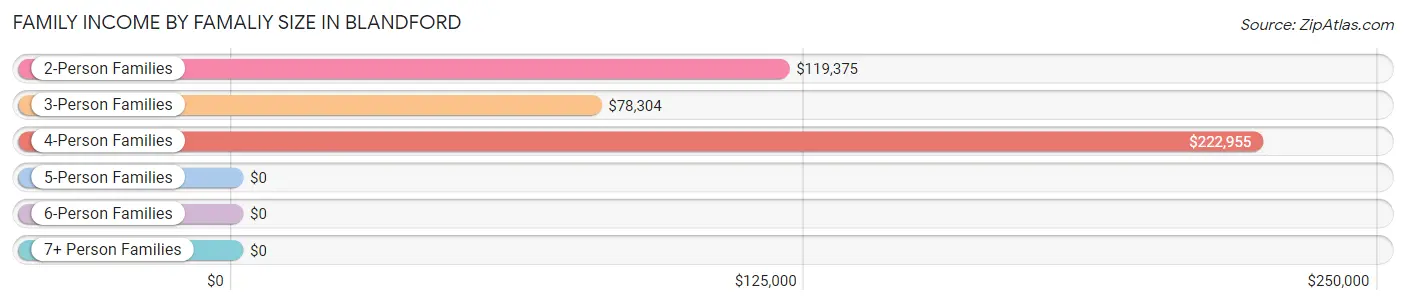
| Income Bracket | # Families | Median Income |
| 2-Person Families | 37 (43.0%) | $119,375 |
| 3-Person Families | 23 (26.7%) | $78,304 |
| 4-Person Families | 26 (30.2%) | $222,955 |
| 5-Person Families | 0 (0.0%) | $0 |
| 6-Person Families | 0 (0.0%) | $0 |
| 7+ Person Families | 0 (0.0%) | $0 |
| Total | 86 (100.0%) | $128,333 |
Family Income by Number of Earners in Blandford
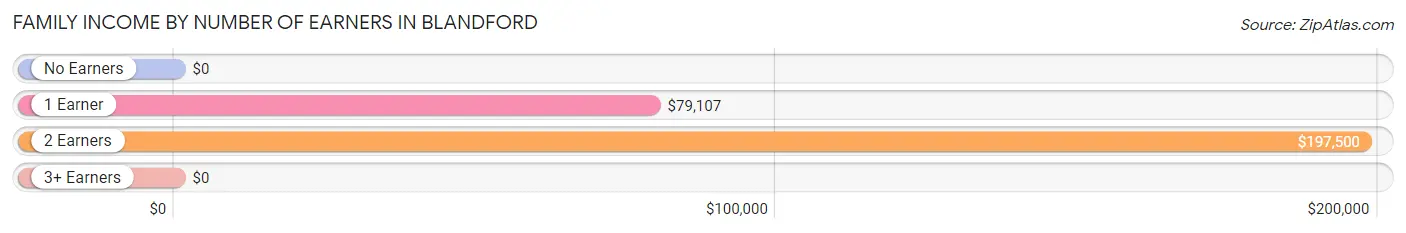
| Number of Earners | # Families | Median Income |
| No Earners | 8 (9.3%) | $0 |
| 1 Earner | 32 (37.2%) | $79,107 |
| 2 Earners | 42 (48.8%) | $197,500 |
| 3+ Earners | 4 (4.6%) | $0 |
| Total | 86 (100.0%) | $128,333 |
Household Income in Blandford
Household Income Brackets in Blandford
With 52 households falling in the category, the $75,000 to $99,999 income range is the most frequent in Blandford, accounting for 30.1% of all households.
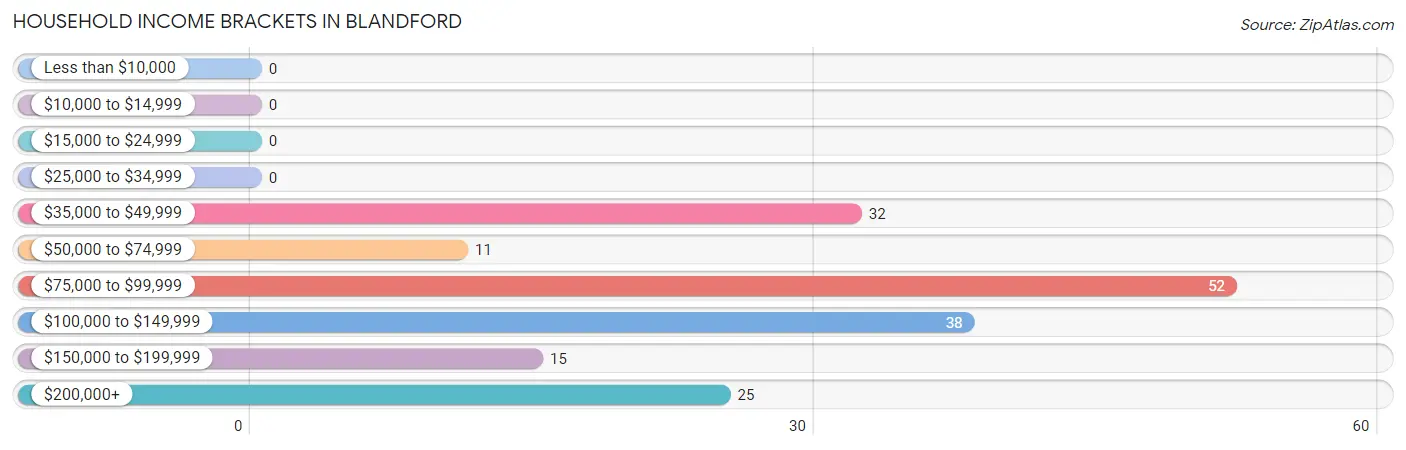
| Income Bracket | # Households | % Households |
| Less than $10,000 | 0 | 0.0% |
| $10,000 to $14,999 | 0 | 0.0% |
| $15,000 to $24,999 | 0 | 0.0% |
| $25,000 to $34,999 | 0 | 0.0% |
| $35,000 to $49,999 | 32 | 18.5% |
| $50,000 to $74,999 | 11 | 6.4% |
| $75,000 to $99,999 | 52 | 30.1% |
| $100,000 to $149,999 | 38 | 22.0% |
| $150,000 to $199,999 | 15 | 8.7% |
| $200,000+ | 25 | 14.5% |
Household Income by Householder Age in Blandford
The median household income in Blandford is $90,865, with the highest median household income of $84,943 found in the 45 to 64 years age bracket for the primary householder. A total of 87 households (50.3%) fall into this category.
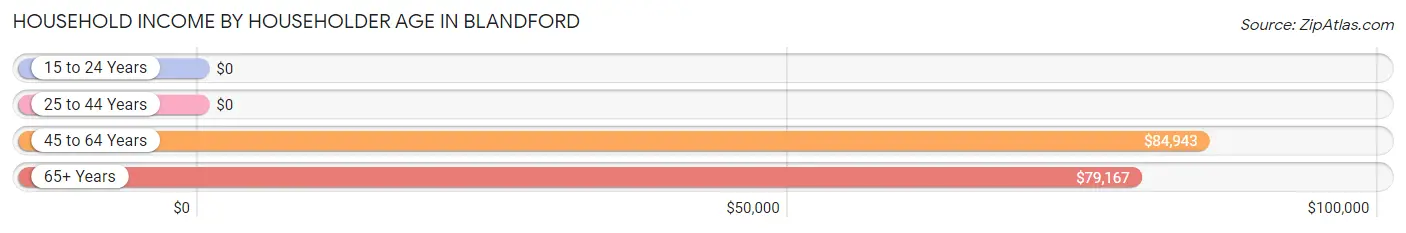
| Income Bracket | # Households | Median Income |
| 15 to 24 Years | 0 (0.0%) | $0 |
| 25 to 44 Years | 38 (22.0%) | $0 |
| 45 to 64 Years | 87 (50.3%) | $84,943 |
| 65+ Years | 48 (27.8%) | $79,167 |
| Total | 173 (100.0%) | $90,865 |
Poverty in Blandford
Income Below Poverty by Sex and Age in Blandford
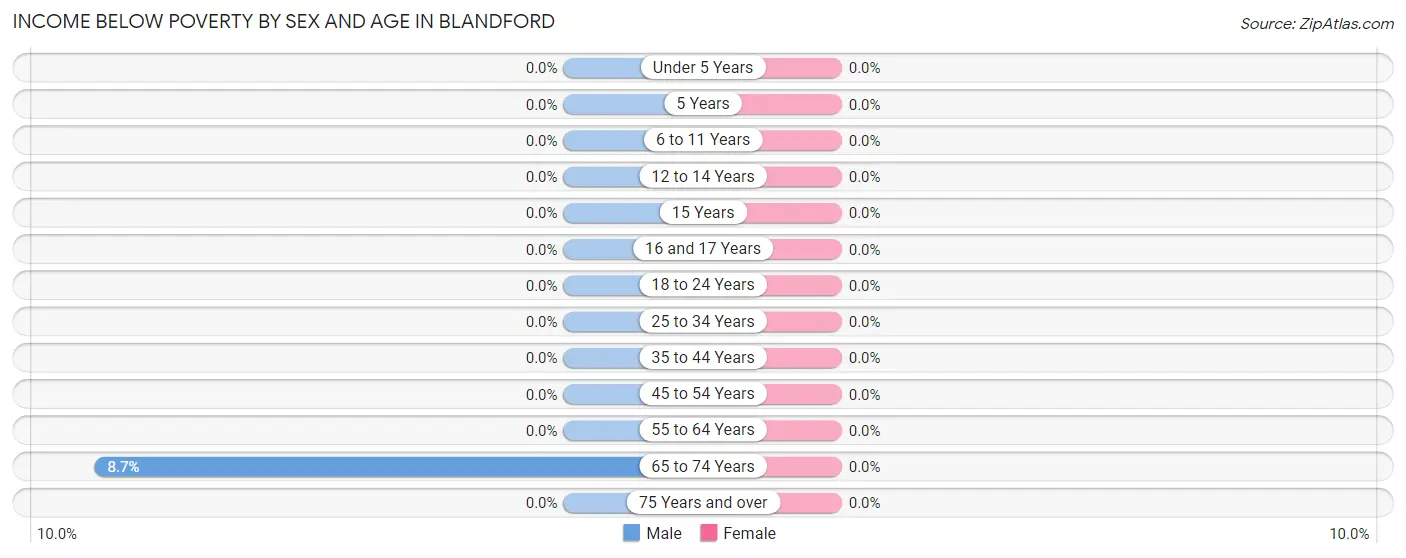
| Age Bracket | Male | Female |
| Under 5 Years | 0 (0.0%) | 0 (0.0%) |
| 5 Years | 0 (0.0%) | 0 (0.0%) |
| 6 to 11 Years | 0 (0.0%) | 0 (0.0%) |
| 12 to 14 Years | 0 (0.0%) | 0 (0.0%) |
| 15 Years | 0 (0.0%) | 0 (0.0%) |
| 16 and 17 Years | 0 (0.0%) | 0 (0.0%) |
| 18 to 24 Years | 0 (0.0%) | 0 (0.0%) |
| 25 to 34 Years | 0 (0.0%) | 0 (0.0%) |
| 35 to 44 Years | 0 (0.0%) | 0 (0.0%) |
| 45 to 54 Years | 0 (0.0%) | 0 (0.0%) |
| 55 to 64 Years | 0 (0.0%) | 0 (0.0%) |
| 65 to 74 Years | 2 (8.7%) | 0 (0.0%) |
| 75 Years and over | 0 (0.0%) | 0 (0.0%) |
| Total | 2 (1.1%) | 0 (0.0%) |
Income Above Poverty by Sex and Age in Blandford
According to the poverty statistics in Blandford, males aged under 5 years and females aged 6 to 11 years are the age groups that are most secure financially, with 100.0% of males and 100.0% of females in these age groups living above the poverty line.
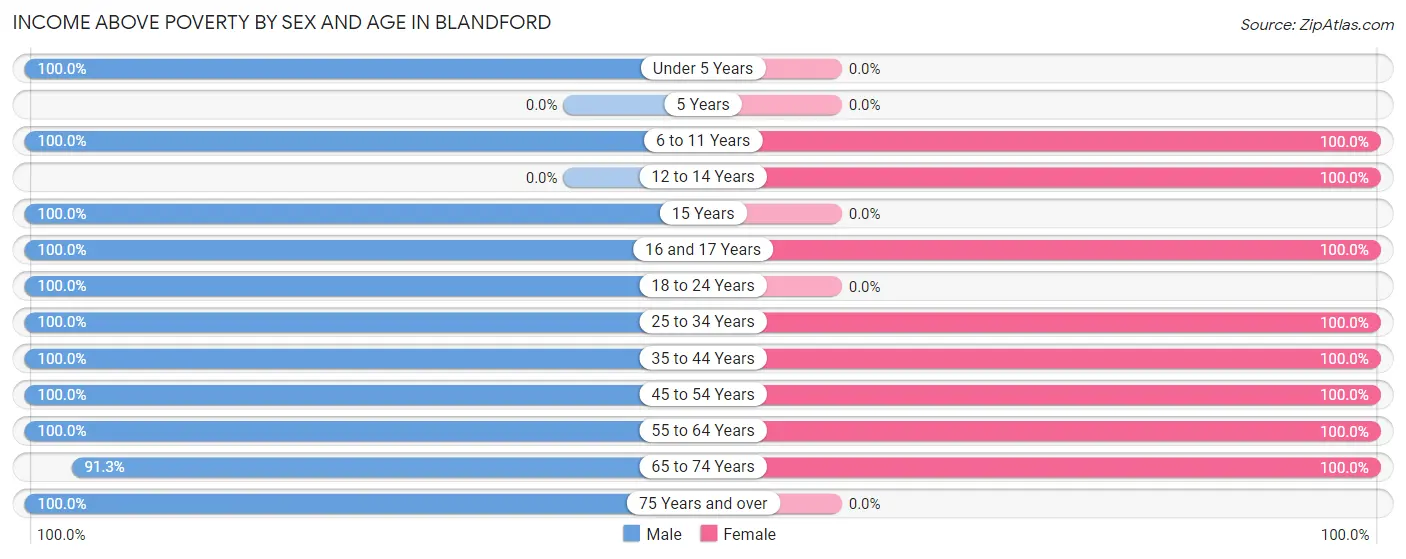
| Age Bracket | Male | Female |
| Under 5 Years | 5 (100.0%) | 0 (0.0%) |
| 5 Years | 0 (0.0%) | 0 (0.0%) |
| 6 to 11 Years | 14 (100.0%) | 5 (100.0%) |
| 12 to 14 Years | 0 (0.0%) | 11 (100.0%) |
| 15 Years | 5 (100.0%) | 0 (0.0%) |
| 16 and 17 Years | 5 (100.0%) | 7 (100.0%) |
| 18 to 24 Years | 26 (100.0%) | 0 (0.0%) |
| 25 to 34 Years | 12 (100.0%) | 4 (100.0%) |
| 35 to 44 Years | 15 (100.0%) | 25 (100.0%) |
| 45 to 54 Years | 50 (100.0%) | 17 (100.0%) |
| 55 to 64 Years | 26 (100.0%) | 54 (100.0%) |
| 65 to 74 Years | 21 (91.3%) | 42 (100.0%) |
| 75 Years and over | 3 (100.0%) | 0 (0.0%) |
| Total | 182 (98.9%) | 165 (100.0%) |
Income Below Poverty Among Married-Couple Families in Blandford
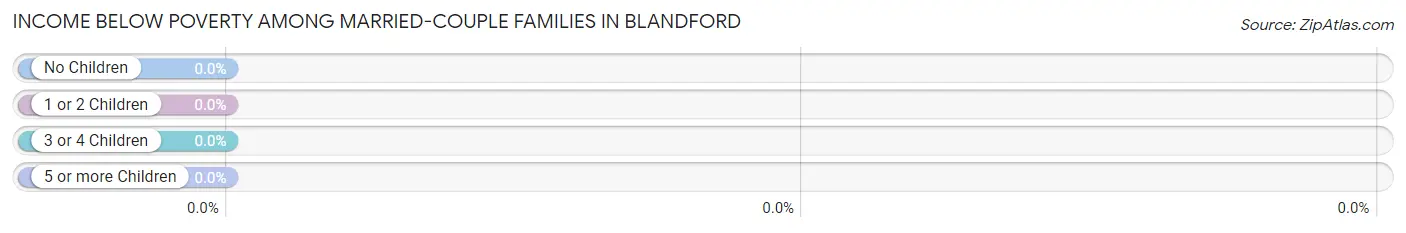
| Children | Above Poverty | Below Poverty |
| No Children | 34 (100.0%) | 0 (0.0%) |
| 1 or 2 Children | 22 (100.0%) | 0 (0.0%) |
| 3 or 4 Children | 0 (0.0%) | 0 (0.0%) |
| 5 or more Children | 0 (0.0%) | 0 (0.0%) |
| Total | 56 (100.0%) | 0 (0.0%) |
Income Below Poverty Among Single-Parent Households in Blandford
| Children | Single Father | Single Mother |
| No Children | 0 (0.0%) | 0 (0.0%) |
| 1 or 2 Children | 0 (0.0%) | 0 (0.0%) |
| 3 or 4 Children | 0 (0.0%) | 0 (0.0%) |
| 5 or more Children | 0 (0.0%) | 0 (0.0%) |
| Total | 0 (0.0%) | 0 (0.0%) |
Income Below Poverty Among Married-Couple vs Single-Parent Households in Blandford
| Children | Married-Couple Families | Single-Parent Households |
| No Children | 0 (0.0%) | 0 (0.0%) |
| 1 or 2 Children | 0 (0.0%) | 0 (0.0%) |
| 3 or 4 Children | 0 (0.0%) | 0 (0.0%) |
| 5 or more Children | 0 (0.0%) | 0 (0.0%) |
| Total | 0 (0.0%) | 0 (0.0%) |
Race in Blandford
The most populous races in Blandford are White / Caucasian (342 | 98.0%), Two or more Races (7 | 2.0%), and Hispanic or Latino (2 | 0.6%).
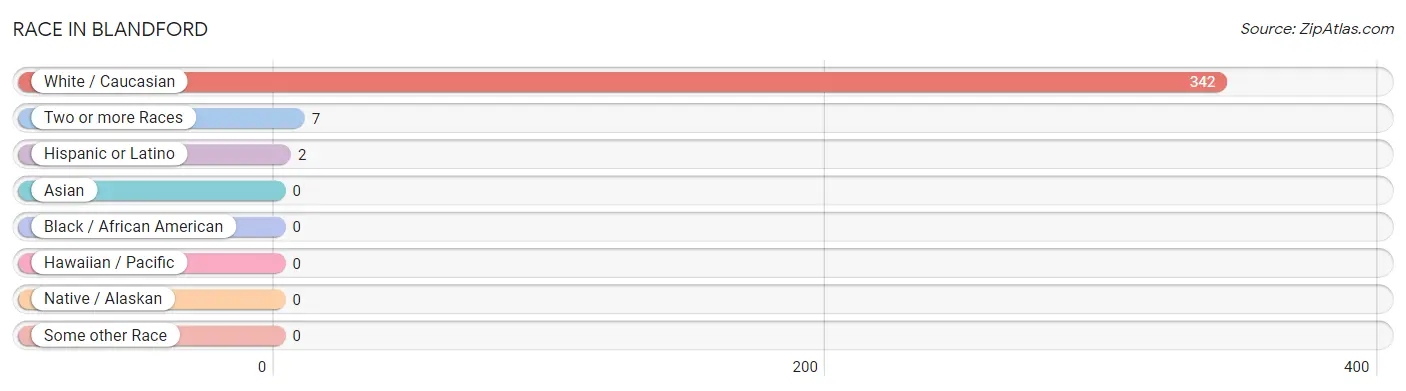
| Race | # Population | % Population |
| Asian | 0 | 0.0% |
| Black / African American | 0 | 0.0% |
| Hawaiian / Pacific | 0 | 0.0% |
| Hispanic or Latino | 2 | 0.6% |
| Native / Alaskan | 0 | 0.0% |
| White / Caucasian | 342 | 98.0% |
| Two or more Races | 7 | 2.0% |
| Some other Race | 0 | 0.0% |
| Total | 349 | 100.0% |
Ancestry in Blandford
The most populous ancestries reported in Blandford are Irish (152 | 43.5%), French Canadian (70 | 20.1%), English (42 | 12.0%), Polish (32 | 9.2%), and American (22 | 6.3%), together accounting for 91.1% of all Blandford residents.
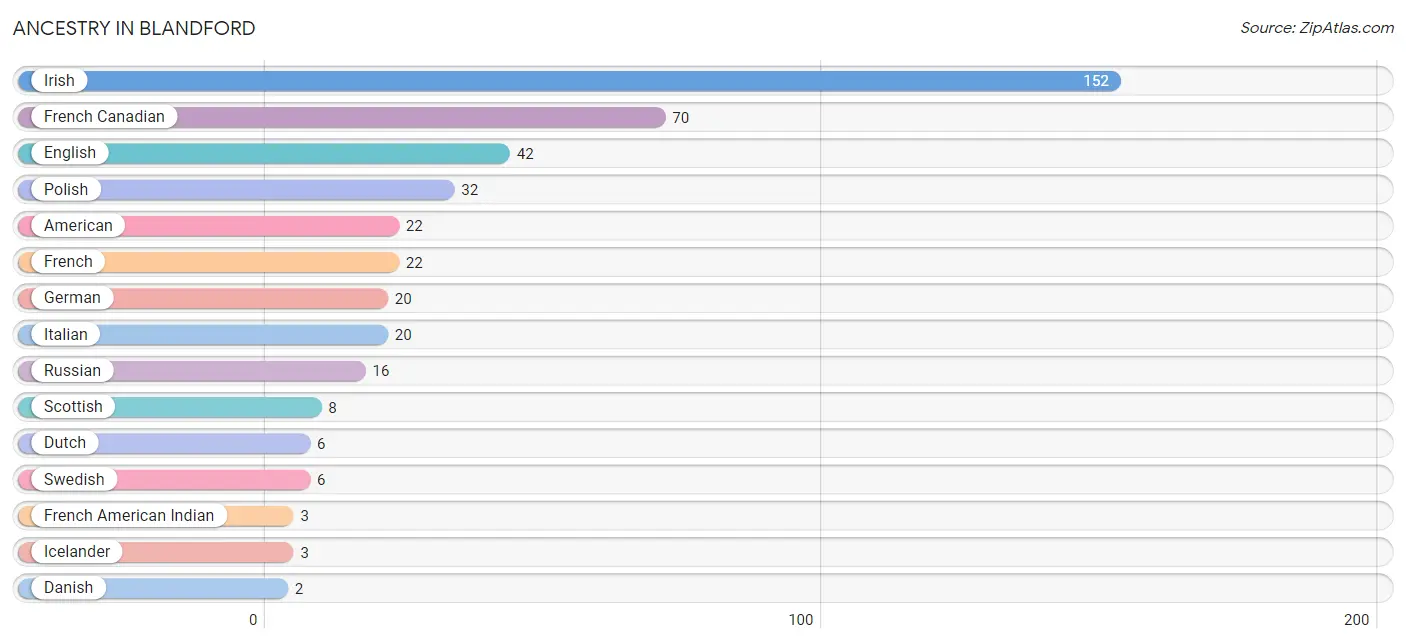
| Ancestry | # Population | % Population |
| American | 22 | 6.3% |
| Danish | 2 | 0.6% |
| Dutch | 6 | 1.7% |
| English | 42 | 12.0% |
| French | 22 | 6.3% |
| French American Indian | 3 | 0.9% |
| French Canadian | 70 | 20.1% |
| German | 20 | 5.7% |
| Icelander | 3 | 0.9% |
| Irish | 152 | 43.5% |
| Italian | 20 | 5.7% |
| Polish | 32 | 9.2% |
| Puerto Rican | 2 | 0.6% |
| Russian | 16 | 4.6% |
| Scottish | 8 | 2.3% |
| Swedish | 6 | 1.7% | View All 16 Rows |
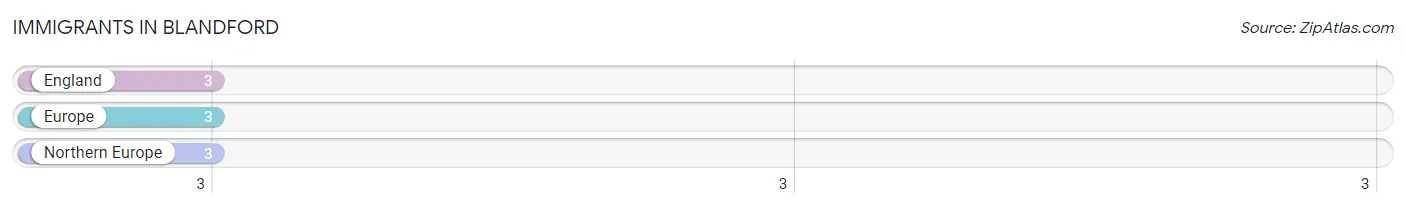
Immigrants in Blandford
The most numerous immigrant groups reported in Blandford came from England (3 | 0.9%), Europe (3 | 0.9%), and Northern Europe (3 | 0.9%), together accounting for 2.6% of all Blandford residents.
| Immigration Origin | # Population | % Population |
| England | 3 | 0.9% |
| Europe | 3 | 0.9% |
| Northern Europe | 3 | 0.9% | View All 3 Rows |
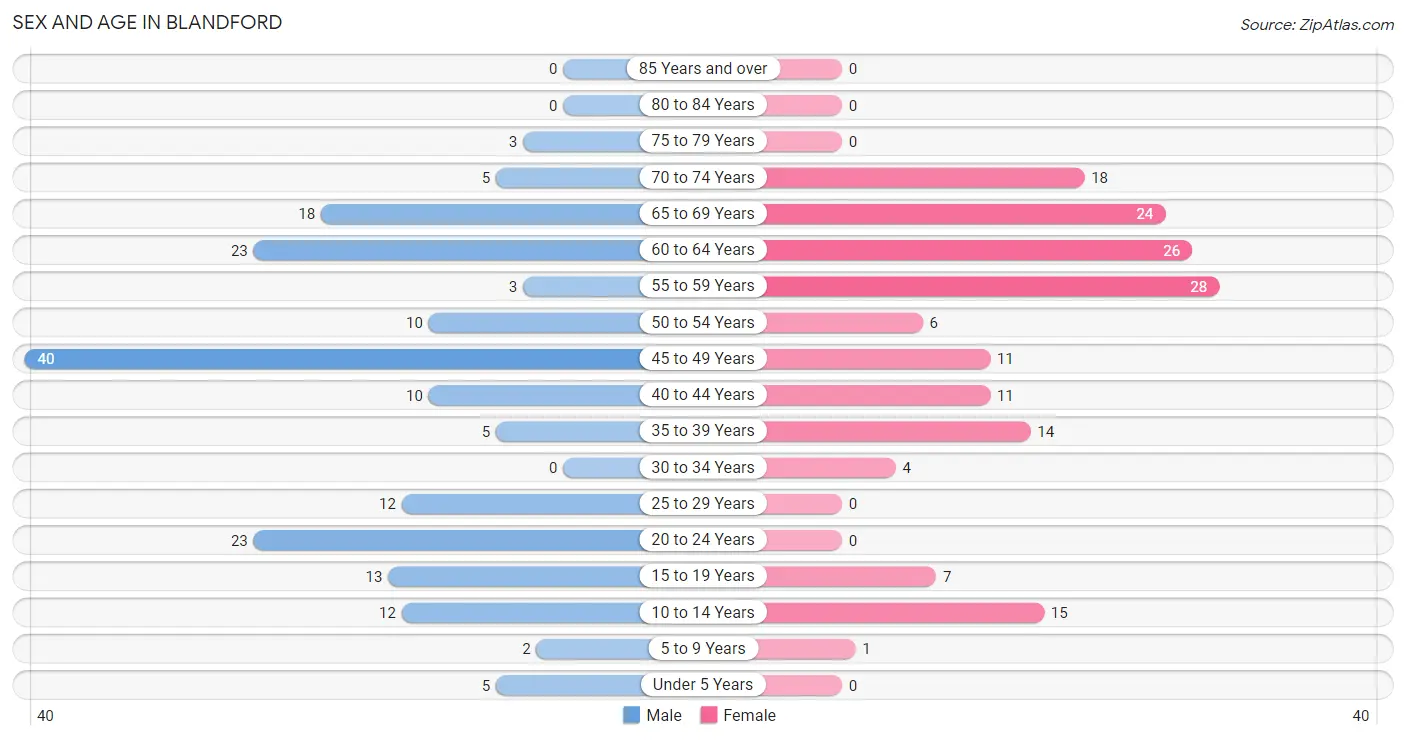
Sex and Age in Blandford
Sex and Age in Blandford
The most populous age groups in Blandford are 45 to 49 Years (40 | 21.7%) for men and 55 to 59 Years (28 | 17.0%) for women.
| Age Bracket | Male | Female |
| Under 5 Years | 5 (2.7%) | 0 (0.0%) |
| 5 to 9 Years | 2 (1.1%) | 1 (0.6%) |
| 10 to 14 Years | 12 (6.5%) | 15 (9.1%) |
| 15 to 19 Years | 13 (7.1%) | 7 (4.2%) |
| 20 to 24 Years | 23 (12.5%) | 0 (0.0%) |
| 25 to 29 Years | 12 (6.5%) | 0 (0.0%) |
| 30 to 34 Years | 0 (0.0%) | 4 (2.4%) |
| 35 to 39 Years | 5 (2.7%) | 14 (8.5%) |
| 40 to 44 Years | 10 (5.4%) | 11 (6.7%) |
| 45 to 49 Years | 40 (21.7%) | 11 (6.7%) |
| 50 to 54 Years | 10 (5.4%) | 6 (3.6%) |
| 55 to 59 Years | 3 (1.6%) | 28 (17.0%) |
| 60 to 64 Years | 23 (12.5%) | 26 (15.8%) |
| 65 to 69 Years | 18 (9.8%) | 24 (14.5%) |
| 70 to 74 Years | 5 (2.7%) | 18 (10.9%) |
| 75 to 79 Years | 3 (1.6%) | 0 (0.0%) |
| 80 to 84 Years | 0 (0.0%) | 0 (0.0%) |
| 85 Years and over | 0 (0.0%) | 0 (0.0%) |
| Total | 184 (100.0%) | 165 (100.0%) |
Families and Households in Blandford
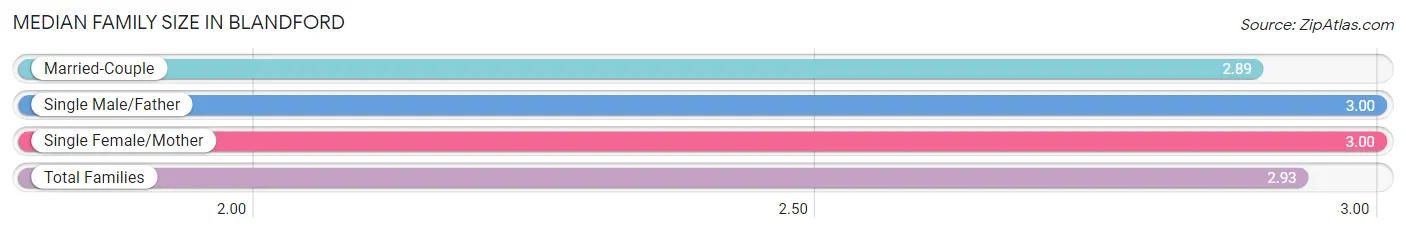
Median Family Size in Blandford
The median family size in Blandford is 2.93 persons per family, with single male/father families (3 | 3.5%) accounting for the largest median family size of 3 persons per family. On the other hand, married-couple families (56 | 65.1%) represent the smallest median family size with 2.89 persons per family.
| Family Type | # Families | Family Size |
| Married-Couple | 56 (65.1%) | 2.89 |
| Single Male/Father | 3 (3.5%) | 3.00 |
| Single Female/Mother | 27 (31.4%) | 3.00 |
| Total Families | 86 (100.0%) | 2.93 |
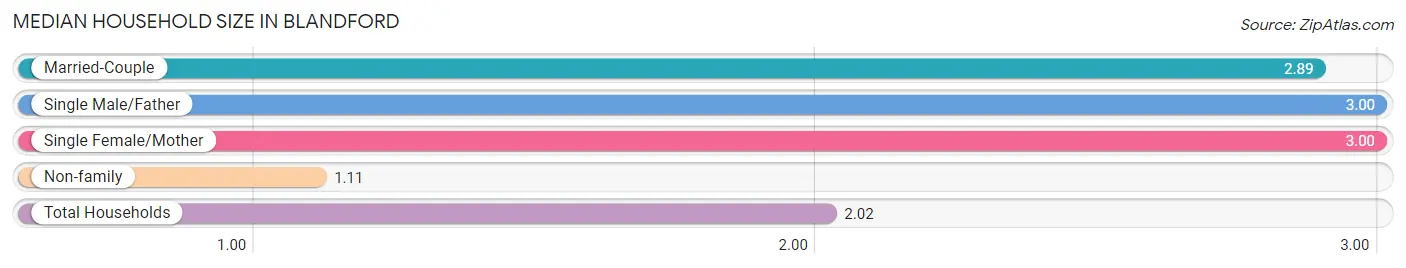
Median Household Size in Blandford
The median household size in Blandford is 2.02 persons per household, with single male/father households (3 | 1.7%) accounting for the largest median household size of 3 persons per household. non-family households (87 | 50.3%) represent the smallest median household size with 1.11 persons per household.
| Household Type | # Households | Household Size |
| Married-Couple | 56 (32.4%) | 2.89 |
| Single Male/Father | 3 (1.7%) | 3.00 |
| Single Female/Mother | 27 (15.6%) | 3.00 |
| Non-family | 87 (50.3%) | 1.11 |
| Total Households | 173 (100.0%) | 2.02 |
Household Size by Marriage Status in Blandford
Out of a total of 173 households in Blandford, 86 (49.7%) are family households, while 87 (50.3%) are nonfamily households. The most numerous type of family households are 2-person households, comprising 37, and the most common type of nonfamily households are 1-person households, comprising 58.
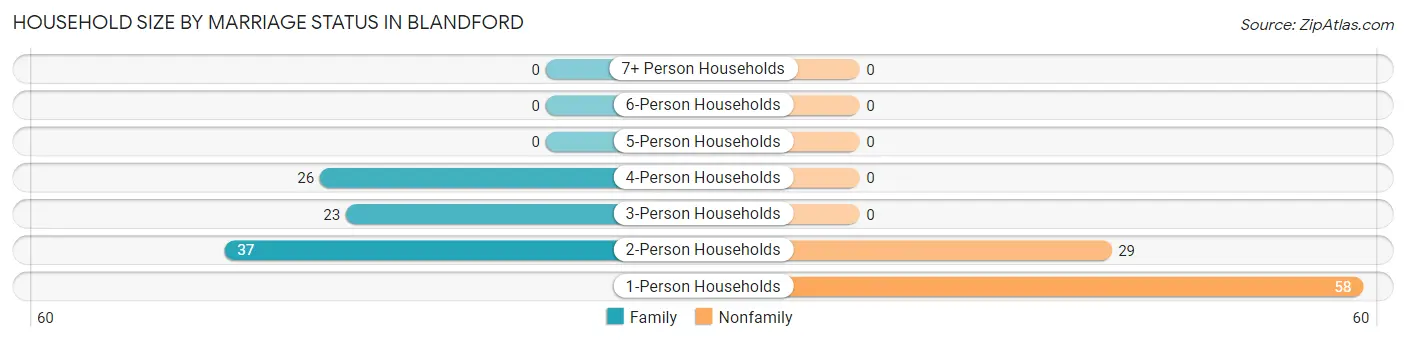
| Household Size | Family Households | Nonfamily Households |
| 1-Person Households | - | 58 (33.5%) |
| 2-Person Households | 37 (21.4%) | 29 (16.8%) |
| 3-Person Households | 23 (13.3%) | 0 (0.0%) |
| 4-Person Households | 26 (15.0%) | 0 (0.0%) |
| 5-Person Households | 0 (0.0%) | 0 (0.0%) |
| 6-Person Households | 0 (0.0%) | 0 (0.0%) |
| 7+ Person Households | 0 (0.0%) | 0 (0.0%) |
| Total | 86 (49.7%) | 87 (50.3%) |
Female Fertility in Blandford
Fertility by Age in Blandford
| Age Bracket | Women with Births | Births / 1,000 Women |
| 15 to 19 years | 0 (0.0%) | 0.0 |
| 20 to 34 years | 0 (0.0%) | 0.0 |
| 35 to 50 years | 0 (0.0%) | 0.0 |
| Total | 0 (0.0%) | 0.0 |
Fertility by Age by Marriage Status in Blandford
| Age Bracket | Married | Unmarried |
| 15 to 19 years | 0 (0.0%) | 0 (0.0%) |
| 20 to 34 years | 0 (0.0%) | 0 (0.0%) |
| 35 to 50 years | 0 (0.0%) | 0 (0.0%) |
| Total | 0 (0.0%) | 0 (0.0%) |
Fertility by Education in Blandford
| Educational Attainment | Women with Births | Births / 1,000 Women |
| Less than High School | 0 (0.0%) | 0.0 |
| High School Diploma | 0 (0.0%) | 0.0 |
| College or Associate's Degree | 0 (0.0%) | 0.0 |
| Bachelor's Degree | 0 (0.0%) | 0.0 |
| Graduate Degree | 0 (0.0%) | 0.0 |
| Total | 0 (0.0%) | 0.0 |
Fertility by Education by Marriage Status in Blandford
| Educational Attainment | Married | Unmarried |
| Less than High School | 0 (0.0%) | 0 (0.0%) |
| High School Diploma | 0 (0.0%) | 0 (0.0%) |
| College or Associate's Degree | 0 (0.0%) | 0 (0.0%) |
| Bachelor's Degree | 0 (0.0%) | 0 (0.0%) |
| Graduate Degree | 0 (0.0%) | 0 (0.0%) |
| Total | 0 (0.0%) | 0 (0.0%) |
Employment Characteristics in Blandford
Employment by Class of Employer in Blandford
Among the 176 employed individuals in Blandford, private company employees (109 | 61.9%), local government employees (18 | 10.2%), and not-for-profit organizations (16 | 9.1%) make up the most common classes of employment.
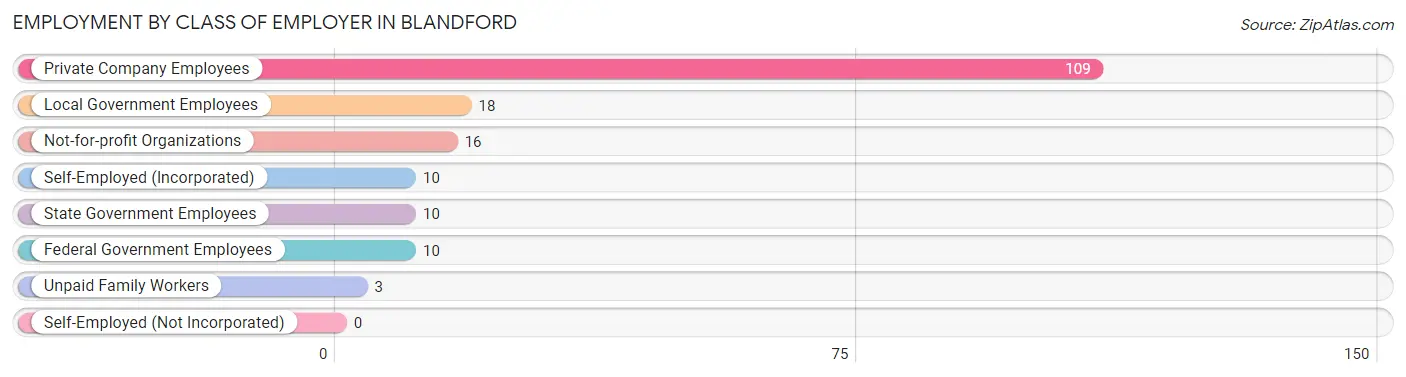
| Employer Class | # Employees | % Employees |
| Private Company Employees | 109 | 61.9% |
| Self-Employed (Incorporated) | 10 | 5.7% |
| Self-Employed (Not Incorporated) | 0 | 0.0% |
| Not-for-profit Organizations | 16 | 9.1% |
| Local Government Employees | 18 | 10.2% |
| State Government Employees | 10 | 5.7% |
| Federal Government Employees | 10 | 5.7% |
| Unpaid Family Workers | 3 | 1.7% |
| Total | 176 | 100.0% |
Employment Status by Age in Blandford
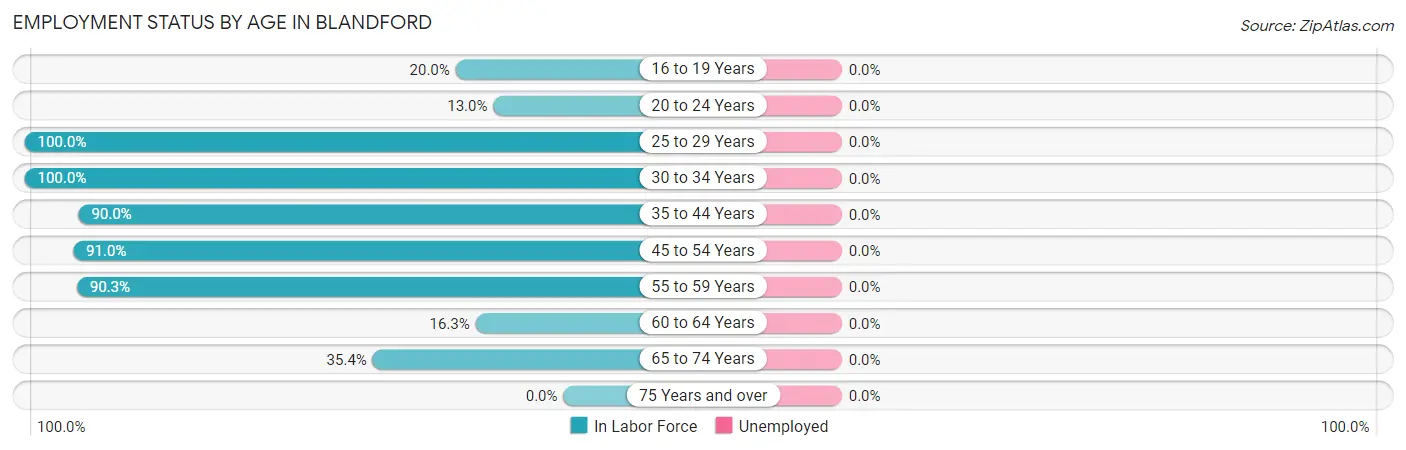
| Age Bracket | In Labor Force | Unemployed |
| 16 to 19 Years | 3 (20.0%) | 0 (0.0%) |
| 20 to 24 Years | 3 (13.0%) | 0 (0.0%) |
| 25 to 29 Years | 12 (100.0%) | 0 (0.0%) |
| 30 to 34 Years | 4 (100.0%) | 0 (0.0%) |
| 35 to 44 Years | 36 (90.0%) | 0 (0.0%) |
| 45 to 54 Years | 61 (91.0%) | 0 (0.0%) |
| 55 to 59 Years | 28 (90.3%) | 0 (0.0%) |
| 60 to 64 Years | 8 (16.3%) | 0 (0.0%) |
| 65 to 74 Years | 23 (35.4%) | 0 (0.0%) |
| 75 Years and over | 0 (0.0%) | 0 (0.0%) |
| Total | 178 (57.6%) | 0 (0.0%) |
Employment Status by Educational Attainment in Blandford
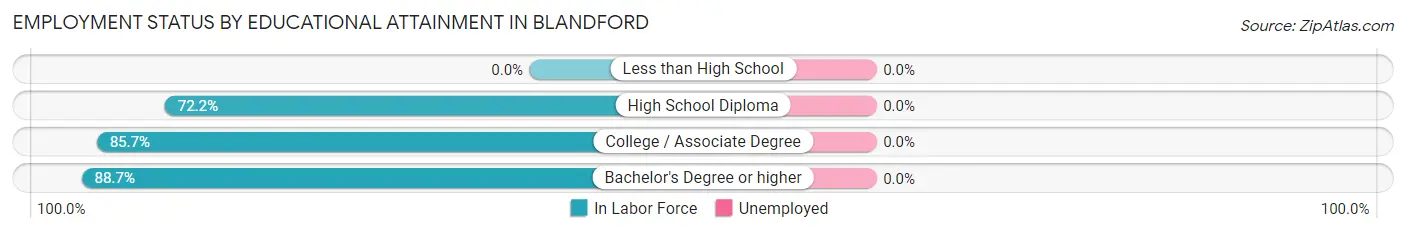
| Educational Attainment | In Labor Force | Unemployed |
| Less than High School | 0 (0.0%) | 0 (0.0%) |
| High School Diploma | 52 (72.2%) | 0 (0.0%) |
| College / Associate Degree | 42 (85.7%) | 0 (0.0%) |
| Bachelor's Degree or higher | 55 (88.7%) | 0 (0.0%) |
| Total | 149 (73.4%) | 0 (0.0%) |
Employment Occupations by Sex in Blandford
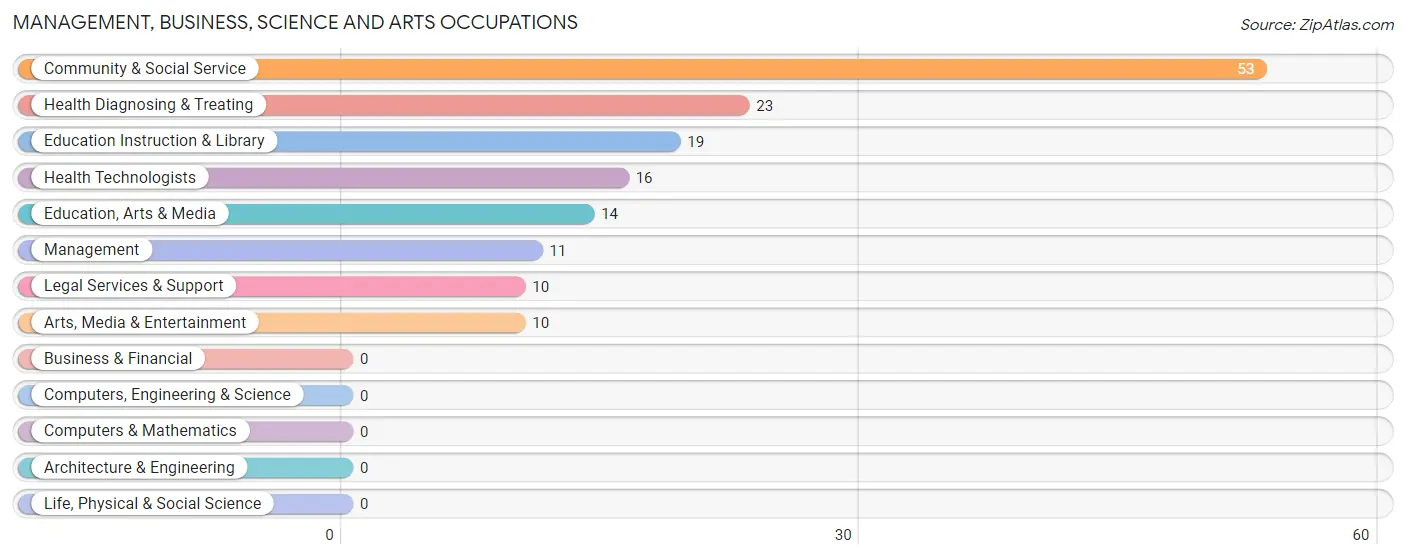
Management, Business, Science and Arts Occupations
The most common Management, Business, Science and Arts occupations in Blandford are Community & Social Service (53 | 29.8%), Health Diagnosing & Treating (23 | 12.9%), Education Instruction & Library (19 | 10.7%), Health Technologists (16 | 9.0%), and Education, Arts & Media (14 | 7.9%).
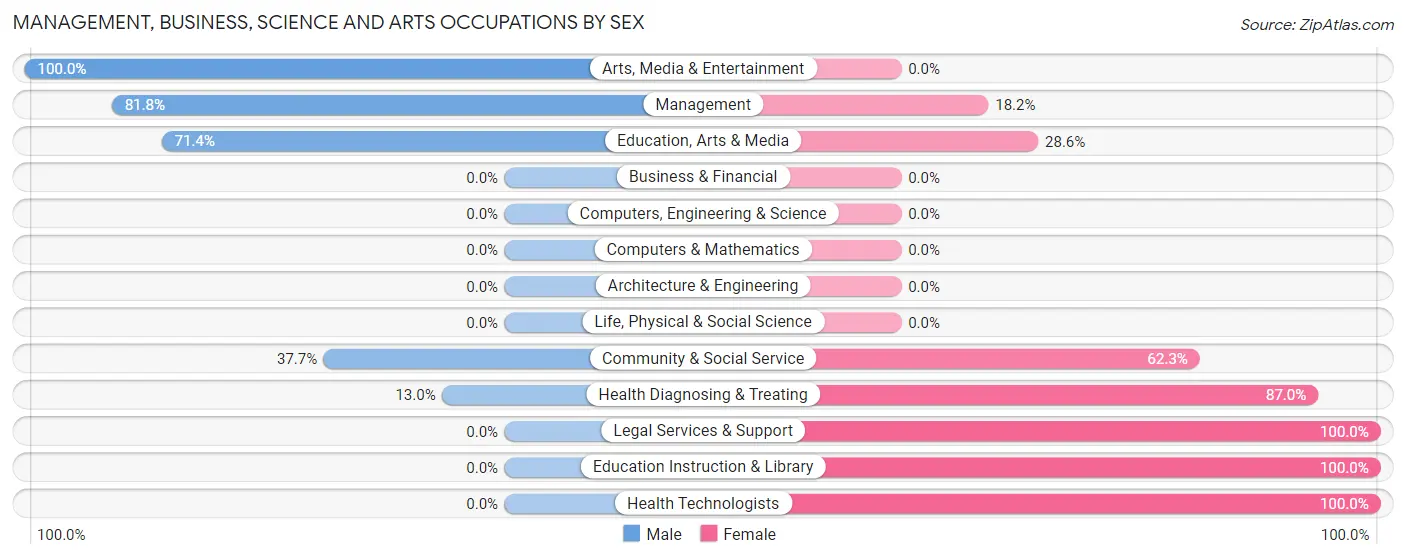
Management, Business, Science and Arts Occupations by Sex
Within the Management, Business, Science and Arts occupations in Blandford, the most male-oriented occupations are Arts, Media & Entertainment (100.0%), Management (81.8%), and Education, Arts & Media (71.4%), while the most female-oriented occupations are Legal Services & Support (100.0%), Education Instruction & Library (100.0%), and Health Technologists (100.0%).
| Occupation | Male | Female |
| Management | 9 (81.8%) | 2 (18.2%) |
| Business & Financial | 0 (0.0%) | 0 (0.0%) |
| Computers, Engineering & Science | 0 (0.0%) | 0 (0.0%) |
| Computers & Mathematics | 0 (0.0%) | 0 (0.0%) |
| Architecture & Engineering | 0 (0.0%) | 0 (0.0%) |
| Life, Physical & Social Science | 0 (0.0%) | 0 (0.0%) |
| Community & Social Service | 20 (37.7%) | 33 (62.3%) |
| Education, Arts & Media | 10 (71.4%) | 4 (28.6%) |
| Legal Services & Support | 0 (0.0%) | 10 (100.0%) |
| Education Instruction & Library | 0 (0.0%) | 19 (100.0%) |
| Arts, Media & Entertainment | 10 (100.0%) | 0 (0.0%) |
| Health Diagnosing & Treating | 3 (13.0%) | 20 (87.0%) |
| Health Technologists | 0 (0.0%) | 16 (100.0%) |
| Total (Category) | 32 (36.8%) | 55 (63.2%) |
| Total (Overall) | 97 (54.5%) | 81 (45.5%) |
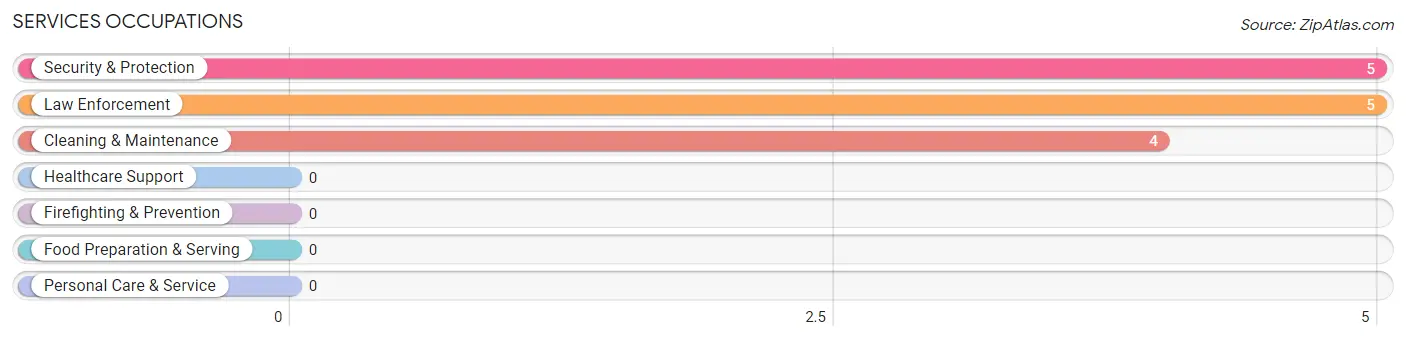
Services Occupations
The most common Services occupations in Blandford are Security & Protection (5 | 2.8%), Law Enforcement (5 | 2.8%), and Cleaning & Maintenance (4 | 2.2%).
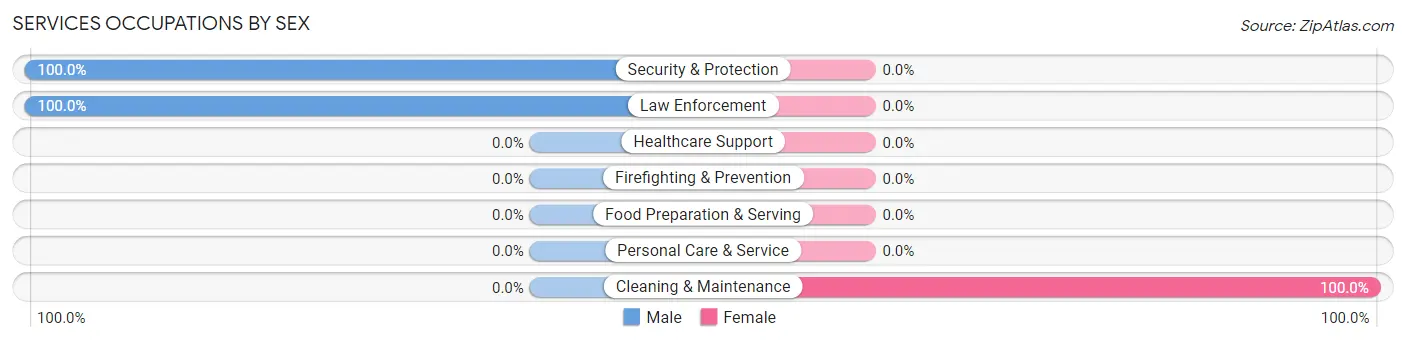
Services Occupations by Sex
| Occupation | Male | Female |
| Healthcare Support | 0 (0.0%) | 0 (0.0%) |
| Security & Protection | 5 (100.0%) | 0 (0.0%) |
| Firefighting & Prevention | 0 (0.0%) | 0 (0.0%) |
| Law Enforcement | 5 (100.0%) | 0 (0.0%) |
| Food Preparation & Serving | 0 (0.0%) | 0 (0.0%) |
| Cleaning & Maintenance | 0 (0.0%) | 4 (100.0%) |
| Personal Care & Service | 0 (0.0%) | 0 (0.0%) |
| Total (Category) | 5 (55.6%) | 4 (44.4%) |
| Total (Overall) | 97 (54.5%) | 81 (45.5%) |
Sales and Office Occupations
The most common Sales and Office occupations in Blandford are , and Sales & Related (22 | 12.4%).
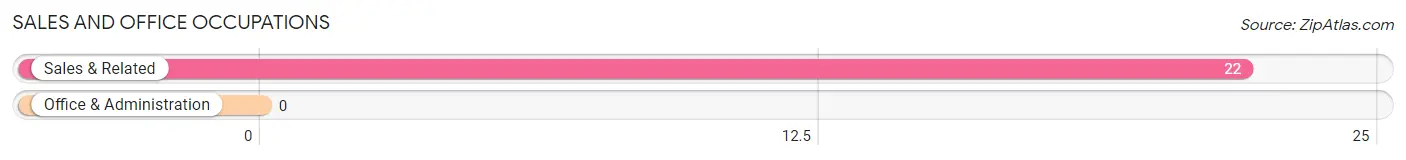
Sales and Office Occupations by Sex
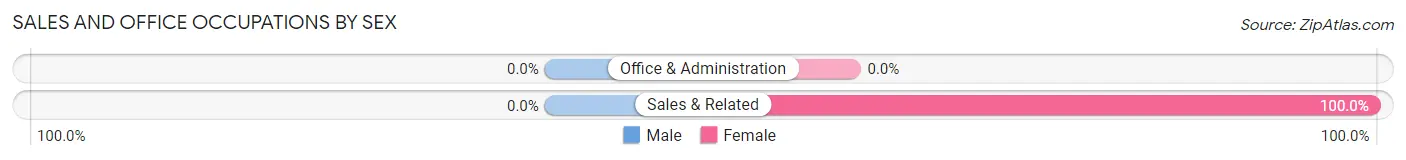
| Occupation | Male | Female |
| Sales & Related | 0 (0.0%) | 22 (100.0%) |
| Office & Administration | 0 (0.0%) | 0 (0.0%) |
| Total (Category) | 0 (0.0%) | 22 (100.0%) |
| Total (Overall) | 97 (54.5%) | 81 (45.5%) |
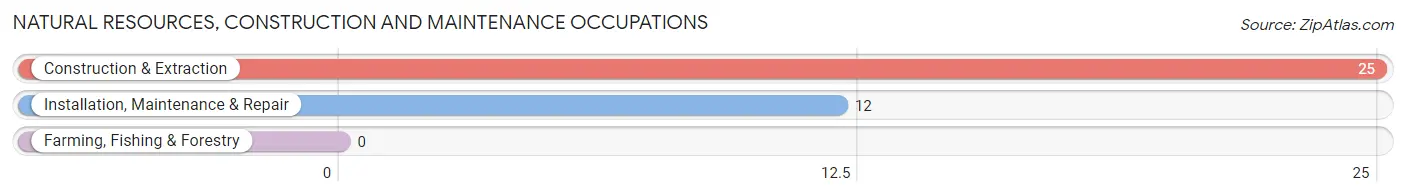
Natural Resources, Construction and Maintenance Occupations
The most common Natural Resources, Construction and Maintenance occupations in Blandford are Construction & Extraction (25 | 14.0%), and Installation, Maintenance & Repair (12 | 6.7%).
Natural Resources, Construction and Maintenance Occupations by Sex
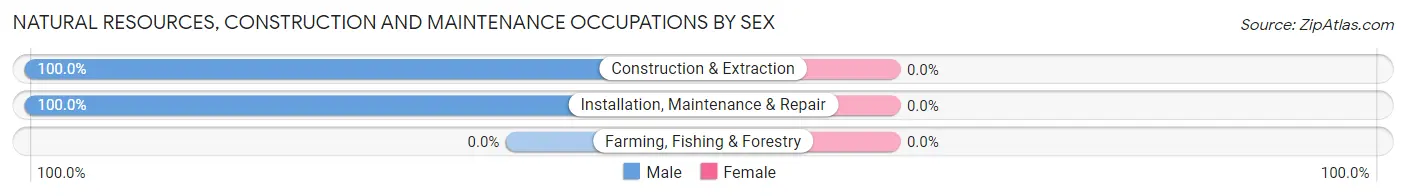
| Occupation | Male | Female |
| Farming, Fishing & Forestry | 0 (0.0%) | 0 (0.0%) |
| Construction & Extraction | 25 (100.0%) | 0 (0.0%) |
| Installation, Maintenance & Repair | 12 (100.0%) | 0 (0.0%) |
| Total (Category) | 37 (100.0%) | 0 (0.0%) |
| Total (Overall) | 97 (54.5%) | 81 (45.5%) |
Production, Transportation and Moving Occupations
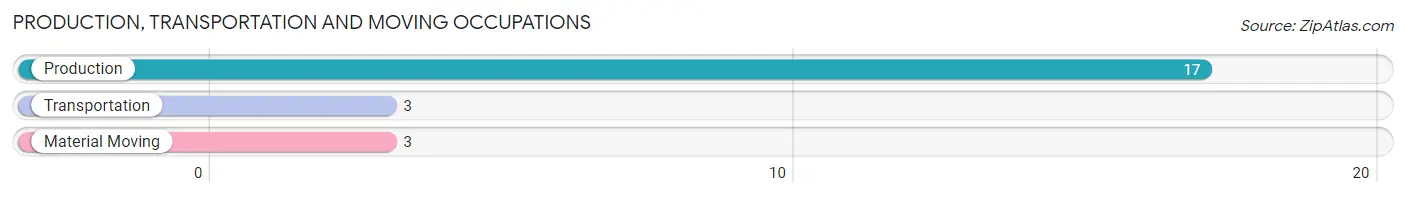
The most common Production, Transportation and Moving occupations in Blandford are Production (17 | 9.6%), Transportation (3 | 1.7%), and Material Moving (3 | 1.7%).
Production, Transportation and Moving Occupations by Sex
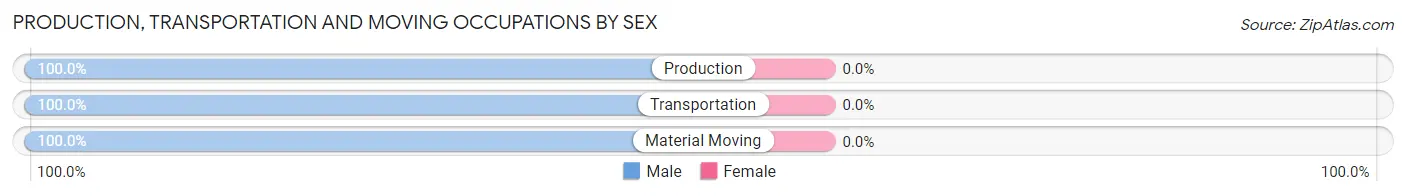
| Occupation | Male | Female |
| Production | 17 (100.0%) | 0 (0.0%) |
| Transportation | 3 (100.0%) | 0 (0.0%) |
| Material Moving | 3 (100.0%) | 0 (0.0%) |
| Total (Category) | 23 (100.0%) | 0 (0.0%) |
| Total (Overall) | 97 (54.5%) | 81 (45.5%) |
Employment Industries by Sex in Blandford
Employment Industries in Blandford
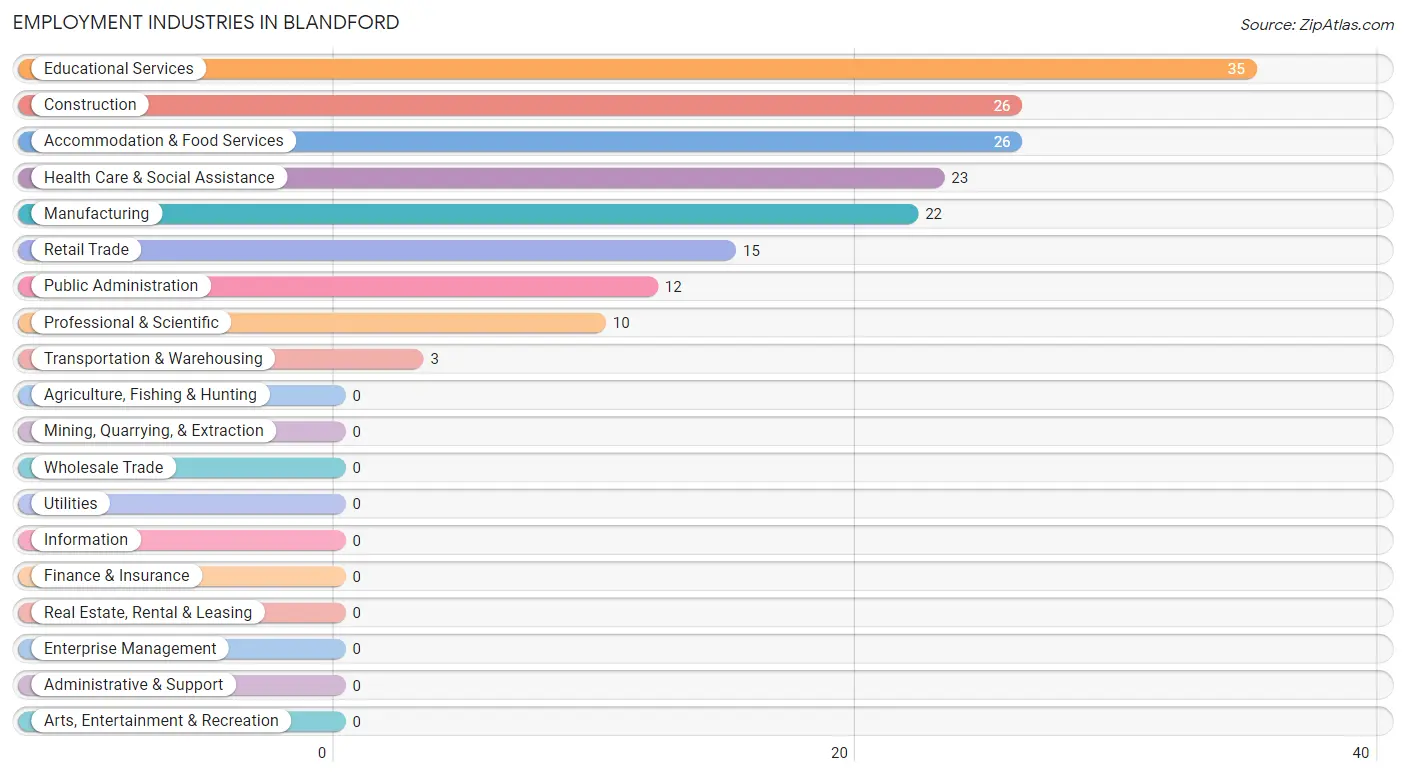
The major employment industries in Blandford include Educational Services (35 | 19.7%), Construction (26 | 14.6%), Accommodation & Food Services (26 | 14.6%), Health Care & Social Assistance (23 | 12.9%), and Manufacturing (22 | 12.4%).
Employment Industries by Sex in Blandford
The Blandford industries that see more men than women are Construction (100.0%), Manufacturing (100.0%), and Transportation & Warehousing (100.0%), whereas the industries that tend to have a higher number of women are Professional & Scientific (100.0%), Accommodation & Food Services (100.0%), and Health Care & Social Assistance (78.3%).
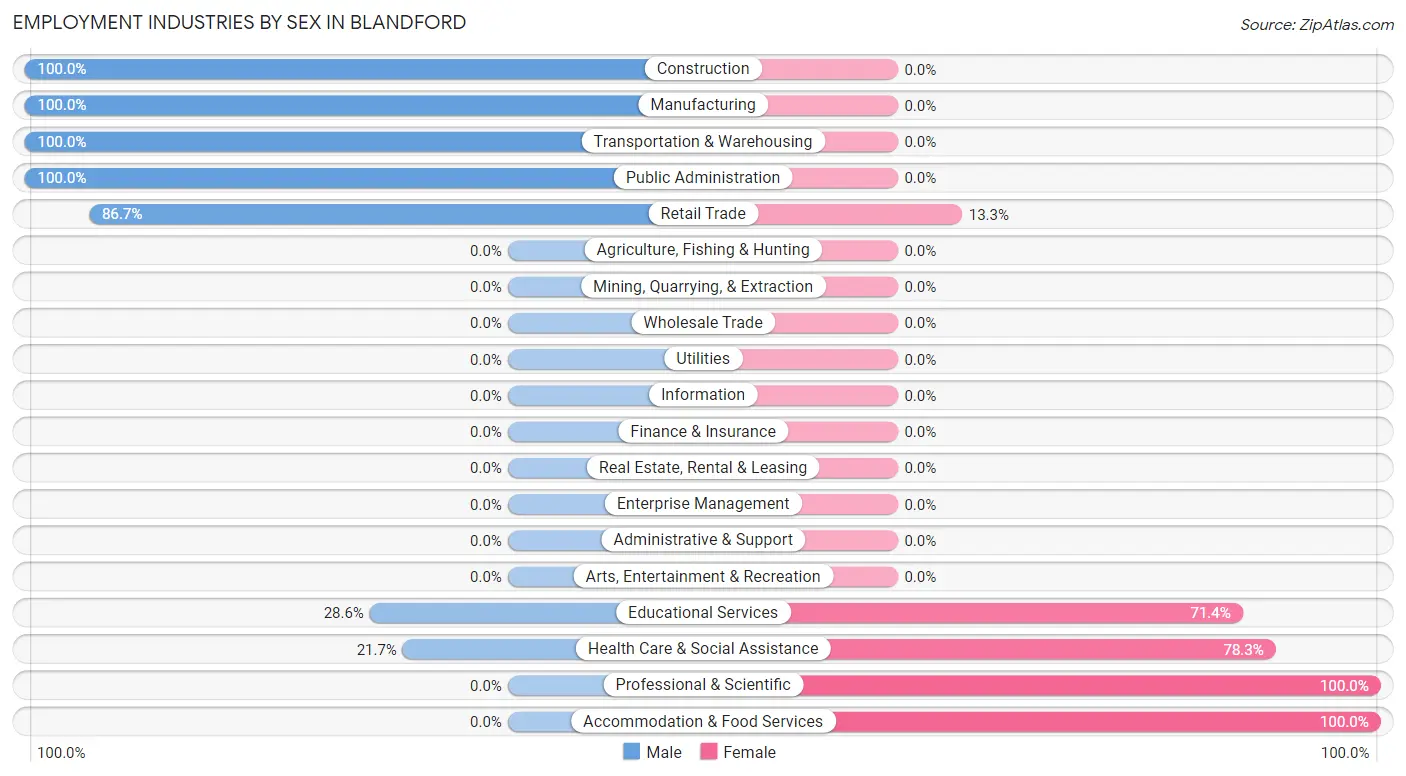
| Industry | Male | Female |
| Agriculture, Fishing & Hunting | 0 (0.0%) | 0 (0.0%) |
| Mining, Quarrying, & Extraction | 0 (0.0%) | 0 (0.0%) |
| Construction | 26 (100.0%) | 0 (0.0%) |
| Manufacturing | 22 (100.0%) | 0 (0.0%) |
| Wholesale Trade | 0 (0.0%) | 0 (0.0%) |
| Retail Trade | 13 (86.7%) | 2 (13.3%) |
| Transportation & Warehousing | 3 (100.0%) | 0 (0.0%) |
| Utilities | 0 (0.0%) | 0 (0.0%) |
| Information | 0 (0.0%) | 0 (0.0%) |
| Finance & Insurance | 0 (0.0%) | 0 (0.0%) |
| Real Estate, Rental & Leasing | 0 (0.0%) | 0 (0.0%) |
| Professional & Scientific | 0 (0.0%) | 10 (100.0%) |
| Enterprise Management | 0 (0.0%) | 0 (0.0%) |
| Administrative & Support | 0 (0.0%) | 0 (0.0%) |
| Educational Services | 10 (28.6%) | 25 (71.4%) |
| Health Care & Social Assistance | 5 (21.7%) | 18 (78.3%) |
| Arts, Entertainment & Recreation | 0 (0.0%) | 0 (0.0%) |
| Accommodation & Food Services | 0 (0.0%) | 26 (100.0%) |
| Public Administration | 12 (100.0%) | 0 (0.0%) |
| Total | 97 (54.5%) | 81 (45.5%) |
Education in Blandford
School Enrollment in Blandford
The most common levels of schooling among the 50 students in Blandford are high school (28 | 56.0%), middle school (12 | 24.0%), and elementary school (7 | 14.0%).
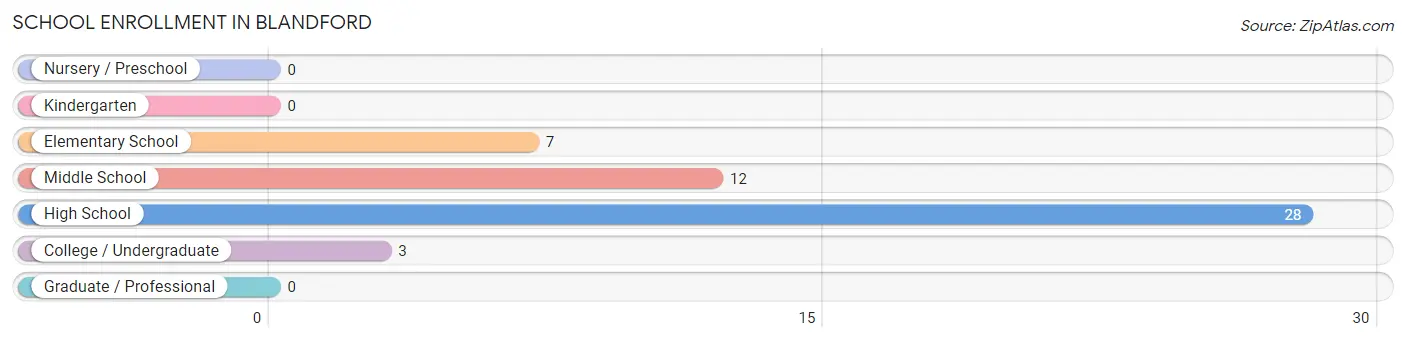
| School Level | # Students | % Students |
| Nursery / Preschool | 0 | 0.0% |
| Kindergarten | 0 | 0.0% |
| Elementary School | 7 | 14.0% |
| Middle School | 12 | 24.0% |
| High School | 28 | 56.0% |
| College / Undergraduate | 3 | 6.0% |
| Graduate / Professional | 0 | 0.0% |
| Total | 50 | 100.0% |
School Enrollment by Age by Funding Source in Blandford
Out of a total of 50 students who are enrolled in schools in Blandford, 31 (62.0%) attend a private institution, while the remaining 19 (38.0%) are enrolled in public schools. The age group of 10 to 14 year olds has the highest likelihood of being enrolled in private schools, with 23 (85.2% in the age bracket) enrolled. Conversely, the age group of 5 to 9 year old has the lowest likelihood of being enrolled in a private school, with 3 (100.0% in the age bracket) attending a public institution.
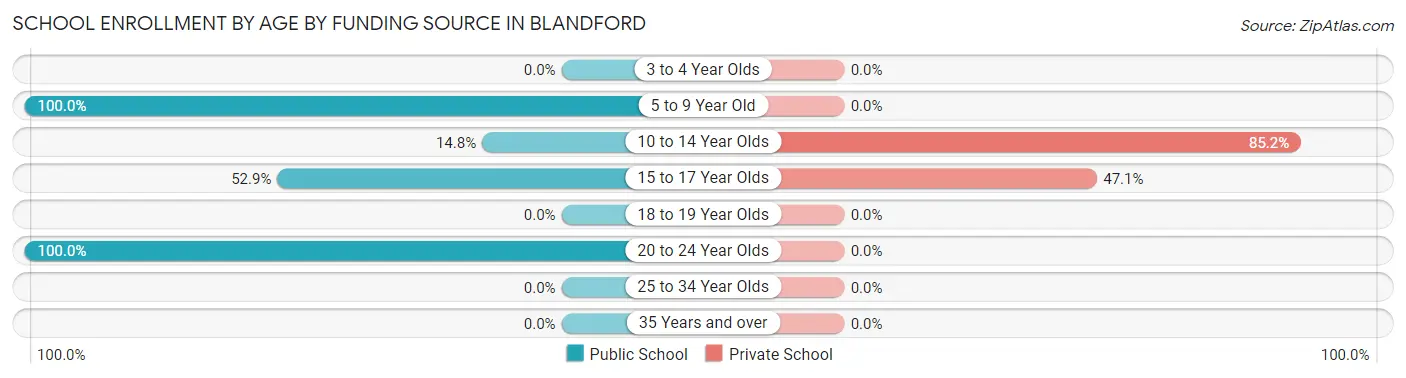
| Age Bracket | Public School | Private School |
| 3 to 4 Year Olds | 0 (0.0%) | 0 (0.0%) |
| 5 to 9 Year Old | 3 (100.0%) | 0 (0.0%) |
| 10 to 14 Year Olds | 4 (14.8%) | 23 (85.2%) |
| 15 to 17 Year Olds | 9 (52.9%) | 8 (47.1%) |
| 18 to 19 Year Olds | 0 (0.0%) | 0 (0.0%) |
| 20 to 24 Year Olds | 3 (100.0%) | 0 (0.0%) |
| 25 to 34 Year Olds | 0 (0.0%) | 0 (0.0%) |
| 35 Years and over | 0 (0.0%) | 0 (0.0%) |
| Total | 19 (38.0%) | 31 (62.0%) |
Educational Attainment by Field of Study in Blandford
Science & technology (25 | 25.5%), psychology (14 | 14.3%), social sciences (10 | 10.2%), visual & performing arts (10 | 10.2%), and education (8 | 8.2%) are the most common fields of study among 98 individuals in Blandford who have obtained a bachelor's degree or higher.
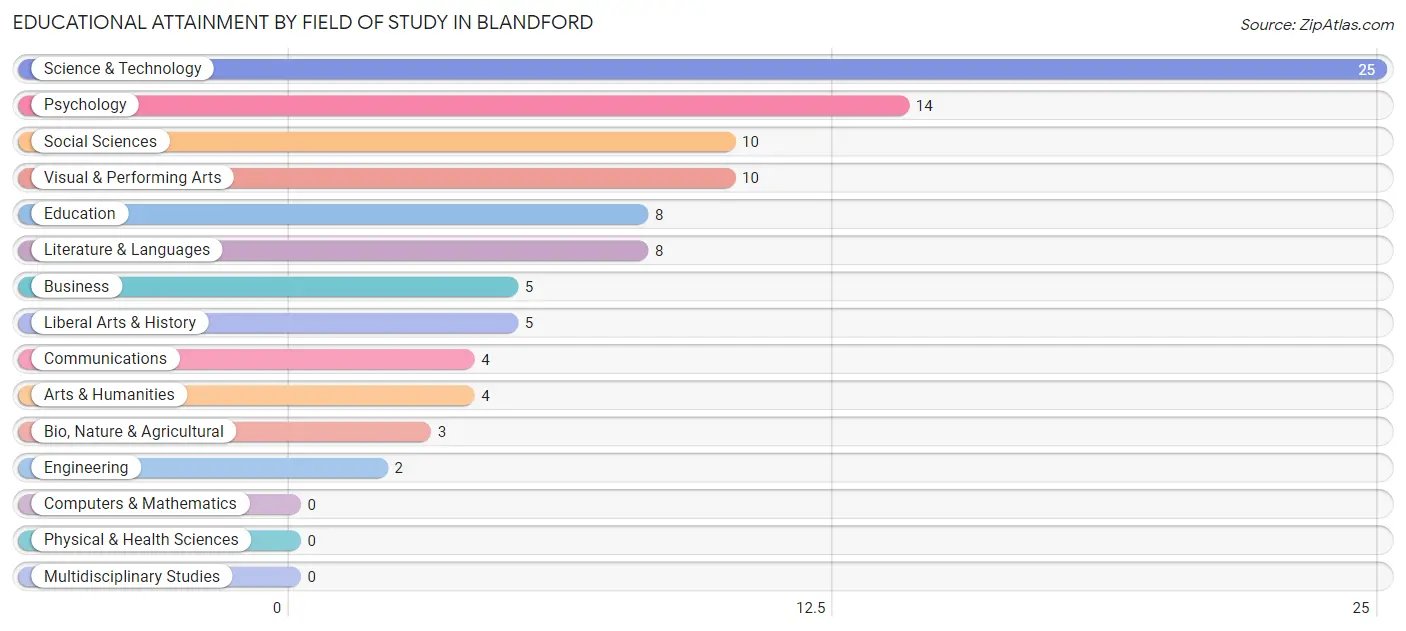
| Field of Study | # Graduates | % Graduates |
| Computers & Mathematics | 0 | 0.0% |
| Bio, Nature & Agricultural | 3 | 3.1% |
| Physical & Health Sciences | 0 | 0.0% |
| Psychology | 14 | 14.3% |
| Social Sciences | 10 | 10.2% |
| Engineering | 2 | 2.0% |
| Multidisciplinary Studies | 0 | 0.0% |
| Science & Technology | 25 | 25.5% |
| Business | 5 | 5.1% |
| Education | 8 | 8.2% |
| Literature & Languages | 8 | 8.2% |
| Liberal Arts & History | 5 | 5.1% |
| Visual & Performing Arts | 10 | 10.2% |
| Communications | 4 | 4.1% |
| Arts & Humanities | 4 | 4.1% |
| Total | 98 | 100.0% |
Transportation & Commute in Blandford
Vehicle Availability by Sex in Blandford
The most prevalent vehicle ownership categories in Blandford are males with 1 vehicle (30, accounting for 31.6%) and females with 1 vehicle (22, making up 37.0%).
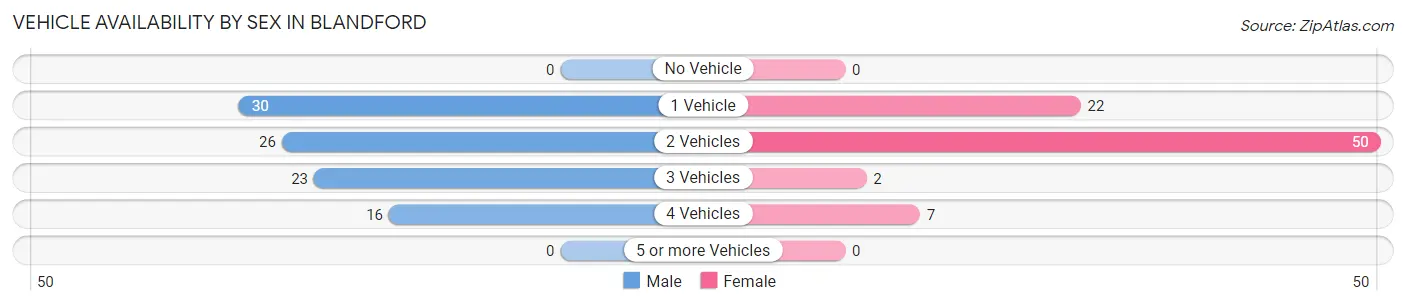
| Vehicles Available | Male | Female |
| No Vehicle | 0 (0.0%) | 0 (0.0%) |
| 1 Vehicle | 30 (31.6%) | 22 (27.2%) |
| 2 Vehicles | 26 (27.4%) | 50 (61.7%) |
| 3 Vehicles | 23 (24.2%) | 2 (2.5%) |
| 4 Vehicles | 16 (16.8%) | 7 (8.6%) |
| 5 or more Vehicles | 0 (0.0%) | 0 (0.0%) |
| Total | 95 (100.0%) | 81 (100.0%) |
Commute Time in Blandford
The most frequently occuring commute durations in Blandford are 30 to 34 minutes (40 commuters, 22.7%), 15 to 19 minutes (38 commuters, 21.6%), and 45 to 59 minutes (35 commuters, 19.9%).
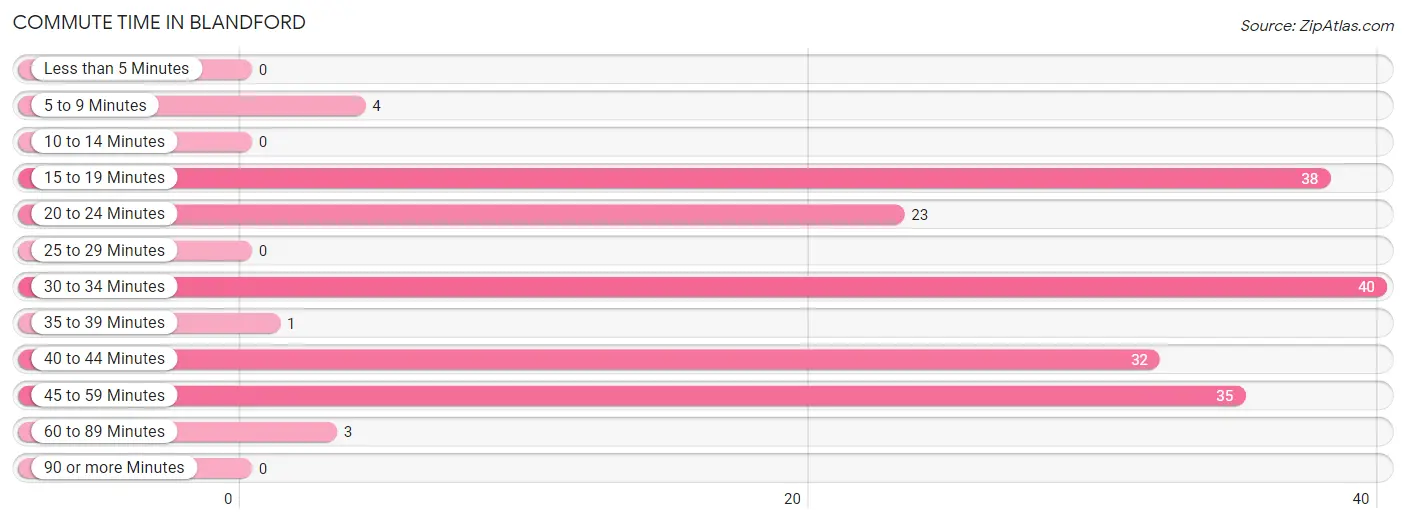
| Commute Time | # Commuters | % Commuters |
| Less than 5 Minutes | 0 | 0.0% |
| 5 to 9 Minutes | 4 | 2.3% |
| 10 to 14 Minutes | 0 | 0.0% |
| 15 to 19 Minutes | 38 | 21.6% |
| 20 to 24 Minutes | 23 | 13.1% |
| 25 to 29 Minutes | 0 | 0.0% |
| 30 to 34 Minutes | 40 | 22.7% |
| 35 to 39 Minutes | 1 | 0.6% |
| 40 to 44 Minutes | 32 | 18.2% |
| 45 to 59 Minutes | 35 | 19.9% |
| 60 to 89 Minutes | 3 | 1.7% |
| 90 or more Minutes | 0 | 0.0% |
Commute Time by Sex in Blandford
The most common commute times in Blandford are 45 to 59 minutes (29 commuters, 30.5%) for males and 40 to 44 minutes (22 commuters, 27.2%) for females.
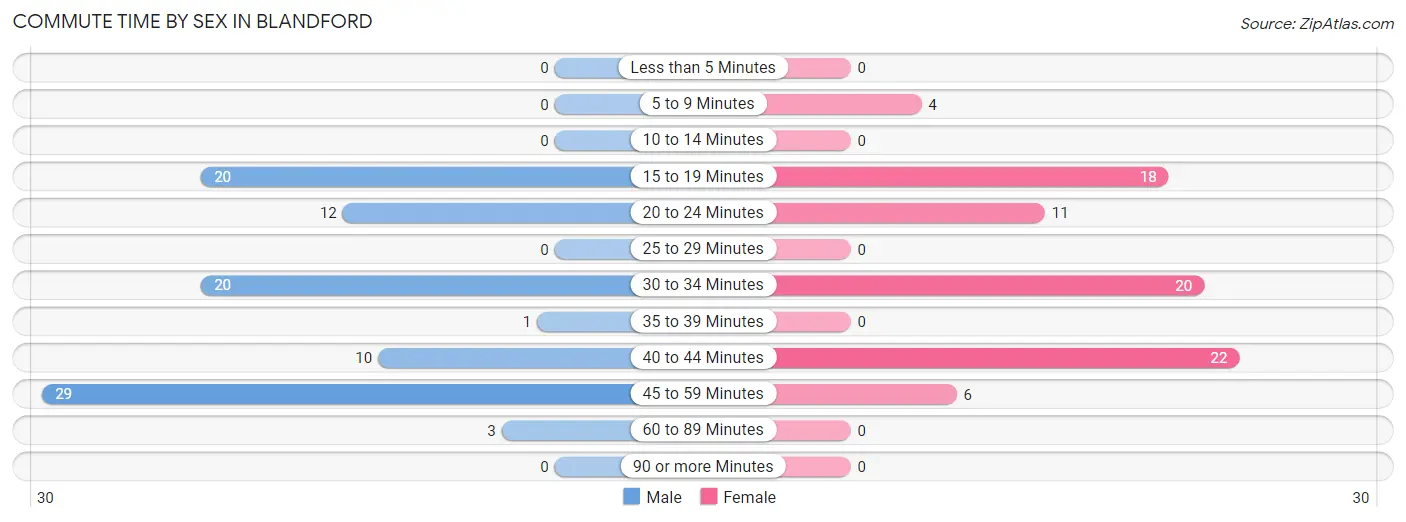
| Commute Time | Male | Female |
| Less than 5 Minutes | 0 (0.0%) | 0 (0.0%) |
| 5 to 9 Minutes | 0 (0.0%) | 4 (4.9%) |
| 10 to 14 Minutes | 0 (0.0%) | 0 (0.0%) |
| 15 to 19 Minutes | 20 (21.0%) | 18 (22.2%) |
| 20 to 24 Minutes | 12 (12.6%) | 11 (13.6%) |
| 25 to 29 Minutes | 0 (0.0%) | 0 (0.0%) |
| 30 to 34 Minutes | 20 (21.0%) | 20 (24.7%) |
| 35 to 39 Minutes | 1 (1.1%) | 0 (0.0%) |
| 40 to 44 Minutes | 10 (10.5%) | 22 (27.2%) |
| 45 to 59 Minutes | 29 (30.5%) | 6 (7.4%) |
| 60 to 89 Minutes | 3 (3.2%) | 0 (0.0%) |
| 90 or more Minutes | 0 (0.0%) | 0 (0.0%) |
Time of Departure to Work by Sex in Blandford
The most frequent times of departure to work in Blandford are 7:00 AM to 7:29 AM (44, 46.3%) for males and 6:30 AM to 6:59 AM (40, 49.4%) for females.
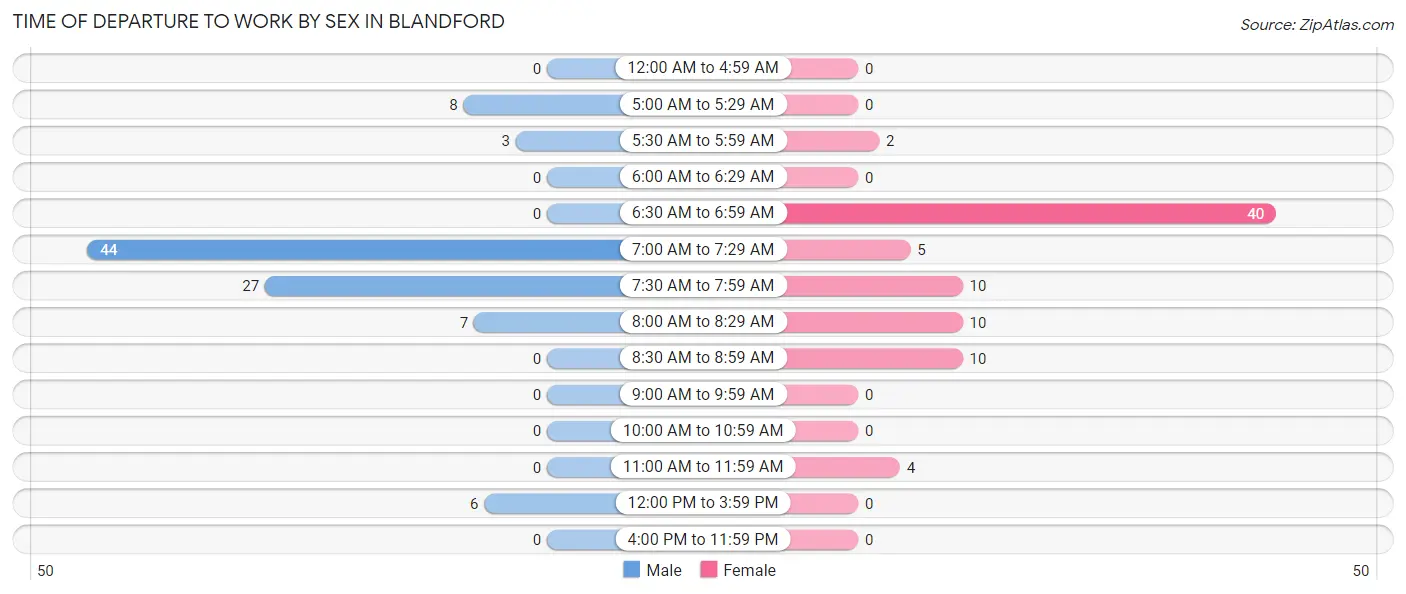
| Time of Departure | Male | Female |
| 12:00 AM to 4:59 AM | 0 (0.0%) | 0 (0.0%) |
| 5:00 AM to 5:29 AM | 8 (8.4%) | 0 (0.0%) |
| 5:30 AM to 5:59 AM | 3 (3.2%) | 2 (2.5%) |
| 6:00 AM to 6:29 AM | 0 (0.0%) | 0 (0.0%) |
| 6:30 AM to 6:59 AM | 0 (0.0%) | 40 (49.4%) |
| 7:00 AM to 7:29 AM | 44 (46.3%) | 5 (6.2%) |
| 7:30 AM to 7:59 AM | 27 (28.4%) | 10 (12.3%) |
| 8:00 AM to 8:29 AM | 7 (7.4%) | 10 (12.3%) |
| 8:30 AM to 8:59 AM | 0 (0.0%) | 10 (12.3%) |
| 9:00 AM to 9:59 AM | 0 (0.0%) | 0 (0.0%) |
| 10:00 AM to 10:59 AM | 0 (0.0%) | 0 (0.0%) |
| 11:00 AM to 11:59 AM | 0 (0.0%) | 4 (4.9%) |
| 12:00 PM to 3:59 PM | 6 (6.3%) | 0 (0.0%) |
| 4:00 PM to 11:59 PM | 0 (0.0%) | 0 (0.0%) |
| Total | 95 (100.0%) | 81 (100.0%) |
Housing Occupancy in Blandford
Occupancy by Ownership in Blandford
Of the total 173 dwellings in Blandford, owner-occupied units account for 163 (94.2%), while renter-occupied units make up 10 (5.8%).
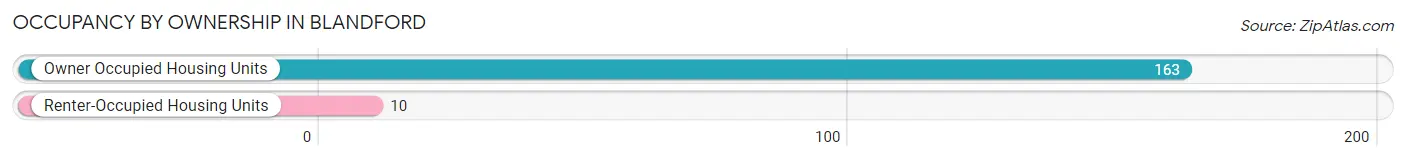
| Occupancy | # Housing Units | % Housing Units |
| Owner Occupied Housing Units | 163 | 94.2% |
| Renter-Occupied Housing Units | 10 | 5.8% |
| Total Occupied Housing Units | 173 | 100.0% |
Occupancy by Household Size in Blandford
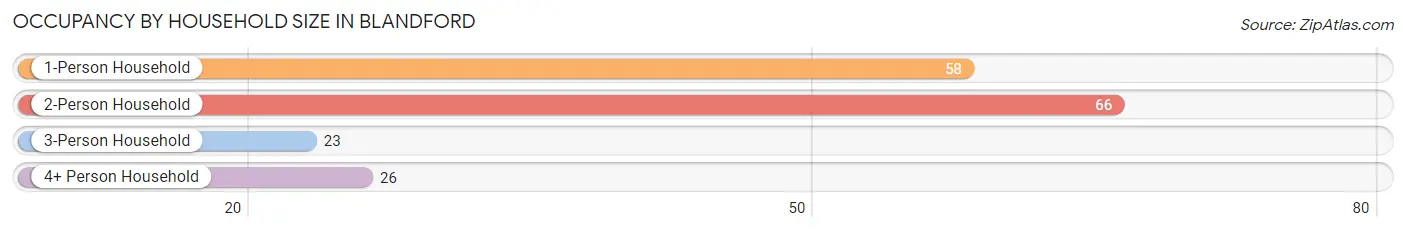
| Household Size | # Housing Units | % Housing Units |
| 1-Person Household | 58 | 33.5% |
| 2-Person Household | 66 | 38.2% |
| 3-Person Household | 23 | 13.3% |
| 4+ Person Household | 26 | 15.0% |
| Total Housing Units | 173 | 100.0% |
Occupancy by Ownership by Household Size in Blandford
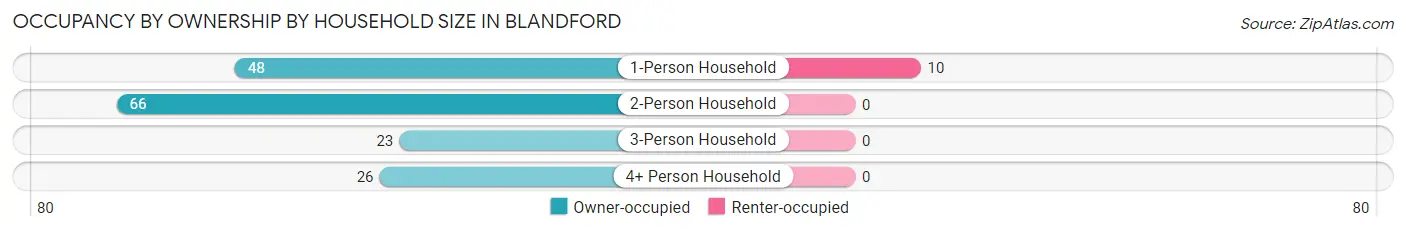
| Household Size | Owner-occupied | Renter-occupied |
| 1-Person Household | 48 (82.8%) | 10 (17.2%) |
| 2-Person Household | 66 (100.0%) | 0 (0.0%) |
| 3-Person Household | 23 (100.0%) | 0 (0.0%) |
| 4+ Person Household | 26 (100.0%) | 0 (0.0%) |
| Total Housing Units | 163 (94.2%) | 10 (5.8%) |
Occupancy by Educational Attainment in Blandford
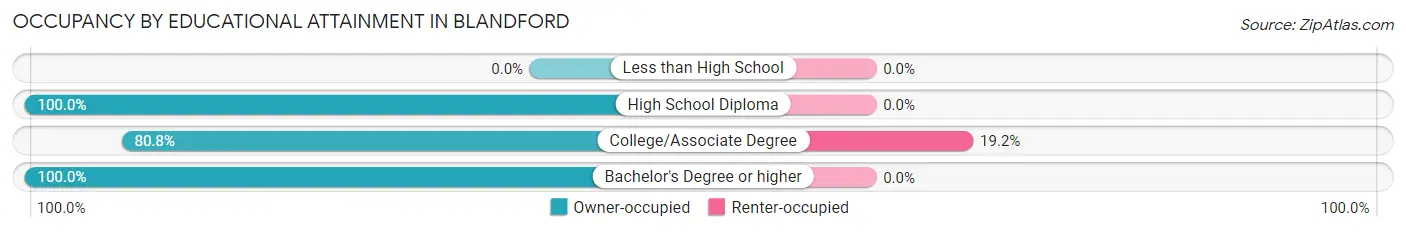
| Household Size | Owner-occupied | Renter-occupied |
| Less than High School | 0 (0.0%) | 0 (0.0%) |
| High School Diploma | 69 (100.0%) | 0 (0.0%) |
| College/Associate Degree | 42 (80.8%) | 10 (19.2%) |
| Bachelor's Degree or higher | 52 (100.0%) | 0 (0.0%) |
Occupancy by Age of Householder in Blandford
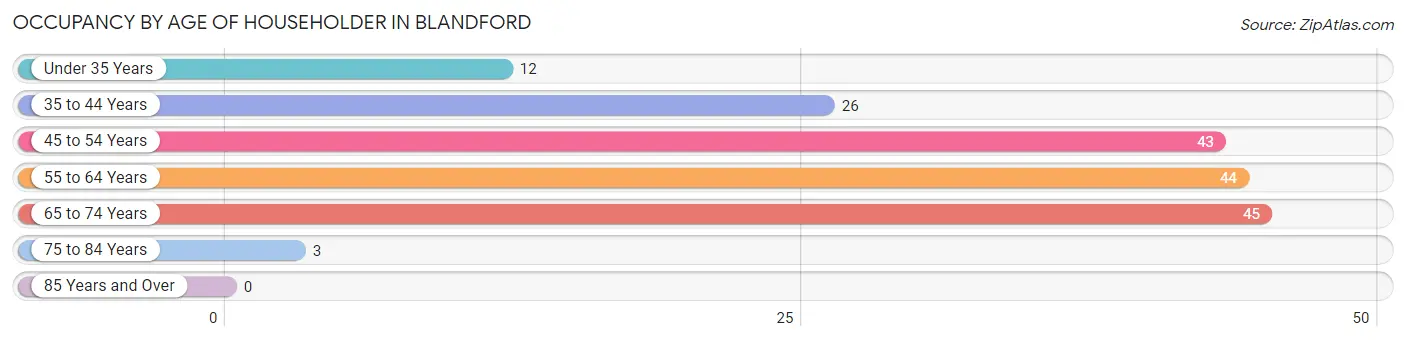
| Age Bracket | # Households | % Households |
| Under 35 Years | 12 | 6.9% |
| 35 to 44 Years | 26 | 15.0% |
| 45 to 54 Years | 43 | 24.9% |
| 55 to 64 Years | 44 | 25.4% |
| 65 to 74 Years | 45 | 26.0% |
| 75 to 84 Years | 3 | 1.7% |
| 85 Years and Over | 0 | 0.0% |
| Total | 173 | 100.0% |
Housing Finances in Blandford
Median Income by Occupancy in Blandford
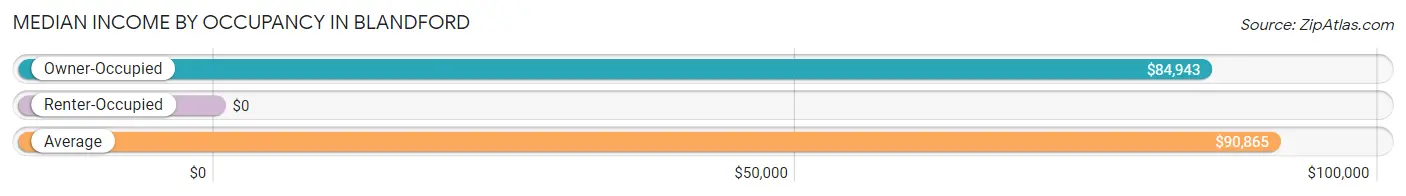
| Occupancy Type | # Households | Median Income |
| Owner-Occupied | 163 (94.2%) | $84,943 |
| Renter-Occupied | 10 (5.8%) | $0 |
| Average | 173 (100.0%) | $90,865 |
Occupancy by Householder Income Bracket in Blandford
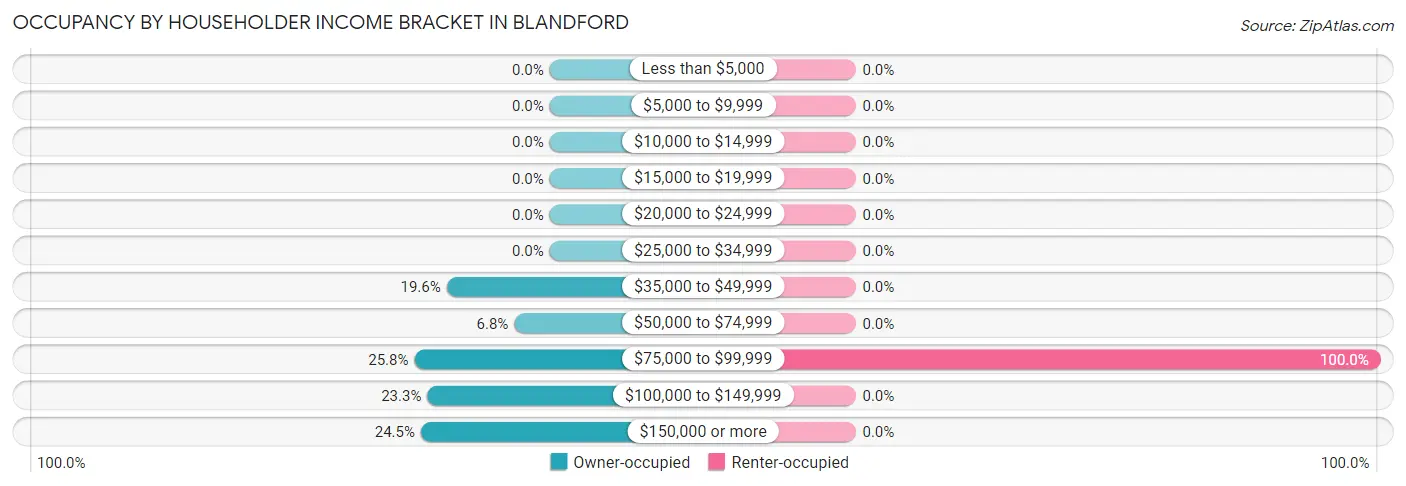
| Income Bracket | Owner-occupied | Renter-occupied |
| Less than $5,000 | 0 (0.0%) | 0 (0.0%) |
| $5,000 to $9,999 | 0 (0.0%) | 0 (0.0%) |
| $10,000 to $14,999 | 0 (0.0%) | 0 (0.0%) |
| $15,000 to $19,999 | 0 (0.0%) | 0 (0.0%) |
| $20,000 to $24,999 | 0 (0.0%) | 0 (0.0%) |
| $25,000 to $34,999 | 0 (0.0%) | 0 (0.0%) |
| $35,000 to $49,999 | 32 (19.6%) | 0 (0.0%) |
| $50,000 to $74,999 | 11 (6.8%) | 0 (0.0%) |
| $75,000 to $99,999 | 42 (25.8%) | 10 (100.0%) |
| $100,000 to $149,999 | 38 (23.3%) | 0 (0.0%) |
| $150,000 or more | 40 (24.5%) | 0 (0.0%) |
| Total | 163 (100.0%) | 10 (100.0%) |
Monthly Housing Cost Tiers in Blandford
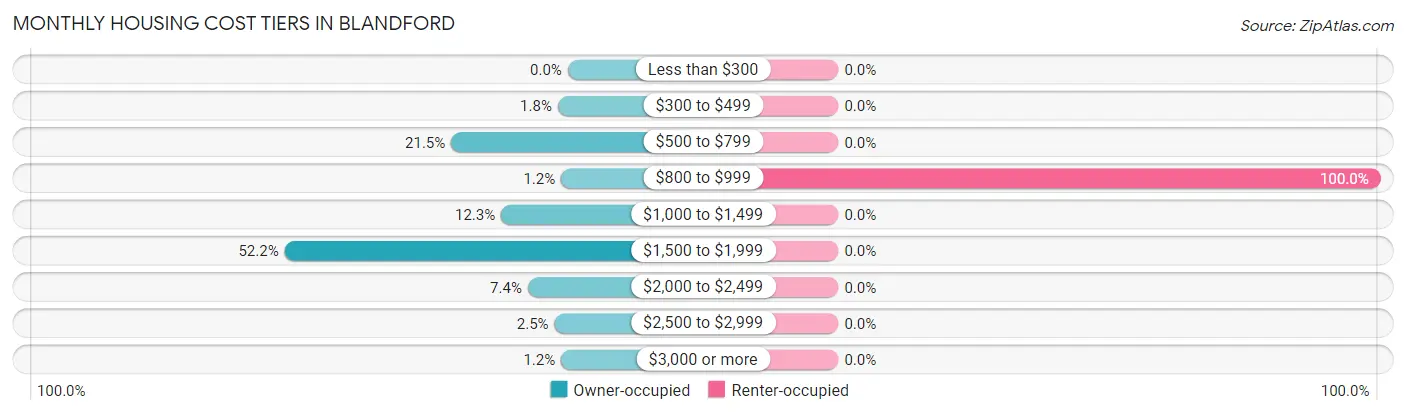
| Monthly Cost | Owner-occupied | Renter-occupied |
| Less than $300 | 0 (0.0%) | 0 (0.0%) |
| $300 to $499 | 3 (1.8%) | 0 (0.0%) |
| $500 to $799 | 35 (21.5%) | 0 (0.0%) |
| $800 to $999 | 2 (1.2%) | 10 (100.0%) |
| $1,000 to $1,499 | 20 (12.3%) | 0 (0.0%) |
| $1,500 to $1,999 | 85 (52.1%) | 0 (0.0%) |
| $2,000 to $2,499 | 12 (7.4%) | 0 (0.0%) |
| $2,500 to $2,999 | 4 (2.5%) | 0 (0.0%) |
| $3,000 or more | 2 (1.2%) | 0 (0.0%) |
| Total | 163 (100.0%) | 10 (100.0%) |
Physical Housing Characteristics in Blandford
Housing Structures in Blandford
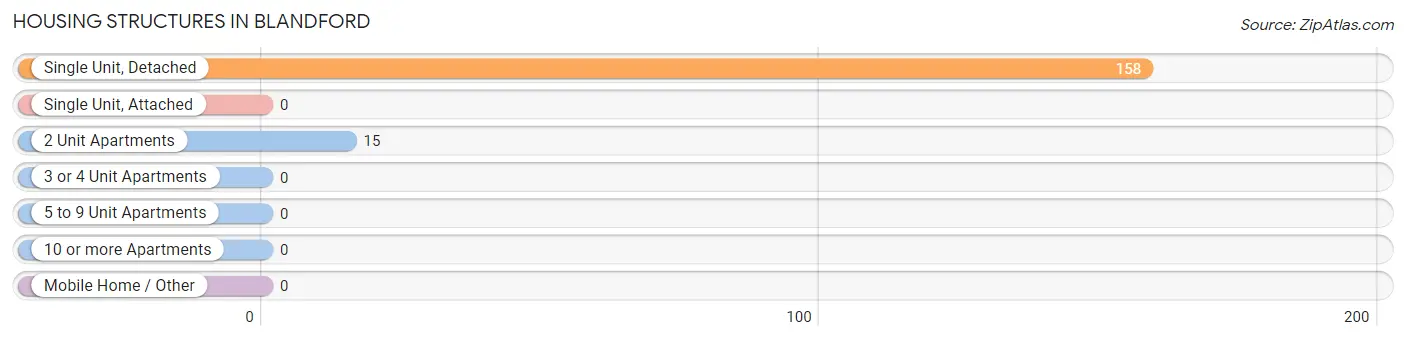
| Structure Type | # Housing Units | % Housing Units |
| Single Unit, Detached | 158 | 91.3% |
| Single Unit, Attached | 0 | 0.0% |
| 2 Unit Apartments | 15 | 8.7% |
| 3 or 4 Unit Apartments | 0 | 0.0% |
| 5 to 9 Unit Apartments | 0 | 0.0% |
| 10 or more Apartments | 0 | 0.0% |
| Mobile Home / Other | 0 | 0.0% |
| Total | 173 | 100.0% |
Housing Structures by Occupancy in Blandford
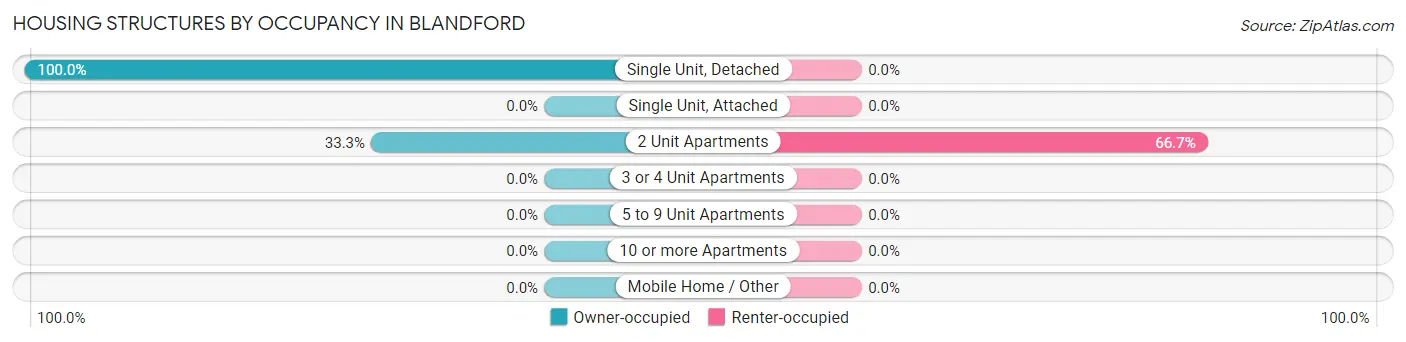
| Structure Type | Owner-occupied | Renter-occupied |
| Single Unit, Detached | 158 (100.0%) | 0 (0.0%) |
| Single Unit, Attached | 0 (0.0%) | 0 (0.0%) |
| 2 Unit Apartments | 5 (33.3%) | 10 (66.7%) |
| 3 or 4 Unit Apartments | 0 (0.0%) | 0 (0.0%) |
| 5 to 9 Unit Apartments | 0 (0.0%) | 0 (0.0%) |
| 10 or more Apartments | 0 (0.0%) | 0 (0.0%) |
| Mobile Home / Other | 0 (0.0%) | 0 (0.0%) |
| Total | 163 (94.2%) | 10 (5.8%) |
Housing Structures by Number of Rooms in Blandford
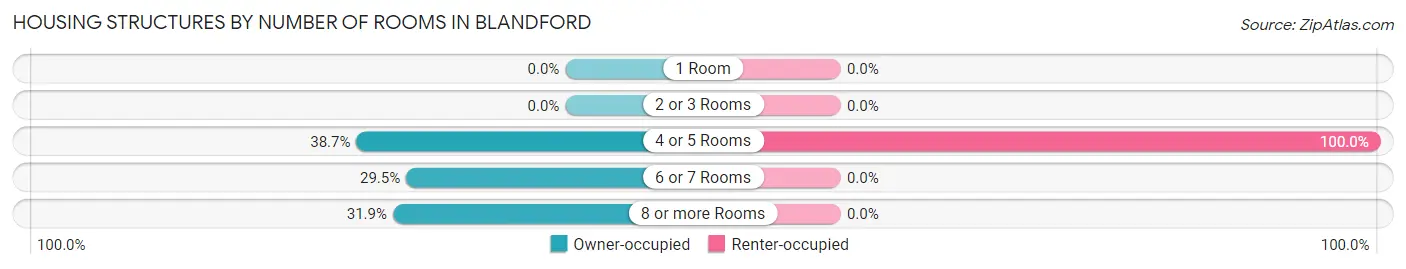
| Number of Rooms | Owner-occupied | Renter-occupied |
| 1 Room | 0 (0.0%) | 0 (0.0%) |
| 2 or 3 Rooms | 0 (0.0%) | 0 (0.0%) |
| 4 or 5 Rooms | 63 (38.7%) | 10 (100.0%) |
| 6 or 7 Rooms | 48 (29.4%) | 0 (0.0%) |
| 8 or more Rooms | 52 (31.9%) | 0 (0.0%) |
| Total | 163 (100.0%) | 10 (100.0%) |
Housing Structure by Heating Type in Blandford
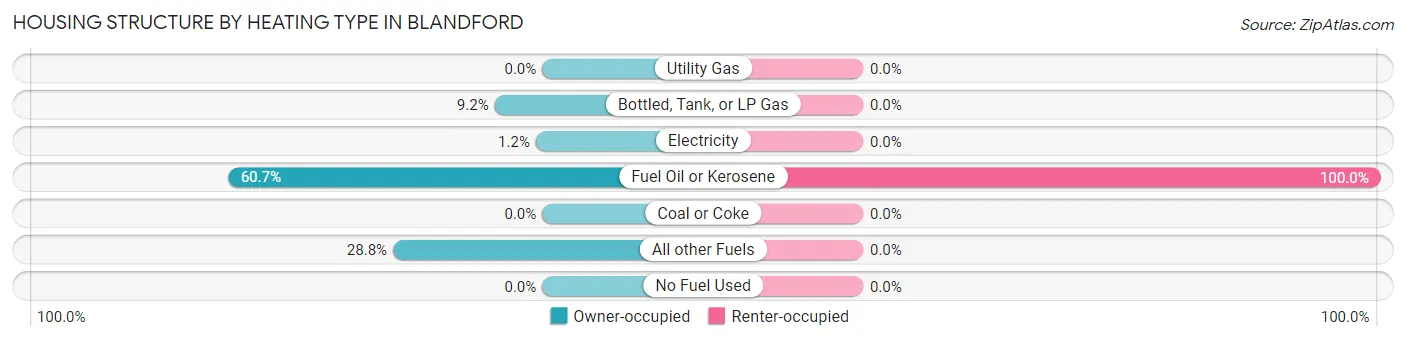
| Heating Type | Owner-occupied | Renter-occupied |
| Utility Gas | 0 (0.0%) | 0 (0.0%) |
| Bottled, Tank, or LP Gas | 15 (9.2%) | 0 (0.0%) |
| Electricity | 2 (1.2%) | 0 (0.0%) |
| Fuel Oil or Kerosene | 99 (60.7%) | 10 (100.0%) |
| Coal or Coke | 0 (0.0%) | 0 (0.0%) |
| All other Fuels | 47 (28.8%) | 0 (0.0%) |
| No Fuel Used | 0 (0.0%) | 0 (0.0%) |
| Total | 163 (100.0%) | 10 (100.0%) |
Household Vehicle Usage in Blandford
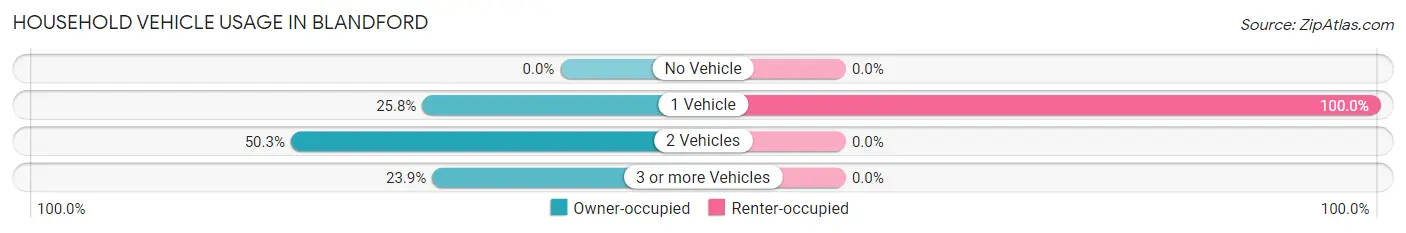
| Vehicles per Household | Owner-occupied | Renter-occupied |
| No Vehicle | 0 (0.0%) | 0 (0.0%) |
| 1 Vehicle | 42 (25.8%) | 10 (100.0%) |
| 2 Vehicles | 82 (50.3%) | 0 (0.0%) |
| 3 or more Vehicles | 39 (23.9%) | 0 (0.0%) |
| Total | 163 (100.0%) | 10 (100.0%) |
Real Estate & Mortgages in Blandford
Real Estate and Mortgage Overview in Blandford
| Characteristic | Without Mortgage | With Mortgage |
| Housing Units | 34 | 129 |
| Median Property Value | $241,200 | $186,200 |
| Median Household Income | - | - |
| Monthly Housing Costs | $1,006 | $2 |
| Real Estate Taxes | $4,071 | $0 |
Property Value by Mortgage Status in Blandford
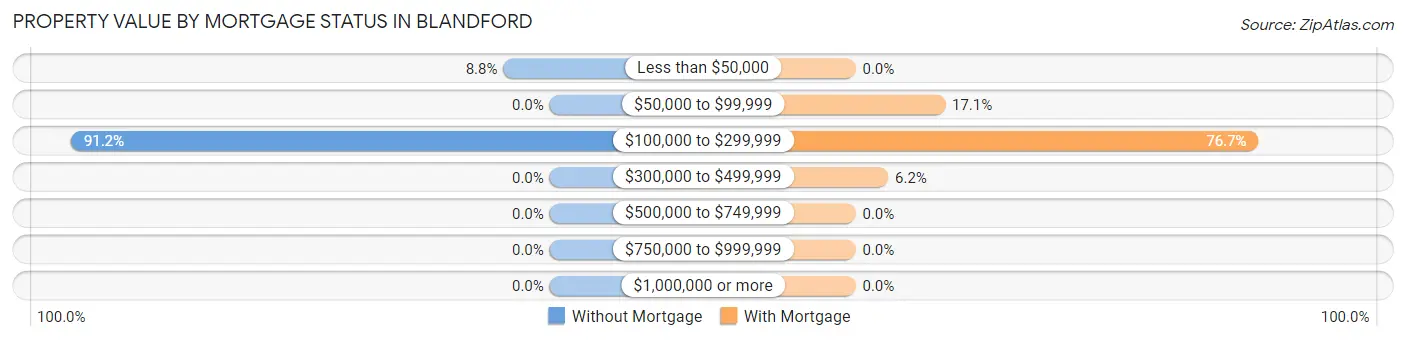
| Property Value | Without Mortgage | With Mortgage |
| Less than $50,000 | 3 (8.8%) | 0 (0.0%) |
| $50,000 to $99,999 | 0 (0.0%) | 22 (17.1%) |
| $100,000 to $299,999 | 31 (91.2%) | 99 (76.7%) |
| $300,000 to $499,999 | 0 (0.0%) | 8 (6.2%) |
| $500,000 to $749,999 | 0 (0.0%) | 0 (0.0%) |
| $750,000 to $999,999 | 0 (0.0%) | 0 (0.0%) |
| $1,000,000 or more | 0 (0.0%) | 0 (0.0%) |
| Total | 34 (100.0%) | 129 (100.0%) |
Household Income by Mortgage Status in Blandford
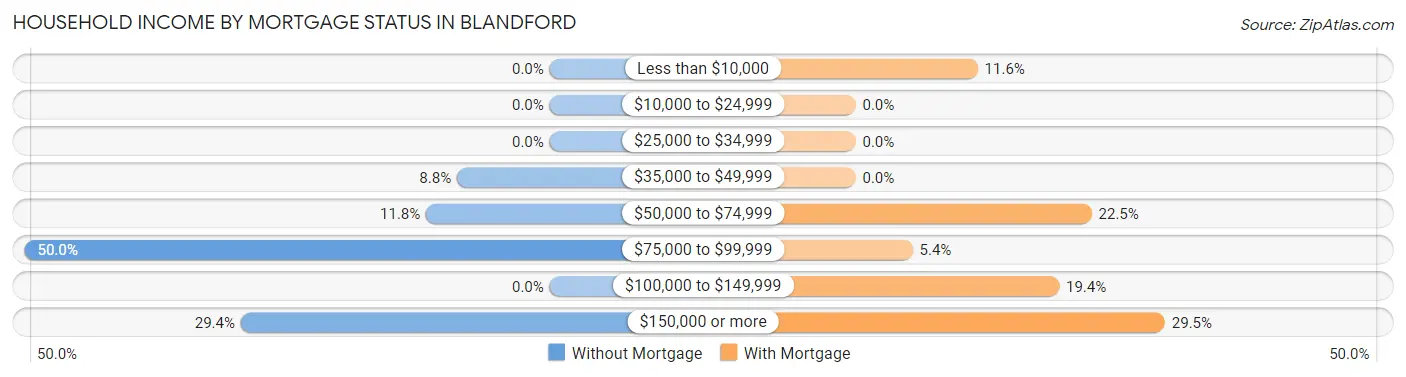
| Household Income | Without Mortgage | With Mortgage |
| Less than $10,000 | 0 (0.0%) | 15 (11.6%) |
| $10,000 to $24,999 | 0 (0.0%) | 0 (0.0%) |
| $25,000 to $34,999 | 0 (0.0%) | 0 (0.0%) |
| $35,000 to $49,999 | 3 (8.8%) | 0 (0.0%) |
| $50,000 to $74,999 | 4 (11.8%) | 29 (22.5%) |
| $75,000 to $99,999 | 17 (50.0%) | 7 (5.4%) |
| $100,000 to $149,999 | 0 (0.0%) | 25 (19.4%) |
| $150,000 or more | 10 (29.4%) | 38 (29.5%) |
| Total | 34 (100.0%) | 129 (100.0%) |
Property Value to Household Income Ratio in Blandford
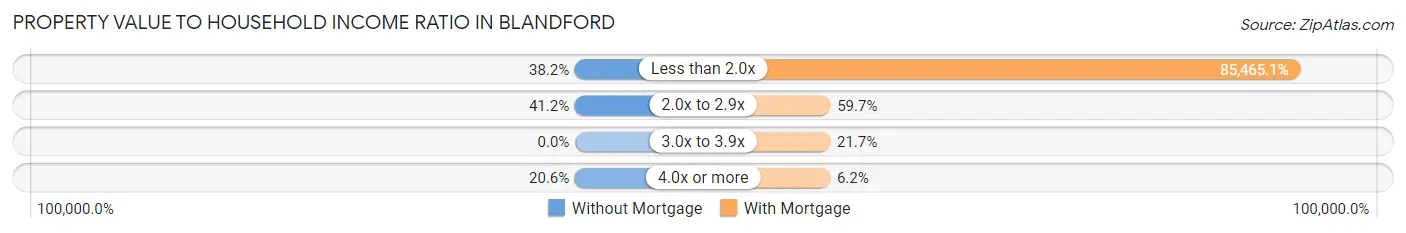
| Value-to-Income Ratio | Without Mortgage | With Mortgage |
| Less than 2.0x | 13 (38.2%) | 110,250 (85,465.1%) |
| 2.0x to 2.9x | 14 (41.2%) | 77 (59.7%) |
| 3.0x to 3.9x | 0 (0.0%) | 28 (21.7%) |
| 4.0x or more | 7 (20.6%) | 8 (6.2%) |
| Total | 34 (100.0%) | 129 (100.0%) |
Real Estate Taxes by Mortgage Status in Blandford
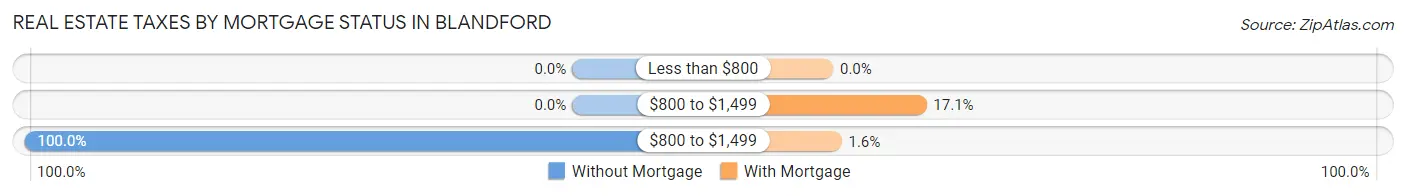
| Property Taxes | Without Mortgage | With Mortgage |
| Less than $800 | 0 (0.0%) | 0 (0.0%) |
| $800 to $1,499 | 0 (0.0%) | 22 (17.1%) |
| $800 to $1,499 | 34 (100.0%) | 2 (1.5%) |
| Total | 34 (100.0%) | 129 (100.0%) |
Health & Disability in Blandford
Health Insurance Coverage by Age in Blandford
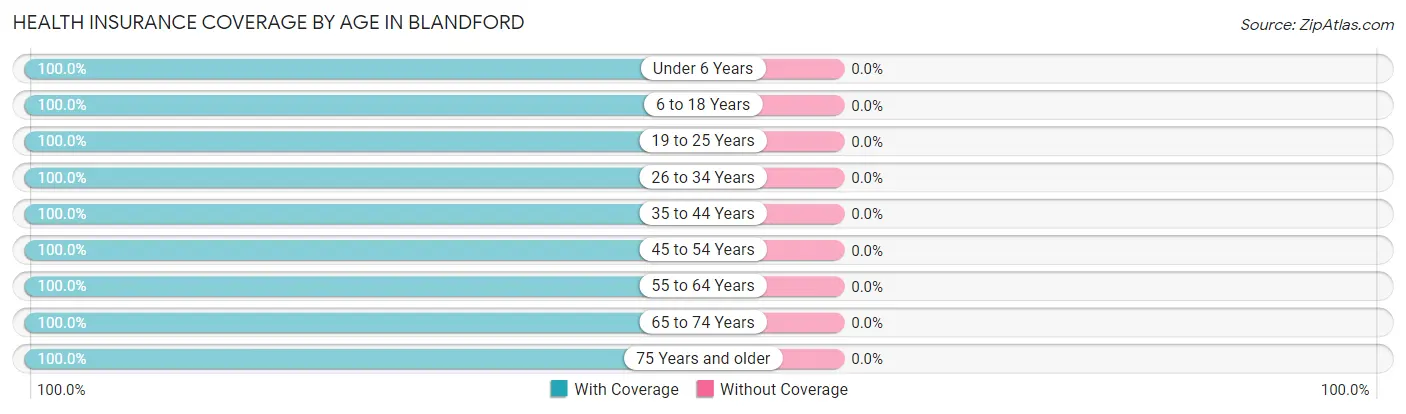
| Age Bracket | With Coverage | Without Coverage |
| Under 6 Years | 5 (100.0%) | 0 (0.0%) |
| 6 to 18 Years | 47 (100.0%) | 0 (0.0%) |
| 19 to 25 Years | 38 (100.0%) | 0 (0.0%) |
| 26 to 34 Years | 4 (100.0%) | 0 (0.0%) |
| 35 to 44 Years | 40 (100.0%) | 0 (0.0%) |
| 45 to 54 Years | 67 (100.0%) | 0 (0.0%) |
| 55 to 64 Years | 80 (100.0%) | 0 (0.0%) |
| 65 to 74 Years | 65 (100.0%) | 0 (0.0%) |
| 75 Years and older | 3 (100.0%) | 0 (0.0%) |
| Total | 349 (100.0%) | 0 (0.0%) |
Health Insurance Coverage by Citizenship Status in Blandford
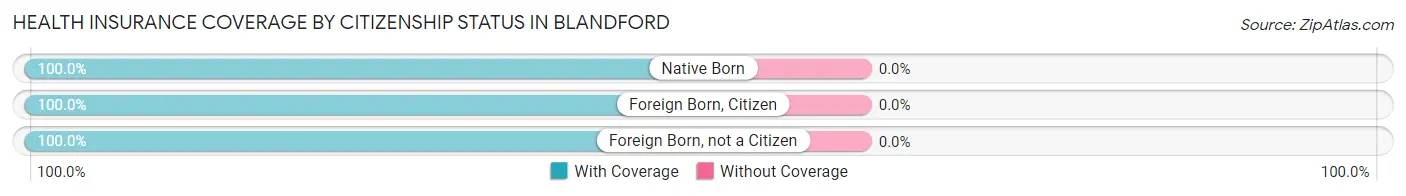
| Citizenship Status | With Coverage | Without Coverage |
| Native Born | 5 (100.0%) | 0 (0.0%) |
| Foreign Born, Citizen | 47 (100.0%) | 0 (0.0%) |
| Foreign Born, not a Citizen | 38 (100.0%) | 0 (0.0%) |
Health Insurance Coverage by Household Income in Blandford
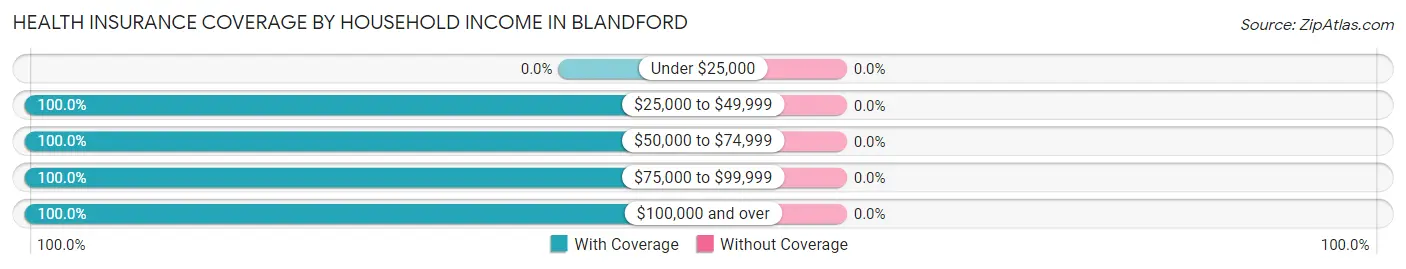
| Household Income | With Coverage | Without Coverage |
| Under $25,000 | 0 (0.0%) | 0 (0.0%) |
| $25,000 to $49,999 | 39 (100.0%) | 0 (0.0%) |
| $50,000 to $74,999 | 25 (100.0%) | 0 (0.0%) |
| $75,000 to $99,999 | 98 (100.0%) | 0 (0.0%) |
| $100,000 and over | 187 (100.0%) | 0 (0.0%) |
Public vs Private Health Insurance Coverage by Age in Blandford
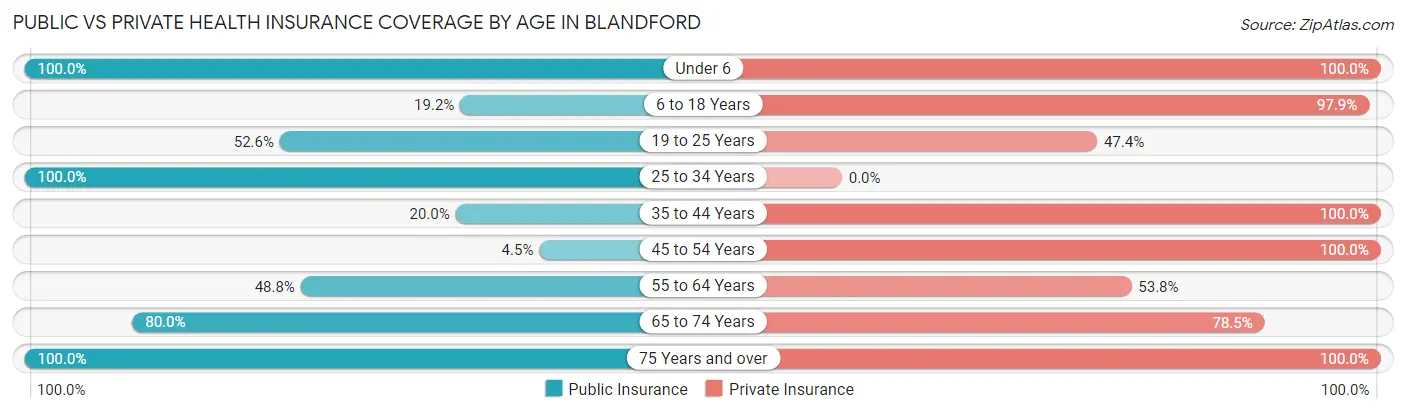
| Age Bracket | Public Insurance | Private Insurance |
| Under 6 | 5 (100.0%) | 5 (100.0%) |
| 6 to 18 Years | 9 (19.2%) | 46 (97.9%) |
| 19 to 25 Years | 20 (52.6%) | 18 (47.4%) |
| 25 to 34 Years | 4 (100.0%) | 0 (0.0%) |
| 35 to 44 Years | 8 (20.0%) | 40 (100.0%) |
| 45 to 54 Years | 3 (4.5%) | 67 (100.0%) |
| 55 to 64 Years | 39 (48.7%) | 43 (53.7%) |
| 65 to 74 Years | 52 (80.0%) | 51 (78.5%) |
| 75 Years and over | 3 (100.0%) | 3 (100.0%) |
| Total | 143 (41.0%) | 273 (78.2%) |
Disability Status by Sex by Age in Blandford
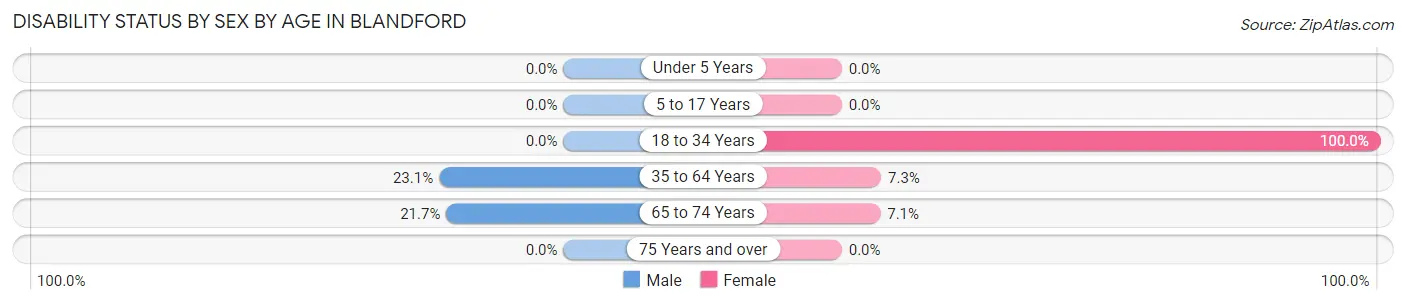
| Age Bracket | Male | Female |
| Under 5 Years | 0 (0.0%) | 0 (0.0%) |
| 5 to 17 Years | 0 (0.0%) | 0 (0.0%) |
| 18 to 34 Years | 0 (0.0%) | 4 (100.0%) |
| 35 to 64 Years | 21 (23.1%) | 7 (7.3%) |
| 65 to 74 Years | 5 (21.7%) | 3 (7.1%) |
| 75 Years and over | 0 (0.0%) | 0 (0.0%) |
Disability Class by Sex by Age in Blandford
Disability Class: Hearing Difficulty
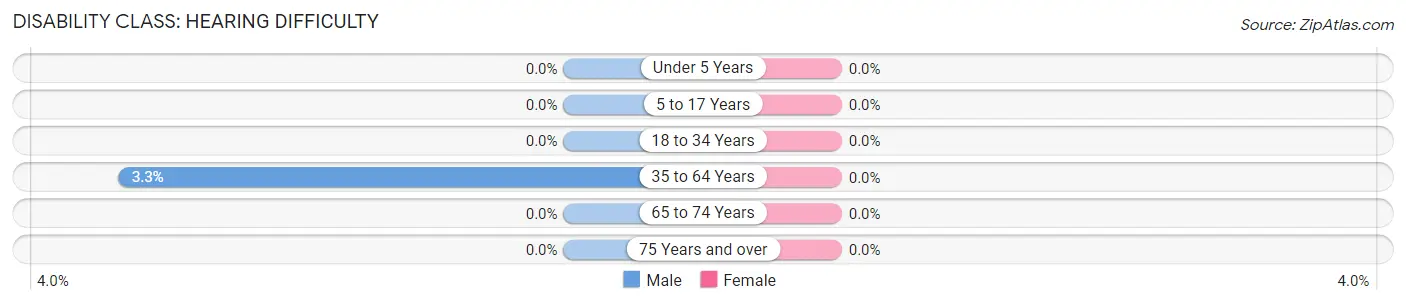
| Age Bracket | Male | Female |
| Under 5 Years | 0 (0.0%) | 0 (0.0%) |
| 5 to 17 Years | 0 (0.0%) | 0 (0.0%) |
| 18 to 34 Years | 0 (0.0%) | 0 (0.0%) |
| 35 to 64 Years | 3 (3.3%) | 0 (0.0%) |
| 65 to 74 Years | 0 (0.0%) | 0 (0.0%) |
| 75 Years and over | 0 (0.0%) | 0 (0.0%) |
Disability Class: Vision Difficulty
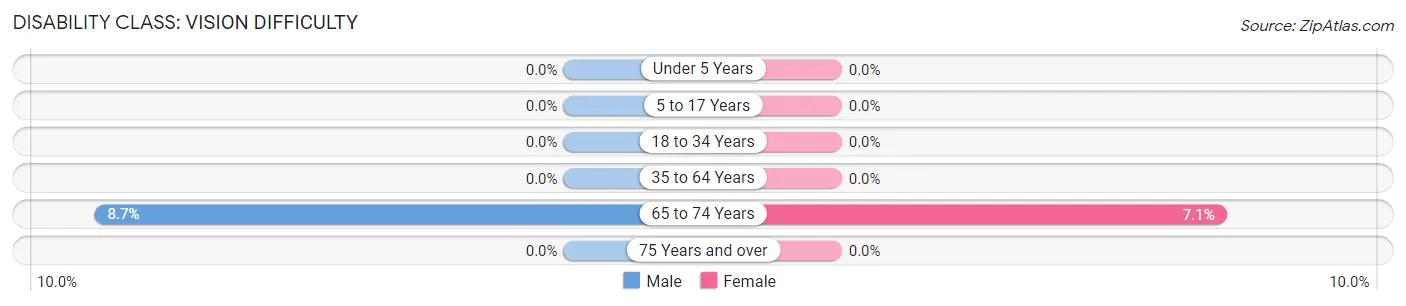
| Age Bracket | Male | Female |
| Under 5 Years | 0 (0.0%) | 0 (0.0%) |
| 5 to 17 Years | 0 (0.0%) | 0 (0.0%) |
| 18 to 34 Years | 0 (0.0%) | 0 (0.0%) |
| 35 to 64 Years | 0 (0.0%) | 0 (0.0%) |
| 65 to 74 Years | 2 (8.7%) | 3 (7.1%) |
| 75 Years and over | 0 (0.0%) | 0 (0.0%) |
Disability Class: Cognitive Difficulty
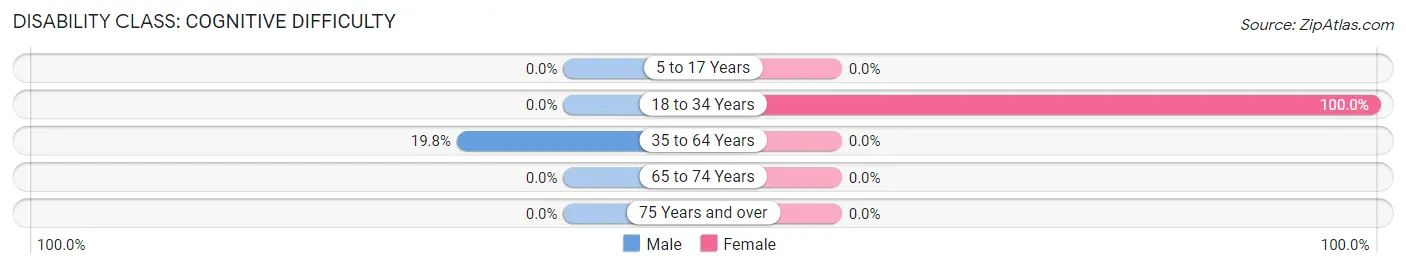
| Age Bracket | Male | Female |
| 5 to 17 Years | 0 (0.0%) | 0 (0.0%) |
| 18 to 34 Years | 0 (0.0%) | 4 (100.0%) |
| 35 to 64 Years | 18 (19.8%) | 0 (0.0%) |
| 65 to 74 Years | 0 (0.0%) | 0 (0.0%) |
| 75 Years and over | 0 (0.0%) | 0 (0.0%) |
Disability Class: Ambulatory Difficulty
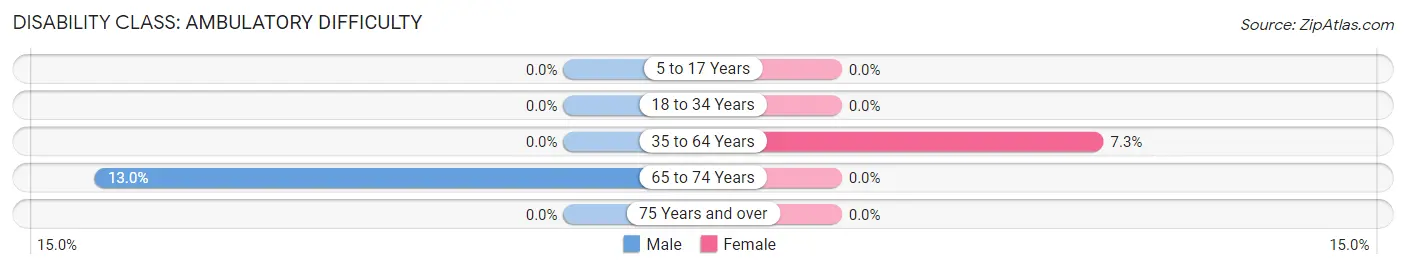
| Age Bracket | Male | Female |
| 5 to 17 Years | 0 (0.0%) | 0 (0.0%) |
| 18 to 34 Years | 0 (0.0%) | 0 (0.0%) |
| 35 to 64 Years | 0 (0.0%) | 7 (7.3%) |
| 65 to 74 Years | 3 (13.0%) | 0 (0.0%) |
| 75 Years and over | 0 (0.0%) | 0 (0.0%) |
Disability Class: Self-Care Difficulty
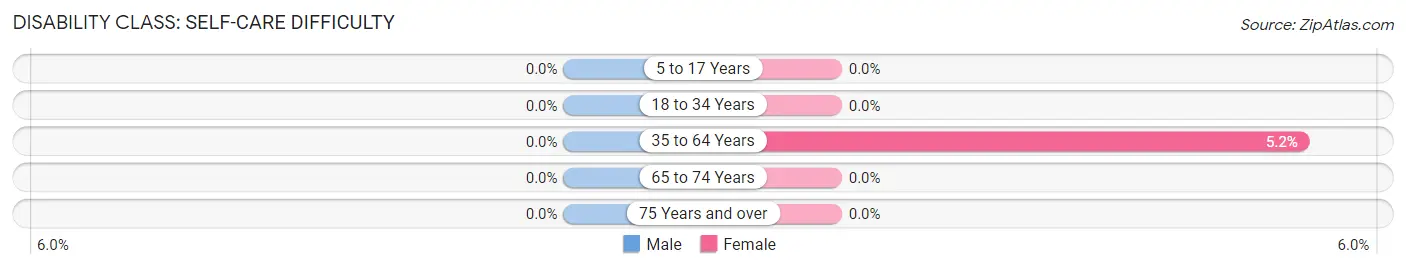
| Age Bracket | Male | Female |
| 5 to 17 Years | 0 (0.0%) | 0 (0.0%) |
| 18 to 34 Years | 0 (0.0%) | 0 (0.0%) |
| 35 to 64 Years | 0 (0.0%) | 5 (5.2%) |
| 65 to 74 Years | 0 (0.0%) | 0 (0.0%) |
| 75 Years and over | 0 (0.0%) | 0 (0.0%) |
Technology Access in Blandford
Computing Device Access in Blandford
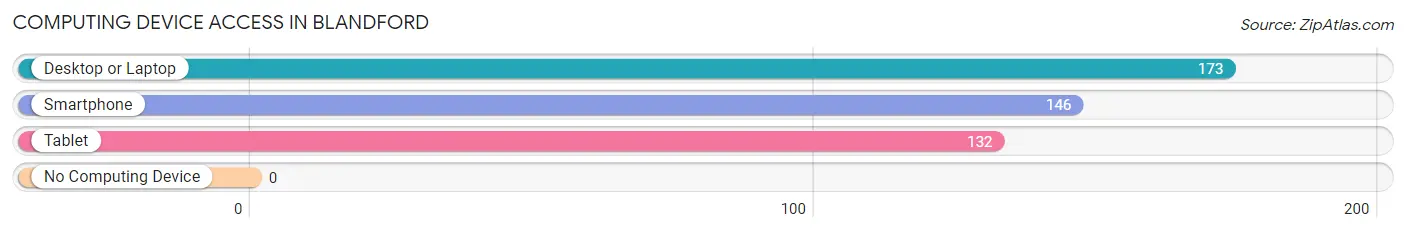
| Device Type | # Households | % Households |
| Desktop or Laptop | 173 | 100.0% |
| Smartphone | 146 | 84.4% |
| Tablet | 132 | 76.3% |
| No Computing Device | 0 | 0.0% |
| Total | 173 | 100.0% |
Internet Access in Blandford
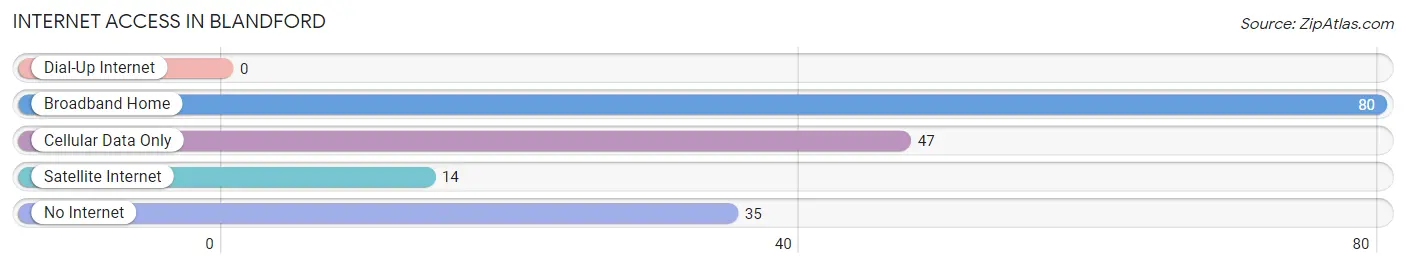
| Internet Type | # Households | % Households |
| Dial-Up Internet | 0 | 0.0% |
| Broadband Home | 80 | 46.2% |
| Cellular Data Only | 47 | 27.2% |
| Satellite Internet | 14 | 8.1% |
| No Internet | 35 | 20.2% |
| Total | 173 | 100.0% |
Blandford Summary
Blandford is a small town located in the western part of Massachusetts, in the county of Hampden. It is situated in the foothills of the Berkshire Mountains, and is bordered by the towns of Russell, Chester, and Otis. The town has a population of 1,233, according to the 2010 census.
History
Blandford was first settled in 1735, and was officially incorporated in 1741. The town was named after the Blandford family, who were among the first settlers. The town was originally a farming community, and the main crops were corn, wheat, and hay. In the 19th century, the town became a center for the production of woolen goods, and several mills were built in the area.
Geography
Blandford is located in the western part of Massachusetts, in the county of Hampden. It is situated in the foothills of the Berkshire Mountains, and is bordered by the towns of Russell, Chester, and Otis. The town has a total area of 24.2 square miles, of which 24.1 square miles is land and 0.1 square miles is water. The highest point in the town is the summit of East Mountain, which has an elevation of 1,717 feet.
Economy
The economy of Blandford is largely based on agriculture and tourism. The town is home to several farms, which produce a variety of crops, including corn, wheat, hay, and vegetables. The town is also home to several small businesses, including a general store, a hardware store, and a restaurant. In addition, the town is a popular destination for outdoor recreation, and is home to several hiking trails, camping sites, and fishing spots.
Demographics
According to the 2010 census, the population of Blandford was 1,233. The racial makeup of the town was 97.3% White, 0.7% African American, 0.2% Native American, 0.2% Asian, 0.2% from other races, and 1.4% from two or more races. The median household income was $60,938, and the median family income was $68,750. The per capita income was $27,945. About 5.3% of the population was below the poverty line.
Common Questions
What is Per Capita Income in Blandford?
Per Capita income in Blandford is $54,754.
What is the Median Family Income in Blandford?
Median Family Income in Blandford is $128,333.
What is the Median Household income in Blandford?
Median Household Income in Blandford is $90,865.
What is Income or Wage Gap in Blandford?
Income or Wage Gap in Blandford is 24.8%.
Women in Blandford earn 75.2 cents for every dollar earned by a man.
What is Inequality or Gini Index in Blandford?
Inequality or Gini Index in Blandford is 0.29.
What is the Total Population of Blandford?
Total Population of Blandford is 349.
What is the Total Male Population of Blandford?
Total Male Population of Blandford is 184.
What is the Total Female Population of Blandford?
Total Female Population of Blandford is 165.
What is the Ratio of Males per 100 Females in Blandford?
There are 111.52 Males per 100 Females in Blandford.
What is the Ratio of Females per 100 Males in Blandford?
There are 89.67 Females per 100 Males in Blandford.
What is the Median Population Age in Blandford?
Median Population Age in Blandford is 48.6 Years.
What is the Average Family Size in Blandford
Average Family Size in Blandford is 2.9 People.
What is the Average Household Size in Blandford
Average Household Size in Blandford is 2.0 People.
How Large is the Labor Force in Blandford?
There are 178 People in the Labor Forcein in Blandford.
What is the Percentage of People in the Labor Force in Blandford?
57.6% of People are in the Labor Force in Blandford.