Bellingham, MA Map & Demographics
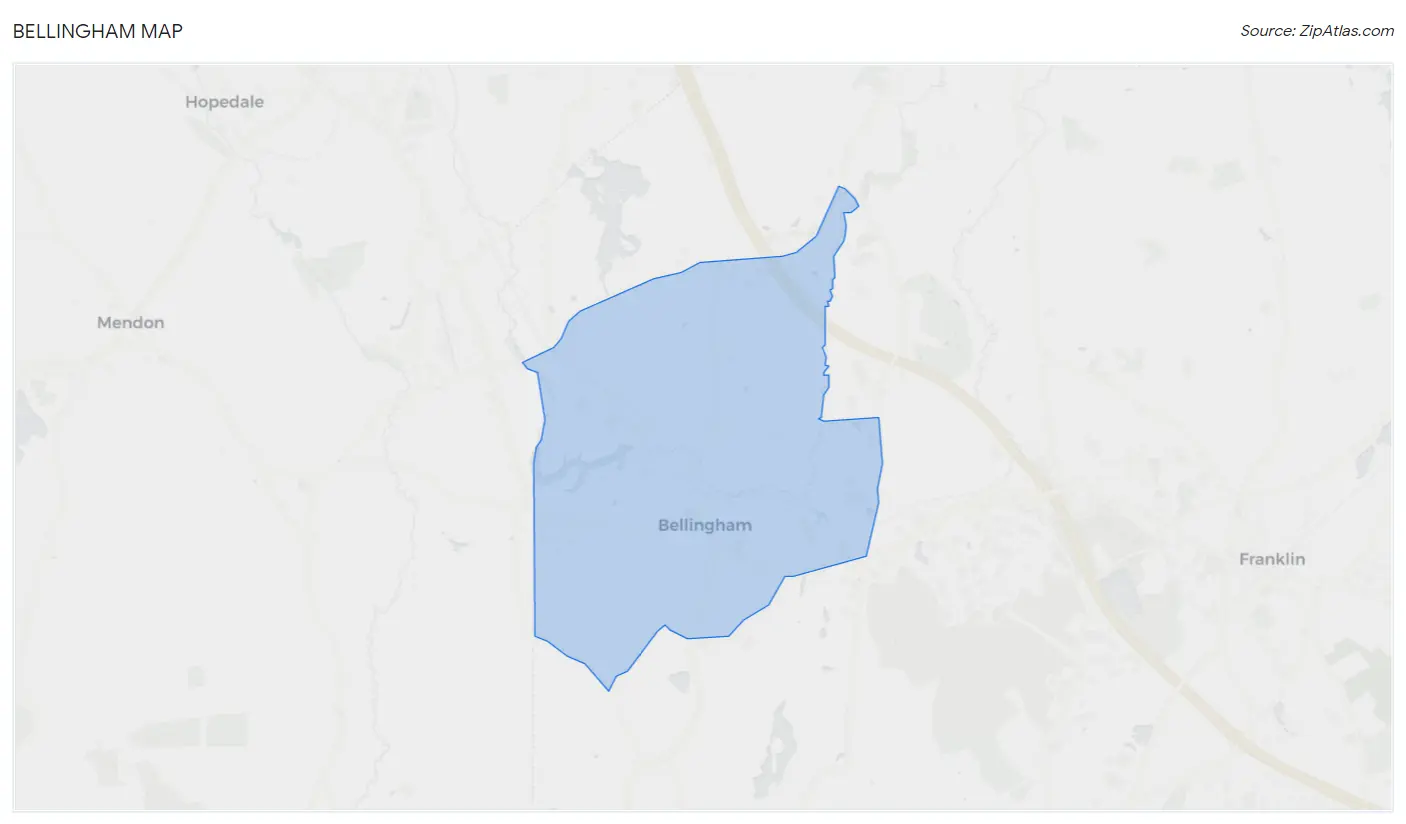
Bellingham Map
Bellingham Overview
$46,603
PER CAPITA INCOME
$106,179
AVG FAMILY INCOME
$76,729
AVG HOUSEHOLD INCOME
10.3%
WAGE / INCOME GAP [ % ]
89.7¢/ $1
WAGE / INCOME GAP [ $ ]
0.44
INEQUALITY / GINI INDEX
4,636
TOTAL POPULATION
2,089
MALE POPULATION
2,547
FEMALE POPULATION
82.02
MALES / 100 FEMALES
121.92
FEMALES / 100 MALES
46.5
MEDIAN AGE
3.1
AVG FAMILY SIZE
2.2
AVG HOUSEHOLD SIZE
2,680
LABOR FORCE [ PEOPLE ]
69.4%
PERCENT IN LABOR FORCE
10.4%
UNEMPLOYMENT RATE
Bellingham Zip Codes
Income in Bellingham
Income Overview in Bellingham
Per Capita Income in Bellingham is $46,603, while median incomes of families and households are $106,179 and $76,729 respectively.
| Characteristic | Number | Measure |
| Per Capita Income | 4,636 | $46,603 |
| Median Family Income | 1,137 | $106,179 |
| Mean Family Income | 1,137 | $132,397 |
| Median Household Income | 2,076 | $76,729 |
| Mean Household Income | 2,076 | $103,184 |
| Income Deficit | 1,137 | $0 |
| Wage / Income Gap (%) | 4,636 | 10.28% |
| Wage / Income Gap ($) | 4,636 | 89.72¢ per $1 |
| Gini / Inequality Index | 4,636 | 0.44 |
Earnings by Sex in Bellingham
Average Earnings in Bellingham are $57,461, $61,504 for men and $55,180 for women, a difference of 10.3%.
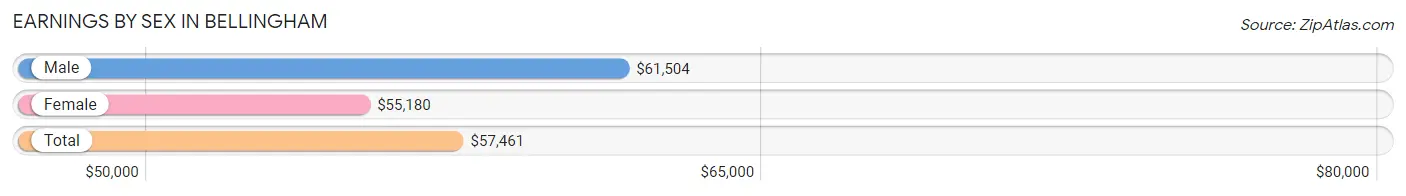
| Sex | Number | Average Earnings |
| Male | 1,329 (50.2%) | $61,504 |
| Female | 1,318 (49.8%) | $55,180 |
| Total | 2,647 (100.0%) | $57,461 |
Earnings by Sex by Income Bracket in Bellingham
The most common earnings brackets in Bellingham are $100,000+ for men (324 | 24.4%) and $55,000 to $64,999 for women (245 | 18.6%).
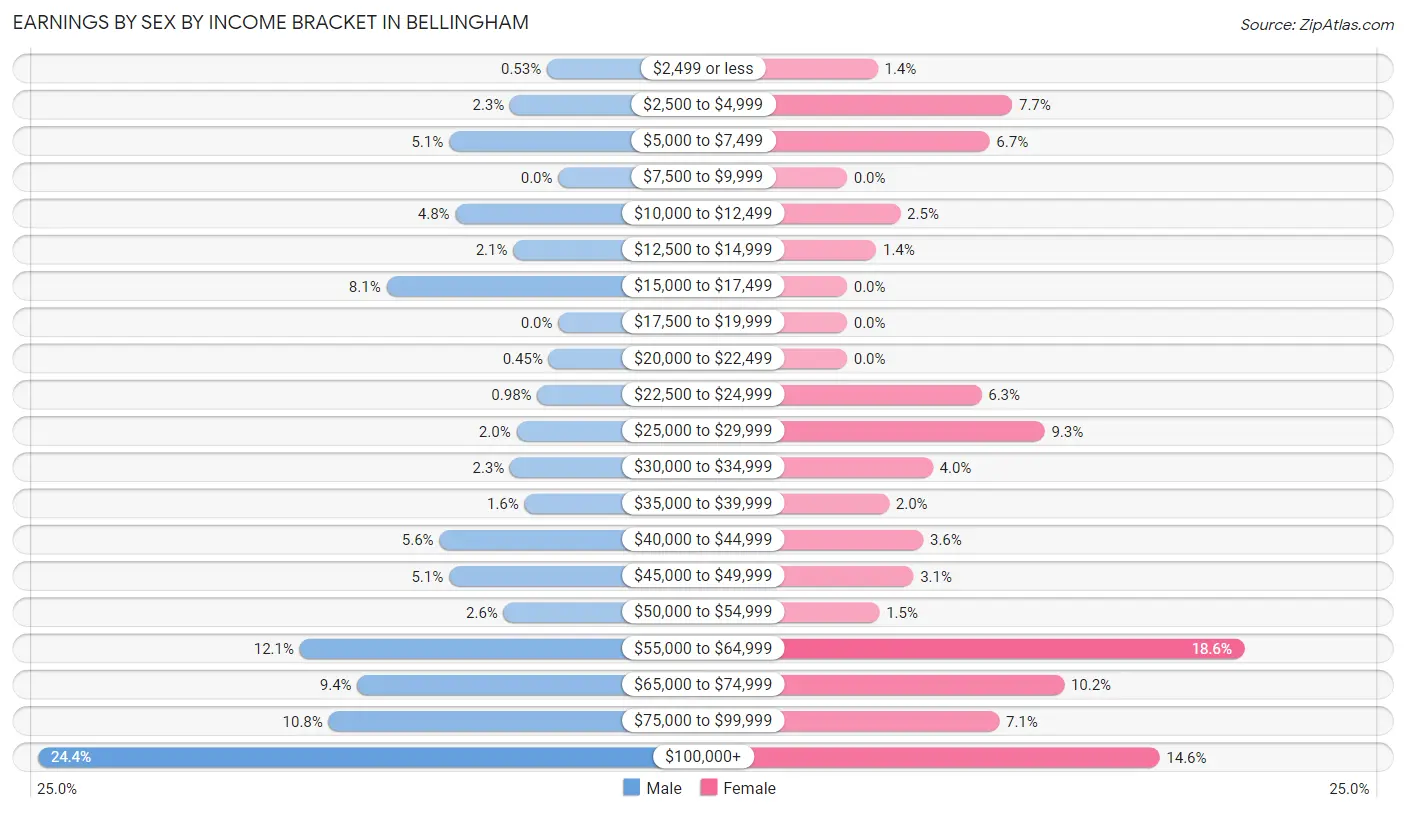
| Income | Male | Female |
| $2,499 or less | 7 (0.5%) | 19 (1.4%) |
| $2,500 to $4,999 | 30 (2.3%) | 102 (7.7%) |
| $5,000 to $7,499 | 68 (5.1%) | 88 (6.7%) |
| $7,500 to $9,999 | 0 (0.0%) | 0 (0.0%) |
| $10,000 to $12,499 | 64 (4.8%) | 33 (2.5%) |
| $12,500 to $14,999 | 28 (2.1%) | 18 (1.4%) |
| $15,000 to $17,499 | 107 (8.1%) | 0 (0.0%) |
| $17,500 to $19,999 | 0 (0.0%) | 0 (0.0%) |
| $20,000 to $22,499 | 6 (0.4%) | 0 (0.0%) |
| $22,500 to $24,999 | 13 (1.0%) | 83 (6.3%) |
| $25,000 to $29,999 | 26 (2.0%) | 122 (9.3%) |
| $30,000 to $34,999 | 30 (2.3%) | 53 (4.0%) |
| $35,000 to $39,999 | 21 (1.6%) | 26 (2.0%) |
| $40,000 to $44,999 | 74 (5.6%) | 47 (3.6%) |
| $45,000 to $49,999 | 68 (5.1%) | 41 (3.1%) |
| $50,000 to $54,999 | 34 (2.6%) | 20 (1.5%) |
| $55,000 to $64,999 | 161 (12.1%) | 245 (18.6%) |
| $65,000 to $74,999 | 125 (9.4%) | 134 (10.2%) |
| $75,000 to $99,999 | 143 (10.8%) | 94 (7.1%) |
| $100,000+ | 324 (24.4%) | 193 (14.6%) |
| Total | 1,329 (100.0%) | 1,318 (100.0%) |
Earnings by Sex by Educational Attainment in Bellingham
Average earnings in Bellingham are $68,321 for men and $57,294 for women, a difference of 16.1%. Men with an educational attainment of bachelor's degree enjoy the highest average annual earnings of $90,163, while those with high school diploma education earn the least with $60,293. Women with an educational attainment of graduate degree earn the most with the average annual earnings of $88,317, while those with high school diploma education have the smallest earnings of $55,020.
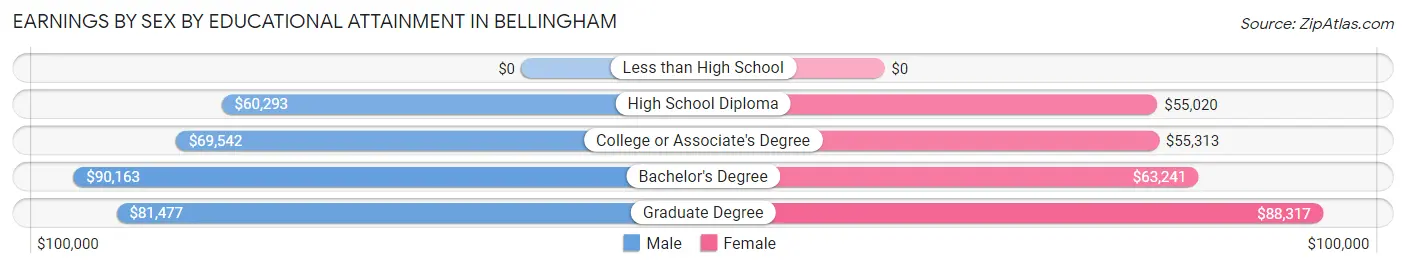
| Educational Attainment | Male Income | Female Income |
| Less than High School | - | - |
| High School Diploma | $60,293 | $55,020 |
| College or Associate's Degree | $69,542 | $55,313 |
| Bachelor's Degree | $90,163 | $63,241 |
| Graduate Degree | $81,477 | $88,317 |
| Total | $68,321 | $57,294 |
Family Income in Bellingham
Family Income Brackets in Bellingham
According to the Bellingham family income data, there are 229 families falling into the $75,000 to $99,999 income range, which is the most common income bracket and makes up 20.1% of all families.
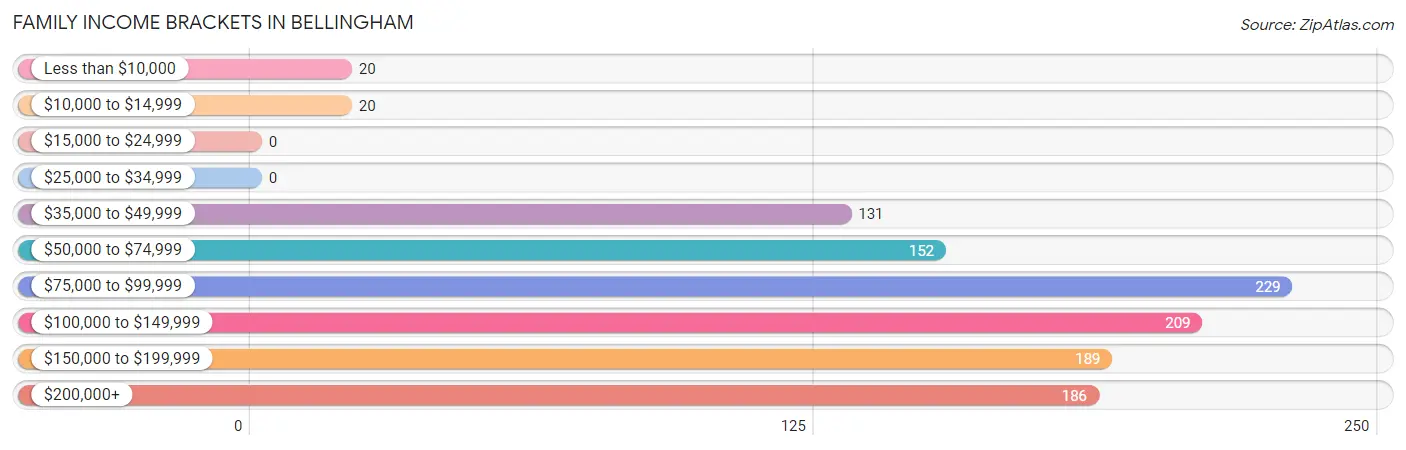
| Income Bracket | # Families | % Families |
| Less than $10,000 | 20 | 1.8% |
| $10,000 to $14,999 | 20 | 1.8% |
| $15,000 to $24,999 | 0 | 0.0% |
| $25,000 to $34,999 | 0 | 0.0% |
| $35,000 to $49,999 | 131 | 11.5% |
| $50,000 to $74,999 | 152 | 13.4% |
| $75,000 to $99,999 | 229 | 20.1% |
| $100,000 to $149,999 | 209 | 18.4% |
| $150,000 to $199,999 | 189 | 16.6% |
| $200,000+ | 186 | 16.4% |
Family Income by Famaliy Size in Bellingham
4-person families (100 | 8.8%) account for the highest median family income in Bellingham with $227,500 per family, while 4-person families (100 | 8.8%) have the highest median income of $56,875 per family member.
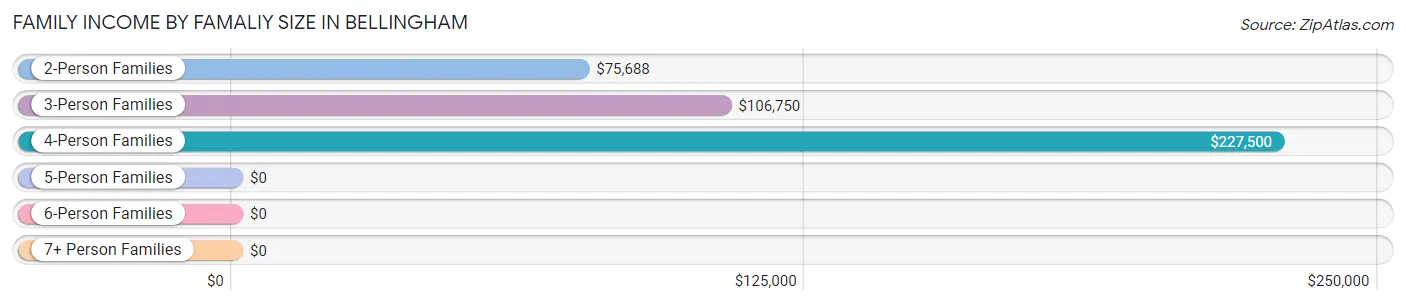
| Income Bracket | # Families | Median Income |
| 2-Person Families | 383 (33.7%) | $75,688 |
| 3-Person Families | 526 (46.3%) | $106,750 |
| 4-Person Families | 100 (8.8%) | $227,500 |
| 5-Person Families | 101 (8.9%) | $0 |
| 6-Person Families | 27 (2.4%) | $0 |
| 7+ Person Families | 0 (0.0%) | $0 |
| Total | 1,137 (100.0%) | $106,179 |
Family Income by Number of Earners in Bellingham
The median family income in Bellingham is $106,179, with families comprising 3+ earners (180) having the highest median family income of $130,667, while families with 1 earner (372) have the lowest median family income of $72,672, accounting for 15.8% and 32.7% of families, respectively.
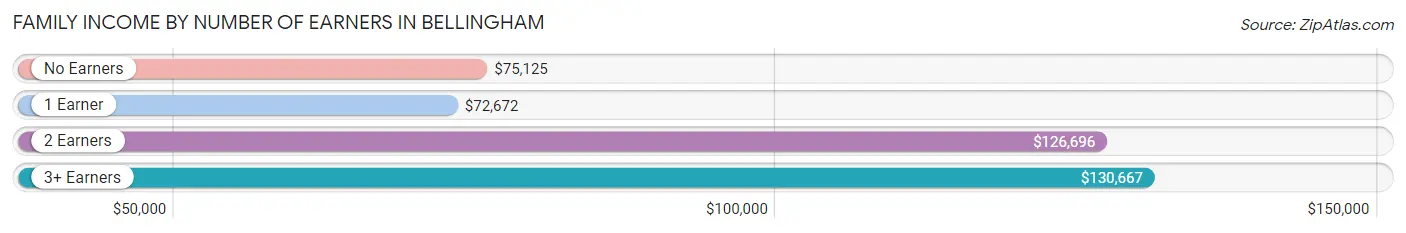
| Number of Earners | # Families | Median Income |
| No Earners | 110 (9.7%) | $75,125 |
| 1 Earner | 372 (32.7%) | $72,672 |
| 2 Earners | 475 (41.8%) | $126,696 |
| 3+ Earners | 180 (15.8%) | $130,667 |
| Total | 1,137 (100.0%) | $106,179 |
Household Income in Bellingham
Household Income Brackets in Bellingham
With 349 households falling in the category, the $100,000 to $149,999 income range is the most frequent in Bellingham, accounting for 16.8% of all households. In contrast, only 27 households (1.3%) fall into the $10,000 to $14,999 income bracket, making it the least populous group.
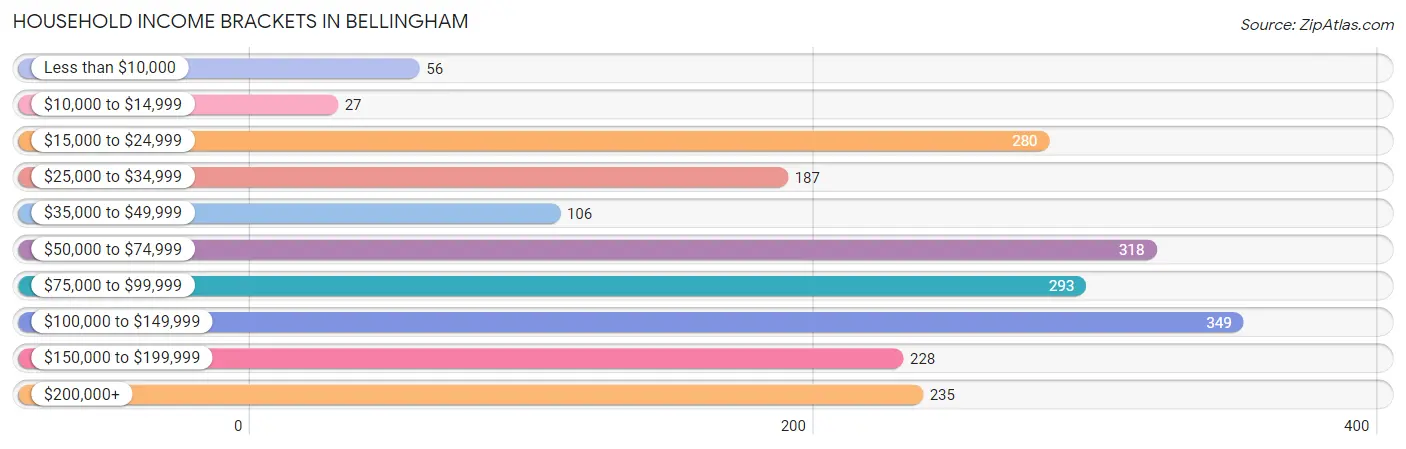
| Income Bracket | # Households | % Households |
| Less than $10,000 | 56 | 2.7% |
| $10,000 to $14,999 | 27 | 1.3% |
| $15,000 to $24,999 | 280 | 13.5% |
| $25,000 to $34,999 | 187 | 9.0% |
| $35,000 to $49,999 | 106 | 5.1% |
| $50,000 to $74,999 | 318 | 15.3% |
| $75,000 to $99,999 | 293 | 14.1% |
| $100,000 to $149,999 | 349 | 16.8% |
| $150,000 to $199,999 | 228 | 11.0% |
| $200,000+ | 235 | 11.3% |
Household Income by Householder Age in Bellingham
The median household income in Bellingham is $76,729, with the highest median household income of $106,438 found in the 25 to 44 years age bracket for the primary householder. A total of 585 households (28.2%) fall into this category. Meanwhile, the 15 to 24 years age bracket for the primary householder has the lowest median household income of $0, with 22 households (1.1%) in this group.
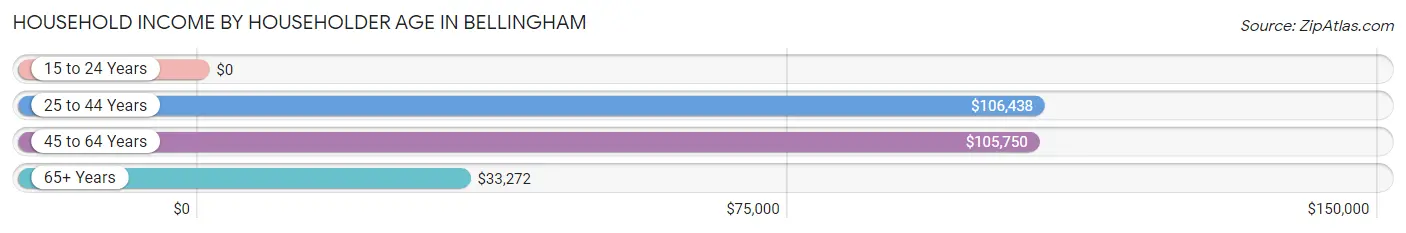
| Income Bracket | # Households | Median Income |
| 15 to 24 Years | 22 (1.1%) | $0 |
| 25 to 44 Years | 585 (28.2%) | $106,438 |
| 45 to 64 Years | 713 (34.3%) | $105,750 |
| 65+ Years | 756 (36.4%) | $33,272 |
| Total | 2,076 (100.0%) | $76,729 |
Poverty in Bellingham
Income Below Poverty by Sex and Age in Bellingham
With 2.6% poverty level for males and 3.5% for females among the residents of Bellingham, 75 year old and over males and 35 to 44 year old females are the most vulnerable to poverty, with 20 males (19.6%) and 21 females (10.5%) in their respective age groups living below the poverty level.
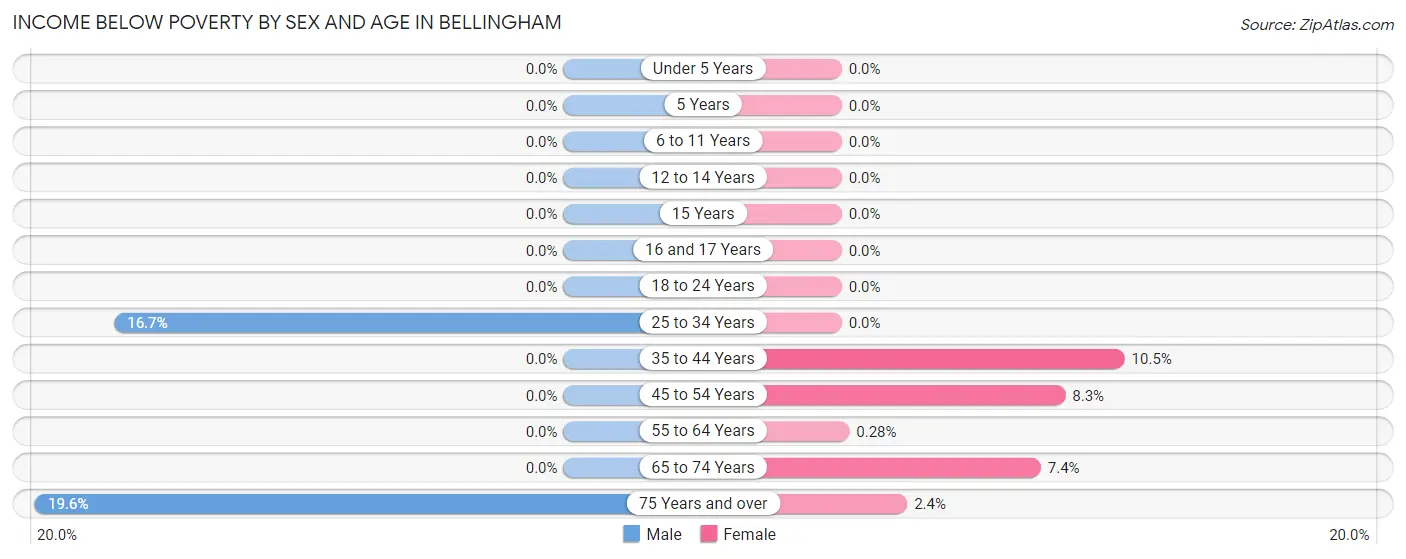
| Age Bracket | Male | Female |
| Under 5 Years | 0 (0.0%) | 0 (0.0%) |
| 5 Years | 0 (0.0%) | 0 (0.0%) |
| 6 to 11 Years | 0 (0.0%) | 0 (0.0%) |
| 12 to 14 Years | 0 (0.0%) | 0 (0.0%) |
| 15 Years | 0 (0.0%) | 0 (0.0%) |
| 16 and 17 Years | 0 (0.0%) | 0 (0.0%) |
| 18 to 24 Years | 0 (0.0%) | 0 (0.0%) |
| 25 to 34 Years | 34 (16.7%) | 0 (0.0%) |
| 35 to 44 Years | 0 (0.0%) | 21 (10.5%) |
| 45 to 54 Years | 0 (0.0%) | 37 (8.3%) |
| 55 to 64 Years | 0 (0.0%) | 1 (0.3%) |
| 65 to 74 Years | 0 (0.0%) | 19 (7.4%) |
| 75 Years and over | 20 (19.6%) | 9 (2.4%) |
| Total | 54 (2.6%) | 87 (3.5%) |
Income Above Poverty by Sex and Age in Bellingham
According to the poverty statistics in Bellingham, males aged under 5 years and females aged under 5 years are the age groups that are most secure financially, with 100.0% of males and 100.0% of females in these age groups living above the poverty line.
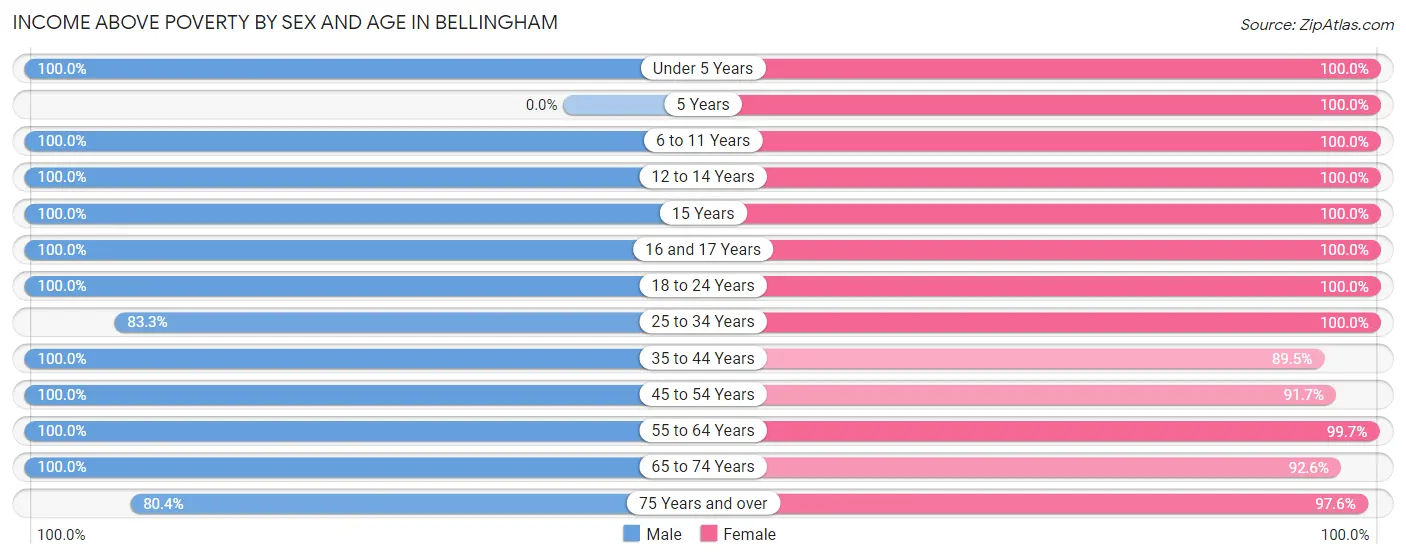
| Age Bracket | Male | Female |
| Under 5 Years | 97 (100.0%) | 86 (100.0%) |
| 5 Years | 0 (0.0%) | 20 (100.0%) |
| 6 to 11 Years | 186 (100.0%) | 213 (100.0%) |
| 12 to 14 Years | 48 (100.0%) | 30 (100.0%) |
| 15 Years | 32 (100.0%) | 27 (100.0%) |
| 16 and 17 Years | 13 (100.0%) | 31 (100.0%) |
| 18 to 24 Years | 337 (100.0%) | 204 (100.0%) |
| 25 to 34 Years | 170 (83.3%) | 267 (100.0%) |
| 35 to 44 Years | 246 (100.0%) | 179 (89.5%) |
| 45 to 54 Years | 317 (100.0%) | 409 (91.7%) |
| 55 to 64 Years | 276 (100.0%) | 358 (99.7%) |
| 65 to 74 Years | 228 (100.0%) | 238 (92.6%) |
| 75 Years and over | 82 (80.4%) | 362 (97.6%) |
| Total | 2,032 (97.4%) | 2,424 (96.5%) |
Income Below Poverty Among Married-Couple Families in Bellingham
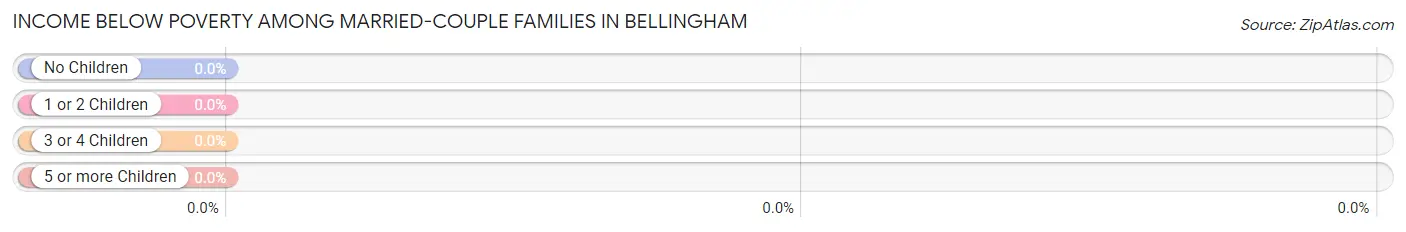
| Children | Above Poverty | Below Poverty |
| No Children | 522 (100.0%) | 0 (0.0%) |
| 1 or 2 Children | 257 (100.0%) | 0 (0.0%) |
| 3 or 4 Children | 39 (100.0%) | 0 (0.0%) |
| 5 or more Children | 0 (0.0%) | 0 (0.0%) |
| Total | 818 (100.0%) | 0 (0.0%) |
Income Below Poverty Among Single-Parent Households in Bellingham
According to the poverty data in Bellingham, 17.5% or 20 single-father households and 10.2% or 21 single-mother households are living below the poverty line. Among single-father households, those with no children have the highest poverty rate, with 20 households (20.0%) experiencing poverty. Likewise, among single-mother households, those with no children have the highest poverty rate, with 21 households (30.4%) falling below the poverty line.
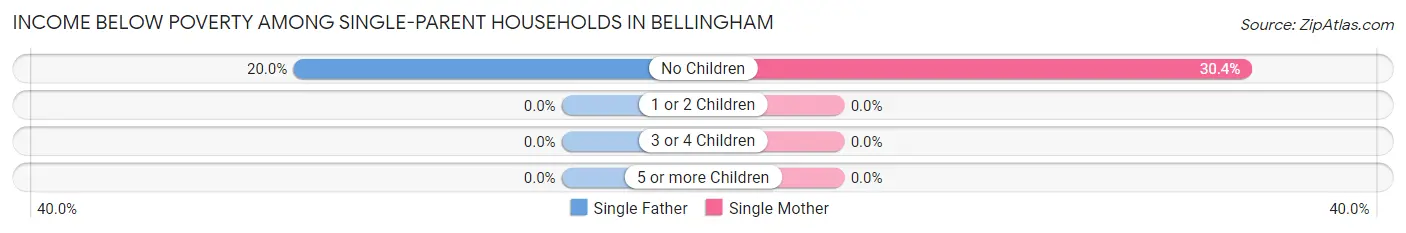
| Children | Single Father | Single Mother |
| No Children | 20 (20.0%) | 21 (30.4%) |
| 1 or 2 Children | 0 (0.0%) | 0 (0.0%) |
| 3 or 4 Children | 0 (0.0%) | 0 (0.0%) |
| 5 or more Children | 0 (0.0%) | 0 (0.0%) |
| Total | 20 (17.5%) | 21 (10.2%) |
Income Below Poverty Among Married-Couple vs Single-Parent Households in Bellingham
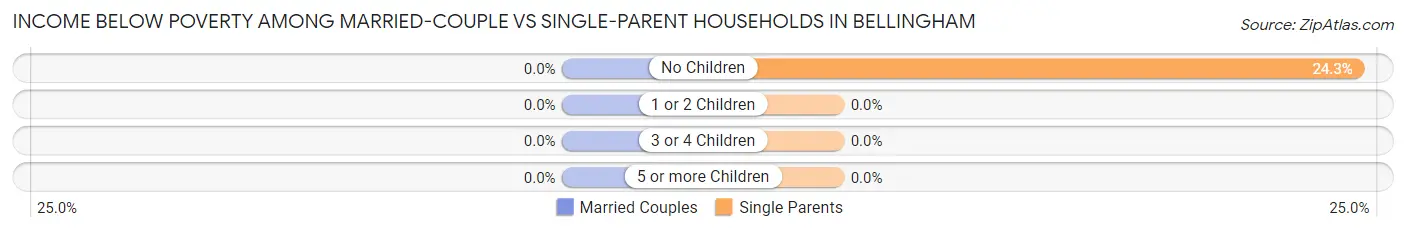
| Children | Married-Couple Families | Single-Parent Households |
| No Children | 0 (0.0%) | 41 (24.3%) |
| 1 or 2 Children | 0 (0.0%) | 0 (0.0%) |
| 3 or 4 Children | 0 (0.0%) | 0 (0.0%) |
| 5 or more Children | 0 (0.0%) | 0 (0.0%) |
| Total | 0 (0.0%) | 41 (12.9%) |
Race in Bellingham
The most populous races in Bellingham are White / Caucasian (4,110 | 88.6%), Hispanic or Latino (206 | 4.4%), and Two or more Races (200 | 4.3%).
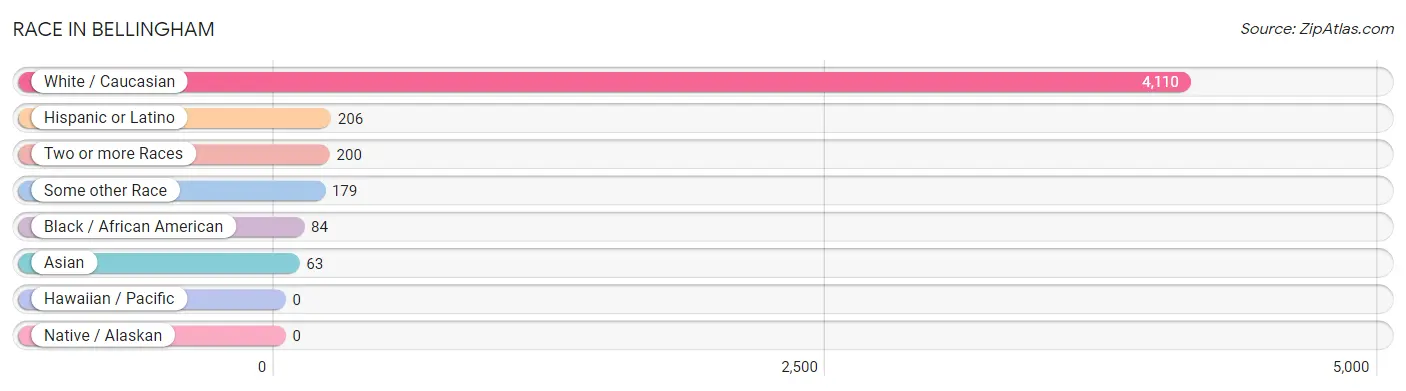
| Race | # Population | % Population |
| Asian | 63 | 1.4% |
| Black / African American | 84 | 1.8% |
| Hawaiian / Pacific | 0 | 0.0% |
| Hispanic or Latino | 206 | 4.4% |
| Native / Alaskan | 0 | 0.0% |
| White / Caucasian | 4,110 | 88.6% |
| Two or more Races | 200 | 4.3% |
| Some other Race | 179 | 3.9% |
| Total | 4,636 | 100.0% |
Ancestry in Bellingham
The most populous ancestries reported in Bellingham are Irish (1,299 | 28.0%), Italian (652 | 14.1%), English (437 | 9.4%), French (338 | 7.3%), and American (291 | 6.3%), together accounting for 65.1% of all Bellingham residents.
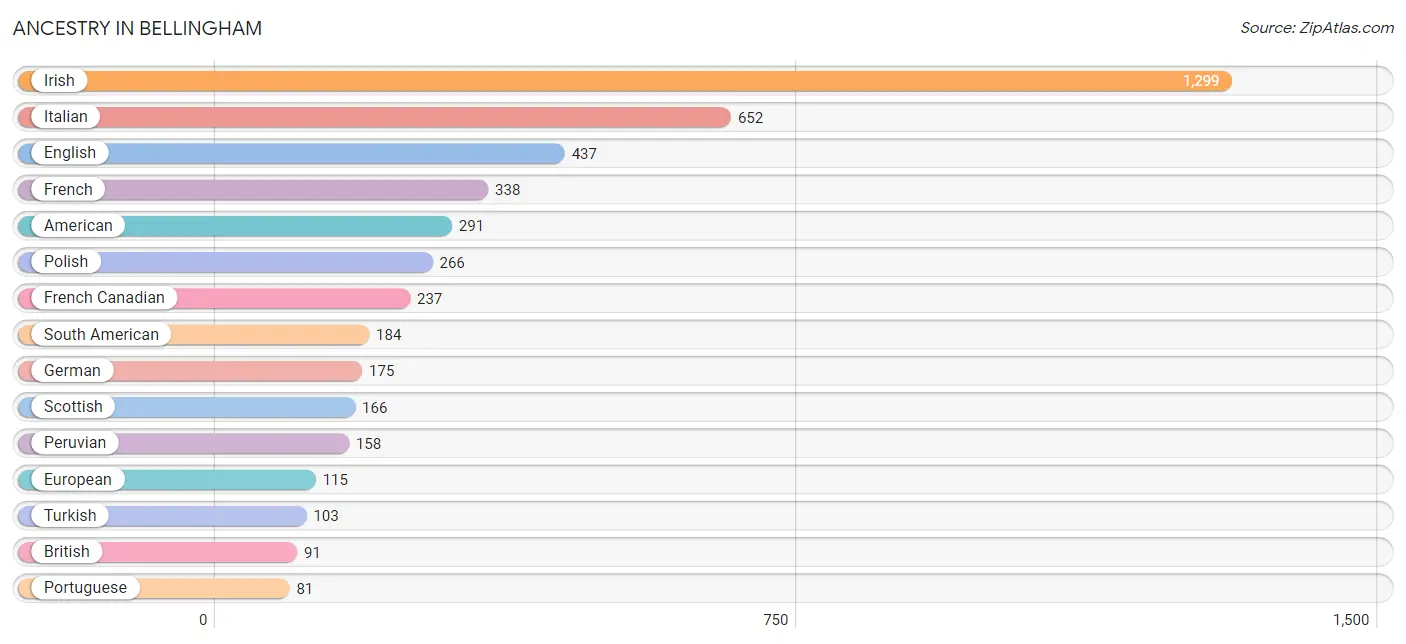
| Ancestry | # Population | % Population |
| American | 291 | 6.3% |
| Arab | 14 | 0.3% |
| Argentinean | 26 | 0.6% |
| Armenian | 33 | 0.7% |
| Bhutanese | 39 | 0.8% |
| Brazilian | 75 | 1.6% |
| British | 91 | 2.0% |
| Burmese | 1 | 0.0% |
| Croatian | 20 | 0.4% |
| Eastern European | 50 | 1.1% |
| English | 437 | 9.4% |
| European | 115 | 2.5% |
| French | 338 | 7.3% |
| French Canadian | 237 | 5.1% |
| German | 175 | 3.8% |
| Greek | 58 | 1.3% |
| Indian (Asian) | 27 | 0.6% |
| Irish | 1,299 | 28.0% |
| Italian | 652 | 14.1% |
| Korean | 37 | 0.8% |
| Lebanese | 14 | 0.3% |
| Lithuanian | 69 | 1.5% |
| Malaysian | 9 | 0.2% |
| Norwegian | 40 | 0.9% |
| Peruvian | 158 | 3.4% |
| Polish | 266 | 5.7% |
| Portuguese | 81 | 1.8% |
| Puerto Rican | 15 | 0.3% |
| Russian | 65 | 1.4% |
| Scotch-Irish | 23 | 0.5% |
| Scottish | 166 | 3.6% |
| South American | 184 | 4.0% |
| Spanish | 4 | 0.1% |
| Swedish | 60 | 1.3% |
| Thai | 8 | 0.2% |
| Turkish | 103 | 2.2% | View All 36 Rows |
Immigrants in Bellingham
The most numerous immigrant groups reported in Bellingham came from Latin America (96 | 2.1%), South America (96 | 2.1%), Asia (80 | 1.7%), Canada (67 | 1.5%), and Europe (67 | 1.5%), together accounting for 8.8% of all Bellingham residents.
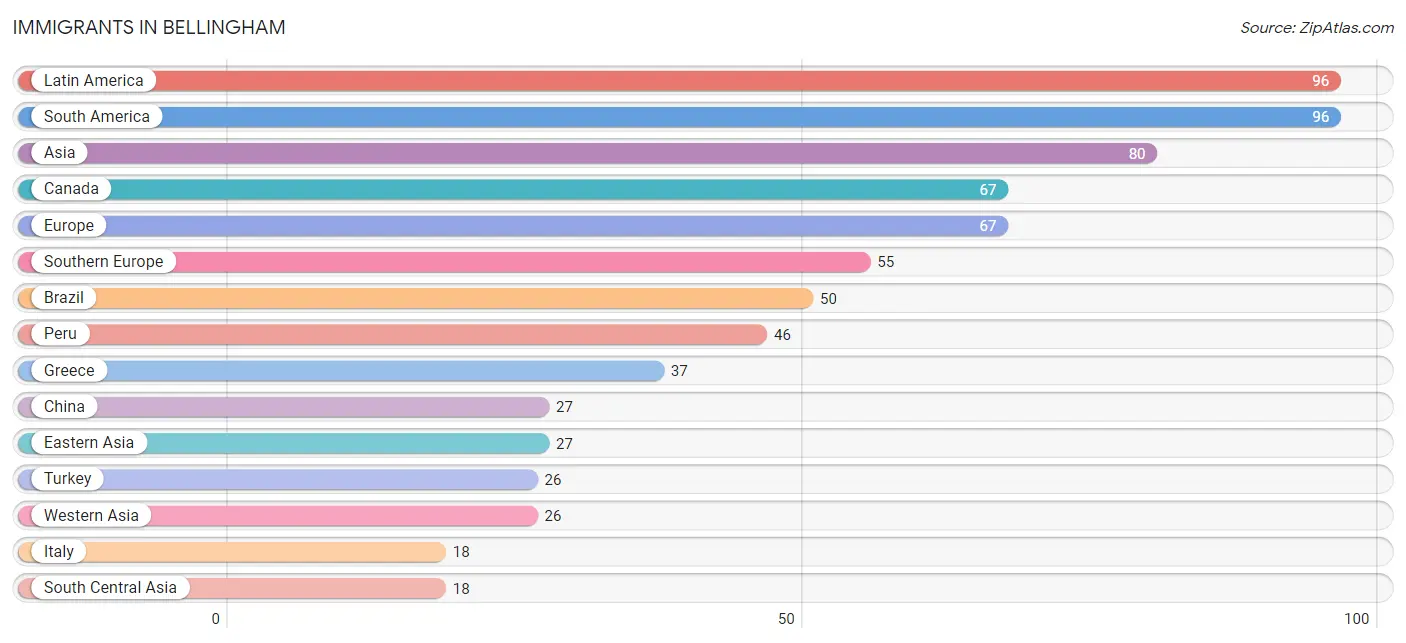
| Immigration Origin | # Population | % Population |
| Asia | 80 | 1.7% |
| Brazil | 50 | 1.1% |
| Canada | 67 | 1.5% |
| China | 27 | 0.6% |
| Eastern Asia | 27 | 0.6% |
| Eastern Europe | 1 | 0.0% |
| England | 11 | 0.2% |
| Europe | 67 | 1.5% |
| Greece | 37 | 0.8% |
| India | 8 | 0.2% |
| Italy | 18 | 0.4% |
| Laos | 9 | 0.2% |
| Latin America | 96 | 2.1% |
| Nepal | 10 | 0.2% |
| Northern Europe | 11 | 0.2% |
| Peru | 46 | 1.0% |
| Poland | 1 | 0.0% |
| South America | 96 | 2.1% |
| South Central Asia | 18 | 0.4% |
| South Eastern Asia | 9 | 0.2% |
| Southern Europe | 55 | 1.2% |
| Turkey | 26 | 0.6% |
| Western Asia | 26 | 0.6% | View All 23 Rows |
Sex and Age in Bellingham
Sex and Age in Bellingham
The most populous age groups in Bellingham are 20 to 24 Years (245 | 11.7%) for men and 50 to 54 Years (290 | 11.4%) for women.
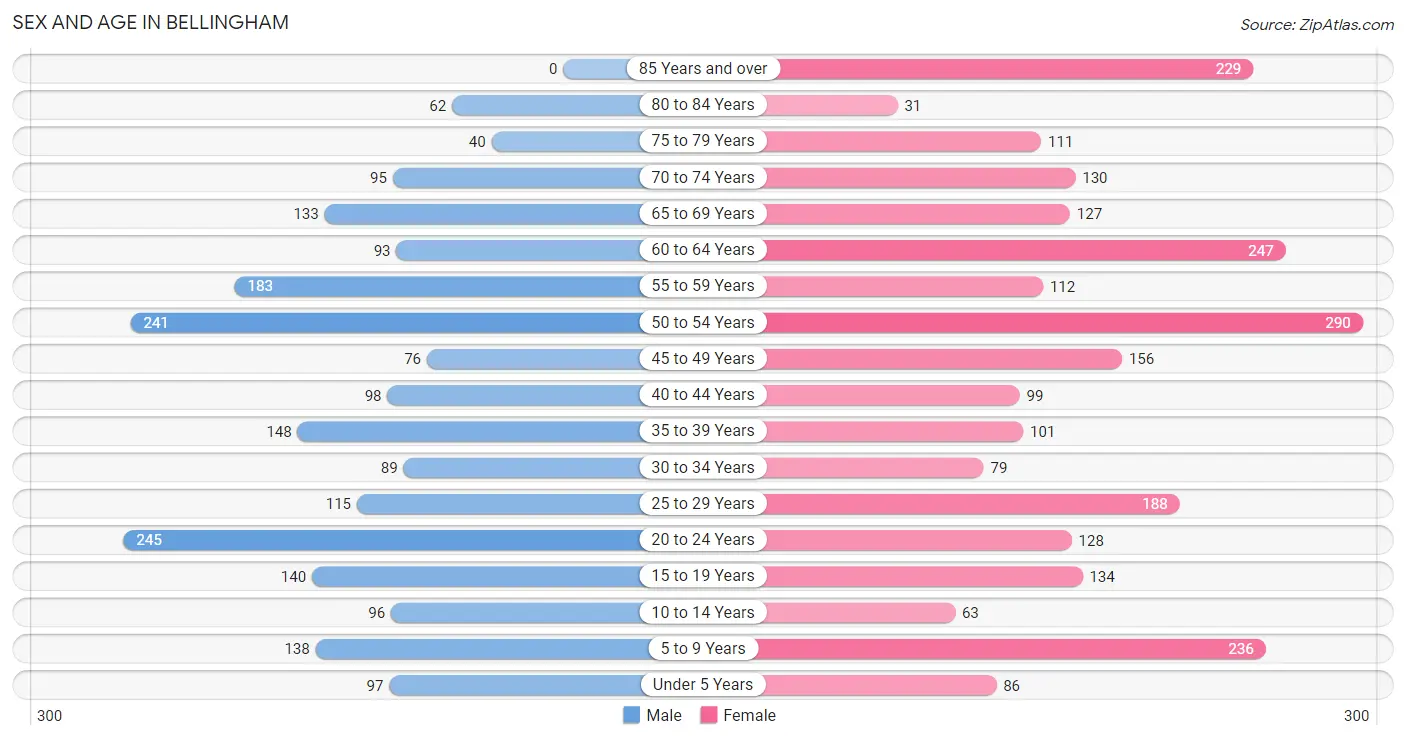
| Age Bracket | Male | Female |
| Under 5 Years | 97 (4.6%) | 86 (3.4%) |
| 5 to 9 Years | 138 (6.6%) | 236 (9.3%) |
| 10 to 14 Years | 96 (4.6%) | 63 (2.5%) |
| 15 to 19 Years | 140 (6.7%) | 134 (5.3%) |
| 20 to 24 Years | 245 (11.7%) | 128 (5.0%) |
| 25 to 29 Years | 115 (5.5%) | 188 (7.4%) |
| 30 to 34 Years | 89 (4.3%) | 79 (3.1%) |
| 35 to 39 Years | 148 (7.1%) | 101 (4.0%) |
| 40 to 44 Years | 98 (4.7%) | 99 (3.9%) |
| 45 to 49 Years | 76 (3.6%) | 156 (6.1%) |
| 50 to 54 Years | 241 (11.5%) | 290 (11.4%) |
| 55 to 59 Years | 183 (8.8%) | 112 (4.4%) |
| 60 to 64 Years | 93 (4.4%) | 247 (9.7%) |
| 65 to 69 Years | 133 (6.4%) | 127 (5.0%) |
| 70 to 74 Years | 95 (4.5%) | 130 (5.1%) |
| 75 to 79 Years | 40 (1.9%) | 111 (4.4%) |
| 80 to 84 Years | 62 (3.0%) | 31 (1.2%) |
| 85 Years and over | 0 (0.0%) | 229 (9.0%) |
| Total | 2,089 (100.0%) | 2,547 (100.0%) |
Families and Households in Bellingham
Median Family Size in Bellingham
The median family size in Bellingham is 3.07 persons per family, with married-couple families (818 | 71.9%) accounting for the largest median family size of 3.26 persons per family. On the other hand, single male/father families (114 | 10.0%) represent the smallest median family size with 2.39 persons per family.
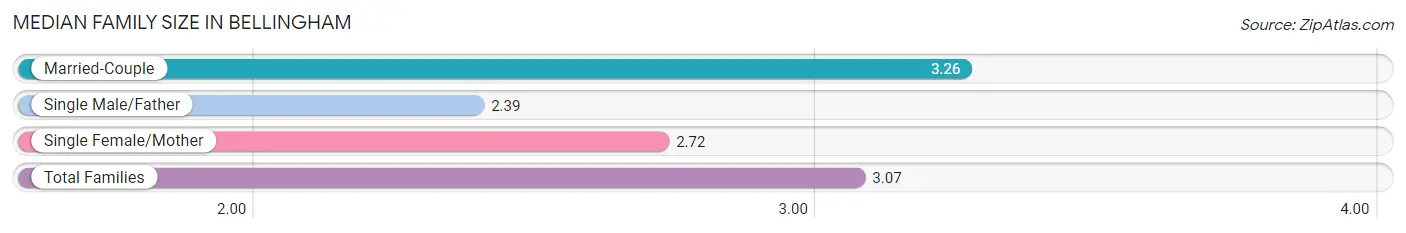
| Family Type | # Families | Family Size |
| Married-Couple | 818 (71.9%) | 3.26 |
| Single Male/Father | 114 (10.0%) | 2.39 |
| Single Female/Mother | 205 (18.0%) | 2.72 |
| Total Families | 1,137 (100.0%) | 3.07 |
Median Household Size in Bellingham
The median household size in Bellingham is 2.23 persons per household, with married-couple households (818 | 39.4%) accounting for the largest median household size of 3.26 persons per household. non-family households (939 | 45.2%) represent the smallest median household size with 1.13 persons per household.
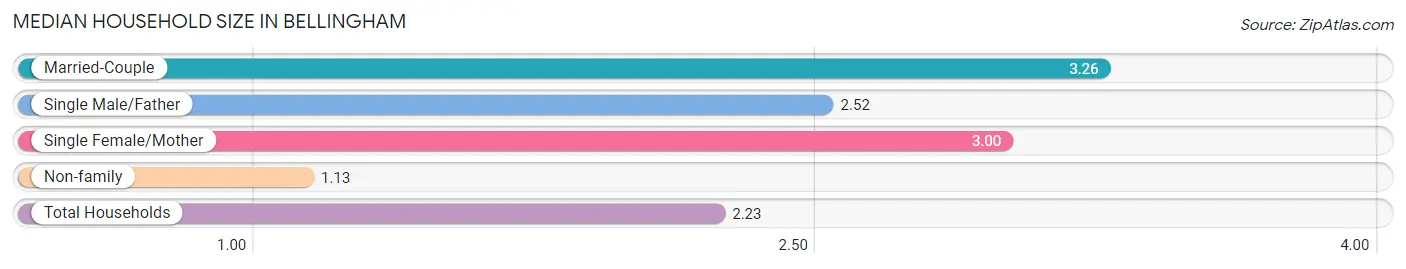
| Household Type | # Households | Household Size |
| Married-Couple | 818 (39.4%) | 3.26 |
| Single Male/Father | 114 (5.5%) | 2.52 |
| Single Female/Mother | 205 (9.9%) | 3.00 |
| Non-family | 939 (45.2%) | 1.13 |
| Total Households | 2,076 (100.0%) | 2.23 |
Household Size by Marriage Status in Bellingham
Out of a total of 2,076 households in Bellingham, 1,137 (54.8%) are family households, while 939 (45.2%) are nonfamily households. The most numerous type of family households are 3-person households, comprising 558, and the most common type of nonfamily households are 1-person households, comprising 813.
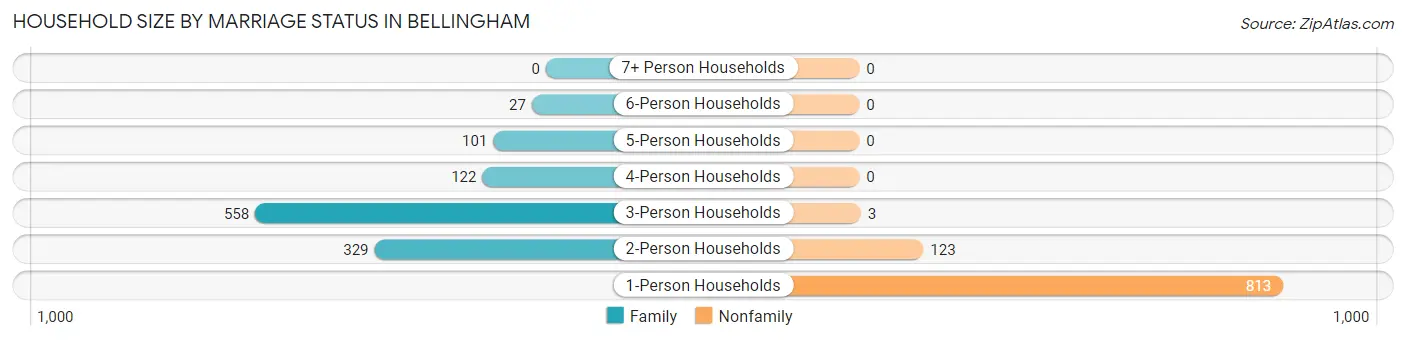
| Household Size | Family Households | Nonfamily Households |
| 1-Person Households | - | 813 (39.2%) |
| 2-Person Households | 329 (15.9%) | 123 (5.9%) |
| 3-Person Households | 558 (26.9%) | 3 (0.1%) |
| 4-Person Households | 122 (5.9%) | 0 (0.0%) |
| 5-Person Households | 101 (4.9%) | 0 (0.0%) |
| 6-Person Households | 27 (1.3%) | 0 (0.0%) |
| 7+ Person Households | 0 (0.0%) | 0 (0.0%) |
| Total | 1,137 (54.8%) | 939 (45.2%) |
Female Fertility in Bellingham
Fertility by Age in Bellingham
Average fertility rate in Bellingham is 18.0 births per 1,000 women. Women in the age bracket of 20 to 34 years have the highest fertility rate with 43.0 births per 1,000 women. Women in the age bracket of 20 to 34 years acount for 100.0% of all women with births.
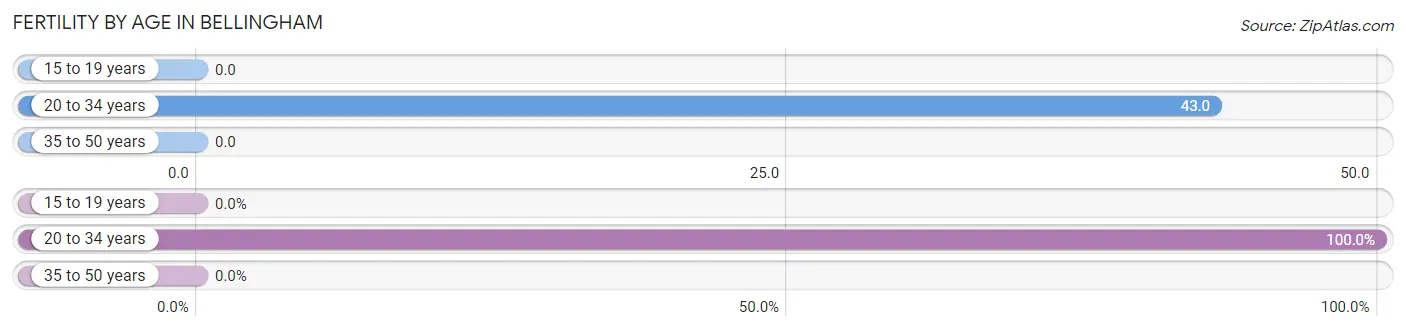
| Age Bracket | Women with Births | Births / 1,000 Women |
| 15 to 19 years | 0 (0.0%) | 0.0 |
| 20 to 34 years | 17 (100.0%) | 43.0 |
| 35 to 50 years | 0 (0.0%) | 0.0 |
| Total | 17 (100.0%) | 18.0 |
Fertility by Age by Marriage Status in Bellingham
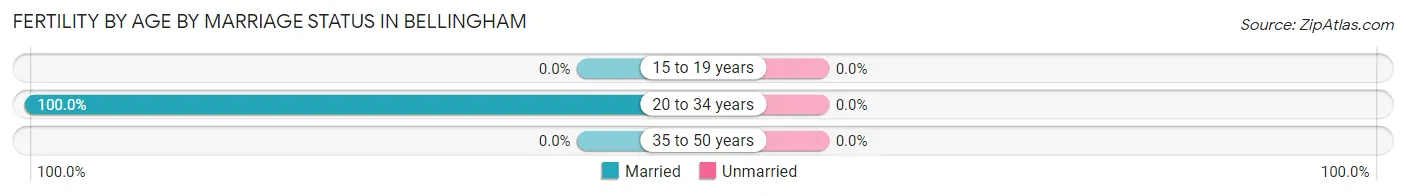
| Age Bracket | Married | Unmarried |
| 15 to 19 years | 0 (0.0%) | 0 (0.0%) |
| 20 to 34 years | 17 (100.0%) | 0 (0.0%) |
| 35 to 50 years | 0 (0.0%) | 0 (0.0%) |
| Total | 17 (100.0%) | 0 (0.0%) |
Fertility by Education in Bellingham
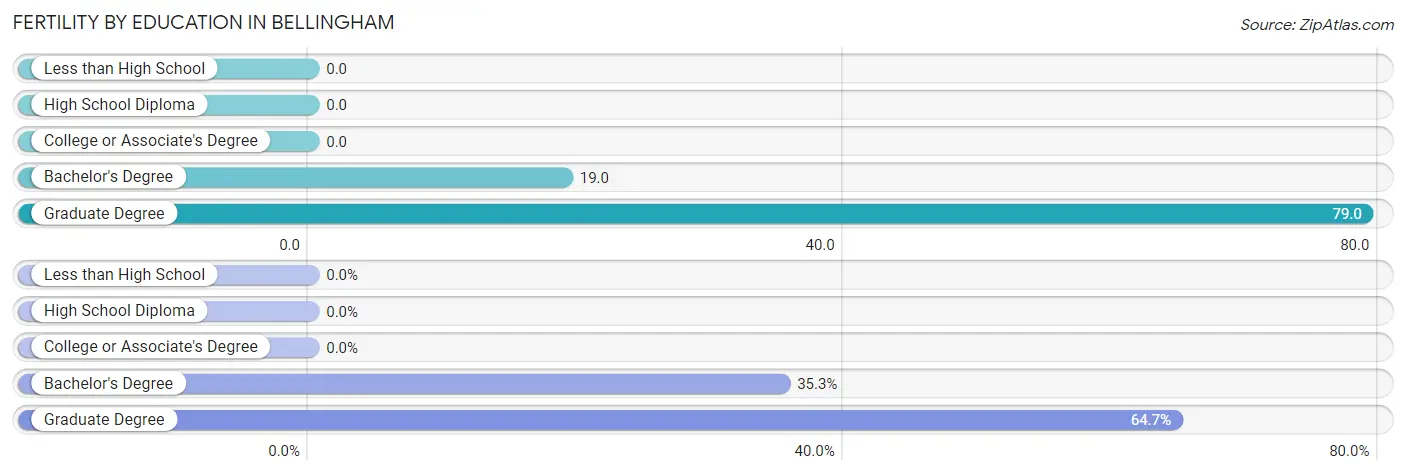
| Educational Attainment | Women with Births | Births / 1,000 Women |
| Less than High School | 0 (0.0%) | 0.0 |
| High School Diploma | 0 (0.0%) | 0.0 |
| College or Associate's Degree | 0 (0.0%) | 0.0 |
| Bachelor's Degree | 6 (35.3%) | 19.0 |
| Graduate Degree | 11 (64.7%) | 79.0 |
| Total | 17 (100.0%) | 18.0 |
Fertility by Education by Marriage Status in Bellingham
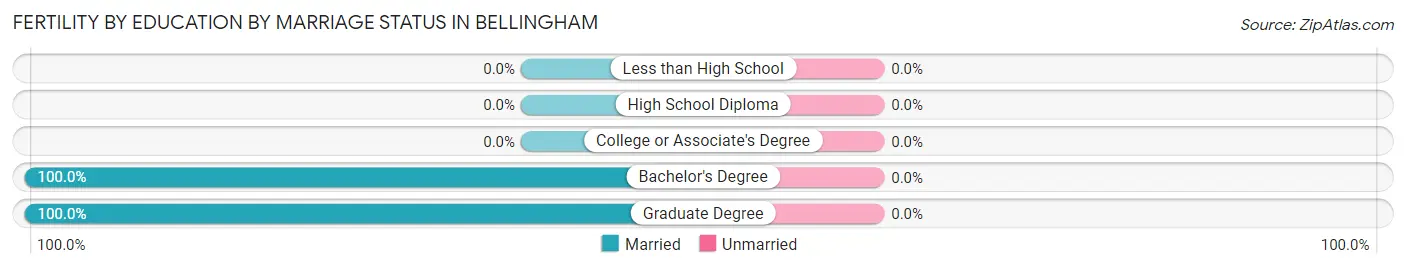
| Educational Attainment | Married | Unmarried |
| Less than High School | 0 (0.0%) | 0 (0.0%) |
| High School Diploma | 0 (0.0%) | 0 (0.0%) |
| College or Associate's Degree | 0 (0.0%) | 0 (0.0%) |
| Bachelor's Degree | 6 (100.0%) | 0 (0.0%) |
| Graduate Degree | 11 (100.0%) | 0 (0.0%) |
| Total | 17 (100.0%) | 0 (0.0%) |
Employment Characteristics in Bellingham
Employment by Class of Employer in Bellingham
Among the 2,189 employed individuals in Bellingham, private company employees (1,617 | 73.9%), not-for-profit organizations (233 | 10.6%), and self-employed (not incorporated) (132 | 6.0%) make up the most common classes of employment.
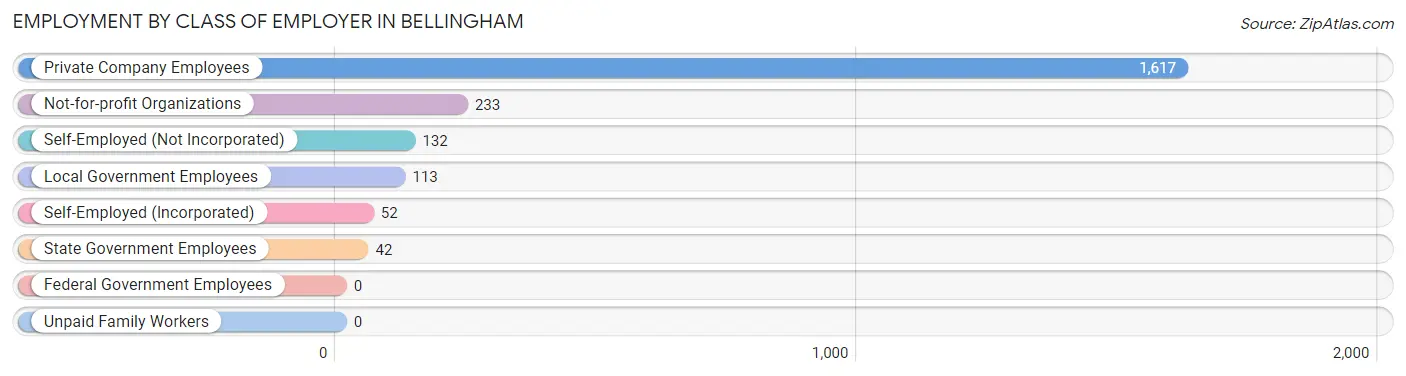
| Employer Class | # Employees | % Employees |
| Private Company Employees | 1,617 | 73.9% |
| Self-Employed (Incorporated) | 52 | 2.4% |
| Self-Employed (Not Incorporated) | 132 | 6.0% |
| Not-for-profit Organizations | 233 | 10.6% |
| Local Government Employees | 113 | 5.2% |
| State Government Employees | 42 | 1.9% |
| Federal Government Employees | 0 | 0.0% |
| Unpaid Family Workers | 0 | 0.0% |
| Total | 2,189 | 100.0% |
Employment Status by Age in Bellingham
According to the labor force statistics for Bellingham, out of the total population over 16 years of age (3,861), 69.4% or 2,680 individuals are in the labor force, with 10.4% or 279 of them unemployed. The age group with the highest labor force participation rate is 25 to 29 years, with 100.0% or 303 individuals in the labor force. Within the labor force, the 20 to 24 years age range has the highest percentage of unemployed individuals, with 42.9% or 151 of them being unemployed.
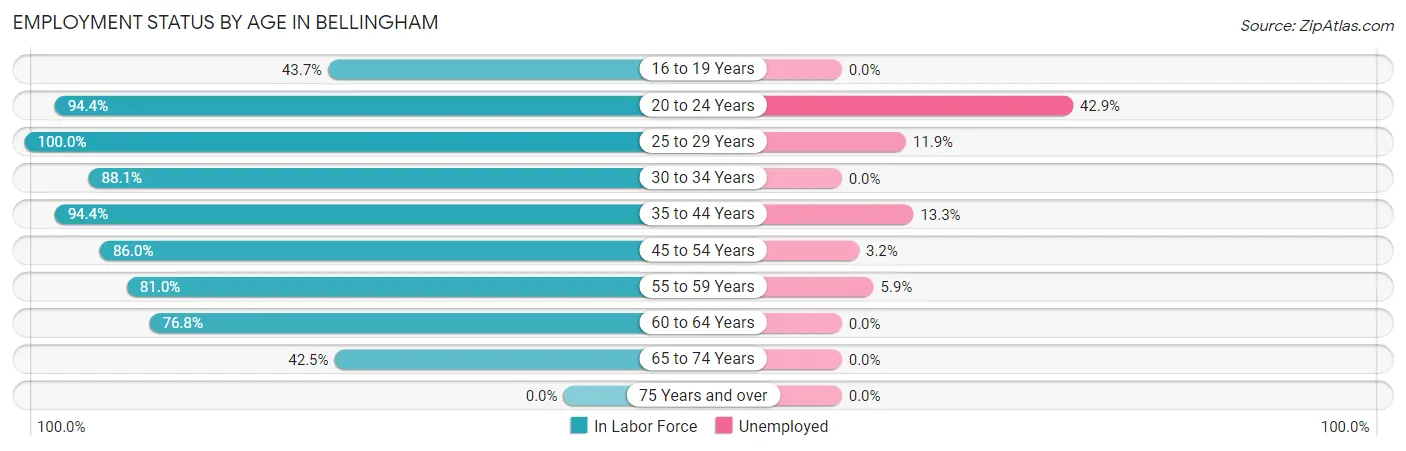
| Age Bracket | In Labor Force | Unemployed |
| 16 to 19 Years | 94 (43.7%) | 0 (0.0%) |
| 20 to 24 Years | 352 (94.4%) | 151 (42.9%) |
| 25 to 29 Years | 303 (100.0%) | 36 (11.9%) |
| 30 to 34 Years | 148 (88.1%) | 0 (0.0%) |
| 35 to 44 Years | 421 (94.4%) | 56 (13.3%) |
| 45 to 54 Years | 656 (86.0%) | 21 (3.2%) |
| 55 to 59 Years | 239 (81.0%) | 14 (5.9%) |
| 60 to 64 Years | 261 (76.8%) | 0 (0.0%) |
| 65 to 74 Years | 206 (42.5%) | 0 (0.0%) |
| 75 Years and over | 0 (0.0%) | 0 (0.0%) |
| Total | 2,680 (69.4%) | 279 (10.4%) |
Employment Status by Educational Attainment in Bellingham
According to labor force statistics for Bellingham, 87.6% of individuals (2,028) out of the total population between 25 and 64 years of age (2,315) are in the labor force, with 6.3% or 128 of them being unemployed. The group with the highest labor force participation rate are those with the educational attainment of less than high school, with 100.0% or 27 individuals in the labor force. Within the labor force, individuals with less than high school education have the highest percentage of unemployment, with 51.9% or 14 of them being unemployed.
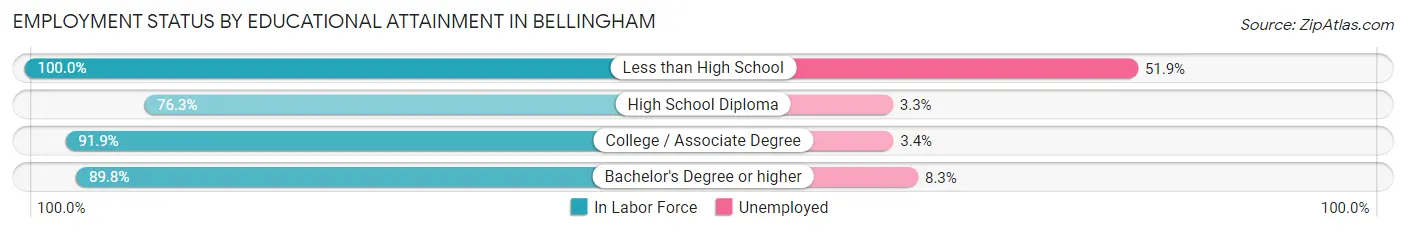
| Educational Attainment | In Labor Force | Unemployed |
| Less than High School | 27 (100.0%) | 14 (51.9%) |
| High School Diploma | 390 (76.3%) | 17 (3.3%) |
| College / Associate Degree | 682 (91.9%) | 25 (3.4%) |
| Bachelor's Degree or higher | 929 (89.8%) | 86 (8.3%) |
| Total | 2,028 (87.6%) | 146 (6.3%) |
Employment Occupations by Sex in Bellingham
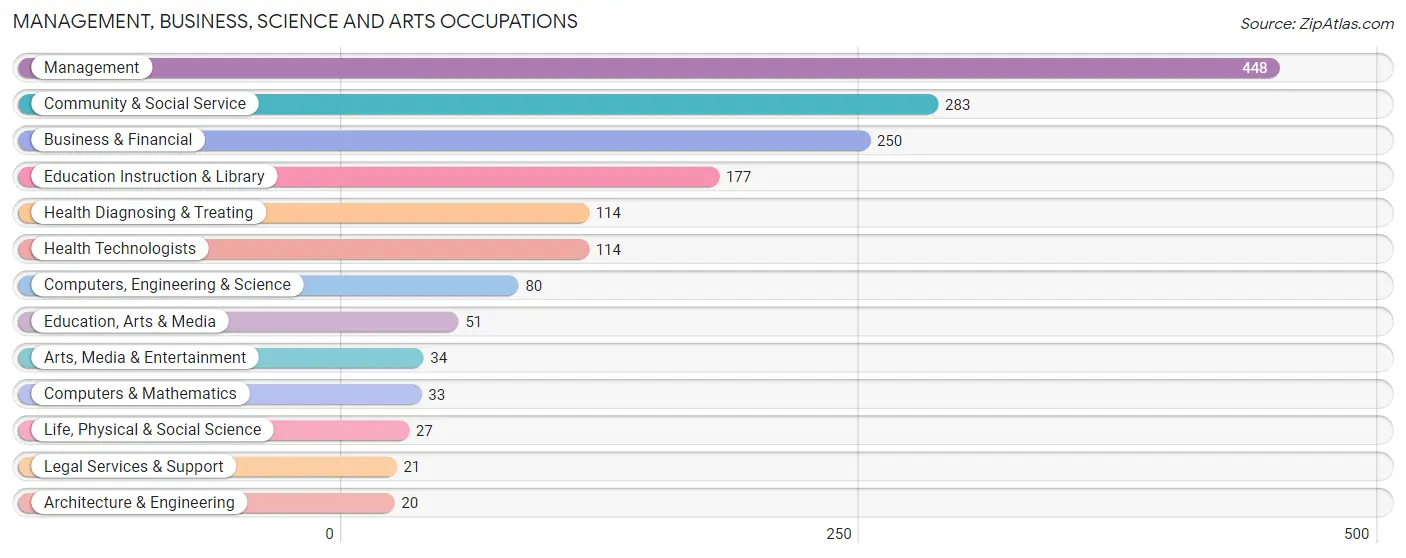
Management, Business, Science and Arts Occupations
The most common Management, Business, Science and Arts occupations in Bellingham are Management (448 | 18.6%), Community & Social Service (283 | 11.8%), Business & Financial (250 | 10.4%), Education Instruction & Library (177 | 7.4%), and Health Diagnosing & Treating (114 | 4.8%).
Management, Business, Science and Arts Occupations by Sex
Within the Management, Business, Science and Arts occupations in Bellingham, the most male-oriented occupations are Computers & Mathematics (100.0%), Architecture & Engineering (100.0%), and Computers, Engineering & Science (80.0%), while the most female-oriented occupations are Education Instruction & Library (100.0%), Health Diagnosing & Treating (88.6%), and Health Technologists (88.6%).
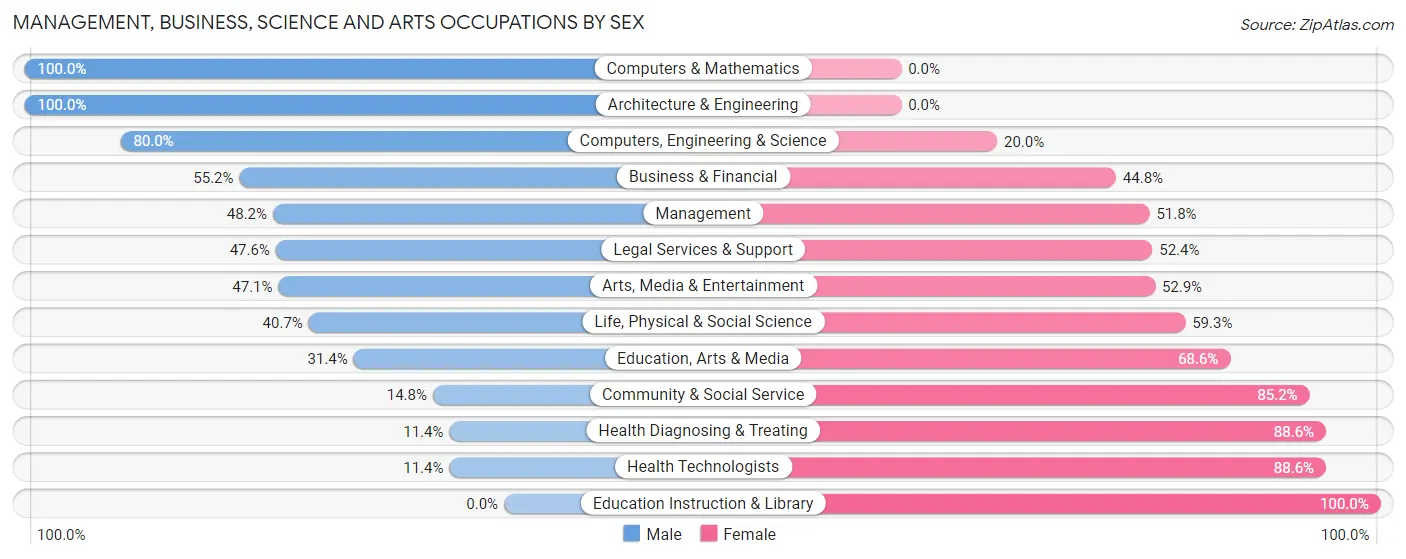
| Occupation | Male | Female |
| Management | 216 (48.2%) | 232 (51.8%) |
| Business & Financial | 138 (55.2%) | 112 (44.8%) |
| Computers, Engineering & Science | 64 (80.0%) | 16 (20.0%) |
| Computers & Mathematics | 33 (100.0%) | 0 (0.0%) |
| Architecture & Engineering | 20 (100.0%) | 0 (0.0%) |
| Life, Physical & Social Science | 11 (40.7%) | 16 (59.3%) |
| Community & Social Service | 42 (14.8%) | 241 (85.2%) |
| Education, Arts & Media | 16 (31.4%) | 35 (68.6%) |
| Legal Services & Support | 10 (47.6%) | 11 (52.4%) |
| Education Instruction & Library | 0 (0.0%) | 177 (100.0%) |
| Arts, Media & Entertainment | 16 (47.1%) | 18 (52.9%) |
| Health Diagnosing & Treating | 13 (11.4%) | 101 (88.6%) |
| Health Technologists | 13 (11.4%) | 101 (88.6%) |
| Total (Category) | 473 (40.3%) | 702 (59.7%) |
| Total (Overall) | 1,211 (50.4%) | 1,191 (49.6%) |
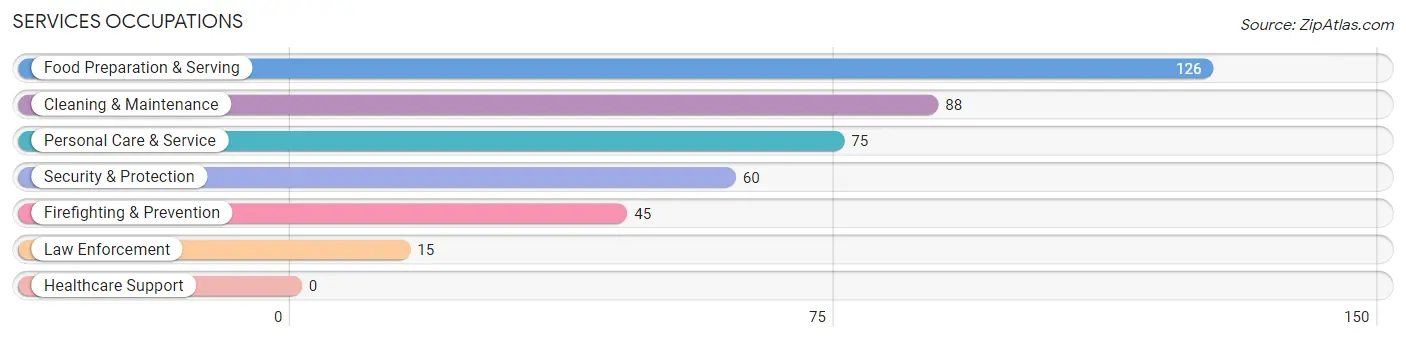
Services Occupations
The most common Services occupations in Bellingham are Food Preparation & Serving (126 | 5.2%), Cleaning & Maintenance (88 | 3.7%), Personal Care & Service (75 | 3.1%), Security & Protection (60 | 2.5%), and Firefighting & Prevention (45 | 1.9%).
Services Occupations by Sex
Within the Services occupations in Bellingham, the most male-oriented occupations are Law Enforcement (100.0%), Security & Protection (80.0%), and Firefighting & Prevention (73.3%), while the most female-oriented occupations are Personal Care & Service (77.3%), Cleaning & Maintenance (69.3%), and Food Preparation & Serving (34.1%).
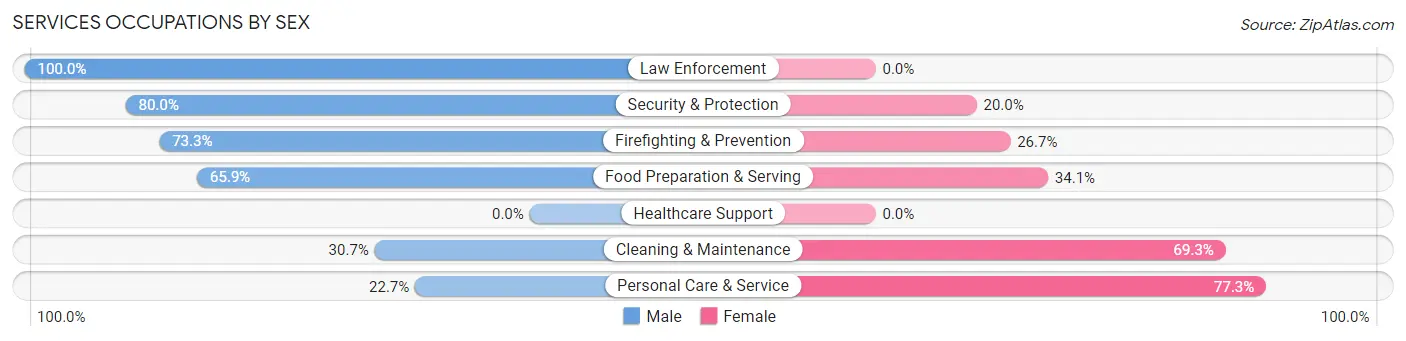
| Occupation | Male | Female |
| Healthcare Support | 0 (0.0%) | 0 (0.0%) |
| Security & Protection | 48 (80.0%) | 12 (20.0%) |
| Firefighting & Prevention | 33 (73.3%) | 12 (26.7%) |
| Law Enforcement | 15 (100.0%) | 0 (0.0%) |
| Food Preparation & Serving | 83 (65.9%) | 43 (34.1%) |
| Cleaning & Maintenance | 27 (30.7%) | 61 (69.3%) |
| Personal Care & Service | 17 (22.7%) | 58 (77.3%) |
| Total (Category) | 175 (50.1%) | 174 (49.9%) |
| Total (Overall) | 1,211 (50.4%) | 1,191 (49.6%) |
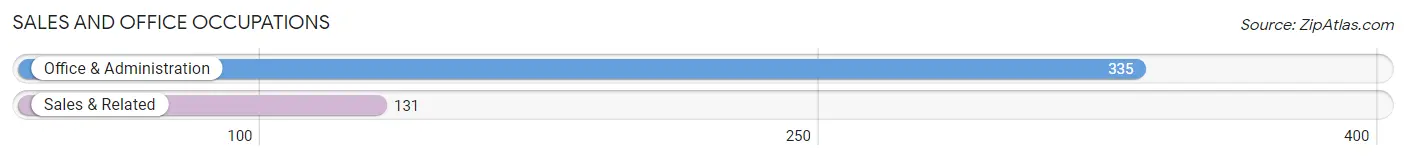
Sales and Office Occupations
The most common Sales and Office occupations in Bellingham are Office & Administration (335 | 14.0%), and Sales & Related (131 | 5.4%).
Sales and Office Occupations by Sex
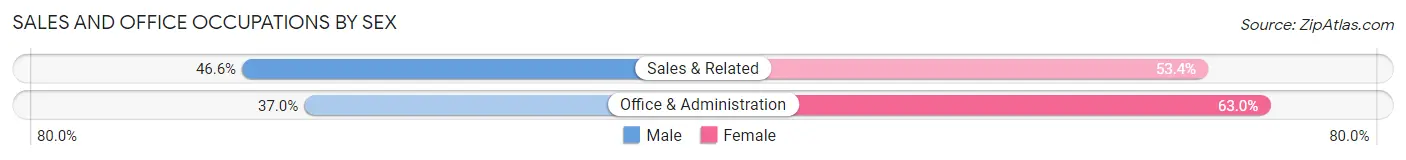
| Occupation | Male | Female |
| Sales & Related | 61 (46.6%) | 70 (53.4%) |
| Office & Administration | 124 (37.0%) | 211 (63.0%) |
| Total (Category) | 185 (39.7%) | 281 (60.3%) |
| Total (Overall) | 1,211 (50.4%) | 1,191 (49.6%) |
Natural Resources, Construction and Maintenance Occupations
The most common Natural Resources, Construction and Maintenance occupations in Bellingham are Construction & Extraction (123 | 5.1%), and Installation, Maintenance & Repair (86 | 3.6%).
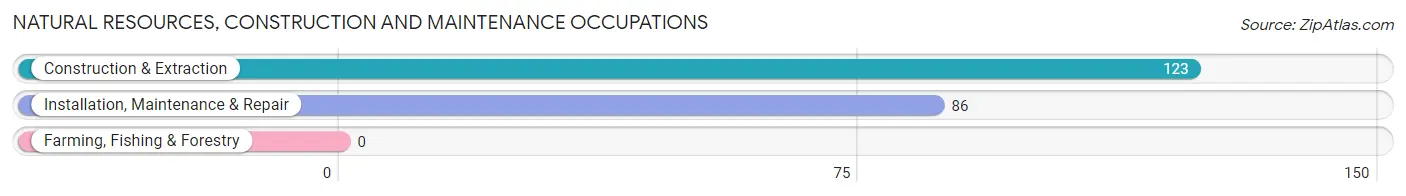
Natural Resources, Construction and Maintenance Occupations by Sex
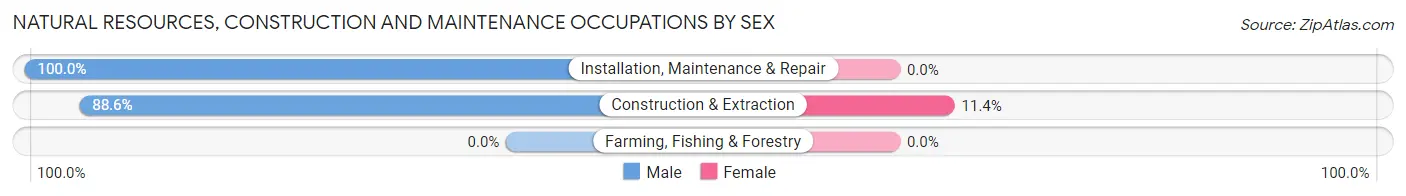
| Occupation | Male | Female |
| Farming, Fishing & Forestry | 0 (0.0%) | 0 (0.0%) |
| Construction & Extraction | 109 (88.6%) | 14 (11.4%) |
| Installation, Maintenance & Repair | 86 (100.0%) | 0 (0.0%) |
| Total (Category) | 195 (93.3%) | 14 (6.7%) |
| Total (Overall) | 1,211 (50.4%) | 1,191 (49.6%) |
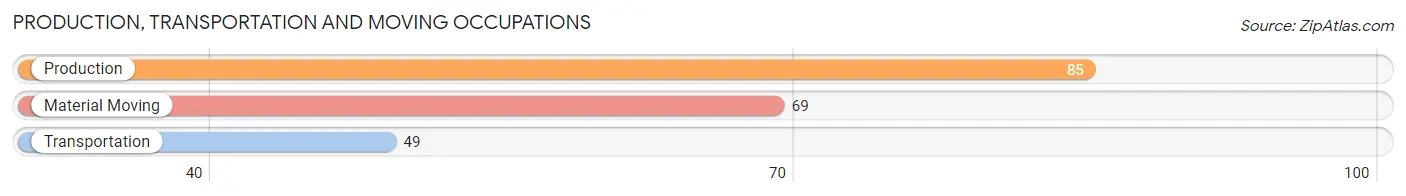
Production, Transportation and Moving Occupations
The most common Production, Transportation and Moving occupations in Bellingham are Production (85 | 3.5%), Material Moving (69 | 2.9%), and Transportation (49 | 2.0%).
Production, Transportation and Moving Occupations by Sex
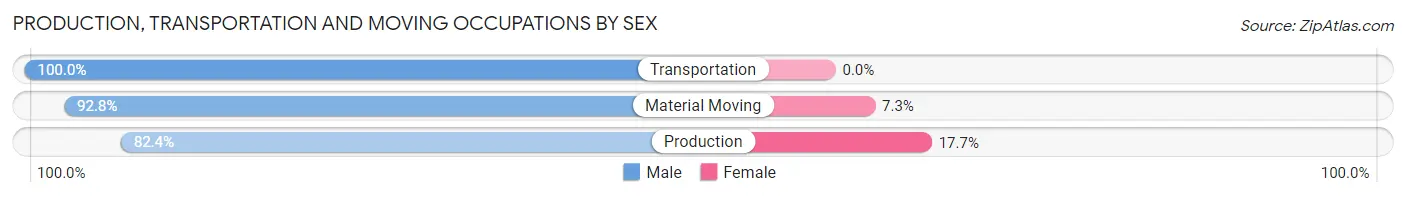
| Occupation | Male | Female |
| Production | 70 (82.4%) | 15 (17.6%) |
| Transportation | 49 (100.0%) | 0 (0.0%) |
| Material Moving | 64 (92.7%) | 5 (7.2%) |
| Total (Category) | 183 (90.1%) | 20 (9.9%) |
| Total (Overall) | 1,211 (50.4%) | 1,191 (49.6%) |
Employment Industries by Sex in Bellingham
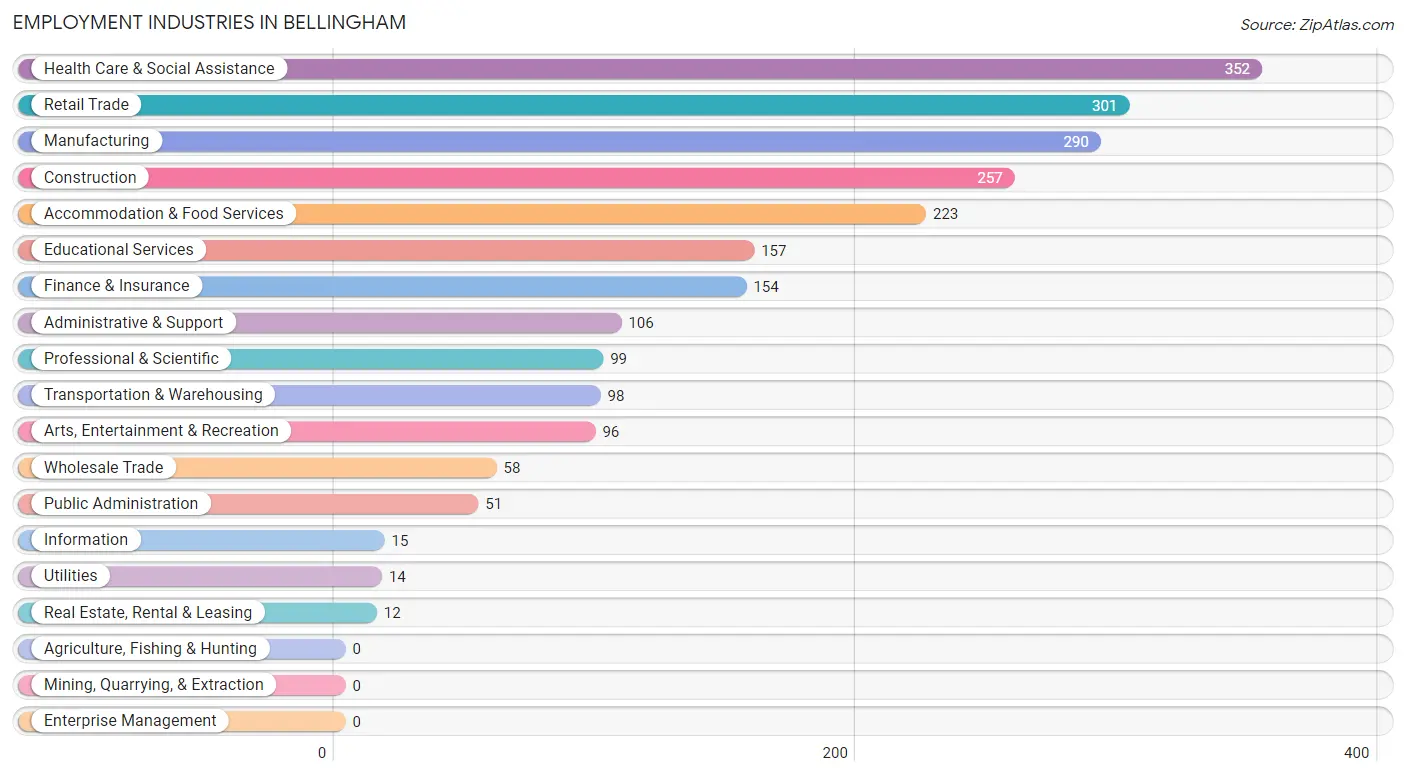
Employment Industries in Bellingham
The major employment industries in Bellingham include Health Care & Social Assistance (352 | 14.6%), Retail Trade (301 | 12.5%), Manufacturing (290 | 12.1%), Construction (257 | 10.7%), and Accommodation & Food Services (223 | 9.3%).
Employment Industries by Sex in Bellingham
The Bellingham industries that see more men than women are Information (100.0%), Real Estate, Rental & Leasing (100.0%), and Construction (89.1%), whereas the industries that tend to have a higher number of women are Utilities (100.0%), Arts, Entertainment & Recreation (96.9%), and Health Care & Social Assistance (90.3%).
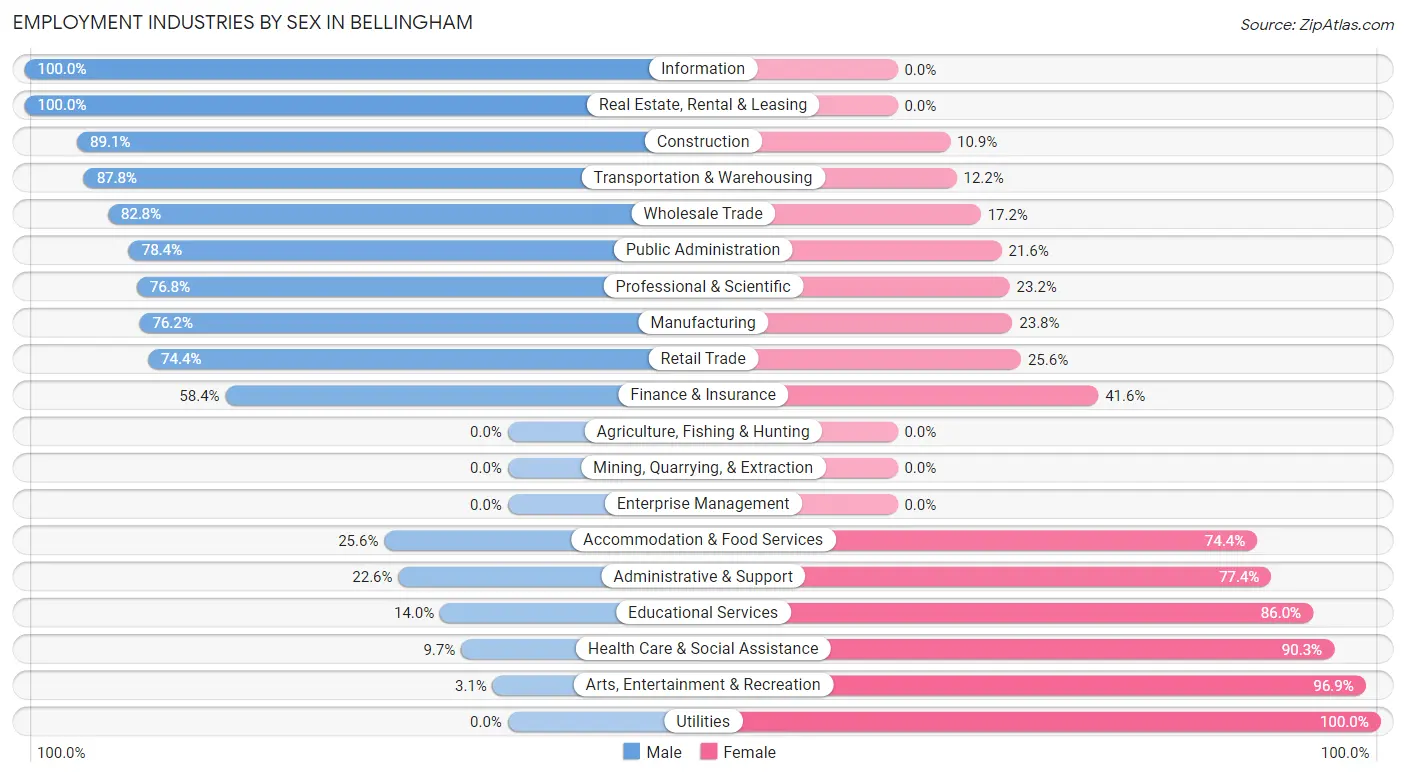
| Industry | Male | Female |
| Agriculture, Fishing & Hunting | 0 (0.0%) | 0 (0.0%) |
| Mining, Quarrying, & Extraction | 0 (0.0%) | 0 (0.0%) |
| Construction | 229 (89.1%) | 28 (10.9%) |
| Manufacturing | 221 (76.2%) | 69 (23.8%) |
| Wholesale Trade | 48 (82.8%) | 10 (17.2%) |
| Retail Trade | 224 (74.4%) | 77 (25.6%) |
| Transportation & Warehousing | 86 (87.8%) | 12 (12.2%) |
| Utilities | 0 (0.0%) | 14 (100.0%) |
| Information | 15 (100.0%) | 0 (0.0%) |
| Finance & Insurance | 90 (58.4%) | 64 (41.6%) |
| Real Estate, Rental & Leasing | 12 (100.0%) | 0 (0.0%) |
| Professional & Scientific | 76 (76.8%) | 23 (23.2%) |
| Enterprise Management | 0 (0.0%) | 0 (0.0%) |
| Administrative & Support | 24 (22.6%) | 82 (77.4%) |
| Educational Services | 22 (14.0%) | 135 (86.0%) |
| Health Care & Social Assistance | 34 (9.7%) | 318 (90.3%) |
| Arts, Entertainment & Recreation | 3 (3.1%) | 93 (96.9%) |
| Accommodation & Food Services | 57 (25.6%) | 166 (74.4%) |
| Public Administration | 40 (78.4%) | 11 (21.6%) |
| Total | 1,211 (50.4%) | 1,191 (49.6%) |
Education in Bellingham
School Enrollment in Bellingham
The most common levels of schooling among the 882 students in Bellingham are elementary school (394 | 44.7%), high school (211 | 23.9%), and middle school (104 | 11.8%).
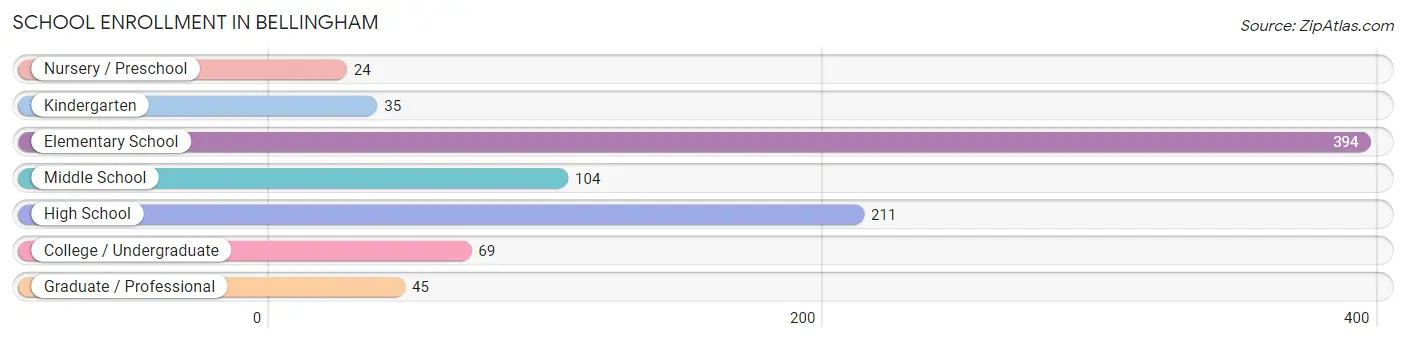
| School Level | # Students | % Students |
| Nursery / Preschool | 24 | 2.7% |
| Kindergarten | 35 | 4.0% |
| Elementary School | 394 | 44.7% |
| Middle School | 104 | 11.8% |
| High School | 211 | 23.9% |
| College / Undergraduate | 69 | 7.8% |
| Graduate / Professional | 45 | 5.1% |
| Total | 882 | 100.0% |
School Enrollment by Age by Funding Source in Bellingham
Out of a total of 882 students who are enrolled in schools in Bellingham, 104 (11.8%) attend a private institution, while the remaining 778 (88.2%) are enrolled in public schools. The age group of 20 to 24 year olds has the highest likelihood of being enrolled in private schools, with 22 (100.0% in the age bracket) enrolled. Conversely, the age group of 3 to 4 year olds has the lowest likelihood of being enrolled in a private school, with 24 (100.0% in the age bracket) attending a public institution.
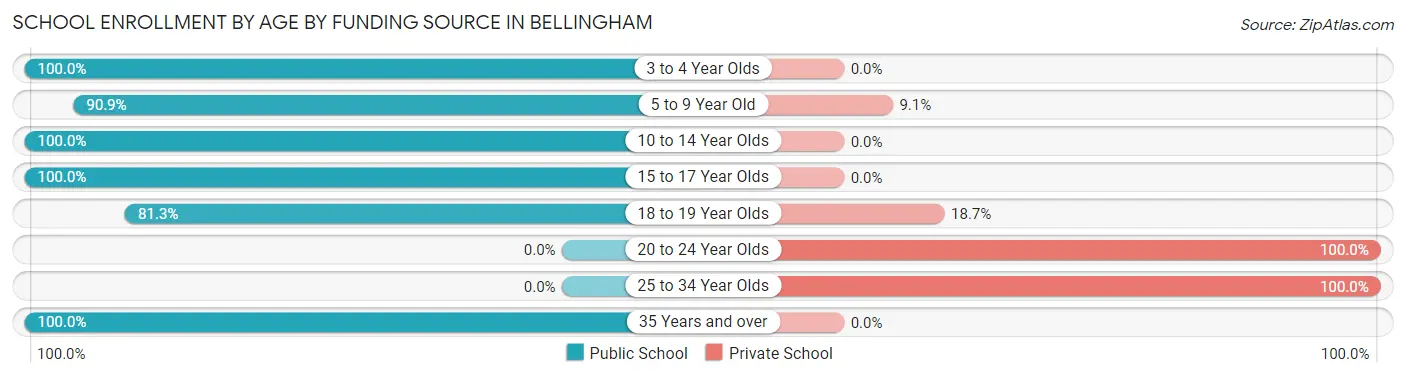
| Age Bracket | Public School | Private School |
| 3 to 4 Year Olds | 24 (100.0%) | 0 (0.0%) |
| 5 to 9 Year Old | 340 (90.9%) | 34 (9.1%) |
| 10 to 14 Year Olds | 159 (100.0%) | 0 (0.0%) |
| 15 to 17 Year Olds | 103 (100.0%) | 0 (0.0%) |
| 18 to 19 Year Olds | 126 (81.3%) | 29 (18.7%) |
| 20 to 24 Year Olds | 0 (0.0%) | 22 (100.0%) |
| 25 to 34 Year Olds | 0 (0.0%) | 19 (100.0%) |
| 35 Years and over | 26 (100.0%) | 0 (0.0%) |
| Total | 778 (88.2%) | 104 (11.8%) |
Educational Attainment by Field of Study in Bellingham
Business (305 | 24.7%), engineering (180 | 14.6%), education (113 | 9.2%), arts & humanities (112 | 9.1%), and physical & health sciences (98 | 8.0%) are the most common fields of study among 1,233 individuals in Bellingham who have obtained a bachelor's degree or higher.
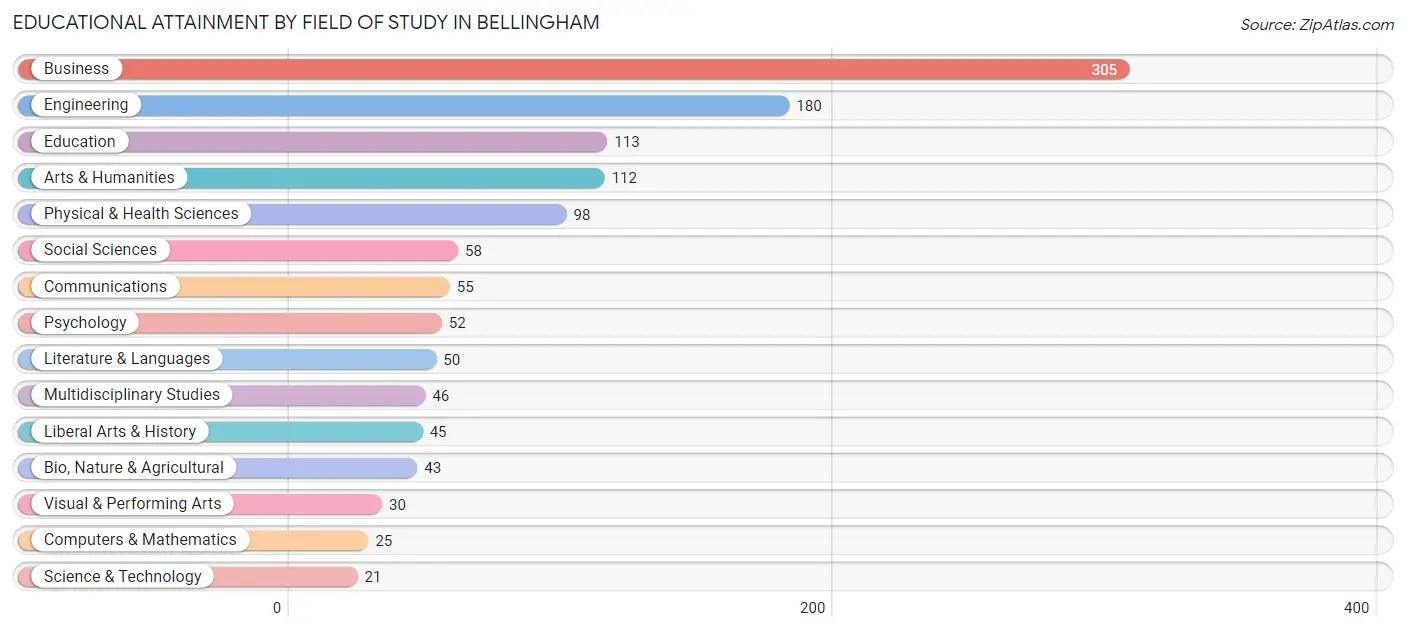
| Field of Study | # Graduates | % Graduates |
| Computers & Mathematics | 25 | 2.0% |
| Bio, Nature & Agricultural | 43 | 3.5% |
| Physical & Health Sciences | 98 | 8.0% |
| Psychology | 52 | 4.2% |
| Social Sciences | 58 | 4.7% |
| Engineering | 180 | 14.6% |
| Multidisciplinary Studies | 46 | 3.7% |
| Science & Technology | 21 | 1.7% |
| Business | 305 | 24.7% |
| Education | 113 | 9.2% |
| Literature & Languages | 50 | 4.1% |
| Liberal Arts & History | 45 | 3.6% |
| Visual & Performing Arts | 30 | 2.4% |
| Communications | 55 | 4.5% |
| Arts & Humanities | 112 | 9.1% |
| Total | 1,233 | 100.0% |
Transportation & Commute in Bellingham
Vehicle Availability by Sex in Bellingham
The most prevalent vehicle ownership categories in Bellingham are males with 2 vehicles (582, accounting for 50.8%) and females with 2 vehicles (386, making up 55.8%).
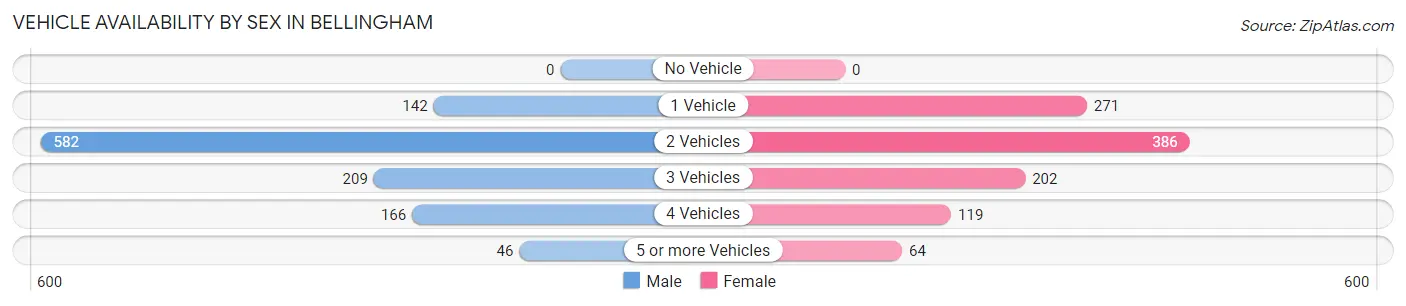
| Vehicles Available | Male | Female |
| No Vehicle | 0 (0.0%) | 0 (0.0%) |
| 1 Vehicle | 142 (12.4%) | 271 (26.0%) |
| 2 Vehicles | 582 (50.8%) | 386 (37.0%) |
| 3 Vehicles | 209 (18.2%) | 202 (19.4%) |
| 4 Vehicles | 166 (14.5%) | 119 (11.4%) |
| 5 or more Vehicles | 46 (4.0%) | 64 (6.1%) |
| Total | 1,145 (100.0%) | 1,042 (100.0%) |
Commute Time in Bellingham
The most frequently occuring commute durations in Bellingham are 45 to 59 minutes (376 commuters, 19.1%), 30 to 34 minutes (264 commuters, 13.4%), and 10 to 14 minutes (259 commuters, 13.1%).
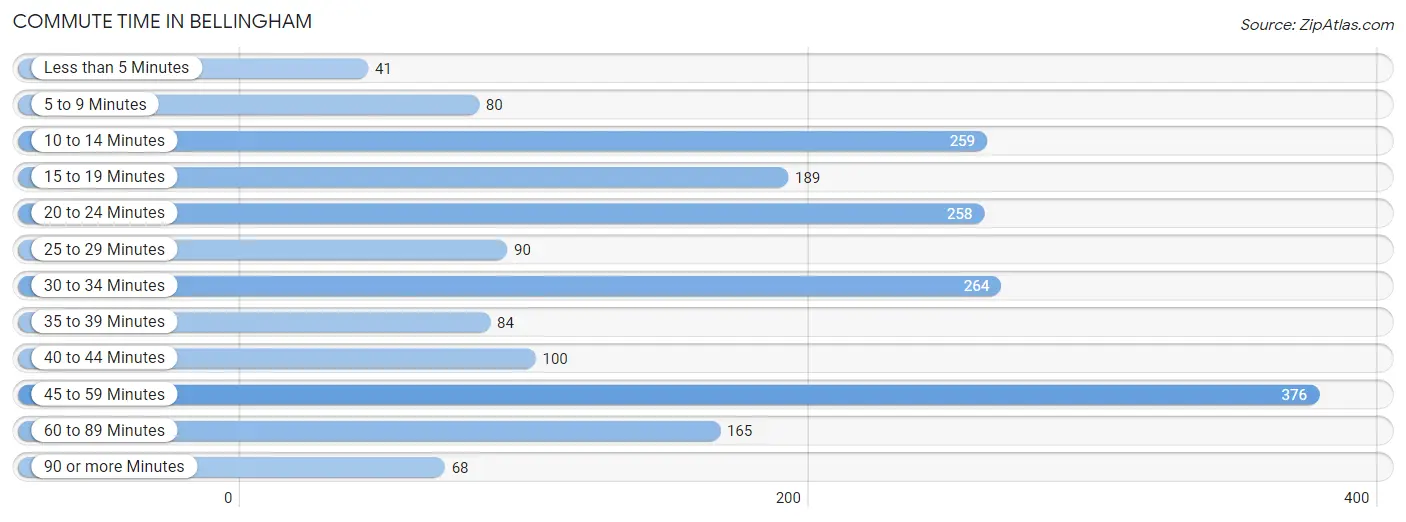
| Commute Time | # Commuters | % Commuters |
| Less than 5 Minutes | 41 | 2.1% |
| 5 to 9 Minutes | 80 | 4.1% |
| 10 to 14 Minutes | 259 | 13.1% |
| 15 to 19 Minutes | 189 | 9.6% |
| 20 to 24 Minutes | 258 | 13.1% |
| 25 to 29 Minutes | 90 | 4.6% |
| 30 to 34 Minutes | 264 | 13.4% |
| 35 to 39 Minutes | 84 | 4.3% |
| 40 to 44 Minutes | 100 | 5.1% |
| 45 to 59 Minutes | 376 | 19.1% |
| 60 to 89 Minutes | 165 | 8.4% |
| 90 or more Minutes | 68 | 3.4% |
Commute Time by Sex in Bellingham
The most common commute times in Bellingham are 20 to 24 minutes (215 commuters, 19.9%) for males and 10 to 14 minutes (199 commuters, 22.2%) for females.
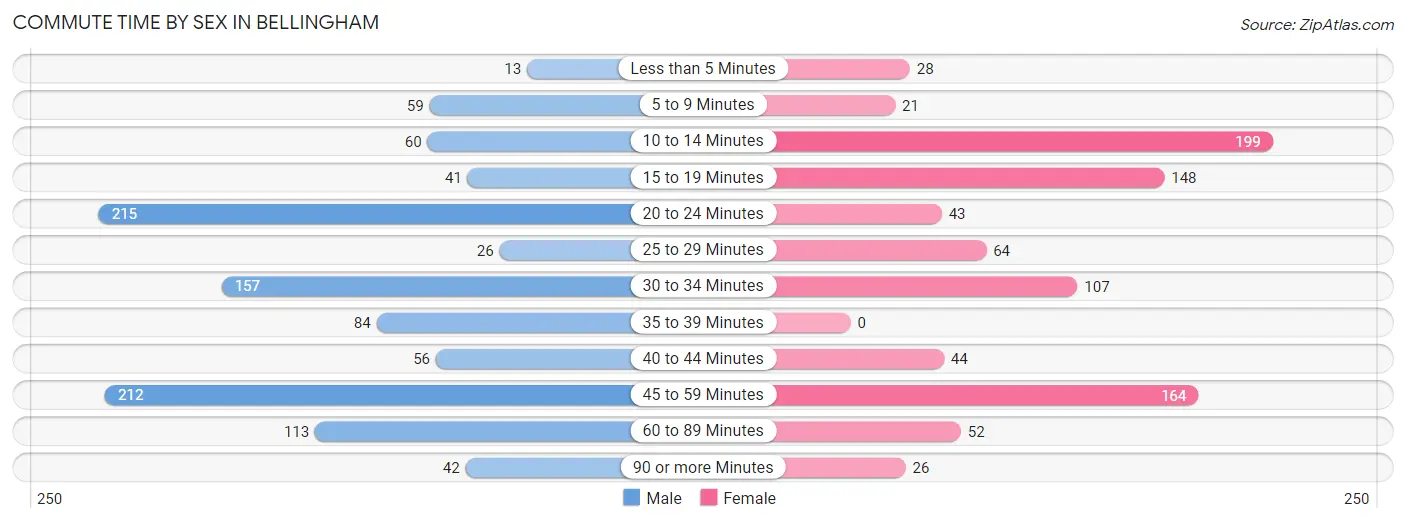
| Commute Time | Male | Female |
| Less than 5 Minutes | 13 (1.2%) | 28 (3.1%) |
| 5 to 9 Minutes | 59 (5.5%) | 21 (2.3%) |
| 10 to 14 Minutes | 60 (5.6%) | 199 (22.2%) |
| 15 to 19 Minutes | 41 (3.8%) | 148 (16.5%) |
| 20 to 24 Minutes | 215 (19.9%) | 43 (4.8%) |
| 25 to 29 Minutes | 26 (2.4%) | 64 (7.1%) |
| 30 to 34 Minutes | 157 (14.6%) | 107 (11.9%) |
| 35 to 39 Minutes | 84 (7.8%) | 0 (0.0%) |
| 40 to 44 Minutes | 56 (5.2%) | 44 (4.9%) |
| 45 to 59 Minutes | 212 (19.7%) | 164 (18.3%) |
| 60 to 89 Minutes | 113 (10.5%) | 52 (5.8%) |
| 90 or more Minutes | 42 (3.9%) | 26 (2.9%) |
Time of Departure to Work by Sex in Bellingham
The most frequent times of departure to work in Bellingham are 7:00 AM to 7:29 AM (241, 22.4%) for males and 7:30 AM to 7:59 AM (179, 20.0%) for females.
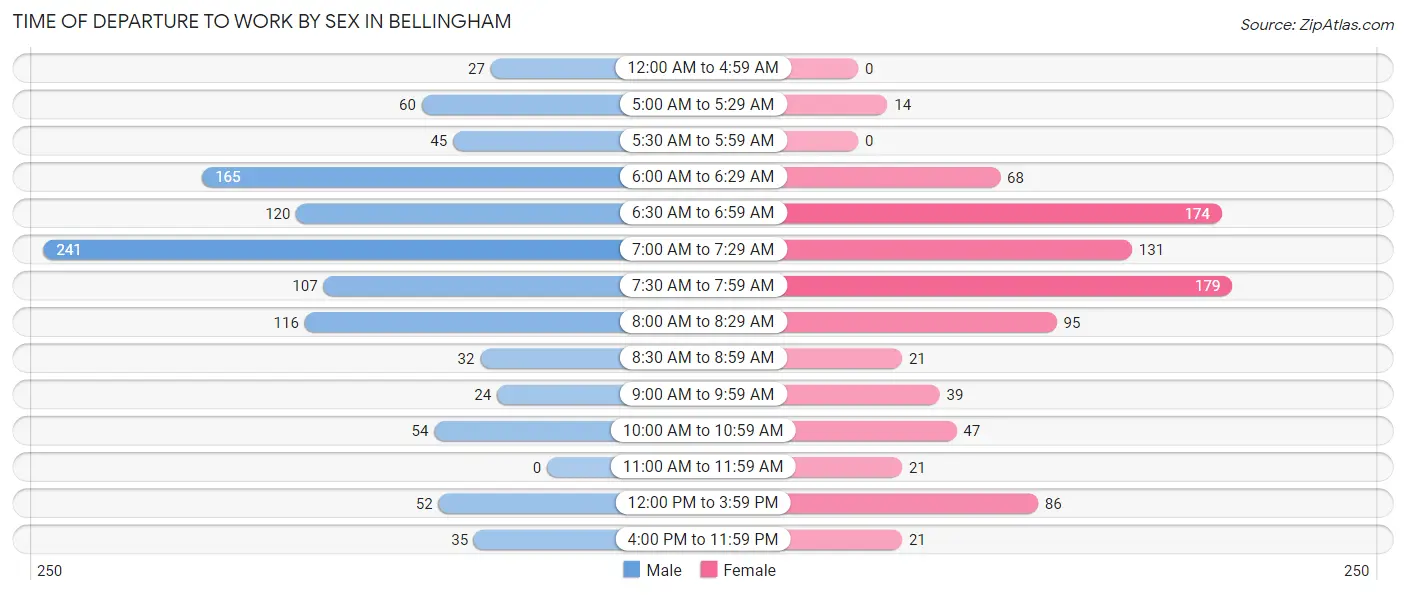
| Time of Departure | Male | Female |
| 12:00 AM to 4:59 AM | 27 (2.5%) | 0 (0.0%) |
| 5:00 AM to 5:29 AM | 60 (5.6%) | 14 (1.6%) |
| 5:30 AM to 5:59 AM | 45 (4.2%) | 0 (0.0%) |
| 6:00 AM to 6:29 AM | 165 (15.3%) | 68 (7.6%) |
| 6:30 AM to 6:59 AM | 120 (11.1%) | 174 (19.4%) |
| 7:00 AM to 7:29 AM | 241 (22.4%) | 131 (14.6%) |
| 7:30 AM to 7:59 AM | 107 (9.9%) | 179 (20.0%) |
| 8:00 AM to 8:29 AM | 116 (10.8%) | 95 (10.6%) |
| 8:30 AM to 8:59 AM | 32 (3.0%) | 21 (2.3%) |
| 9:00 AM to 9:59 AM | 24 (2.2%) | 39 (4.3%) |
| 10:00 AM to 10:59 AM | 54 (5.0%) | 47 (5.2%) |
| 11:00 AM to 11:59 AM | 0 (0.0%) | 21 (2.3%) |
| 12:00 PM to 3:59 PM | 52 (4.8%) | 86 (9.6%) |
| 4:00 PM to 11:59 PM | 35 (3.3%) | 21 (2.3%) |
| Total | 1,078 (100.0%) | 896 (100.0%) |
Housing Occupancy in Bellingham
Occupancy by Ownership in Bellingham
Of the total 2,076 dwellings in Bellingham, owner-occupied units account for 1,383 (66.6%), while renter-occupied units make up 693 (33.4%).
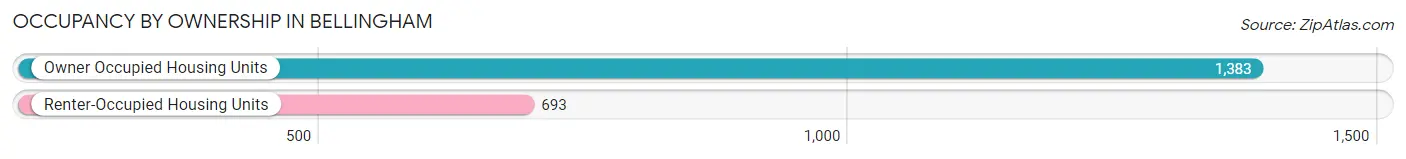
| Occupancy | # Housing Units | % Housing Units |
| Owner Occupied Housing Units | 1,383 | 66.6% |
| Renter-Occupied Housing Units | 693 | 33.4% |
| Total Occupied Housing Units | 2,076 | 100.0% |
Occupancy by Household Size in Bellingham
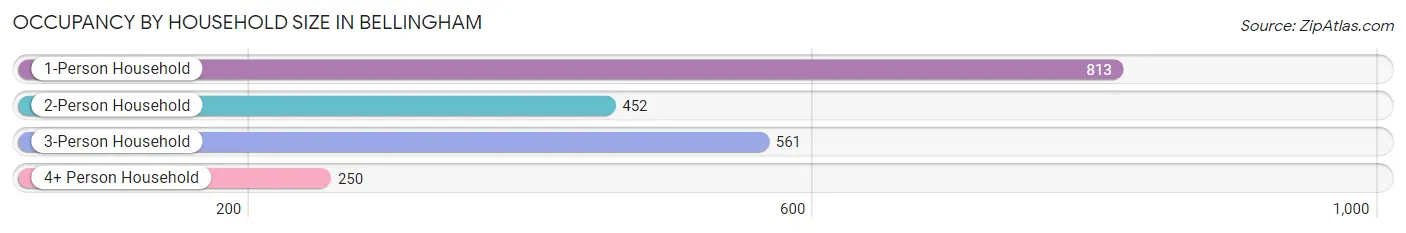
| Household Size | # Housing Units | % Housing Units |
| 1-Person Household | 813 | 39.2% |
| 2-Person Household | 452 | 21.8% |
| 3-Person Household | 561 | 27.0% |
| 4+ Person Household | 250 | 12.0% |
| Total Housing Units | 2,076 | 100.0% |
Occupancy by Ownership by Household Size in Bellingham
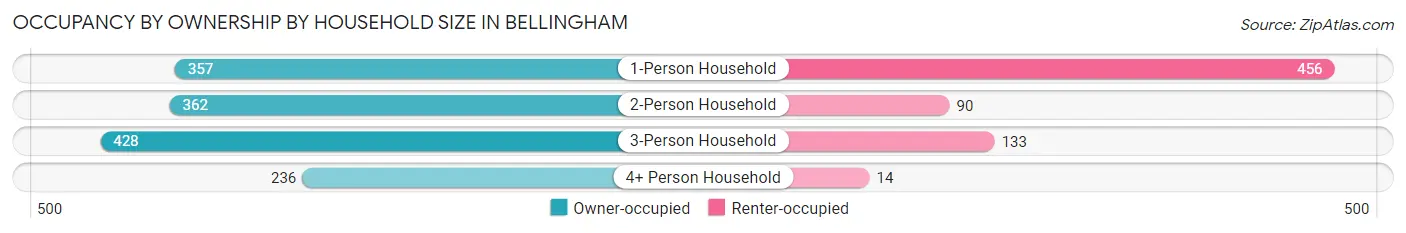
| Household Size | Owner-occupied | Renter-occupied |
| 1-Person Household | 357 (43.9%) | 456 (56.1%) |
| 2-Person Household | 362 (80.1%) | 90 (19.9%) |
| 3-Person Household | 428 (76.3%) | 133 (23.7%) |
| 4+ Person Household | 236 (94.4%) | 14 (5.6%) |
| Total Housing Units | 1,383 (66.6%) | 693 (33.4%) |
Occupancy by Educational Attainment in Bellingham
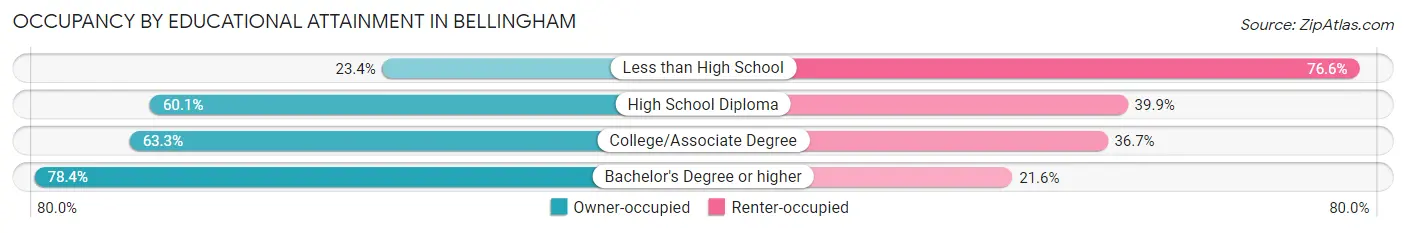
| Household Size | Owner-occupied | Renter-occupied |
| Less than High School | 18 (23.4%) | 59 (76.6%) |
| High School Diploma | 339 (60.1%) | 225 (39.9%) |
| College/Associate Degree | 416 (63.3%) | 241 (36.7%) |
| Bachelor's Degree or higher | 610 (78.4%) | 168 (21.6%) |
Occupancy by Age of Householder in Bellingham
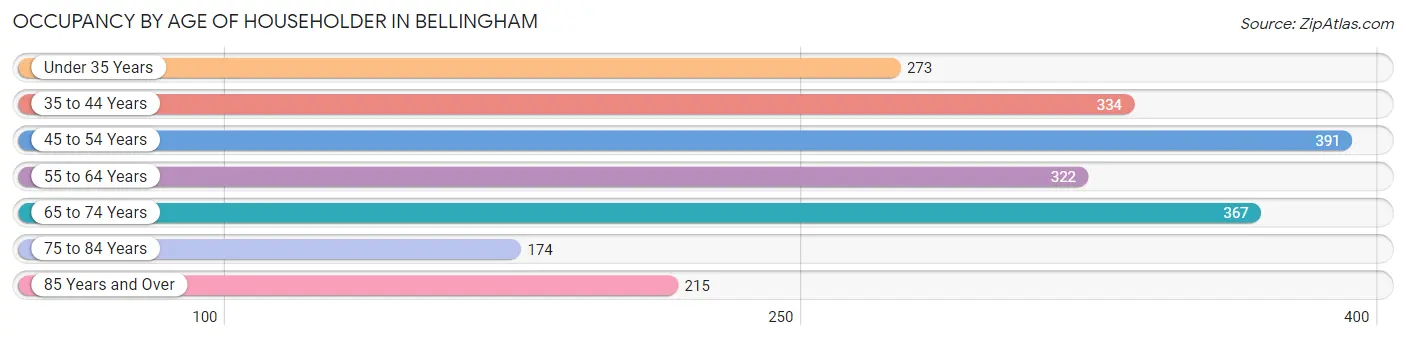
| Age Bracket | # Households | % Households |
| Under 35 Years | 273 | 13.2% |
| 35 to 44 Years | 334 | 16.1% |
| 45 to 54 Years | 391 | 18.8% |
| 55 to 64 Years | 322 | 15.5% |
| 65 to 74 Years | 367 | 17.7% |
| 75 to 84 Years | 174 | 8.4% |
| 85 Years and Over | 215 | 10.4% |
| Total | 2,076 | 100.0% |
Housing Finances in Bellingham
Median Income by Occupancy in Bellingham
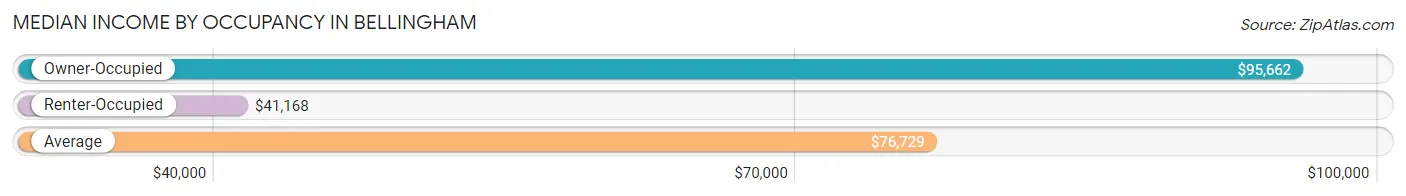
| Occupancy Type | # Households | Median Income |
| Owner-Occupied | 1,383 (66.6%) | $95,662 |
| Renter-Occupied | 693 (33.4%) | $41,168 |
| Average | 2,076 (100.0%) | $76,729 |
Occupancy by Householder Income Bracket in Bellingham
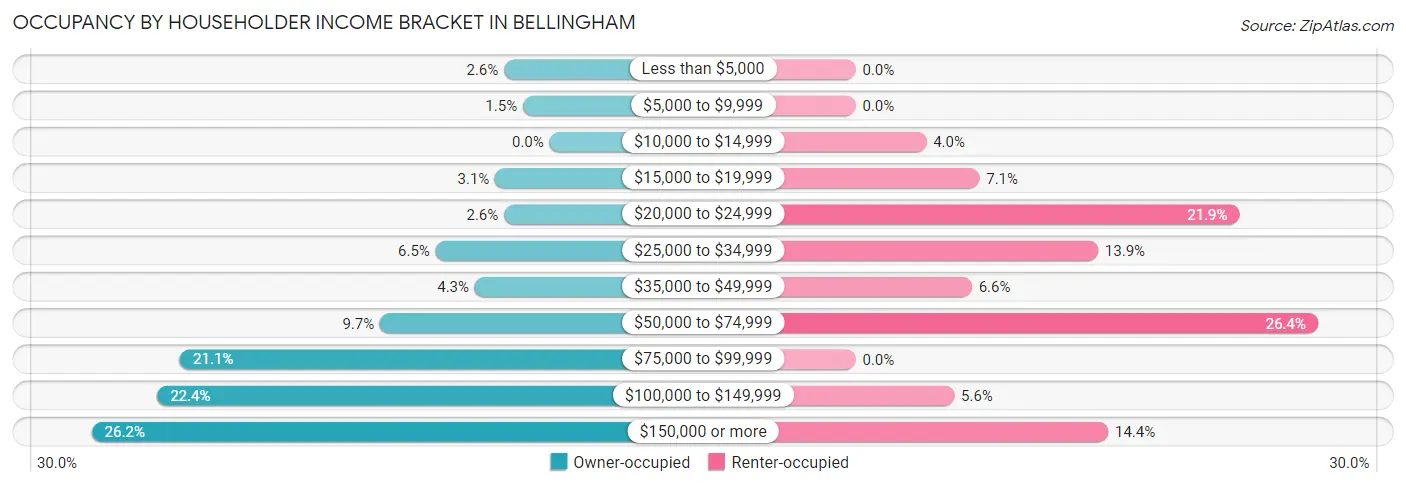
| Income Bracket | Owner-occupied | Renter-occupied |
| Less than $5,000 | 36 (2.6%) | 0 (0.0%) |
| $5,000 to $9,999 | 21 (1.5%) | 0 (0.0%) |
| $10,000 to $14,999 | 0 (0.0%) | 28 (4.0%) |
| $15,000 to $19,999 | 43 (3.1%) | 49 (7.1%) |
| $20,000 to $24,999 | 36 (2.6%) | 152 (21.9%) |
| $25,000 to $34,999 | 90 (6.5%) | 96 (13.9%) |
| $35,000 to $49,999 | 59 (4.3%) | 46 (6.6%) |
| $50,000 to $74,999 | 134 (9.7%) | 183 (26.4%) |
| $75,000 to $99,999 | 292 (21.1%) | 0 (0.0%) |
| $100,000 to $149,999 | 310 (22.4%) | 39 (5.6%) |
| $150,000 or more | 362 (26.2%) | 100 (14.4%) |
| Total | 1,383 (100.0%) | 693 (100.0%) |
Monthly Housing Cost Tiers in Bellingham
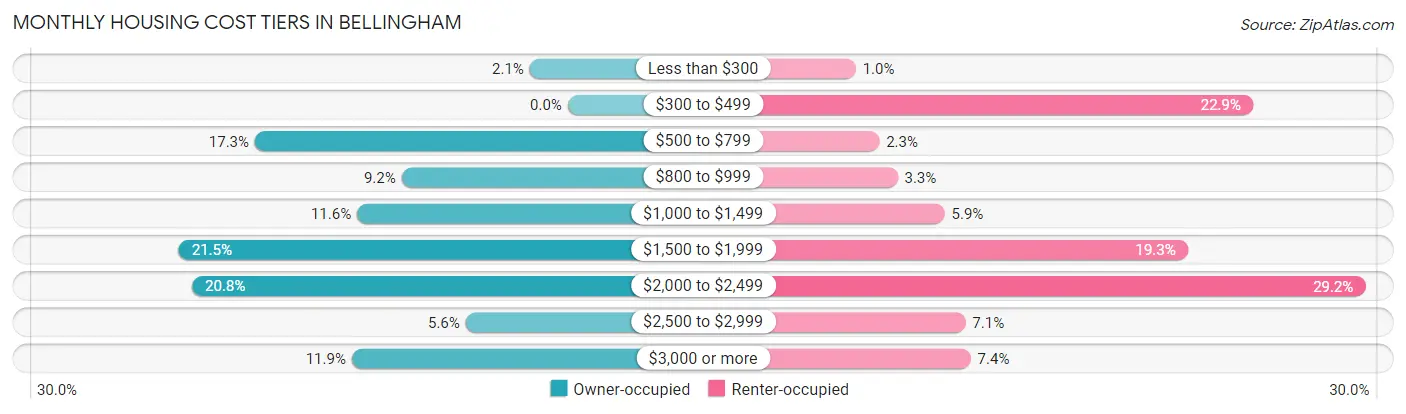
| Monthly Cost | Owner-occupied | Renter-occupied |
| Less than $300 | 29 (2.1%) | 7 (1.0%) |
| $300 to $499 | 0 (0.0%) | 159 (22.9%) |
| $500 to $799 | 239 (17.3%) | 16 (2.3%) |
| $800 to $999 | 127 (9.2%) | 23 (3.3%) |
| $1,000 to $1,499 | 161 (11.6%) | 41 (5.9%) |
| $1,500 to $1,999 | 297 (21.5%) | 134 (19.3%) |
| $2,000 to $2,499 | 287 (20.7%) | 202 (29.1%) |
| $2,500 to $2,999 | 78 (5.6%) | 49 (7.1%) |
| $3,000 or more | 165 (11.9%) | 51 (7.4%) |
| Total | 1,383 (100.0%) | 693 (100.0%) |
Physical Housing Characteristics in Bellingham
Housing Structures in Bellingham
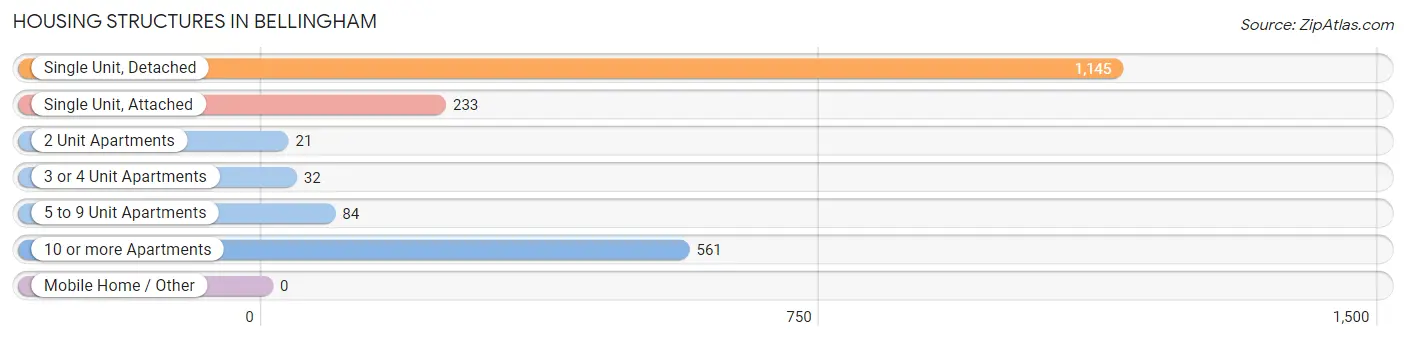
| Structure Type | # Housing Units | % Housing Units |
| Single Unit, Detached | 1,145 | 55.1% |
| Single Unit, Attached | 233 | 11.2% |
| 2 Unit Apartments | 21 | 1.0% |
| 3 or 4 Unit Apartments | 32 | 1.5% |
| 5 to 9 Unit Apartments | 84 | 4.1% |
| 10 or more Apartments | 561 | 27.0% |
| Mobile Home / Other | 0 | 0.0% |
| Total | 2,076 | 100.0% |
Housing Structures by Occupancy in Bellingham
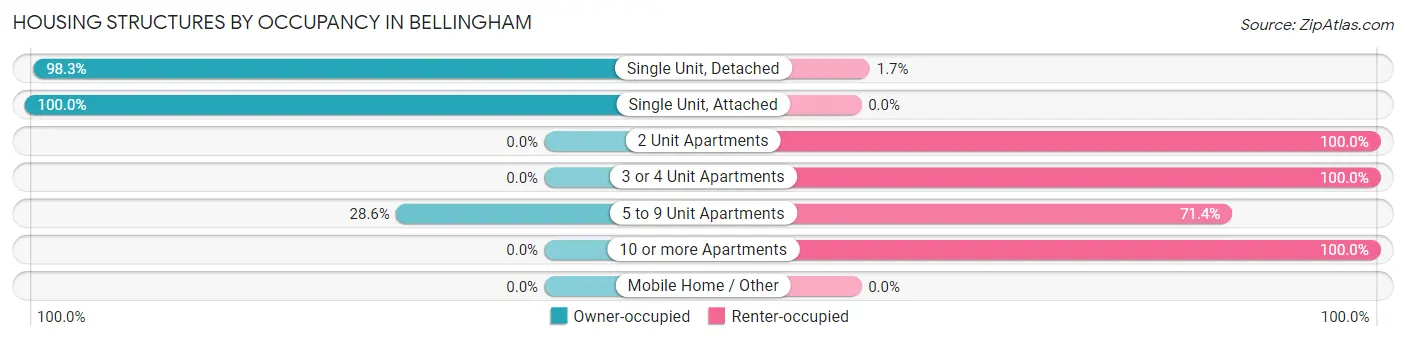
| Structure Type | Owner-occupied | Renter-occupied |
| Single Unit, Detached | 1,126 (98.3%) | 19 (1.7%) |
| Single Unit, Attached | 233 (100.0%) | 0 (0.0%) |
| 2 Unit Apartments | 0 (0.0%) | 21 (100.0%) |
| 3 or 4 Unit Apartments | 0 (0.0%) | 32 (100.0%) |
| 5 to 9 Unit Apartments | 24 (28.6%) | 60 (71.4%) |
| 10 or more Apartments | 0 (0.0%) | 561 (100.0%) |
| Mobile Home / Other | 0 (0.0%) | 0 (0.0%) |
| Total | 1,383 (66.6%) | 693 (33.4%) |
Housing Structures by Number of Rooms in Bellingham
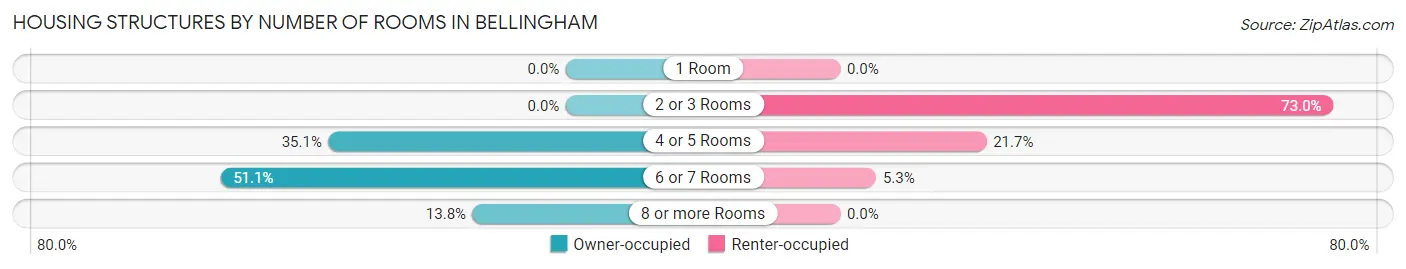
| Number of Rooms | Owner-occupied | Renter-occupied |
| 1 Room | 0 (0.0%) | 0 (0.0%) |
| 2 or 3 Rooms | 0 (0.0%) | 506 (73.0%) |
| 4 or 5 Rooms | 486 (35.1%) | 150 (21.6%) |
| 6 or 7 Rooms | 706 (51.0%) | 37 (5.3%) |
| 8 or more Rooms | 191 (13.8%) | 0 (0.0%) |
| Total | 1,383 (100.0%) | 693 (100.0%) |
Housing Structure by Heating Type in Bellingham
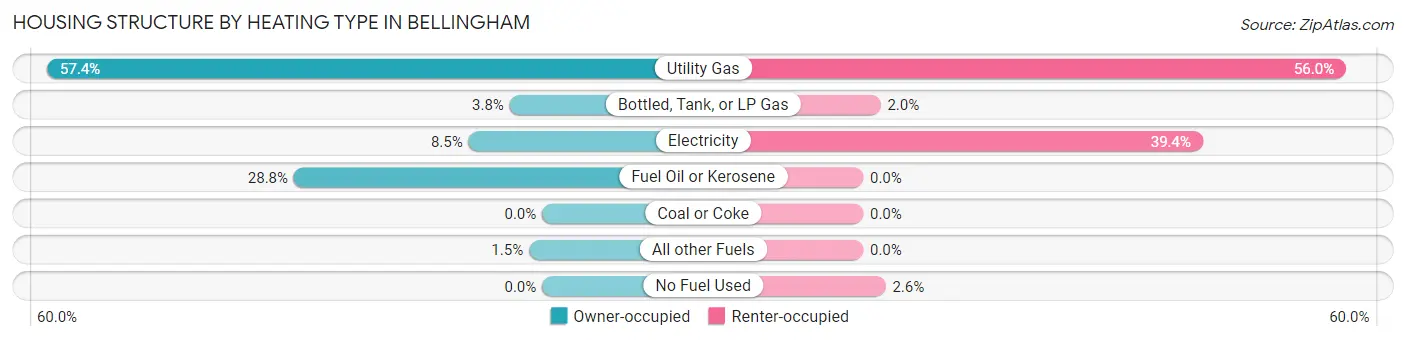
| Heating Type | Owner-occupied | Renter-occupied |
| Utility Gas | 794 (57.4%) | 388 (56.0%) |
| Bottled, Tank, or LP Gas | 52 (3.8%) | 14 (2.0%) |
| Electricity | 118 (8.5%) | 273 (39.4%) |
| Fuel Oil or Kerosene | 398 (28.8%) | 0 (0.0%) |
| Coal or Coke | 0 (0.0%) | 0 (0.0%) |
| All other Fuels | 21 (1.5%) | 0 (0.0%) |
| No Fuel Used | 0 (0.0%) | 18 (2.6%) |
| Total | 1,383 (100.0%) | 693 (100.0%) |
Household Vehicle Usage in Bellingham
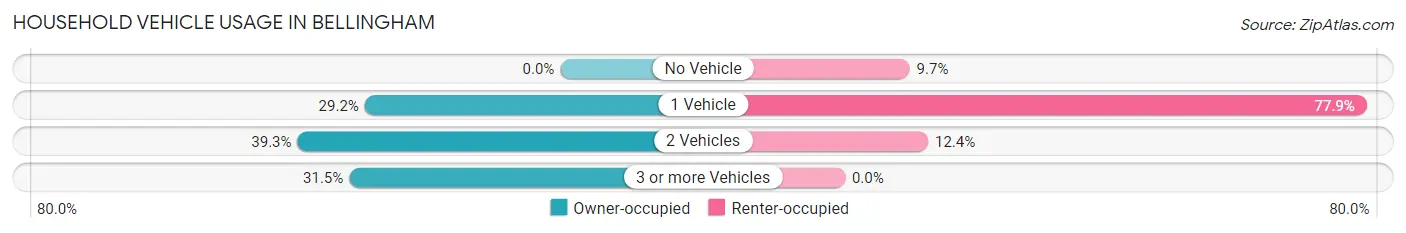
| Vehicles per Household | Owner-occupied | Renter-occupied |
| No Vehicle | 0 (0.0%) | 67 (9.7%) |
| 1 Vehicle | 404 (29.2%) | 540 (77.9%) |
| 2 Vehicles | 543 (39.3%) | 86 (12.4%) |
| 3 or more Vehicles | 436 (31.5%) | 0 (0.0%) |
| Total | 1,383 (100.0%) | 693 (100.0%) |
Real Estate & Mortgages in Bellingham
Real Estate and Mortgage Overview in Bellingham
| Characteristic | Without Mortgage | With Mortgage |
| Housing Units | 410 | 973 |
| Median Property Value | $337,000 | $380,000 |
| Median Household Income | $82,702 | $321 |
| Monthly Housing Costs | $788 | $165 |
| Real Estate Taxes | $4,348 | $20 |
Property Value by Mortgage Status in Bellingham
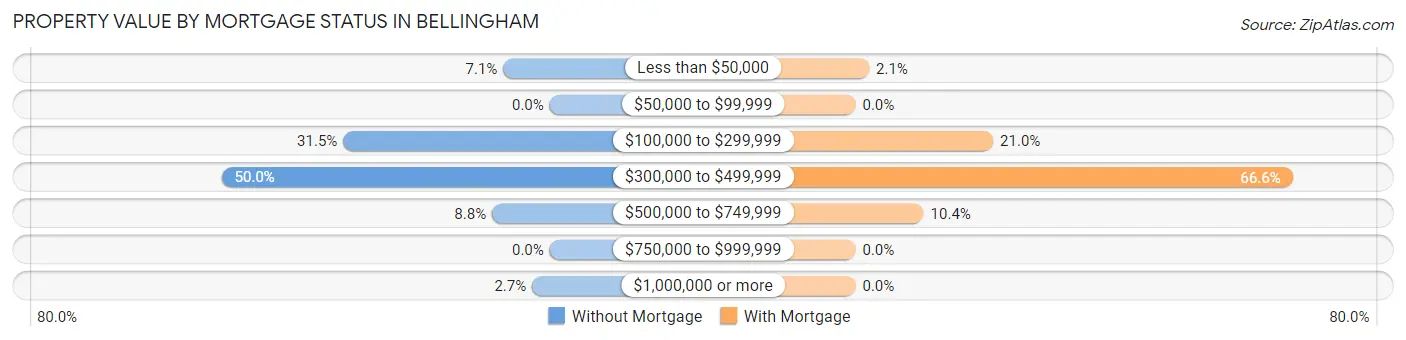
| Property Value | Without Mortgage | With Mortgage |
| Less than $50,000 | 29 (7.1%) | 20 (2.1%) |
| $50,000 to $99,999 | 0 (0.0%) | 0 (0.0%) |
| $100,000 to $299,999 | 129 (31.5%) | 204 (21.0%) |
| $300,000 to $499,999 | 205 (50.0%) | 648 (66.6%) |
| $500,000 to $749,999 | 36 (8.8%) | 101 (10.4%) |
| $750,000 to $999,999 | 0 (0.0%) | 0 (0.0%) |
| $1,000,000 or more | 11 (2.7%) | 0 (0.0%) |
| Total | 410 (100.0%) | 973 (100.0%) |
Household Income by Mortgage Status in Bellingham
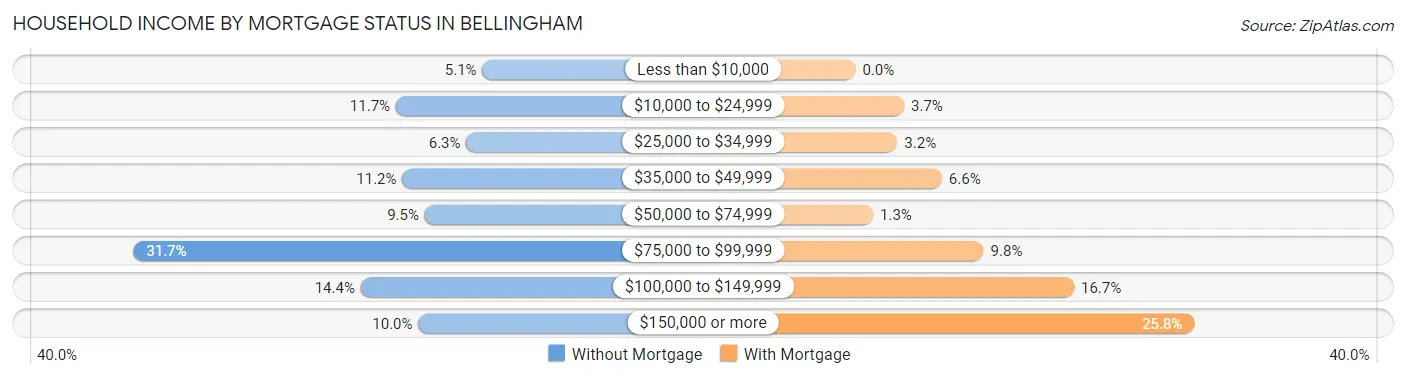
| Household Income | Without Mortgage | With Mortgage |
| Less than $10,000 | 21 (5.1%) | 0 (0.0%) |
| $10,000 to $24,999 | 48 (11.7%) | 36 (3.7%) |
| $25,000 to $34,999 | 26 (6.3%) | 31 (3.2%) |
| $35,000 to $49,999 | 46 (11.2%) | 64 (6.6%) |
| $50,000 to $74,999 | 39 (9.5%) | 13 (1.3%) |
| $75,000 to $99,999 | 130 (31.7%) | 95 (9.8%) |
| $100,000 to $149,999 | 59 (14.4%) | 162 (16.7%) |
| $150,000 or more | 41 (10.0%) | 251 (25.8%) |
| Total | 410 (100.0%) | 973 (100.0%) |
Property Value to Household Income Ratio in Bellingham
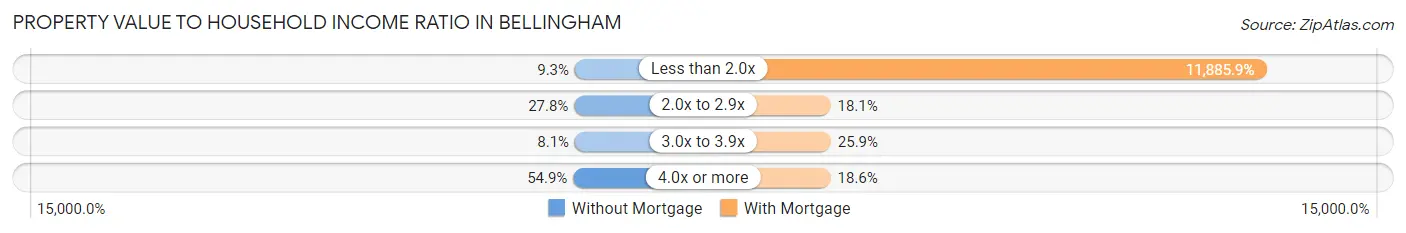
| Value-to-Income Ratio | Without Mortgage | With Mortgage |
| Less than 2.0x | 38 (9.3%) | 115,650 (11,885.9%) |
| 2.0x to 2.9x | 114 (27.8%) | 176 (18.1%) |
| 3.0x to 3.9x | 33 (8.1%) | 252 (25.9%) |
| 4.0x or more | 225 (54.9%) | 181 (18.6%) |
| Total | 410 (100.0%) | 973 (100.0%) |
Real Estate Taxes by Mortgage Status in Bellingham
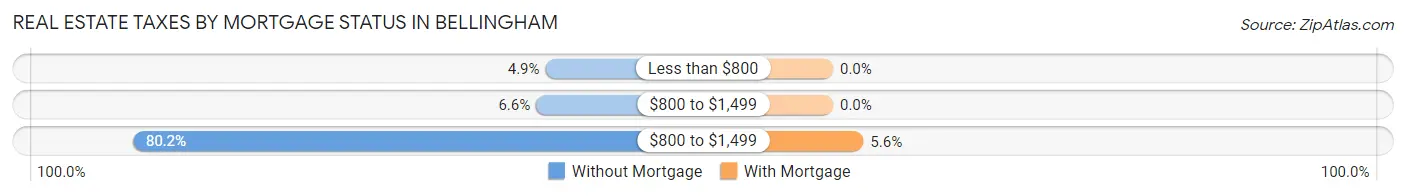
| Property Taxes | Without Mortgage | With Mortgage |
| Less than $800 | 20 (4.9%) | 0 (0.0%) |
| $800 to $1,499 | 27 (6.6%) | 0 (0.0%) |
| $800 to $1,499 | 329 (80.2%) | 54 (5.6%) |
| Total | 410 (100.0%) | 973 (100.0%) |
Health & Disability in Bellingham
Health Insurance Coverage by Age in Bellingham
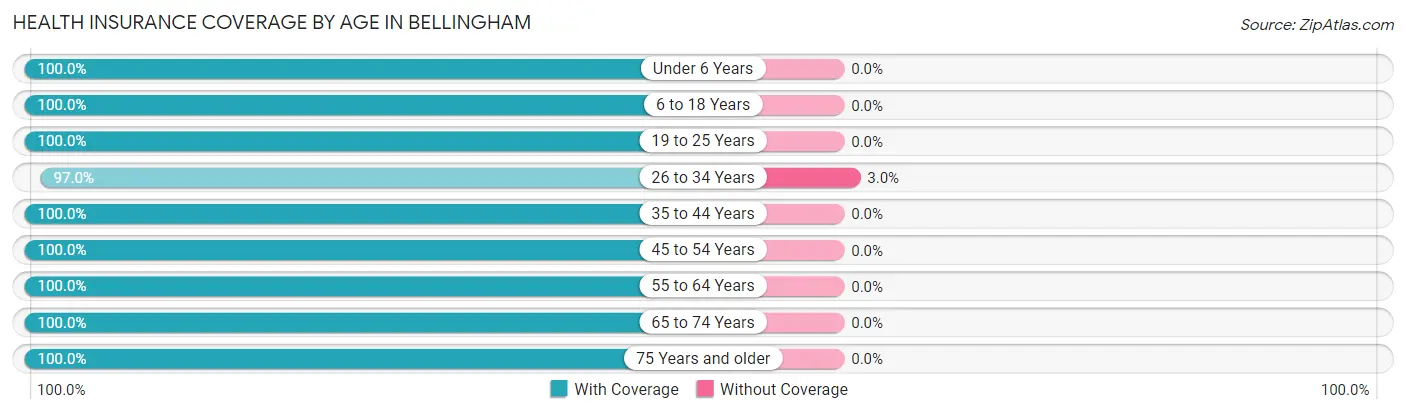
| Age Bracket | With Coverage | Without Coverage |
| Under 6 Years | 203 (100.0%) | 0 (0.0%) |
| 6 to 18 Years | 743 (100.0%) | 0 (0.0%) |
| 19 to 25 Years | 485 (100.0%) | 0 (0.0%) |
| 26 to 34 Years | 388 (97.0%) | 12 (3.0%) |
| 35 to 44 Years | 446 (100.0%) | 0 (0.0%) |
| 45 to 54 Years | 763 (100.0%) | 0 (0.0%) |
| 55 to 64 Years | 635 (100.0%) | 0 (0.0%) |
| 65 to 74 Years | 485 (100.0%) | 0 (0.0%) |
| 75 Years and older | 473 (100.0%) | 0 (0.0%) |
| Total | 4,621 (99.7%) | 12 (0.3%) |
Health Insurance Coverage by Citizenship Status in Bellingham
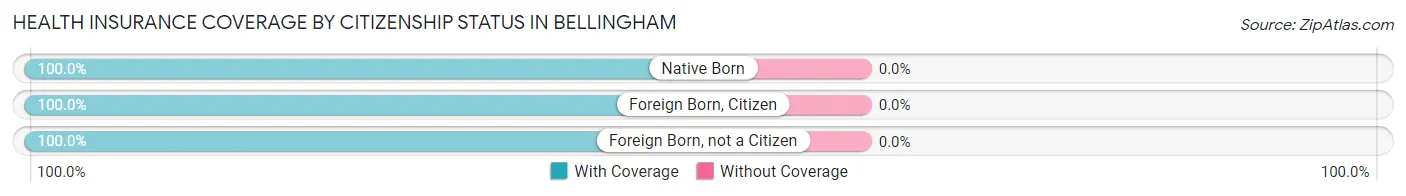
| Citizenship Status | With Coverage | Without Coverage |
| Native Born | 203 (100.0%) | 0 (0.0%) |
| Foreign Born, Citizen | 743 (100.0%) | 0 (0.0%) |
| Foreign Born, not a Citizen | 485 (100.0%) | 0 (0.0%) |
Health Insurance Coverage by Household Income in Bellingham
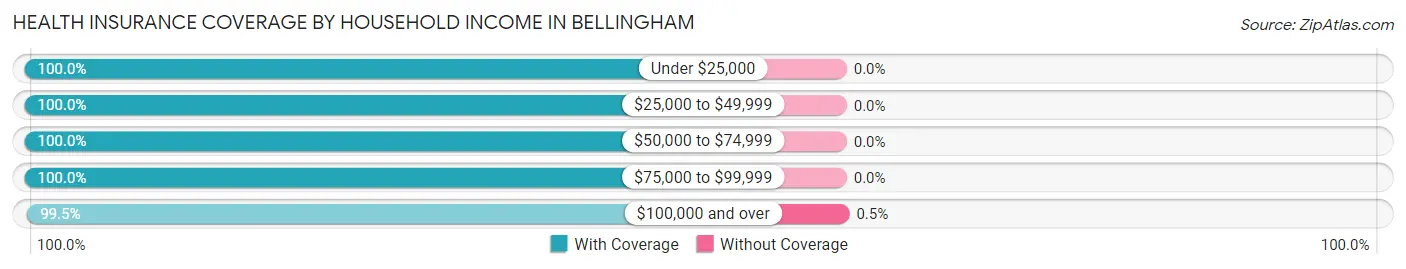
| Household Income | With Coverage | Without Coverage |
| Under $25,000 | 409 (100.0%) | 0 (0.0%) |
| $25,000 to $49,999 | 443 (100.0%) | 0 (0.0%) |
| $50,000 to $74,999 | 667 (100.0%) | 0 (0.0%) |
| $75,000 to $99,999 | 714 (100.0%) | 0 (0.0%) |
| $100,000 and over | 2,385 (99.5%) | 12 (0.5%) |
Public vs Private Health Insurance Coverage by Age in Bellingham
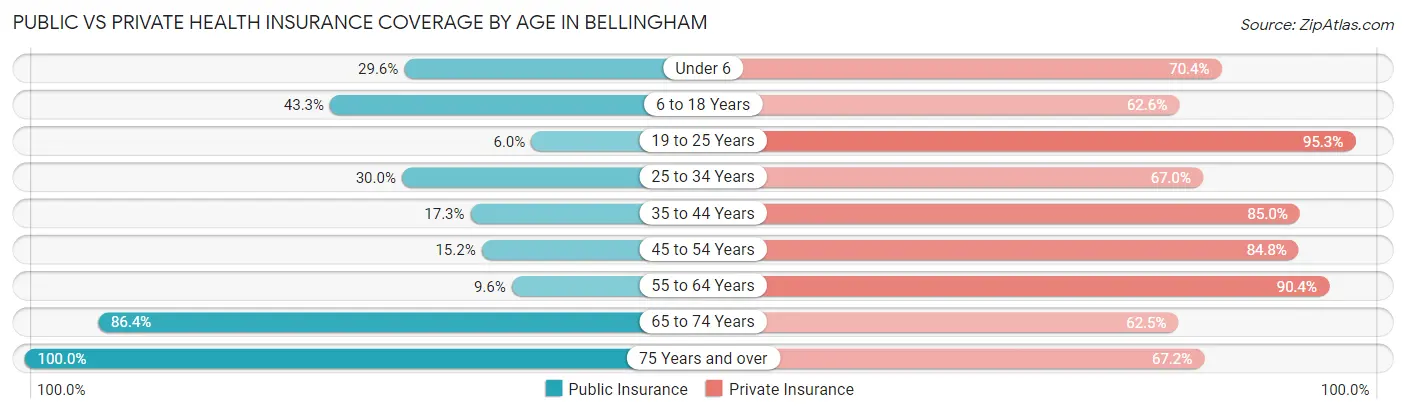
| Age Bracket | Public Insurance | Private Insurance |
| Under 6 | 60 (29.6%) | 143 (70.4%) |
| 6 to 18 Years | 322 (43.3%) | 465 (62.6%) |
| 19 to 25 Years | 29 (6.0%) | 462 (95.3%) |
| 25 to 34 Years | 120 (30.0%) | 268 (67.0%) |
| 35 to 44 Years | 77 (17.3%) | 379 (85.0%) |
| 45 to 54 Years | 116 (15.2%) | 647 (84.8%) |
| 55 to 64 Years | 61 (9.6%) | 574 (90.4%) |
| 65 to 74 Years | 419 (86.4%) | 303 (62.5%) |
| 75 Years and over | 473 (100.0%) | 318 (67.2%) |
| Total | 1,677 (36.2%) | 3,559 (76.8%) |
Disability Status by Sex by Age in Bellingham
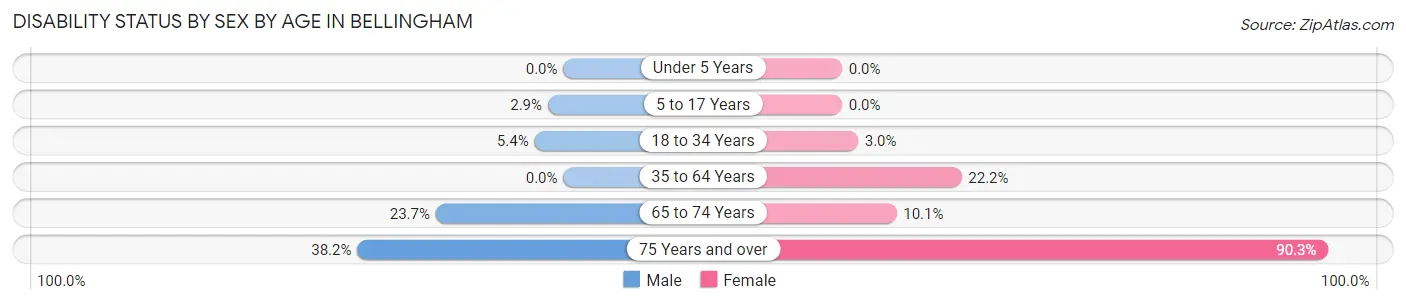
| Age Bracket | Male | Female |
| Under 5 Years | 0 (0.0%) | 0 (0.0%) |
| 5 to 17 Years | 8 (2.9%) | 0 (0.0%) |
| 18 to 34 Years | 29 (5.4%) | 14 (3.0%) |
| 35 to 64 Years | 0 (0.0%) | 223 (22.2%) |
| 65 to 74 Years | 54 (23.7%) | 26 (10.1%) |
| 75 Years and over | 39 (38.2%) | 335 (90.3%) |
Disability Class by Sex by Age in Bellingham
Disability Class: Hearing Difficulty
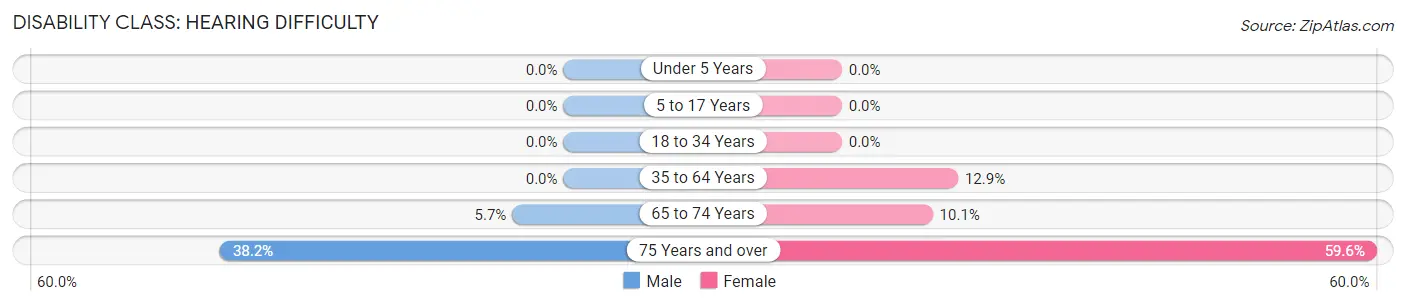
| Age Bracket | Male | Female |
| Under 5 Years | 0 (0.0%) | 0 (0.0%) |
| 5 to 17 Years | 0 (0.0%) | 0 (0.0%) |
| 18 to 34 Years | 0 (0.0%) | 0 (0.0%) |
| 35 to 64 Years | 0 (0.0%) | 130 (12.9%) |
| 65 to 74 Years | 13 (5.7%) | 26 (10.1%) |
| 75 Years and over | 39 (38.2%) | 221 (59.6%) |
Disability Class: Vision Difficulty
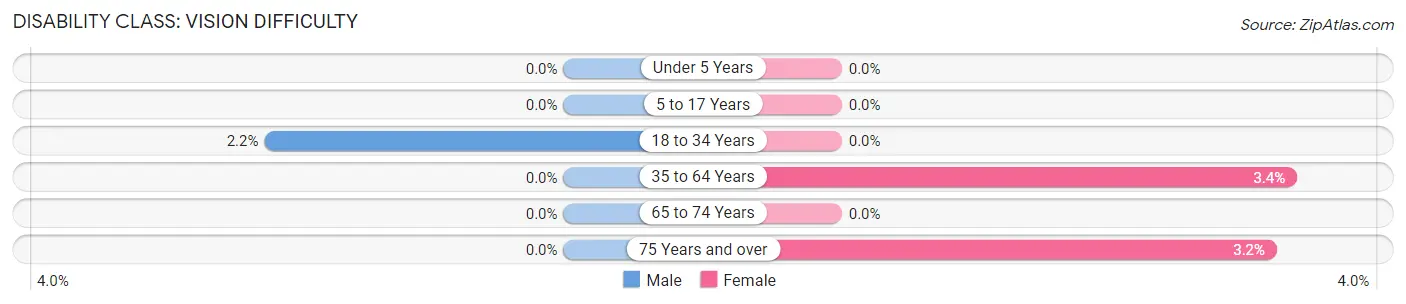
| Age Bracket | Male | Female |
| Under 5 Years | 0 (0.0%) | 0 (0.0%) |
| 5 to 17 Years | 0 (0.0%) | 0 (0.0%) |
| 18 to 34 Years | 12 (2.2%) | 0 (0.0%) |
| 35 to 64 Years | 0 (0.0%) | 34 (3.4%) |
| 65 to 74 Years | 0 (0.0%) | 0 (0.0%) |
| 75 Years and over | 0 (0.0%) | 12 (3.2%) |
Disability Class: Cognitive Difficulty
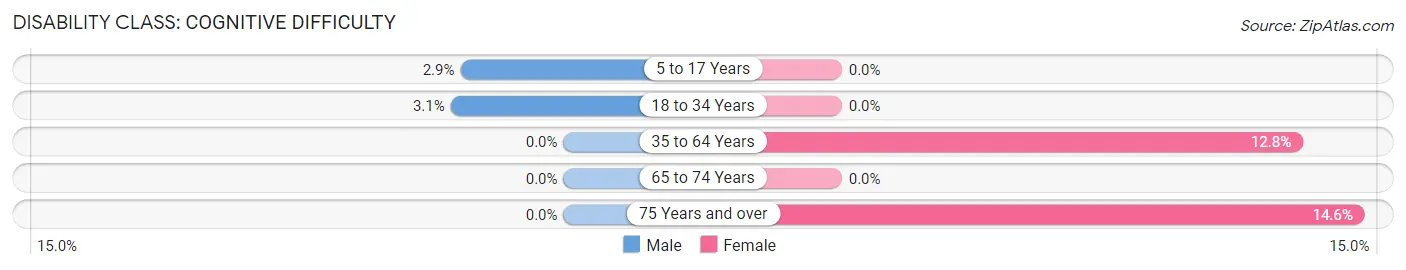
| Age Bracket | Male | Female |
| 5 to 17 Years | 8 (2.9%) | 0 (0.0%) |
| 18 to 34 Years | 17 (3.1%) | 0 (0.0%) |
| 35 to 64 Years | 0 (0.0%) | 129 (12.8%) |
| 65 to 74 Years | 0 (0.0%) | 0 (0.0%) |
| 75 Years and over | 0 (0.0%) | 54 (14.6%) |
Disability Class: Ambulatory Difficulty
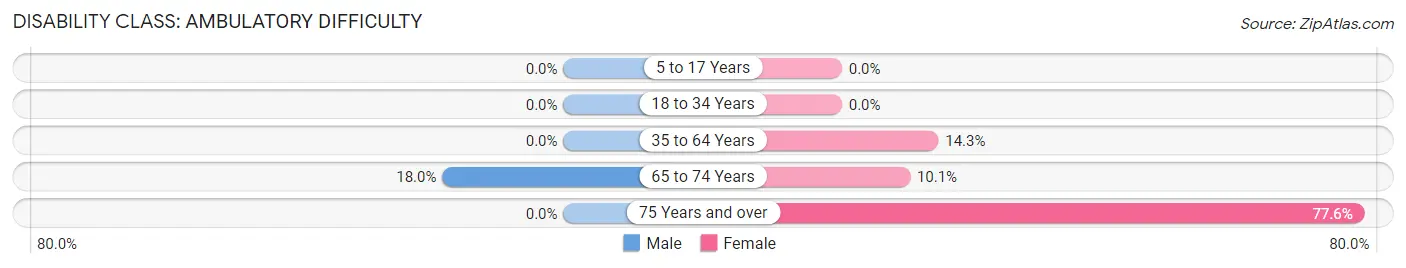
| Age Bracket | Male | Female |
| 5 to 17 Years | 0 (0.0%) | 0 (0.0%) |
| 18 to 34 Years | 0 (0.0%) | 0 (0.0%) |
| 35 to 64 Years | 0 (0.0%) | 144 (14.3%) |
| 65 to 74 Years | 41 (18.0%) | 26 (10.1%) |
| 75 Years and over | 0 (0.0%) | 288 (77.6%) |
Disability Class: Self-Care Difficulty
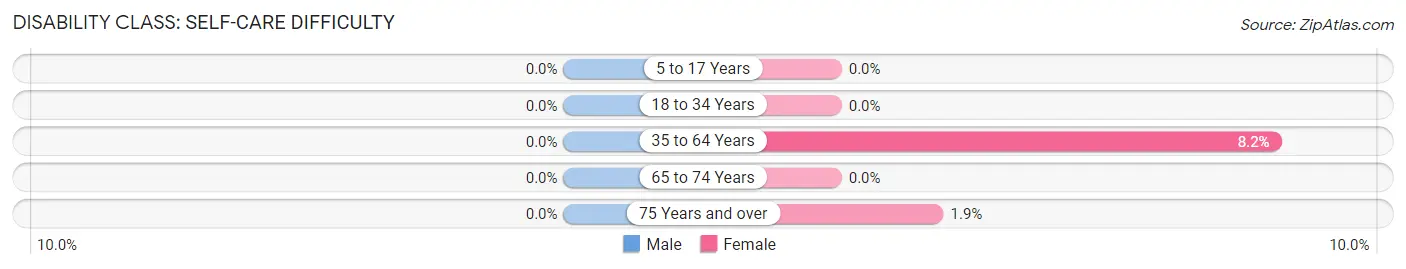
| Age Bracket | Male | Female |
| 5 to 17 Years | 0 (0.0%) | 0 (0.0%) |
| 18 to 34 Years | 0 (0.0%) | 0 (0.0%) |
| 35 to 64 Years | 0 (0.0%) | 82 (8.2%) |
| 65 to 74 Years | 0 (0.0%) | 0 (0.0%) |
| 75 Years and over | 0 (0.0%) | 7 (1.9%) |
Technology Access in Bellingham
Computing Device Access in Bellingham
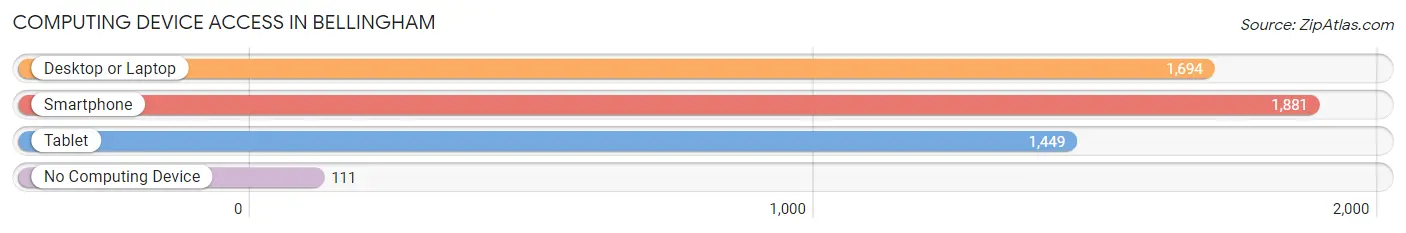
| Device Type | # Households | % Households |
| Desktop or Laptop | 1,694 | 81.6% |
| Smartphone | 1,881 | 90.6% |
| Tablet | 1,449 | 69.8% |
| No Computing Device | 111 | 5.3% |
| Total | 2,076 | 100.0% |
Internet Access in Bellingham
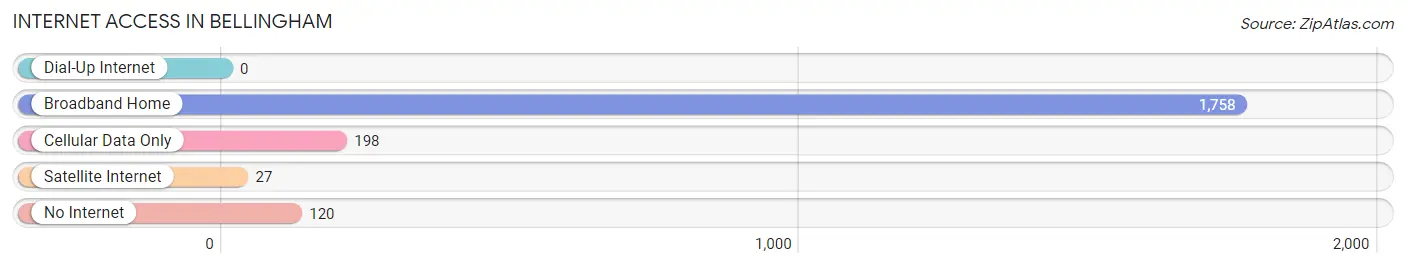
| Internet Type | # Households | % Households |
| Dial-Up Internet | 0 | 0.0% |
| Broadband Home | 1,758 | 84.7% |
| Cellular Data Only | 198 | 9.5% |
| Satellite Internet | 27 | 1.3% |
| No Internet | 120 | 5.8% |
| Total | 2,076 | 100.0% |
Bellingham Summary
Bellingham is a town located in Norfolk County, Massachusetts, United States. It is part of the Greater Boston metropolitan area. As of the 2010 census, the town had a total population of 16,332.
History
The area that is now Bellingham was first settled in 1638 by Europeans. The town was originally part of the town of Dedham, and was known as South Dedham. In 1719, the town was officially incorporated as Bellingham, named after the town of Bellingham in England.
In the 19th century, Bellingham was a rural farming community. The town was known for its production of apples, and was home to several cider mills. The town also had a number of small industries, including a grist mill, a saw mill, and a tannery.
In the late 19th century, the town began to experience rapid growth due to the development of the railroad. The railroad allowed for the transportation of goods and people to and from the town, and allowed for the development of new industries.
Geography
Bellingham is located in eastern Massachusetts, about 25 miles southwest of Boston. The town is bordered by Franklin to the north, Wrentham to the east, Medway to the south, and Woonsocket, Rhode Island to the west.
The town is located in the Blackstone River Valley, and is home to several ponds and lakes, including Lake Hiawatha, Lake Winthrop, and Lake Massapoag. The town is also home to several parks, including the Bellingham Town Forest and the Bellingham Town Common.
Economy
Bellingham is a largely residential community, and the town’s economy is largely based on the service industry. The town is home to several retail stores, restaurants, and other businesses.
The town is also home to several industrial and manufacturing companies, including a paper mill, a plastics manufacturer, and a printing company.
Demographics
As of the 2010 census, there were 16,332 people, 6,093 households, and 4,541 families residing in the town. The population density was 1,093.3 people per square mile. The racial makeup of the town was 94.2% White, 1.3% African American, 0.3% Native American, 1.7% Asian, 0.1% Pacific Islander, 1.2% from other races, and 1.4% from two or more races. Hispanic or Latino of any race were 3.2% of the population.
The median income for a household in the town was $76,845, and the median income for a family was $90,945. The per capita income for the town was $32,945. About 2.7% of families and 3.7% of the population were below the poverty line, including 4.3% of those under age 18 and 4.2% of those age 65 or over.
Common Questions
What is Per Capita Income in Bellingham?
Per Capita income in Bellingham is $46,603.
What is the Median Family Income in Bellingham?
Median Family Income in Bellingham is $106,179.
What is the Median Household income in Bellingham?
Median Household Income in Bellingham is $76,729.
What is Income or Wage Gap in Bellingham?
Income or Wage Gap in Bellingham is 10.3%.
Women in Bellingham earn 89.7 cents for every dollar earned by a man.
What is Inequality or Gini Index in Bellingham?
Inequality or Gini Index in Bellingham is 0.44.
What is the Total Population of Bellingham?
Total Population of Bellingham is 4,636.
What is the Total Male Population of Bellingham?
Total Male Population of Bellingham is 2,089.
What is the Total Female Population of Bellingham?
Total Female Population of Bellingham is 2,547.
What is the Ratio of Males per 100 Females in Bellingham?
There are 82.02 Males per 100 Females in Bellingham.
What is the Ratio of Females per 100 Males in Bellingham?
There are 121.92 Females per 100 Males in Bellingham.
What is the Median Population Age in Bellingham?
Median Population Age in Bellingham is 46.5 Years.
What is the Average Family Size in Bellingham
Average Family Size in Bellingham is 3.1 People.
What is the Average Household Size in Bellingham
Average Household Size in Bellingham is 2.2 People.
How Large is the Labor Force in Bellingham?
There are 2,680 People in the Labor Forcein in Bellingham.
What is the Percentage of People in the Labor Force in Bellingham?
69.4% of People are in the Labor Force in Bellingham.
What is the Unemployment Rate in Bellingham?
Unemployment Rate in Bellingham is 10.4%.