Monson Center, MA Map & Demographics
Monson Center Map
Monson Center Overview
$37,370
PER CAPITA INCOME
$89,792
AVG FAMILY INCOME
$51,902
AVG HOUSEHOLD INCOME
19.6%
WAGE / INCOME GAP [ % ]
80.4¢/ $1
WAGE / INCOME GAP [ $ ]
0.49
INEQUALITY / GINI INDEX
1,673
TOTAL POPULATION
840
MALE POPULATION
833
FEMALE POPULATION
100.84
MALES / 100 FEMALES
99.17
FEMALES / 100 MALES
51.4
MEDIAN AGE
2.8
AVG FAMILY SIZE
2.0
AVG HOUSEHOLD SIZE
877
LABOR FORCE [ PEOPLE ]
60.6%
PERCENT IN LABOR FORCE
16.6%
UNEMPLOYMENT RATE
Income in Monson Center
Income Overview in Monson Center
Per Capita Income in Monson Center is $37,370, while median incomes of families and households are $89,792 and $51,902 respectively.
| Characteristic | Number | Measure |
| Per Capita Income | 1,673 | $37,370 |
| Median Family Income | 424 | $89,792 |
| Mean Family Income | 424 | $100,521 |
| Median Household Income | 827 | $51,902 |
| Mean Household Income | 827 | $73,404 |
| Income Deficit | 424 | $0 |
| Wage / Income Gap (%) | 1,673 | 19.62% |
| Wage / Income Gap ($) | 1,673 | 80.38¢ per $1 |
| Gini / Inequality Index | 1,673 | 0.49 |
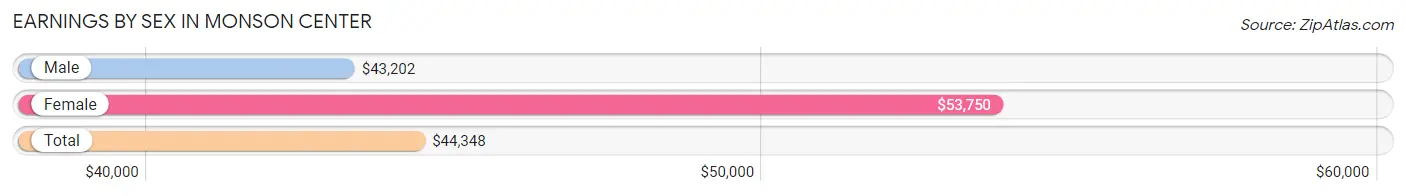
Earnings by Sex in Monson Center
Average Earnings in Monson Center are $44,348, $43,202 for men and $53,750 for women, a difference of 19.6%.
| Sex | Number | Average Earnings |
| Male | 432 (52.7%) | $43,202 |
| Female | 388 (47.3%) | $53,750 |
| Total | 820 (100.0%) | $44,348 |
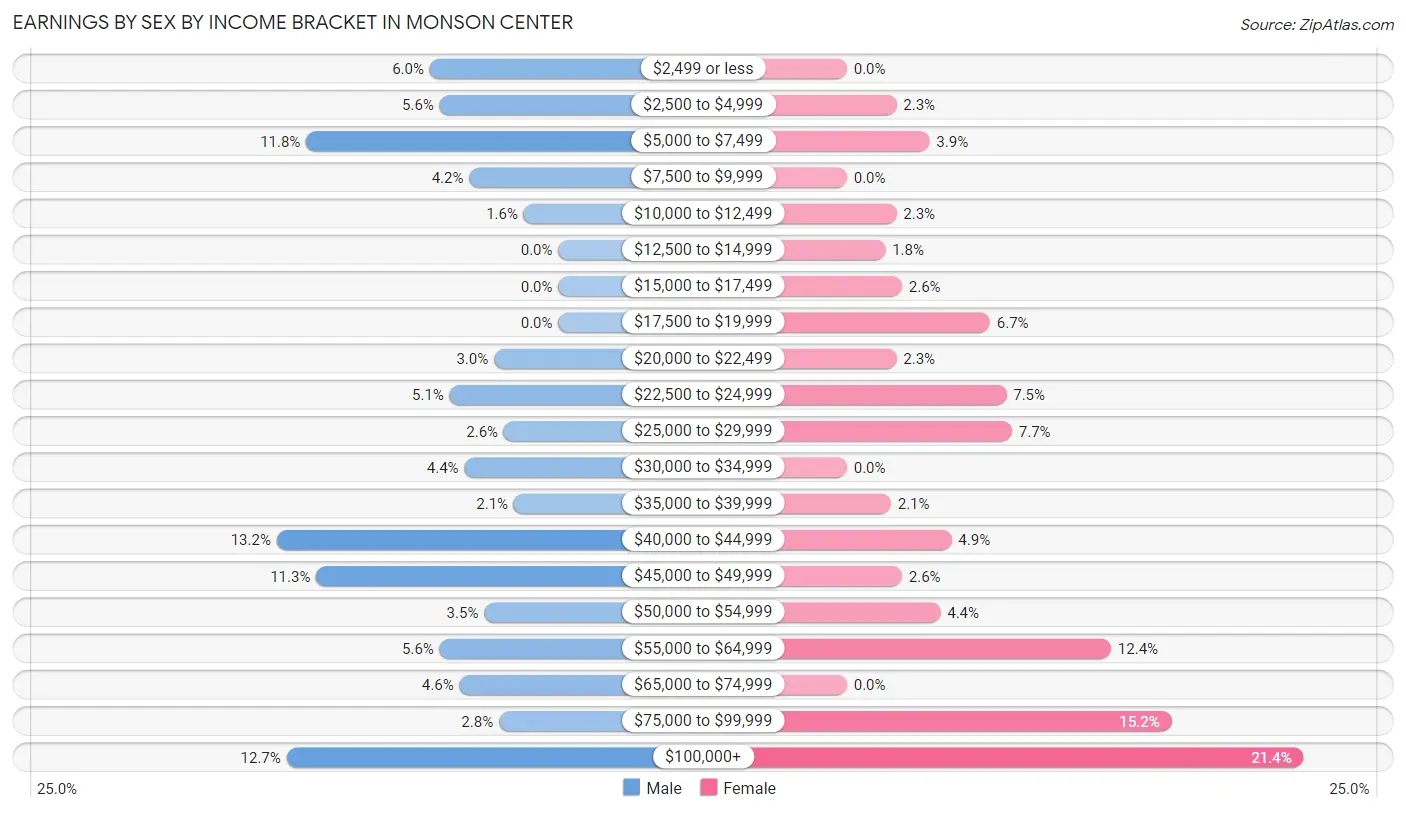
Earnings by Sex by Income Bracket in Monson Center
The most common earnings brackets in Monson Center are $40,000 to $44,999 for men (57 | 13.2%) and $100,000+ for women (83 | 21.4%).
| Income | Male | Female |
| $2,499 or less | 26 (6.0%) | 0 (0.0%) |
| $2,500 to $4,999 | 24 (5.6%) | 9 (2.3%) |
| $5,000 to $7,499 | 51 (11.8%) | 15 (3.9%) |
| $7,500 to $9,999 | 18 (4.2%) | 0 (0.0%) |
| $10,000 to $12,499 | 7 (1.6%) | 9 (2.3%) |
| $12,500 to $14,999 | 0 (0.0%) | 7 (1.8%) |
| $15,000 to $17,499 | 0 (0.0%) | 10 (2.6%) |
| $17,500 to $19,999 | 0 (0.0%) | 26 (6.7%) |
| $20,000 to $22,499 | 13 (3.0%) | 9 (2.3%) |
| $22,500 to $24,999 | 22 (5.1%) | 29 (7.5%) |
| $25,000 to $29,999 | 11 (2.5%) | 30 (7.7%) |
| $30,000 to $34,999 | 19 (4.4%) | 0 (0.0%) |
| $35,000 to $39,999 | 9 (2.1%) | 8 (2.1%) |
| $40,000 to $44,999 | 57 (13.2%) | 19 (4.9%) |
| $45,000 to $49,999 | 49 (11.3%) | 10 (2.6%) |
| $50,000 to $54,999 | 15 (3.5%) | 17 (4.4%) |
| $55,000 to $64,999 | 24 (5.6%) | 48 (12.4%) |
| $65,000 to $74,999 | 20 (4.6%) | 0 (0.0%) |
| $75,000 to $99,999 | 12 (2.8%) | 59 (15.2%) |
| $100,000+ | 55 (12.7%) | 83 (21.4%) |
| Total | 432 (100.0%) | 388 (100.0%) |
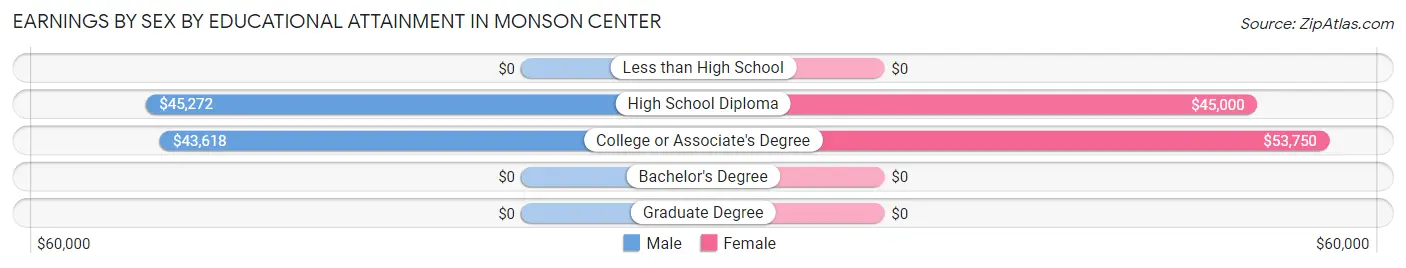
Earnings by Sex by Educational Attainment in Monson Center
Average earnings in Monson Center are $43,706 for men and $51,111 for women, a difference of 14.5%. Men with an educational attainment of high school diploma enjoy the highest average annual earnings of $45,272, while those with college or associate's degree education earn the least with $43,618. Women with an educational attainment of college or associate's degree earn the most with the average annual earnings of $53,750, while those with high school diploma education have the smallest earnings of $45,000.
| Educational Attainment | Male Income | Female Income |
| Less than High School | - | - |
| High School Diploma | $45,272 | $45,000 |
| College or Associate's Degree | $43,618 | $53,750 |
| Bachelor's Degree | - | - |
| Graduate Degree | - | - |
| Total | $43,706 | $51,111 |
Family Income in Monson Center
Family Income Brackets in Monson Center
According to the Monson Center family income data, there are 89 families falling into the $100,000 to $149,999 income range, which is the most common income bracket and makes up 21.0% of all families.
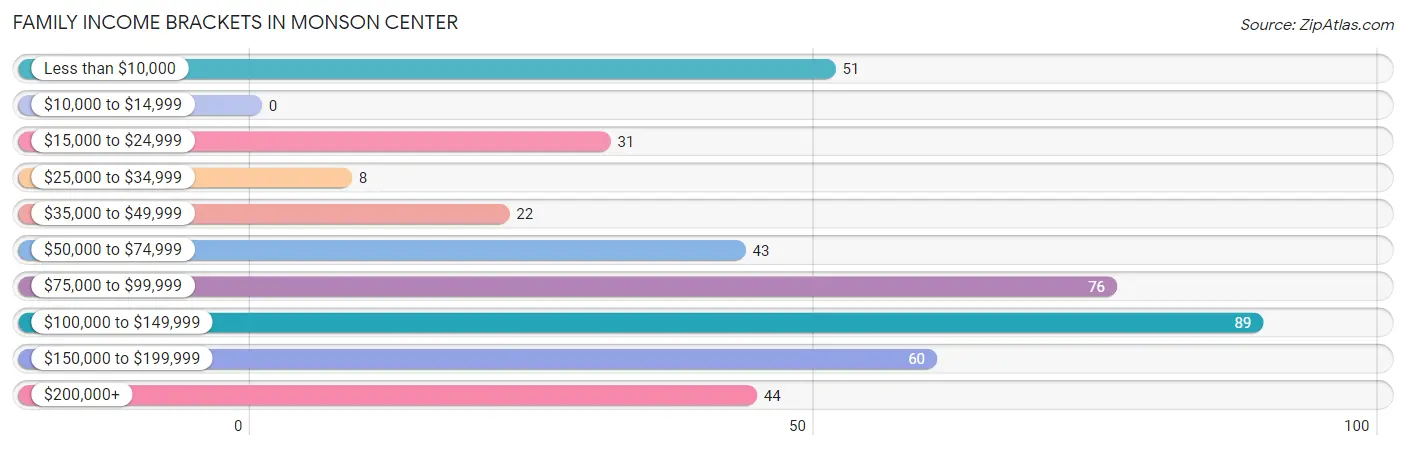
| Income Bracket | # Families | % Families |
| Less than $10,000 | 51 | 12.0% |
| $10,000 to $14,999 | 0 | 0.0% |
| $15,000 to $24,999 | 31 | 7.3% |
| $25,000 to $34,999 | 8 | 1.9% |
| $35,000 to $49,999 | 22 | 5.2% |
| $50,000 to $74,999 | 43 | 10.1% |
| $75,000 to $99,999 | 76 | 17.9% |
| $100,000 to $149,999 | 89 | 21.0% |
| $150,000 to $199,999 | 60 | 14.2% |
| $200,000+ | 44 | 10.4% |
Family Income by Famaliy Size in Monson Center
3-person families (99 | 23.4%) account for the highest median family income in Monson Center with $147,639 per family, while 3-person families (99 | 23.4%) have the highest median income of $49,213 per family member.
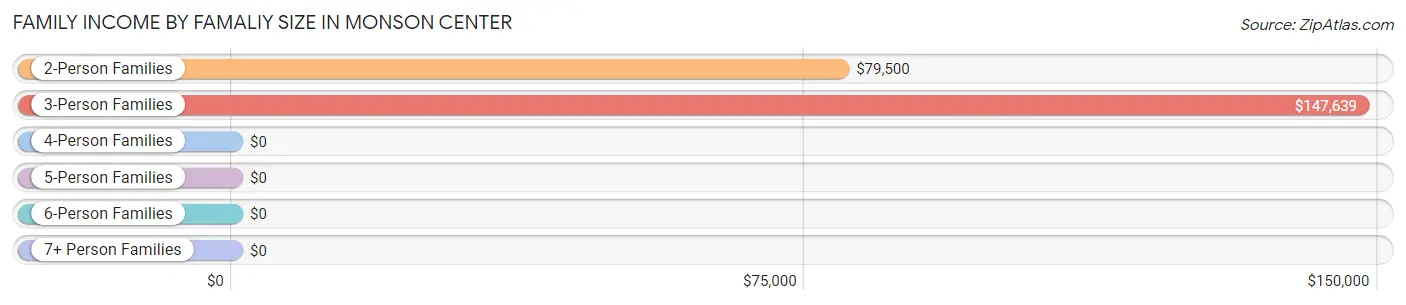
| Income Bracket | # Families | Median Income |
| 2-Person Families | 244 (57.6%) | $79,500 |
| 3-Person Families | 99 (23.4%) | $147,639 |
| 4-Person Families | 46 (10.8%) | $0 |
| 5-Person Families | 35 (8.3%) | $0 |
| 6-Person Families | 0 (0.0%) | $0 |
| 7+ Person Families | 0 (0.0%) | $0 |
| Total | 424 (100.0%) | $89,792 |
Family Income by Number of Earners in Monson Center
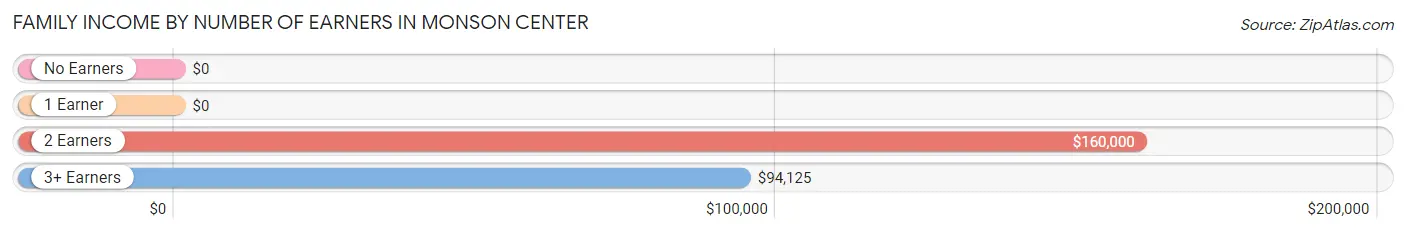
| Number of Earners | # Families | Median Income |
| No Earners | 46 (10.8%) | $0 |
| 1 Earner | 199 (46.9%) | $0 |
| 2 Earners | 148 (34.9%) | $160,000 |
| 3+ Earners | 31 (7.3%) | $94,125 |
| Total | 424 (100.0%) | $89,792 |
Household Income in Monson Center
Household Income Brackets in Monson Center
With 115 households falling in the category, the $75,000 to $99,999 income range is the most frequent in Monson Center, accounting for 13.9% of all households. In contrast, only 51 households (6.2%) fall into the $25,000 to $34,999 income bracket, making it the least populous group.
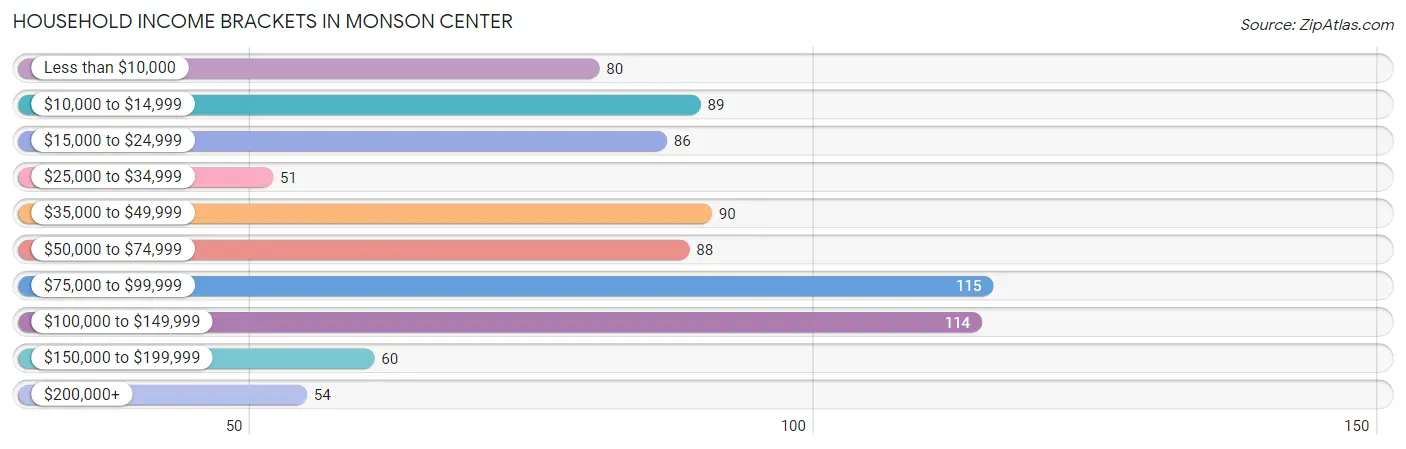
| Income Bracket | # Households | % Households |
| Less than $10,000 | 80 | 9.7% |
| $10,000 to $14,999 | 89 | 10.8% |
| $15,000 to $24,999 | 86 | 10.4% |
| $25,000 to $34,999 | 51 | 6.2% |
| $35,000 to $49,999 | 90 | 10.9% |
| $50,000 to $74,999 | 88 | 10.6% |
| $75,000 to $99,999 | 115 | 13.9% |
| $100,000 to $149,999 | 114 | 13.8% |
| $150,000 to $199,999 | 60 | 7.3% |
| $200,000+ | 54 | 6.5% |
Household Income by Householder Age in Monson Center
The median household income in Monson Center is $51,902, with the highest median household income of $80,909 found in the 45 to 64 years age bracket for the primary householder. A total of 284 households (34.3%) fall into this category. Meanwhile, the 15 to 24 years age bracket for the primary householder has the lowest median household income of $0, with 22 households (2.7%) in this group.
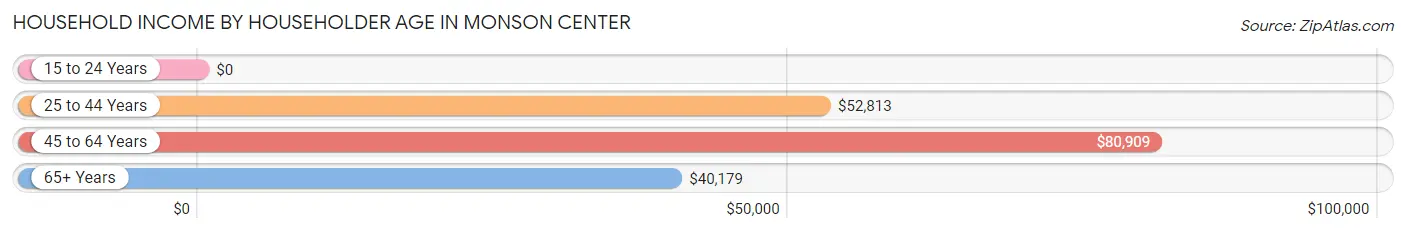
| Income Bracket | # Households | Median Income |
| 15 to 24 Years | 22 (2.7%) | $0 |
| 25 to 44 Years | 193 (23.3%) | $52,813 |
| 45 to 64 Years | 284 (34.3%) | $80,909 |
| 65+ Years | 328 (39.7%) | $40,179 |
| Total | 827 (100.0%) | $51,902 |
Poverty in Monson Center
Income Below Poverty by Sex and Age in Monson Center
With 23.8% poverty level for males and 32.5% for females among the residents of Monson Center, 15 year old males and 75 year old and over females are the most vulnerable to poverty, with 28 males (77.8%) and 31 females (79.5%) in their respective age groups living below the poverty level.
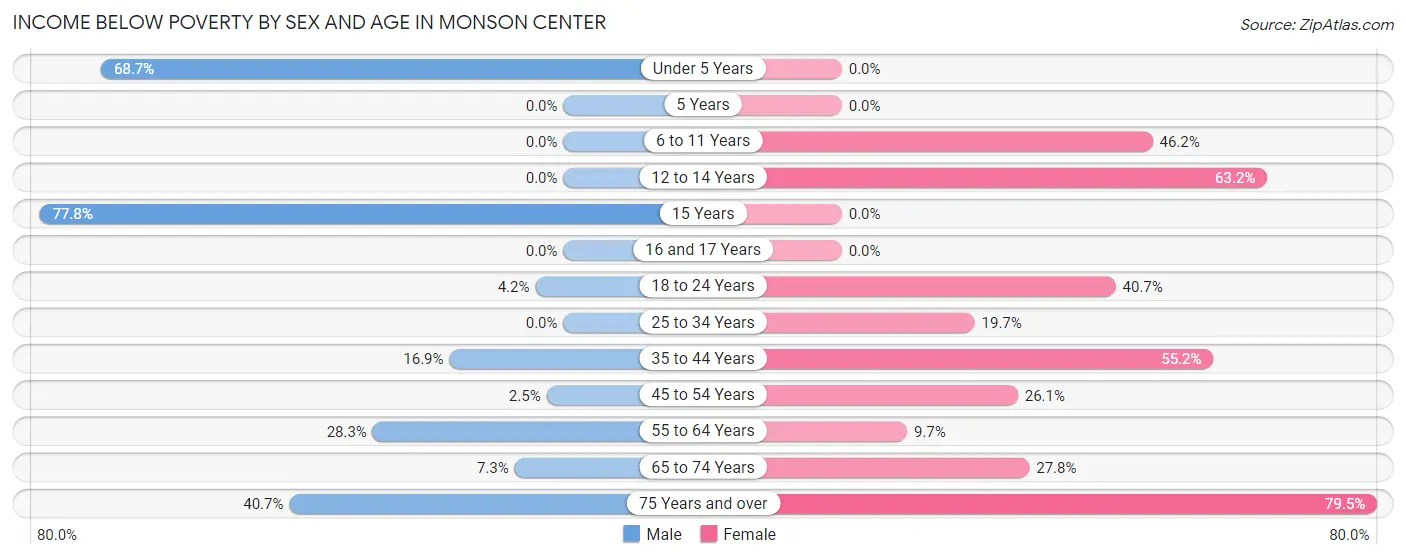
| Age Bracket | Male | Female |
| Under 5 Years | 46 (68.7%) | 0 (0.0%) |
| 5 Years | 0 (0.0%) | 0 (0.0%) |
| 6 to 11 Years | 0 (0.0%) | 24 (46.2%) |
| 12 to 14 Years | 0 (0.0%) | 24 (63.2%) |
| 15 Years | 28 (77.8%) | 0 (0.0%) |
| 16 and 17 Years | 0 (0.0%) | 0 (0.0%) |
| 18 to 24 Years | 1 (4.2%) | 37 (40.7%) |
| 25 to 34 Years | 0 (0.0%) | 14 (19.7%) |
| 35 to 44 Years | 32 (16.9%) | 48 (55.2%) |
| 45 to 54 Years | 1 (2.5%) | 29 (26.1%) |
| 55 to 64 Years | 47 (28.3%) | 15 (9.7%) |
| 65 to 74 Years | 10 (7.2%) | 49 (27.8%) |
| 75 Years and over | 35 (40.7%) | 31 (79.5%) |
| Total | 200 (23.8%) | 271 (32.5%) |
Income Above Poverty by Sex and Age in Monson Center
According to the poverty statistics in Monson Center, males aged 6 to 11 years and females aged under 5 years are the age groups that are most secure financially, with 100.0% of males and 100.0% of females in these age groups living above the poverty line.
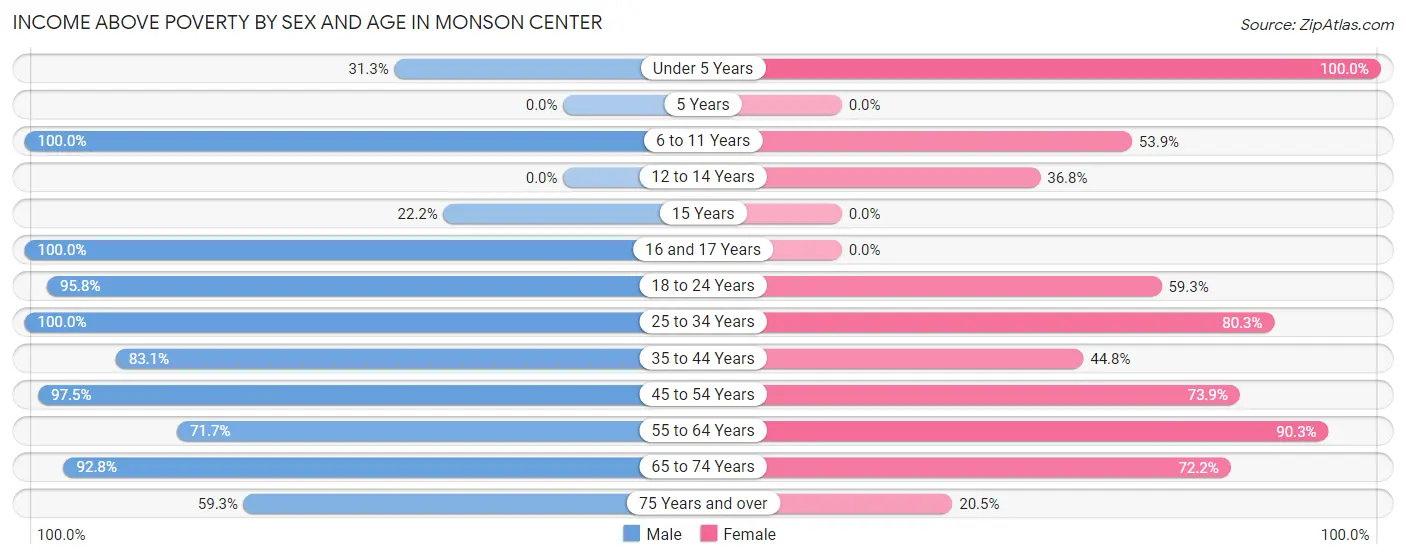
| Age Bracket | Male | Female |
| Under 5 Years | 21 (31.3%) | 13 (100.0%) |
| 5 Years | 0 (0.0%) | 0 (0.0%) |
| 6 to 11 Years | 19 (100.0%) | 28 (53.8%) |
| 12 to 14 Years | 0 (0.0%) | 14 (36.8%) |
| 15 Years | 8 (22.2%) | 0 (0.0%) |
| 16 and 17 Years | 12 (100.0%) | 0 (0.0%) |
| 18 to 24 Years | 23 (95.8%) | 54 (59.3%) |
| 25 to 34 Years | 63 (100.0%) | 57 (80.3%) |
| 35 to 44 Years | 157 (83.1%) | 39 (44.8%) |
| 45 to 54 Years | 39 (97.5%) | 82 (73.9%) |
| 55 to 64 Years | 119 (71.7%) | 140 (90.3%) |
| 65 to 74 Years | 128 (92.7%) | 127 (72.2%) |
| 75 Years and over | 51 (59.3%) | 8 (20.5%) |
| Total | 640 (76.2%) | 562 (67.5%) |
Income Below Poverty Among Married-Couple Families in Monson Center
The poverty statistics for married-couple families in Monson Center show that 18.4% or 59 of the total 320 families live below the poverty line. Families with 1 or 2 children have the highest poverty rate of 27.9%, comprising of 24 families. On the other hand, families with no children have the lowest poverty rate of 15.0%, which includes 35 families.
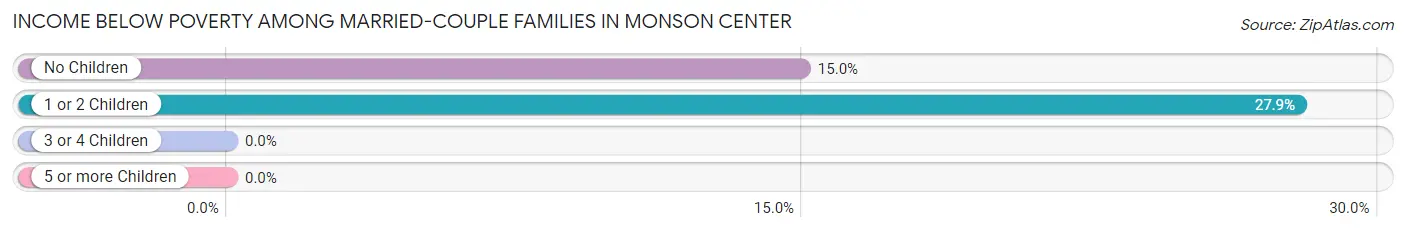
| Children | Above Poverty | Below Poverty |
| No Children | 199 (85.0%) | 35 (15.0%) |
| 1 or 2 Children | 62 (72.1%) | 24 (27.9%) |
| 3 or 4 Children | 0 (0.0%) | 0 (0.0%) |
| 5 or more Children | 0 (0.0%) | 0 (0.0%) |
| Total | 261 (81.6%) | 59 (18.4%) |
Income Below Poverty Among Single-Parent Households in Monson Center
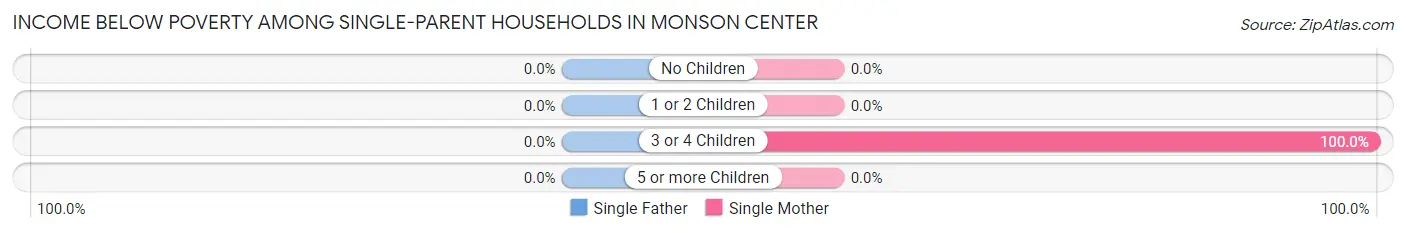
| Children | Single Father | Single Mother |
| No Children | 0 (0.0%) | 0 (0.0%) |
| 1 or 2 Children | 0 (0.0%) | 0 (0.0%) |
| 3 or 4 Children | 0 (0.0%) | 23 (100.0%) |
| 5 or more Children | 0 (0.0%) | 0 (0.0%) |
| Total | 0 (0.0%) | 23 (33.8%) |
Income Below Poverty Among Married-Couple vs Single-Parent Households in Monson Center
The poverty data for Monson Center shows that 59 of the married-couple family households (18.4%) and 23 of the single-parent households (22.1%) are living below the poverty level. Within the married-couple family households, those with 1 or 2 children have the highest poverty rate, with 24 households (27.9%) falling below the poverty line. Among the single-parent households, those with 3 or 4 children have the highest poverty rate, with 23 household (100.0%) living below poverty.
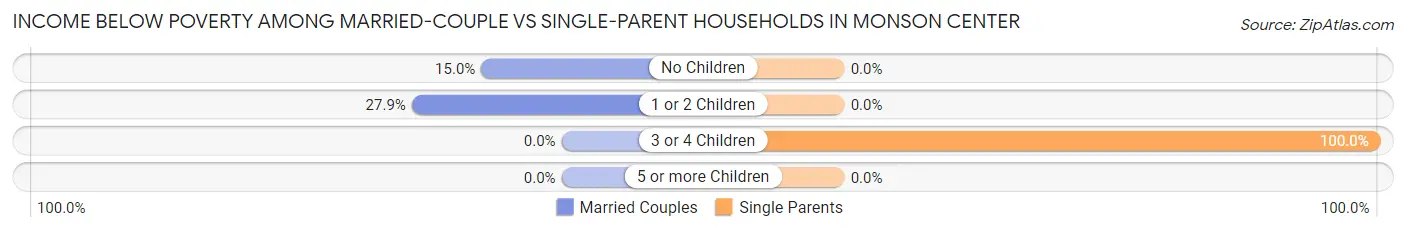
| Children | Married-Couple Families | Single-Parent Households |
| No Children | 35 (15.0%) | 0 (0.0%) |
| 1 or 2 Children | 24 (27.9%) | 0 (0.0%) |
| 3 or 4 Children | 0 (0.0%) | 23 (100.0%) |
| 5 or more Children | 0 (0.0%) | 0 (0.0%) |
| Total | 59 (18.4%) | 23 (22.1%) |
Race in Monson Center
The most populous races in Monson Center are White / Caucasian (1,578 | 94.3%), Asian (47 | 2.8%), and Black / African American (31 | 1.8%).
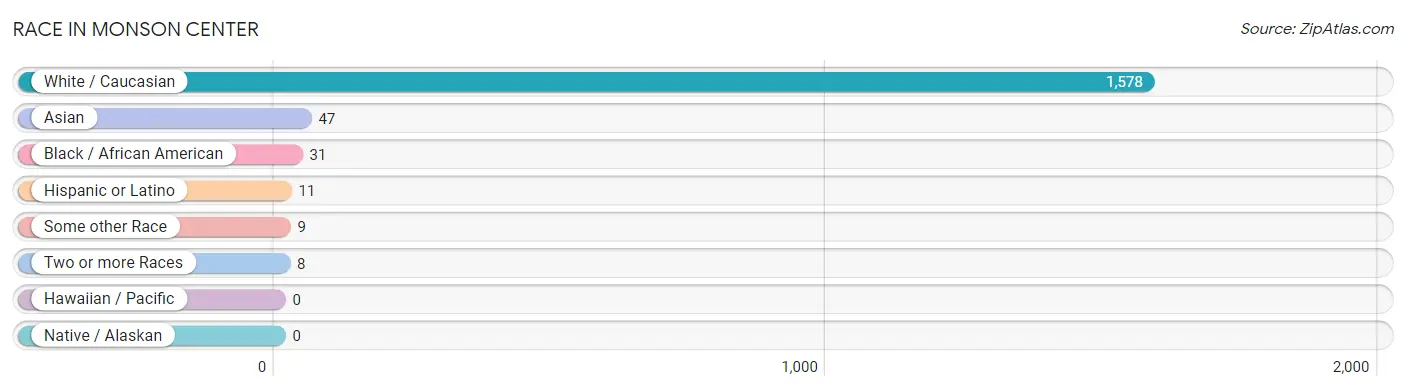
| Race | # Population | % Population |
| Asian | 47 | 2.8% |
| Black / African American | 31 | 1.8% |
| Hawaiian / Pacific | 0 | 0.0% |
| Hispanic or Latino | 11 | 0.7% |
| Native / Alaskan | 0 | 0.0% |
| White / Caucasian | 1,578 | 94.3% |
| Two or more Races | 8 | 0.5% |
| Some other Race | 9 | 0.5% |
| Total | 1,673 | 100.0% |
Ancestry in Monson Center
The most populous ancestries reported in Monson Center are Irish (420 | 25.1%), Italian (273 | 16.3%), French (226 | 13.5%), French Canadian (186 | 11.1%), and Polish (170 | 10.2%), together accounting for 76.2% of all Monson Center residents.
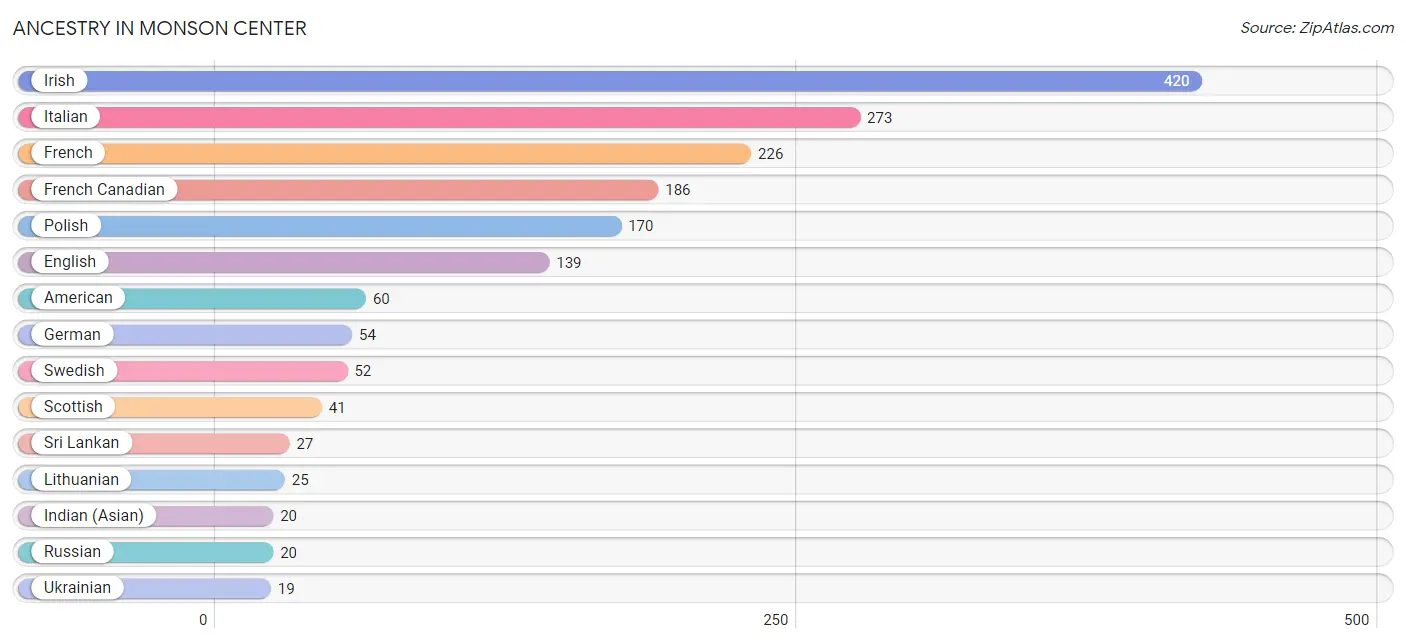
| Ancestry | # Population | % Population |
| American | 60 | 3.6% |
| Arab | 8 | 0.5% |
| British | 9 | 0.5% |
| British West Indian | 1 | 0.1% |
| Canadian | 13 | 0.8% |
| Czech | 9 | 0.5% |
| Dominican | 1 | 0.1% |
| English | 139 | 8.3% |
| French | 226 | 13.5% |
| French Canadian | 186 | 11.1% |
| German | 54 | 3.2% |
| Indian (Asian) | 20 | 1.2% |
| Irish | 420 | 25.1% |
| Italian | 273 | 16.3% |
| Jamaican | 8 | 0.5% |
| Lithuanian | 25 | 1.5% |
| Norwegian | 8 | 0.5% |
| Peruvian | 1 | 0.1% |
| Polish | 170 | 10.2% |
| Puerto Rican | 9 | 0.5% |
| Romanian | 1 | 0.1% |
| Russian | 20 | 1.2% |
| Scotch-Irish | 17 | 1.0% |
| Scottish | 41 | 2.5% |
| South American | 1 | 0.1% |
| Sri Lankan | 27 | 1.6% |
| Swedish | 52 | 3.1% |
| Ukrainian | 19 | 1.1% | View All 28 Rows |
Immigrants in Monson Center
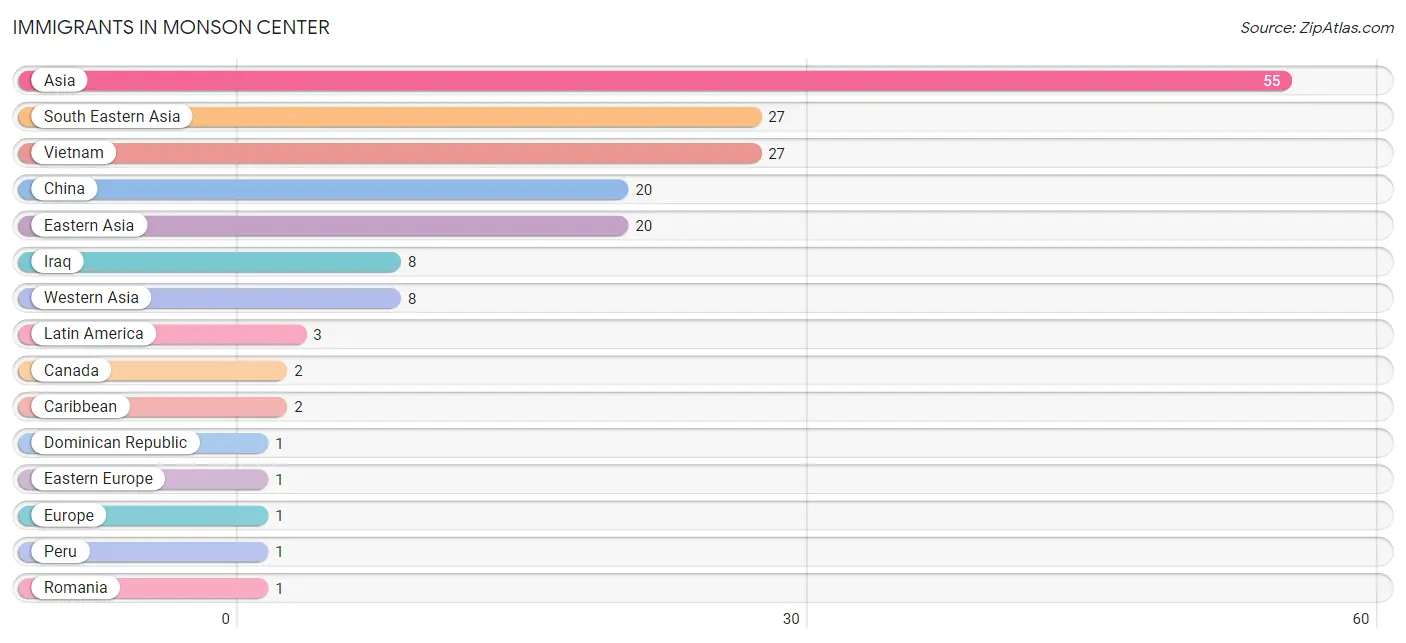
The most numerous immigrant groups reported in Monson Center came from Asia (55 | 3.3%), South Eastern Asia (27 | 1.6%), Vietnam (27 | 1.6%), China (20 | 1.2%), and Eastern Asia (20 | 1.2%), together accounting for 8.9% of all Monson Center residents.
| Immigration Origin | # Population | % Population |
| Asia | 55 | 3.3% |
| Canada | 2 | 0.1% |
| Caribbean | 2 | 0.1% |
| China | 20 | 1.2% |
| Dominican Republic | 1 | 0.1% |
| Eastern Asia | 20 | 1.2% |
| Eastern Europe | 1 | 0.1% |
| Europe | 1 | 0.1% |
| Iraq | 8 | 0.5% |
| Latin America | 3 | 0.2% |
| Peru | 1 | 0.1% |
| Romania | 1 | 0.1% |
| South America | 1 | 0.1% |
| South Eastern Asia | 27 | 1.6% |
| Vietnam | 27 | 1.6% |
| West Indies | 1 | 0.1% |
| Western Asia | 8 | 0.5% | View All 17 Rows |
Sex and Age in Monson Center
Sex and Age in Monson Center
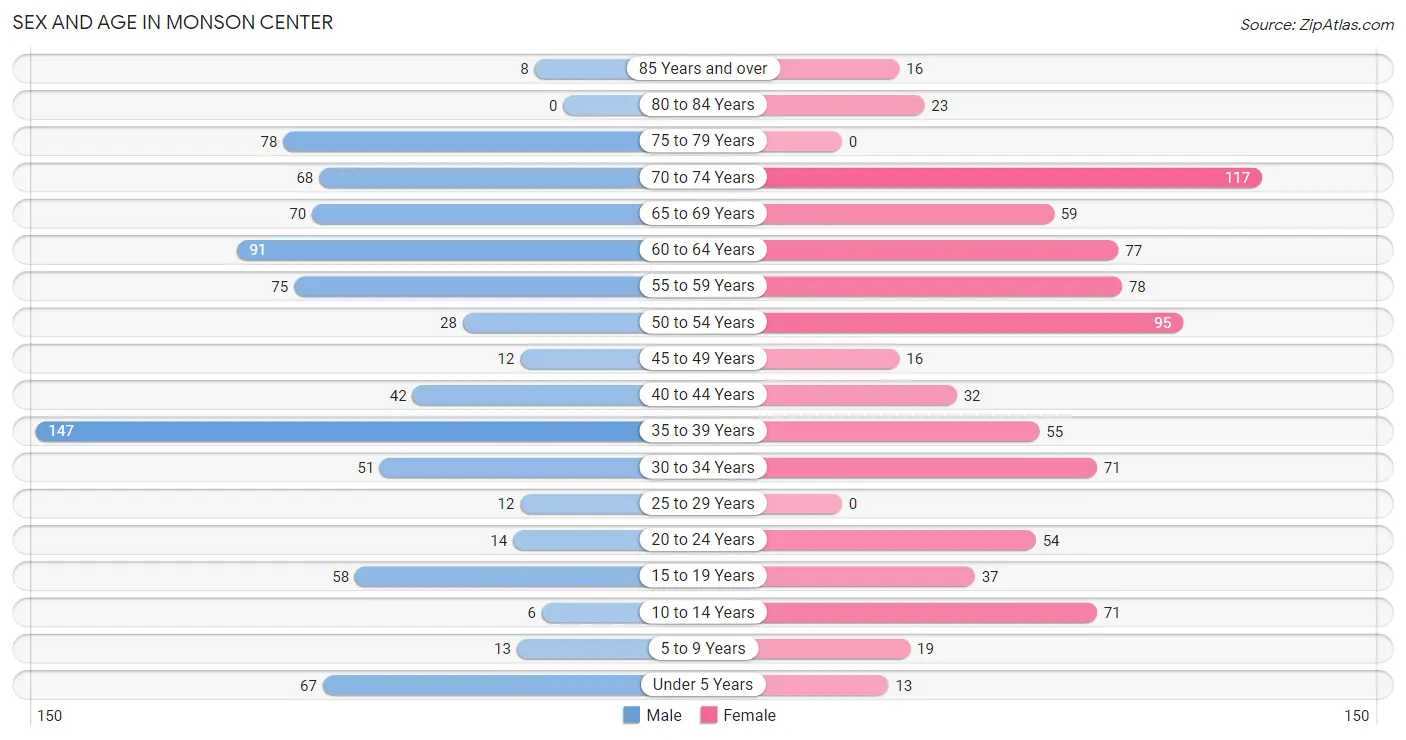
The most populous age groups in Monson Center are 35 to 39 Years (147 | 17.5%) for men and 70 to 74 Years (117 | 14.1%) for women.
| Age Bracket | Male | Female |
| Under 5 Years | 67 (8.0%) | 13 (1.6%) |
| 5 to 9 Years | 13 (1.5%) | 19 (2.3%) |
| 10 to 14 Years | 6 (0.7%) | 71 (8.5%) |
| 15 to 19 Years | 58 (6.9%) | 37 (4.4%) |
| 20 to 24 Years | 14 (1.7%) | 54 (6.5%) |
| 25 to 29 Years | 12 (1.4%) | 0 (0.0%) |
| 30 to 34 Years | 51 (6.1%) | 71 (8.5%) |
| 35 to 39 Years | 147 (17.5%) | 55 (6.6%) |
| 40 to 44 Years | 42 (5.0%) | 32 (3.8%) |
| 45 to 49 Years | 12 (1.4%) | 16 (1.9%) |
| 50 to 54 Years | 28 (3.3%) | 95 (11.4%) |
| 55 to 59 Years | 75 (8.9%) | 78 (9.4%) |
| 60 to 64 Years | 91 (10.8%) | 77 (9.2%) |
| 65 to 69 Years | 70 (8.3%) | 59 (7.1%) |
| 70 to 74 Years | 68 (8.1%) | 117 (14.1%) |
| 75 to 79 Years | 78 (9.3%) | 0 (0.0%) |
| 80 to 84 Years | 0 (0.0%) | 23 (2.8%) |
| 85 Years and over | 8 (0.9%) | 16 (1.9%) |
| Total | 840 (100.0%) | 833 (100.0%) |
Families and Households in Monson Center
Median Family Size in Monson Center
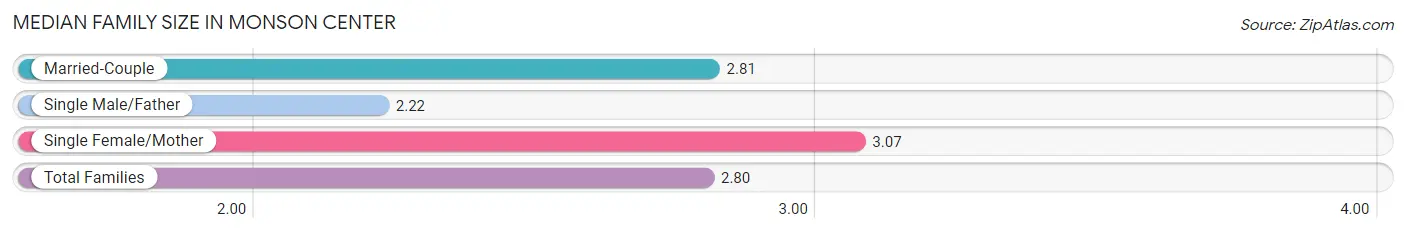
The median family size in Monson Center is 2.80 persons per family, with single female/mother families (68 | 16.0%) accounting for the largest median family size of 3.07 persons per family. On the other hand, single male/father families (36 | 8.5%) represent the smallest median family size with 2.22 persons per family.
| Family Type | # Families | Family Size |
| Married-Couple | 320 (75.5%) | 2.81 |
| Single Male/Father | 36 (8.5%) | 2.22 |
| Single Female/Mother | 68 (16.0%) | 3.07 |
| Total Families | 424 (100.0%) | 2.80 |
Median Household Size in Monson Center
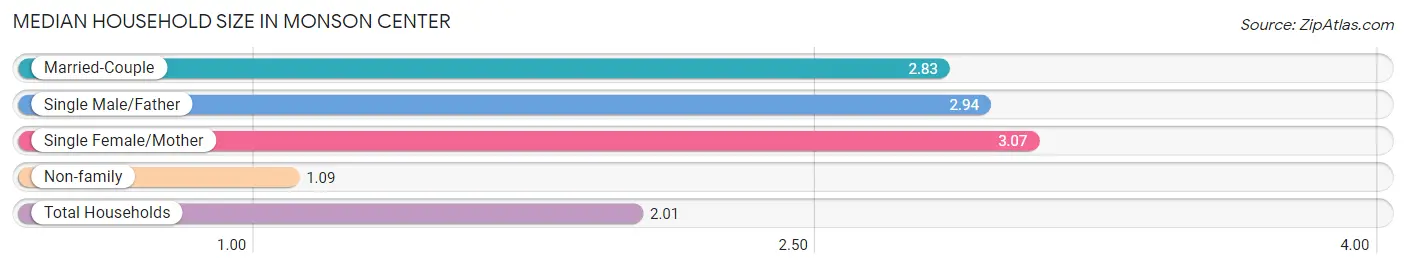
The median household size in Monson Center is 2.01 persons per household, with single female/mother households (68 | 8.2%) accounting for the largest median household size of 3.07 persons per household. non-family households (403 | 48.7%) represent the smallest median household size with 1.09 persons per household.
| Household Type | # Households | Household Size |
| Married-Couple | 320 (38.7%) | 2.83 |
| Single Male/Father | 36 (4.3%) | 2.94 |
| Single Female/Mother | 68 (8.2%) | 3.07 |
| Non-family | 403 (48.7%) | 1.09 |
| Total Households | 827 (100.0%) | 2.01 |
Household Size by Marriage Status in Monson Center
Out of a total of 827 households in Monson Center, 424 (51.3%) are family households, while 403 (48.7%) are nonfamily households. The most numerous type of family households are 2-person households, comprising 213, and the most common type of nonfamily households are 1-person households, comprising 380.
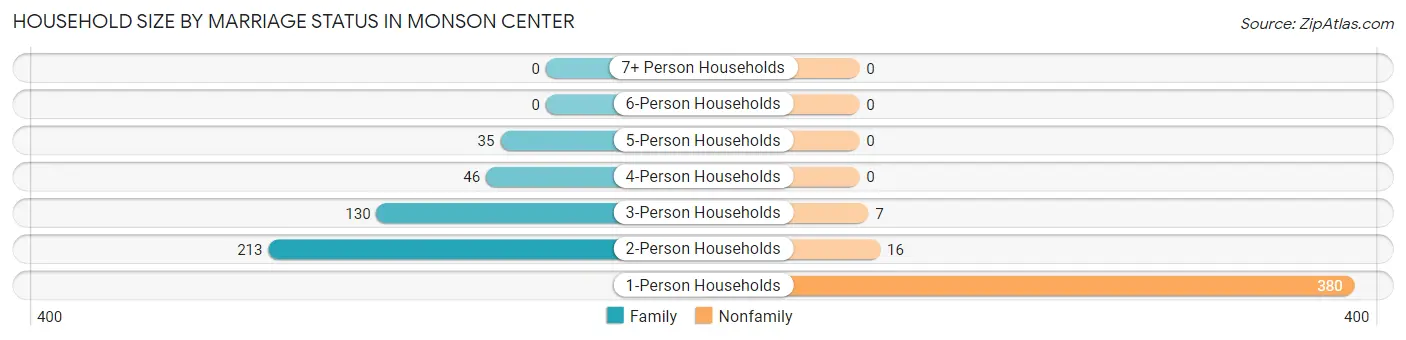
| Household Size | Family Households | Nonfamily Households |
| 1-Person Households | - | 380 (46.0%) |
| 2-Person Households | 213 (25.8%) | 16 (1.9%) |
| 3-Person Households | 130 (15.7%) | 7 (0.9%) |
| 4-Person Households | 46 (5.6%) | 0 (0.0%) |
| 5-Person Households | 35 (4.2%) | 0 (0.0%) |
| 6-Person Households | 0 (0.0%) | 0 (0.0%) |
| 7+ Person Households | 0 (0.0%) | 0 (0.0%) |
| Total | 424 (51.3%) | 403 (48.7%) |
Female Fertility in Monson Center
Fertility by Age in Monson Center
| Age Bracket | Women with Births | Births / 1,000 Women |
| 15 to 19 years | 0 (0.0%) | 0.0 |
| 20 to 34 years | 0 (0.0%) | 0.0 |
| 35 to 50 years | 0 (0.0%) | 0.0 |
| Total | 0 (0.0%) | 0.0 |
Fertility by Age by Marriage Status in Monson Center
| Age Bracket | Married | Unmarried |
| 15 to 19 years | 0 (0.0%) | 0 (0.0%) |
| 20 to 34 years | 0 (0.0%) | 0 (0.0%) |
| 35 to 50 years | 0 (0.0%) | 0 (0.0%) |
| Total | 0 (0.0%) | 0 (0.0%) |
Fertility by Education in Monson Center
| Educational Attainment | Women with Births | Births / 1,000 Women |
| Less than High School | 0 (0.0%) | 0.0 |
| High School Diploma | 0 (0.0%) | 0.0 |
| College or Associate's Degree | 0 (0.0%) | 0.0 |
| Bachelor's Degree | 0 (0.0%) | 0.0 |
| Graduate Degree | 0 (0.0%) | 0.0 |
| Total | 0 (0.0%) | 0.0 |
Fertility by Education by Marriage Status in Monson Center
| Educational Attainment | Married | Unmarried |
| Less than High School | 0 (0.0%) | 0 (0.0%) |
| High School Diploma | 0 (0.0%) | 0 (0.0%) |
| College or Associate's Degree | 0 (0.0%) | 0 (0.0%) |
| Bachelor's Degree | 0 (0.0%) | 0 (0.0%) |
| Graduate Degree | 0 (0.0%) | 0 (0.0%) |
| Total | 0 (0.0%) | 0 (0.0%) |
Employment Characteristics in Monson Center
Employment by Class of Employer in Monson Center
Among the 731 employed individuals in Monson Center, private company employees (509 | 69.6%), not-for-profit organizations (79 | 10.8%), and local government employees (51 | 7.0%) make up the most common classes of employment.
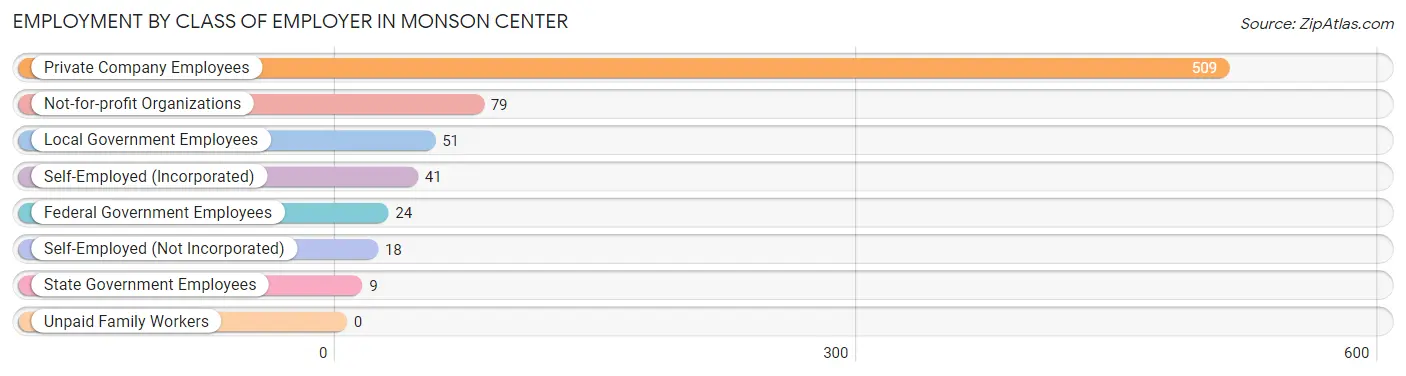
| Employer Class | # Employees | % Employees |
| Private Company Employees | 509 | 69.6% |
| Self-Employed (Incorporated) | 41 | 5.6% |
| Self-Employed (Not Incorporated) | 18 | 2.5% |
| Not-for-profit Organizations | 79 | 10.8% |
| Local Government Employees | 51 | 7.0% |
| State Government Employees | 9 | 1.2% |
| Federal Government Employees | 24 | 3.3% |
| Unpaid Family Workers | 0 | 0.0% |
| Total | 731 | 100.0% |
Employment Status by Age in Monson Center
According to the labor force statistics for Monson Center, out of the total population over 16 years of age (1,448), 60.6% or 877 individuals are in the labor force, with 16.6% or 146 of them unemployed. The age group with the highest labor force participation rate is 16 to 19 years, with 100.0% or 59 individuals in the labor force. Within the labor force, the 16 to 19 years age range has the highest percentage of unemployed individuals, with 83.1% or 49 of them being unemployed.
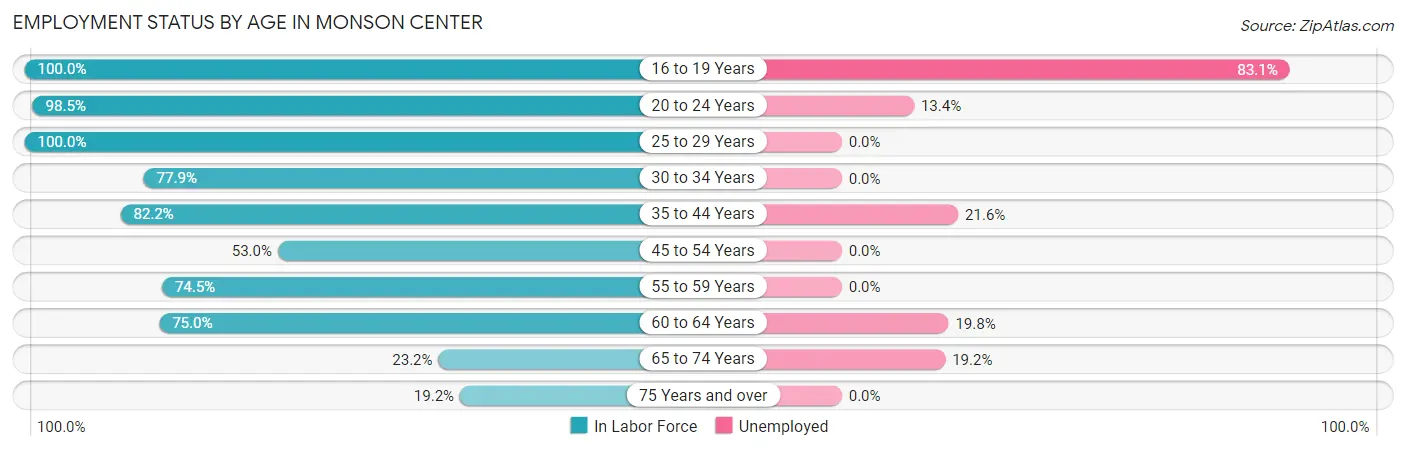
| Age Bracket | In Labor Force | Unemployed |
| 16 to 19 Years | 59 (100.0%) | 49 (83.1%) |
| 20 to 24 Years | 67 (98.5%) | 9 (13.4%) |
| 25 to 29 Years | 12 (100.0%) | 0 (0.0%) |
| 30 to 34 Years | 95 (77.9%) | 0 (0.0%) |
| 35 to 44 Years | 227 (82.2%) | 49 (21.6%) |
| 45 to 54 Years | 80 (53.0%) | 0 (0.0%) |
| 55 to 59 Years | 114 (74.5%) | 0 (0.0%) |
| 60 to 64 Years | 126 (75.0%) | 25 (19.8%) |
| 65 to 74 Years | 73 (23.2%) | 14 (19.2%) |
| 75 Years and over | 24 (19.2%) | 0 (0.0%) |
| Total | 877 (60.6%) | 146 (16.6%) |
Employment Status by Educational Attainment in Monson Center
According to labor force statistics for Monson Center, 74.1% of individuals (654) out of the total population between 25 and 64 years of age (882) are in the labor force, with 11.3% or 74 of them being unemployed. The group with the highest labor force participation rate are those with the educational attainment of bachelor's degree or higher, with 96.7% or 176 individuals in the labor force. Within the labor force, individuals with college / associate degree education have the highest percentage of unemployment, with 15.4% or 42 of them being unemployed.
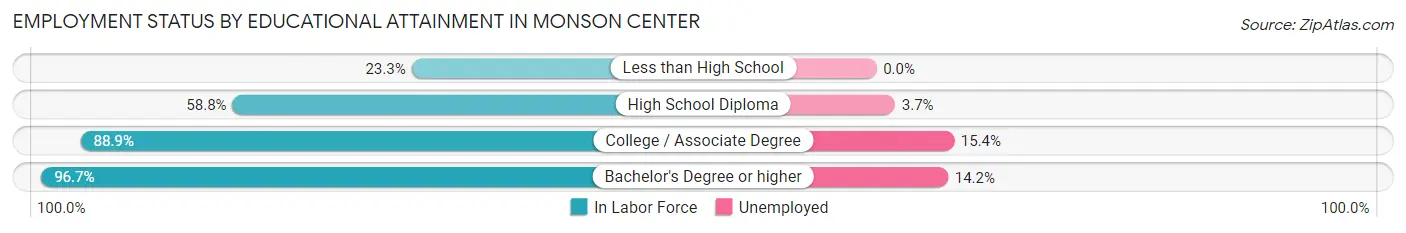
| Educational Attainment | In Labor Force | Unemployed |
| Less than High School | 17 (23.3%) | 0 (0.0%) |
| High School Diploma | 188 (58.8%) | 12 (3.7%) |
| College / Associate Degree | 273 (88.9%) | 47 (15.4%) |
| Bachelor's Degree or higher | 176 (96.7%) | 26 (14.2%) |
| Total | 654 (74.1%) | 100 (11.3%) |
Employment Occupations by Sex in Monson Center
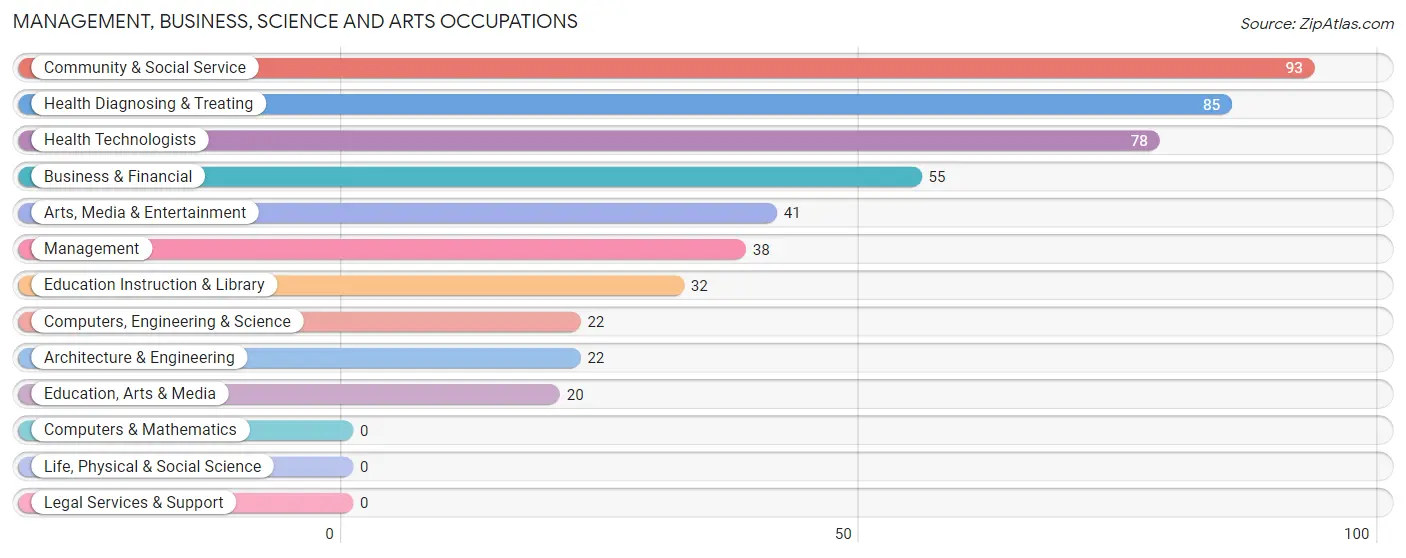
Management, Business, Science and Arts Occupations
The most common Management, Business, Science and Arts occupations in Monson Center are Community & Social Service (93 | 12.7%), Health Diagnosing & Treating (85 | 11.6%), Health Technologists (78 | 10.7%), Business & Financial (55 | 7.5%), and Arts, Media & Entertainment (41 | 5.6%).
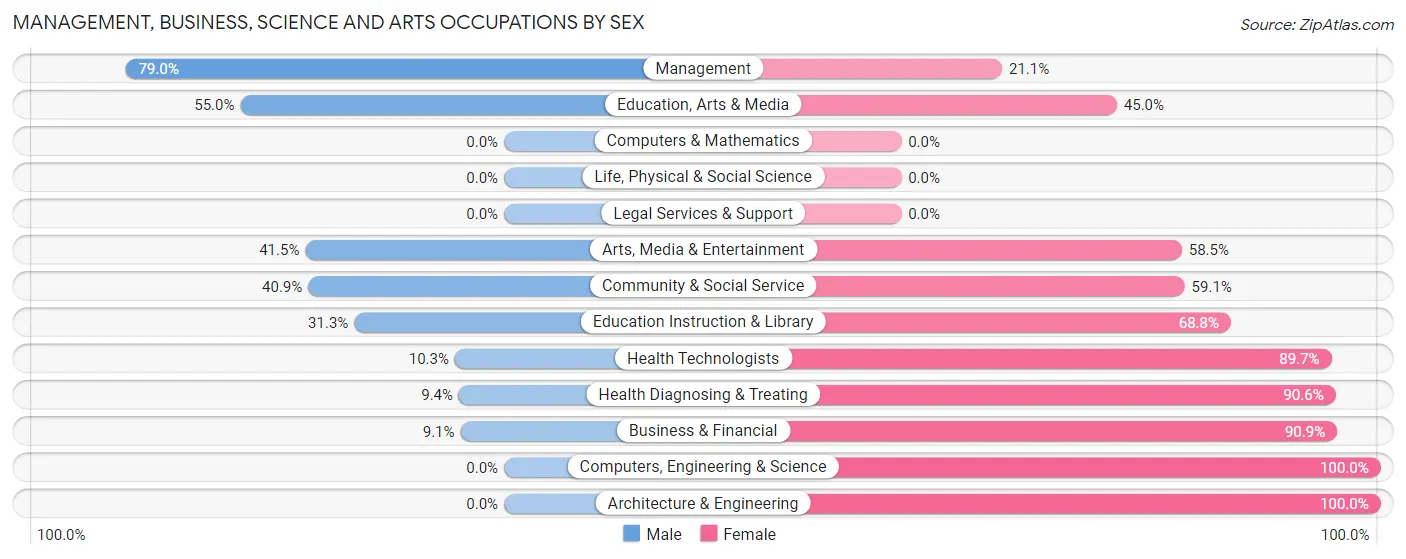
Management, Business, Science and Arts Occupations by Sex
Within the Management, Business, Science and Arts occupations in Monson Center, the most male-oriented occupations are Management (78.9%), Education, Arts & Media (55.0%), and Arts, Media & Entertainment (41.5%), while the most female-oriented occupations are Computers, Engineering & Science (100.0%), Architecture & Engineering (100.0%), and Business & Financial (90.9%).
| Occupation | Male | Female |
| Management | 30 (78.9%) | 8 (21.0%) |
| Business & Financial | 5 (9.1%) | 50 (90.9%) |
| Computers, Engineering & Science | 0 (0.0%) | 22 (100.0%) |
| Computers & Mathematics | 0 (0.0%) | 0 (0.0%) |
| Architecture & Engineering | 0 (0.0%) | 22 (100.0%) |
| Life, Physical & Social Science | 0 (0.0%) | 0 (0.0%) |
| Community & Social Service | 38 (40.9%) | 55 (59.1%) |
| Education, Arts & Media | 11 (55.0%) | 9 (45.0%) |
| Legal Services & Support | 0 (0.0%) | 0 (0.0%) |
| Education Instruction & Library | 10 (31.2%) | 22 (68.8%) |
| Arts, Media & Entertainment | 17 (41.5%) | 24 (58.5%) |
| Health Diagnosing & Treating | 8 (9.4%) | 77 (90.6%) |
| Health Technologists | 8 (10.3%) | 70 (89.7%) |
| Total (Category) | 81 (27.7%) | 212 (72.4%) |
| Total (Overall) | 360 (49.2%) | 371 (50.7%) |
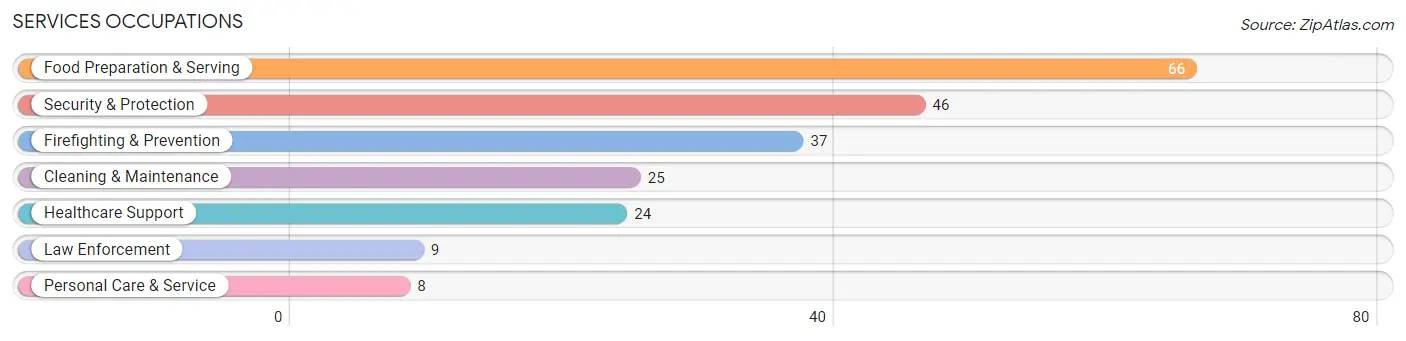
Services Occupations
The most common Services occupations in Monson Center are Food Preparation & Serving (66 | 9.0%), Security & Protection (46 | 6.3%), Firefighting & Prevention (37 | 5.1%), Cleaning & Maintenance (25 | 3.4%), and Healthcare Support (24 | 3.3%).
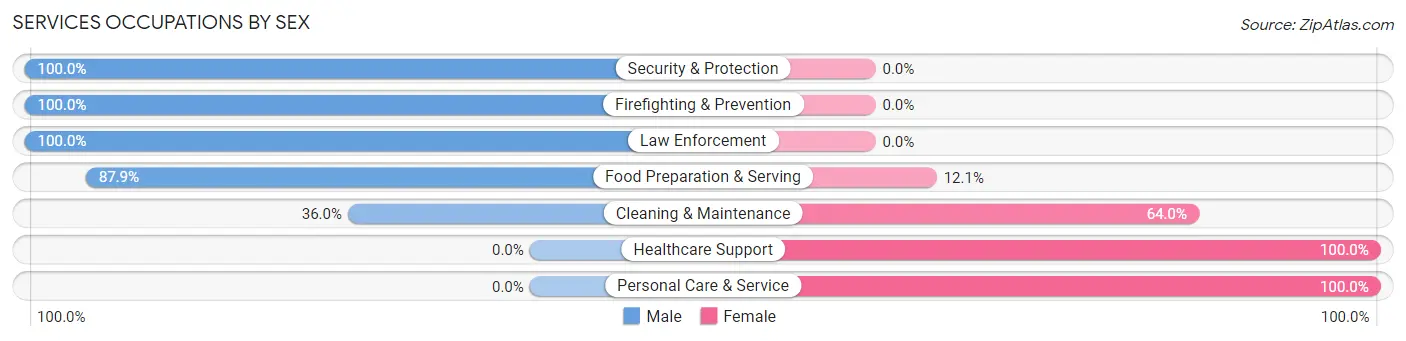
Services Occupations by Sex
Within the Services occupations in Monson Center, the most male-oriented occupations are Security & Protection (100.0%), Firefighting & Prevention (100.0%), and Law Enforcement (100.0%), while the most female-oriented occupations are Healthcare Support (100.0%), Personal Care & Service (100.0%), and Cleaning & Maintenance (64.0%).
| Occupation | Male | Female |
| Healthcare Support | 0 (0.0%) | 24 (100.0%) |
| Security & Protection | 46 (100.0%) | 0 (0.0%) |
| Firefighting & Prevention | 37 (100.0%) | 0 (0.0%) |
| Law Enforcement | 9 (100.0%) | 0 (0.0%) |
| Food Preparation & Serving | 58 (87.9%) | 8 (12.1%) |
| Cleaning & Maintenance | 9 (36.0%) | 16 (64.0%) |
| Personal Care & Service | 0 (0.0%) | 8 (100.0%) |
| Total (Category) | 113 (66.9%) | 56 (33.1%) |
| Total (Overall) | 360 (49.2%) | 371 (50.7%) |
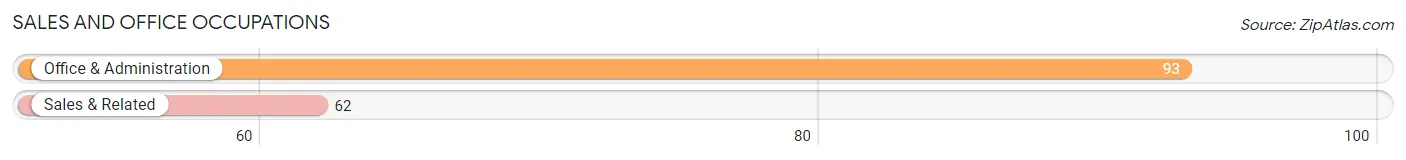
Sales and Office Occupations
The most common Sales and Office occupations in Monson Center are Office & Administration (93 | 12.7%), and Sales & Related (62 | 8.5%).
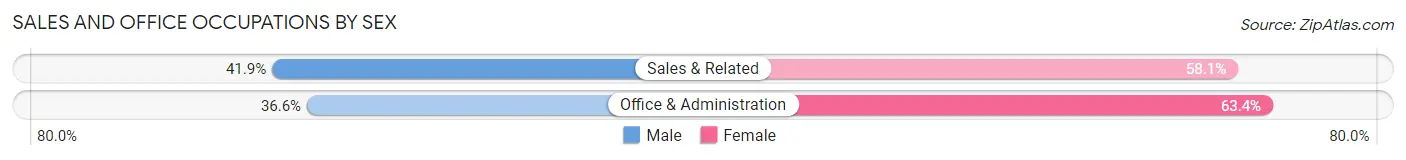
Sales and Office Occupations by Sex
| Occupation | Male | Female |
| Sales & Related | 26 (41.9%) | 36 (58.1%) |
| Office & Administration | 34 (36.6%) | 59 (63.4%) |
| Total (Category) | 60 (38.7%) | 95 (61.3%) |
| Total (Overall) | 360 (49.2%) | 371 (50.7%) |
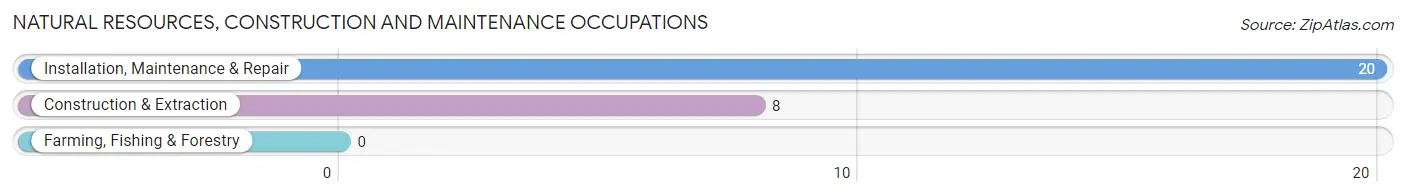
Natural Resources, Construction and Maintenance Occupations
The most common Natural Resources, Construction and Maintenance occupations in Monson Center are Installation, Maintenance & Repair (20 | 2.7%), and Construction & Extraction (8 | 1.1%).
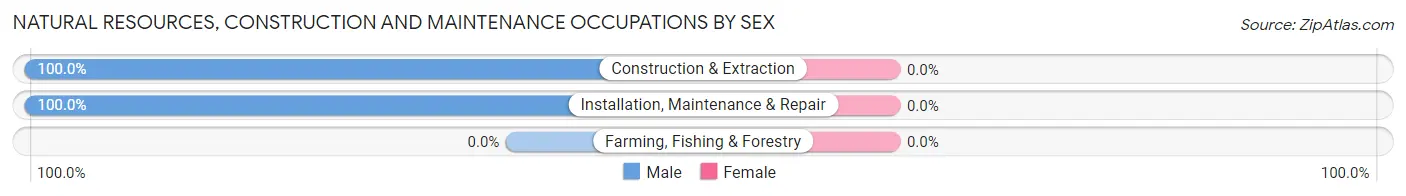
Natural Resources, Construction and Maintenance Occupations by Sex
| Occupation | Male | Female |
| Farming, Fishing & Forestry | 0 (0.0%) | 0 (0.0%) |
| Construction & Extraction | 8 (100.0%) | 0 (0.0%) |
| Installation, Maintenance & Repair | 20 (100.0%) | 0 (0.0%) |
| Total (Category) | 28 (100.0%) | 0 (0.0%) |
| Total (Overall) | 360 (49.2%) | 371 (50.7%) |
Production, Transportation and Moving Occupations
The most common Production, Transportation and Moving occupations in Monson Center are Transportation (37 | 5.1%), Material Moving (31 | 4.2%), and Production (18 | 2.5%).
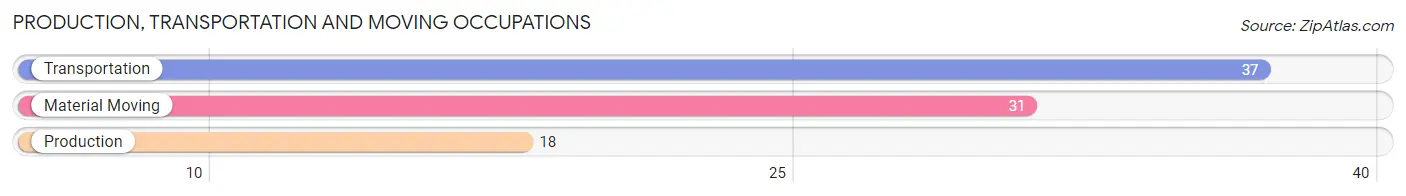
Production, Transportation and Moving Occupations by Sex
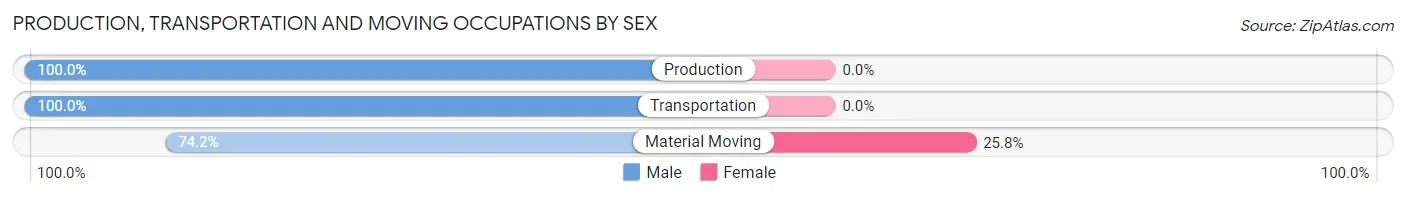
| Occupation | Male | Female |
| Production | 18 (100.0%) | 0 (0.0%) |
| Transportation | 37 (100.0%) | 0 (0.0%) |
| Material Moving | 23 (74.2%) | 8 (25.8%) |
| Total (Category) | 78 (90.7%) | 8 (9.3%) |
| Total (Overall) | 360 (49.2%) | 371 (50.7%) |
Employment Industries by Sex in Monson Center
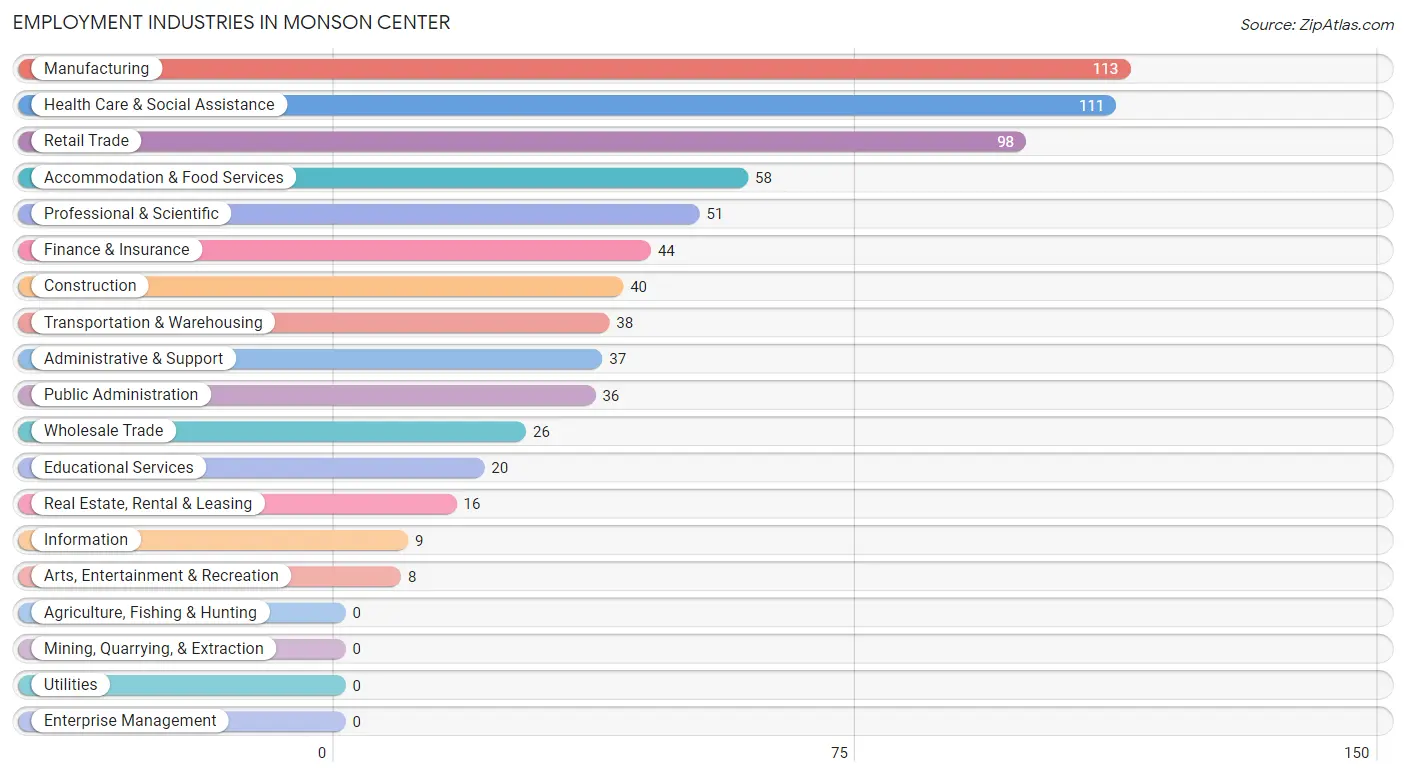
Employment Industries in Monson Center
The major employment industries in Monson Center include Manufacturing (113 | 15.5%), Health Care & Social Assistance (111 | 15.2%), Retail Trade (98 | 13.4%), Accommodation & Food Services (58 | 7.9%), and Professional & Scientific (51 | 7.0%).
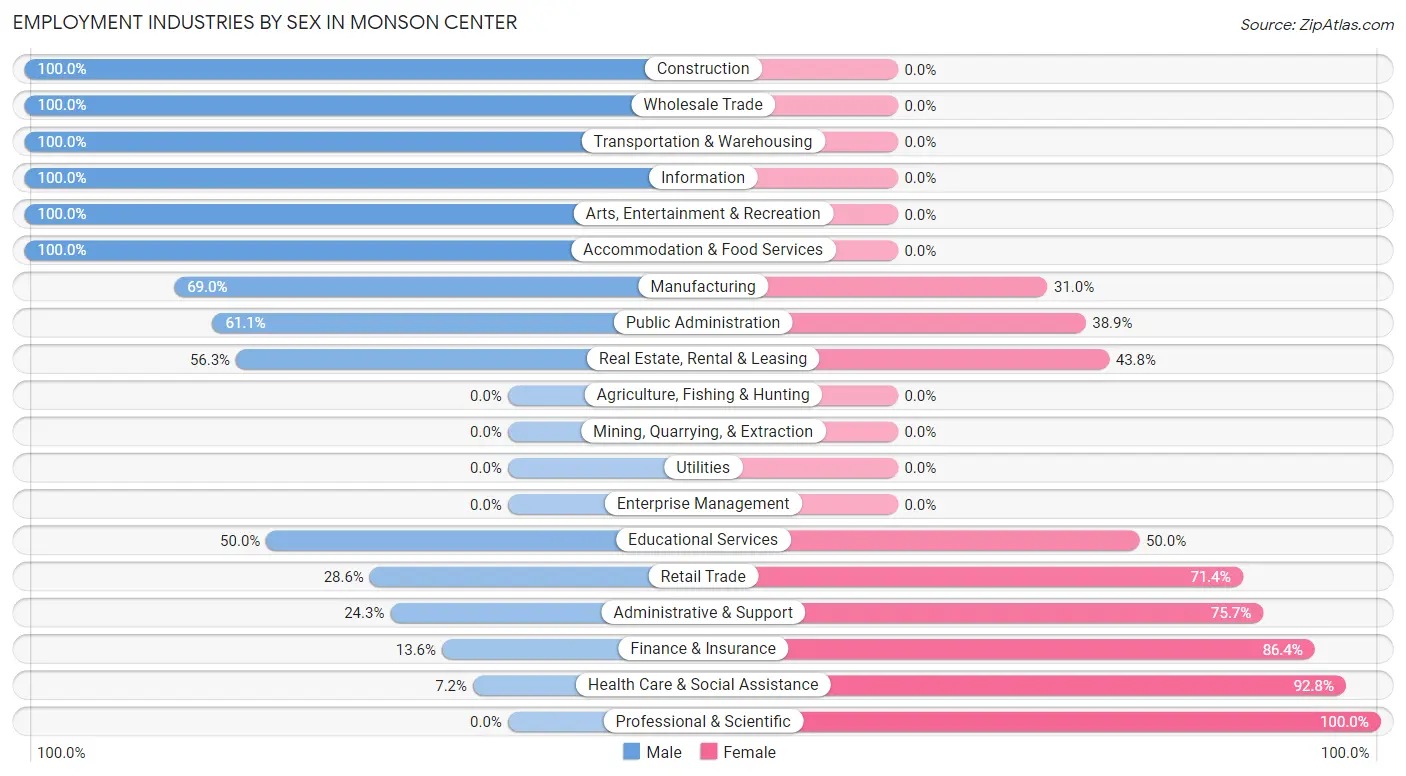
Employment Industries by Sex in Monson Center
The Monson Center industries that see more men than women are Construction (100.0%), Wholesale Trade (100.0%), and Transportation & Warehousing (100.0%), whereas the industries that tend to have a higher number of women are Professional & Scientific (100.0%), Health Care & Social Assistance (92.8%), and Finance & Insurance (86.4%).
| Industry | Male | Female |
| Agriculture, Fishing & Hunting | 0 (0.0%) | 0 (0.0%) |
| Mining, Quarrying, & Extraction | 0 (0.0%) | 0 (0.0%) |
| Construction | 40 (100.0%) | 0 (0.0%) |
| Manufacturing | 78 (69.0%) | 35 (31.0%) |
| Wholesale Trade | 26 (100.0%) | 0 (0.0%) |
| Retail Trade | 28 (28.6%) | 70 (71.4%) |
| Transportation & Warehousing | 38 (100.0%) | 0 (0.0%) |
| Utilities | 0 (0.0%) | 0 (0.0%) |
| Information | 9 (100.0%) | 0 (0.0%) |
| Finance & Insurance | 6 (13.6%) | 38 (86.4%) |
| Real Estate, Rental & Leasing | 9 (56.2%) | 7 (43.8%) |
| Professional & Scientific | 0 (0.0%) | 51 (100.0%) |
| Enterprise Management | 0 (0.0%) | 0 (0.0%) |
| Administrative & Support | 9 (24.3%) | 28 (75.7%) |
| Educational Services | 10 (50.0%) | 10 (50.0%) |
| Health Care & Social Assistance | 8 (7.2%) | 103 (92.8%) |
| Arts, Entertainment & Recreation | 8 (100.0%) | 0 (0.0%) |
| Accommodation & Food Services | 58 (100.0%) | 0 (0.0%) |
| Public Administration | 22 (61.1%) | 14 (38.9%) |
| Total | 360 (49.2%) | 371 (50.7%) |
Education in Monson Center
School Enrollment in Monson Center
The most common levels of schooling among the 198 students in Monson Center are middle school (77 | 38.9%), high school (59 | 29.8%), and elementary school (32 | 16.2%).
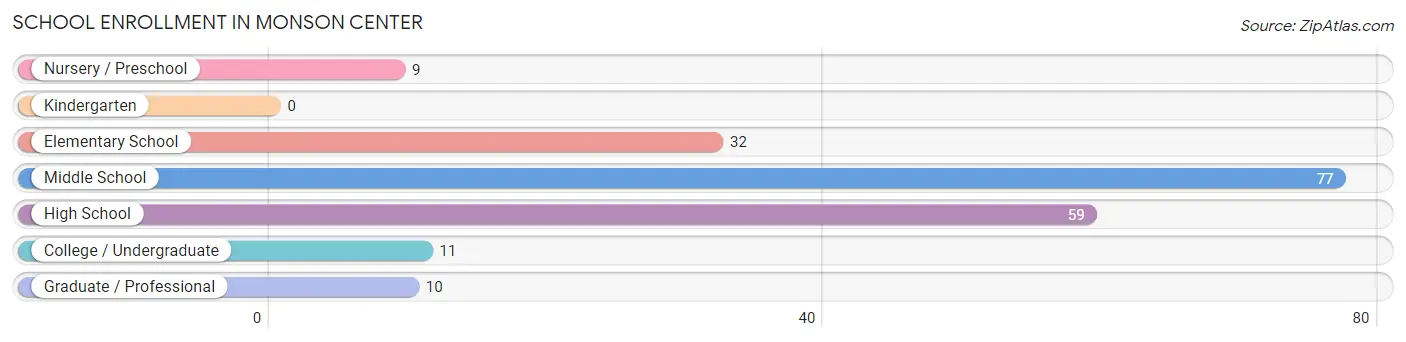
| School Level | # Students | % Students |
| Nursery / Preschool | 9 | 4.5% |
| Kindergarten | 0 | 0.0% |
| Elementary School | 32 | 16.2% |
| Middle School | 77 | 38.9% |
| High School | 59 | 29.8% |
| College / Undergraduate | 11 | 5.6% |
| Graduate / Professional | 10 | 5.1% |
| Total | 198 | 100.0% |
School Enrollment by Age by Funding Source in Monson Center
Out of a total of 198 students who are enrolled in schools in Monson Center, 11 (5.6%) attend a private institution, while the remaining 187 (94.4%) are enrolled in public schools. The age group of 35 years and over has the highest likelihood of being enrolled in private schools, with 11 (52.4% in the age bracket) enrolled. Conversely, the age group of 3 to 4 year olds has the lowest likelihood of being enrolled in a private school, with 9 (100.0% in the age bracket) attending a public institution.
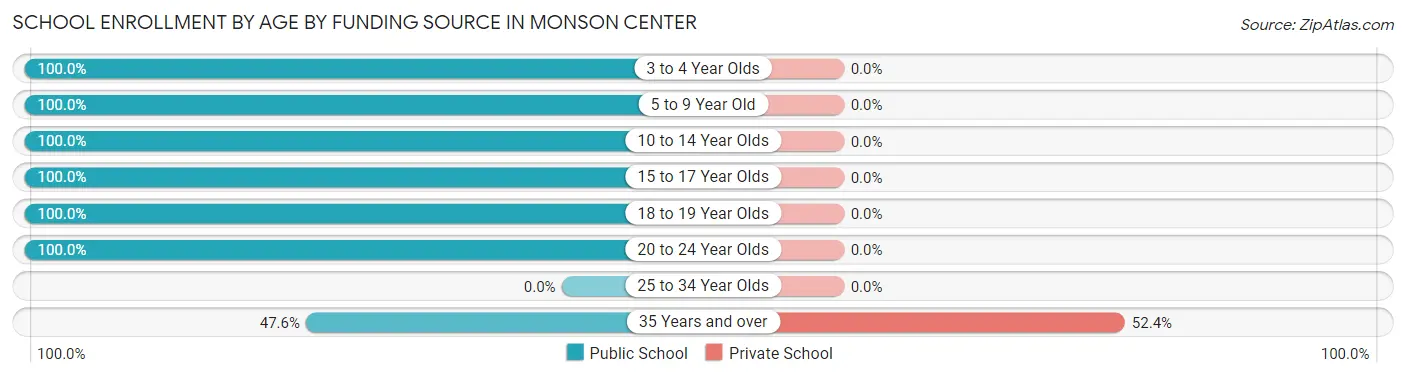
| Age Bracket | Public School | Private School |
| 3 to 4 Year Olds | 9 (100.0%) | 0 (0.0%) |
| 5 to 9 Year Old | 32 (100.0%) | 0 (0.0%) |
| 10 to 14 Year Olds | 77 (100.0%) | 0 (0.0%) |
| 15 to 17 Year Olds | 48 (100.0%) | 0 (0.0%) |
| 18 to 19 Year Olds | 10 (100.0%) | 0 (0.0%) |
| 20 to 24 Year Olds | 1 (100.0%) | 0 (0.0%) |
| 25 to 34 Year Olds | 0 (0.0%) | 0 (0.0%) |
| 35 Years and over | 10 (47.6%) | 11 (52.4%) |
| Total | 187 (94.4%) | 11 (5.6%) |
Educational Attainment by Field of Study in Monson Center
Science & technology (61 | 18.5%), education (53 | 16.1%), business (40 | 12.2%), engineering (31 | 9.4%), and liberal arts & history (27 | 8.2%) are the most common fields of study among 329 individuals in Monson Center who have obtained a bachelor's degree or higher.
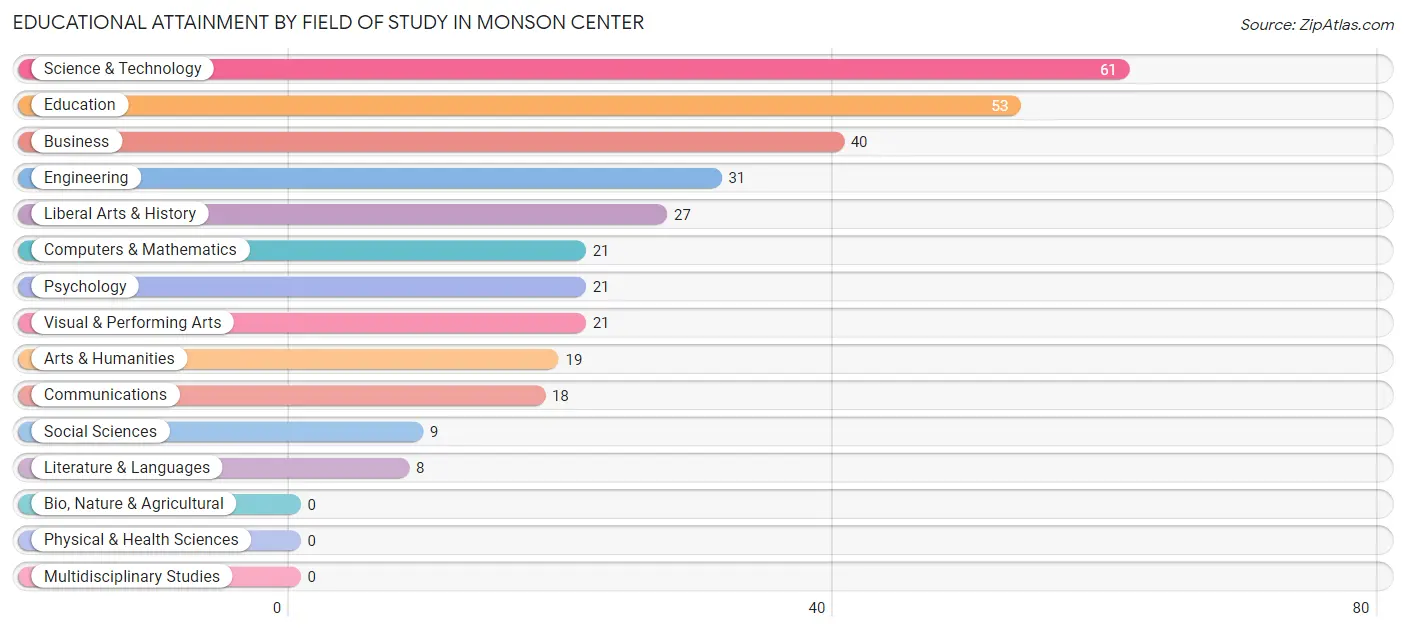
| Field of Study | # Graduates | % Graduates |
| Computers & Mathematics | 21 | 6.4% |
| Bio, Nature & Agricultural | 0 | 0.0% |
| Physical & Health Sciences | 0 | 0.0% |
| Psychology | 21 | 6.4% |
| Social Sciences | 9 | 2.7% |
| Engineering | 31 | 9.4% |
| Multidisciplinary Studies | 0 | 0.0% |
| Science & Technology | 61 | 18.5% |
| Business | 40 | 12.2% |
| Education | 53 | 16.1% |
| Literature & Languages | 8 | 2.4% |
| Liberal Arts & History | 27 | 8.2% |
| Visual & Performing Arts | 21 | 6.4% |
| Communications | 18 | 5.5% |
| Arts & Humanities | 19 | 5.8% |
| Total | 329 | 100.0% |
Transportation & Commute in Monson Center
Vehicle Availability by Sex in Monson Center
The most prevalent vehicle ownership categories in Monson Center are males with 2 vehicles (162, accounting for 45.3%) and females with 2 vehicles (206, making up 43.7%).
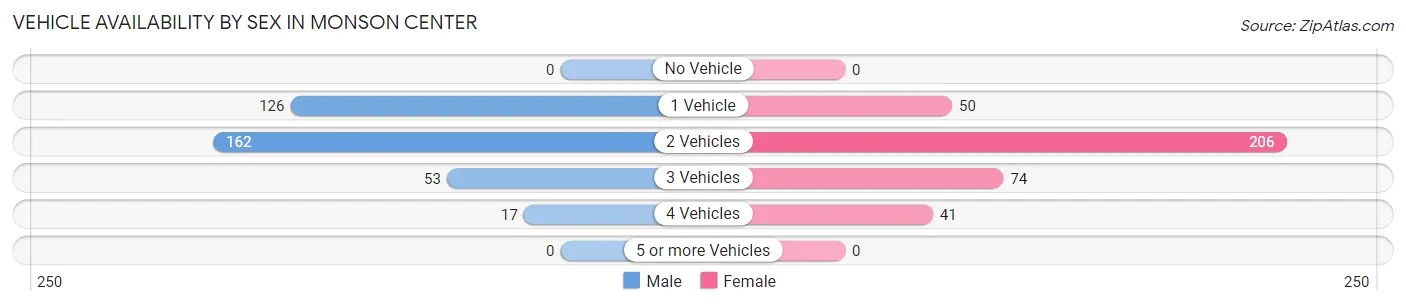
| Vehicles Available | Male | Female |
| No Vehicle | 0 (0.0%) | 0 (0.0%) |
| 1 Vehicle | 126 (35.2%) | 50 (13.5%) |
| 2 Vehicles | 162 (45.3%) | 206 (55.5%) |
| 3 Vehicles | 53 (14.8%) | 74 (20.0%) |
| 4 Vehicles | 17 (4.8%) | 41 (11.1%) |
| 5 or more Vehicles | 0 (0.0%) | 0 (0.0%) |
| Total | 358 (100.0%) | 371 (100.0%) |
Commute Time in Monson Center
The most frequently occuring commute durations in Monson Center are 5 to 9 minutes (86 commuters, 13.9%), 30 to 34 minutes (80 commuters, 13.0%), and 15 to 19 minutes (74 commuters, 12.0%).
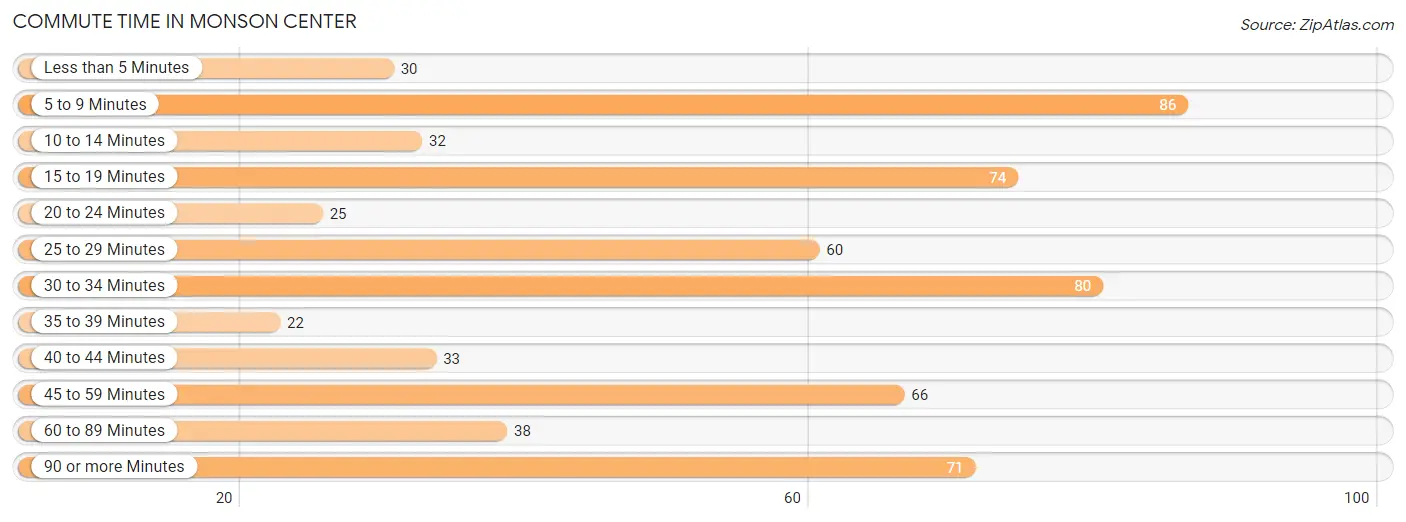
| Commute Time | # Commuters | % Commuters |
| Less than 5 Minutes | 30 | 4.9% |
| 5 to 9 Minutes | 86 | 13.9% |
| 10 to 14 Minutes | 32 | 5.2% |
| 15 to 19 Minutes | 74 | 12.0% |
| 20 to 24 Minutes | 25 | 4.1% |
| 25 to 29 Minutes | 60 | 9.7% |
| 30 to 34 Minutes | 80 | 13.0% |
| 35 to 39 Minutes | 22 | 3.6% |
| 40 to 44 Minutes | 33 | 5.3% |
| 45 to 59 Minutes | 66 | 10.7% |
| 60 to 89 Minutes | 38 | 6.2% |
| 90 or more Minutes | 71 | 11.5% |
Commute Time by Sex in Monson Center
The most common commute times in Monson Center are 15 to 19 minutes (64 commuters, 20.4%) for males and 5 to 9 minutes (59 commuters, 19.4%) for females.
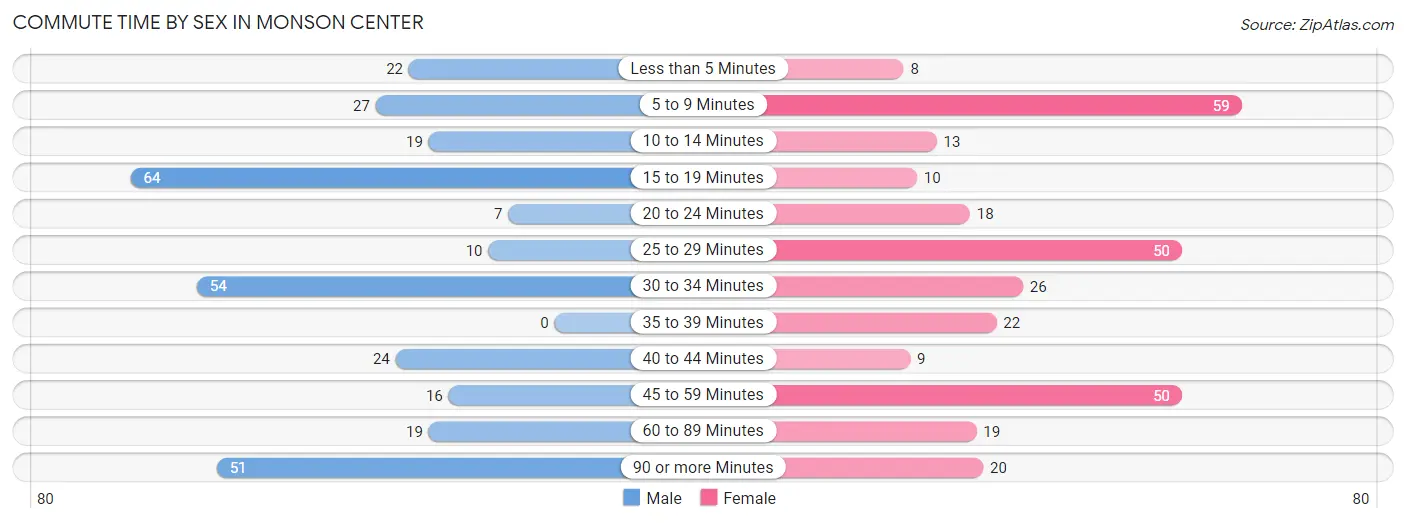
| Commute Time | Male | Female |
| Less than 5 Minutes | 22 (7.0%) | 8 (2.6%) |
| 5 to 9 Minutes | 27 (8.6%) | 59 (19.4%) |
| 10 to 14 Minutes | 19 (6.1%) | 13 (4.3%) |
| 15 to 19 Minutes | 64 (20.4%) | 10 (3.3%) |
| 20 to 24 Minutes | 7 (2.2%) | 18 (5.9%) |
| 25 to 29 Minutes | 10 (3.2%) | 50 (16.5%) |
| 30 to 34 Minutes | 54 (17.2%) | 26 (8.6%) |
| 35 to 39 Minutes | 0 (0.0%) | 22 (7.2%) |
| 40 to 44 Minutes | 24 (7.7%) | 9 (3.0%) |
| 45 to 59 Minutes | 16 (5.1%) | 50 (16.5%) |
| 60 to 89 Minutes | 19 (6.1%) | 19 (6.2%) |
| 90 or more Minutes | 51 (16.3%) | 20 (6.6%) |
Time of Departure to Work by Sex in Monson Center
The most frequent times of departure to work in Monson Center are 4:00 PM to 11:59 PM (68, 21.7%) for males and 7:30 AM to 7:59 AM (69, 22.7%) for females.
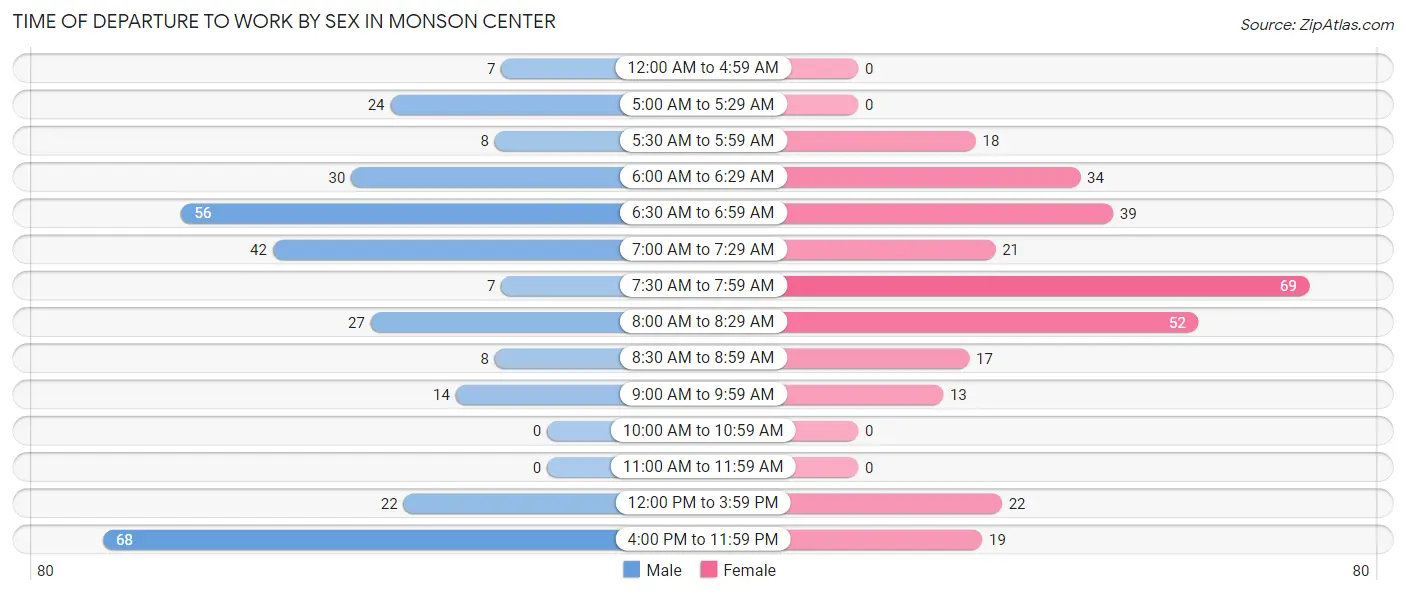
| Time of Departure | Male | Female |
| 12:00 AM to 4:59 AM | 7 (2.2%) | 0 (0.0%) |
| 5:00 AM to 5:29 AM | 24 (7.7%) | 0 (0.0%) |
| 5:30 AM to 5:59 AM | 8 (2.6%) | 18 (5.9%) |
| 6:00 AM to 6:29 AM | 30 (9.6%) | 34 (11.2%) |
| 6:30 AM to 6:59 AM | 56 (17.9%) | 39 (12.8%) |
| 7:00 AM to 7:29 AM | 42 (13.4%) | 21 (6.9%) |
| 7:30 AM to 7:59 AM | 7 (2.2%) | 69 (22.7%) |
| 8:00 AM to 8:29 AM | 27 (8.6%) | 52 (17.1%) |
| 8:30 AM to 8:59 AM | 8 (2.6%) | 17 (5.6%) |
| 9:00 AM to 9:59 AM | 14 (4.5%) | 13 (4.3%) |
| 10:00 AM to 10:59 AM | 0 (0.0%) | 0 (0.0%) |
| 11:00 AM to 11:59 AM | 0 (0.0%) | 0 (0.0%) |
| 12:00 PM to 3:59 PM | 22 (7.0%) | 22 (7.2%) |
| 4:00 PM to 11:59 PM | 68 (21.7%) | 19 (6.2%) |
| Total | 313 (100.0%) | 304 (100.0%) |
Housing Occupancy in Monson Center
Occupancy by Ownership in Monson Center
Of the total 827 dwellings in Monson Center, owner-occupied units account for 512 (61.9%), while renter-occupied units make up 315 (38.1%).
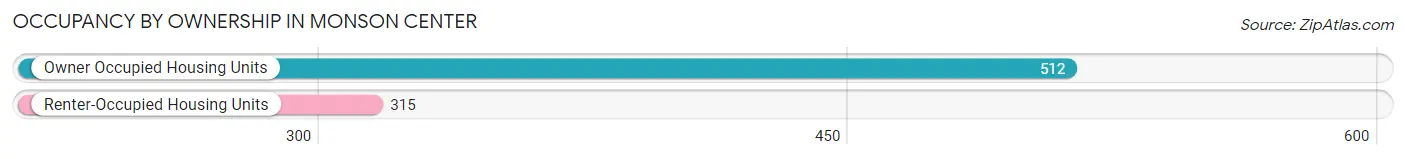
| Occupancy | # Housing Units | % Housing Units |
| Owner Occupied Housing Units | 512 | 61.9% |
| Renter-Occupied Housing Units | 315 | 38.1% |
| Total Occupied Housing Units | 827 | 100.0% |
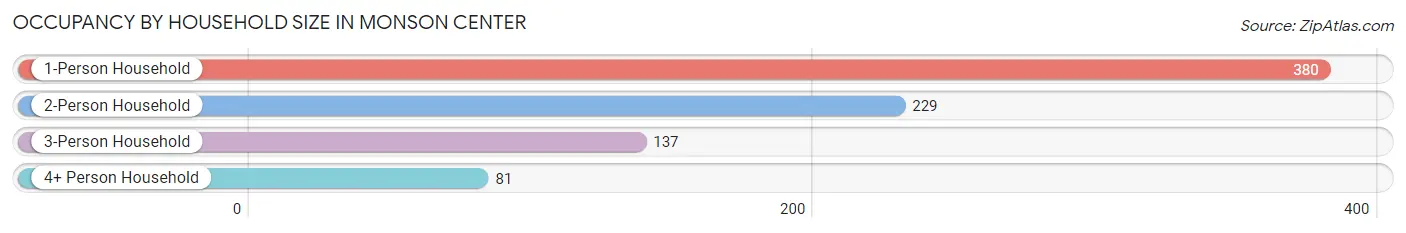
Occupancy by Household Size in Monson Center
| Household Size | # Housing Units | % Housing Units |
| 1-Person Household | 380 | 46.0% |
| 2-Person Household | 229 | 27.7% |
| 3-Person Household | 137 | 16.6% |
| 4+ Person Household | 81 | 9.8% |
| Total Housing Units | 827 | 100.0% |
Occupancy by Ownership by Household Size in Monson Center
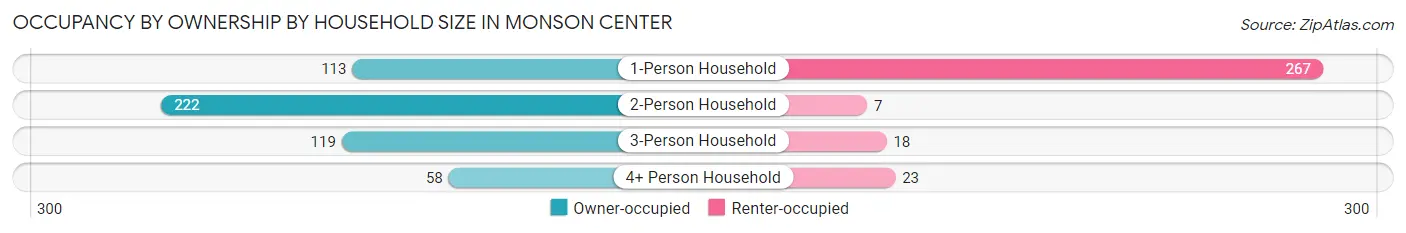
| Household Size | Owner-occupied | Renter-occupied |
| 1-Person Household | 113 (29.7%) | 267 (70.3%) |
| 2-Person Household | 222 (96.9%) | 7 (3.1%) |
| 3-Person Household | 119 (86.9%) | 18 (13.1%) |
| 4+ Person Household | 58 (71.6%) | 23 (28.4%) |
| Total Housing Units | 512 (61.9%) | 315 (38.1%) |
Occupancy by Educational Attainment in Monson Center
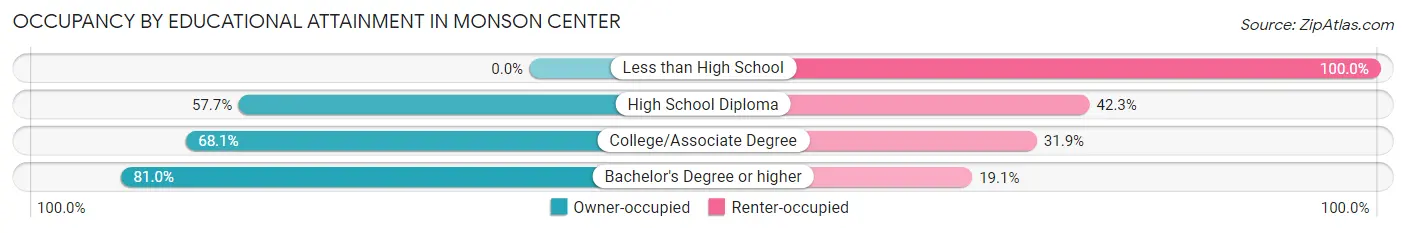
| Household Size | Owner-occupied | Renter-occupied |
| Less than High School | 0 (0.0%) | 78 (100.0%) |
| High School Diploma | 154 (57.7%) | 113 (42.3%) |
| College/Associate Degree | 171 (68.1%) | 80 (31.9%) |
| Bachelor's Degree or higher | 187 (80.9%) | 44 (19.1%) |
Occupancy by Age of Householder in Monson Center
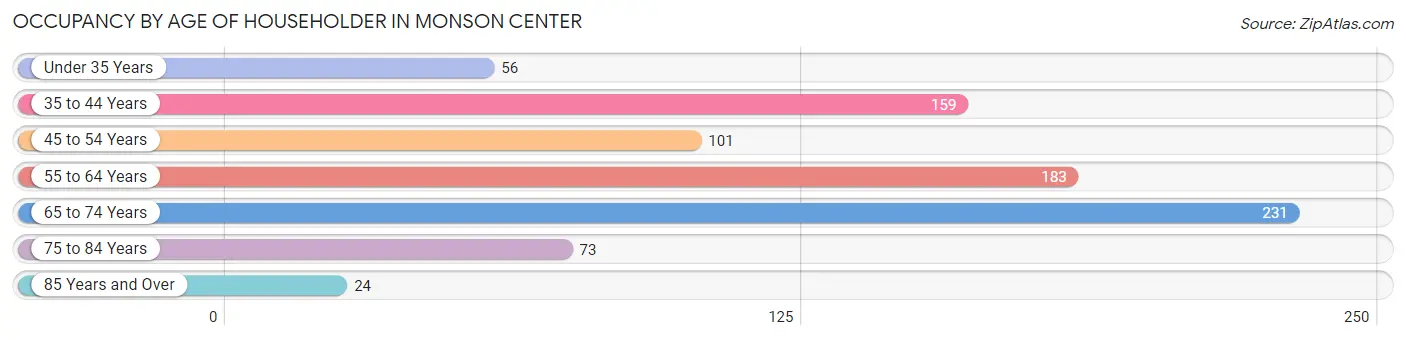
| Age Bracket | # Households | % Households |
| Under 35 Years | 56 | 6.8% |
| 35 to 44 Years | 159 | 19.2% |
| 45 to 54 Years | 101 | 12.2% |
| 55 to 64 Years | 183 | 22.1% |
| 65 to 74 Years | 231 | 27.9% |
| 75 to 84 Years | 73 | 8.8% |
| 85 Years and Over | 24 | 2.9% |
| Total | 827 | 100.0% |
Housing Finances in Monson Center
Median Income by Occupancy in Monson Center
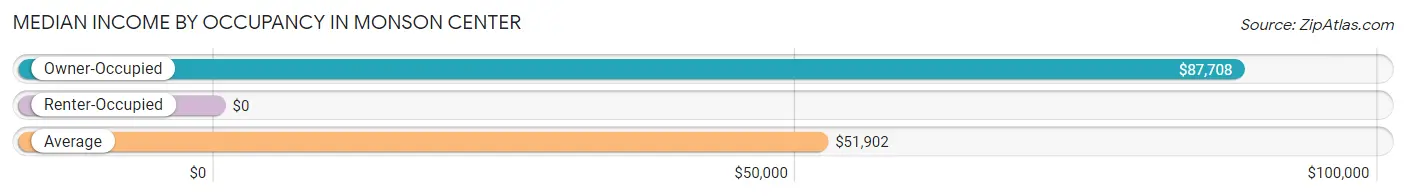
| Occupancy Type | # Households | Median Income |
| Owner-Occupied | 512 (61.9%) | $87,708 |
| Renter-Occupied | 315 (38.1%) | $0 |
| Average | 827 (100.0%) | $51,902 |
Occupancy by Householder Income Bracket in Monson Center
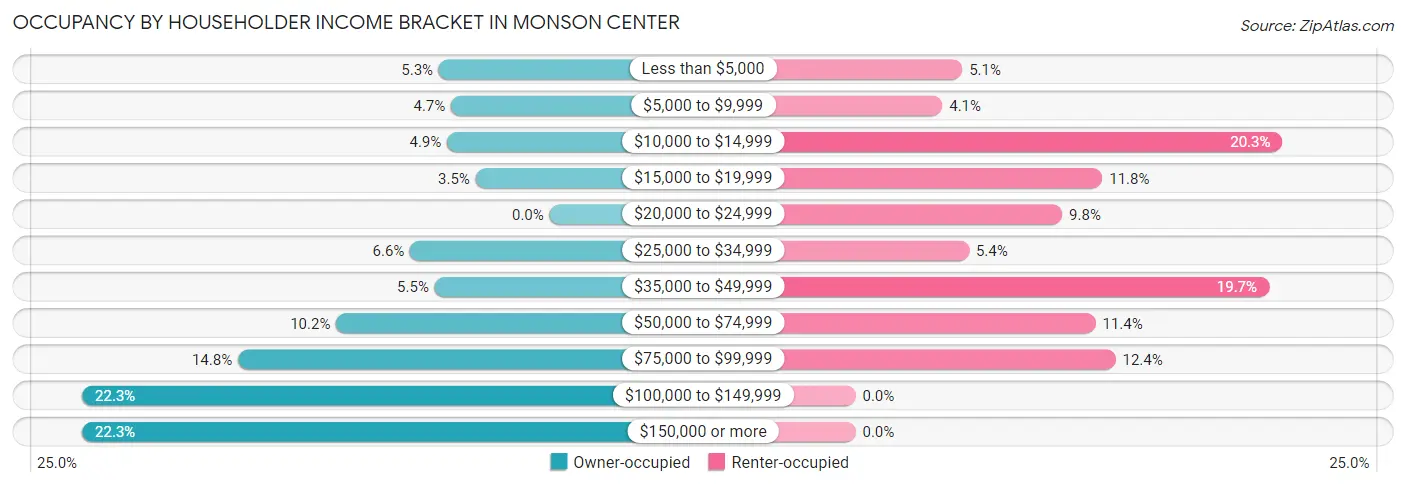
| Income Bracket | Owner-occupied | Renter-occupied |
| Less than $5,000 | 27 (5.3%) | 16 (5.1%) |
| $5,000 to $9,999 | 24 (4.7%) | 13 (4.1%) |
| $10,000 to $14,999 | 25 (4.9%) | 64 (20.3%) |
| $15,000 to $19,999 | 18 (3.5%) | 37 (11.7%) |
| $20,000 to $24,999 | 0 (0.0%) | 31 (9.8%) |
| $25,000 to $34,999 | 34 (6.6%) | 17 (5.4%) |
| $35,000 to $49,999 | 28 (5.5%) | 62 (19.7%) |
| $50,000 to $74,999 | 52 (10.2%) | 36 (11.4%) |
| $75,000 to $99,999 | 76 (14.8%) | 39 (12.4%) |
| $100,000 to $149,999 | 114 (22.3%) | 0 (0.0%) |
| $150,000 or more | 114 (22.3%) | 0 (0.0%) |
| Total | 512 (100.0%) | 315 (100.0%) |
Monthly Housing Cost Tiers in Monson Center
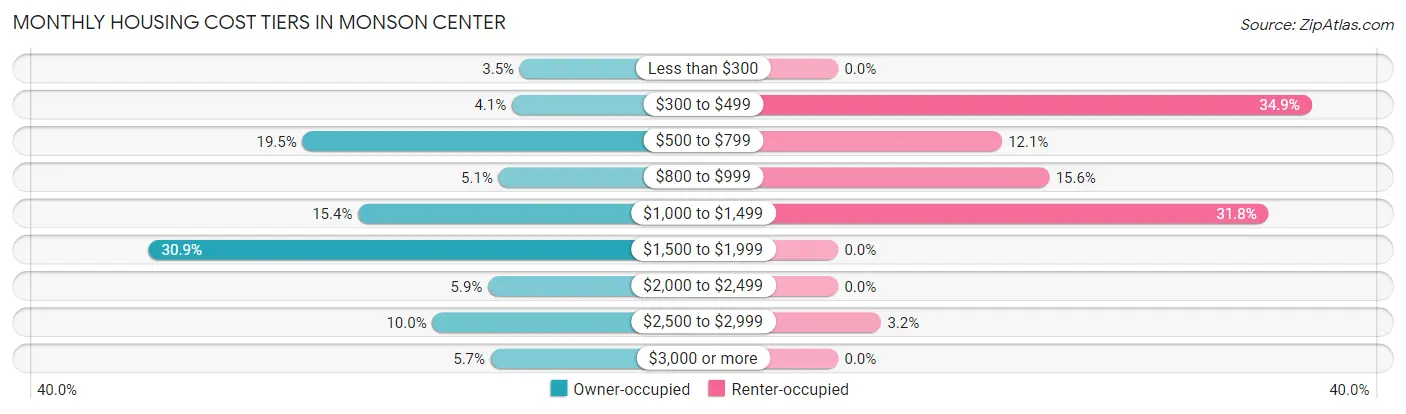
| Monthly Cost | Owner-occupied | Renter-occupied |
| Less than $300 | 18 (3.5%) | 0 (0.0%) |
| $300 to $499 | 21 (4.1%) | 110 (34.9%) |
| $500 to $799 | 100 (19.5%) | 38 (12.1%) |
| $800 to $999 | 26 (5.1%) | 49 (15.6%) |
| $1,000 to $1,499 | 79 (15.4%) | 100 (31.8%) |
| $1,500 to $1,999 | 158 (30.9%) | 0 (0.0%) |
| $2,000 to $2,499 | 30 (5.9%) | 0 (0.0%) |
| $2,500 to $2,999 | 51 (10.0%) | 10 (3.2%) |
| $3,000 or more | 29 (5.7%) | 0 (0.0%) |
| Total | 512 (100.0%) | 315 (100.0%) |
Physical Housing Characteristics in Monson Center
Housing Structures in Monson Center
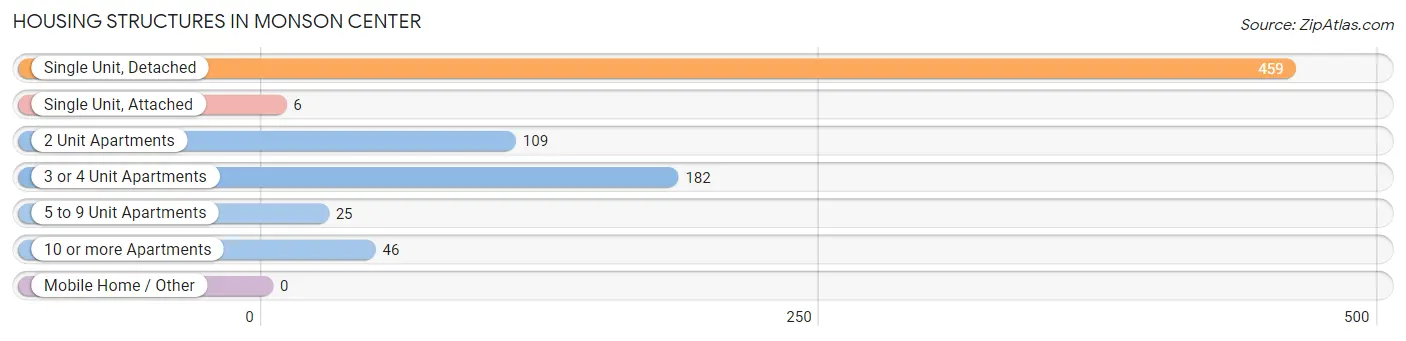
| Structure Type | # Housing Units | % Housing Units |
| Single Unit, Detached | 459 | 55.5% |
| Single Unit, Attached | 6 | 0.7% |
| 2 Unit Apartments | 109 | 13.2% |
| 3 or 4 Unit Apartments | 182 | 22.0% |
| 5 to 9 Unit Apartments | 25 | 3.0% |
| 10 or more Apartments | 46 | 5.6% |
| Mobile Home / Other | 0 | 0.0% |
| Total | 827 | 100.0% |
Housing Structures by Occupancy in Monson Center
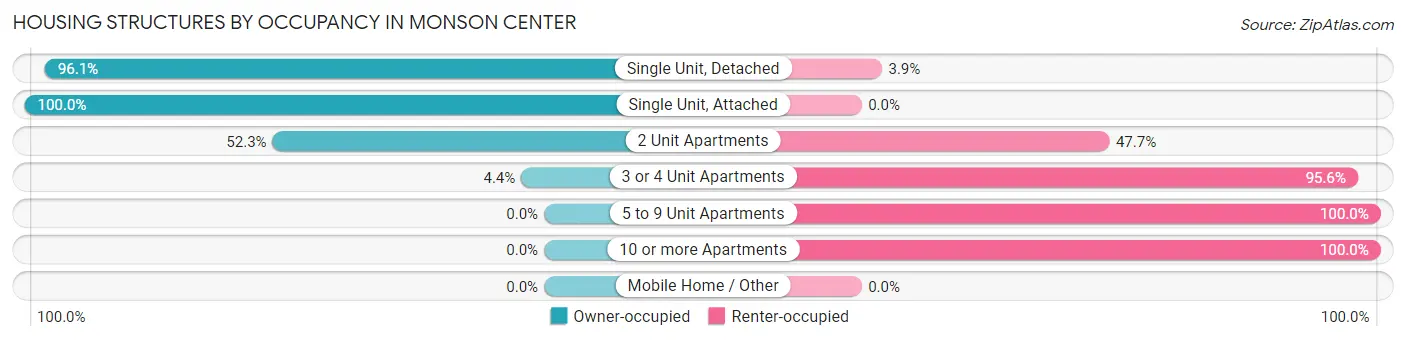
| Structure Type | Owner-occupied | Renter-occupied |
| Single Unit, Detached | 441 (96.1%) | 18 (3.9%) |
| Single Unit, Attached | 6 (100.0%) | 0 (0.0%) |
| 2 Unit Apartments | 57 (52.3%) | 52 (47.7%) |
| 3 or 4 Unit Apartments | 8 (4.4%) | 174 (95.6%) |
| 5 to 9 Unit Apartments | 0 (0.0%) | 25 (100.0%) |
| 10 or more Apartments | 0 (0.0%) | 46 (100.0%) |
| Mobile Home / Other | 0 (0.0%) | 0 (0.0%) |
| Total | 512 (61.9%) | 315 (38.1%) |
Housing Structures by Number of Rooms in Monson Center
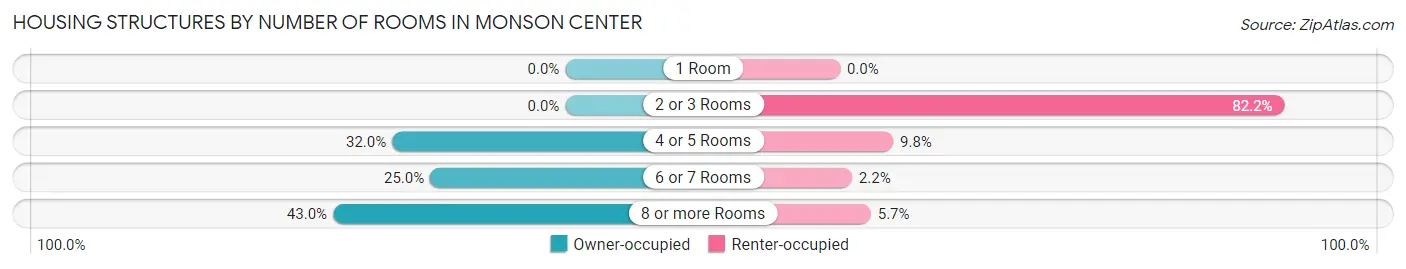
| Number of Rooms | Owner-occupied | Renter-occupied |
| 1 Room | 0 (0.0%) | 0 (0.0%) |
| 2 or 3 Rooms | 0 (0.0%) | 259 (82.2%) |
| 4 or 5 Rooms | 164 (32.0%) | 31 (9.8%) |
| 6 or 7 Rooms | 128 (25.0%) | 7 (2.2%) |
| 8 or more Rooms | 220 (43.0%) | 18 (5.7%) |
| Total | 512 (100.0%) | 315 (100.0%) |
Housing Structure by Heating Type in Monson Center
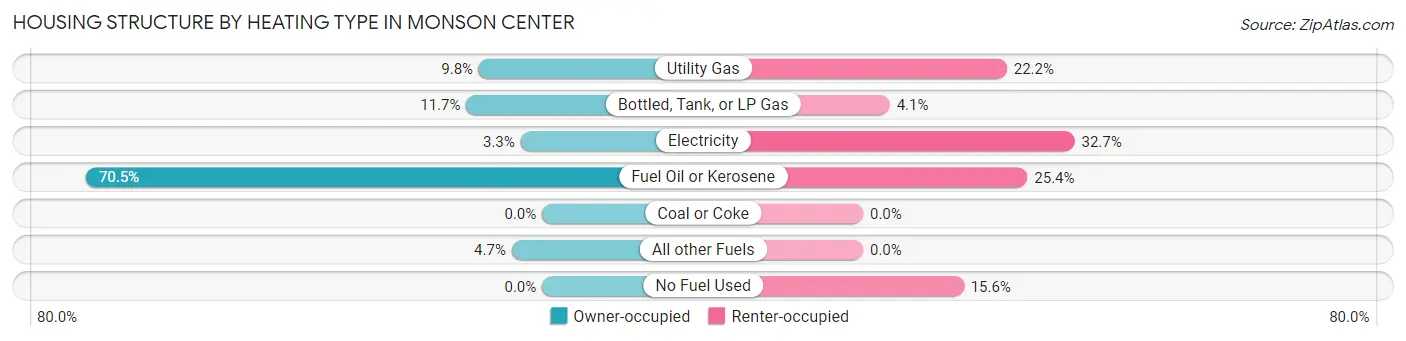
| Heating Type | Owner-occupied | Renter-occupied |
| Utility Gas | 50 (9.8%) | 70 (22.2%) |
| Bottled, Tank, or LP Gas | 60 (11.7%) | 13 (4.1%) |
| Electricity | 17 (3.3%) | 103 (32.7%) |
| Fuel Oil or Kerosene | 361 (70.5%) | 80 (25.4%) |
| Coal or Coke | 0 (0.0%) | 0 (0.0%) |
| All other Fuels | 24 (4.7%) | 0 (0.0%) |
| No Fuel Used | 0 (0.0%) | 49 (15.6%) |
| Total | 512 (100.0%) | 315 (100.0%) |
Household Vehicle Usage in Monson Center
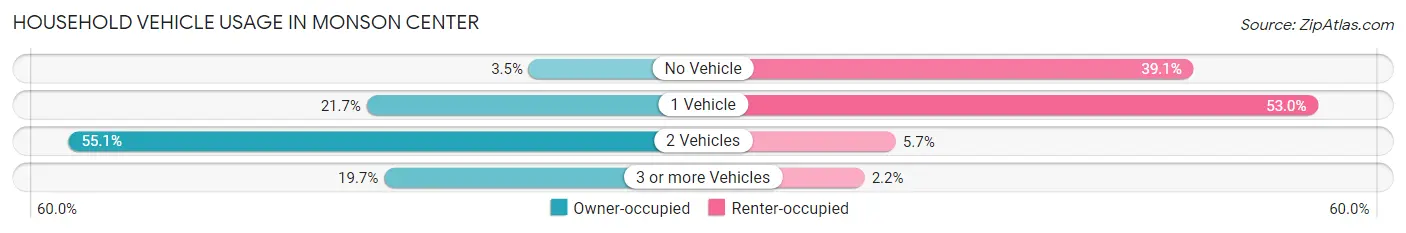
| Vehicles per Household | Owner-occupied | Renter-occupied |
| No Vehicle | 18 (3.5%) | 123 (39.1%) |
| 1 Vehicle | 111 (21.7%) | 167 (53.0%) |
| 2 Vehicles | 282 (55.1%) | 18 (5.7%) |
| 3 or more Vehicles | 101 (19.7%) | 7 (2.2%) |
| Total | 512 (100.0%) | 315 (100.0%) |
Real Estate & Mortgages in Monson Center
Real Estate and Mortgage Overview in Monson Center
| Characteristic | Without Mortgage | With Mortgage |
| Housing Units | 192 | 320 |
| Median Property Value | $227,300 | $271,700 |
| Median Household Income | $78,625 | $96 |
| Monthly Housing Costs | $673 | $29 |
| Real Estate Taxes | $4,217 | $11 |
Property Value by Mortgage Status in Monson Center
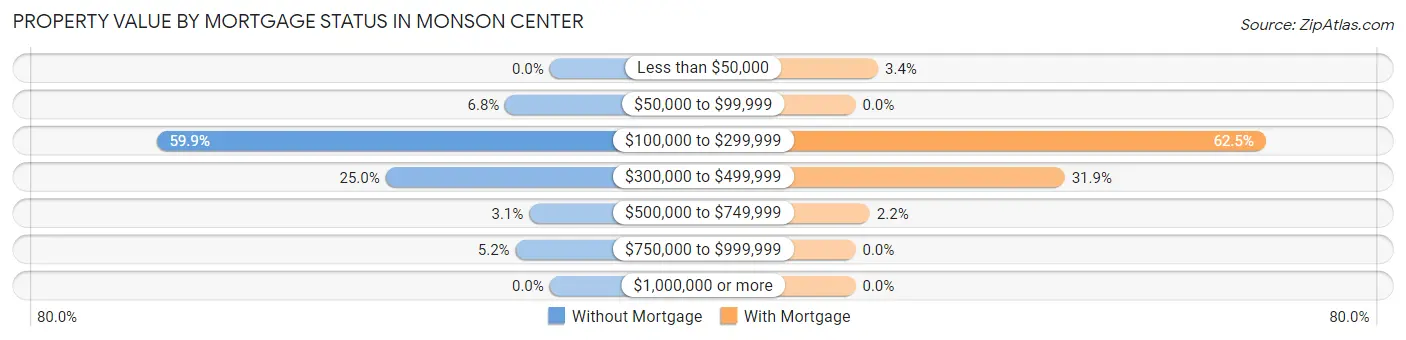
| Property Value | Without Mortgage | With Mortgage |
| Less than $50,000 | 0 (0.0%) | 11 (3.4%) |
| $50,000 to $99,999 | 13 (6.8%) | 0 (0.0%) |
| $100,000 to $299,999 | 115 (59.9%) | 200 (62.5%) |
| $300,000 to $499,999 | 48 (25.0%) | 102 (31.9%) |
| $500,000 to $749,999 | 6 (3.1%) | 7 (2.2%) |
| $750,000 to $999,999 | 10 (5.2%) | 0 (0.0%) |
| $1,000,000 or more | 0 (0.0%) | 0 (0.0%) |
| Total | 192 (100.0%) | 320 (100.0%) |
Household Income by Mortgage Status in Monson Center
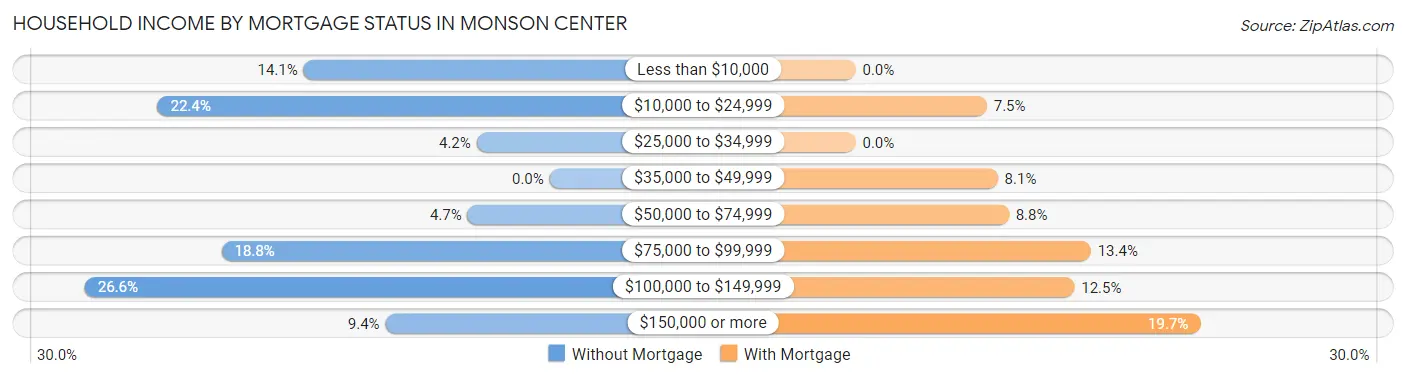
| Household Income | Without Mortgage | With Mortgage |
| Less than $10,000 | 27 (14.1%) | 0 (0.0%) |
| $10,000 to $24,999 | 43 (22.4%) | 24 (7.5%) |
| $25,000 to $34,999 | 8 (4.2%) | 0 (0.0%) |
| $35,000 to $49,999 | 0 (0.0%) | 26 (8.1%) |
| $50,000 to $74,999 | 9 (4.7%) | 28 (8.7%) |
| $75,000 to $99,999 | 36 (18.8%) | 43 (13.4%) |
| $100,000 to $149,999 | 51 (26.6%) | 40 (12.5%) |
| $150,000 or more | 18 (9.4%) | 63 (19.7%) |
| Total | 192 (100.0%) | 320 (100.0%) |
Property Value to Household Income Ratio in Monson Center
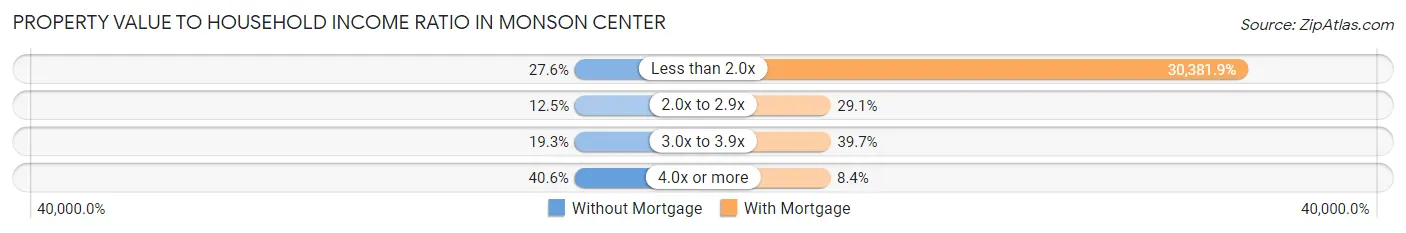
| Value-to-Income Ratio | Without Mortgage | With Mortgage |
| Less than 2.0x | 53 (27.6%) | 97,222 (30,381.9%) |
| 2.0x to 2.9x | 24 (12.5%) | 93 (29.1%) |
| 3.0x to 3.9x | 37 (19.3%) | 127 (39.7%) |
| 4.0x or more | 78 (40.6%) | 27 (8.4%) |
| Total | 192 (100.0%) | 320 (100.0%) |
Real Estate Taxes by Mortgage Status in Monson Center
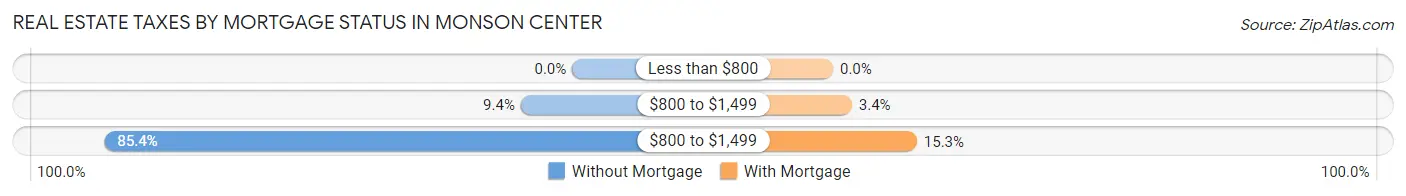
| Property Taxes | Without Mortgage | With Mortgage |
| Less than $800 | 0 (0.0%) | 0 (0.0%) |
| $800 to $1,499 | 18 (9.4%) | 11 (3.4%) |
| $800 to $1,499 | 164 (85.4%) | 49 (15.3%) |
| Total | 192 (100.0%) | 320 (100.0%) |
Health & Disability in Monson Center
Health Insurance Coverage by Age in Monson Center
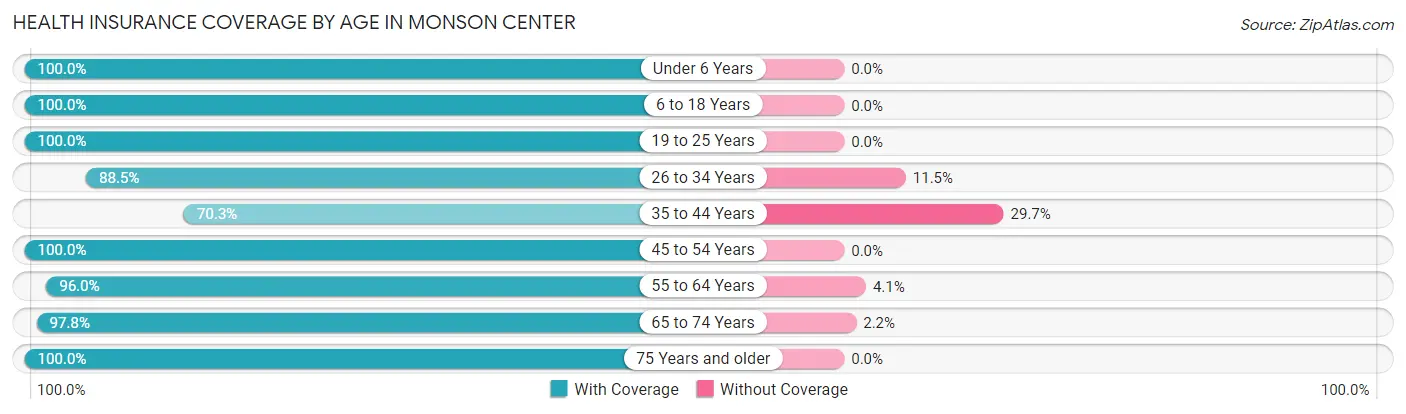
| Age Bracket | With Coverage | Without Coverage |
| Under 6 Years | 80 (100.0%) | 0 (0.0%) |
| 6 to 18 Years | 204 (100.0%) | 0 (0.0%) |
| 19 to 25 Years | 80 (100.0%) | 0 (0.0%) |
| 26 to 34 Years | 108 (88.5%) | 14 (11.5%) |
| 35 to 44 Years | 194 (70.3%) | 82 (29.7%) |
| 45 to 54 Years | 151 (100.0%) | 0 (0.0%) |
| 55 to 64 Years | 308 (96.0%) | 13 (4.1%) |
| 65 to 74 Years | 307 (97.8%) | 7 (2.2%) |
| 75 Years and older | 125 (100.0%) | 0 (0.0%) |
| Total | 1,557 (93.1%) | 116 (6.9%) |
Health Insurance Coverage by Citizenship Status in Monson Center
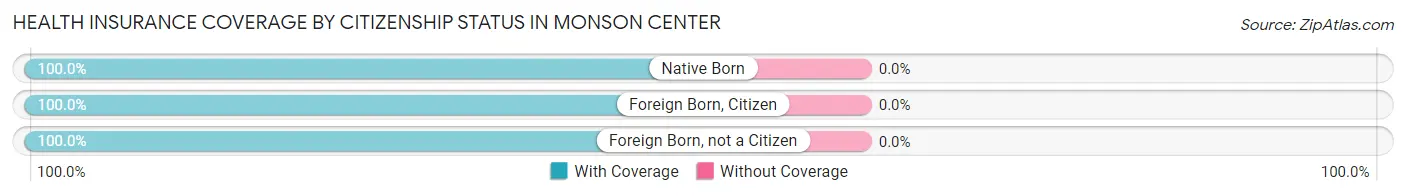
| Citizenship Status | With Coverage | Without Coverage |
| Native Born | 80 (100.0%) | 0 (0.0%) |
| Foreign Born, Citizen | 204 (100.0%) | 0 (0.0%) |
| Foreign Born, not a Citizen | 80 (100.0%) | 0 (0.0%) |
Health Insurance Coverage by Household Income in Monson Center
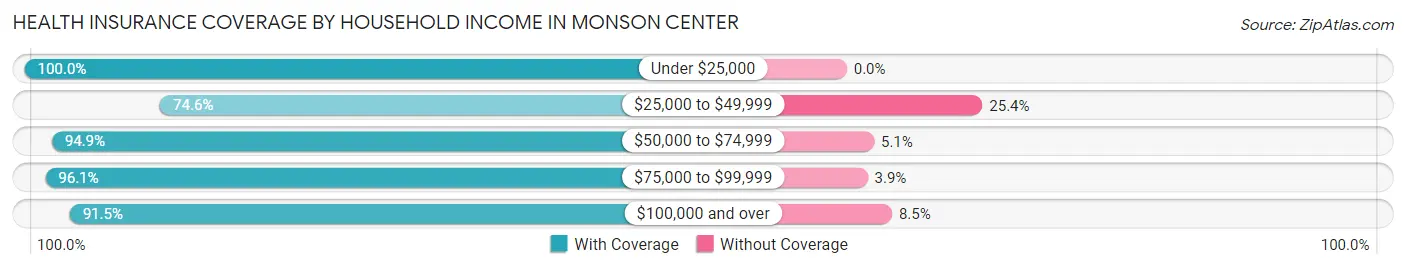
| Household Income | With Coverage | Without Coverage |
| Under $25,000 | 480 (100.0%) | 0 (0.0%) |
| $25,000 to $49,999 | 141 (74.6%) | 48 (25.4%) |
| $50,000 to $74,999 | 149 (94.9%) | 8 (5.1%) |
| $75,000 to $99,999 | 222 (96.1%) | 9 (3.9%) |
| $100,000 and over | 552 (91.5%) | 51 (8.5%) |
Public vs Private Health Insurance Coverage by Age in Monson Center
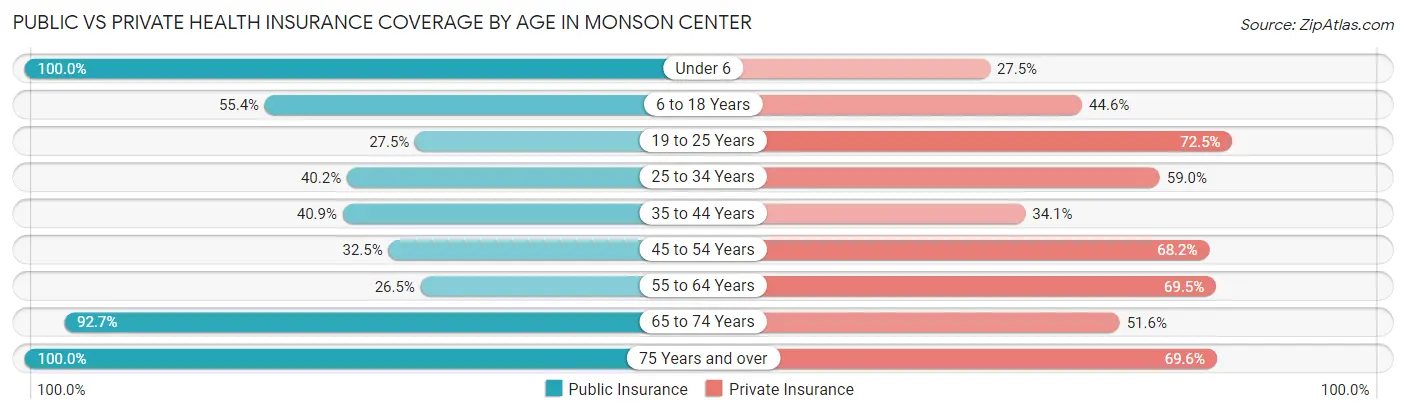
| Age Bracket | Public Insurance | Private Insurance |
| Under 6 | 80 (100.0%) | 22 (27.5%) |
| 6 to 18 Years | 113 (55.4%) | 91 (44.6%) |
| 19 to 25 Years | 22 (27.5%) | 58 (72.5%) |
| 25 to 34 Years | 49 (40.2%) | 72 (59.0%) |
| 35 to 44 Years | 113 (40.9%) | 94 (34.1%) |
| 45 to 54 Years | 49 (32.5%) | 103 (68.2%) |
| 55 to 64 Years | 85 (26.5%) | 223 (69.5%) |
| 65 to 74 Years | 291 (92.7%) | 162 (51.6%) |
| 75 Years and over | 125 (100.0%) | 87 (69.6%) |
| Total | 927 (55.4%) | 912 (54.5%) |
Disability Status by Sex by Age in Monson Center
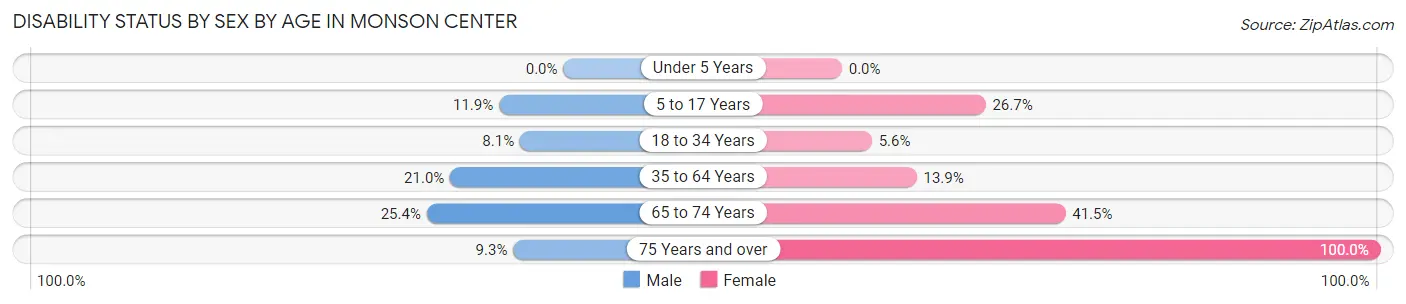
| Age Bracket | Male | Female |
| Under 5 Years | 0 (0.0%) | 0 (0.0%) |
| 5 to 17 Years | 8 (11.9%) | 24 (26.7%) |
| 18 to 34 Years | 7 (8.1%) | 9 (5.6%) |
| 35 to 64 Years | 83 (21.0%) | 49 (13.9%) |
| 65 to 74 Years | 35 (25.4%) | 73 (41.5%) |
| 75 Years and over | 8 (9.3%) | 39 (100.0%) |
Disability Class by Sex by Age in Monson Center
Disability Class: Hearing Difficulty
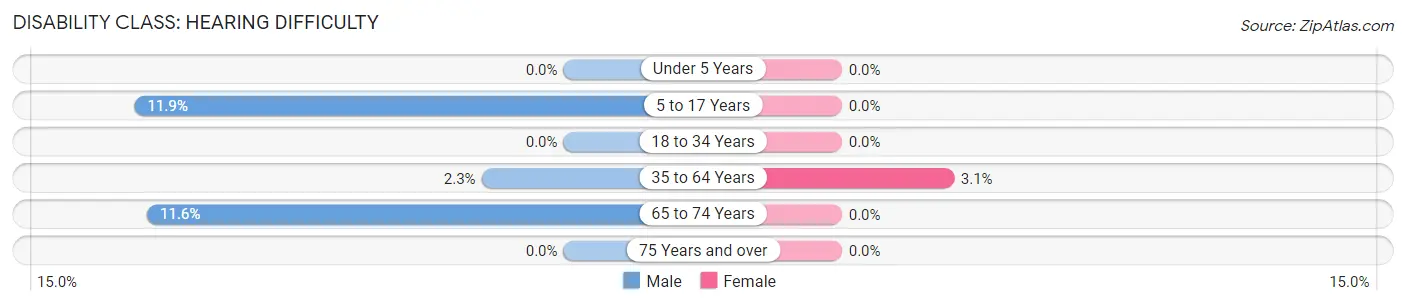
| Age Bracket | Male | Female |
| Under 5 Years | 0 (0.0%) | 0 (0.0%) |
| 5 to 17 Years | 8 (11.9%) | 0 (0.0%) |
| 18 to 34 Years | 0 (0.0%) | 0 (0.0%) |
| 35 to 64 Years | 9 (2.3%) | 11 (3.1%) |
| 65 to 74 Years | 16 (11.6%) | 0 (0.0%) |
| 75 Years and over | 0 (0.0%) | 0 (0.0%) |
Disability Class: Vision Difficulty
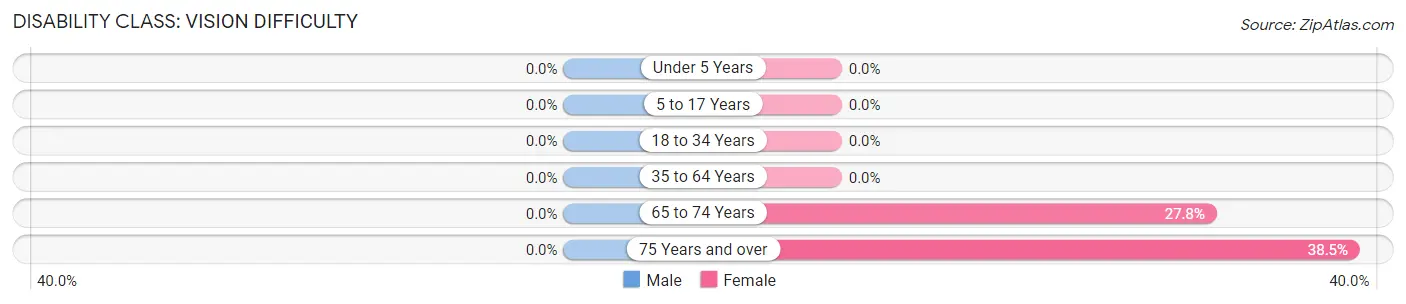
| Age Bracket | Male | Female |
| Under 5 Years | 0 (0.0%) | 0 (0.0%) |
| 5 to 17 Years | 0 (0.0%) | 0 (0.0%) |
| 18 to 34 Years | 0 (0.0%) | 0 (0.0%) |
| 35 to 64 Years | 0 (0.0%) | 0 (0.0%) |
| 65 to 74 Years | 0 (0.0%) | 49 (27.8%) |
| 75 Years and over | 0 (0.0%) | 15 (38.5%) |
Disability Class: Cognitive Difficulty
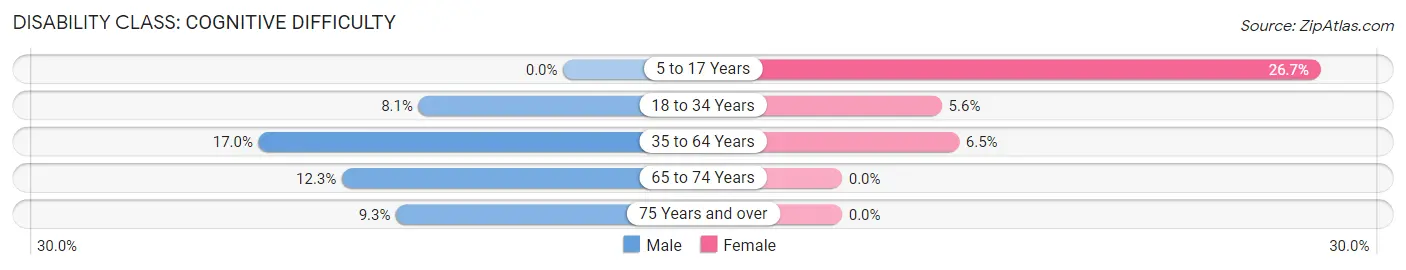
| Age Bracket | Male | Female |
| 5 to 17 Years | 0 (0.0%) | 24 (26.7%) |
| 18 to 34 Years | 7 (8.1%) | 9 (5.6%) |
| 35 to 64 Years | 67 (17.0%) | 23 (6.5%) |
| 65 to 74 Years | 17 (12.3%) | 0 (0.0%) |
| 75 Years and over | 8 (9.3%) | 0 (0.0%) |
Disability Class: Ambulatory Difficulty
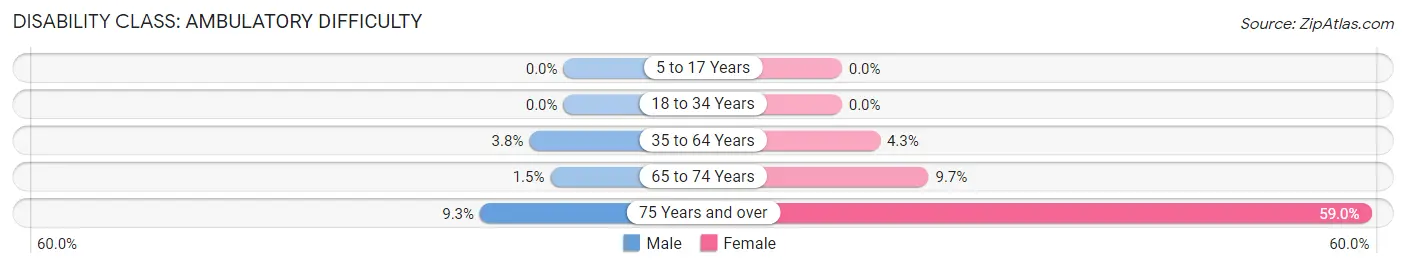
| Age Bracket | Male | Female |
| 5 to 17 Years | 0 (0.0%) | 0 (0.0%) |
| 18 to 34 Years | 0 (0.0%) | 0 (0.0%) |
| 35 to 64 Years | 15 (3.8%) | 15 (4.3%) |
| 65 to 74 Years | 2 (1.5%) | 17 (9.7%) |
| 75 Years and over | 8 (9.3%) | 23 (59.0%) |
Disability Class: Self-Care Difficulty
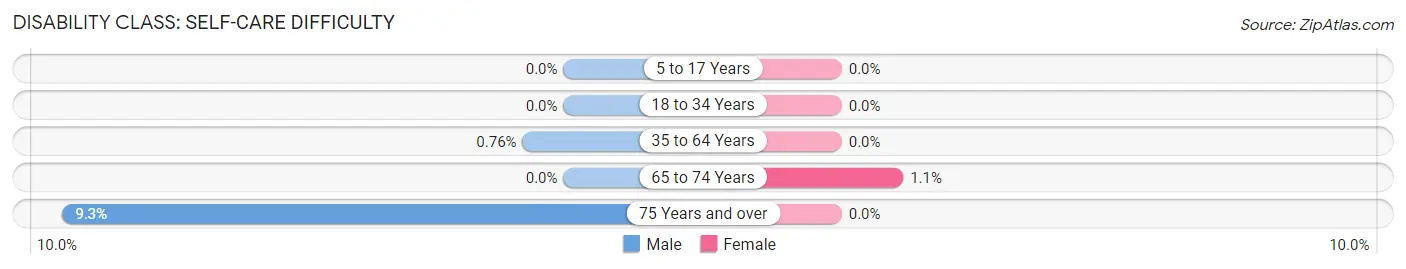
| Age Bracket | Male | Female |
| 5 to 17 Years | 0 (0.0%) | 0 (0.0%) |
| 18 to 34 Years | 0 (0.0%) | 0 (0.0%) |
| 35 to 64 Years | 3 (0.8%) | 0 (0.0%) |
| 65 to 74 Years | 0 (0.0%) | 2 (1.1%) |
| 75 Years and over | 8 (9.3%) | 0 (0.0%) |
Technology Access in Monson Center
Computing Device Access in Monson Center
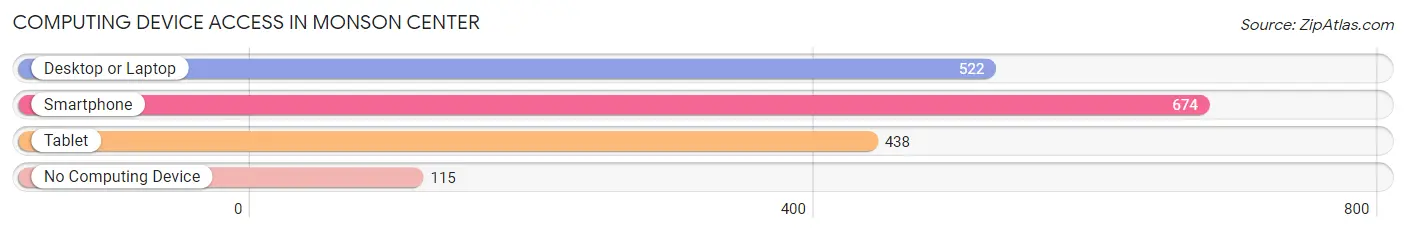
| Device Type | # Households | % Households |
| Desktop or Laptop | 522 | 63.1% |
| Smartphone | 674 | 81.5% |
| Tablet | 438 | 53.0% |
| No Computing Device | 115 | 13.9% |
| Total | 827 | 100.0% |
Internet Access in Monson Center
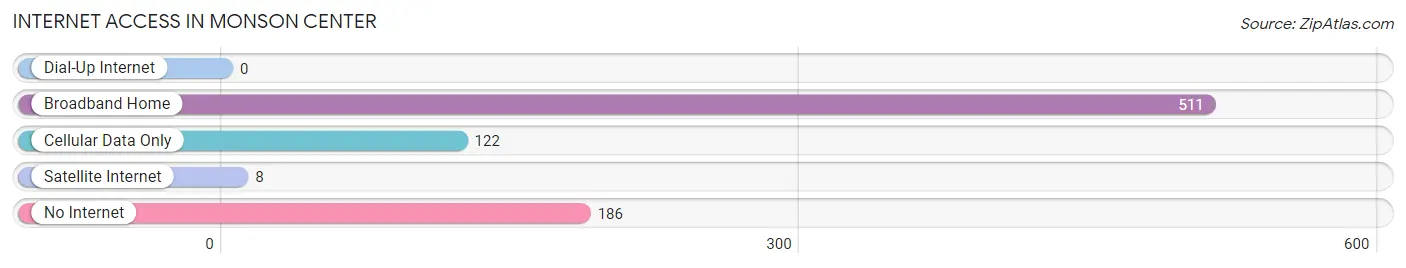
| Internet Type | # Households | % Households |
| Dial-Up Internet | 0 | 0.0% |
| Broadband Home | 511 | 61.8% |
| Cellular Data Only | 122 | 14.7% |
| Satellite Internet | 8 | 1.0% |
| No Internet | 186 | 22.5% |
| Total | 827 | 100.0% |
Monson Center Summary
Monson Center is a small town located in Hampden County, Massachusetts. It is situated in the Pioneer Valley region of the state, and is bordered by the towns of Wilbraham, Hampden, and Palmer. The town has a population of approximately 5,000 people, and is known for its rural charm and small-town atmosphere.
History
Monson Center was first settled in 1715 by a group of settlers from Connecticut. The town was originally known as “Monson”, after the first settler, John Monson. The town was officially incorporated in 1775, and was named “Monson Center” to distinguish it from the nearby town of Monson.
In the 19th century, Monson Center was a thriving agricultural community. The town was home to several mills, including a grist mill, a saw mill, and a paper mill. The town also had a thriving dairy industry, and was known for its cheese production.
In the late 19th century, the town began to experience a decline in its agricultural industry. This decline was due to the introduction of new technologies, such as the railroad, which allowed for the transportation of goods to larger cities. As a result, many of the town’s mills and factories closed, and the town’s population began to decline.
In the 20th century, Monson Center began to experience a resurgence in its economy. The town was home to several manufacturing companies, including a shoe factory and a paper mill. The town also experienced a growth in its tourism industry, as it became a popular destination for outdoor recreation.
Geography
Monson Center is located in Hampden County, Massachusetts. The town is situated in the Pioneer Valley region of the state, and is bordered by the towns of Wilbraham, Hampden, and Palmer. The town is located approximately 25 miles north of Springfield, and is situated on the banks of the Quaboag River.
The town has a total area of 8.3 square miles, of which 8.2 square miles is land and 0.1 square miles is water. The town is located in a hilly region, and is home to several small lakes and ponds. The highest point in the town is located at an elevation of 1,068 feet.
Economy
Monson Center’s economy is largely based on tourism and manufacturing. The town is home to several manufacturing companies, including a shoe factory and a paper mill. The town also has a thriving tourism industry, as it is a popular destination for outdoor recreation.
The town is also home to several small businesses, including restaurants, retail stores, and service providers. The town is also home to several educational institutions, including Monson Center High School and Monson Center Community College.
Demographics
As of the 2010 census, the town had a population of 5,000 people. The racial makeup of the town was 95.2% White, 1.2% African American, 0.4% Native American, 0.8% Asian, 0.2% from other races, and 2.4% from two or more races. Hispanic or Latino of any race were 1.2% of the population.
The median income for a household in the town was $50,000, and the median income for a family was $60,000. The per capita income for the town was $25,000. About 8.2% of families and 10.2% of the population were below the poverty line, including 14.2% of those under age 18 and 5.2% of those age 65 or over.
Common Questions
What is Per Capita Income in Monson Center?
Per Capita income in Monson Center is $37,370.
What is the Median Family Income in Monson Center?
Median Family Income in Monson Center is $89,792.
What is the Median Household income in Monson Center?
Median Household Income in Monson Center is $51,902.
What is Income or Wage Gap in Monson Center?
Income or Wage Gap in Monson Center is 19.6%.
Women in Monson Center earn 80.4 cents for every dollar earned by a man.
What is Inequality or Gini Index in Monson Center?
Inequality or Gini Index in Monson Center is 0.49.
What is the Total Population of Monson Center?
Total Population of Monson Center is 1,673.
What is the Total Male Population of Monson Center?
Total Male Population of Monson Center is 840.
What is the Total Female Population of Monson Center?
Total Female Population of Monson Center is 833.
What is the Ratio of Males per 100 Females in Monson Center?
There are 100.84 Males per 100 Females in Monson Center.
What is the Ratio of Females per 100 Males in Monson Center?
There are 99.17 Females per 100 Males in Monson Center.
What is the Median Population Age in Monson Center?
Median Population Age in Monson Center is 51.4 Years.
What is the Average Family Size in Monson Center
Average Family Size in Monson Center is 2.8 People.
What is the Average Household Size in Monson Center
Average Household Size in Monson Center is 2.0 People.
How Large is the Labor Force in Monson Center?
There are 877 People in the Labor Forcein in Monson Center.
What is the Percentage of People in the Labor Force in Monson Center?
60.6% of People are in the Labor Force in Monson Center.
What is the Unemployment Rate in Monson Center?
Unemployment Rate in Monson Center is 16.6%.