Cities with the Largest Scotch-Irish Community in Massachusetts
RELATED REPORTS & OPTIONS
Scotch-Irish
Massachusetts
Compare Cities
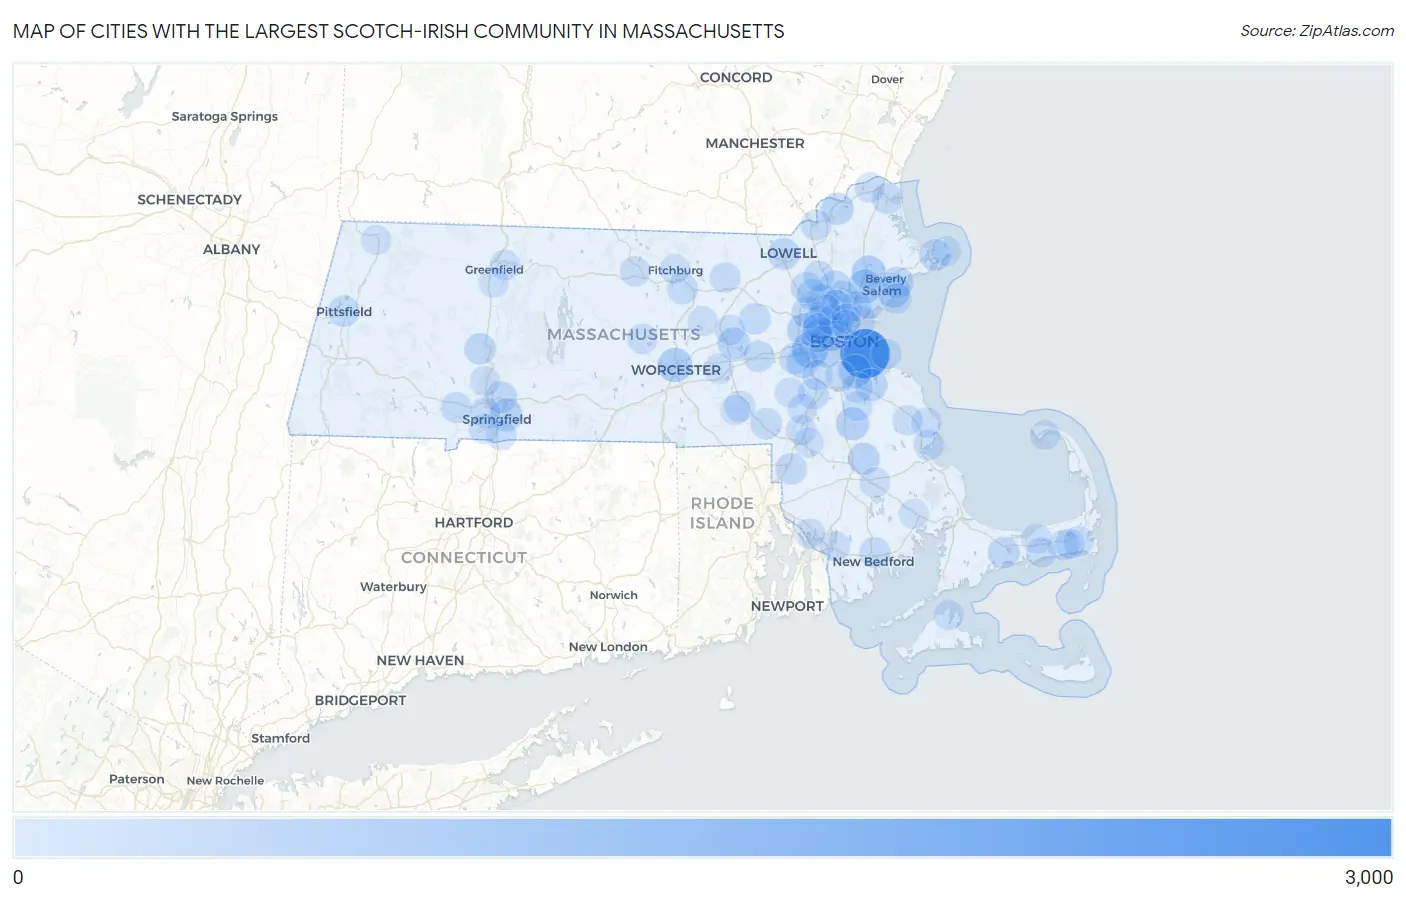
Map of Cities with the Largest Scotch-Irish Community in Massachusetts
0
3,000
Cities with the Largest Scotch-Irish Community in Massachusetts
| City | Scotch-Irish | vs State | vs National | |
| 1. | Boston | 2,529 | 40,545(6.24%)#1 | 2,707,911(0.09%)#60 |
| 2. | Newton | 749 | 40,545(1.85%)#2 | 2,707,911(0.03%)#367 |
| 3. | Cambridge | 601 | 40,545(1.48%)#3 | 2,707,911(0.02%)#515 |
| 4. | Worcester | 578 | 40,545(1.43%)#4 | 2,707,911(0.02%)#543 |
| 5. | Danvers | 538 | 40,545(1.33%)#5 | 2,707,911(0.02%)#601 |
| 6. | Peabody | 517 | 40,545(1.28%)#6 | 2,707,911(0.02%)#624 |
| 7. | Quincy | 453 | 40,545(1.12%)#7 | 2,707,911(0.02%)#762 |
| 8. | Waltham | 450 | 40,545(1.11%)#8 | 2,707,911(0.02%)#766 |
| 9. | Brockton | 423 | 40,545(1.04%)#9 | 2,707,911(0.02%)#811 |
| 10. | Somerville | 422 | 40,545(1.04%)#10 | 2,707,911(0.02%)#816 |
| 11. | Arlington | 409 | 40,545(1.01%)#11 | 2,707,911(0.02%)#845 |
| 12. | Brookline | 398 | 40,545(0.98%)#12 | 2,707,911(0.01%)#875 |
| 13. | Springfield | 395 | 40,545(0.97%)#13 | 2,707,911(0.01%)#885 |
| 14. | Salem | 380 | 40,545(0.94%)#14 | 2,707,911(0.01%)#924 |
| 15. | Marlborough | 360 | 40,545(0.89%)#15 | 2,707,911(0.01%)#986 |
| 16. | Weymouth Town | 353 | 40,545(0.87%)#16 | 2,707,911(0.01%)#1,008 |
| 17. | Haverhill | 328 | 40,545(0.81%)#17 | 2,707,911(0.01%)#1,102 |
| 18. | Watertown Town | 316 | 40,545(0.78%)#18 | 2,707,911(0.01%)#1,153 |
| 19. | Bridgewater Town | 303 | 40,545(0.75%)#19 | 2,707,911(0.01%)#1,201 |
| 20. | Barnstable Town | 285 | 40,545(0.70%)#20 | 2,707,911(0.01%)#1,297 |
| 21. | Beverly | 285 | 40,545(0.70%)#21 | 2,707,911(0.01%)#1,298 |
| 22. | Lexington | 283 | 40,545(0.70%)#22 | 2,707,911(0.01%)#1,309 |
| 23. | Lowell | 282 | 40,545(0.70%)#23 | 2,707,911(0.01%)#1,315 |
| 24. | Medford | 270 | 40,545(0.67%)#24 | 2,707,911(0.01%)#1,379 |
| 25. | Gloucester | 266 | 40,545(0.66%)#25 | 2,707,911(0.01%)#1,399 |
| 26. | Chicopee | 260 | 40,545(0.64%)#26 | 2,707,911(0.01%)#1,445 |
| 27. | Reading | 256 | 40,545(0.63%)#27 | 2,707,911(0.01%)#1,473 |
| 28. | Needham | 253 | 40,545(0.62%)#28 | 2,707,911(0.01%)#1,486 |
| 29. | Northampton | 252 | 40,545(0.62%)#29 | 2,707,911(0.01%)#1,491 |
| 30. | Woburn | 249 | 40,545(0.61%)#30 | 2,707,911(0.01%)#1,506 |
| 31. | Melrose | 248 | 40,545(0.61%)#31 | 2,707,911(0.01%)#1,512 |
| 32. | Burlington | 244 | 40,545(0.60%)#32 | 2,707,911(0.01%)#1,551 |
| 33. | Wakefield | 239 | 40,545(0.59%)#33 | 2,707,911(0.01%)#1,584 |
| 34. | Winchester | 238 | 40,545(0.59%)#34 | 2,707,911(0.01%)#1,595 |
| 35. | Wellesley | 235 | 40,545(0.58%)#35 | 2,707,911(0.01%)#1,609 |
| 36. | Attleboro | 234 | 40,545(0.58%)#36 | 2,707,911(0.01%)#1,620 |
| 37. | Pittsfield | 224 | 40,545(0.55%)#37 | 2,707,911(0.01%)#1,699 |
| 38. | Maynard | 222 | 40,545(0.55%)#38 | 2,707,911(0.01%)#1,717 |
| 39. | Norwood | 221 | 40,545(0.55%)#39 | 2,707,911(0.01%)#1,720 |
| 40. | Franklin Town | 215 | 40,545(0.53%)#40 | 2,707,911(0.01%)#1,779 |
| 41. | Framingham | 204 | 40,545(0.50%)#41 | 2,707,911(0.01%)#1,878 |
| 42. | Pinehurst | 198 | 40,545(0.49%)#42 | 2,707,911(0.01%)#1,933 |
| 43. | Amherst | 193 | 40,545(0.48%)#43 | 2,707,911(0.01%)#1,980 |
| 44. | Leominster | 191 | 40,545(0.47%)#44 | 2,707,911(0.01%)#2,008 |
| 45. | Westfield | 186 | 40,545(0.46%)#45 | 2,707,911(0.01%)#2,052 |
| 46. | New Bedford | 177 | 40,545(0.44%)#46 | 2,707,911(0.01%)#2,146 |
| 47. | Methuen Town | 170 | 40,545(0.42%)#47 | 2,707,911(0.01%)#2,225 |
| 48. | Wilmington | 162 | 40,545(0.40%)#48 | 2,707,911(0.01%)#2,337 |
| 49. | Newburyport | 161 | 40,545(0.40%)#49 | 2,707,911(0.01%)#2,356 |
| 50. | Greenfield | 147 | 40,545(0.36%)#50 | 2,707,911(0.01%)#2,573 |
| 51. | Milford | 146 | 40,545(0.36%)#51 | 2,707,911(0.01%)#2,589 |
| 52. | Revere | 142 | 40,545(0.35%)#52 | 2,707,911(0.01%)#2,651 |
| 53. | Northwest Harwich | 139 | 40,545(0.34%)#53 | 2,707,911(0.01%)#2,711 |
| 54. | West Springfield Town | 137 | 40,545(0.34%)#54 | 2,707,911(0.01%)#2,731 |
| 55. | Belmont | 126 | 40,545(0.31%)#55 | 2,707,911(0.00%)#2,943 |
| 56. | Marblehead | 126 | 40,545(0.31%)#56 | 2,707,911(0.00%)#2,946 |
| 57. | Ayer | 126 | 40,545(0.31%)#57 | 2,707,911(0.00%)#2,964 |
| 58. | Braintree Town | 124 | 40,545(0.31%)#58 | 2,707,911(0.00%)#2,989 |
| 59. | Gardner | 122 | 40,545(0.30%)#59 | 2,707,911(0.00%)#3,028 |
| 60. | Longmeadow | 115 | 40,545(0.28%)#60 | 2,707,911(0.00%)#3,182 |
| 61. | Stoneham | 114 | 40,545(0.28%)#61 | 2,707,911(0.00%)#3,207 |
| 62. | South Duxbury | 114 | 40,545(0.28%)#62 | 2,707,911(0.00%)#3,224 |
| 63. | Hull | 110 | 40,545(0.27%)#63 | 2,707,911(0.00%)#3,309 |
| 64. | Agawam Town | 108 | 40,545(0.27%)#64 | 2,707,911(0.00%)#3,345 |
| 65. | Dedham | 108 | 40,545(0.27%)#65 | 2,707,911(0.00%)#3,348 |
| 66. | East Harwich | 108 | 40,545(0.27%)#66 | 2,707,911(0.00%)#3,366 |
| 67. | Foxborough | 105 | 40,545(0.26%)#67 | 2,707,911(0.00%)#3,439 |
| 68. | North Pembroke | 105 | 40,545(0.26%)#68 | 2,707,911(0.00%)#3,445 |
| 69. | Turners Falls | 105 | 40,545(0.26%)#69 | 2,707,911(0.00%)#3,446 |
| 70. | Rutland | 102 | 40,545(0.25%)#70 | 2,707,911(0.00%)#3,539 |
| 71. | Hudson | 100 | 40,545(0.25%)#71 | 2,707,911(0.00%)#3,576 |
| 72. | Holyoke | 98 | 40,545(0.24%)#72 | 2,707,911(0.00%)#3,619 |
| 73. | Saugus | 98 | 40,545(0.24%)#73 | 2,707,911(0.00%)#3,621 |
| 74. | Lynn | 96 | 40,545(0.24%)#74 | 2,707,911(0.00%)#3,670 |
| 75. | Fall River | 94 | 40,545(0.23%)#75 | 2,707,911(0.00%)#3,740 |
| 76. | Milton | 93 | 40,545(0.23%)#76 | 2,707,911(0.00%)#3,769 |
| 77. | Marshfield | 93 | 40,545(0.23%)#77 | 2,707,911(0.00%)#3,791 |
| 78. | Middleborough Center | 91 | 40,545(0.22%)#78 | 2,707,911(0.00%)#3,865 |
| 79. | North Attleborough | 86 | 40,545(0.21%)#79 | 2,707,911(0.00%)#3,992 |
| 80. | Ocean Grove | 85 | 40,545(0.21%)#80 | 2,707,911(0.00%)#4,054 |
| 81. | Medfield | 84 | 40,545(0.21%)#81 | 2,707,911(0.00%)#4,079 |
| 82. | Westborough | 84 | 40,545(0.21%)#82 | 2,707,911(0.00%)#4,085 |
| 83. | Amesbury Town | 83 | 40,545(0.20%)#83 | 2,707,911(0.00%)#4,102 |
| 84. | Vineyard Haven | 83 | 40,545(0.20%)#84 | 2,707,911(0.00%)#4,135 |
| 85. | South Yarmouth | 80 | 40,545(0.20%)#85 | 2,707,911(0.00%)#4,215 |
| 86. | Clinton | 79 | 40,545(0.19%)#86 | 2,707,911(0.00%)#4,252 |
| 87. | Walpole | 79 | 40,545(0.19%)#87 | 2,707,911(0.00%)#4,256 |
| 88. | Rockport | 76 | 40,545(0.19%)#88 | 2,707,911(0.00%)#4,382 |
| 89. | Malden | 72 | 40,545(0.18%)#89 | 2,707,911(0.00%)#4,520 |
| 90. | Yarmouth Port | 72 | 40,545(0.18%)#90 | 2,707,911(0.00%)#4,539 |
| 91. | Harwich Center | 72 | 40,545(0.18%)#91 | 2,707,911(0.00%)#4,567 |
| 92. | Deerfield | 72 | 40,545(0.18%)#92 | 2,707,911(0.00%)#4,568 |
| 93. | Mansfield Center | 70 | 40,545(0.17%)#93 | 2,707,911(0.00%)#4,640 |
| 94. | Holbrook | 68 | 40,545(0.17%)#94 | 2,707,911(0.00%)#4,717 |
| 95. | Hopedale | 68 | 40,545(0.17%)#95 | 2,707,911(0.00%)#4,733 |
| 96. | Everett | 64 | 40,545(0.16%)#96 | 2,707,911(0.00%)#4,909 |
| 97. | West Wareham | 64 | 40,545(0.16%)#97 | 2,707,911(0.00%)#4,944 |
| 98. | North Adams | 61 | 40,545(0.15%)#98 | 2,707,911(0.00%)#5,064 |
| 99. | Fitchburg | 59 | 40,545(0.15%)#99 | 2,707,911(0.00%)#5,169 |
| 100. | Provincetown | 59 | 40,545(0.15%)#100 | 2,707,911(0.00%)#5,205 |
Common Questions
What are the Top 10 Cities with the Largest Scotch-Irish Community in Massachusetts?
Top 10 Cities with the Largest Scotch-Irish Community in Massachusetts are:
What city has the Largest Scotch-Irish Community in Massachusetts?
Boston has the Largest Scotch-Irish Community in Massachusetts with 2,529.
What is the Total Scotch-Irish Population in the State of Massachusetts?
Total Scotch-Irish Population in Massachusetts is 40,545.
What is the Total Scotch-Irish Population in the United States?
Total Scotch-Irish Population in the United States is 2,707,911.