Weymouth Town, MA Map & Demographics
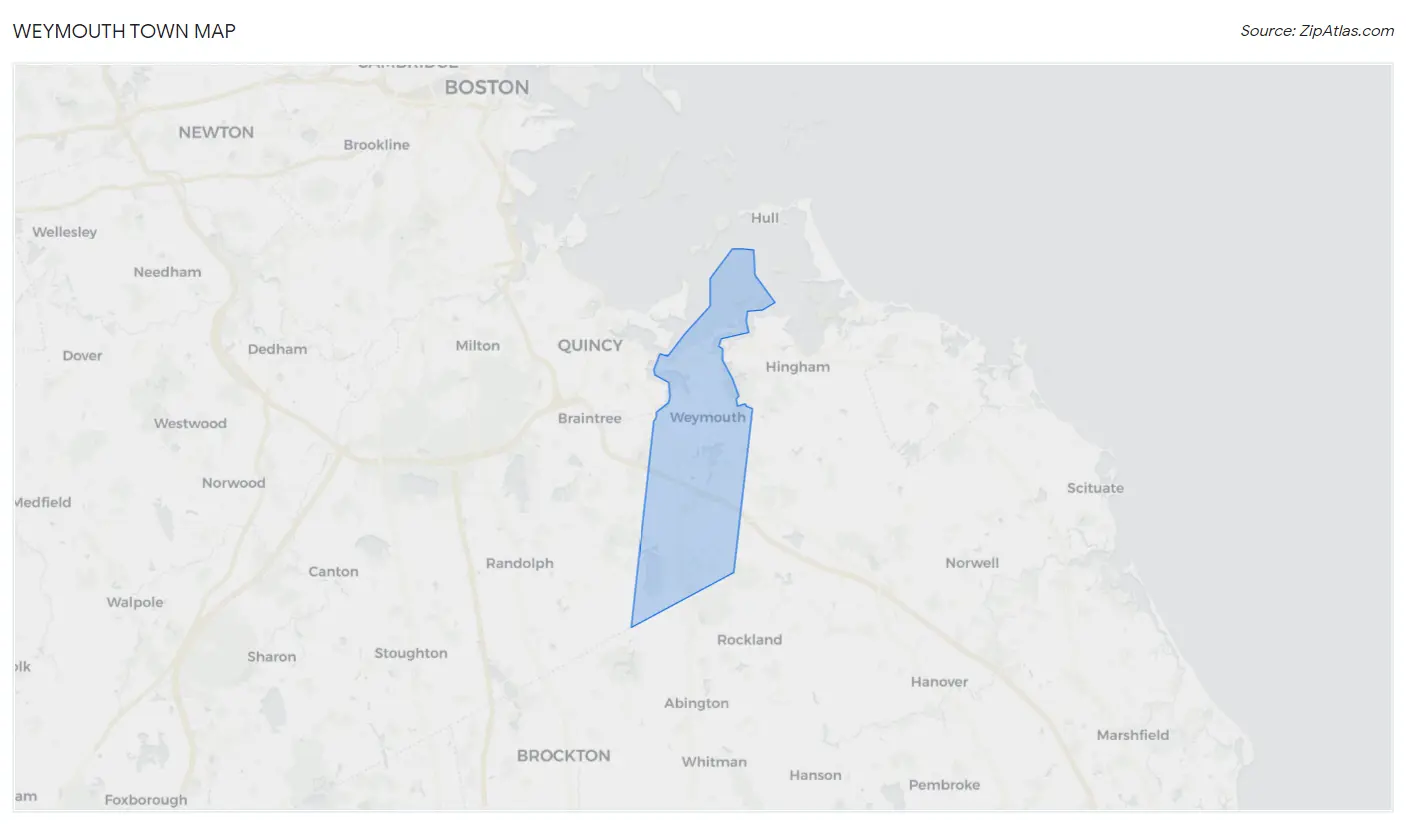
Weymouth Town Map
Weymouth Town Overview
$51,316
PER CAPITA INCOME
$123,519
AVG FAMILY INCOME
$95,879
AVG HOUSEHOLD INCOME
15.2%
WAGE / INCOME GAP [ % ]
84.8¢/ $1
WAGE / INCOME GAP [ $ ]
0.41
INEQUALITY / GINI INDEX
57,300
TOTAL POPULATION
27,952
MALE POPULATION
29,348
FEMALE POPULATION
95.24
MALES / 100 FEMALES
104.99
FEMALES / 100 MALES
44.3
MEDIAN AGE
3.0
AVG FAMILY SIZE
2.3
AVG HOUSEHOLD SIZE
34,031
LABOR FORCE [ PEOPLE ]
69.3%
PERCENT IN LABOR FORCE
4.7%
UNEMPLOYMENT RATE
Income in Weymouth Town
Income Overview in Weymouth Town
Per Capita Income in Weymouth Town is $51,316, while median incomes of families and households are $123,519 and $95,879 respectively.
| Characteristic | Number | Measure |
| Per Capita Income | 57,300 | $51,316 |
| Median Family Income | 15,128 | $123,519 |
| Mean Family Income | 15,128 | $141,351 |
| Median Household Income | 24,696 | $95,879 |
| Mean Household Income | 24,696 | $117,742 |
| Income Deficit | 15,128 | $0 |
| Wage / Income Gap (%) | 57,300 | 15.22% |
| Wage / Income Gap ($) | 57,300 | 84.78¢ per $1 |
| Gini / Inequality Index | 57,300 | 0.41 |
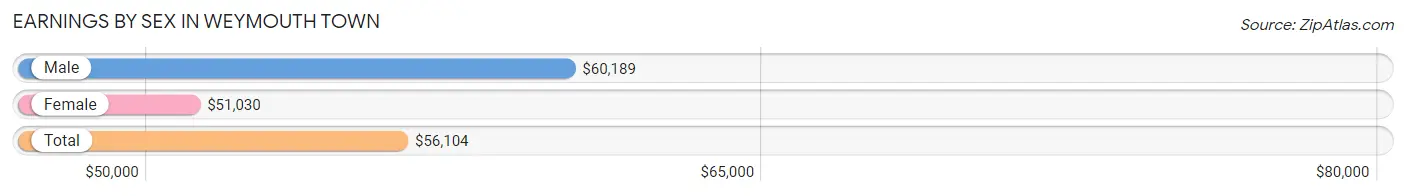
Earnings by Sex in Weymouth Town
Average Earnings in Weymouth Town are $56,104, $60,189 for men and $51,030 for women, a difference of 15.2%.
| Sex | Number | Average Earnings |
| Male | 18,480 (52.7%) | $60,189 |
| Female | 16,587 (47.3%) | $51,030 |
| Total | 35,067 (100.0%) | $56,104 |
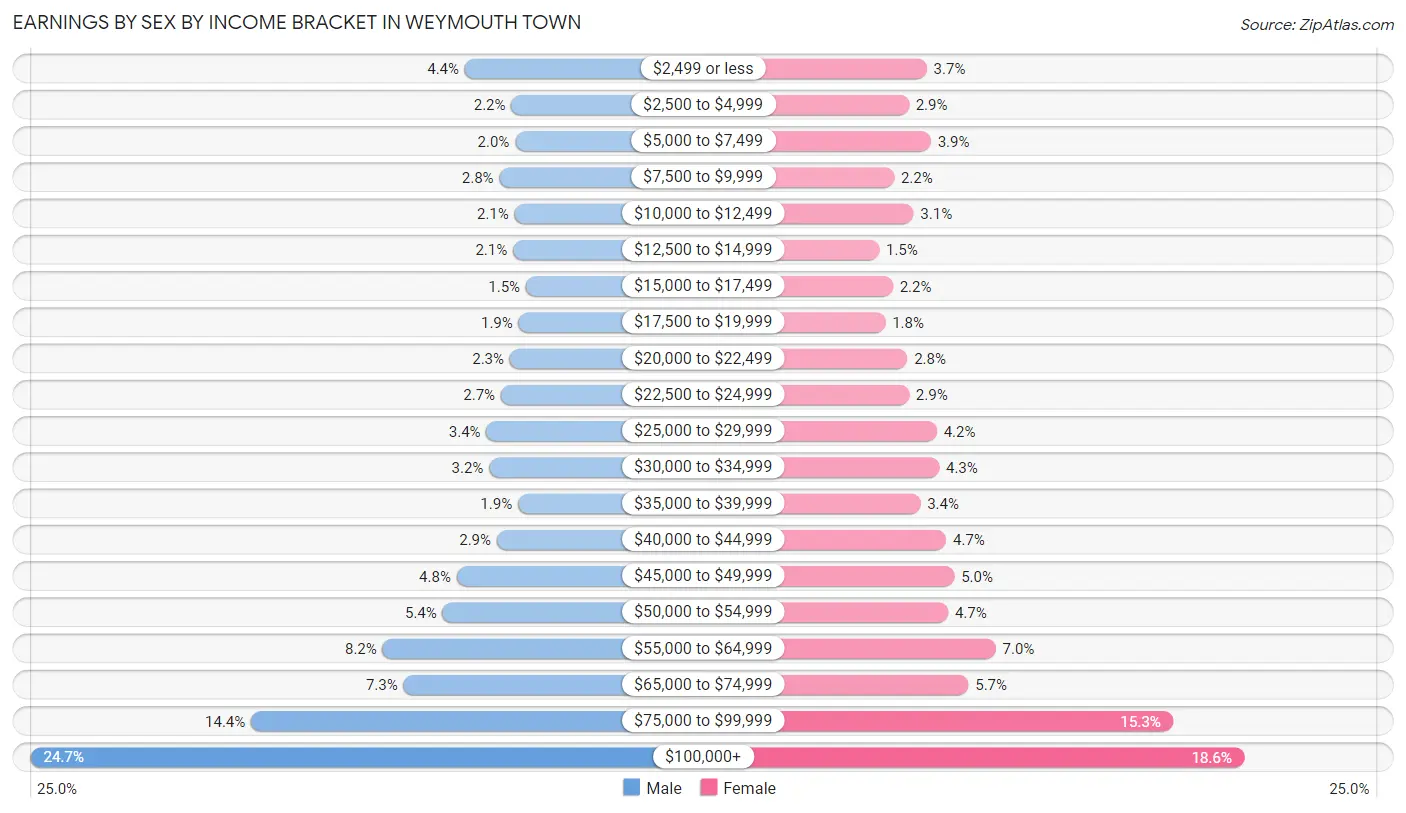
Earnings by Sex by Income Bracket in Weymouth Town
The most common earnings brackets in Weymouth Town are $100,000+ for men (4,568 | 24.7%) and $100,000+ for women (3,083 | 18.6%).
| Income | Male | Female |
| $2,499 or less | 809 (4.4%) | 621 (3.7%) |
| $2,500 to $4,999 | 406 (2.2%) | 481 (2.9%) |
| $5,000 to $7,499 | 374 (2.0%) | 652 (3.9%) |
| $7,500 to $9,999 | 510 (2.8%) | 367 (2.2%) |
| $10,000 to $12,499 | 379 (2.1%) | 517 (3.1%) |
| $12,500 to $14,999 | 391 (2.1%) | 251 (1.5%) |
| $15,000 to $17,499 | 280 (1.5%) | 356 (2.1%) |
| $17,500 to $19,999 | 343 (1.9%) | 298 (1.8%) |
| $20,000 to $22,499 | 420 (2.3%) | 470 (2.8%) |
| $22,500 to $24,999 | 497 (2.7%) | 482 (2.9%) |
| $25,000 to $29,999 | 622 (3.4%) | 699 (4.2%) |
| $30,000 to $34,999 | 598 (3.2%) | 716 (4.3%) |
| $35,000 to $39,999 | 349 (1.9%) | 571 (3.4%) |
| $40,000 to $44,999 | 533 (2.9%) | 772 (4.6%) |
| $45,000 to $49,999 | 879 (4.8%) | 835 (5.0%) |
| $50,000 to $54,999 | 1,002 (5.4%) | 786 (4.7%) |
| $55,000 to $64,999 | 1,521 (8.2%) | 1,156 (7.0%) |
| $65,000 to $74,999 | 1,339 (7.2%) | 943 (5.7%) |
| $75,000 to $99,999 | 2,660 (14.4%) | 2,531 (15.3%) |
| $100,000+ | 4,568 (24.7%) | 3,083 (18.6%) |
| Total | 18,480 (100.0%) | 16,587 (100.0%) |
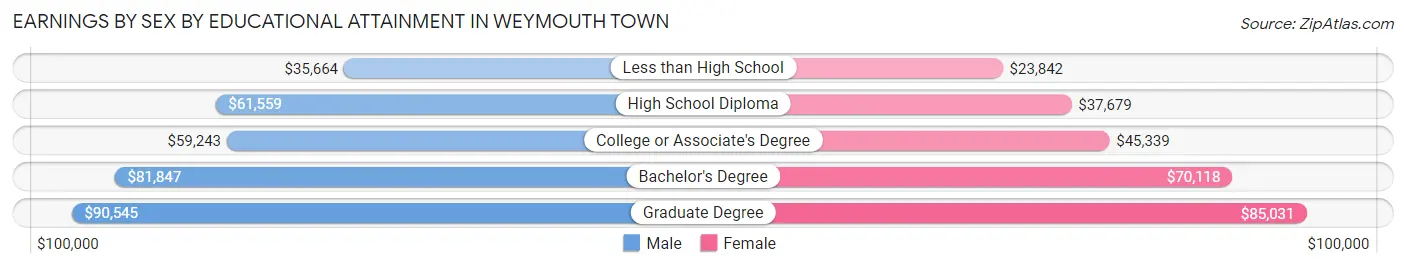
Earnings by Sex by Educational Attainment in Weymouth Town
Average earnings in Weymouth Town are $69,444 for men and $57,267 for women, a difference of 17.5%. Men with an educational attainment of graduate degree enjoy the highest average annual earnings of $90,545, while those with less than high school education earn the least with $35,664. Women with an educational attainment of graduate degree earn the most with the average annual earnings of $85,031, while those with less than high school education have the smallest earnings of $23,842.
| Educational Attainment | Male Income | Female Income |
| Less than High School | $35,664 | $23,842 |
| High School Diploma | $61,559 | $37,679 |
| College or Associate's Degree | $59,243 | $45,339 |
| Bachelor's Degree | $81,847 | $70,118 |
| Graduate Degree | $90,545 | $85,031 |
| Total | $69,444 | $57,267 |
Family Income in Weymouth Town
Family Income Brackets in Weymouth Town
According to the Weymouth Town family income data, there are 3,207 families falling into the $100,000 to $149,999 income range, which is the most common income bracket and makes up 21.2% of all families. Conversely, the $10,000 to $14,999 income bracket is the least frequent group with only 106 families (0.7%) belonging to this category.
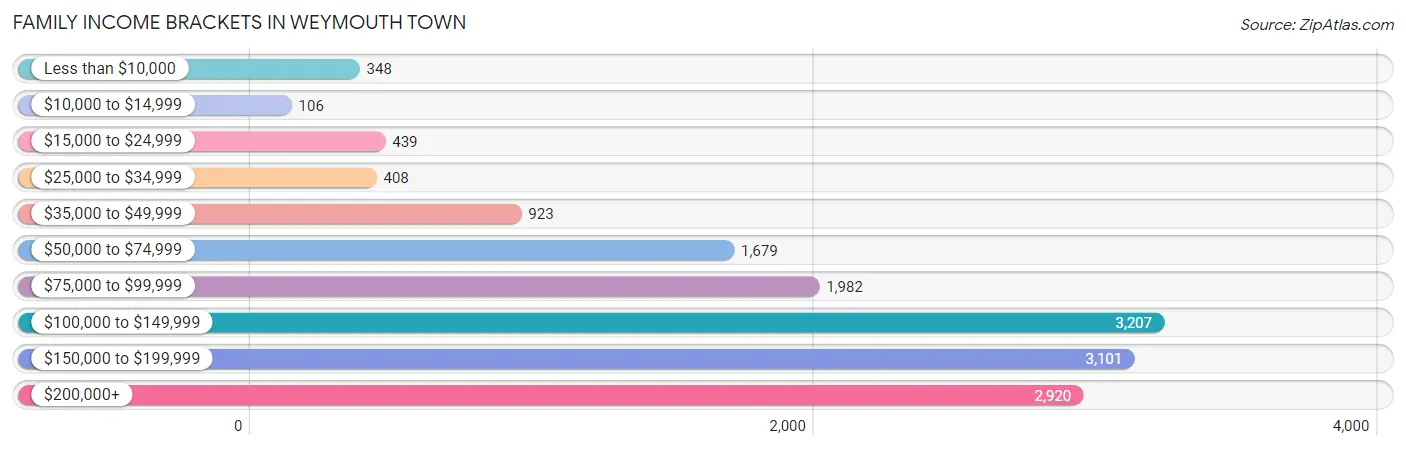
| Income Bracket | # Families | % Families |
| Less than $10,000 | 348 | 2.3% |
| $10,000 to $14,999 | 106 | 0.7% |
| $15,000 to $24,999 | 439 | 2.9% |
| $25,000 to $34,999 | 408 | 2.7% |
| $35,000 to $49,999 | 923 | 6.1% |
| $50,000 to $74,999 | 1,679 | 11.1% |
| $75,000 to $99,999 | 1,982 | 13.1% |
| $100,000 to $149,999 | 3,207 | 21.2% |
| $150,000 to $199,999 | 3,101 | 20.5% |
| $200,000+ | 2,920 | 19.3% |
Family Income by Famaliy Size in Weymouth Town
6-person families (429 | 2.8%) account for the highest median family income in Weymouth Town with $220,515 per family, while 2-person families (7,678 | 50.7%) have the highest median income of $53,077 per family member.
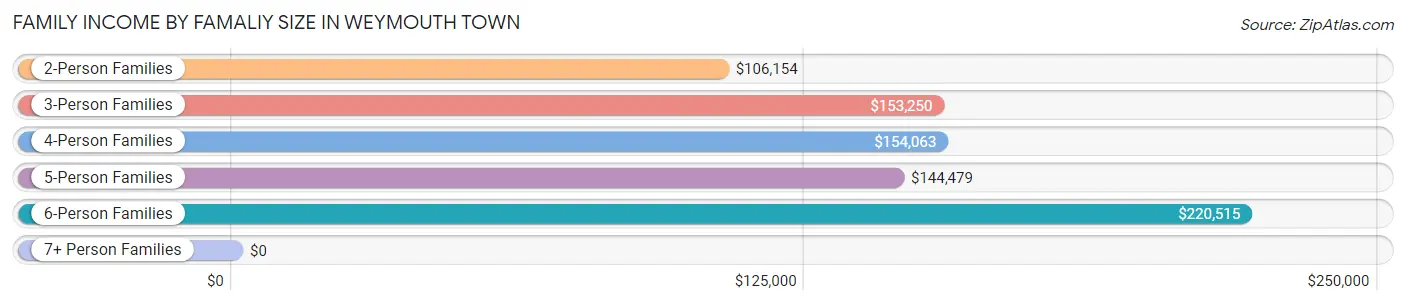
| Income Bracket | # Families | Median Income |
| 2-Person Families | 7,678 (50.7%) | $106,154 |
| 3-Person Families | 3,280 (21.7%) | $153,250 |
| 4-Person Families | 2,665 (17.6%) | $154,063 |
| 5-Person Families | 989 (6.5%) | $144,479 |
| 6-Person Families | 429 (2.8%) | $220,515 |
| 7+ Person Families | 87 (0.6%) | $0 |
| Total | 15,128 (100.0%) | $123,519 |
Family Income by Number of Earners in Weymouth Town
The median family income in Weymouth Town is $123,519, with families comprising 3+ earners (2,618) having the highest median family income of $182,031, while families with no earners (1,814) have the lowest median family income of $58,333, accounting for 17.3% and 12.0% of families, respectively.
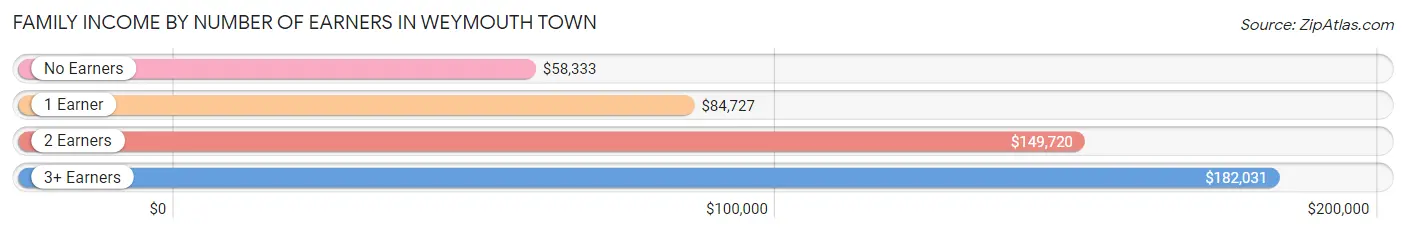
| Number of Earners | # Families | Median Income |
| No Earners | 1,814 (12.0%) | $58,333 |
| 1 Earner | 3,968 (26.2%) | $84,727 |
| 2 Earners | 6,728 (44.5%) | $149,720 |
| 3+ Earners | 2,618 (17.3%) | $182,031 |
| Total | 15,128 (100.0%) | $123,519 |
Household Income in Weymouth Town
Household Income Brackets in Weymouth Town
With 4,668 households falling in the category, the $100,000 to $149,999 income range is the most frequent in Weymouth Town, accounting for 18.9% of all households. In contrast, only 617 households (2.5%) fall into the $10,000 to $14,999 income bracket, making it the least populous group.
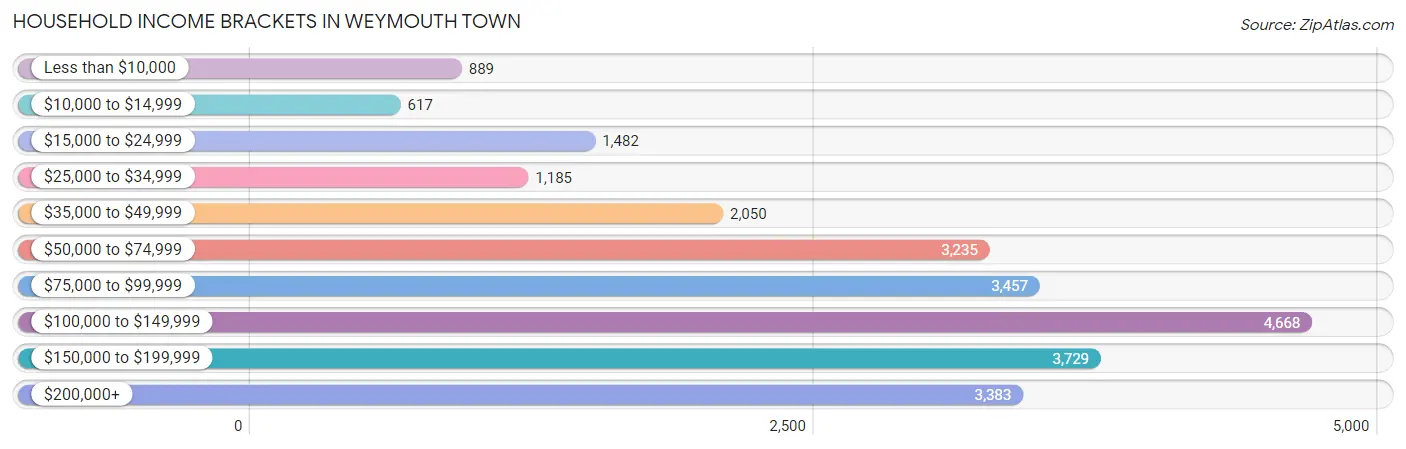
| Income Bracket | # Households | % Households |
| Less than $10,000 | 889 | 3.6% |
| $10,000 to $14,999 | 617 | 2.5% |
| $15,000 to $24,999 | 1,482 | 6.0% |
| $25,000 to $34,999 | 1,185 | 4.8% |
| $35,000 to $49,999 | 2,050 | 8.3% |
| $50,000 to $74,999 | 3,235 | 13.1% |
| $75,000 to $99,999 | 3,457 | 14.0% |
| $100,000 to $149,999 | 4,668 | 18.9% |
| $150,000 to $199,999 | 3,729 | 15.1% |
| $200,000+ | 3,383 | 13.7% |
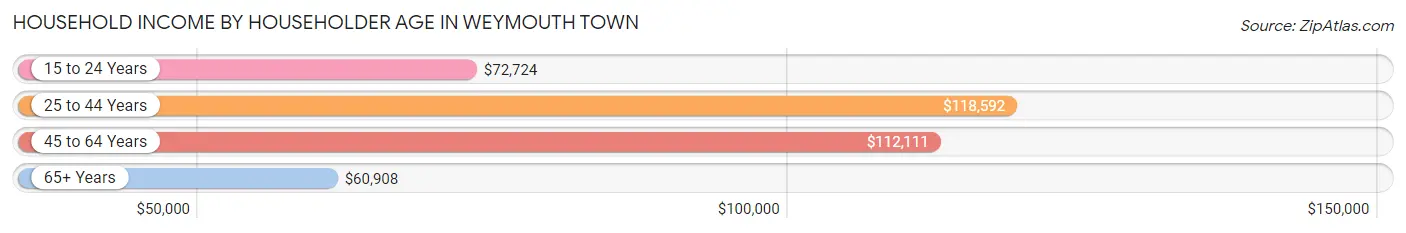
Household Income by Householder Age in Weymouth Town
The median household income in Weymouth Town is $95,879, with the highest median household income of $118,592 found in the 25 to 44 years age bracket for the primary householder. A total of 7,156 households (29.0%) fall into this category. Meanwhile, the 65+ years age bracket for the primary householder has the lowest median household income of $60,908, with 7,083 households (28.7%) in this group.
| Income Bracket | # Households | Median Income |
| 15 to 24 Years | 301 (1.2%) | $72,724 |
| 25 to 44 Years | 7,156 (29.0%) | $118,592 |
| 45 to 64 Years | 10,156 (41.1%) | $112,111 |
| 65+ Years | 7,083 (28.7%) | $60,908 |
| Total | 24,696 (100.0%) | $95,879 |
Poverty in Weymouth Town
Income Below Poverty by Sex and Age in Weymouth Town
With 4.7% poverty level for males and 7.7% for females among the residents of Weymouth Town, 75 year old and over males and 15 year old females are the most vulnerable to poverty, with 223 males (16.3%) and 60 females (17.7%) in their respective age groups living below the poverty level.
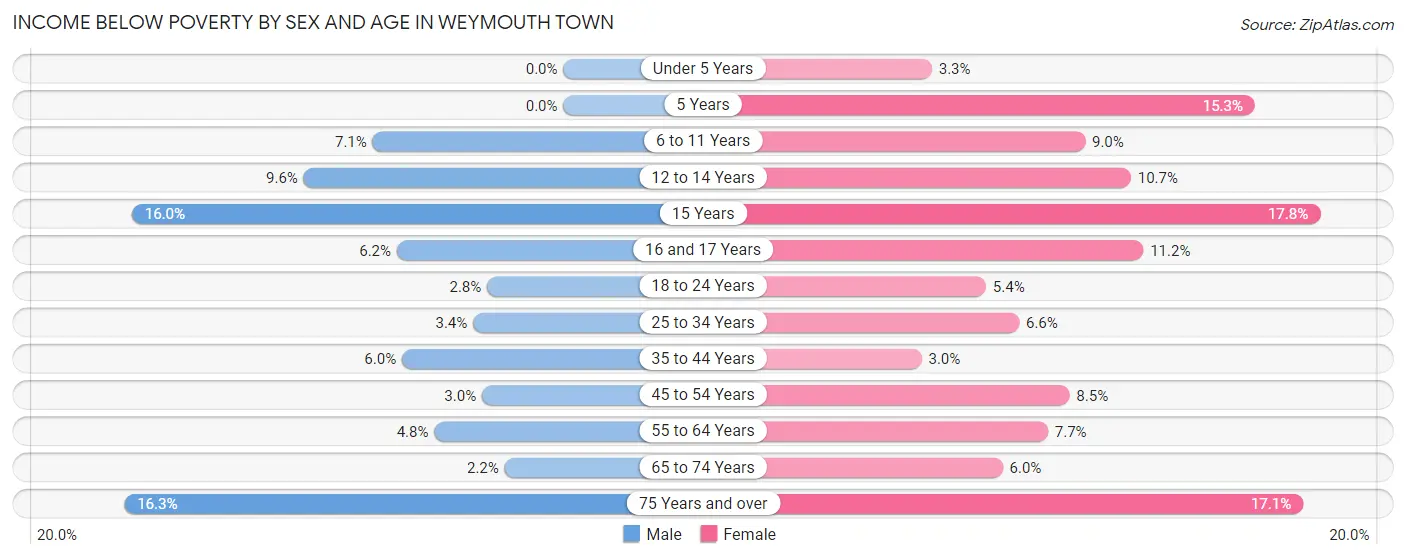
| Age Bracket | Male | Female |
| Under 5 Years | 0 (0.0%) | 42 (3.3%) |
| 5 Years | 0 (0.0%) | 21 (15.3%) |
| 6 to 11 Years | 93 (7.1%) | 132 (9.0%) |
| 12 to 14 Years | 69 (9.6%) | 100 (10.7%) |
| 15 Years | 37 (16.0%) | 60 (17.7%) |
| 16 and 17 Years | 40 (6.2%) | 79 (11.2%) |
| 18 to 24 Years | 72 (2.8%) | 103 (5.3%) |
| 25 to 34 Years | 127 (3.4%) | 263 (6.6%) |
| 35 to 44 Years | 240 (6.0%) | 98 (3.0%) |
| 45 to 54 Years | 109 (3.0%) | 320 (8.5%) |
| 55 to 64 Years | 227 (4.8%) | 397 (7.6%) |
| 65 to 74 Years | 68 (2.2%) | 214 (6.0%) |
| 75 Years and over | 223 (16.3%) | 424 (17.1%) |
| Total | 1,305 (4.7%) | 2,253 (7.7%) |
Income Above Poverty by Sex and Age in Weymouth Town
According to the poverty statistics in Weymouth Town, males aged under 5 years and females aged 35 to 44 years are the age groups that are most secure financially, with 100.0% of males and 97.0% of females in these age groups living above the poverty line.
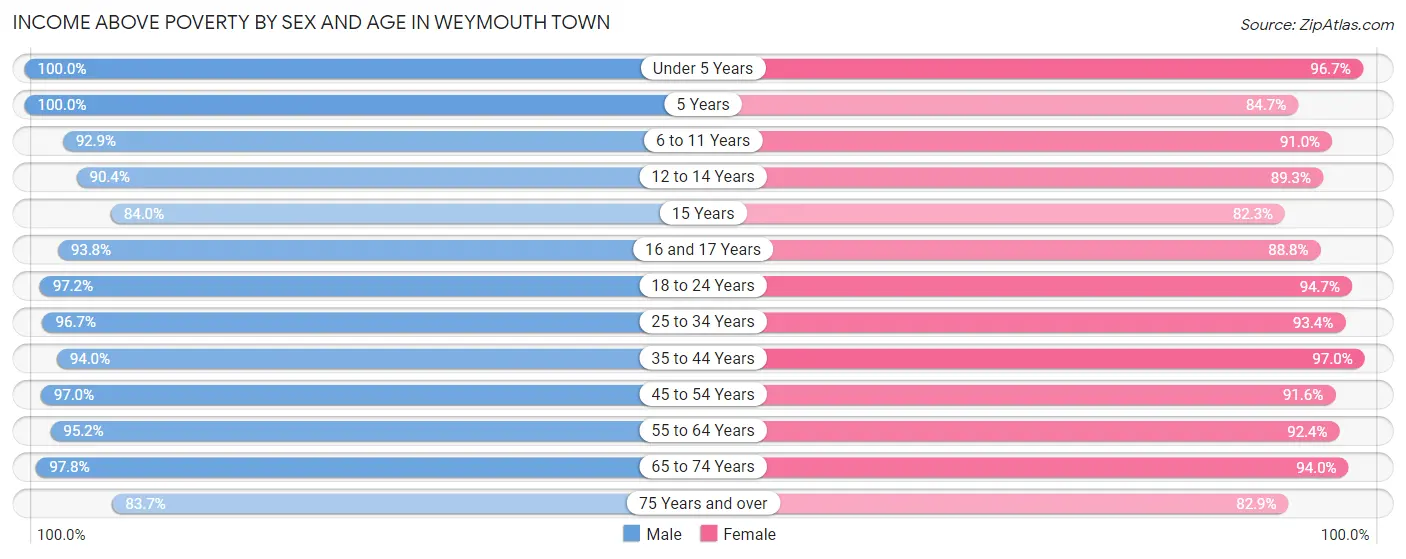
| Age Bracket | Male | Female |
| Under 5 Years | 1,398 (100.0%) | 1,214 (96.7%) |
| 5 Years | 288 (100.0%) | 116 (84.7%) |
| 6 to 11 Years | 1,220 (92.9%) | 1,329 (91.0%) |
| 12 to 14 Years | 647 (90.4%) | 832 (89.3%) |
| 15 Years | 194 (84.0%) | 278 (82.3%) |
| 16 and 17 Years | 607 (93.8%) | 627 (88.8%) |
| 18 to 24 Years | 2,469 (97.2%) | 1,821 (94.7%) |
| 25 to 34 Years | 3,668 (96.7%) | 3,735 (93.4%) |
| 35 to 44 Years | 3,766 (94.0%) | 3,210 (97.0%) |
| 45 to 54 Years | 3,505 (97.0%) | 3,469 (91.5%) |
| 55 to 64 Years | 4,514 (95.2%) | 4,793 (92.3%) |
| 65 to 74 Years | 3,055 (97.8%) | 3,371 (94.0%) |
| 75 Years and over | 1,145 (83.7%) | 2,052 (82.9%) |
| Total | 26,476 (95.3%) | 26,847 (92.3%) |
Income Below Poverty Among Married-Couple Families in Weymouth Town
The poverty statistics for married-couple families in Weymouth Town show that 2.0% or 226 of the total 11,457 families live below the poverty line. Families with 3 or 4 children have the highest poverty rate of 3.1%, comprising of 17 families. On the other hand, families with 5 or more children have the lowest poverty rate of 0.0%, which includes 0 families.
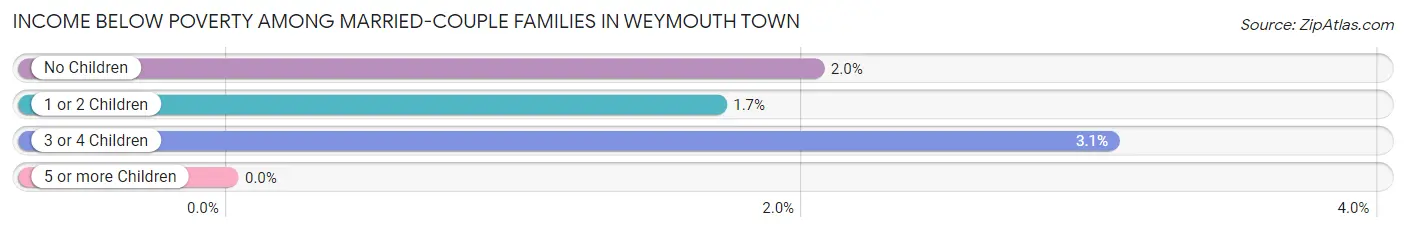
| Children | Above Poverty | Below Poverty |
| No Children | 7,052 (98.0%) | 147 (2.0%) |
| 1 or 2 Children | 3,578 (98.3%) | 62 (1.7%) |
| 3 or 4 Children | 536 (96.9%) | 17 (3.1%) |
| 5 or more Children | 65 (100.0%) | 0 (0.0%) |
| Total | 11,231 (98.0%) | 226 (2.0%) |
Income Below Poverty Among Single-Parent Households in Weymouth Town
According to the poverty data in Weymouth Town, 2.3% or 26 single-father households and 16.1% or 410 single-mother households are living below the poverty line. Among single-father households, those with 1 or 2 children have the highest poverty rate, with 17 households (6.6%) experiencing poverty. Likewise, among single-mother households, those with 3 or 4 children have the highest poverty rate, with 108 households (90.8%) falling below the poverty line.
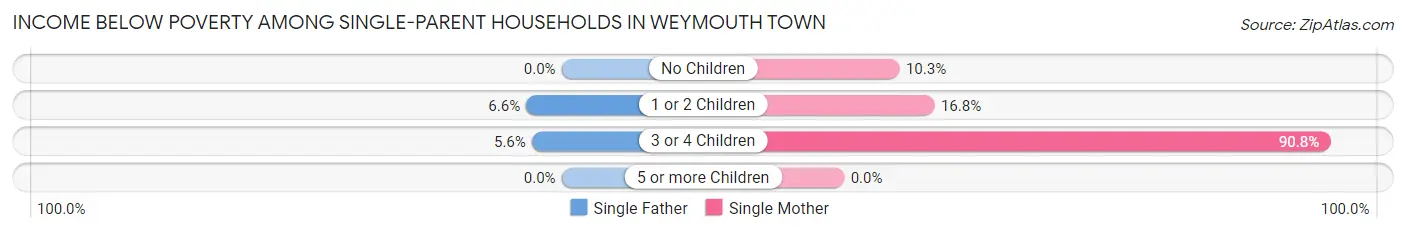
| Children | Single Father | Single Mother |
| No Children | 0 (0.0%) | 170 (10.3%) |
| 1 or 2 Children | 17 (6.6%) | 132 (16.8%) |
| 3 or 4 Children | 9 (5.6%) | 108 (90.8%) |
| 5 or more Children | 0 (0.0%) | 0 (0.0%) |
| Total | 26 (2.3%) | 410 (16.1%) |
Income Below Poverty Among Married-Couple vs Single-Parent Households in Weymouth Town
The poverty data for Weymouth Town shows that 226 of the married-couple family households (2.0%) and 436 of the single-parent households (11.9%) are living below the poverty level. Within the married-couple family households, those with 3 or 4 children have the highest poverty rate, with 17 households (3.1%) falling below the poverty line. Among the single-parent households, those with 3 or 4 children have the highest poverty rate, with 117 household (41.6%) living below poverty.
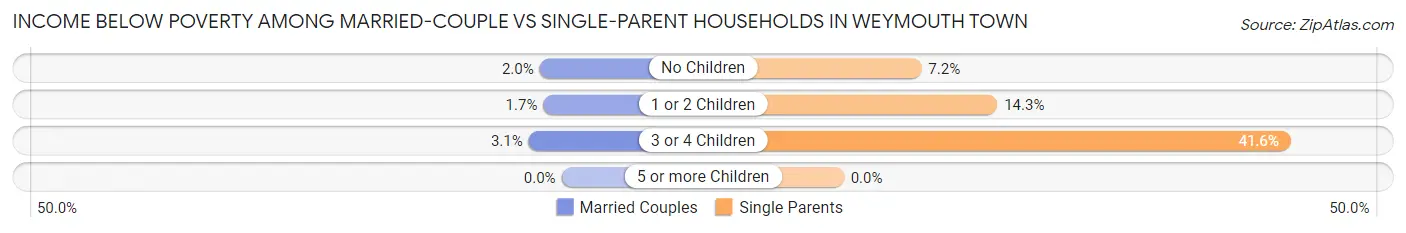
| Children | Married-Couple Families | Single-Parent Households |
| No Children | 147 (2.0%) | 170 (7.2%) |
| 1 or 2 Children | 62 (1.7%) | 149 (14.3%) |
| 3 or 4 Children | 17 (3.1%) | 117 (41.6%) |
| 5 or more Children | 0 (0.0%) | 0 (0.0%) |
| Total | 226 (2.0%) | 436 (11.9%) |
Race in Weymouth Town
The most populous races in Weymouth Town are White / Caucasian (46,880 | 81.8%), Asian (3,915 | 6.8%), and Black / African American (3,141 | 5.5%).
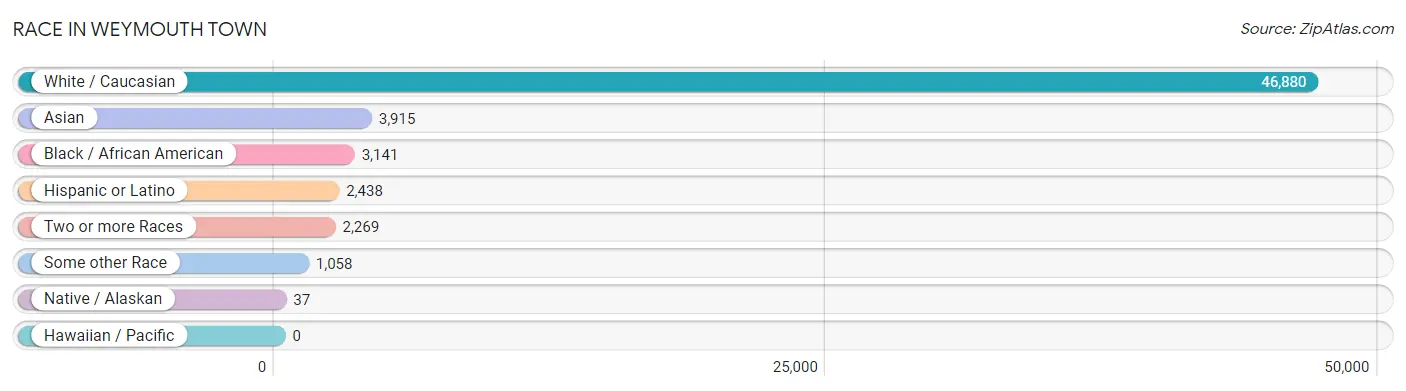
| Race | # Population | % Population |
| Asian | 3,915 | 6.8% |
| Black / African American | 3,141 | 5.5% |
| Hawaiian / Pacific | 0 | 0.0% |
| Hispanic or Latino | 2,438 | 4.3% |
| Native / Alaskan | 37 | 0.1% |
| White / Caucasian | 46,880 | 81.8% |
| Two or more Races | 2,269 | 4.0% |
| Some other Race | 1,058 | 1.8% |
| Total | 57,300 | 100.0% |
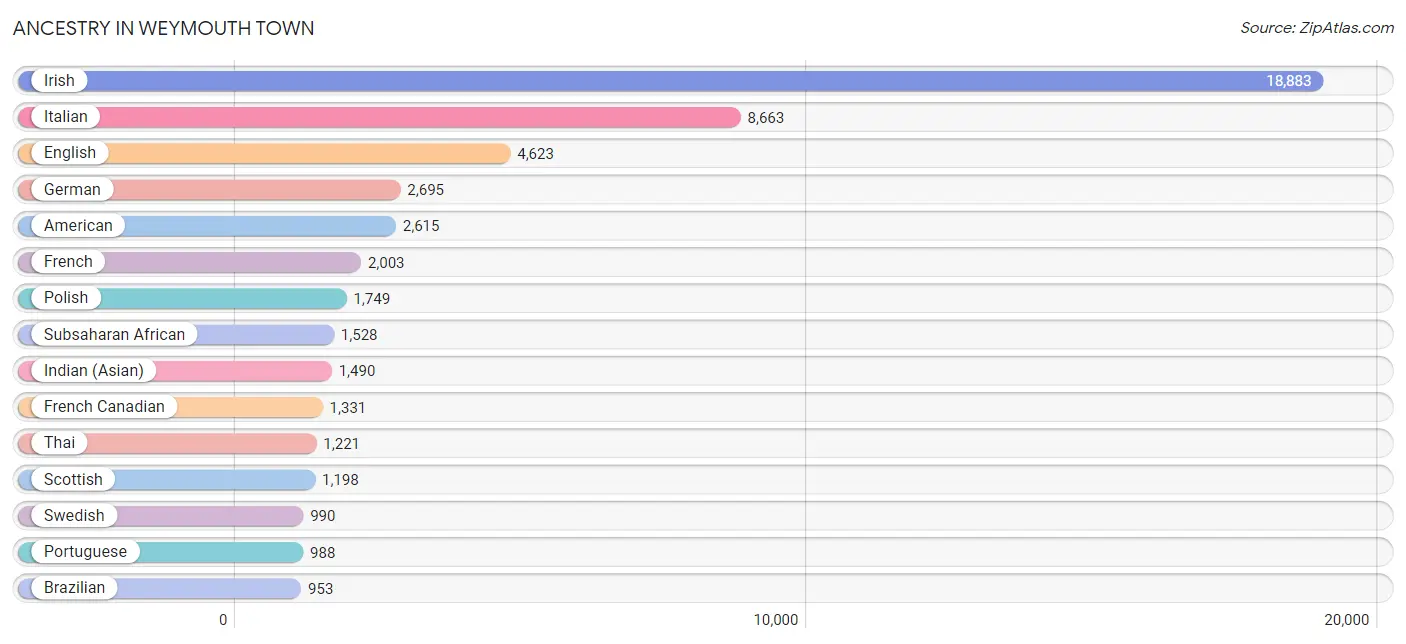
Ancestry in Weymouth Town
The most populous ancestries reported in Weymouth Town are Irish (18,883 | 33.0%), Italian (8,663 | 15.1%), English (4,623 | 8.1%), German (2,695 | 4.7%), and American (2,615 | 4.6%), together accounting for 65.4% of all Weymouth Town residents.
| Ancestry | # Population | % Population |
| African | 440 | 0.8% |
| Albanian | 328 | 0.6% |
| American | 2,615 | 4.6% |
| Apache | 24 | 0.0% |
| Arab | 470 | 0.8% |
| Argentinean | 45 | 0.1% |
| Armenian | 182 | 0.3% |
| Assyrian / Chaldean / Syriac | 38 | 0.1% |
| Australian | 15 | 0.0% |
| Austrian | 23 | 0.0% |
| Barbadian | 12 | 0.0% |
| Belgian | 18 | 0.0% |
| Bhutanese | 79 | 0.1% |
| Brazilian | 953 | 1.7% |
| British | 320 | 0.6% |
| Bulgarian | 100 | 0.2% |
| Burmese | 46 | 0.1% |
| Cajun | 10 | 0.0% |
| Canadian | 396 | 0.7% |
| Cape Verdean | 471 | 0.8% |
| Celtic | 27 | 0.1% |
| Central American | 191 | 0.3% |
| Cherokee | 20 | 0.0% |
| Chilean | 27 | 0.1% |
| Colombian | 69 | 0.1% |
| Comanche | 13 | 0.0% |
| Cuban | 287 | 0.5% |
| Czech | 73 | 0.1% |
| Danish | 102 | 0.2% |
| Dominican | 274 | 0.5% |
| Dutch | 403 | 0.7% |
| Eastern European | 139 | 0.2% |
| Ecuadorian | 174 | 0.3% |
| Egyptian | 10 | 0.0% |
| English | 4,623 | 8.1% |
| European | 509 | 0.9% |
| Filipino | 70 | 0.1% |
| Finnish | 327 | 0.6% |
| French | 2,003 | 3.5% |
| French Canadian | 1,331 | 2.3% |
| German | 2,695 | 4.7% |
| Greek | 612 | 1.1% |
| Guatemalan | 115 | 0.2% |
| Haitian | 715 | 1.3% |
| Hungarian | 104 | 0.2% |
| Indian (Asian) | 1,490 | 2.6% |
| Indonesian | 7 | 0.0% |
| Iranian | 122 | 0.2% |
| Iraqi | 11 | 0.0% |
| Irish | 18,883 | 33.0% |
| Italian | 8,663 | 15.1% |
| Jamaican | 98 | 0.2% |
| Kenyan | 484 | 0.8% |
| Korean | 338 | 0.6% |
| Latvian | 51 | 0.1% |
| Lebanese | 152 | 0.3% |
| Lithuanian | 312 | 0.5% |
| Malaysian | 8 | 0.0% |
| Mexican | 367 | 0.6% |
| Moroccan | 66 | 0.1% |
| Native Hawaiian | 14 | 0.0% |
| Nigerian | 87 | 0.2% |
| Northern European | 36 | 0.1% |
| Norwegian | 497 | 0.9% |
| Okinawan | 34 | 0.1% |
| Pakistani | 61 | 0.1% |
| Pennsylvania German | 40 | 0.1% |
| Polish | 1,749 | 3.0% |
| Portuguese | 988 | 1.7% |
| Puerto Rican | 792 | 1.4% |
| Romanian | 128 | 0.2% |
| Russian | 474 | 0.8% |
| Salvadoran | 76 | 0.1% |
| Samoan | 14 | 0.0% |
| Scandinavian | 14 | 0.0% |
| Scotch-Irish | 353 | 0.6% |
| Scottish | 1,198 | 2.1% |
| Serbian | 24 | 0.0% |
| Sierra Leonean | 46 | 0.1% |
| Slavic | 5 | 0.0% |
| Slovak | 9 | 0.0% |
| South American | 325 | 0.6% |
| South American Indian | 41 | 0.1% |
| Spaniard | 128 | 0.2% |
| Spanish | 34 | 0.1% |
| Sri Lankan | 839 | 1.5% |
| Subsaharan African | 1,528 | 2.7% |
| Swedish | 990 | 1.7% |
| Swiss | 24 | 0.0% |
| Syrian | 50 | 0.1% |
| Thai | 1,221 | 2.1% |
| Trinidadian and Tobagonian | 10 | 0.0% |
| Turkish | 61 | 0.1% |
| Ukrainian | 105 | 0.2% |
| Venezuelan | 10 | 0.0% |
| Vietnamese | 15 | 0.0% |
| Welsh | 204 | 0.4% |
| West Indian | 7 | 0.0% | View All 98 Rows |
Immigrants in Weymouth Town
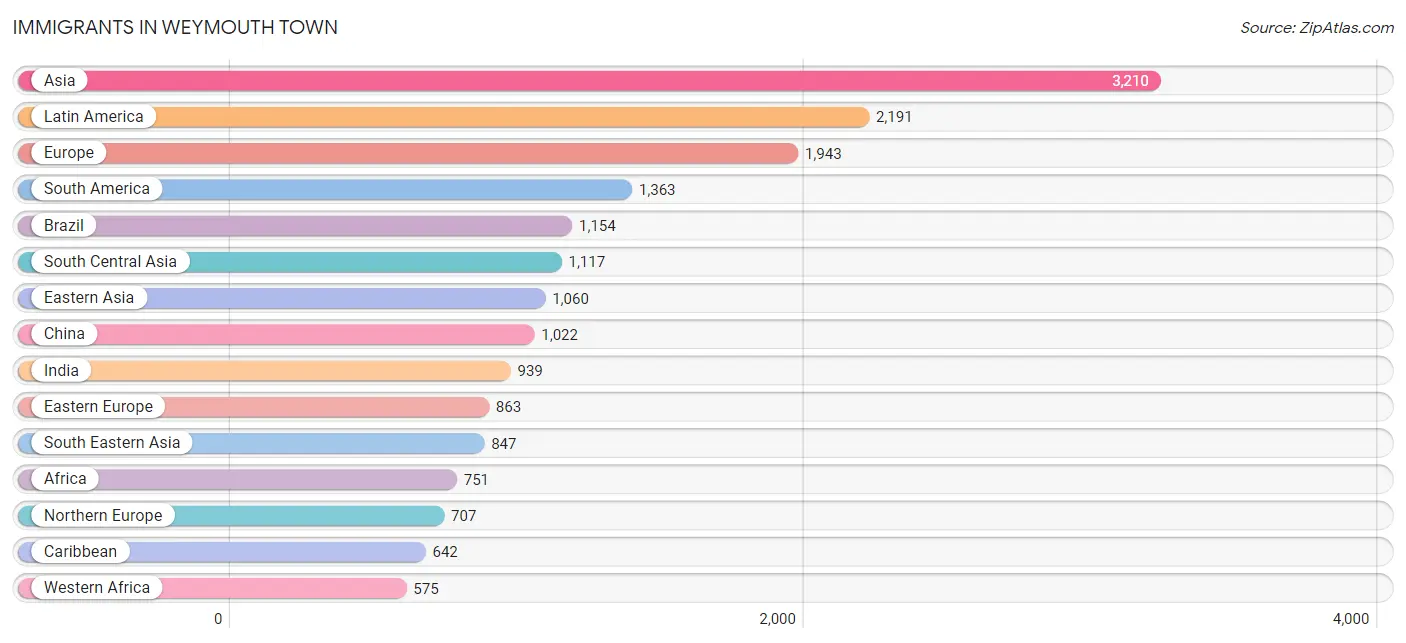
The most numerous immigrant groups reported in Weymouth Town came from Asia (3,210 | 5.6%), Latin America (2,191 | 3.8%), Europe (1,943 | 3.4%), South America (1,363 | 2.4%), and Brazil (1,154 | 2.0%), together accounting for 17.2% of all Weymouth Town residents.
| Immigration Origin | # Population | % Population |
| Africa | 751 | 1.3% |
| Albania | 276 | 0.5% |
| Argentina | 26 | 0.1% |
| Asia | 3,210 | 5.6% |
| Australia | 19 | 0.0% |
| Bangladesh | 15 | 0.0% |
| Barbados | 12 | 0.0% |
| Belarus | 9 | 0.0% |
| Brazil | 1,154 | 2.0% |
| Bulgaria | 111 | 0.2% |
| Cabo Verde | 96 | 0.2% |
| Canada | 94 | 0.2% |
| Caribbean | 642 | 1.1% |
| Central America | 186 | 0.3% |
| China | 1,022 | 1.8% |
| Colombia | 37 | 0.1% |
| Costa Rica | 23 | 0.0% |
| Czechoslovakia | 23 | 0.0% |
| Dominican Republic | 148 | 0.3% |
| Eastern Africa | 67 | 0.1% |
| Eastern Asia | 1,060 | 1.8% |
| Eastern Europe | 863 | 1.5% |
| Ecuador | 136 | 0.2% |
| Egypt | 10 | 0.0% |
| El Salvador | 31 | 0.1% |
| England | 159 | 0.3% |
| Europe | 1,943 | 3.4% |
| Germany | 14 | 0.0% |
| Ghana | 285 | 0.5% |
| Greece | 142 | 0.3% |
| Guatemala | 96 | 0.2% |
| Haiti | 441 | 0.8% |
| Hong Kong | 103 | 0.2% |
| Hungary | 16 | 0.0% |
| India | 939 | 1.6% |
| Iran | 84 | 0.2% |
| Iraq | 47 | 0.1% |
| Ireland | 225 | 0.4% |
| Italy | 116 | 0.2% |
| Jamaica | 31 | 0.1% |
| Jordan | 43 | 0.1% |
| Kenya | 67 | 0.1% |
| Korea | 38 | 0.1% |
| Kuwait | 36 | 0.1% |
| Latin America | 2,191 | 3.8% |
| Latvia | 12 | 0.0% |
| Lebanon | 6 | 0.0% |
| Mexico | 36 | 0.1% |
| Morocco | 99 | 0.2% |
| Nepal | 7 | 0.0% |
| Netherlands | 22 | 0.0% |
| Nigeria | 87 | 0.2% |
| Northern Africa | 109 | 0.2% |
| Northern Europe | 707 | 1.2% |
| Oceania | 51 | 0.1% |
| Philippines | 258 | 0.4% |
| Portugal | 15 | 0.0% |
| Romania | 60 | 0.1% |
| Russia | 185 | 0.3% |
| Scotland | 18 | 0.0% |
| Serbia | 12 | 0.0% |
| Sierra Leone | 107 | 0.2% |
| Singapore | 9 | 0.0% |
| South America | 1,363 | 2.4% |
| South Central Asia | 1,117 | 1.9% |
| South Eastern Asia | 847 | 1.5% |
| Southern Europe | 337 | 0.6% |
| Spain | 64 | 0.1% |
| Sri Lanka | 57 | 0.1% |
| Syria | 16 | 0.0% |
| Taiwan | 59 | 0.1% |
| Thailand | 32 | 0.1% |
| Trinidad and Tobago | 10 | 0.0% |
| Turkey | 38 | 0.1% |
| Ukraine | 147 | 0.3% |
| Uzbekistan | 15 | 0.0% |
| Venezuela | 10 | 0.0% |
| Vietnam | 523 | 0.9% |
| Western Africa | 575 | 1.0% |
| Western Asia | 186 | 0.3% |
| Western Europe | 36 | 0.1% | View All 81 Rows |
Sex and Age in Weymouth Town
Sex and Age in Weymouth Town
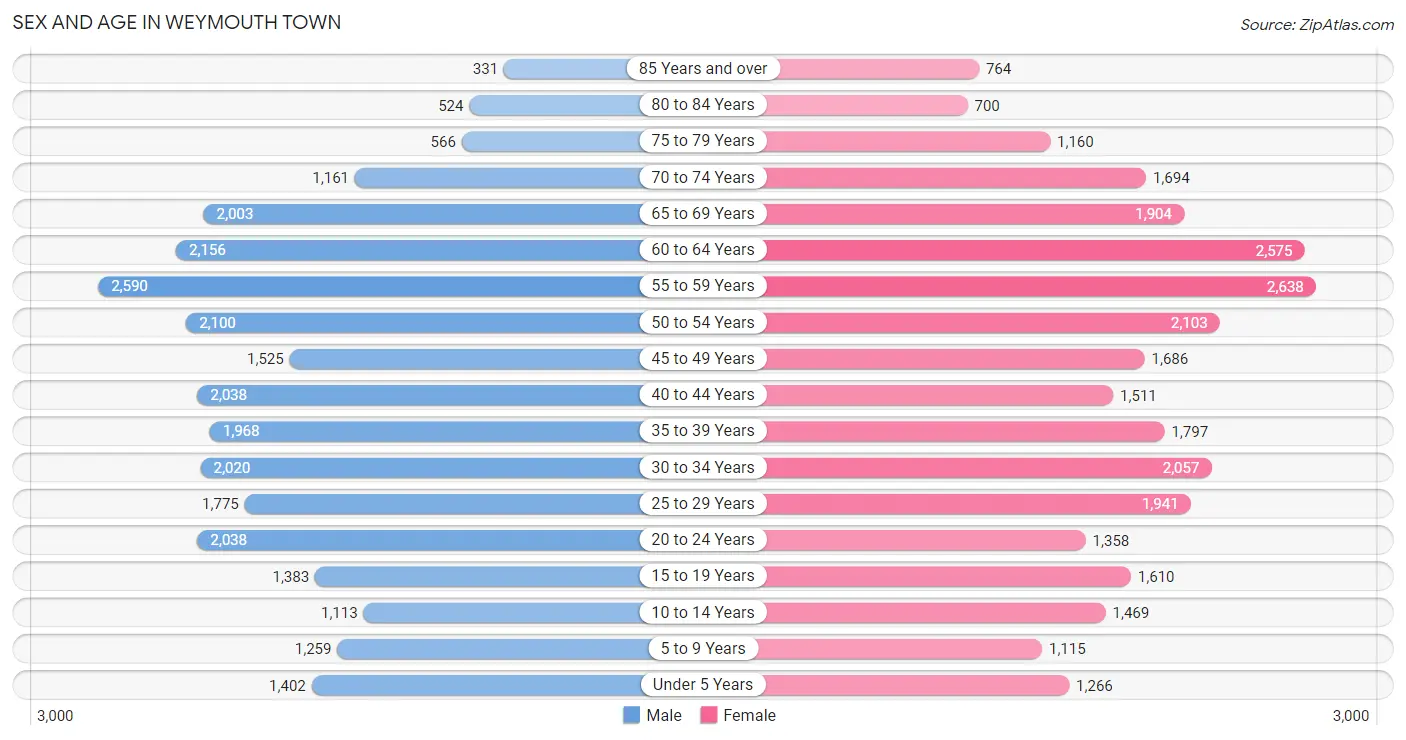
The most populous age groups in Weymouth Town are 55 to 59 Years (2,590 | 9.3%) for men and 55 to 59 Years (2,638 | 9.0%) for women.
| Age Bracket | Male | Female |
| Under 5 Years | 1,402 (5.0%) | 1,266 (4.3%) |
| 5 to 9 Years | 1,259 (4.5%) | 1,115 (3.8%) |
| 10 to 14 Years | 1,113 (4.0%) | 1,469 (5.0%) |
| 15 to 19 Years | 1,383 (5.0%) | 1,610 (5.5%) |
| 20 to 24 Years | 2,038 (7.3%) | 1,358 (4.6%) |
| 25 to 29 Years | 1,775 (6.4%) | 1,941 (6.6%) |
| 30 to 34 Years | 2,020 (7.2%) | 2,057 (7.0%) |
| 35 to 39 Years | 1,968 (7.0%) | 1,797 (6.1%) |
| 40 to 44 Years | 2,038 (7.3%) | 1,511 (5.1%) |
| 45 to 49 Years | 1,525 (5.5%) | 1,686 (5.7%) |
| 50 to 54 Years | 2,100 (7.5%) | 2,103 (7.2%) |
| 55 to 59 Years | 2,590 (9.3%) | 2,638 (9.0%) |
| 60 to 64 Years | 2,156 (7.7%) | 2,575 (8.8%) |
| 65 to 69 Years | 2,003 (7.2%) | 1,904 (6.5%) |
| 70 to 74 Years | 1,161 (4.2%) | 1,694 (5.8%) |
| 75 to 79 Years | 566 (2.0%) | 1,160 (4.0%) |
| 80 to 84 Years | 524 (1.9%) | 700 (2.4%) |
| 85 Years and over | 331 (1.2%) | 764 (2.6%) |
| Total | 27,952 (100.0%) | 29,348 (100.0%) |
Families and Households in Weymouth Town
Median Family Size in Weymouth Town
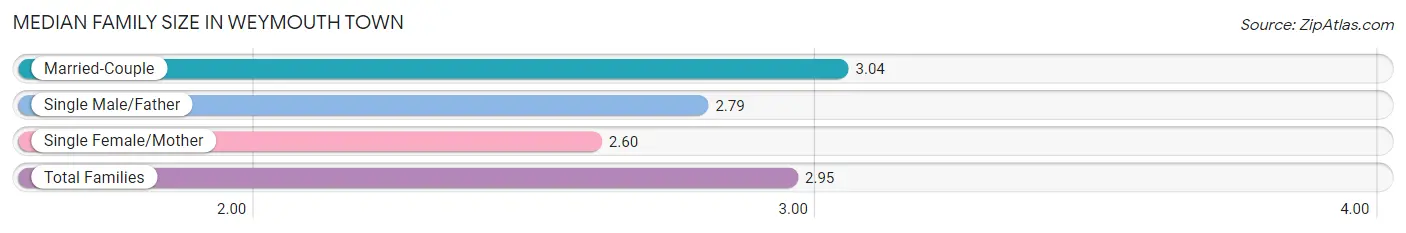
The median family size in Weymouth Town is 2.95 persons per family, with married-couple families (11,457 | 75.7%) accounting for the largest median family size of 3.04 persons per family. On the other hand, single female/mother families (2,554 | 16.9%) represent the smallest median family size with 2.60 persons per family.
| Family Type | # Families | Family Size |
| Married-Couple | 11,457 (75.7%) | 3.04 |
| Single Male/Father | 1,117 (7.4%) | 2.79 |
| Single Female/Mother | 2,554 (16.9%) | 2.60 |
| Total Families | 15,128 (100.0%) | 2.95 |
Median Household Size in Weymouth Town
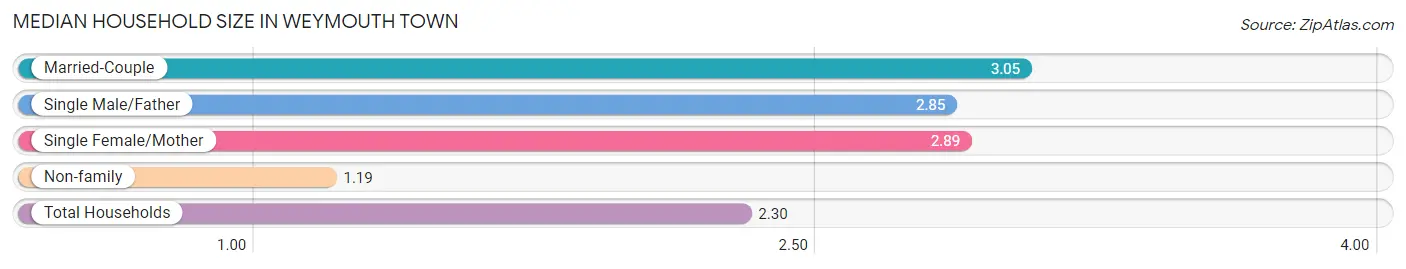
The median household size in Weymouth Town is 2.30 persons per household, with married-couple households (11,457 | 46.4%) accounting for the largest median household size of 3.05 persons per household. non-family households (9,568 | 38.7%) represent the smallest median household size with 1.19 persons per household.
| Household Type | # Households | Household Size |
| Married-Couple | 11,457 (46.4%) | 3.05 |
| Single Male/Father | 1,117 (4.5%) | 2.85 |
| Single Female/Mother | 2,554 (10.3%) | 2.89 |
| Non-family | 9,568 (38.7%) | 1.19 |
| Total Households | 24,696 (100.0%) | 2.30 |
Household Size by Marriage Status in Weymouth Town
Out of a total of 24,696 households in Weymouth Town, 15,128 (61.3%) are family households, while 9,568 (38.7%) are nonfamily households. The most numerous type of family households are 2-person households, comprising 7,275, and the most common type of nonfamily households are 1-person households, comprising 7,946.
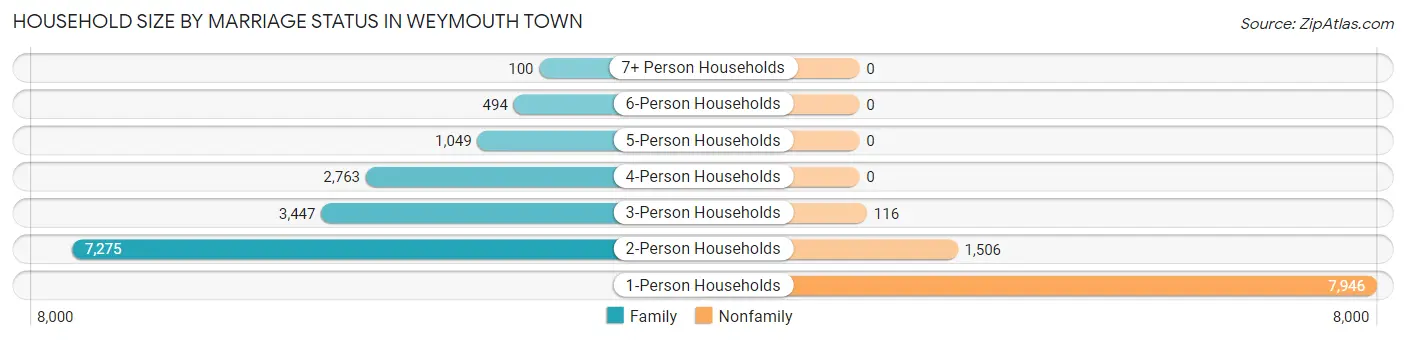
| Household Size | Family Households | Nonfamily Households |
| 1-Person Households | - | 7,946 (32.2%) |
| 2-Person Households | 7,275 (29.5%) | 1,506 (6.1%) |
| 3-Person Households | 3,447 (14.0%) | 116 (0.5%) |
| 4-Person Households | 2,763 (11.2%) | 0 (0.0%) |
| 5-Person Households | 1,049 (4.3%) | 0 (0.0%) |
| 6-Person Households | 494 (2.0%) | 0 (0.0%) |
| 7+ Person Households | 100 (0.4%) | 0 (0.0%) |
| Total | 15,128 (61.3%) | 9,568 (38.7%) |
Female Fertility in Weymouth Town
Fertility by Age in Weymouth Town
Average fertility rate in Weymouth Town is 50.0 births per 1,000 women. Women in the age bracket of 35 to 50 years have the highest fertility rate with 62.0 births per 1,000 women. Women in the age bracket of 35 to 50 years acount for 53.9% of all women with births.
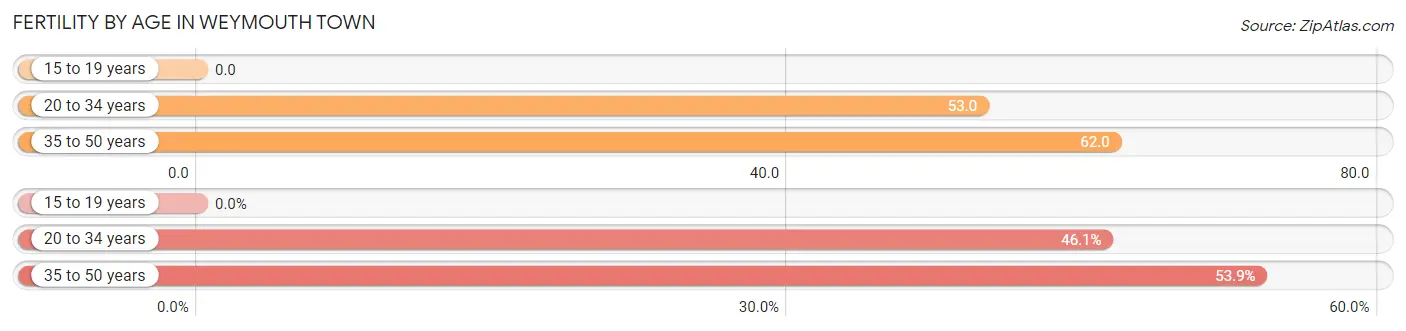
| Age Bracket | Women with Births | Births / 1,000 Women |
| 15 to 19 years | 0 (0.0%) | 0.0 |
| 20 to 34 years | 282 (46.1%) | 53.0 |
| 35 to 50 years | 330 (53.9%) | 62.0 |
| Total | 612 (100.0%) | 50.0 |
Fertility by Age by Marriage Status in Weymouth Town
88.2% of women with births (612) in Weymouth Town are married. The highest percentage of unmarried women with births falls into 20 to 34 years age bracket with 20.2% of them unmarried at the time of birth, while the lowest percentage of unmarried women with births belong to 35 to 50 years age bracket with 4.5% of them unmarried.
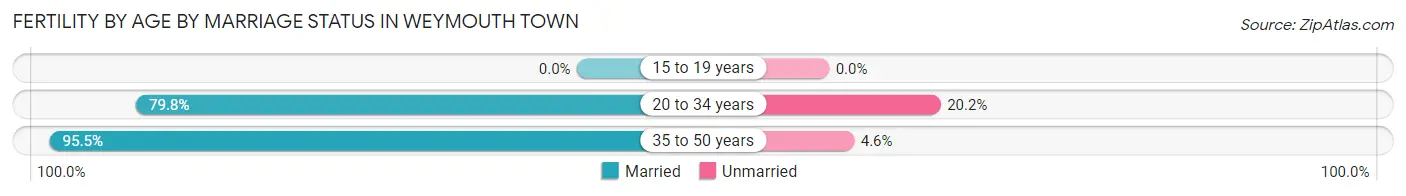
| Age Bracket | Married | Unmarried |
| 15 to 19 years | 0 (0.0%) | 0 (0.0%) |
| 20 to 34 years | 225 (79.8%) | 57 (20.2%) |
| 35 to 50 years | 315 (95.5%) | 15 (4.5%) |
| Total | 540 (88.2%) | 72 (11.8%) |
Fertility by Education in Weymouth Town
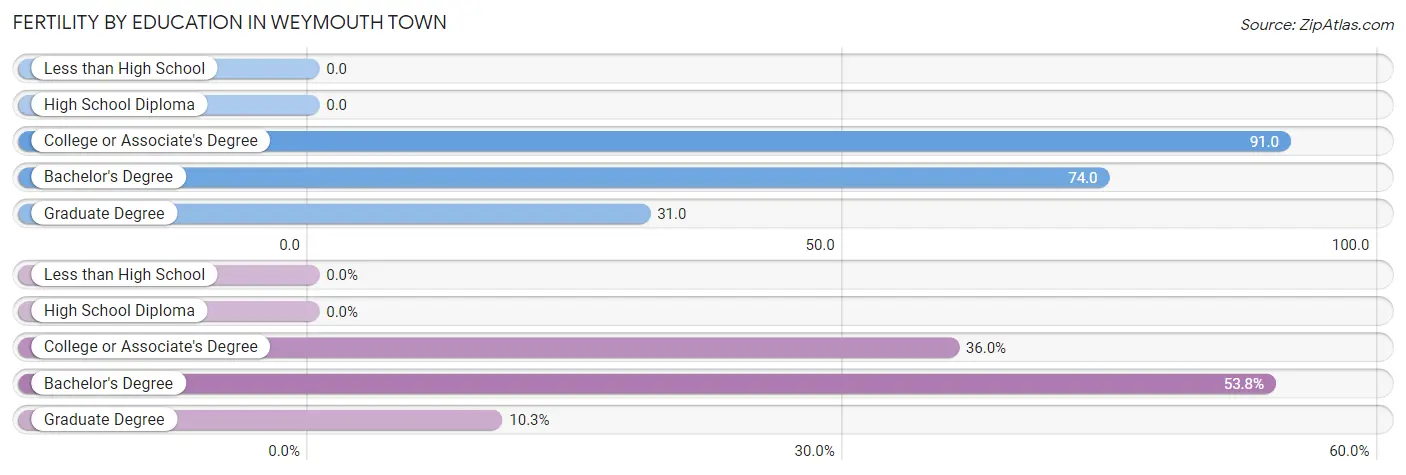
| Educational Attainment | Women with Births | Births / 1,000 Women |
| Less than High School | 0 (0.0%) | 0.0 |
| High School Diploma | 0 (0.0%) | 0.0 |
| College or Associate's Degree | 220 (35.9%) | 91.0 |
| Bachelor's Degree | 329 (53.8%) | 74.0 |
| Graduate Degree | 63 (10.3%) | 31.0 |
| Total | 612 (100.0%) | 50.0 |
Fertility by Education by Marriage Status in Weymouth Town
11.8% of women with births in Weymouth Town are unmarried. Women with the educational attainment of bachelor's degree are most likely to be married with 97.0% of them married at childbirth, while women with the educational attainment of graduate degree are least likely to be married with 23.8% of them unmarried at childbirth.
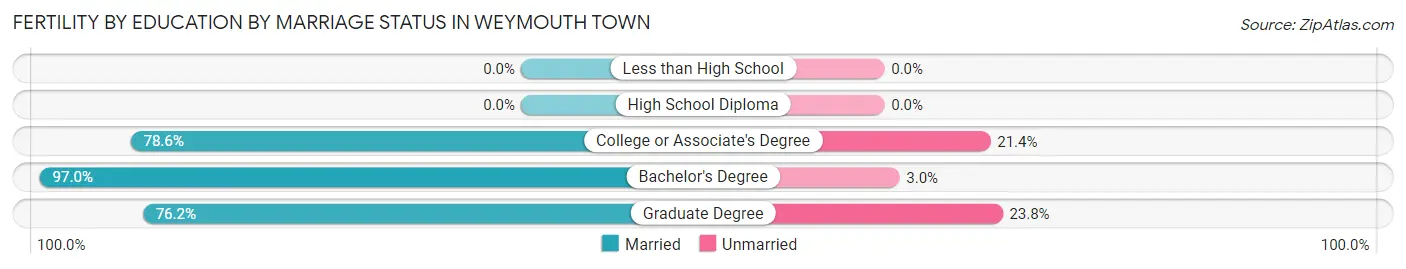
| Educational Attainment | Married | Unmarried |
| Less than High School | 0 (0.0%) | 0 (0.0%) |
| High School Diploma | 0 (0.0%) | 0 (0.0%) |
| College or Associate's Degree | 173 (78.6%) | 47 (21.4%) |
| Bachelor's Degree | 319 (97.0%) | 10 (3.0%) |
| Graduate Degree | 48 (76.2%) | 15 (23.8%) |
| Total | 540 (88.2%) | 72 (11.8%) |
Employment Characteristics in Weymouth Town
Employment by Class of Employer in Weymouth Town
Among the 31,311 employed individuals in Weymouth Town, private company employees (21,293 | 68.0%), not-for-profit organizations (3,731 | 11.9%), and local government employees (2,278 | 7.3%) make up the most common classes of employment.
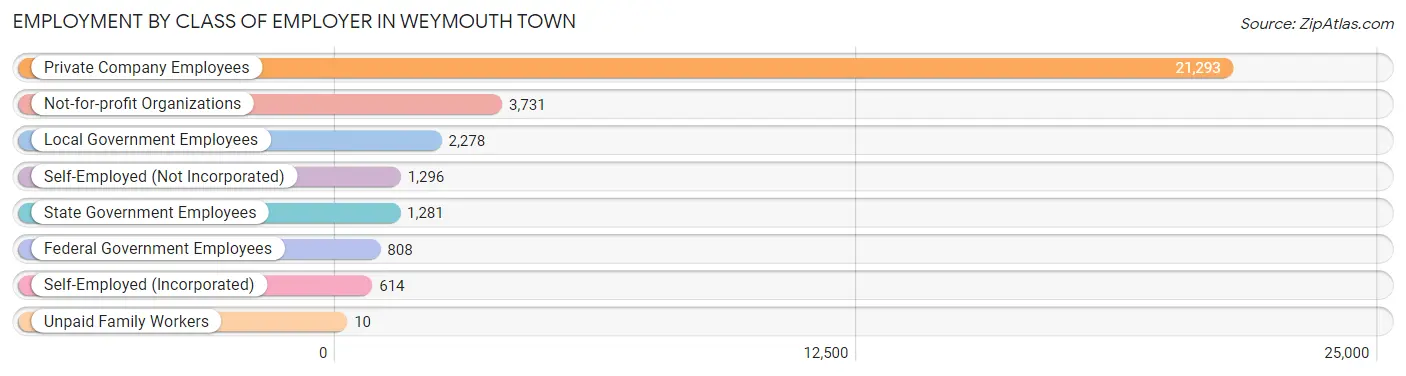
| Employer Class | # Employees | % Employees |
| Private Company Employees | 21,293 | 68.0% |
| Self-Employed (Incorporated) | 614 | 2.0% |
| Self-Employed (Not Incorporated) | 1,296 | 4.1% |
| Not-for-profit Organizations | 3,731 | 11.9% |
| Local Government Employees | 2,278 | 7.3% |
| State Government Employees | 1,281 | 4.1% |
| Federal Government Employees | 808 | 2.6% |
| Unpaid Family Workers | 10 | 0.0% |
| Total | 31,311 | 100.0% |
Employment Status by Age in Weymouth Town
According to the labor force statistics for Weymouth Town, out of the total population over 16 years of age (49,107), 69.3% or 34,031 individuals are in the labor force, with 4.7% or 1,599 of them unemployed. The age group with the highest labor force participation rate is 45 to 54 years, with 92.1% or 6,828 individuals in the labor force. Within the labor force, the 16 to 19 years age range has the highest percentage of unemployed individuals, with 10.5% or 127 of them being unemployed.
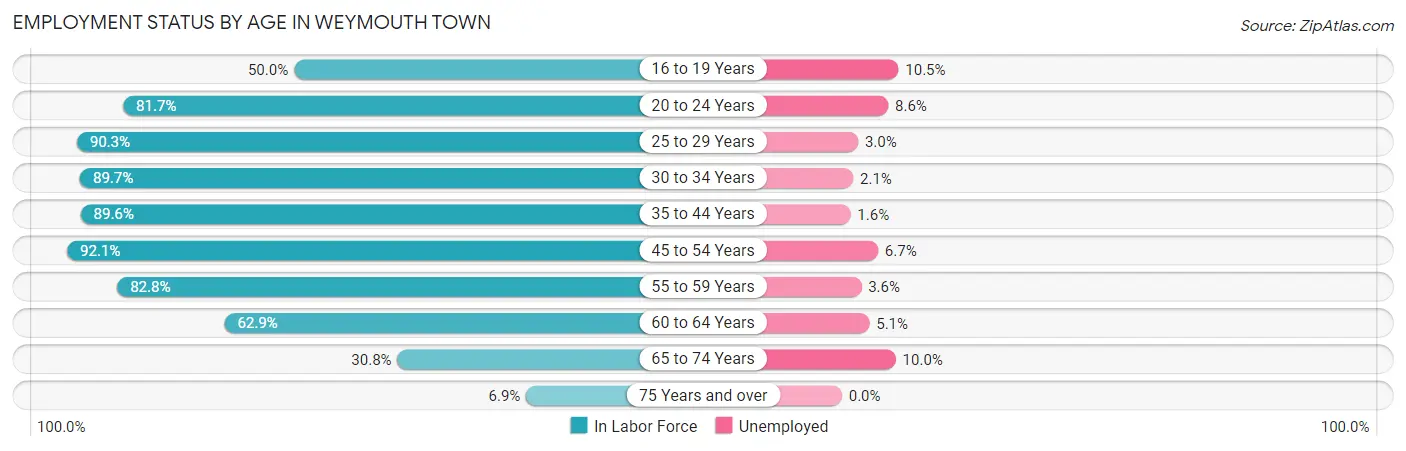
| Age Bracket | In Labor Force | Unemployed |
| 16 to 19 Years | 1,212 (50.0%) | 127 (10.5%) |
| 20 to 24 Years | 2,775 (81.7%) | 239 (8.6%) |
| 25 to 29 Years | 3,356 (90.3%) | 101 (3.0%) |
| 30 to 34 Years | 3,657 (89.7%) | 77 (2.1%) |
| 35 to 44 Years | 6,553 (89.6%) | 105 (1.6%) |
| 45 to 54 Years | 6,828 (92.1%) | 457 (6.7%) |
| 55 to 59 Years | 4,329 (82.8%) | 156 (3.6%) |
| 60 to 64 Years | 2,976 (62.9%) | 152 (5.1%) |
| 65 to 74 Years | 2,083 (30.8%) | 208 (10.0%) |
| 75 Years and over | 279 (6.9%) | 0 (0.0%) |
| Total | 34,031 (69.3%) | 1,599 (4.7%) |
Employment Status by Educational Attainment in Weymouth Town
According to labor force statistics for Weymouth Town, 85.3% of individuals (27,705) out of the total population between 25 and 64 years of age (32,480) are in the labor force, with 3.7% or 1,025 of them being unemployed. The group with the highest labor force participation rate are those with the educational attainment of bachelor's degree or higher, with 92.1% or 13,757 individuals in the labor force. Within the labor force, individuals with high school diploma education have the highest percentage of unemployment, with 6.6% or 383 of them being unemployed.
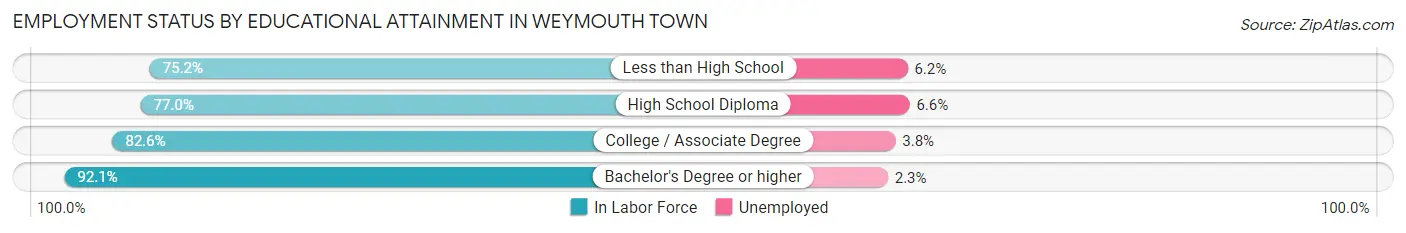
| Educational Attainment | In Labor Force | Unemployed |
| Less than High School | 1,251 (75.2%) | 103 (6.2%) |
| High School Diploma | 5,798 (77.0%) | 497 (6.6%) |
| College / Associate Degree | 6,896 (82.6%) | 317 (3.8%) |
| Bachelor's Degree or higher | 13,757 (92.1%) | 344 (2.3%) |
| Total | 27,705 (85.3%) | 1,202 (3.7%) |
Employment Occupations by Sex in Weymouth Town
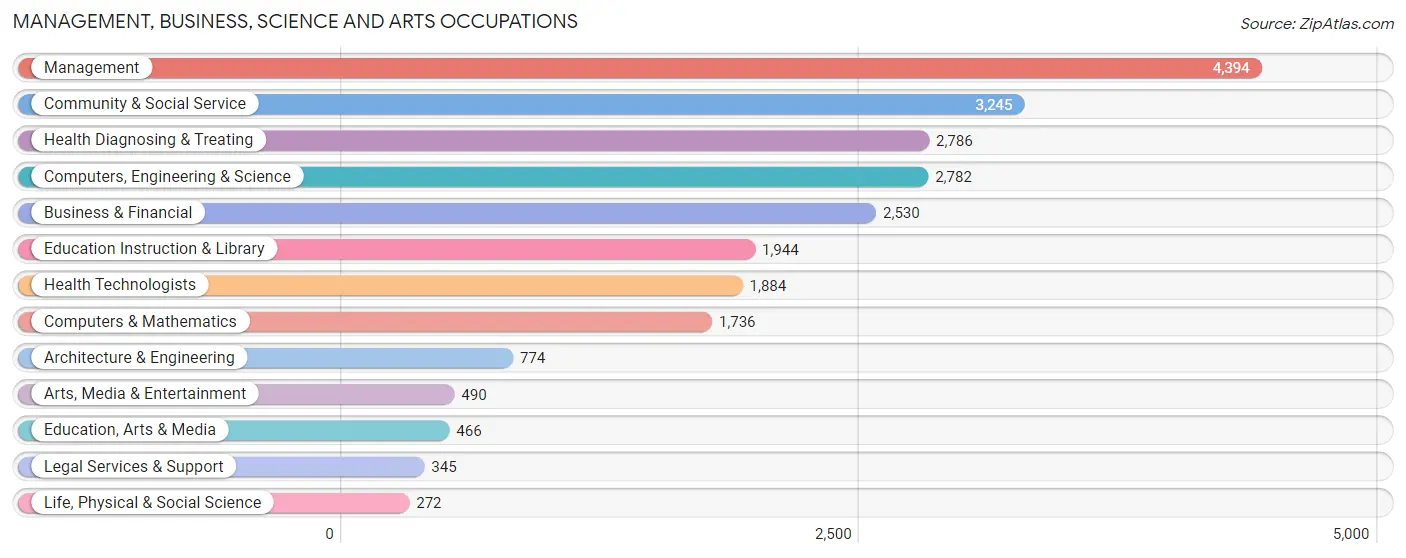
Management, Business, Science and Arts Occupations
The most common Management, Business, Science and Arts occupations in Weymouth Town are Management (4,394 | 13.6%), Community & Social Service (3,245 | 10.0%), Health Diagnosing & Treating (2,786 | 8.6%), Computers, Engineering & Science (2,782 | 8.6%), and Business & Financial (2,530 | 7.8%).
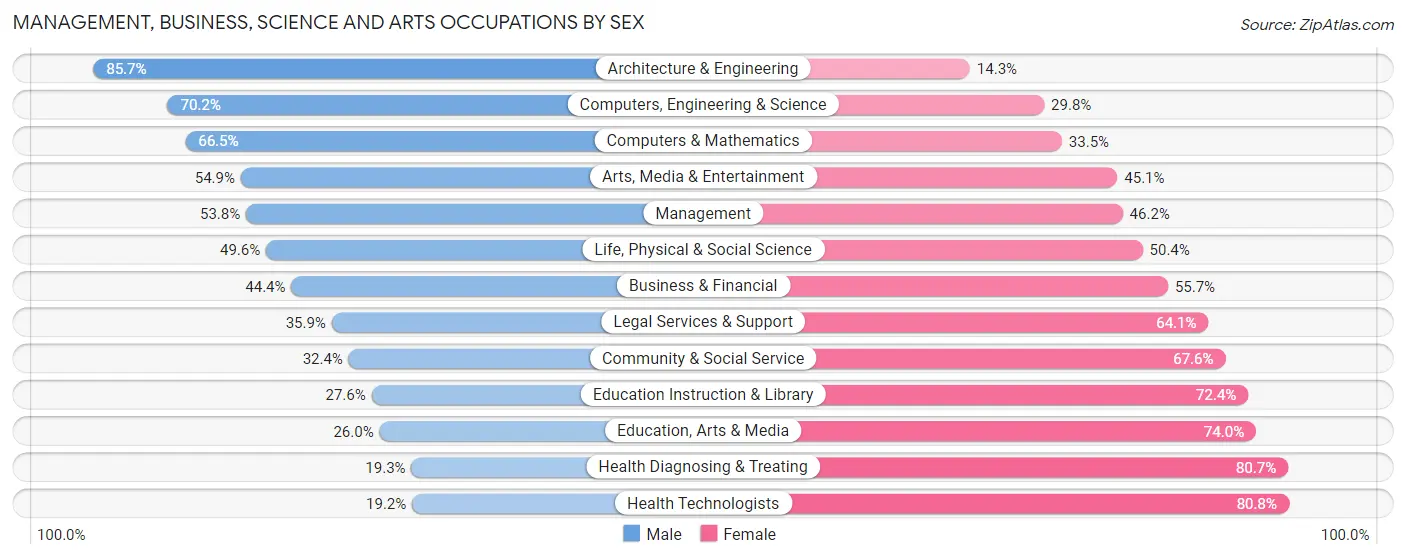
Management, Business, Science and Arts Occupations by Sex
Within the Management, Business, Science and Arts occupations in Weymouth Town, the most male-oriented occupations are Architecture & Engineering (85.7%), Computers, Engineering & Science (70.2%), and Computers & Mathematics (66.5%), while the most female-oriented occupations are Health Technologists (80.8%), Health Diagnosing & Treating (80.7%), and Education, Arts & Media (74.0%).
| Occupation | Male | Female |
| Management | 2,364 (53.8%) | 2,030 (46.2%) |
| Business & Financial | 1,122 (44.4%) | 1,408 (55.6%) |
| Computers, Engineering & Science | 1,952 (70.2%) | 830 (29.8%) |
| Computers & Mathematics | 1,154 (66.5%) | 582 (33.5%) |
| Architecture & Engineering | 663 (85.7%) | 111 (14.3%) |
| Life, Physical & Social Science | 135 (49.6%) | 137 (50.4%) |
| Community & Social Service | 1,051 (32.4%) | 2,194 (67.6%) |
| Education, Arts & Media | 121 (26.0%) | 345 (74.0%) |
| Legal Services & Support | 124 (35.9%) | 221 (64.1%) |
| Education Instruction & Library | 537 (27.6%) | 1,407 (72.4%) |
| Arts, Media & Entertainment | 269 (54.9%) | 221 (45.1%) |
| Health Diagnosing & Treating | 538 (19.3%) | 2,248 (80.7%) |
| Health Technologists | 361 (19.2%) | 1,523 (80.8%) |
| Total (Category) | 7,027 (44.7%) | 8,710 (55.3%) |
| Total (Overall) | 16,815 (51.9%) | 15,606 (48.1%) |
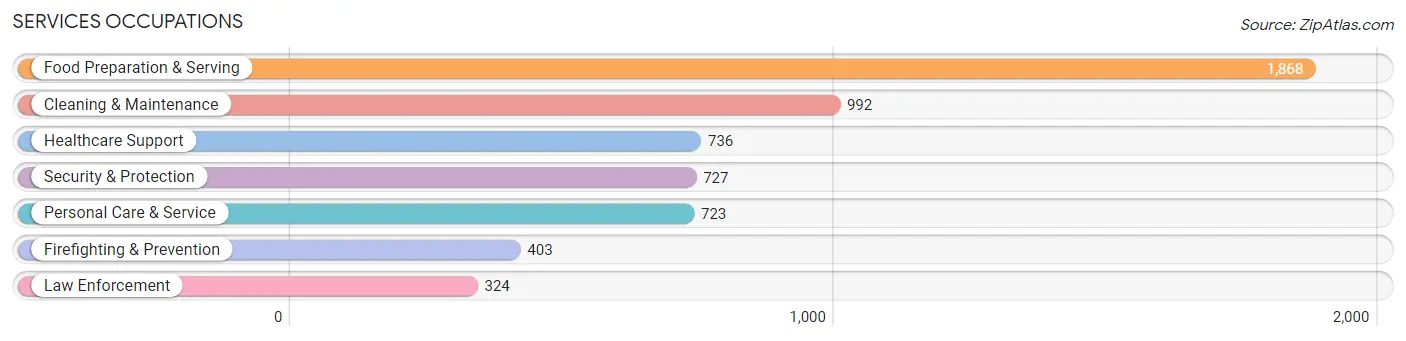
Services Occupations
The most common Services occupations in Weymouth Town are Food Preparation & Serving (1,868 | 5.8%), Cleaning & Maintenance (992 | 3.1%), Healthcare Support (736 | 2.3%), Security & Protection (727 | 2.2%), and Personal Care & Service (723 | 2.2%).
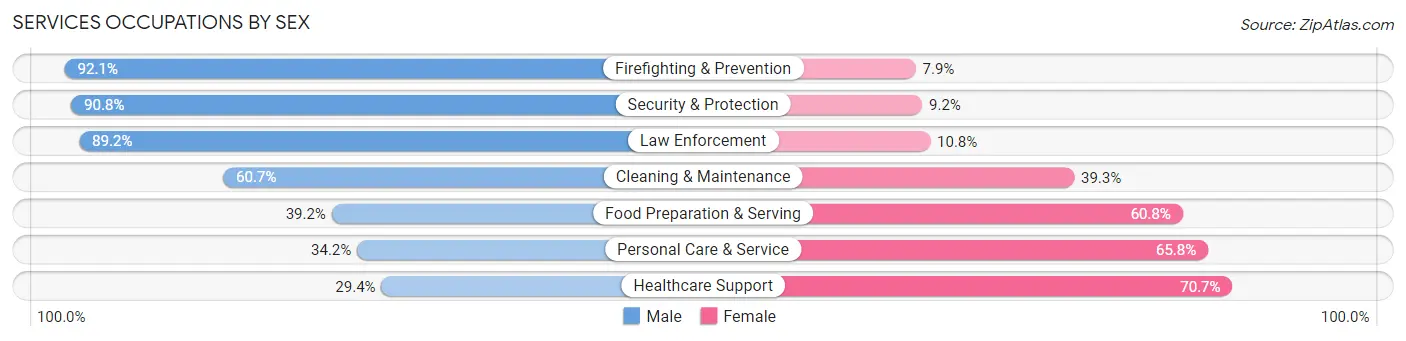
Services Occupations by Sex
Within the Services occupations in Weymouth Town, the most male-oriented occupations are Firefighting & Prevention (92.1%), Security & Protection (90.8%), and Law Enforcement (89.2%), while the most female-oriented occupations are Healthcare Support (70.7%), Personal Care & Service (65.8%), and Food Preparation & Serving (60.8%).
| Occupation | Male | Female |
| Healthcare Support | 216 (29.3%) | 520 (70.7%) |
| Security & Protection | 660 (90.8%) | 67 (9.2%) |
| Firefighting & Prevention | 371 (92.1%) | 32 (7.9%) |
| Law Enforcement | 289 (89.2%) | 35 (10.8%) |
| Food Preparation & Serving | 732 (39.2%) | 1,136 (60.8%) |
| Cleaning & Maintenance | 602 (60.7%) | 390 (39.3%) |
| Personal Care & Service | 247 (34.2%) | 476 (65.8%) |
| Total (Category) | 2,457 (48.7%) | 2,589 (51.3%) |
| Total (Overall) | 16,815 (51.9%) | 15,606 (48.1%) |
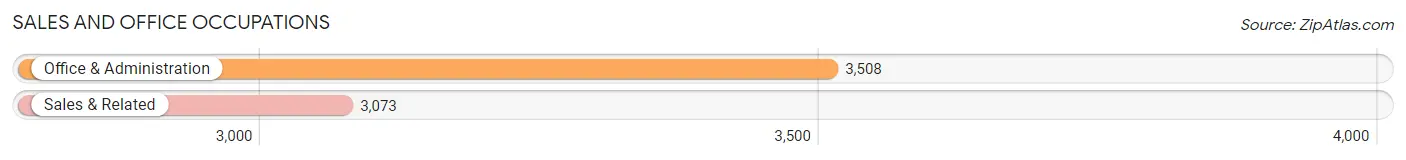
Sales and Office Occupations
The most common Sales and Office occupations in Weymouth Town are Office & Administration (3,508 | 10.8%), and Sales & Related (3,073 | 9.5%).
Sales and Office Occupations by Sex
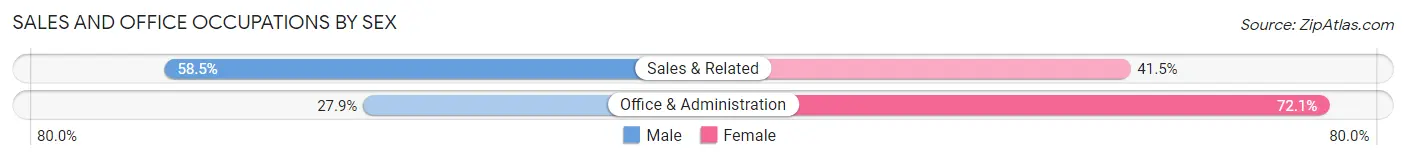
| Occupation | Male | Female |
| Sales & Related | 1,797 (58.5%) | 1,276 (41.5%) |
| Office & Administration | 979 (27.9%) | 2,529 (72.1%) |
| Total (Category) | 2,776 (42.2%) | 3,805 (57.8%) |
| Total (Overall) | 16,815 (51.9%) | 15,606 (48.1%) |
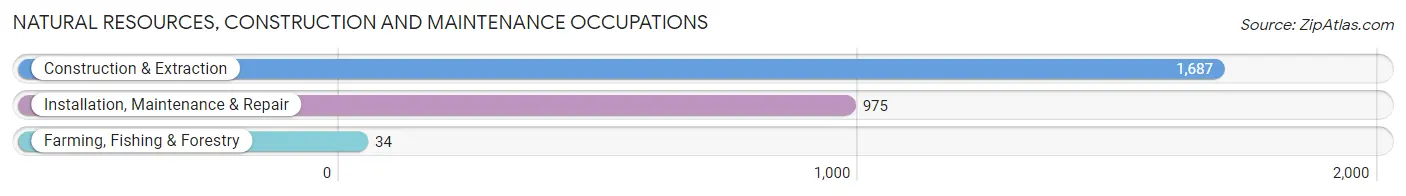
Natural Resources, Construction and Maintenance Occupations
The most common Natural Resources, Construction and Maintenance occupations in Weymouth Town are Construction & Extraction (1,687 | 5.2%), Installation, Maintenance & Repair (975 | 3.0%), and Farming, Fishing & Forestry (34 | 0.1%).
Natural Resources, Construction and Maintenance Occupations by Sex
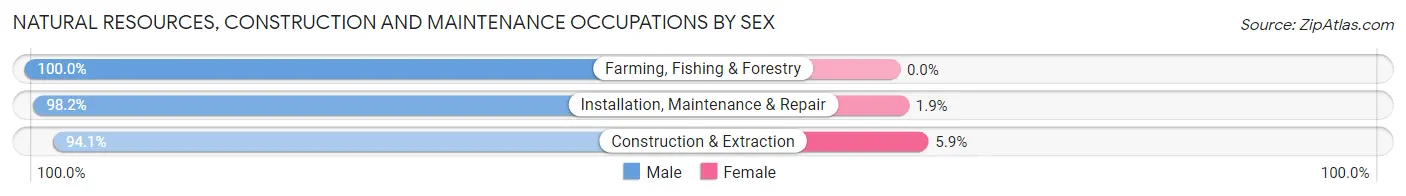
| Occupation | Male | Female |
| Farming, Fishing & Forestry | 34 (100.0%) | 0 (0.0%) |
| Construction & Extraction | 1,587 (94.1%) | 100 (5.9%) |
| Installation, Maintenance & Repair | 957 (98.2%) | 18 (1.8%) |
| Total (Category) | 2,578 (95.6%) | 118 (4.4%) |
| Total (Overall) | 16,815 (51.9%) | 15,606 (48.1%) |
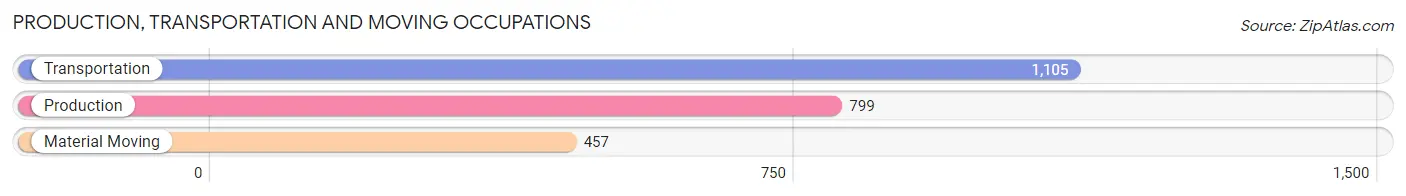
Production, Transportation and Moving Occupations
The most common Production, Transportation and Moving occupations in Weymouth Town are Transportation (1,105 | 3.4%), Production (799 | 2.5%), and Material Moving (457 | 1.4%).
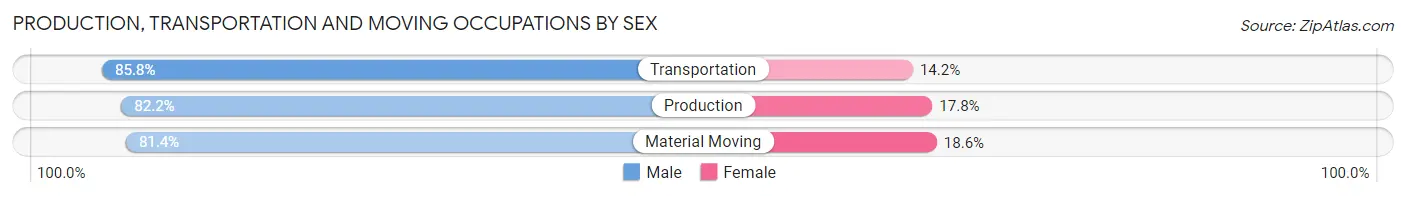
Production, Transportation and Moving Occupations by Sex
| Occupation | Male | Female |
| Production | 657 (82.2%) | 142 (17.8%) |
| Transportation | 948 (85.8%) | 157 (14.2%) |
| Material Moving | 372 (81.4%) | 85 (18.6%) |
| Total (Category) | 1,977 (83.7%) | 384 (16.3%) |
| Total (Overall) | 16,815 (51.9%) | 15,606 (48.1%) |
Employment Industries by Sex in Weymouth Town
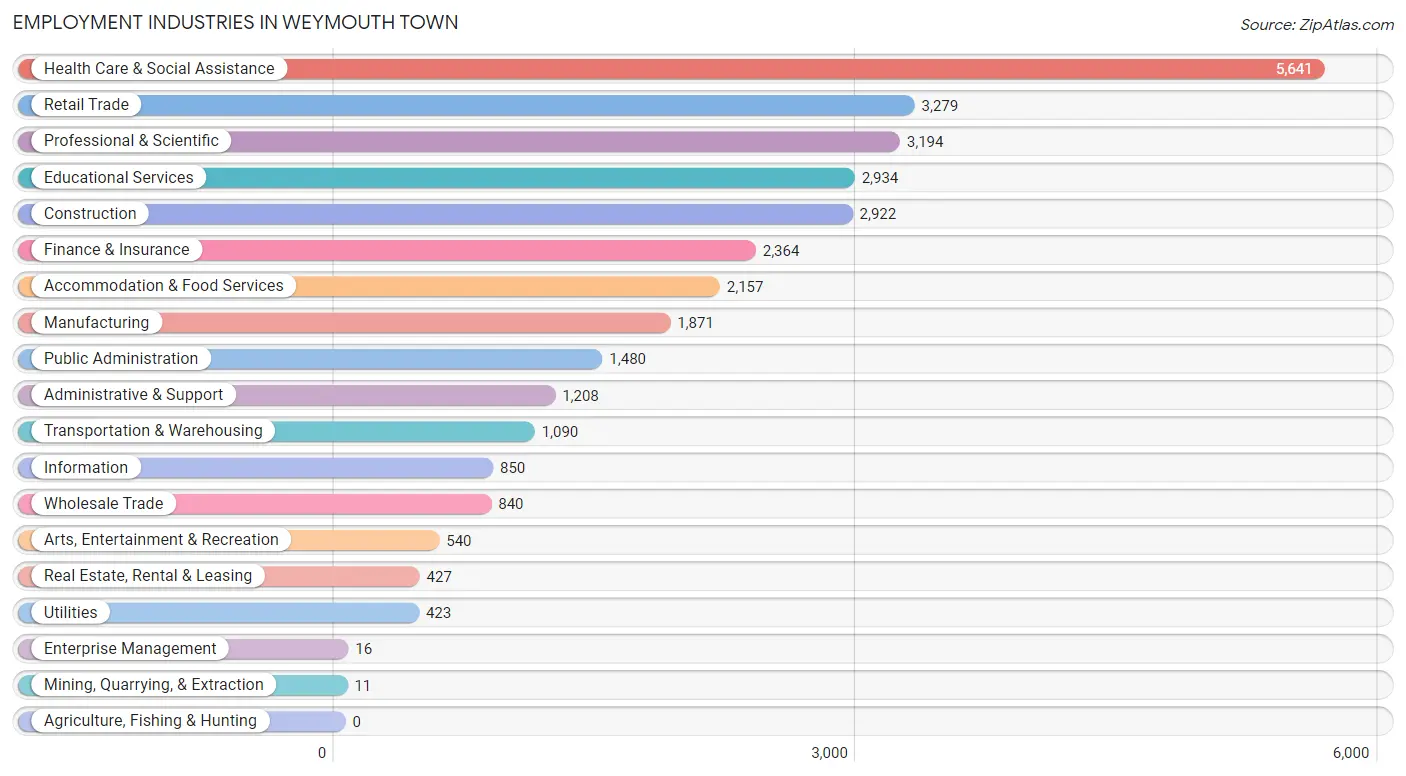
Employment Industries in Weymouth Town
The major employment industries in Weymouth Town include Health Care & Social Assistance (5,641 | 17.4%), Retail Trade (3,279 | 10.1%), Professional & Scientific (3,194 | 9.9%), Educational Services (2,934 | 9.0%), and Construction (2,922 | 9.0%).
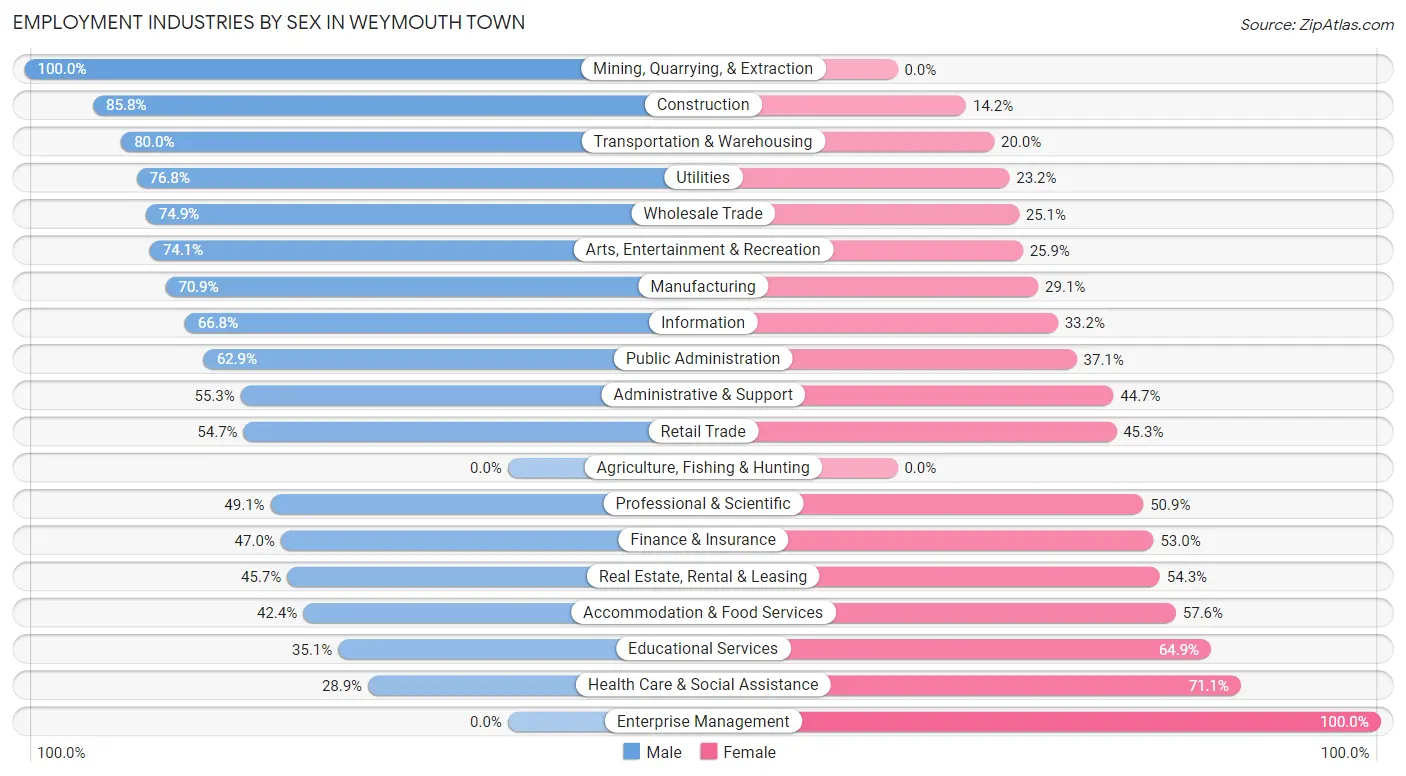
Employment Industries by Sex in Weymouth Town
The Weymouth Town industries that see more men than women are Mining, Quarrying, & Extraction (100.0%), Construction (85.8%), and Transportation & Warehousing (80.0%), whereas the industries that tend to have a higher number of women are Enterprise Management (100.0%), Health Care & Social Assistance (71.1%), and Educational Services (64.9%).
| Industry | Male | Female |
| Agriculture, Fishing & Hunting | 0 (0.0%) | 0 (0.0%) |
| Mining, Quarrying, & Extraction | 11 (100.0%) | 0 (0.0%) |
| Construction | 2,507 (85.8%) | 415 (14.2%) |
| Manufacturing | 1,326 (70.9%) | 545 (29.1%) |
| Wholesale Trade | 629 (74.9%) | 211 (25.1%) |
| Retail Trade | 1,794 (54.7%) | 1,485 (45.3%) |
| Transportation & Warehousing | 872 (80.0%) | 218 (20.0%) |
| Utilities | 325 (76.8%) | 98 (23.2%) |
| Information | 568 (66.8%) | 282 (33.2%) |
| Finance & Insurance | 1,111 (47.0%) | 1,253 (53.0%) |
| Real Estate, Rental & Leasing | 195 (45.7%) | 232 (54.3%) |
| Professional & Scientific | 1,569 (49.1%) | 1,625 (50.9%) |
| Enterprise Management | 0 (0.0%) | 16 (100.0%) |
| Administrative & Support | 668 (55.3%) | 540 (44.7%) |
| Educational Services | 1,030 (35.1%) | 1,904 (64.9%) |
| Health Care & Social Assistance | 1,632 (28.9%) | 4,009 (71.1%) |
| Arts, Entertainment & Recreation | 400 (74.1%) | 140 (25.9%) |
| Accommodation & Food Services | 914 (42.4%) | 1,243 (57.6%) |
| Public Administration | 931 (62.9%) | 549 (37.1%) |
| Total | 16,815 (51.9%) | 15,606 (48.1%) |
Education in Weymouth Town
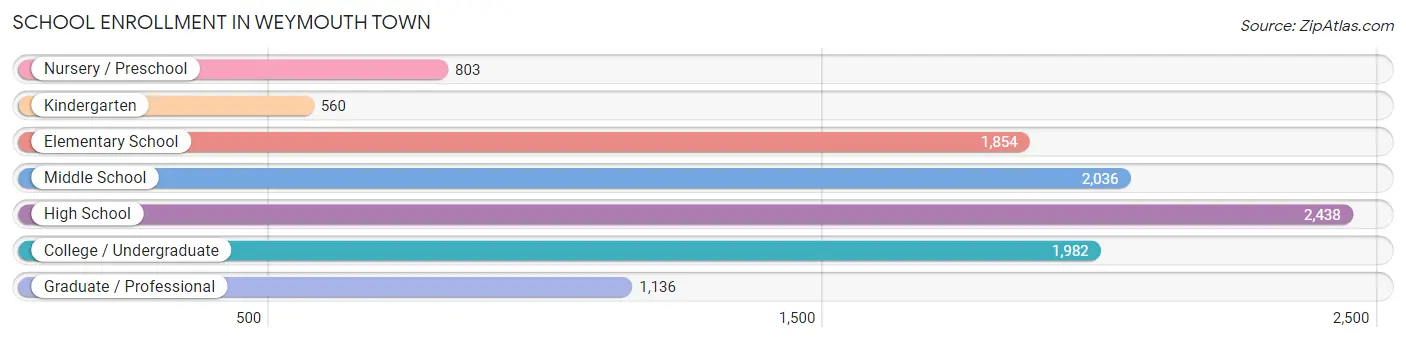
School Enrollment in Weymouth Town
The most common levels of schooling among the 10,809 students in Weymouth Town are high school (2,438 | 22.6%), middle school (2,036 | 18.8%), and college / undergraduate (1,982 | 18.3%).
| School Level | # Students | % Students |
| Nursery / Preschool | 803 | 7.4% |
| Kindergarten | 560 | 5.2% |
| Elementary School | 1,854 | 17.2% |
| Middle School | 2,036 | 18.8% |
| High School | 2,438 | 22.6% |
| College / Undergraduate | 1,982 | 18.3% |
| Graduate / Professional | 1,136 | 10.5% |
| Total | 10,809 | 100.0% |
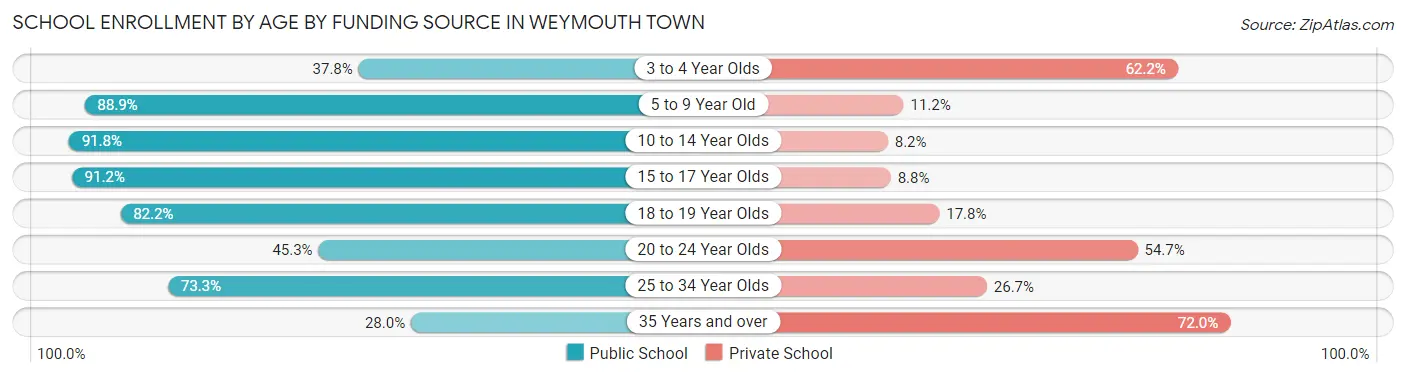
School Enrollment by Age by Funding Source in Weymouth Town
Out of a total of 10,809 students who are enrolled in schools in Weymouth Town, 2,529 (23.4%) attend a private institution, while the remaining 8,280 (76.6%) are enrolled in public schools. The age group of 35 years and over has the highest likelihood of being enrolled in private schools, with 362 (72.0% in the age bracket) enrolled. Conversely, the age group of 10 to 14 year olds has the lowest likelihood of being enrolled in a private school, with 2,310 (91.8% in the age bracket) attending a public institution.
| Age Bracket | Public School | Private School |
| 3 to 4 Year Olds | 257 (37.8%) | 423 (62.2%) |
| 5 to 9 Year Old | 1,984 (88.8%) | 249 (11.2%) |
| 10 to 14 Year Olds | 2,310 (91.8%) | 207 (8.2%) |
| 15 to 17 Year Olds | 1,739 (91.2%) | 167 (8.8%) |
| 18 to 19 Year Olds | 563 (82.2%) | 122 (17.8%) |
| 20 to 24 Year Olds | 622 (45.3%) | 752 (54.7%) |
| 25 to 34 Year Olds | 668 (73.3%) | 243 (26.7%) |
| 35 Years and over | 141 (28.0%) | 362 (72.0%) |
| Total | 8,280 (76.6%) | 2,529 (23.4%) |
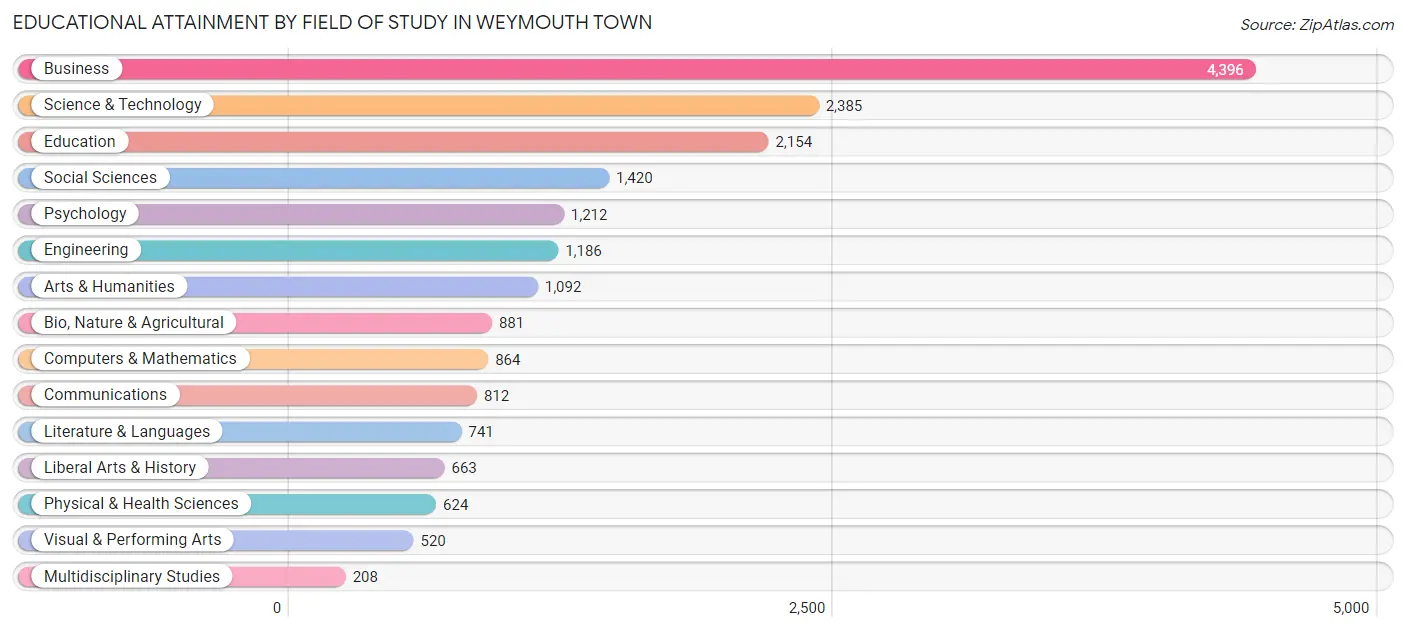
Educational Attainment by Field of Study in Weymouth Town
Business (4,396 | 23.0%), science & technology (2,385 | 12.4%), education (2,154 | 11.2%), social sciences (1,420 | 7.4%), and psychology (1,212 | 6.3%) are the most common fields of study among 19,158 individuals in Weymouth Town who have obtained a bachelor's degree or higher.
| Field of Study | # Graduates | % Graduates |
| Computers & Mathematics | 864 | 4.5% |
| Bio, Nature & Agricultural | 881 | 4.6% |
| Physical & Health Sciences | 624 | 3.3% |
| Psychology | 1,212 | 6.3% |
| Social Sciences | 1,420 | 7.4% |
| Engineering | 1,186 | 6.2% |
| Multidisciplinary Studies | 208 | 1.1% |
| Science & Technology | 2,385 | 12.4% |
| Business | 4,396 | 23.0% |
| Education | 2,154 | 11.2% |
| Literature & Languages | 741 | 3.9% |
| Liberal Arts & History | 663 | 3.5% |
| Visual & Performing Arts | 520 | 2.7% |
| Communications | 812 | 4.2% |
| Arts & Humanities | 1,092 | 5.7% |
| Total | 19,158 | 100.0% |
Transportation & Commute in Weymouth Town
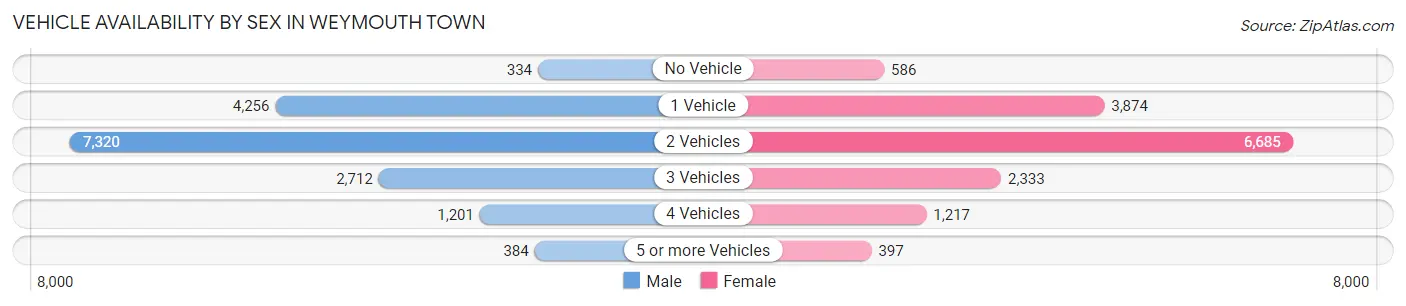
Vehicle Availability by Sex in Weymouth Town
The most prevalent vehicle ownership categories in Weymouth Town are males with 2 vehicles (7,320, accounting for 45.2%) and females with 2 vehicles (6,685, making up 48.5%).
| Vehicles Available | Male | Female |
| No Vehicle | 334 (2.1%) | 586 (3.9%) |
| 1 Vehicle | 4,256 (26.3%) | 3,874 (25.7%) |
| 2 Vehicles | 7,320 (45.2%) | 6,685 (44.3%) |
| 3 Vehicles | 2,712 (16.7%) | 2,333 (15.5%) |
| 4 Vehicles | 1,201 (7.4%) | 1,217 (8.1%) |
| 5 or more Vehicles | 384 (2.4%) | 397 (2.6%) |
| Total | 16,207 (100.0%) | 15,092 (100.0%) |
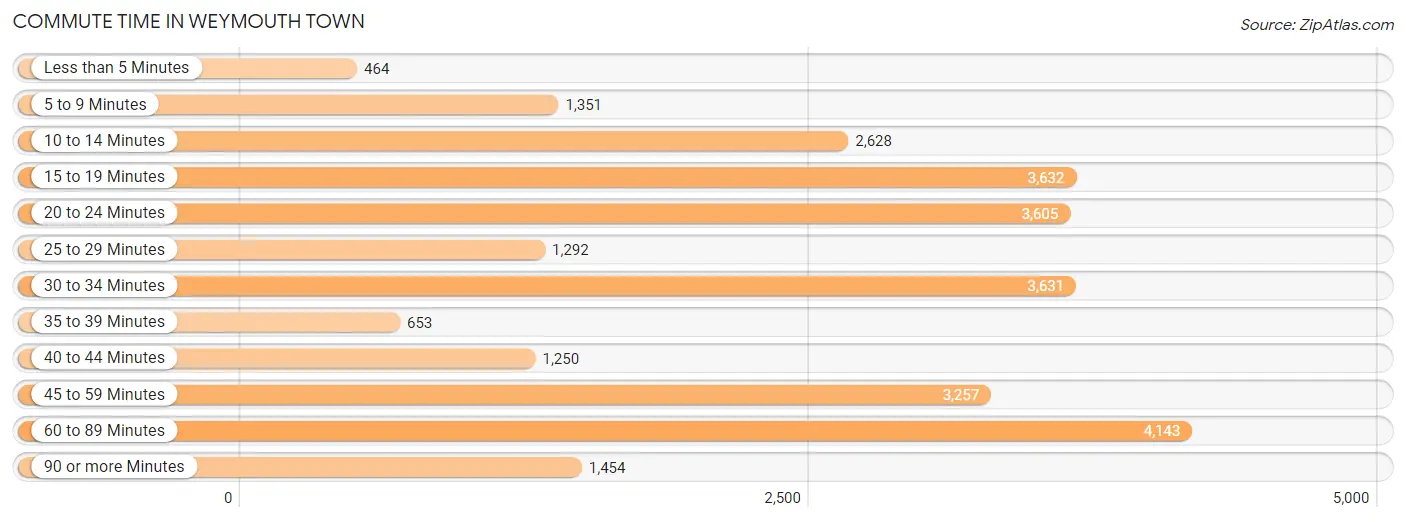
Commute Time in Weymouth Town
The most frequently occuring commute durations in Weymouth Town are 60 to 89 minutes (4,143 commuters, 15.1%), 15 to 19 minutes (3,632 commuters, 13.3%), and 30 to 34 minutes (3,631 commuters, 13.3%).
| Commute Time | # Commuters | % Commuters |
| Less than 5 Minutes | 464 | 1.7% |
| 5 to 9 Minutes | 1,351 | 4.9% |
| 10 to 14 Minutes | 2,628 | 9.6% |
| 15 to 19 Minutes | 3,632 | 13.3% |
| 20 to 24 Minutes | 3,605 | 13.2% |
| 25 to 29 Minutes | 1,292 | 4.7% |
| 30 to 34 Minutes | 3,631 | 13.3% |
| 35 to 39 Minutes | 653 | 2.4% |
| 40 to 44 Minutes | 1,250 | 4.6% |
| 45 to 59 Minutes | 3,257 | 11.9% |
| 60 to 89 Minutes | 4,143 | 15.1% |
| 90 or more Minutes | 1,454 | 5.3% |
Commute Time by Sex in Weymouth Town
The most common commute times in Weymouth Town are 60 to 89 minutes (2,160 commuters, 14.9%) for males and 60 to 89 minutes (1,983 commuters, 15.5%) for females.
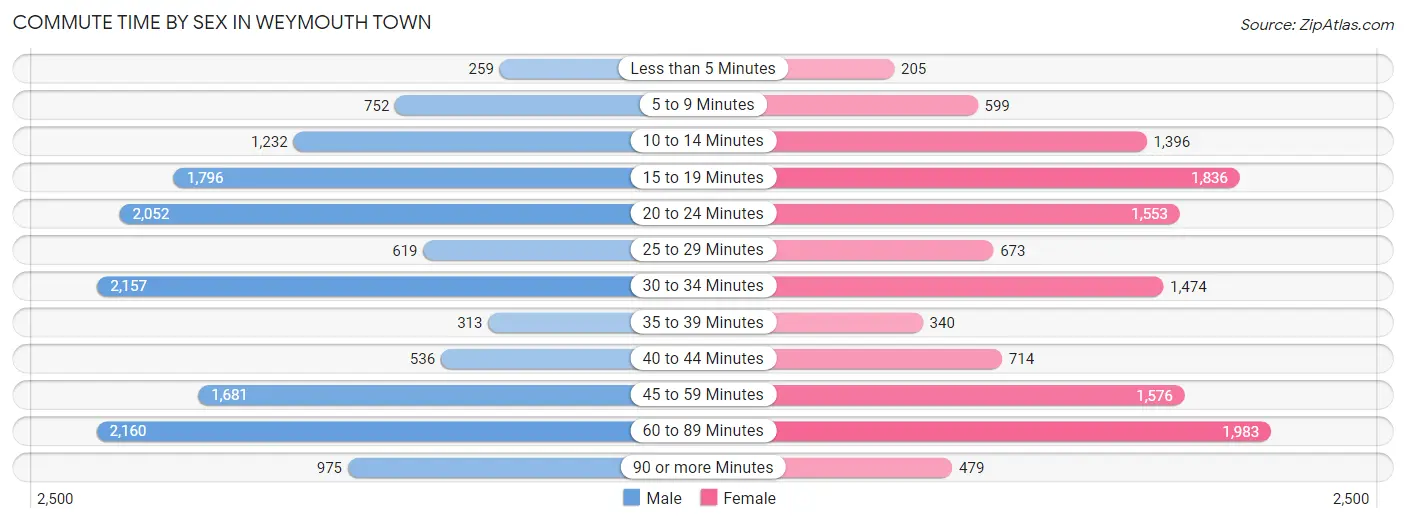
| Commute Time | Male | Female |
| Less than 5 Minutes | 259 (1.8%) | 205 (1.6%) |
| 5 to 9 Minutes | 752 (5.2%) | 599 (4.7%) |
| 10 to 14 Minutes | 1,232 (8.5%) | 1,396 (10.9%) |
| 15 to 19 Minutes | 1,796 (12.4%) | 1,836 (14.3%) |
| 20 to 24 Minutes | 2,052 (14.1%) | 1,553 (12.1%) |
| 25 to 29 Minutes | 619 (4.3%) | 673 (5.2%) |
| 30 to 34 Minutes | 2,157 (14.8%) | 1,474 (11.5%) |
| 35 to 39 Minutes | 313 (2.1%) | 340 (2.6%) |
| 40 to 44 Minutes | 536 (3.7%) | 714 (5.6%) |
| 45 to 59 Minutes | 1,681 (11.6%) | 1,576 (12.3%) |
| 60 to 89 Minutes | 2,160 (14.9%) | 1,983 (15.5%) |
| 90 or more Minutes | 975 (6.7%) | 479 (3.7%) |
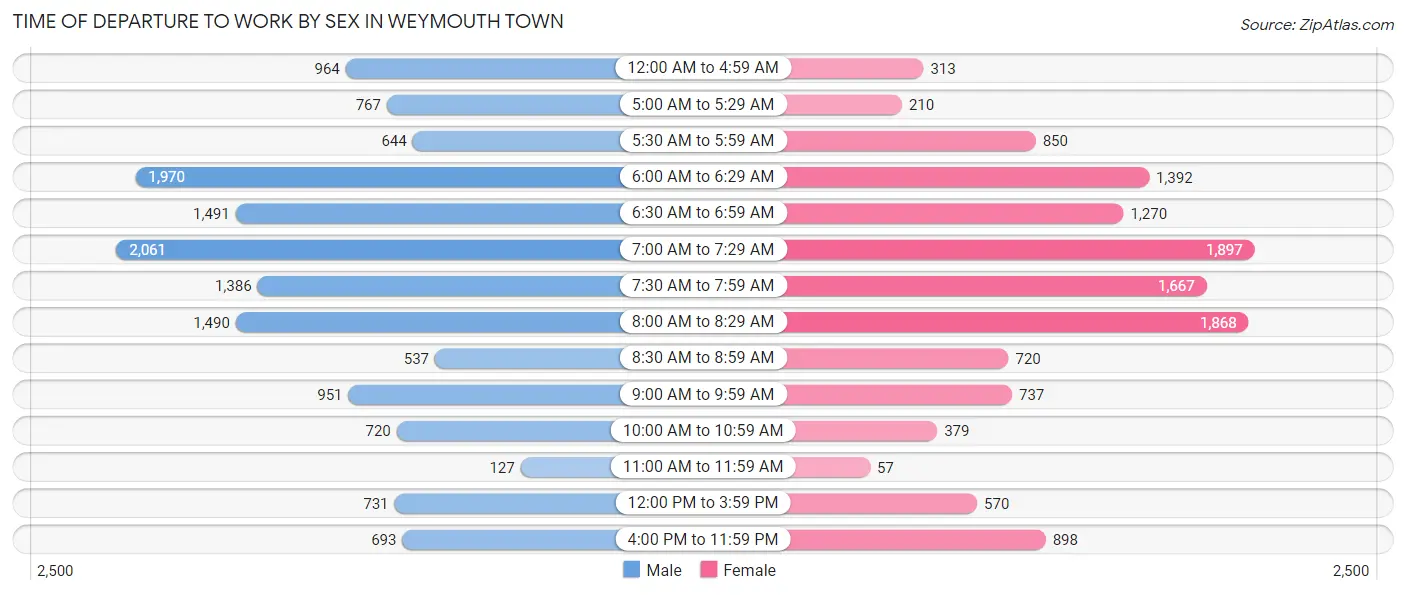
Time of Departure to Work by Sex in Weymouth Town
The most frequent times of departure to work in Weymouth Town are 7:00 AM to 7:29 AM (2,061, 14.2%) for males and 7:00 AM to 7:29 AM (1,897, 14.8%) for females.
| Time of Departure | Male | Female |
| 12:00 AM to 4:59 AM | 964 (6.6%) | 313 (2.4%) |
| 5:00 AM to 5:29 AM | 767 (5.3%) | 210 (1.6%) |
| 5:30 AM to 5:59 AM | 644 (4.4%) | 850 (6.6%) |
| 6:00 AM to 6:29 AM | 1,970 (13.6%) | 1,392 (10.8%) |
| 6:30 AM to 6:59 AM | 1,491 (10.3%) | 1,270 (9.9%) |
| 7:00 AM to 7:29 AM | 2,061 (14.2%) | 1,897 (14.8%) |
| 7:30 AM to 7:59 AM | 1,386 (9.5%) | 1,667 (13.0%) |
| 8:00 AM to 8:29 AM | 1,490 (10.2%) | 1,868 (14.6%) |
| 8:30 AM to 8:59 AM | 537 (3.7%) | 720 (5.6%) |
| 9:00 AM to 9:59 AM | 951 (6.5%) | 737 (5.8%) |
| 10:00 AM to 10:59 AM | 720 (5.0%) | 379 (2.9%) |
| 11:00 AM to 11:59 AM | 127 (0.9%) | 57 (0.4%) |
| 12:00 PM to 3:59 PM | 731 (5.0%) | 570 (4.4%) |
| 4:00 PM to 11:59 PM | 693 (4.8%) | 898 (7.0%) |
| Total | 14,532 (100.0%) | 12,828 (100.0%) |
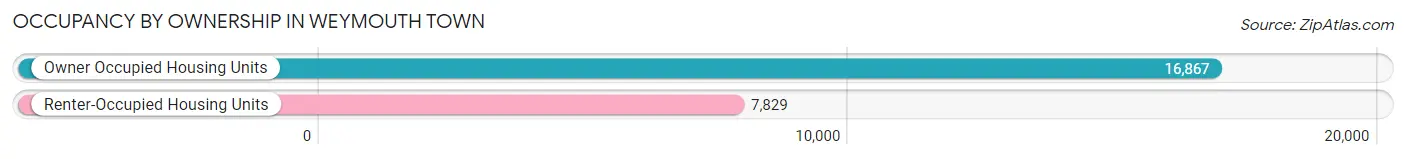
Housing Occupancy in Weymouth Town
Occupancy by Ownership in Weymouth Town
Of the total 24,696 dwellings in Weymouth Town, owner-occupied units account for 16,867 (68.3%), while renter-occupied units make up 7,829 (31.7%).
| Occupancy | # Housing Units | % Housing Units |
| Owner Occupied Housing Units | 16,867 | 68.3% |
| Renter-Occupied Housing Units | 7,829 | 31.7% |
| Total Occupied Housing Units | 24,696 | 100.0% |
Occupancy by Household Size in Weymouth Town
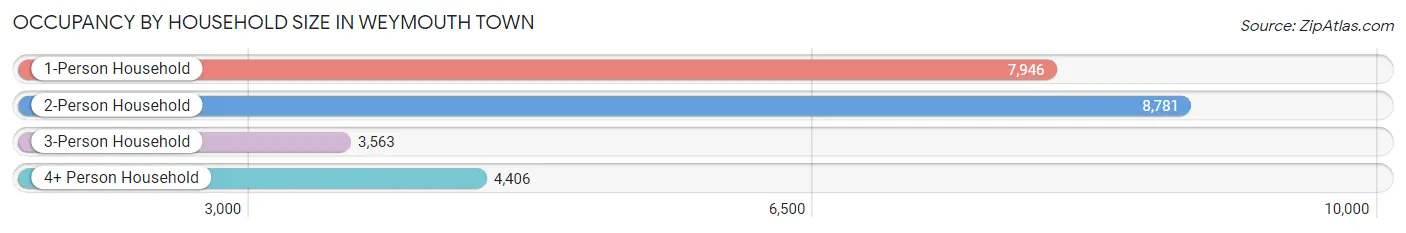
| Household Size | # Housing Units | % Housing Units |
| 1-Person Household | 7,946 | 32.2% |
| 2-Person Household | 8,781 | 35.6% |
| 3-Person Household | 3,563 | 14.4% |
| 4+ Person Household | 4,406 | 17.8% |
| Total Housing Units | 24,696 | 100.0% |
Occupancy by Ownership by Household Size in Weymouth Town
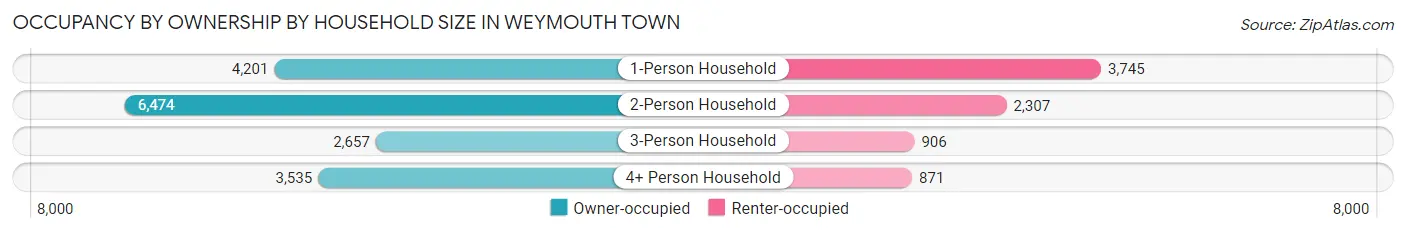
| Household Size | Owner-occupied | Renter-occupied |
| 1-Person Household | 4,201 (52.9%) | 3,745 (47.1%) |
| 2-Person Household | 6,474 (73.7%) | 2,307 (26.3%) |
| 3-Person Household | 2,657 (74.6%) | 906 (25.4%) |
| 4+ Person Household | 3,535 (80.2%) | 871 (19.8%) |
| Total Housing Units | 16,867 (68.3%) | 7,829 (31.7%) |
Occupancy by Educational Attainment in Weymouth Town
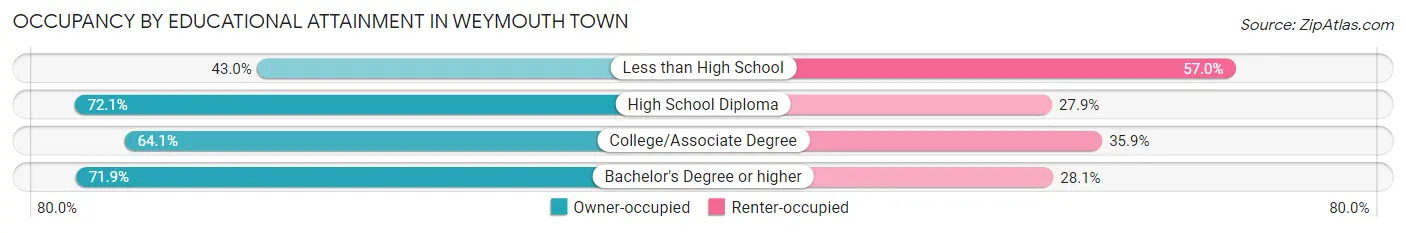
| Household Size | Owner-occupied | Renter-occupied |
| Less than High School | 473 (43.0%) | 626 (57.0%) |
| High School Diploma | 4,252 (72.1%) | 1,646 (27.9%) |
| College/Associate Degree | 4,817 (64.1%) | 2,693 (35.9%) |
| Bachelor's Degree or higher | 7,325 (71.9%) | 2,864 (28.1%) |
Occupancy by Age of Householder in Weymouth Town
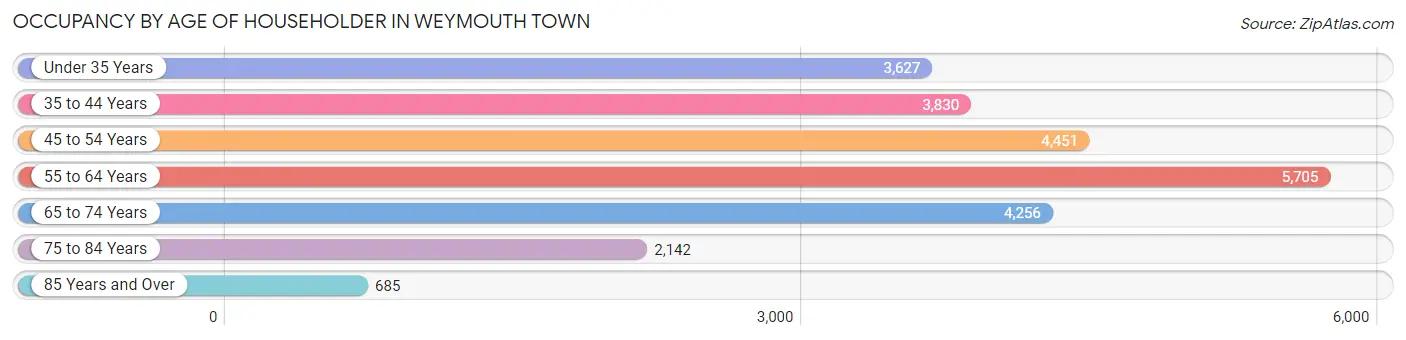
| Age Bracket | # Households | % Households |
| Under 35 Years | 3,627 | 14.7% |
| 35 to 44 Years | 3,830 | 15.5% |
| 45 to 54 Years | 4,451 | 18.0% |
| 55 to 64 Years | 5,705 | 23.1% |
| 65 to 74 Years | 4,256 | 17.2% |
| 75 to 84 Years | 2,142 | 8.7% |
| 85 Years and Over | 685 | 2.8% |
| Total | 24,696 | 100.0% |
Housing Finances in Weymouth Town
Median Income by Occupancy in Weymouth Town
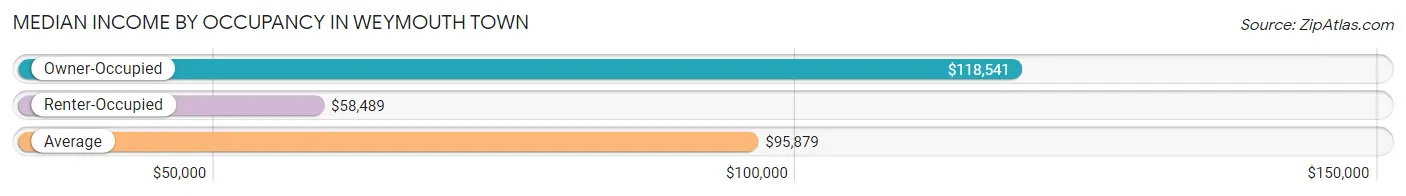
| Occupancy Type | # Households | Median Income |
| Owner-Occupied | 16,867 (68.3%) | $118,541 |
| Renter-Occupied | 7,829 (31.7%) | $58,489 |
| Average | 24,696 (100.0%) | $95,879 |
Occupancy by Householder Income Bracket in Weymouth Town
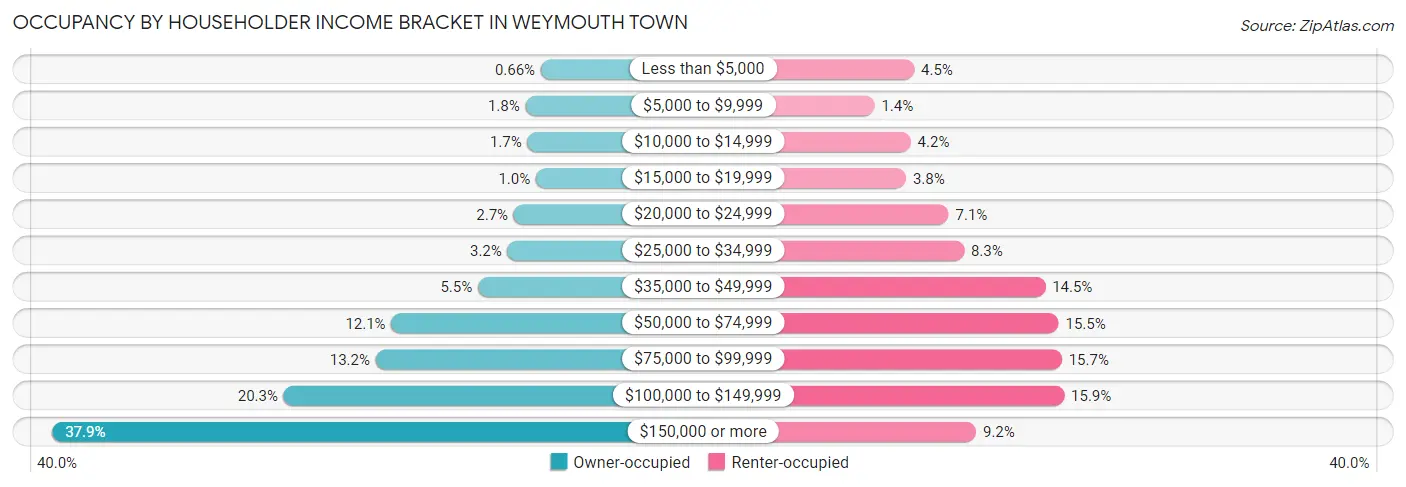
| Income Bracket | Owner-occupied | Renter-occupied |
| Less than $5,000 | 112 (0.7%) | 349 (4.5%) |
| $5,000 to $9,999 | 309 (1.8%) | 113 (1.4%) |
| $10,000 to $14,999 | 283 (1.7%) | 329 (4.2%) |
| $15,000 to $19,999 | 173 (1.0%) | 301 (3.8%) |
| $20,000 to $24,999 | 458 (2.7%) | 555 (7.1%) |
| $25,000 to $34,999 | 539 (3.2%) | 647 (8.3%) |
| $35,000 to $49,999 | 919 (5.4%) | 1,131 (14.4%) |
| $50,000 to $74,999 | 2,033 (12.0%) | 1,211 (15.5%) |
| $75,000 to $99,999 | 2,234 (13.2%) | 1,230 (15.7%) |
| $100,000 to $149,999 | 3,416 (20.3%) | 1,244 (15.9%) |
| $150,000 or more | 6,391 (37.9%) | 719 (9.2%) |
| Total | 16,867 (100.0%) | 7,829 (100.0%) |
Monthly Housing Cost Tiers in Weymouth Town
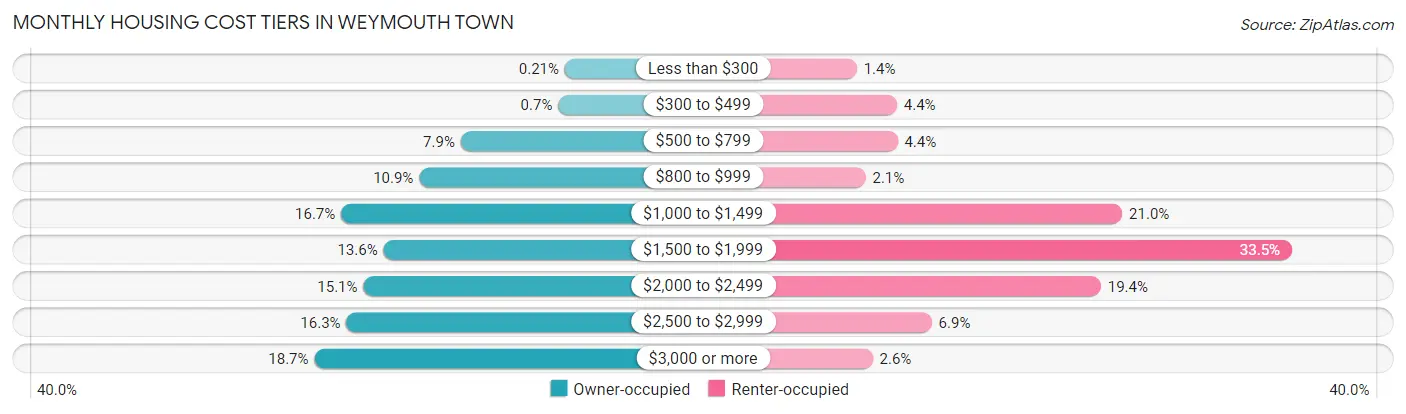
| Monthly Cost | Owner-occupied | Renter-occupied |
| Less than $300 | 35 (0.2%) | 111 (1.4%) |
| $300 to $499 | 118 (0.7%) | 343 (4.4%) |
| $500 to $799 | 1,329 (7.9%) | 346 (4.4%) |
| $800 to $999 | 1,845 (10.9%) | 162 (2.1%) |
| $1,000 to $1,499 | 2,815 (16.7%) | 1,642 (21.0%) |
| $1,500 to $1,999 | 2,289 (13.6%) | 2,620 (33.5%) |
| $2,000 to $2,499 | 2,538 (15.0%) | 1,519 (19.4%) |
| $2,500 to $2,999 | 2,750 (16.3%) | 543 (6.9%) |
| $3,000 or more | 3,148 (18.7%) | 203 (2.6%) |
| Total | 16,867 (100.0%) | 7,829 (100.0%) |
Physical Housing Characteristics in Weymouth Town
Housing Structures in Weymouth Town
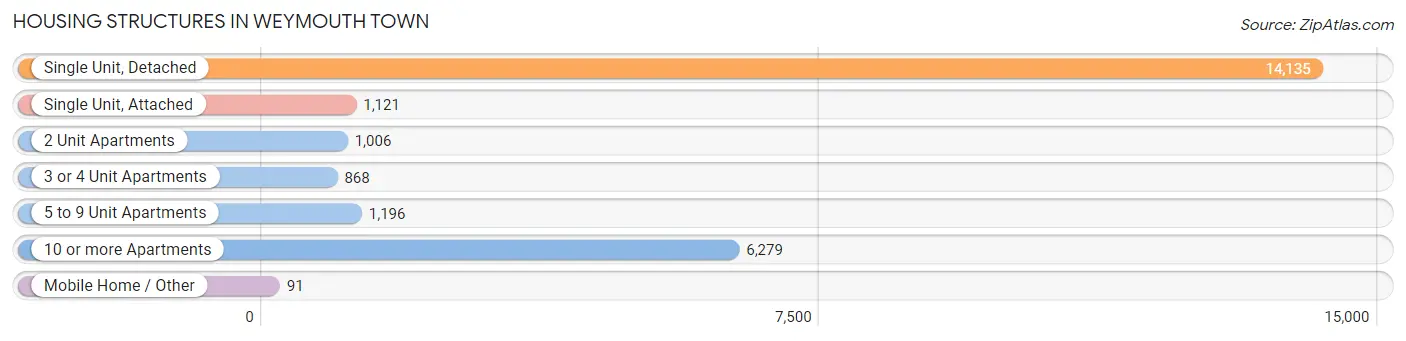
| Structure Type | # Housing Units | % Housing Units |
| Single Unit, Detached | 14,135 | 57.2% |
| Single Unit, Attached | 1,121 | 4.5% |
| 2 Unit Apartments | 1,006 | 4.1% |
| 3 or 4 Unit Apartments | 868 | 3.5% |
| 5 to 9 Unit Apartments | 1,196 | 4.8% |
| 10 or more Apartments | 6,279 | 25.4% |
| Mobile Home / Other | 91 | 0.4% |
| Total | 24,696 | 100.0% |
Housing Structures by Occupancy in Weymouth Town
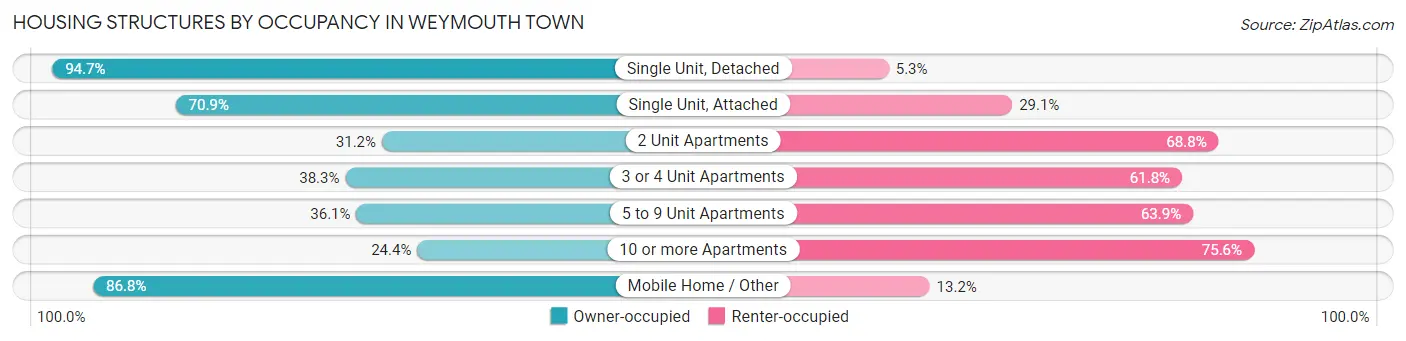
| Structure Type | Owner-occupied | Renter-occupied |
| Single Unit, Detached | 13,383 (94.7%) | 752 (5.3%) |
| Single Unit, Attached | 795 (70.9%) | 326 (29.1%) |
| 2 Unit Apartments | 314 (31.2%) | 692 (68.8%) |
| 3 or 4 Unit Apartments | 332 (38.3%) | 536 (61.8%) |
| 5 to 9 Unit Apartments | 432 (36.1%) | 764 (63.9%) |
| 10 or more Apartments | 1,532 (24.4%) | 4,747 (75.6%) |
| Mobile Home / Other | 79 (86.8%) | 12 (13.2%) |
| Total | 16,867 (68.3%) | 7,829 (31.7%) |
Housing Structures by Number of Rooms in Weymouth Town
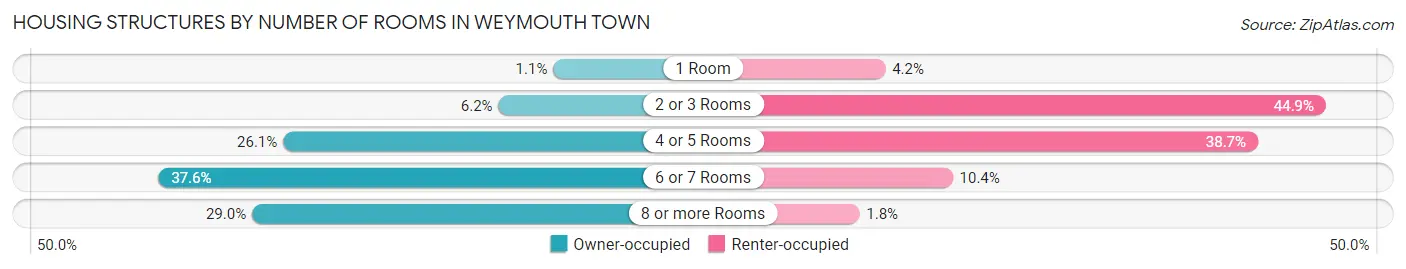
| Number of Rooms | Owner-occupied | Renter-occupied |
| 1 Room | 188 (1.1%) | 328 (4.2%) |
| 2 or 3 Rooms | 1,042 (6.2%) | 3,518 (44.9%) |
| 4 or 5 Rooms | 4,401 (26.1%) | 3,026 (38.7%) |
| 6 or 7 Rooms | 6,349 (37.6%) | 816 (10.4%) |
| 8 or more Rooms | 4,887 (29.0%) | 141 (1.8%) |
| Total | 16,867 (100.0%) | 7,829 (100.0%) |
Housing Structure by Heating Type in Weymouth Town
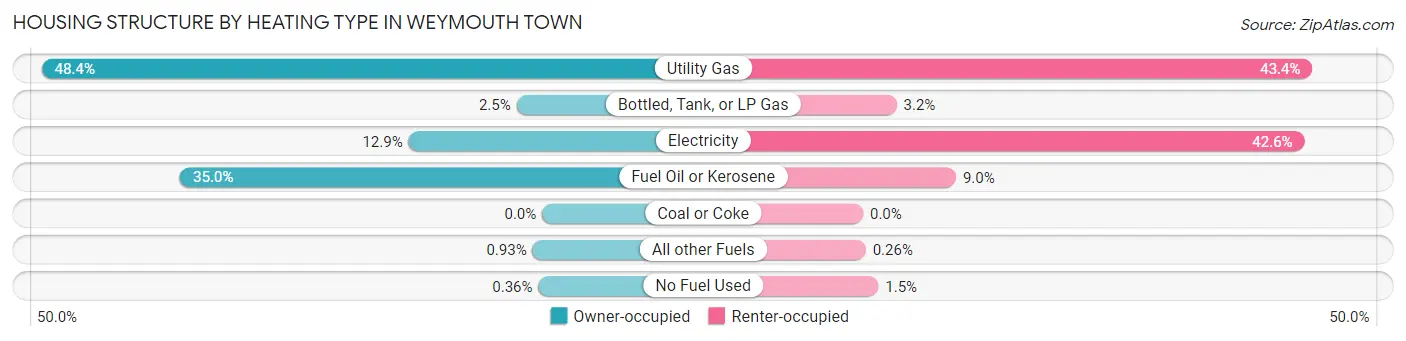
| Heating Type | Owner-occupied | Renter-occupied |
| Utility Gas | 8,157 (48.4%) | 3,398 (43.4%) |
| Bottled, Tank, or LP Gas | 417 (2.5%) | 254 (3.2%) |
| Electricity | 2,177 (12.9%) | 3,338 (42.6%) |
| Fuel Oil or Kerosene | 5,898 (35.0%) | 703 (9.0%) |
| Coal or Coke | 0 (0.0%) | 0 (0.0%) |
| All other Fuels | 157 (0.9%) | 20 (0.3%) |
| No Fuel Used | 61 (0.4%) | 116 (1.5%) |
| Total | 16,867 (100.0%) | 7,829 (100.0%) |
Household Vehicle Usage in Weymouth Town
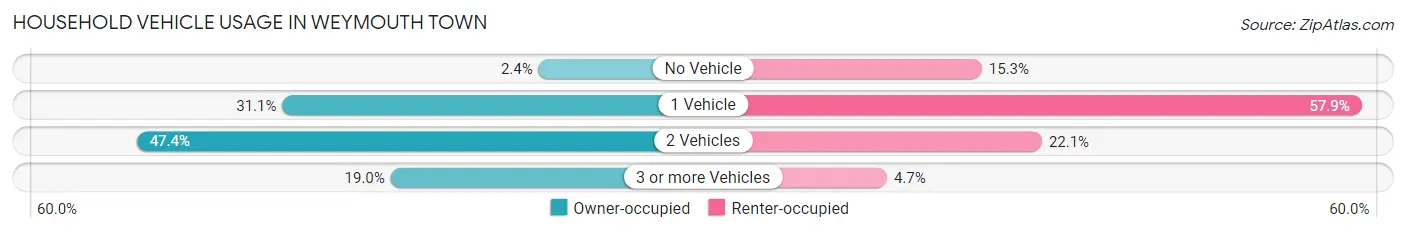
| Vehicles per Household | Owner-occupied | Renter-occupied |
| No Vehicle | 410 (2.4%) | 1,201 (15.3%) |
| 1 Vehicle | 5,250 (31.1%) | 4,531 (57.9%) |
| 2 Vehicles | 8,002 (47.4%) | 1,728 (22.1%) |
| 3 or more Vehicles | 3,205 (19.0%) | 369 (4.7%) |
| Total | 16,867 (100.0%) | 7,829 (100.0%) |
Real Estate & Mortgages in Weymouth Town
Real Estate and Mortgage Overview in Weymouth Town
| Characteristic | Without Mortgage | With Mortgage |
| Housing Units | 4,937 | 11,930 |
| Median Property Value | $466,700 | $470,400 |
| Median Household Income | $86,211 | $5,337 |
| Monthly Housing Costs | $938 | $3,130 |
| Real Estate Taxes | $4,867 | $202 |
Property Value by Mortgage Status in Weymouth Town
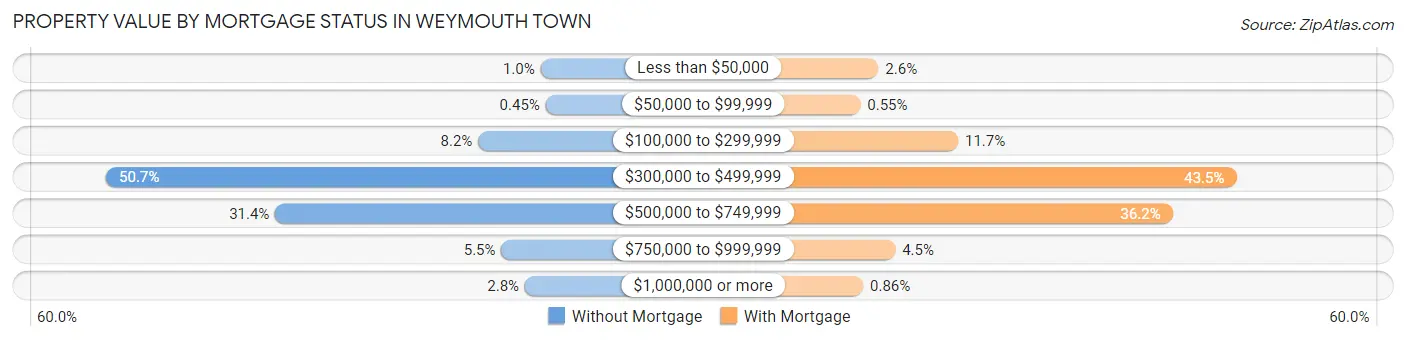
| Property Value | Without Mortgage | With Mortgage |
| Less than $50,000 | 51 (1.0%) | 311 (2.6%) |
| $50,000 to $99,999 | 22 (0.4%) | 66 (0.5%) |
| $100,000 to $299,999 | 403 (8.2%) | 1,397 (11.7%) |
| $300,000 to $499,999 | 2,502 (50.7%) | 5,191 (43.5%) |
| $500,000 to $749,999 | 1,548 (31.4%) | 4,322 (36.2%) |
| $750,000 to $999,999 | 272 (5.5%) | 540 (4.5%) |
| $1,000,000 or more | 139 (2.8%) | 103 (0.9%) |
| Total | 4,937 (100.0%) | 11,930 (100.0%) |
Household Income by Mortgage Status in Weymouth Town
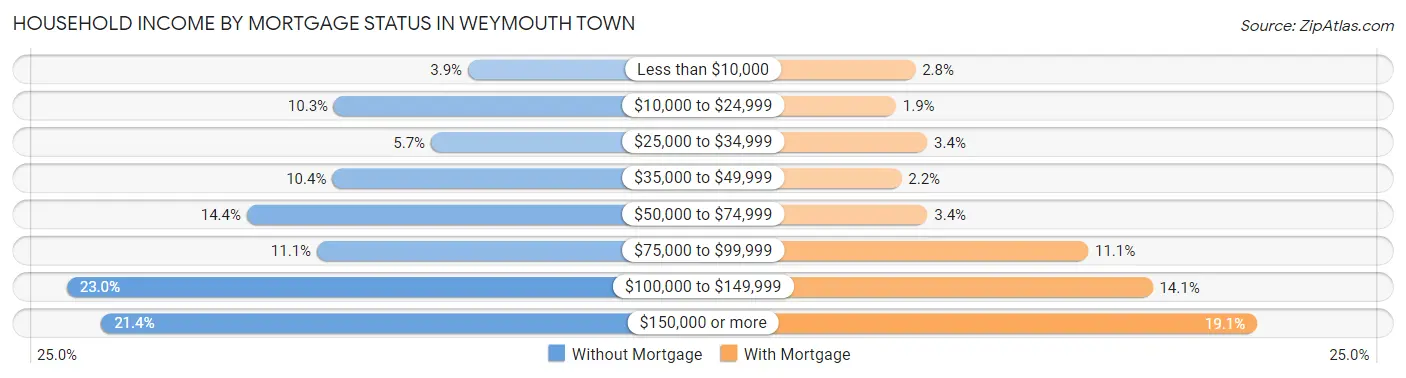
| Household Income | Without Mortgage | With Mortgage |
| Less than $10,000 | 192 (3.9%) | 339 (2.8%) |
| $10,000 to $24,999 | 507 (10.3%) | 229 (1.9%) |
| $25,000 to $34,999 | 279 (5.7%) | 407 (3.4%) |
| $35,000 to $49,999 | 511 (10.3%) | 260 (2.2%) |
| $50,000 to $74,999 | 712 (14.4%) | 408 (3.4%) |
| $75,000 to $99,999 | 547 (11.1%) | 1,321 (11.1%) |
| $100,000 to $149,999 | 1,135 (23.0%) | 1,687 (14.1%) |
| $150,000 or more | 1,054 (21.3%) | 2,281 (19.1%) |
| Total | 4,937 (100.0%) | 11,930 (100.0%) |
Property Value to Household Income Ratio in Weymouth Town
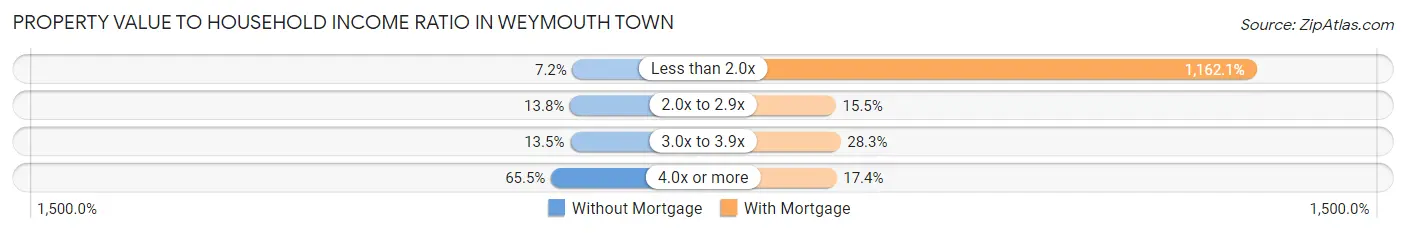
| Value-to-Income Ratio | Without Mortgage | With Mortgage |
| Less than 2.0x | 354 (7.2%) | 138,640 (1,162.1%) |
| 2.0x to 2.9x | 682 (13.8%) | 1,851 (15.5%) |
| 3.0x to 3.9x | 668 (13.5%) | 3,376 (28.3%) |
| 4.0x or more | 3,233 (65.5%) | 2,076 (17.4%) |
| Total | 4,937 (100.0%) | 11,930 (100.0%) |
Real Estate Taxes by Mortgage Status in Weymouth Town
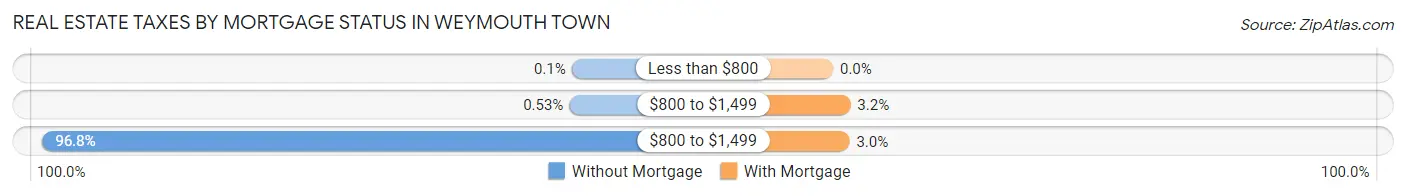
| Property Taxes | Without Mortgage | With Mortgage |
| Less than $800 | 5 (0.1%) | 0 (0.0%) |
| $800 to $1,499 | 26 (0.5%) | 378 (3.2%) |
| $800 to $1,499 | 4,777 (96.8%) | 358 (3.0%) |
| Total | 4,937 (100.0%) | 11,930 (100.0%) |
Health & Disability in Weymouth Town
Health Insurance Coverage by Age in Weymouth Town
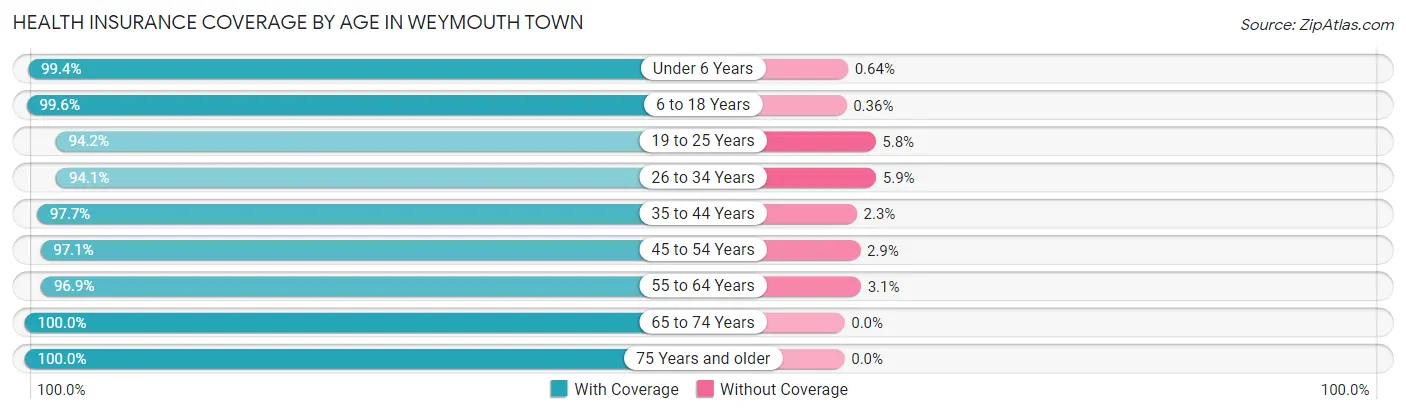
| Age Bracket | With Coverage | Without Coverage |
| Under 6 Years | 3,096 (99.4%) | 20 (0.6%) |
| 6 to 18 Years | 6,843 (99.6%) | 25 (0.4%) |
| 19 to 25 Years | 4,395 (94.2%) | 270 (5.8%) |
| 26 to 34 Years | 6,734 (94.1%) | 421 (5.9%) |
| 35 to 44 Years | 7,146 (97.7%) | 168 (2.3%) |
| 45 to 54 Years | 7,167 (97.1%) | 216 (2.9%) |
| 55 to 64 Years | 9,627 (96.9%) | 304 (3.1%) |
| 65 to 74 Years | 6,708 (100.0%) | 0 (0.0%) |
| 75 Years and older | 3,844 (100.0%) | 0 (0.0%) |
| Total | 55,560 (97.5%) | 1,424 (2.5%) |
Health Insurance Coverage by Citizenship Status in Weymouth Town
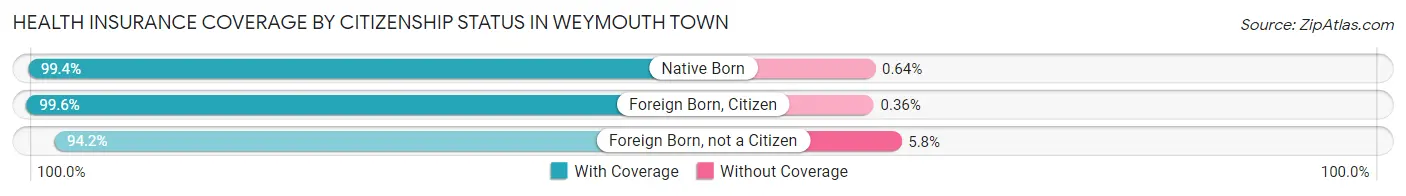
| Citizenship Status | With Coverage | Without Coverage |
| Native Born | 3,096 (99.4%) | 20 (0.6%) |
| Foreign Born, Citizen | 6,843 (99.6%) | 25 (0.4%) |
| Foreign Born, not a Citizen | 4,395 (94.2%) | 270 (5.8%) |
Health Insurance Coverage by Household Income in Weymouth Town
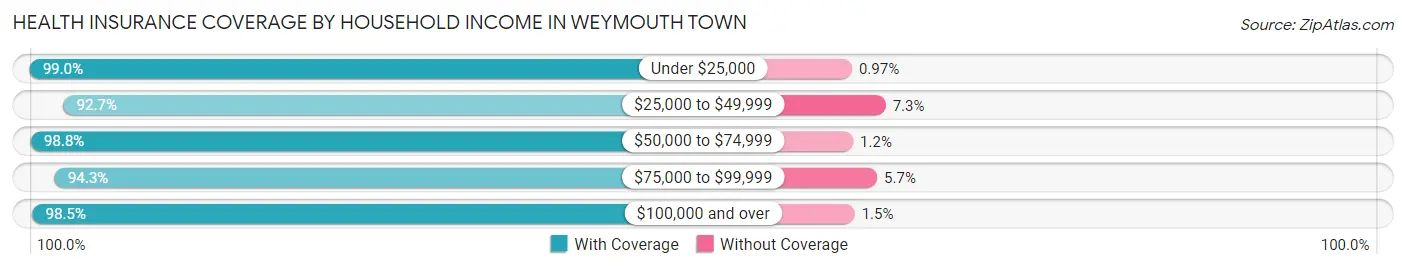
| Household Income | With Coverage | Without Coverage |
| Under $25,000 | 4,276 (99.0%) | 42 (1.0%) |
| $25,000 to $49,999 | 5,145 (92.7%) | 405 (7.3%) |
| $50,000 to $74,999 | 6,249 (98.8%) | 75 (1.2%) |
| $75,000 to $99,999 | 6,626 (94.3%) | 400 (5.7%) |
| $100,000 and over | 33,112 (98.5%) | 500 (1.5%) |
Public vs Private Health Insurance Coverage by Age in Weymouth Town
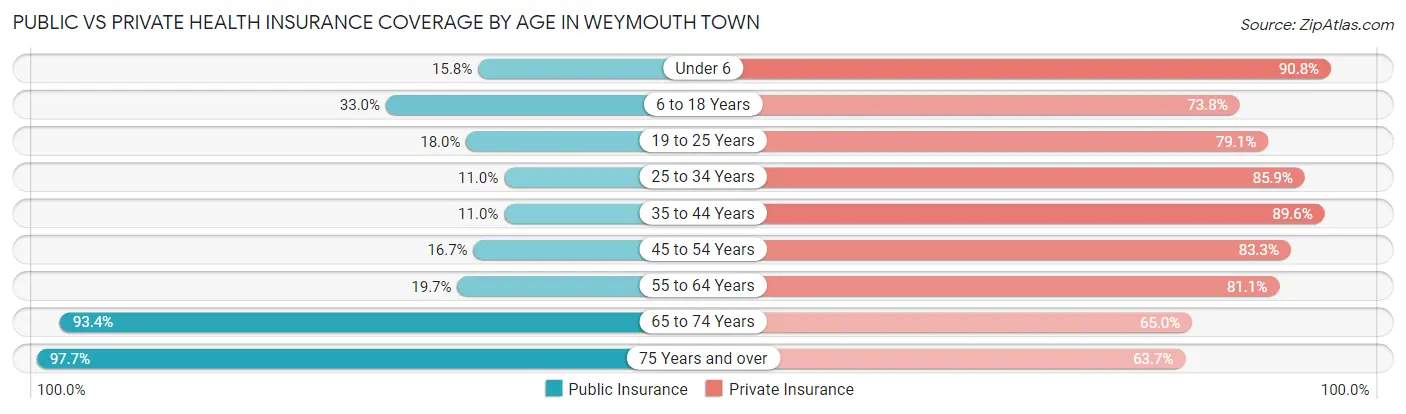
| Age Bracket | Public Insurance | Private Insurance |
| Under 6 | 493 (15.8%) | 2,829 (90.8%) |
| 6 to 18 Years | 2,263 (33.0%) | 5,069 (73.8%) |
| 19 to 25 Years | 840 (18.0%) | 3,690 (79.1%) |
| 25 to 34 Years | 788 (11.0%) | 6,149 (85.9%) |
| 35 to 44 Years | 804 (11.0%) | 6,553 (89.6%) |
| 45 to 54 Years | 1,232 (16.7%) | 6,153 (83.3%) |
| 55 to 64 Years | 1,953 (19.7%) | 8,058 (81.1%) |
| 65 to 74 Years | 6,268 (93.4%) | 4,361 (65.0%) |
| 75 Years and over | 3,757 (97.7%) | 2,450 (63.7%) |
| Total | 18,398 (32.3%) | 45,312 (79.5%) |
Disability Status by Sex by Age in Weymouth Town
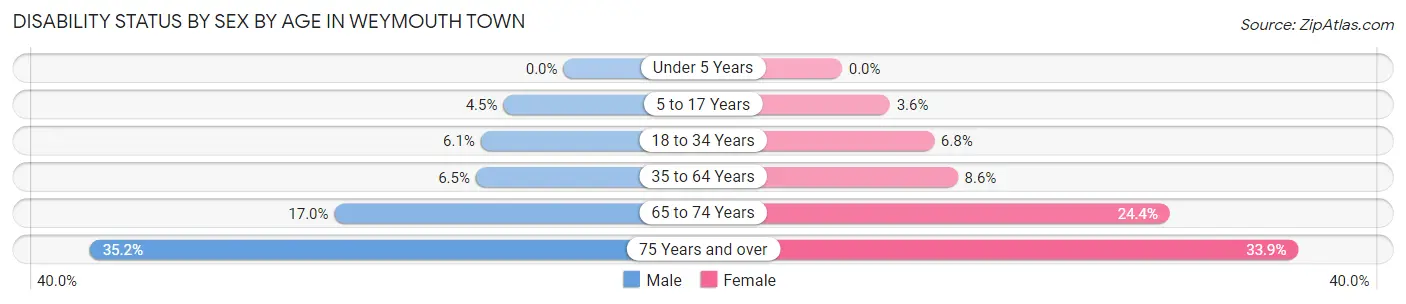
| Age Bracket | Male | Female |
| Under 5 Years | 0 (0.0%) | 0 (0.0%) |
| 5 to 17 Years | 145 (4.5%) | 129 (3.6%) |
| 18 to 34 Years | 389 (6.1%) | 405 (6.8%) |
| 35 to 64 Years | 802 (6.5%) | 1,057 (8.6%) |
| 65 to 74 Years | 531 (17.0%) | 873 (24.3%) |
| 75 Years and over | 481 (35.2%) | 839 (33.9%) |
Disability Class by Sex by Age in Weymouth Town
Disability Class: Hearing Difficulty
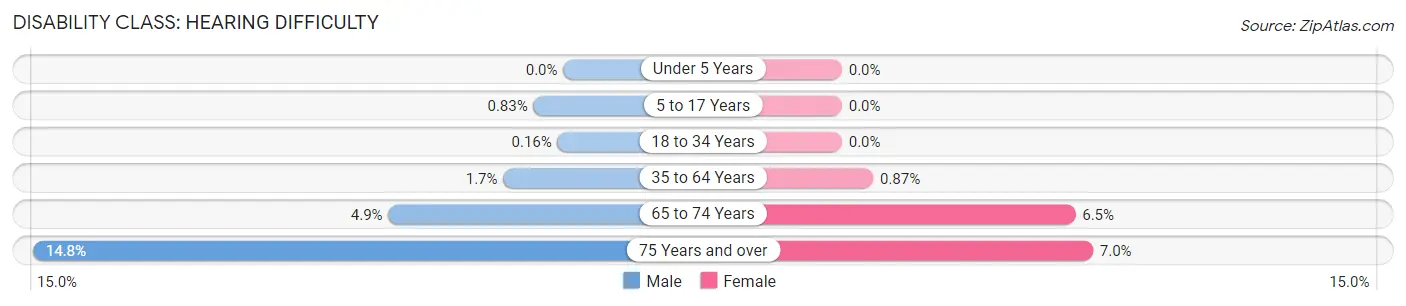
| Age Bracket | Male | Female |
| Under 5 Years | 0 (0.0%) | 0 (0.0%) |
| 5 to 17 Years | 27 (0.8%) | 0 (0.0%) |
| 18 to 34 Years | 10 (0.2%) | 0 (0.0%) |
| 35 to 64 Years | 206 (1.7%) | 107 (0.9%) |
| 65 to 74 Years | 152 (4.9%) | 233 (6.5%) |
| 75 Years and over | 202 (14.8%) | 173 (7.0%) |
Disability Class: Vision Difficulty
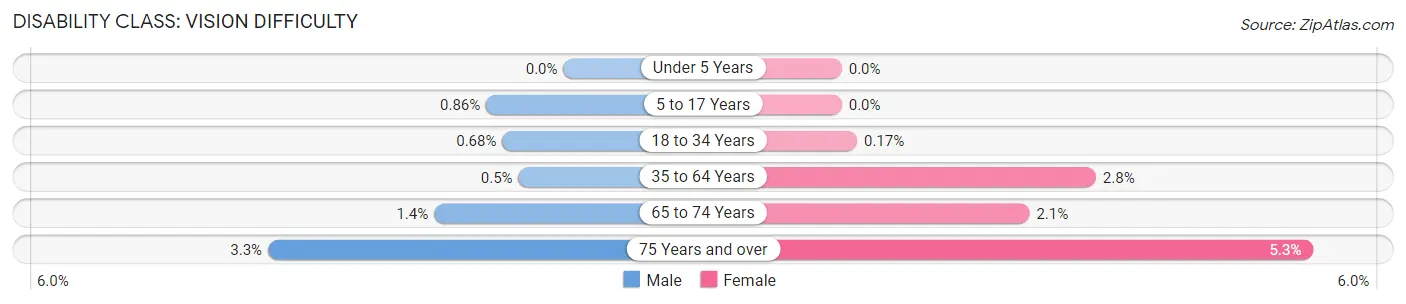
| Age Bracket | Male | Female |
| Under 5 Years | 0 (0.0%) | 0 (0.0%) |
| 5 to 17 Years | 28 (0.9%) | 0 (0.0%) |
| 18 to 34 Years | 43 (0.7%) | 10 (0.2%) |
| 35 to 64 Years | 62 (0.5%) | 348 (2.8%) |
| 65 to 74 Years | 45 (1.4%) | 75 (2.1%) |
| 75 Years and over | 45 (3.3%) | 130 (5.2%) |
Disability Class: Cognitive Difficulty
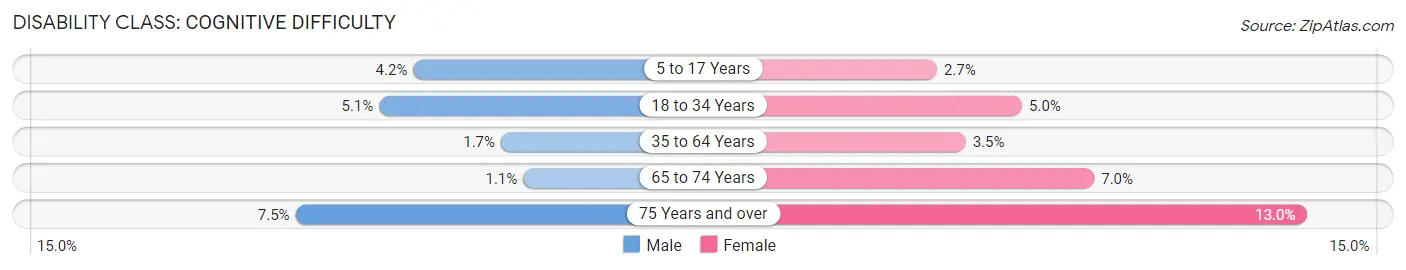
| Age Bracket | Male | Female |
| 5 to 17 Years | 136 (4.2%) | 96 (2.6%) |
| 18 to 34 Years | 325 (5.1%) | 297 (5.0%) |
| 35 to 64 Years | 215 (1.7%) | 424 (3.5%) |
| 65 to 74 Years | 35 (1.1%) | 252 (7.0%) |
| 75 Years and over | 102 (7.5%) | 321 (13.0%) |
Disability Class: Ambulatory Difficulty
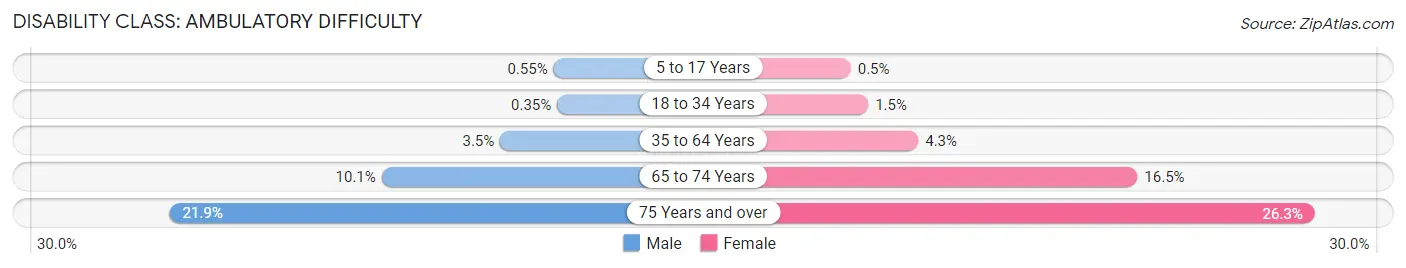
| Age Bracket | Male | Female |
| 5 to 17 Years | 18 (0.5%) | 18 (0.5%) |
| 18 to 34 Years | 22 (0.4%) | 87 (1.5%) |
| 35 to 64 Years | 434 (3.5%) | 524 (4.3%) |
| 65 to 74 Years | 316 (10.1%) | 590 (16.5%) |
| 75 Years and over | 300 (21.9%) | 652 (26.3%) |
Disability Class: Self-Care Difficulty
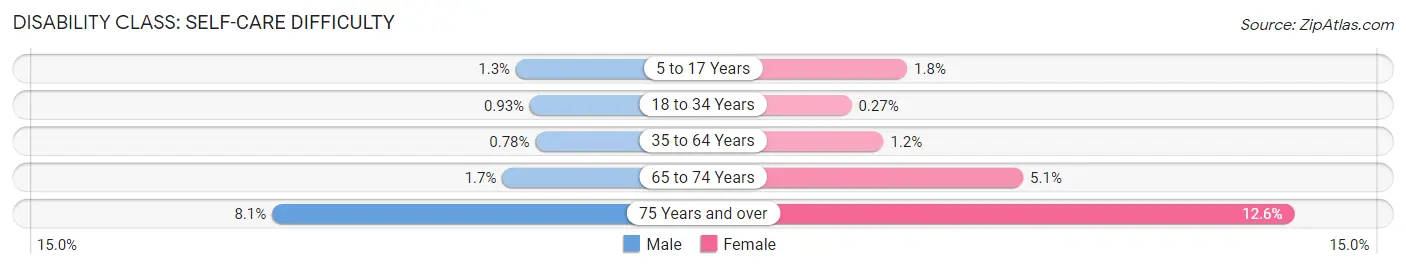
| Age Bracket | Male | Female |
| 5 to 17 Years | 43 (1.3%) | 66 (1.8%) |
| 18 to 34 Years | 59 (0.9%) | 16 (0.3%) |
| 35 to 64 Years | 96 (0.8%) | 143 (1.2%) |
| 65 to 74 Years | 53 (1.7%) | 181 (5.1%) |
| 75 Years and over | 111 (8.1%) | 312 (12.6%) |
Technology Access in Weymouth Town
Computing Device Access in Weymouth Town
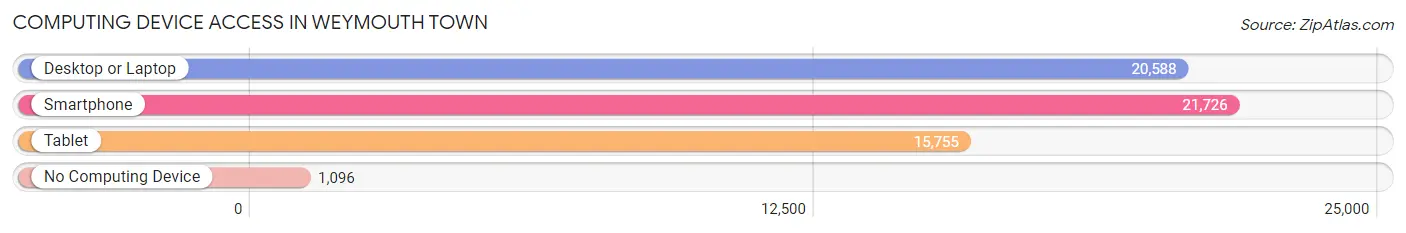
| Device Type | # Households | % Households |
| Desktop or Laptop | 20,588 | 83.4% |
| Smartphone | 21,726 | 88.0% |
| Tablet | 15,755 | 63.8% |
| No Computing Device | 1,096 | 4.4% |
| Total | 24,696 | 100.0% |
Internet Access in Weymouth Town
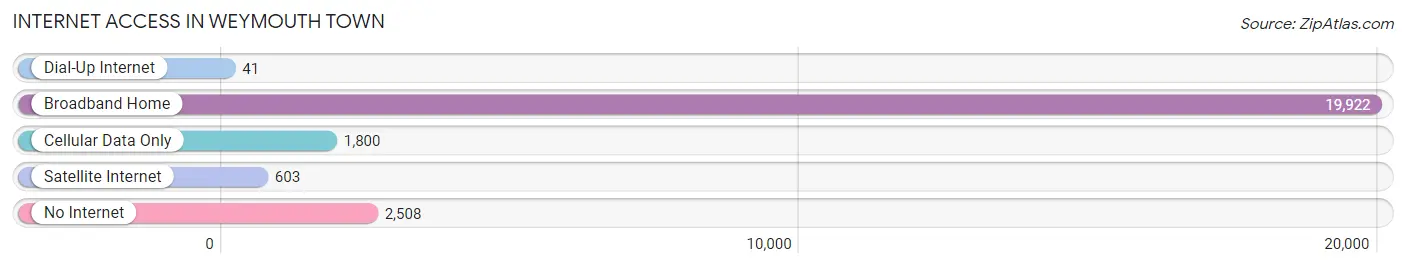
| Internet Type | # Households | % Households |
| Dial-Up Internet | 41 | 0.2% |
| Broadband Home | 19,922 | 80.7% |
| Cellular Data Only | 1,800 | 7.3% |
| Satellite Internet | 603 | 2.4% |
| No Internet | 2,508 | 10.2% |
| Total | 24,696 | 100.0% |
Weymouth Town Summary
Weymouth Town is a city located in Norfolk County, Massachusetts, United States. It is part of the Greater Boston metropolitan area and is situated on the south shore of Massachusetts Bay. As of the 2010 census, the population of Weymouth Town was 53,743.
History
Weymouth Town was first settled in 1622 by a group of English Puritans led by William Torrey. The town was named after Weymouth, England, and was incorporated in 1635. Weymouth Town was an important port in colonial times, and was the site of the first naval battle of the American Revolution in 1775. During the 19th century, Weymouth Town was a major shipbuilding center, and the town was home to several large shipyards.
Geography
Weymouth Town is located at 42°12'N 70°57'W (42.20, -70.95). It is bordered by the towns of Hingham to the north, Rockland to the east, Abington to the south, and Braintree and Quincy to the west. Weymouth Town is located on the south shore of Massachusetts Bay, and is approximately 12 miles south of Boston.
The town has a total area of 16.3 square miles, of which 15.7 square miles is land and 0.6 square miles is water. Weymouth Town is mostly flat, with some hills in the northern part of town. The highest point in town is the summit of Great Hill, which is approximately 200 feet above sea level.
Economy
Weymouth Town has a diverse economy, with a mix of manufacturing, retail, and service industries. The town is home to several large employers, including South Shore Hospital, South Shore Plaza, and the Weymouth Naval Air Station. The town is also home to several smaller businesses, including restaurants, shops, and professional services.
Demographics
As of the 2010 census, there were 53,743 people, 20,845 households, and 14,717 families residing in Weymouth Town. The population density was 3,400.7 people per square mile. The racial makeup of the town was 87.2% White, 5.3% African American, 0.3% Native American, 3.2% Asian, 0.1% Pacific Islander, 1.7% from other races, and 2.3% from two or more races. Hispanic or Latino of any race were 4.2% of the population.
The median income for a household in Weymouth Town was $63,845, and the median income for a family was $76,945. Males had a median income of $51,945 versus $41,945 for females. The per capita income for the town was $30,945. About 4.2% of families and 5.7% of the population were below the poverty line, including 7.2% of those under age 18 and 5.2% of those age 65 or over.
Common Questions
What is Per Capita Income in Weymouth Town?
Per Capita income in Weymouth Town is $51,316.
What is the Median Family Income in Weymouth Town?
Median Family Income in Weymouth Town is $123,519.
What is the Median Household income in Weymouth Town?
Median Household Income in Weymouth Town is $95,879.
What is Income or Wage Gap in Weymouth Town?
Income or Wage Gap in Weymouth Town is 15.2%.
Women in Weymouth Town earn 84.8 cents for every dollar earned by a man.
What is Inequality or Gini Index in Weymouth Town?
Inequality or Gini Index in Weymouth Town is 0.41.
What is the Total Population of Weymouth Town?
Total Population of Weymouth Town is 57,300.
What is the Total Male Population of Weymouth Town?
Total Male Population of Weymouth Town is 27,952.
What is the Total Female Population of Weymouth Town?
Total Female Population of Weymouth Town is 29,348.
What is the Ratio of Males per 100 Females in Weymouth Town?
There are 95.24 Males per 100 Females in Weymouth Town.
What is the Ratio of Females per 100 Males in Weymouth Town?
There are 104.99 Females per 100 Males in Weymouth Town.
What is the Median Population Age in Weymouth Town?
Median Population Age in Weymouth Town is 44.3 Years.
What is the Average Family Size in Weymouth Town
Average Family Size in Weymouth Town is 3.0 People.
What is the Average Household Size in Weymouth Town
Average Household Size in Weymouth Town is 2.3 People.
How Large is the Labor Force in Weymouth Town?
There are 34,031 People in the Labor Forcein in Weymouth Town.
What is the Percentage of People in the Labor Force in Weymouth Town?
69.3% of People are in the Labor Force in Weymouth Town.
What is the Unemployment Rate in Weymouth Town?
Unemployment Rate in Weymouth Town is 4.7%.