Cities with the Largest Subsaharan African Community in Massachusetts
RELATED REPORTS & OPTIONS
Subsaharan African
Massachusetts
Compare Cities
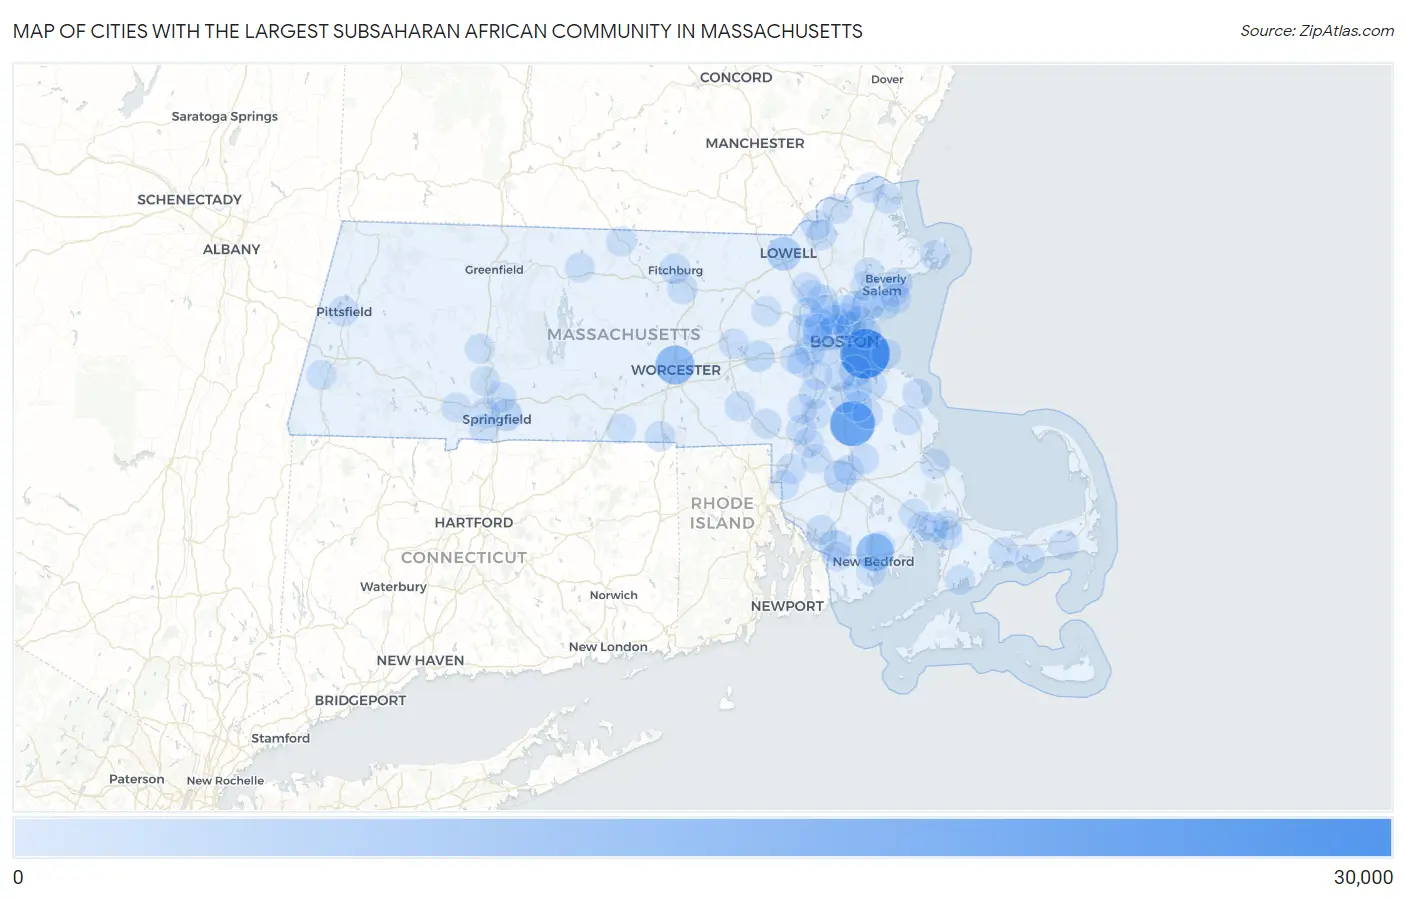
Map of Cities with the Largest Subsaharan African Community in Massachusetts
0
30,000
Cities with the Largest Subsaharan African Community in Massachusetts
| City | Subsaharan African | vs State | vs National | |
| 1. | Boston | 26,894 | 154,402(17.42%)#1 | 4,023,199(0.67%)#11 |
| 2. | Brockton | 20,394 | 154,402(13.21%)#2 | 4,023,199(0.51%)#19 |
| 3. | Worcester | 12,207 | 154,402(7.91%)#3 | 4,023,199(0.30%)#33 |
| 4. | New Bedford | 10,161 | 154,402(6.58%)#4 | 4,023,199(0.25%)#43 |
| 5. | Lowell | 5,302 | 154,402(3.43%)#5 | 4,023,199(0.13%)#91 |
| 6. | Cambridge | 3,624 | 154,402(2.35%)#6 | 4,023,199(0.09%)#139 |
| 7. | Lynn | 3,415 | 154,402(2.21%)#7 | 4,023,199(0.08%)#157 |
| 8. | Fall River | 3,390 | 154,402(2.20%)#8 | 4,023,199(0.08%)#158 |
| 9. | Taunton | 3,212 | 154,402(2.08%)#9 | 4,023,199(0.08%)#173 |
| 10. | Springfield | 2,732 | 154,402(1.77%)#10 | 4,023,199(0.07%)#213 |
| 11. | Quincy | 2,571 | 154,402(1.67%)#11 | 4,023,199(0.06%)#230 |
| 12. | Malden | 1,879 | 154,402(1.22%)#12 | 4,023,199(0.05%)#321 |
| 13. | Randolph Town | 1,730 | 154,402(1.12%)#13 | 4,023,199(0.04%)#355 |
| 14. | Framingham | 1,688 | 154,402(1.09%)#14 | 4,023,199(0.04%)#362 |
| 15. | Weymouth Town | 1,528 | 154,402(0.99%)#15 | 4,023,199(0.04%)#400 |
| 16. | Waltham | 1,490 | 154,402(0.97%)#16 | 4,023,199(0.04%)#411 |
| 17. | Leominster | 1,110 | 154,402(0.72%)#17 | 4,023,199(0.03%)#534 |
| 18. | Chelsea | 1,058 | 154,402(0.69%)#18 | 4,023,199(0.03%)#562 |
| 19. | Newton | 1,050 | 154,402(0.68%)#19 | 4,023,199(0.03%)#567 |
| 20. | Salem | 998 | 154,402(0.65%)#20 | 4,023,199(0.02%)#593 |
| 21. | Somerville | 958 | 154,402(0.62%)#21 | 4,023,199(0.02%)#613 |
| 22. | Fitchburg | 956 | 154,402(0.62%)#22 | 4,023,199(0.02%)#614 |
| 23. | Lawrence | 942 | 154,402(0.61%)#23 | 4,023,199(0.02%)#625 |
| 24. | Barnstable Town | 936 | 154,402(0.61%)#24 | 4,023,199(0.02%)#630 |
| 25. | Woburn | 829 | 154,402(0.54%)#25 | 4,023,199(0.02%)#689 |
| 26. | Everett | 799 | 154,402(0.52%)#26 | 4,023,199(0.02%)#716 |
| 27. | Methuen Town | 751 | 154,402(0.49%)#27 | 4,023,199(0.02%)#758 |
| 28. | Amherst | 658 | 154,402(0.43%)#28 | 4,023,199(0.02%)#860 |
| 29. | Watertown Town | 651 | 154,402(0.42%)#29 | 4,023,199(0.02%)#867 |
| 30. | Pittsfield | 648 | 154,402(0.42%)#30 | 4,023,199(0.02%)#875 |
| 31. | Bridgewater Town | 648 | 154,402(0.42%)#31 | 4,023,199(0.02%)#876 |
| 32. | Chicopee | 645 | 154,402(0.42%)#32 | 4,023,199(0.02%)#879 |
| 33. | Medford | 619 | 154,402(0.40%)#33 | 4,023,199(0.02%)#915 |
| 34. | Attleboro | 612 | 154,402(0.40%)#34 | 4,023,199(0.02%)#928 |
| 35. | Norwood | 566 | 154,402(0.37%)#35 | 4,023,199(0.01%)#989 |
| 36. | Milford | 561 | 154,402(0.36%)#36 | 4,023,199(0.01%)#995 |
| 37. | Marlborough | 547 | 154,402(0.35%)#37 | 4,023,199(0.01%)#1,013 |
| 38. | Abington | 536 | 154,402(0.35%)#38 | 4,023,199(0.01%)#1,031 |
| 39. | Needham | 532 | 154,402(0.34%)#39 | 4,023,199(0.01%)#1,039 |
| 40. | Milton | 508 | 154,402(0.33%)#40 | 4,023,199(0.01%)#1,074 |
| 41. | Foxborough | 494 | 154,402(0.32%)#41 | 4,023,199(0.01%)#1,095 |
| 42. | Holbrook | 462 | 154,402(0.30%)#42 | 4,023,199(0.01%)#1,162 |
| 43. | Haverhill | 449 | 154,402(0.29%)#43 | 4,023,199(0.01%)#1,189 |
| 44. | Scituate | 448 | 154,402(0.29%)#44 | 4,023,199(0.01%)#1,196 |
| 45. | Revere | 440 | 154,402(0.28%)#45 | 4,023,199(0.01%)#1,211 |
| 46. | Beverly | 439 | 154,402(0.28%)#46 | 4,023,199(0.01%)#1,214 |
| 47. | Raynham Center | 433 | 154,402(0.28%)#47 | 4,023,199(0.01%)#1,233 |
| 48. | Brookline | 409 | 154,402(0.26%)#48 | 4,023,199(0.01%)#1,273 |
| 49. | Monument Beach | 406 | 154,402(0.26%)#49 | 4,023,199(0.01%)#1,282 |
| 50. | Mansfield Center | 401 | 154,402(0.26%)#50 | 4,023,199(0.01%)#1,296 |
| 51. | Webster | 399 | 154,402(0.26%)#51 | 4,023,199(0.01%)#1,303 |
| 52. | Onset | 398 | 154,402(0.26%)#52 | 4,023,199(0.01%)#1,305 |
| 53. | Winthrop Town | 333 | 154,402(0.22%)#53 | 4,023,199(0.01%)#1,477 |
| 54. | Franklin Town | 328 | 154,402(0.21%)#54 | 4,023,199(0.01%)#1,488 |
| 55. | Arlington | 314 | 154,402(0.20%)#55 | 4,023,199(0.01%)#1,535 |
| 56. | Somerset | 310 | 154,402(0.20%)#56 | 4,023,199(0.01%)#1,549 |
| 57. | Gloucester | 306 | 154,402(0.20%)#57 | 4,023,199(0.01%)#1,557 |
| 58. | Dedham | 287 | 154,402(0.19%)#58 | 4,023,199(0.01%)#1,620 |
| 59. | Amesbury Town | 273 | 154,402(0.18%)#59 | 4,023,199(0.01%)#1,680 |
| 60. | Braintree Town | 268 | 154,402(0.17%)#60 | 4,023,199(0.01%)#1,693 |
| 61. | Holyoke | 258 | 154,402(0.17%)#61 | 4,023,199(0.01%)#1,735 |
| 62. | Wellesley | 249 | 154,402(0.16%)#62 | 4,023,199(0.01%)#1,779 |
| 63. | West Springfield Town | 245 | 154,402(0.16%)#63 | 4,023,199(0.01%)#1,796 |
| 64. | Burlington | 237 | 154,402(0.15%)#64 | 4,023,199(0.01%)#1,833 |
| 65. | West Wareham | 234 | 154,402(0.15%)#65 | 4,023,199(0.01%)#1,854 |
| 66. | Bliss Corner | 226 | 154,402(0.15%)#66 | 4,023,199(0.01%)#1,897 |
| 67. | Saugus | 222 | 154,402(0.14%)#67 | 4,023,199(0.01%)#1,921 |
| 68. | Northwest Harwich | 215 | 154,402(0.14%)#68 | 4,023,199(0.01%)#1,965 |
| 69. | Melrose | 212 | 154,402(0.14%)#69 | 4,023,199(0.01%)#1,980 |
| 70. | Pinehurst | 212 | 154,402(0.14%)#70 | 4,023,199(0.01%)#1,987 |
| 71. | West Concord | 206 | 154,402(0.13%)#71 | 4,023,199(0.01%)#2,019 |
| 72. | Lexington | 196 | 154,402(0.13%)#72 | 4,023,199(0.00%)#2,077 |
| 73. | Peabody | 188 | 154,402(0.12%)#73 | 4,023,199(0.00%)#2,136 |
| 74. | North Attleborough | 179 | 154,402(0.12%)#74 | 4,023,199(0.00%)#2,216 |
| 75. | Southbridge Town | 172 | 154,402(0.11%)#75 | 4,023,199(0.00%)#2,268 |
| 76. | Winchester | 166 | 154,402(0.11%)#76 | 4,023,199(0.00%)#2,310 |
| 77. | Marblehead | 162 | 154,402(0.10%)#77 | 4,023,199(0.00%)#2,342 |
| 78. | Agawam Town | 159 | 154,402(0.10%)#78 | 4,023,199(0.00%)#2,372 |
| 79. | Plymouth | 154 | 154,402(0.10%)#79 | 4,023,199(0.00%)#2,425 |
| 80. | North Westport | 147 | 154,402(0.10%)#80 | 4,023,199(0.00%)#2,495 |
| 81. | North Seekonk | 144 | 154,402(0.09%)#81 | 4,023,199(0.00%)#2,528 |
| 82. | Belmont | 140 | 154,402(0.09%)#82 | 4,023,199(0.00%)#2,561 |
| 83. | Sharon | 139 | 154,402(0.09%)#83 | 4,023,199(0.00%)#2,579 |
| 84. | Northampton | 137 | 154,402(0.09%)#84 | 4,023,199(0.00%)#2,591 |
| 85. | Danvers | 130 | 154,402(0.08%)#85 | 4,023,199(0.00%)#2,673 |
| 86. | Housatonic | 123 | 154,402(0.08%)#86 | 4,023,199(0.00%)#2,771 |
| 87. | Newburyport | 116 | 154,402(0.08%)#87 | 4,023,199(0.00%)#2,833 |
| 88. | Westfield | 109 | 154,402(0.07%)#88 | 4,023,199(0.00%)#2,913 |
| 89. | Wareham Center | 104 | 154,402(0.07%)#89 | 4,023,199(0.00%)#2,992 |
| 90. | Hull | 101 | 154,402(0.07%)#90 | 4,023,199(0.00%)#3,041 |
| 91. | North Pembroke | 99 | 154,402(0.06%)#91 | 4,023,199(0.00%)#3,088 |
| 92. | Swampscott | 93 | 154,402(0.06%)#92 | 4,023,199(0.00%)#3,183 |
| 93. | Buzzards Bay | 92 | 154,402(0.06%)#93 | 4,023,199(0.00%)#3,223 |
| 94. | East Falmouth | 89 | 154,402(0.06%)#94 | 4,023,199(0.00%)#3,277 |
| 95. | Winchendon | 85 | 154,402(0.06%)#95 | 4,023,199(0.00%)#3,355 |
| 96. | Athol | 79 | 154,402(0.05%)#96 | 4,023,199(0.00%)#3,473 |
| 97. | Walpole | 77 | 154,402(0.05%)#97 | 4,023,199(0.00%)#3,518 |
| 98. | Norton Center | 77 | 154,402(0.05%)#98 | 4,023,199(0.00%)#3,522 |
| 99. | Acushnet Center | 73 | 154,402(0.05%)#99 | 4,023,199(0.00%)#3,608 |
| 100. | West Yarmouth | 69 | 154,402(0.04%)#100 | 4,023,199(0.00%)#3,708 |
Common Questions
What are the Top 10 Cities with the Largest Subsaharan African Community in Massachusetts?
Top 10 Cities with the Largest Subsaharan African Community in Massachusetts are:
#1
26,894
#2
20,394
#3
12,207
#4
10,161
#5
5,302
#6
3,624
#7
3,415
#8
3,390
#9
3,212
#10
2,732
What city has the Largest Subsaharan African Community in Massachusetts?
Boston has the Largest Subsaharan African Community in Massachusetts with 26,894.
What is the Total Subsaharan African Population in the State of Massachusetts?
Total Subsaharan African Population in Massachusetts is 154,402.
What is the Total Subsaharan African Population in the United States?
Total Subsaharan African Population in the United States is 4,023,199.