Cities with the Lowest Population Density in Massachusetts
RELATED REPORTS & OPTIONS
Lowest Population Density
Massachusetts
Compare Cities
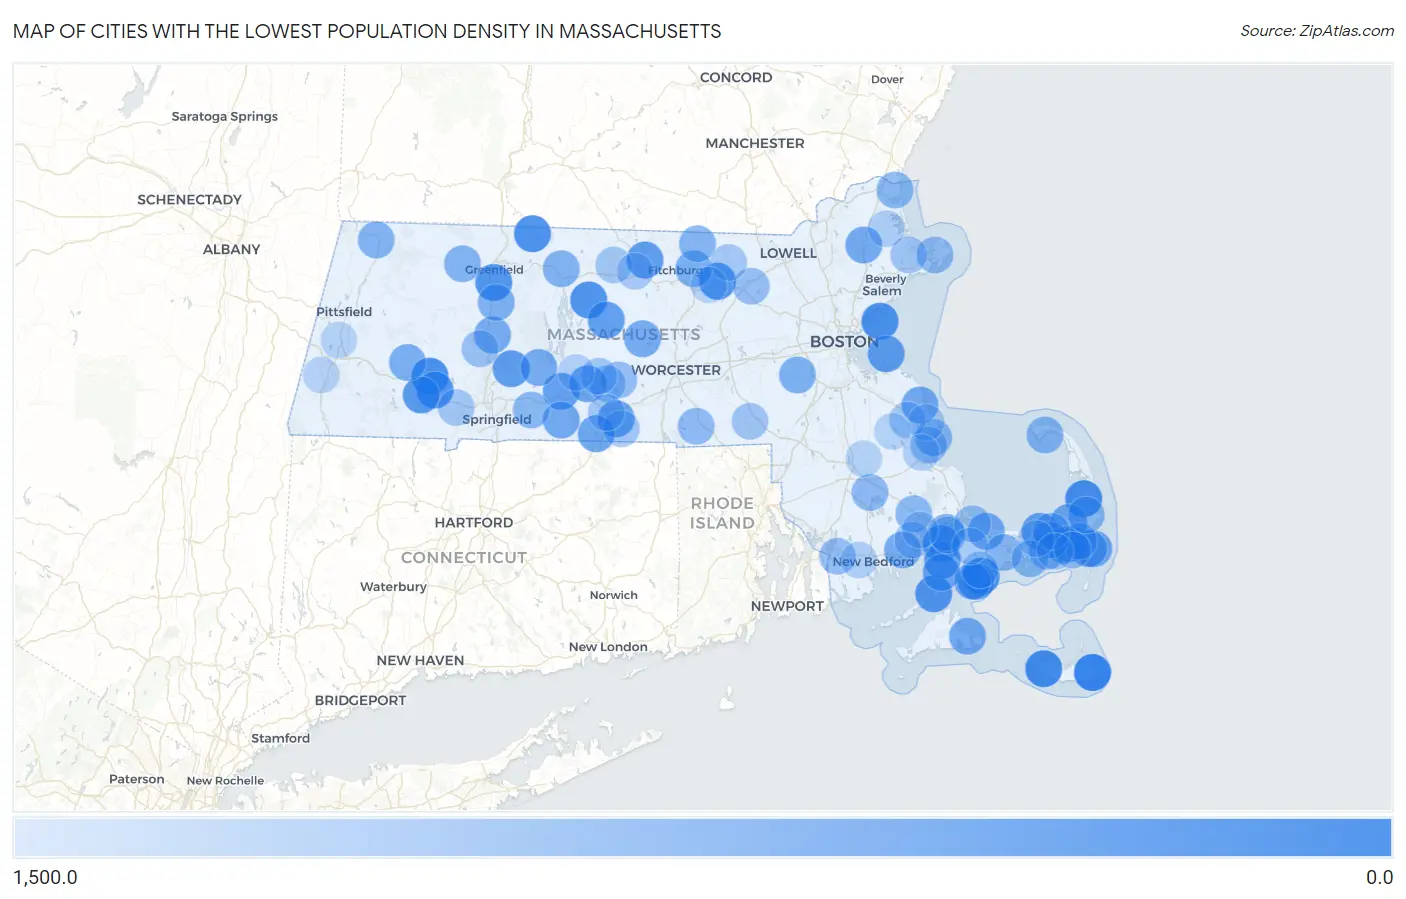
Map of Cities with the Lowest Population Density in Massachusetts
1,500.0
0.0
Cities with the Lowest Population Density in Massachusetts
| City | People / Sq Mi | vs State | vs National | |
| 1. | Siasconset | 46.9 | 895.3(-848)#1 | 0.0(+46.9)#1,503 |
| 2. | Madaket | 132.6 | 895.3(-763)#2 | 0.0(+133)#3,751 |
| 3. | North Eastham | 165.2 | 895.3(-730)#3 | 0.0(+165)#4,509 |
| 4. | Huntington | 182.6 | 895.3(-713)#4 | 0.0(+183)#4,915 |
| 5. | Popponesset Island | 184.2 | 895.3(-711)#5 | 0.0(+184)#4,950 |
| 6. | Northfield | 203.3 | 895.3(-692)#6 | 0.0(+203)#5,361 |
| 7. | Nahant | 213.7 | 895.3(-682)#7 | 0.0(+214)#5,582 |
| 8. | Petersham | 222.2 | 895.3(-673)#8 | 0.0(+222)#5,748 |
| 9. | Russell | 244.9 | 895.3(-650)#9 | 0.0(+245)#6,182 |
| 10. | Woods Hole | 252.5 | 895.3(-643)#10 | 0.0(+253)#6,331 |
| 11. | Devens | 257.0 | 895.3(-638)#11 | 0.0(+257)#6,414 |
| 12. | Deerfield | 261.4 | 895.3(-634)#12 | 0.0(+261)#6,517 |
| 13. | Pocasset | 268.5 | 895.3(-627)#13 | 0.0(+268)#6,659 |
| 14. | New Seabury | 287.0 | 895.3(-608)#14 | 0.0(+287)#6,991 |
| 15. | Blandford | 303.3 | 895.3(-592)#15 | 0.0(+303)#7,302 |
| 16. | Granby | 338.5 | 895.3(-557)#16 | 0.0(+338)#7,916 |
| 17. | South Ashburnham | 350.7 | 895.3(-545)#17 | 0.0(+351)#8,154 |
| 18. | North Falmouth | 350.9 | 895.3(-544)#18 | 0.0(+351)#8,160 |
| 19. | Hull | 359.1 | 895.3(-536)#19 | 0.0(+359)#8,300 |
| 20. | Dennis | 371.4 | 895.3(-524)#20 | 0.0(+371)#8,517 |
| 21. | Barre | 377.3 | 895.3(-518)#21 | 0.0(+377)#8,615 |
| 22. | Palmer Town | 388.8 | 895.3(-507)#22 | 0.0(+389)#8,800 |
| 23. | Sturbridge | 411.5 | 895.3(-484)#23 | 0.0(+412)#9,198 |
| 24. | West Falmouth | 412.1 | 895.3(-483)#24 | 0.0(+412)#9,210 |
| 25. | Warren | 438.2 | 895.3(-457)#25 | 0.0(+438)#9,615 |
| 26. | Brewster | 444.3 | 895.3(-451)#26 | 0.0(+444)#9,714 |
| 27. | Holland | 444.7 | 895.3(-451)#27 | 0.0(+445)#9,721 |
| 28. | Northwest Harwich | 446.0 | 895.3(-449)#28 | 0.0(+446)#9,742 |
| 29. | Chatham | 470.3 | 895.3(-425)#29 | 0.0(+470)#10,123 |
| 30. | West Chatham | 492.8 | 895.3(-402)#30 | 0.0(+493)#10,487 |
| 31. | East Sandwich | 496.4 | 895.3(-399)#31 | 0.0(+496)#10,544 |
| 32. | Boxford | 497.3 | 895.3(-398)#32 | 0.0(+497)#10,563 |
| 33. | Monson Center | 497.7 | 895.3(-398)#33 | 0.0(+498)#10,571 |
| 34. | Marshfield Hills | 500.1 | 895.3(-395)#34 | 0.0(+500)#10,606 |
| 35. | Edgartown | 508.8 | 895.3(-386)#35 | 0.0(+509)#10,759 |
| 36. | Hatfield | 526.9 | 895.3(-368)#36 | 0.0(+527)#11,038 |
| 37. | Belchertown | 527.5 | 895.3(-368)#37 | 0.0(+527)#11,052 |
| 38. | Rutland | 531.2 | 895.3(-364)#38 | 0.0(+531)#11,116 |
| 39. | Mattapoisett Center | 534.8 | 895.3(-360)#39 | 0.0(+535)#11,178 |
| 40. | Monomoscoy Island | 535.1 | 895.3(-360)#40 | 0.0(+535)#11,184 |
| 41. | Chester | 558.6 | 895.3(-337)#41 | 0.0(+559)#11,514 |
| 42. | Lunenburg | 567.0 | 895.3(-328)#42 | 0.0(+567)#11,630 |
| 43. | Dover | 577.4 | 895.3(-318)#43 | 0.0(+577)#11,768 |
| 44. | South Deerfield | 599.4 | 895.3(-296)#44 | 0.0(+599)#12,085 |
| 45. | Bourne | 604.0 | 895.3(-291)#45 | 0.0(+604)#12,161 |
| 46. | Orange | 617.2 | 895.3(-278)#46 | 0.0(+617)#12,346 |
| 47. | Harwich Center | 619.5 | 895.3(-276)#47 | 0.0(+620)#12,370 |
| 48. | Shelburne Falls | 626.5 | 895.3(-269)#48 | 0.0(+627)#12,475 |
| 49. | North Adams | 628.6 | 895.3(-267)#49 | 0.0(+629)#12,516 |
| 50. | Barnstable Town | 640.4 | 895.3(-255)#50 | 0.0(+640)#12,670 |
| 51. | Provincetown | 646.8 | 895.3(-249)#51 | 0.0(+647)#12,764 |
| 52. | East Harwich | 649.9 | 895.3(-245)#52 | 0.0(+650)#12,820 |
| 53. | West Dennis | 650.0 | 895.3(-245)#53 | 0.0(+650)#12,824 |
| 54. | South Dennis | 653.8 | 895.3(-241)#54 | 0.0(+654)#12,867 |
| 55. | Townsend | 661.7 | 895.3(-234)#55 | 0.0(+662)#12,983 |
| 56. | Duxbury | 664.2 | 895.3(-231)#56 | 0.0(+664)#13,022 |
| 57. | West Yarmouth | 671.6 | 895.3(-224)#57 | 0.0(+672)#13,126 |
| 58. | Orleans | 674.4 | 895.3(-221)#58 | 0.0(+674)#13,161 |
| 59. | Wilbraham | 679.9 | 895.3(-215)#59 | 0.0(+680)#13,230 |
| 60. | Salisbury | 680.3 | 895.3(-215)#60 | 0.0(+680)#13,239 |
| 61. | West Wareham | 688.7 | 895.3(-207)#61 | 0.0(+689)#13,337 |
| 62. | North Lakeville | 703.6 | 895.3(-192)#62 | 0.0(+704)#13,541 |
| 63. | Gloucester | 719.8 | 895.3(-176)#63 | 0.0(+720)#13,748 |
| 64. | East Douglas | 727.7 | 895.3(-168)#64 | 0.0(+728)#13,859 |
| 65. | East Dennis | 746.0 | 895.3(-149)#65 | 0.0(+746)#14,058 |
| 66. | North Westport | 755.6 | 895.3(-140)#66 | 0.0(+756)#14,172 |
| 67. | East Brookfield | 760.4 | 895.3(-135)#67 | 0.0(+760)#14,238 |
| 68. | Sandwich | 774.5 | 895.3(-121)#68 | 0.0(+774)#14,405 |
| 69. | South Duxbury | 774.9 | 895.3(-120)#69 | 0.0(+775)#14,409 |
| 70. | Littleton Common | 776.5 | 895.3(-119)#70 | 0.0(+777)#14,436 |
| 71. | Harwich Port | 783.7 | 895.3(-112)#71 | 0.0(+784)#14,507 |
| 72. | Northampton | 791.3 | 895.3(-104)#72 | 0.0(+791)#14,599 |
| 73. | Brookfield | 817.9 | 895.3(-77.4)#73 | 0.0(+818)#14,939 |
| 74. | Bellingham | 844.2 | 895.3(-51.1)#74 | 0.0(+844)#15,246 |
| 75. | Essex | 845.1 | 895.3(-50.2)#75 | 0.0(+845)#15,259 |
| 76. | Southbridge Town | 848.3 | 895.3(-47.0)#76 | 0.0(+848)#15,303 |
| 77. | Fiskdale | 855.6 | 895.3(-39.7)#77 | 0.0(+856)#15,387 |
| 78. | Westfield | 863.5 | 895.3(-31.8)#78 | 0.0(+863)#15,471 |
| 79. | Baldwinville | 864.6 | 895.3(-30.7)#79 | 0.0(+865)#15,487 |
| 80. | West Brookfield | 866.5 | 895.3(-28.8)#80 | 0.0(+866)#15,508 |
| 81. | Monument Beach | 874.3 | 895.3(-21.0)#81 | 0.0(+874)#15,597 |
| 82. | Marion Center | 879.0 | 895.3(-16.3)#82 | 0.0(+879)#15,660 |
| 83. | Groton | 882.1 | 895.3(-13.2)#83 | 0.0(+882)#15,693 |
| 84. | Mashpee Neck | 885.0 | 895.3(-10.3)#84 | 0.0(+885)#15,715 |
| 85. | North Pembroke | 892.9 | 895.3(-2.42)#85 | 0.0(+893)#15,801 |
| 86. | Gardner | 918.0 | 895.3(+22.7)#86 | 0.0(+918)#16,087 |
| 87. | Yarmouth Port | 923.2 | 895.3(+27.9)#87 | 0.0(+923)#16,159 |
| 88. | Forestdale | 938.2 | 895.3(+42.9)#88 | 0.0(+938)#16,311 |
| 89. | Marshfield | 947.7 | 895.3(+52.4)#89 | 0.0(+948)#16,433 |
| 90. | Weweantic | 948.4 | 895.3(+53.1)#90 | 0.0(+948)#16,437 |
| 91. | Rowley | 950.6 | 895.3(+55.3)#91 | 0.0(+951)#16,465 |
| 92. | Smith Mills | 962.5 | 895.3(+67.2)#92 | 0.0(+962)#16,603 |
| 93. | Kingston | 970.6 | 895.3(+75.3)#93 | 0.0(+971)#16,694 |
| 94. | Ware | 986.7 | 895.3(+91.4)#94 | 0.0(+987)#16,872 |
| 95. | Hanson | 1,002.1 | 895.3(+107)#95 | 0.0(+1.00k)#17,053 |
| 96. | Lenox | 1,003.5 | 895.3(+108)#96 | 0.0(+1.00k)#17,070 |
| 97. | Dennis Port | 1,005.9 | 895.3(+111)#97 | 0.0(+1.01k)#17,095 |
| 98. | Bridgewater Town | 1,007.4 | 895.3(+112)#98 | 0.0(+1.01k)#17,114 |
| 99. | Housatonic | 1,016.9 | 895.3(+122)#99 | 0.0(+1.02k)#17,211 |
| 100. | Shirley | 1,017.6 | 895.3(+122)#100 | 0.0(+1.02k)#17,218 |
Common Questions
What are the Top 10 Cities with the Lowest Population Density in Massachusetts?
Top 10 Cities with the Lowest Population Density in Massachusetts are:
#1
46.9
#2
132.6
#3
165.2
#4
182.6
#5
184.2
#6
203.3
#7
213.7
#8
222.2
#9
244.9
#10
252.5
What city has the Lowest Population Density in Massachusetts?
Siasconset has the Lowest Population Density in Massachusetts with 46.9.
What is the Population Density in the State of Massachusetts?
Population Density in Massachusetts is 895.3.