Burlington, MA Map & Demographics
Burlington Map
Burlington Overview
$62,805
PER CAPITA INCOME
$157,286
AVG FAMILY INCOME
$133,936
AVG HOUSEHOLD INCOME
36.5%
WAGE / INCOME GAP [ % ]
63.5¢/ $1
WAGE / INCOME GAP [ $ ]
$11,206
FAMILY INCOME DEFICIT
0.43
INEQUALITY / GINI INDEX
26,169
TOTAL POPULATION
12,697
MALE POPULATION
13,472
FEMALE POPULATION
94.25
MALES / 100 FEMALES
106.10
FEMALES / 100 MALES
43.9
MEDIAN AGE
3.1
AVG FAMILY SIZE
2.6
AVG HOUSEHOLD SIZE
14,356
LABOR FORCE [ PEOPLE ]
67.0%
PERCENT IN LABOR FORCE
3.5%
UNEMPLOYMENT RATE
Burlington Zip Codes
Income in Burlington
Income Overview in Burlington
Per Capita Income in Burlington is $62,805, while median incomes of families and households are $157,286 and $133,936 respectively.
| Characteristic | Number | Measure |
| Per Capita Income | 26,169 | $62,805 |
| Median Family Income | 7,130 | $157,286 |
| Mean Family Income | 7,130 | $189,336 |
| Median Household Income | 10,059 | $133,936 |
| Mean Household Income | 10,059 | $161,892 |
| Income Deficit | 7,130 | $11,206 |
| Wage / Income Gap (%) | 26,169 | 36.52% |
| Wage / Income Gap ($) | 26,169 | 63.48¢ per $1 |
| Gini / Inequality Index | 26,169 | 0.43 |
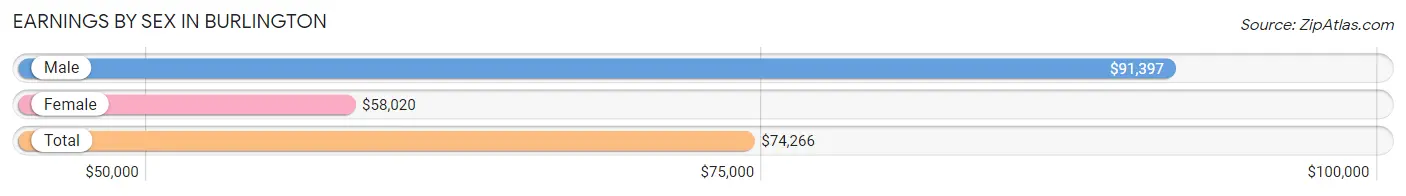
Earnings by Sex in Burlington
Average Earnings in Burlington are $74,266, $91,397 for men and $58,020 for women, a difference of 36.5%.
| Sex | Number | Average Earnings |
| Male | 7,770 (53.5%) | $91,397 |
| Female | 6,756 (46.5%) | $58,020 |
| Total | 14,526 (100.0%) | $74,266 |
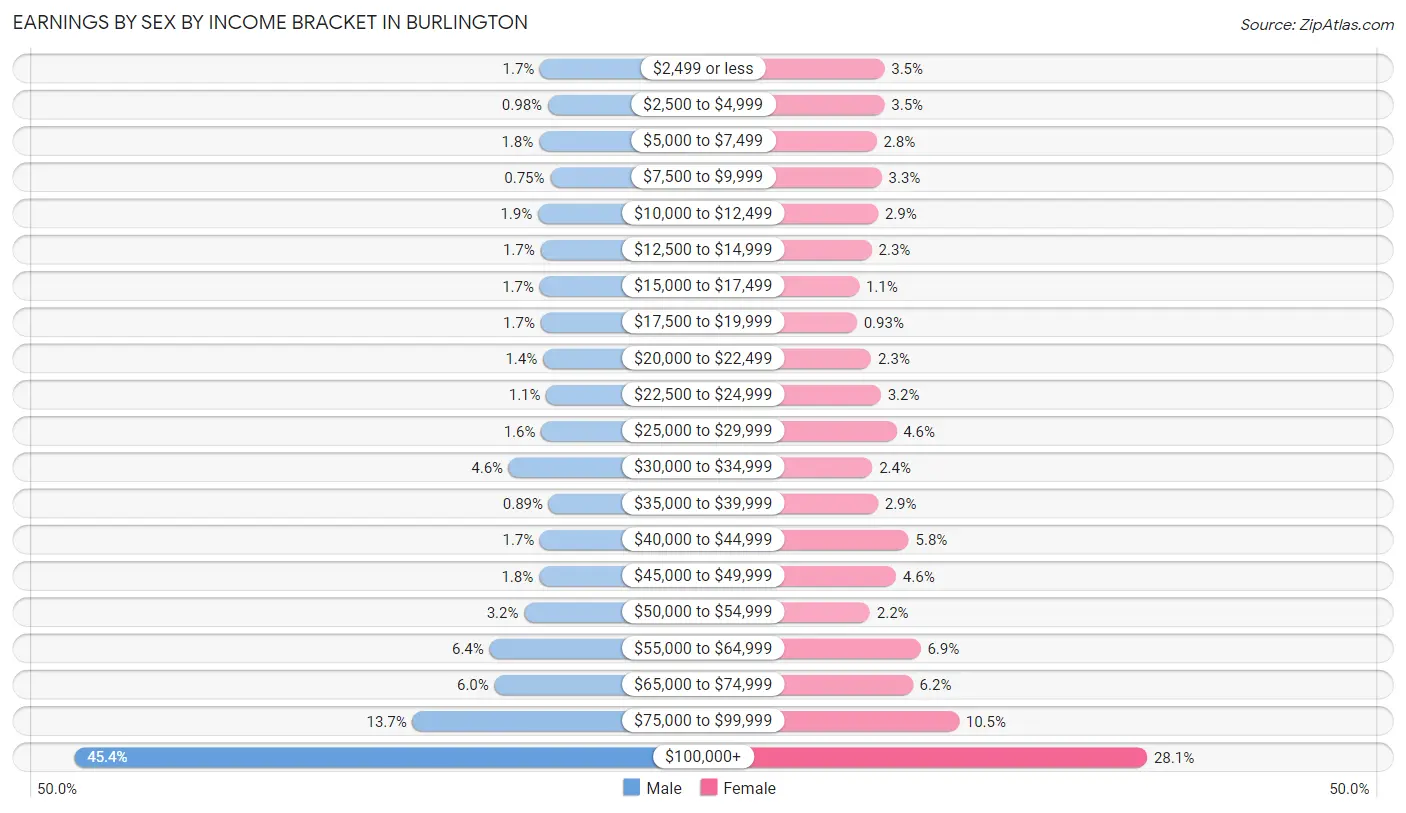
Earnings by Sex by Income Bracket in Burlington
The most common earnings brackets in Burlington are $100,000+ for men (3,524 | 45.4%) and $100,000+ for women (1,900 | 28.1%).
| Income | Male | Female |
| $2,499 or less | 132 (1.7%) | 237 (3.5%) |
| $2,500 to $4,999 | 76 (1.0%) | 238 (3.5%) |
| $5,000 to $7,499 | 141 (1.8%) | 188 (2.8%) |
| $7,500 to $9,999 | 58 (0.7%) | 220 (3.3%) |
| $10,000 to $12,499 | 148 (1.9%) | 197 (2.9%) |
| $12,500 to $14,999 | 130 (1.7%) | 157 (2.3%) |
| $15,000 to $17,499 | 135 (1.7%) | 77 (1.1%) |
| $17,500 to $19,999 | 128 (1.7%) | 63 (0.9%) |
| $20,000 to $22,499 | 111 (1.4%) | 154 (2.3%) |
| $22,500 to $24,999 | 87 (1.1%) | 215 (3.2%) |
| $25,000 to $29,999 | 124 (1.6%) | 313 (4.6%) |
| $30,000 to $34,999 | 360 (4.6%) | 161 (2.4%) |
| $35,000 to $39,999 | 69 (0.9%) | 196 (2.9%) |
| $40,000 to $44,999 | 133 (1.7%) | 391 (5.8%) |
| $45,000 to $49,999 | 141 (1.8%) | 311 (4.6%) |
| $50,000 to $54,999 | 248 (3.2%) | 146 (2.2%) |
| $55,000 to $64,999 | 500 (6.4%) | 466 (6.9%) |
| $65,000 to $74,999 | 464 (6.0%) | 417 (6.2%) |
| $75,000 to $99,999 | 1,061 (13.7%) | 709 (10.5%) |
| $100,000+ | 3,524 (45.4%) | 1,900 (28.1%) |
| Total | 7,770 (100.0%) | 6,756 (100.0%) |
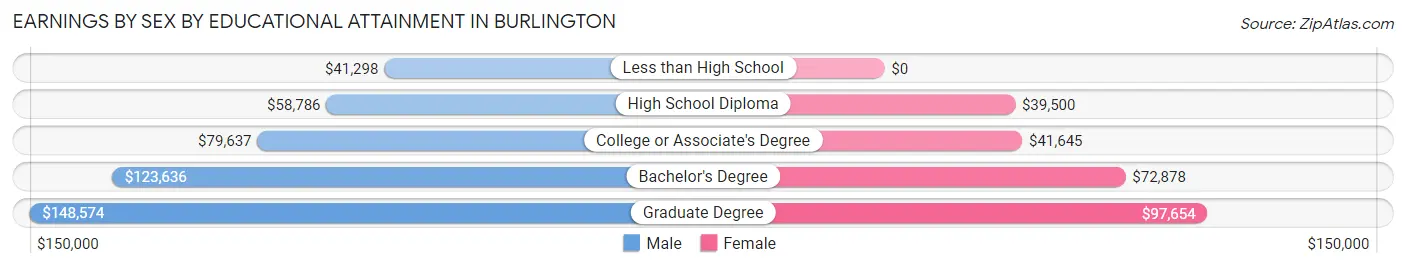
Earnings by Sex by Educational Attainment in Burlington
Average earnings in Burlington are $105,704 for men and $65,649 for women, a difference of 37.9%. Men with an educational attainment of graduate degree enjoy the highest average annual earnings of $148,574, while those with less than high school education earn the least with $41,298. Women with an educational attainment of graduate degree earn the most with the average annual earnings of $97,654, while those with high school diploma education have the smallest earnings of $39,500.
| Educational Attainment | Male Income | Female Income |
| Less than High School | $41,298 | $0 |
| High School Diploma | $58,786 | $39,500 |
| College or Associate's Degree | $79,637 | $41,645 |
| Bachelor's Degree | $123,636 | $72,878 |
| Graduate Degree | $148,574 | $97,654 |
| Total | $105,704 | $65,649 |
Family Income in Burlington
Family Income Brackets in Burlington
According to the Burlington family income data, there are 2,553 families falling into the $200,000+ income range, which is the most common income bracket and makes up 35.8% of all families. Conversely, the $15,000 to $24,999 income bracket is the least frequent group with only 57 families (0.8%) belonging to this category.
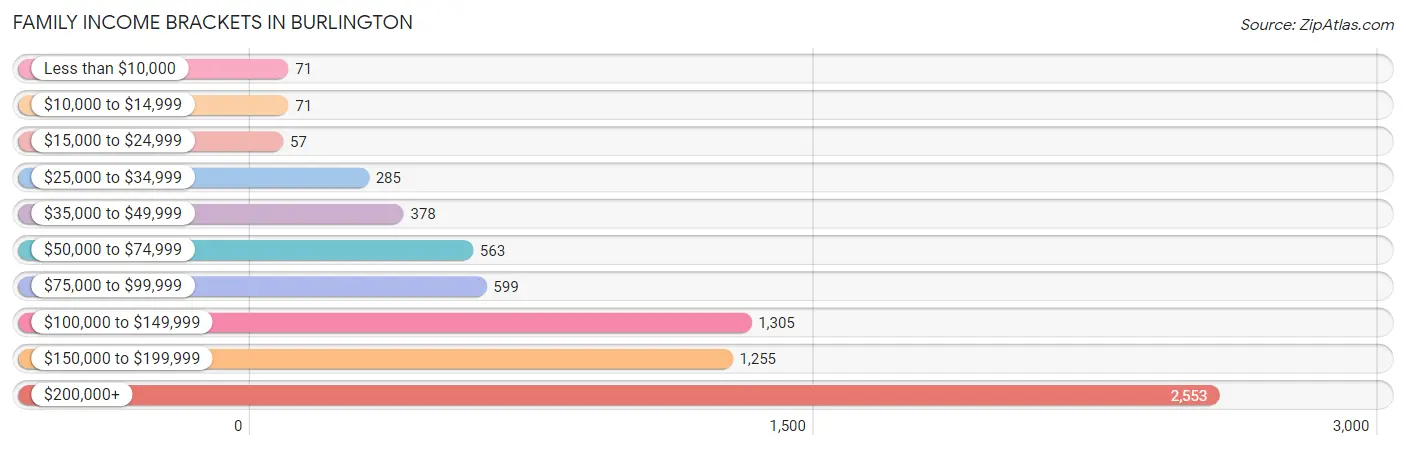
| Income Bracket | # Families | % Families |
| Less than $10,000 | 71 | 1.0% |
| $10,000 to $14,999 | 71 | 1.0% |
| $15,000 to $24,999 | 57 | 0.8% |
| $25,000 to $34,999 | 285 | 4.0% |
| $35,000 to $49,999 | 378 | 5.3% |
| $50,000 to $74,999 | 563 | 7.9% |
| $75,000 to $99,999 | 599 | 8.4% |
| $100,000 to $149,999 | 1,305 | 18.3% |
| $150,000 to $199,999 | 1,255 | 17.6% |
| $200,000+ | 2,553 | 35.8% |
Family Income by Famaliy Size in Burlington
6-person families (305 | 4.3%) account for the highest median family income in Burlington with $234,632 per family, while 3-person families (1,841 | 25.8%) have the highest median income of $62,806 per family member.
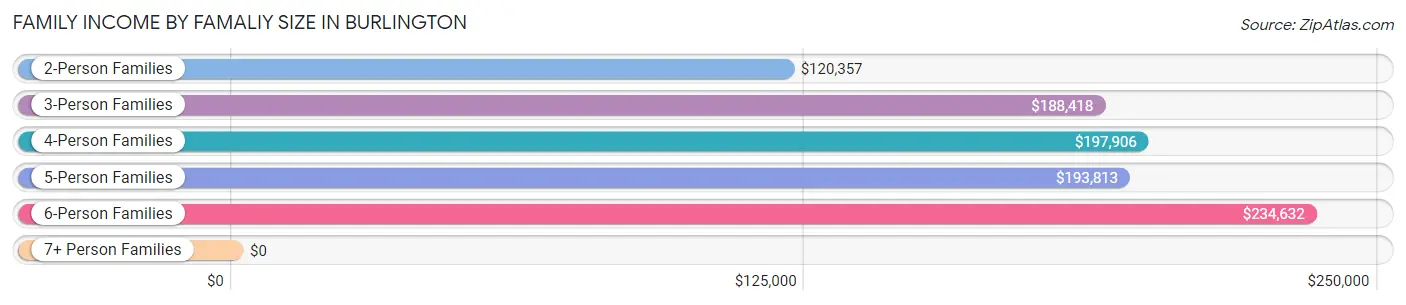
| Income Bracket | # Families | Median Income |
| 2-Person Families | 3,108 (43.6%) | $120,357 |
| 3-Person Families | 1,841 (25.8%) | $188,418 |
| 4-Person Families | 1,441 (20.2%) | $197,906 |
| 5-Person Families | 367 (5.1%) | $193,813 |
| 6-Person Families | 305 (4.3%) | $234,632 |
| 7+ Person Families | 68 (0.9%) | $0 |
| Total | 7,130 (100.0%) | $157,286 |
Family Income by Number of Earners in Burlington
The median family income in Burlington is $157,286, with families comprising 3+ earners (1,099) having the highest median family income of $235,679, while families with no earners (1,014) have the lowest median family income of $76,855, accounting for 15.4% and 14.2% of families, respectively.
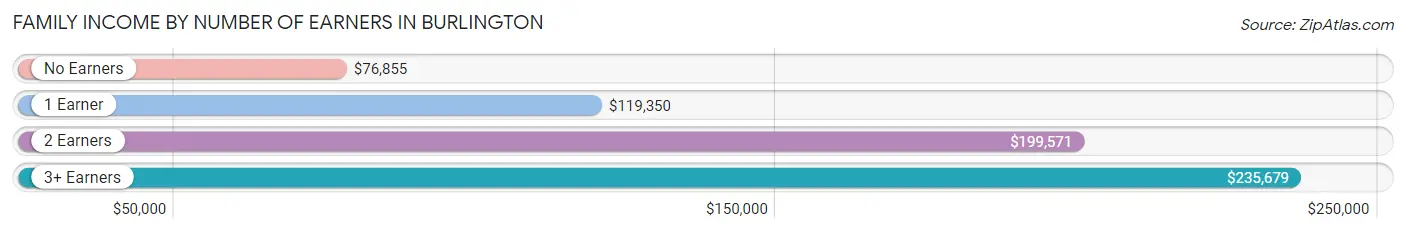
| Number of Earners | # Families | Median Income |
| No Earners | 1,014 (14.2%) | $76,855 |
| 1 Earner | 2,043 (28.6%) | $119,350 |
| 2 Earners | 2,974 (41.7%) | $199,571 |
| 3+ Earners | 1,099 (15.4%) | $235,679 |
| Total | 7,130 (100.0%) | $157,286 |
Household Income in Burlington
Household Income Brackets in Burlington
With 2,917 households falling in the category, the $200,000+ income range is the most frequent in Burlington, accounting for 29.0% of all households. In contrast, only 191 households (1.9%) fall into the less than $10,000 income bracket, making it the least populous group.
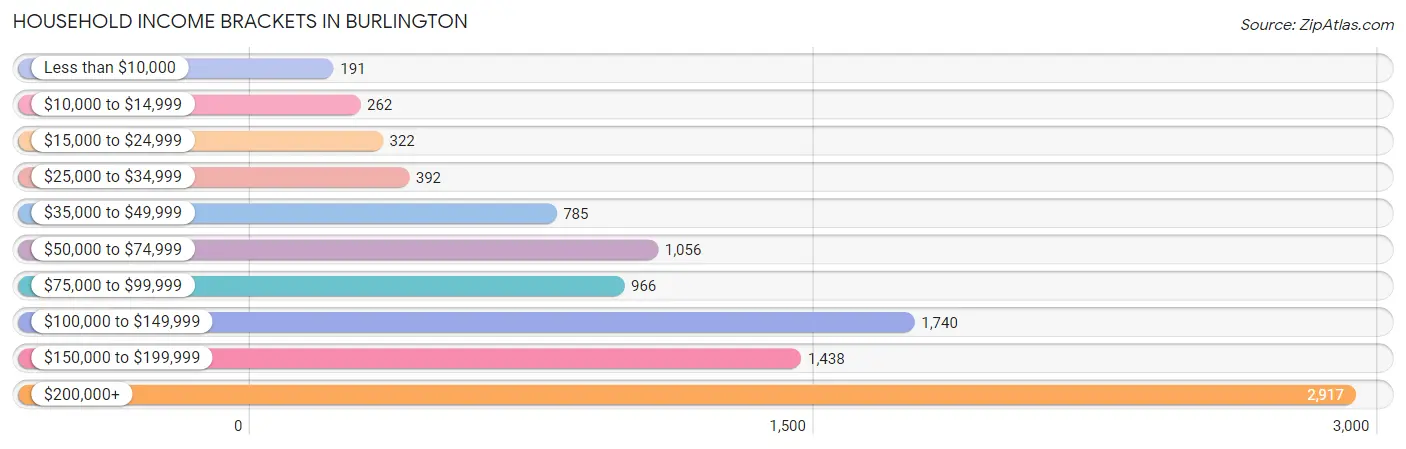
| Income Bracket | # Households | % Households |
| Less than $10,000 | 191 | 1.9% |
| $10,000 to $14,999 | 262 | 2.6% |
| $15,000 to $24,999 | 322 | 3.2% |
| $25,000 to $34,999 | 392 | 3.9% |
| $35,000 to $49,999 | 785 | 7.8% |
| $50,000 to $74,999 | 1,056 | 10.5% |
| $75,000 to $99,999 | 966 | 9.6% |
| $100,000 to $149,999 | 1,740 | 17.3% |
| $150,000 to $199,999 | 1,438 | 14.3% |
| $200,000+ | 2,917 | 29.0% |
Household Income by Householder Age in Burlington
The median household income in Burlington is $133,936, with the highest median household income of $172,899 found in the 45 to 64 years age bracket for the primary householder. A total of 3,447 households (34.3%) fall into this category. Meanwhile, the 65+ years age bracket for the primary householder has the lowest median household income of $74,315, with 3,380 households (33.6%) in this group.
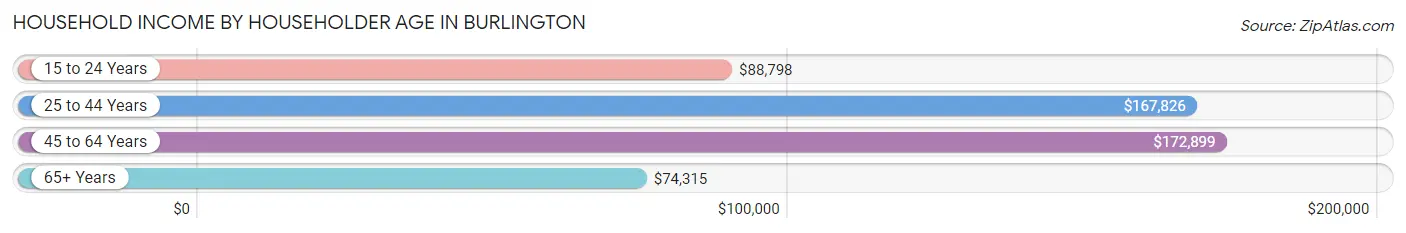
| Income Bracket | # Households | Median Income |
| 15 to 24 Years | 140 (1.4%) | $88,798 |
| 25 to 44 Years | 3,092 (30.7%) | $167,826 |
| 45 to 64 Years | 3,447 (34.3%) | $172,899 |
| 65+ Years | 3,380 (33.6%) | $74,315 |
| Total | 10,059 (100.0%) | $133,936 |
Poverty in Burlington
Income Below Poverty by Sex and Age in Burlington
With 4.0% poverty level for males and 6.4% for females among the residents of Burlington, 15 year old males and 12 to 14 year old females are the most vulnerable to poverty, with 17 males (16.5%) and 58 females (15.1%) in their respective age groups living below the poverty level.
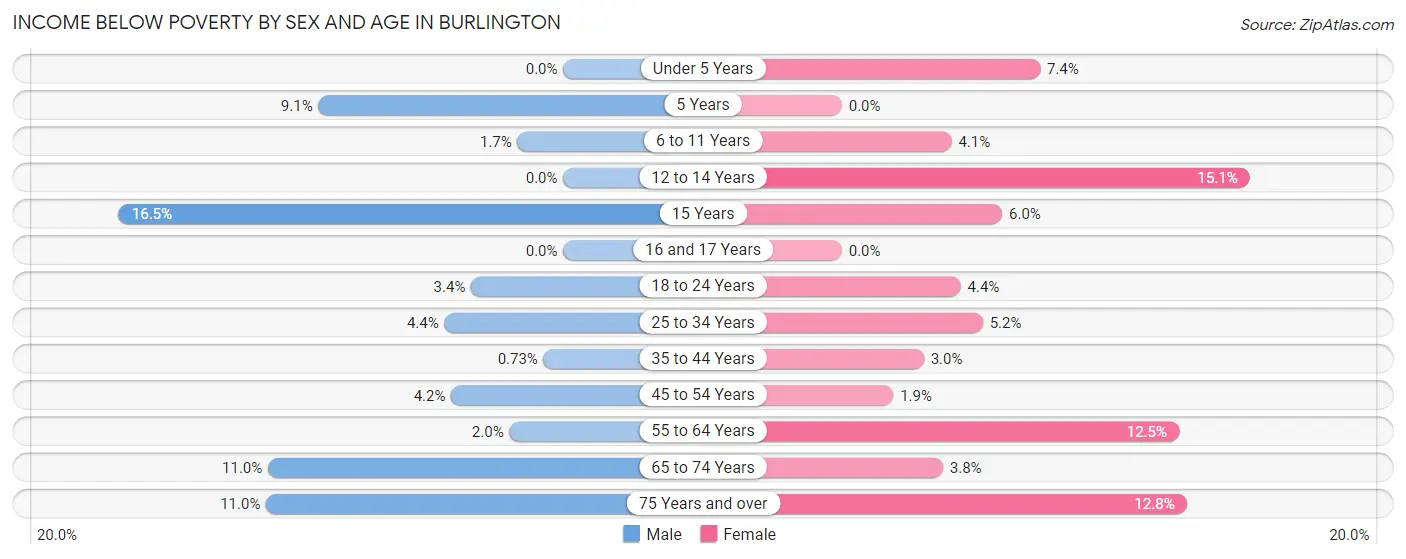
| Age Bracket | Male | Female |
| Under 5 Years | 0 (0.0%) | 50 (7.4%) |
| 5 Years | 10 (9.1%) | 0 (0.0%) |
| 6 to 11 Years | 22 (1.7%) | 39 (4.1%) |
| 12 to 14 Years | 0 (0.0%) | 58 (15.1%) |
| 15 Years | 17 (16.5%) | 10 (5.9%) |
| 16 and 17 Years | 0 (0.0%) | 0 (0.0%) |
| 18 to 24 Years | 41 (3.4%) | 34 (4.4%) |
| 25 to 34 Years | 51 (4.4%) | 77 (5.2%) |
| 35 to 44 Years | 15 (0.7%) | 52 (3.0%) |
| 45 to 54 Years | 61 (4.2%) | 36 (1.9%) |
| 55 to 64 Years | 39 (2.0%) | 234 (12.5%) |
| 65 to 74 Years | 126 (11.0%) | 60 (3.7%) |
| 75 Years and over | 126 (11.0%) | 205 (12.8%) |
| Total | 508 (4.0%) | 855 (6.4%) |
Income Above Poverty by Sex and Age in Burlington
According to the poverty statistics in Burlington, males aged under 5 years and females aged 5 years are the age groups that are most secure financially, with 100.0% of males and 100.0% of females in these age groups living above the poverty line.
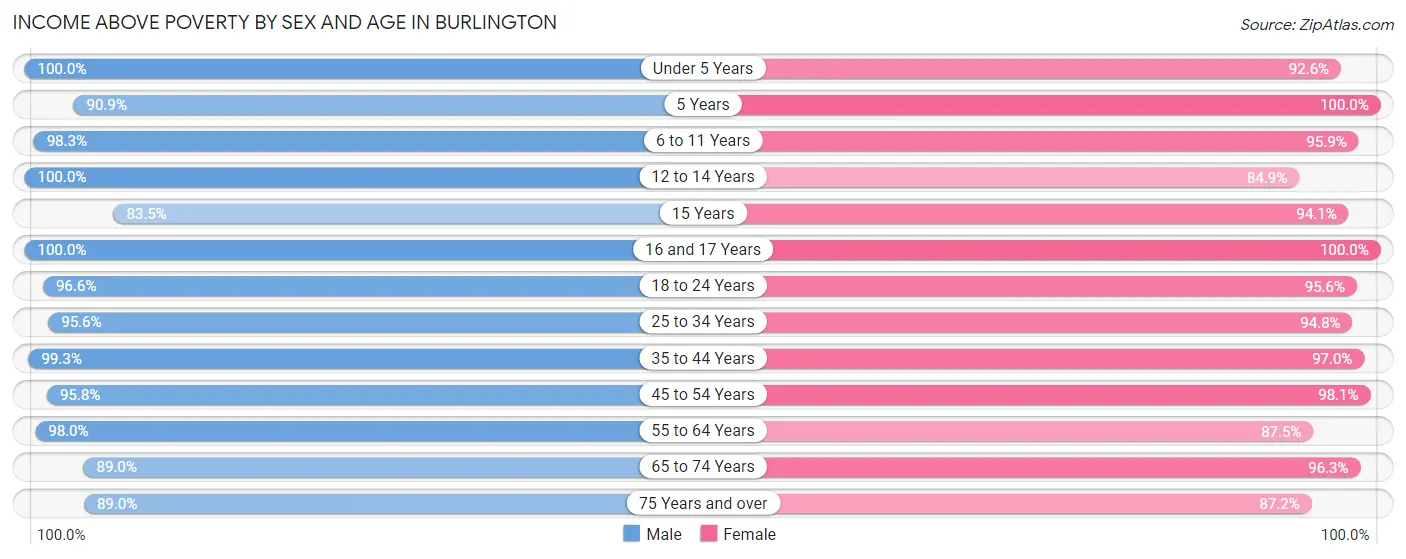
| Age Bracket | Male | Female |
| Under 5 Years | 725 (100.0%) | 629 (92.6%) |
| 5 Years | 100 (90.9%) | 109 (100.0%) |
| 6 to 11 Years | 1,272 (98.3%) | 920 (95.9%) |
| 12 to 14 Years | 211 (100.0%) | 325 (84.9%) |
| 15 Years | 86 (83.5%) | 158 (94.1%) |
| 16 and 17 Years | 124 (100.0%) | 140 (100.0%) |
| 18 to 24 Years | 1,158 (96.6%) | 737 (95.6%) |
| 25 to 34 Years | 1,106 (95.6%) | 1,396 (94.8%) |
| 35 to 44 Years | 2,034 (99.3%) | 1,661 (97.0%) |
| 45 to 54 Years | 1,407 (95.8%) | 1,850 (98.1%) |
| 55 to 64 Years | 1,912 (98.0%) | 1,636 (87.5%) |
| 65 to 74 Years | 1,024 (89.0%) | 1,541 (96.3%) |
| 75 Years and over | 1,016 (89.0%) | 1,396 (87.2%) |
| Total | 12,175 (96.0%) | 12,498 (93.6%) |
Income Below Poverty Among Married-Couple Families in Burlington
The poverty statistics for married-couple families in Burlington show that 2.0% or 119 of the total 5,895 families live below the poverty line. Families with 1 or 2 children have the highest poverty rate of 2.5%, comprising of 59 families. On the other hand, families with 3 or 4 children have the lowest poverty rate of 0.0%, which includes 0 families.
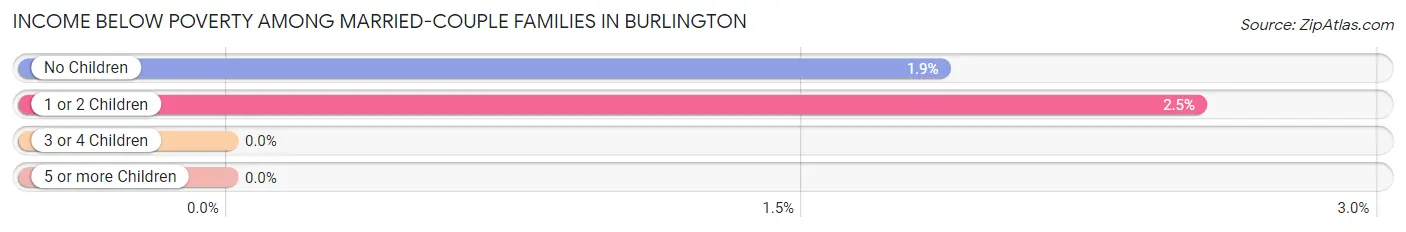
| Children | Above Poverty | Below Poverty |
| No Children | 3,173 (98.1%) | 60 (1.9%) |
| 1 or 2 Children | 2,277 (97.5%) | 59 (2.5%) |
| 3 or 4 Children | 326 (100.0%) | 0 (0.0%) |
| 5 or more Children | 0 (0.0%) | 0 (0.0%) |
| Total | 5,776 (98.0%) | 119 (2.0%) |
Income Below Poverty Among Single-Parent Households in Burlington
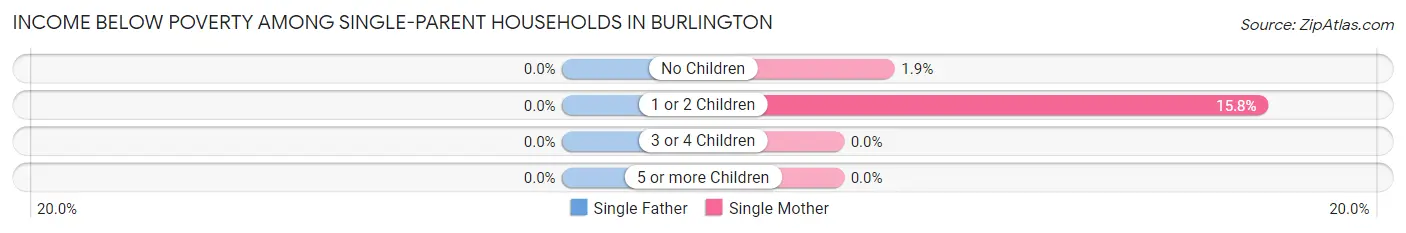
| Children | Single Father | Single Mother |
| No Children | 0 (0.0%) | 12 (1.9%) |
| 1 or 2 Children | 0 (0.0%) | 59 (15.8%) |
| 3 or 4 Children | 0 (0.0%) | 0 (0.0%) |
| 5 or more Children | 0 (0.0%) | 0 (0.0%) |
| Total | 0 (0.0%) | 71 (7.0%) |
Income Below Poverty Among Married-Couple vs Single-Parent Households in Burlington
The poverty data for Burlington shows that 119 of the married-couple family households (2.0%) and 71 of the single-parent households (5.8%) are living below the poverty level. Within the married-couple family households, those with 1 or 2 children have the highest poverty rate, with 59 households (2.5%) falling below the poverty line. Among the single-parent households, those with 1 or 2 children have the highest poverty rate, with 59 household (15.8%) living below poverty.
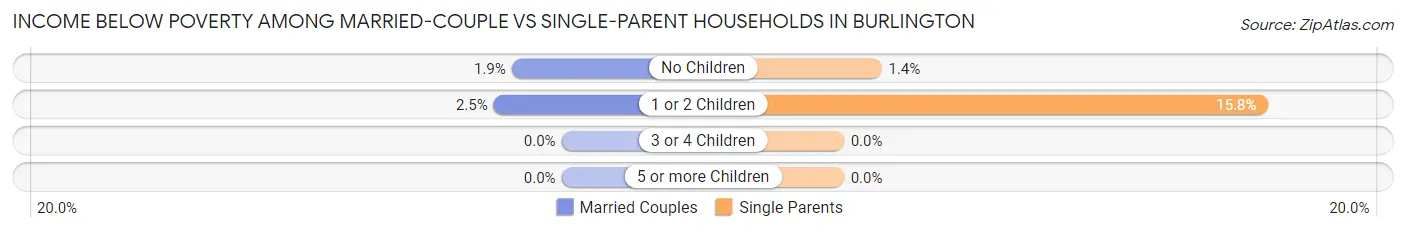
| Children | Married-Couple Families | Single-Parent Households |
| No Children | 60 (1.9%) | 12 (1.4%) |
| 1 or 2 Children | 59 (2.5%) | 59 (15.8%) |
| 3 or 4 Children | 0 (0.0%) | 0 (0.0%) |
| 5 or more Children | 0 (0.0%) | 0 (0.0%) |
| Total | 119 (2.0%) | 71 (5.8%) |
Race in Burlington
The most populous races in Burlington are White / Caucasian (20,168 | 77.1%), Asian (3,793 | 14.5%), and Two or more Races (1,297 | 5.0%).
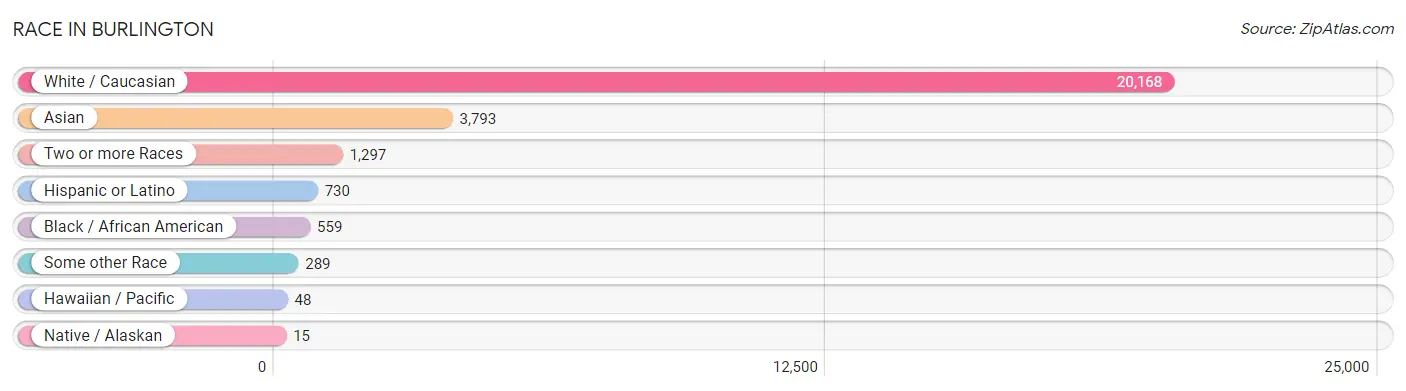
| Race | # Population | % Population |
| Asian | 3,793 | 14.5% |
| Black / African American | 559 | 2.1% |
| Hawaiian / Pacific | 48 | 0.2% |
| Hispanic or Latino | 730 | 2.8% |
| Native / Alaskan | 15 | 0.1% |
| White / Caucasian | 20,168 | 77.1% |
| Two or more Races | 1,297 | 5.0% |
| Some other Race | 289 | 1.1% |
| Total | 26,169 | 100.0% |
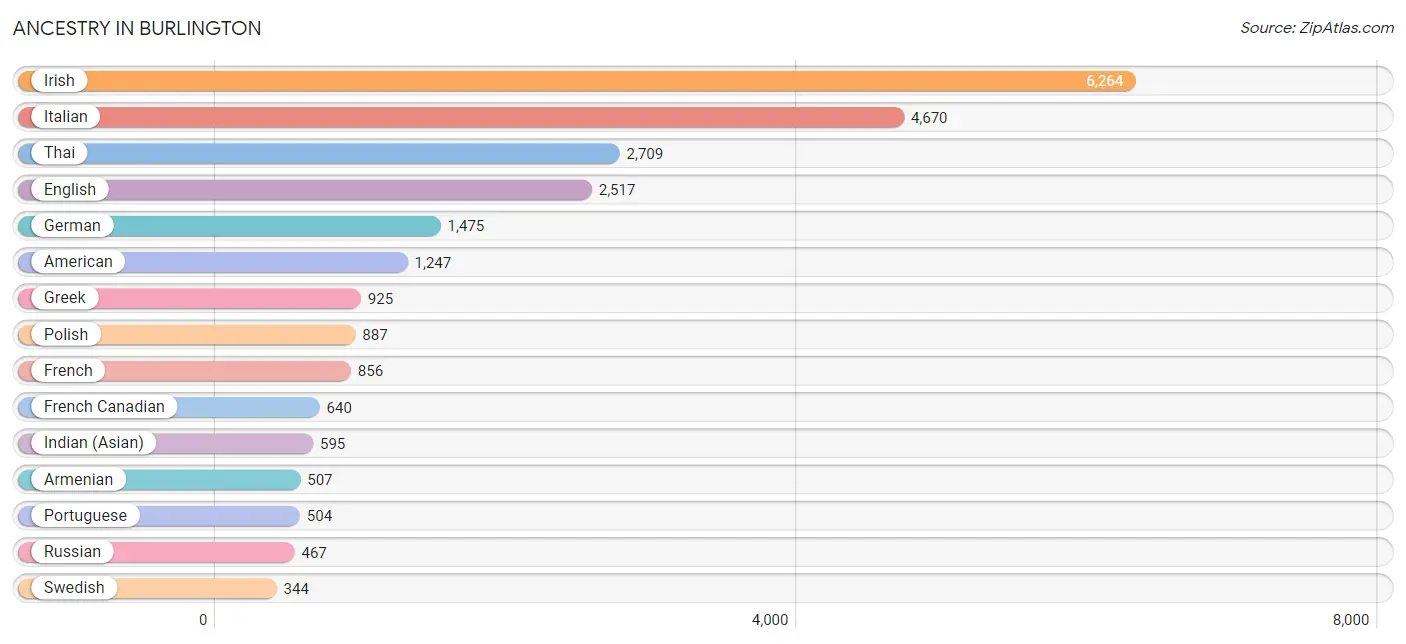
Ancestry in Burlington
The most populous ancestries reported in Burlington are Irish (6,264 | 23.9%), Italian (4,670 | 17.8%), Thai (2,709 | 10.3%), English (2,517 | 9.6%), and German (1,475 | 5.6%), together accounting for 67.4% of all Burlington residents.
| Ancestry | # Population | % Population |
| African | 130 | 0.5% |
| Albanian | 119 | 0.4% |
| American | 1,247 | 4.8% |
| Arab | 163 | 0.6% |
| Armenian | 507 | 1.9% |
| Austrian | 55 | 0.2% |
| Belgian | 20 | 0.1% |
| Bhutanese | 112 | 0.4% |
| Brazilian | 9 | 0.0% |
| British | 165 | 0.6% |
| Bulgarian | 12 | 0.1% |
| Burmese | 309 | 1.2% |
| Canadian | 186 | 0.7% |
| Cape Verdean | 9 | 0.0% |
| Central American | 243 | 0.9% |
| Central American Indian | 71 | 0.3% |
| Cherokee | 12 | 0.1% |
| Colombian | 32 | 0.1% |
| Croatian | 41 | 0.2% |
| Czech | 45 | 0.2% |
| Danish | 36 | 0.1% |
| Dominican | 67 | 0.3% |
| Dutch | 220 | 0.8% |
| Eastern European | 50 | 0.2% |
| Ecuadorian | 29 | 0.1% |
| Egyptian | 14 | 0.1% |
| English | 2,517 | 9.6% |
| Estonian | 47 | 0.2% |
| European | 118 | 0.4% |
| Filipino | 53 | 0.2% |
| Finnish | 58 | 0.2% |
| French | 856 | 3.3% |
| French Canadian | 640 | 2.5% |
| German | 1,475 | 5.6% |
| Greek | 925 | 3.5% |
| Guatemalan | 173 | 0.7% |
| Haitian | 55 | 0.2% |
| Honduran | 57 | 0.2% |
| Hungarian | 39 | 0.2% |
| Icelander | 16 | 0.1% |
| Indian (Asian) | 595 | 2.3% |
| Irish | 6,264 | 23.9% |
| Italian | 4,670 | 17.8% |
| Japanese | 54 | 0.2% |
| Korean | 145 | 0.5% |
| Laotian | 4 | 0.0% |
| Latvian | 13 | 0.1% |
| Lebanese | 14 | 0.1% |
| Lithuanian | 27 | 0.1% |
| Mexican | 16 | 0.1% |
| Mongolian | 15 | 0.1% |
| Native Hawaiian | 73 | 0.3% |
| Norwegian | 143 | 0.5% |
| Pakistani | 58 | 0.2% |
| Polish | 887 | 3.4% |
| Portuguese | 504 | 1.9% |
| Puerto Rican | 314 | 1.2% |
| Romanian | 49 | 0.2% |
| Russian | 467 | 1.8% |
| Salvadoran | 13 | 0.1% |
| Scandinavian | 13 | 0.1% |
| Scotch-Irish | 244 | 0.9% |
| Scottish | 300 | 1.1% |
| Serbian | 17 | 0.1% |
| Slovak | 38 | 0.2% |
| South American | 89 | 0.3% |
| Sri Lankan | 235 | 0.9% |
| Subsaharan African | 237 | 0.9% |
| Swedish | 344 | 1.3% |
| Swiss | 75 | 0.3% |
| Syrian | 57 | 0.2% |
| Thai | 2,709 | 10.3% |
| Turkish | 34 | 0.1% |
| Ugandan | 98 | 0.4% |
| Ukrainian | 161 | 0.6% |
| Venezuelan | 28 | 0.1% |
| Vietnamese | 116 | 0.4% |
| Welsh | 257 | 1.0% | View All 78 Rows |
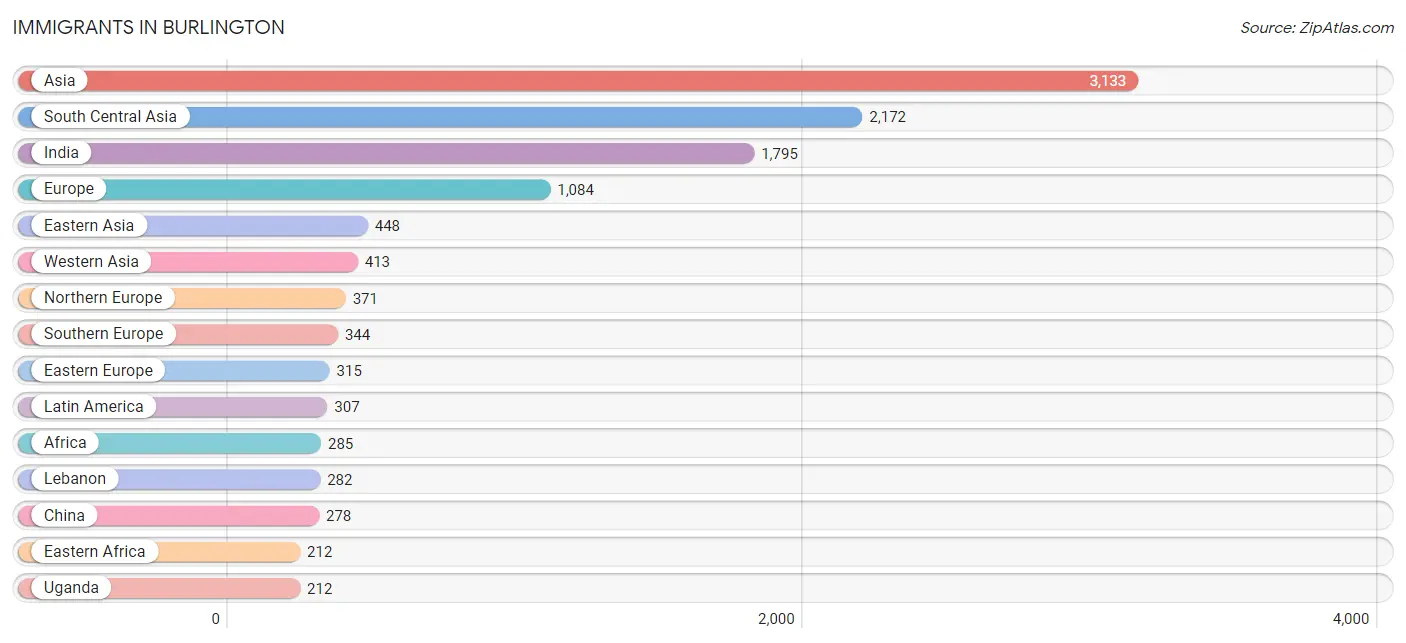
Immigrants in Burlington
The most numerous immigrant groups reported in Burlington came from Asia (3,133 | 12.0%), South Central Asia (2,172 | 8.3%), India (1,795 | 6.9%), Europe (1,084 | 4.1%), and Eastern Asia (448 | 1.7%), together accounting for 33.0% of all Burlington residents.
| Immigration Origin | # Population | % Population |
| Africa | 285 | 1.1% |
| Albania | 119 | 0.4% |
| Asia | 3,133 | 12.0% |
| Australia | 21 | 0.1% |
| Austria | 6 | 0.0% |
| Azores | 24 | 0.1% |
| Bangladesh | 110 | 0.4% |
| Brazil | 49 | 0.2% |
| Cabo Verde | 16 | 0.1% |
| Cambodia | 17 | 0.1% |
| Canada | 174 | 0.7% |
| Caribbean | 103 | 0.4% |
| Central America | 91 | 0.4% |
| China | 278 | 1.1% |
| Colombia | 7 | 0.0% |
| Dominican Republic | 67 | 0.3% |
| Eastern Africa | 212 | 0.8% |
| Eastern Asia | 448 | 1.7% |
| Eastern Europe | 315 | 1.2% |
| Ecuador | 29 | 0.1% |
| Egypt | 31 | 0.1% |
| England | 130 | 0.5% |
| Europe | 1,084 | 4.1% |
| Fiji | 43 | 0.2% |
| France | 17 | 0.1% |
| Germany | 31 | 0.1% |
| Greece | 155 | 0.6% |
| Guatemala | 75 | 0.3% |
| Haiti | 36 | 0.1% |
| Honduras | 16 | 0.1% |
| Hong Kong | 40 | 0.2% |
| Hungary | 39 | 0.2% |
| India | 1,795 | 6.9% |
| Indonesia | 16 | 0.1% |
| Iraq | 20 | 0.1% |
| Ireland | 44 | 0.2% |
| Israel | 16 | 0.1% |
| Italy | 59 | 0.2% |
| Japan | 22 | 0.1% |
| Kazakhstan | 25 | 0.1% |
| Korea | 148 | 0.6% |
| Latin America | 307 | 1.2% |
| Lebanon | 282 | 1.1% |
| Malaysia | 13 | 0.1% |
| Nepal | 37 | 0.1% |
| Northern Africa | 31 | 0.1% |
| Northern Europe | 371 | 1.4% |
| Oceania | 64 | 0.2% |
| Pakistan | 149 | 0.6% |
| Philippines | 15 | 0.1% |
| Poland | 10 | 0.0% |
| Portugal | 130 | 0.5% |
| Romania | 32 | 0.1% |
| Russia | 60 | 0.2% |
| Saudi Arabia | 9 | 0.0% |
| Scotland | 8 | 0.0% |
| South America | 113 | 0.4% |
| South Central Asia | 2,172 | 8.3% |
| South Eastern Asia | 100 | 0.4% |
| Southern Europe | 344 | 1.3% |
| Sri Lanka | 46 | 0.2% |
| Syria | 49 | 0.2% |
| Taiwan | 35 | 0.1% |
| Thailand | 26 | 0.1% |
| Turkey | 37 | 0.1% |
| Uganda | 212 | 0.8% |
| Ukraine | 55 | 0.2% |
| Uzbekistan | 10 | 0.0% |
| Venezuela | 28 | 0.1% |
| Vietnam | 13 | 0.1% |
| Western Africa | 16 | 0.1% |
| Western Asia | 413 | 1.6% |
| Western Europe | 54 | 0.2% | View All 73 Rows |
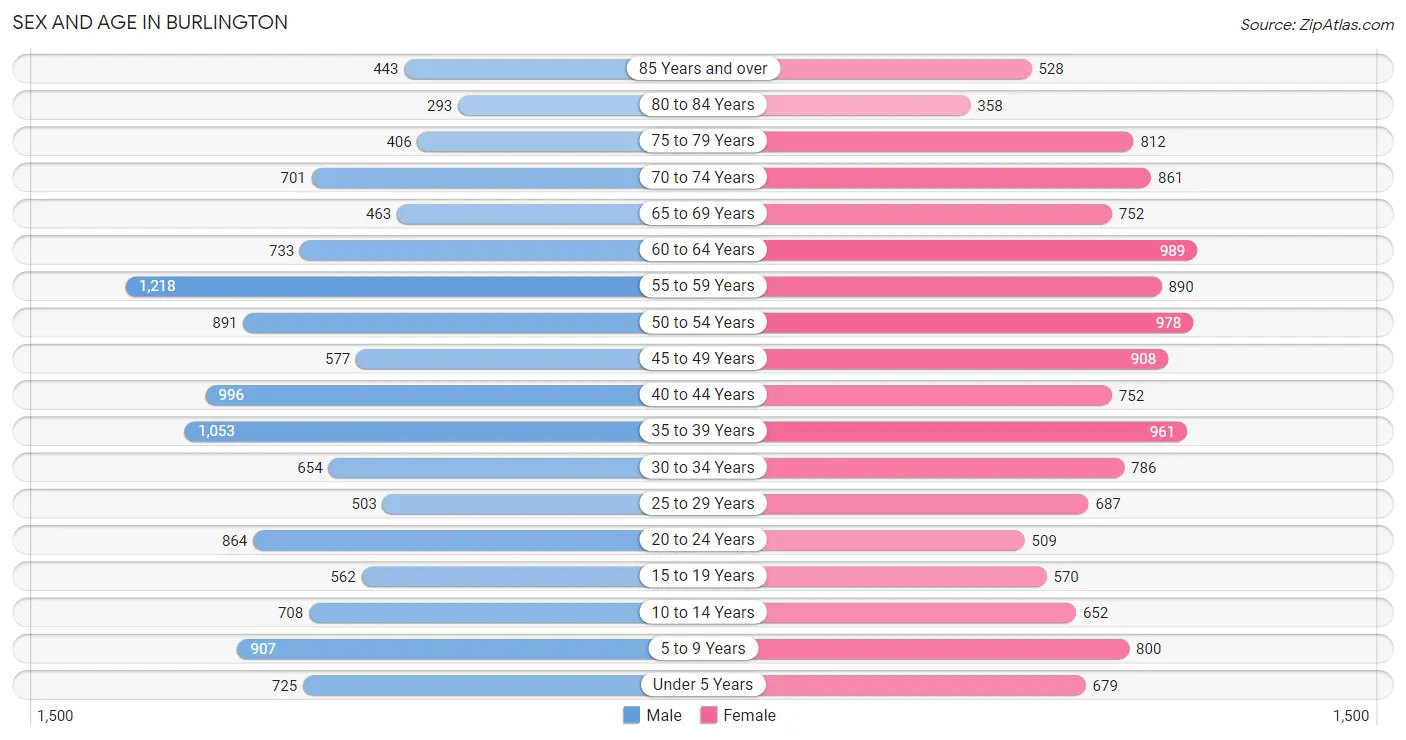
Sex and Age in Burlington
Sex and Age in Burlington
The most populous age groups in Burlington are 55 to 59 Years (1,218 | 9.6%) for men and 60 to 64 Years (989 | 7.3%) for women.
| Age Bracket | Male | Female |
| Under 5 Years | 725 (5.7%) | 679 (5.0%) |
| 5 to 9 Years | 907 (7.1%) | 800 (5.9%) |
| 10 to 14 Years | 708 (5.6%) | 652 (4.8%) |
| 15 to 19 Years | 562 (4.4%) | 570 (4.2%) |
| 20 to 24 Years | 864 (6.8%) | 509 (3.8%) |
| 25 to 29 Years | 503 (4.0%) | 687 (5.1%) |
| 30 to 34 Years | 654 (5.1%) | 786 (5.8%) |
| 35 to 39 Years | 1,053 (8.3%) | 961 (7.1%) |
| 40 to 44 Years | 996 (7.8%) | 752 (5.6%) |
| 45 to 49 Years | 577 (4.5%) | 908 (6.7%) |
| 50 to 54 Years | 891 (7.0%) | 978 (7.3%) |
| 55 to 59 Years | 1,218 (9.6%) | 890 (6.6%) |
| 60 to 64 Years | 733 (5.8%) | 989 (7.3%) |
| 65 to 69 Years | 463 (3.6%) | 752 (5.6%) |
| 70 to 74 Years | 701 (5.5%) | 861 (6.4%) |
| 75 to 79 Years | 406 (3.2%) | 812 (6.0%) |
| 80 to 84 Years | 293 (2.3%) | 358 (2.7%) |
| 85 Years and over | 443 (3.5%) | 528 (3.9%) |
| Total | 12,697 (100.0%) | 13,472 (100.0%) |
Families and Households in Burlington
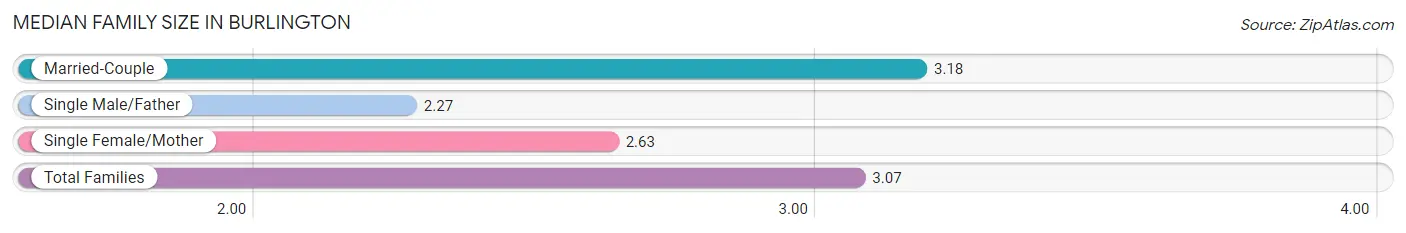
Median Family Size in Burlington
The median family size in Burlington is 3.07 persons per family, with married-couple families (5,895 | 82.7%) accounting for the largest median family size of 3.18 persons per family. On the other hand, single male/father families (215 | 3.0%) represent the smallest median family size with 2.27 persons per family.
| Family Type | # Families | Family Size |
| Married-Couple | 5,895 (82.7%) | 3.18 |
| Single Male/Father | 215 (3.0%) | 2.27 |
| Single Female/Mother | 1,020 (14.3%) | 2.63 |
| Total Families | 7,130 (100.0%) | 3.07 |
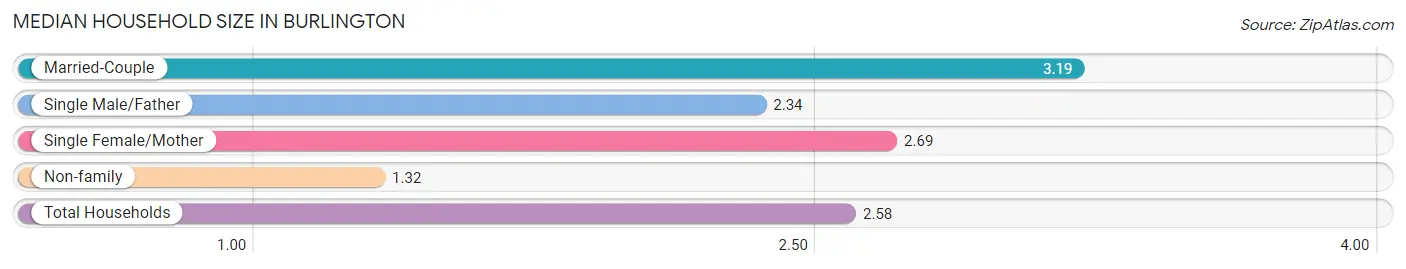
Median Household Size in Burlington
The median household size in Burlington is 2.58 persons per household, with married-couple households (5,895 | 58.6%) accounting for the largest median household size of 3.19 persons per household. non-family households (2,929 | 29.1%) represent the smallest median household size with 1.32 persons per household.
| Household Type | # Households | Household Size |
| Married-Couple | 5,895 (58.6%) | 3.19 |
| Single Male/Father | 215 (2.1%) | 2.34 |
| Single Female/Mother | 1,020 (10.1%) | 2.69 |
| Non-family | 2,929 (29.1%) | 1.32 |
| Total Households | 10,059 (100.0%) | 2.58 |
Household Size by Marriage Status in Burlington
Out of a total of 10,059 households in Burlington, 7,130 (70.9%) are family households, while 2,929 (29.1%) are nonfamily households. The most numerous type of family households are 2-person households, comprising 3,081, and the most common type of nonfamily households are 1-person households, comprising 2,189.
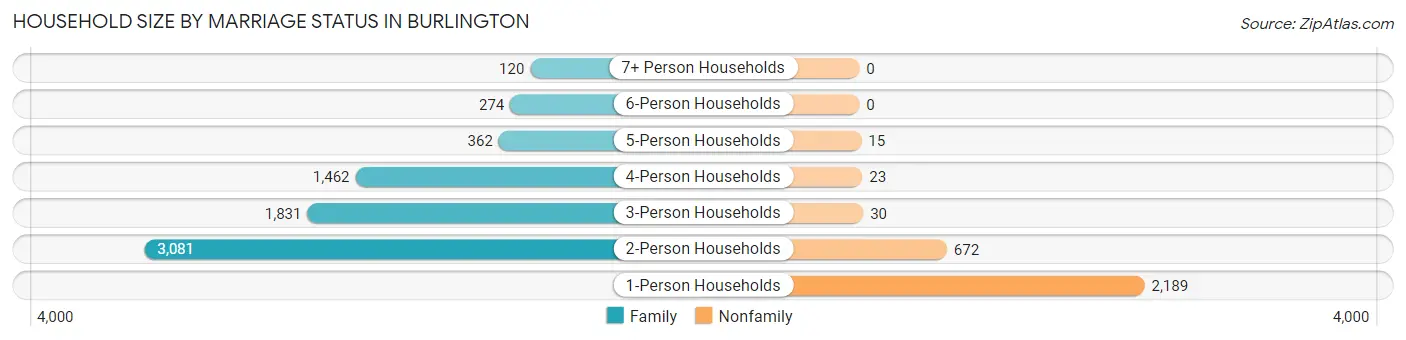
| Household Size | Family Households | Nonfamily Households |
| 1-Person Households | - | 2,189 (21.8%) |
| 2-Person Households | 3,081 (30.6%) | 672 (6.7%) |
| 3-Person Households | 1,831 (18.2%) | 30 (0.3%) |
| 4-Person Households | 1,462 (14.5%) | 23 (0.2%) |
| 5-Person Households | 362 (3.6%) | 15 (0.2%) |
| 6-Person Households | 274 (2.7%) | 0 (0.0%) |
| 7+ Person Households | 120 (1.2%) | 0 (0.0%) |
| Total | 7,130 (70.9%) | 2,929 (29.1%) |
Female Fertility in Burlington
Fertility by Age in Burlington
Average fertility rate in Burlington is 48.0 births per 1,000 women. Women in the age bracket of 20 to 34 years have the highest fertility rate with 103.0 births per 1,000 women. Women in the age bracket of 20 to 34 years acount for 80.4% of all women with births.
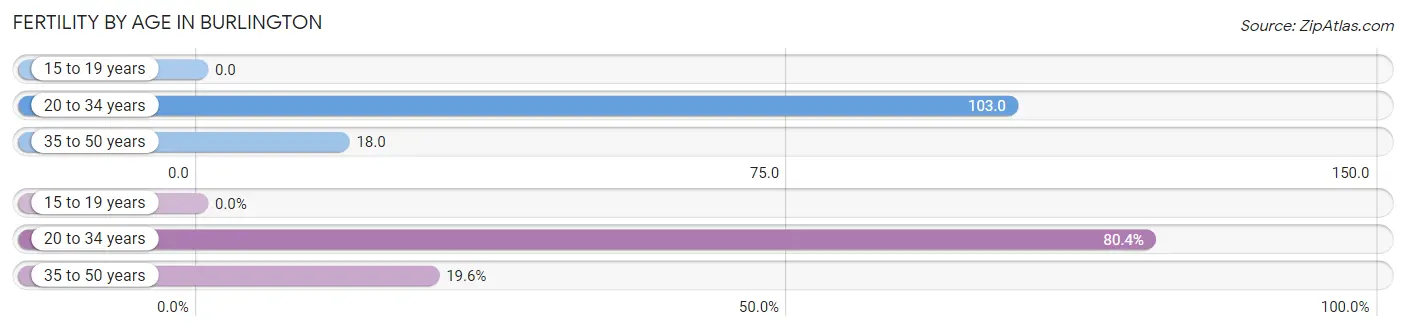
| Age Bracket | Women with Births | Births / 1,000 Women |
| 15 to 19 years | 0 (0.0%) | 0.0 |
| 20 to 34 years | 205 (80.4%) | 103.0 |
| 35 to 50 years | 50 (19.6%) | 18.0 |
| Total | 255 (100.0%) | 48.0 |
Fertility by Age by Marriage Status in Burlington
92.9% of women with births (255) in Burlington are married. The highest percentage of unmarried women with births falls into 20 to 34 years age bracket with 8.8% of them unmarried at the time of birth, while the lowest percentage of unmarried women with births belong to 35 to 50 years age bracket with 0.0% of them unmarried.
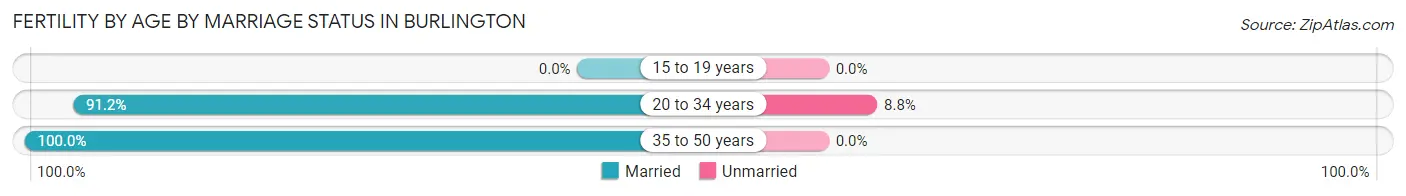
| Age Bracket | Married | Unmarried |
| 15 to 19 years | 0 (0.0%) | 0 (0.0%) |
| 20 to 34 years | 187 (91.2%) | 18 (8.8%) |
| 35 to 50 years | 50 (100.0%) | 0 (0.0%) |
| Total | 237 (92.9%) | 18 (7.1%) |
Fertility by Education in Burlington
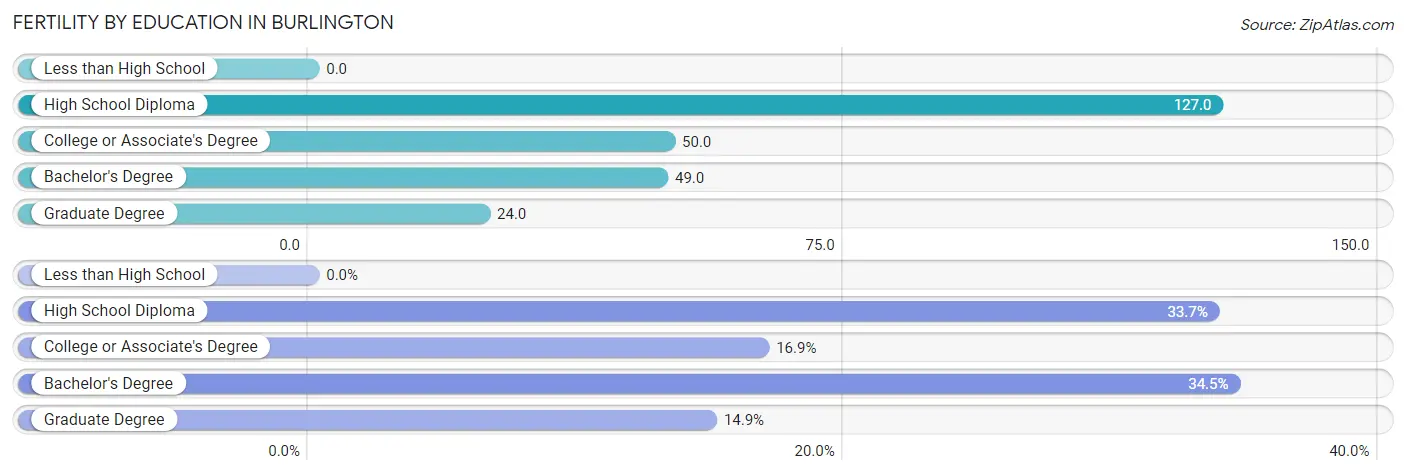
| Educational Attainment | Women with Births | Births / 1,000 Women |
| Less than High School | 0 (0.0%) | 0.0 |
| High School Diploma | 86 (33.7%) | 127.0 |
| College or Associate's Degree | 43 (16.9%) | 50.0 |
| Bachelor's Degree | 88 (34.5%) | 49.0 |
| Graduate Degree | 38 (14.9%) | 24.0 |
| Total | 255 (100.0%) | 48.0 |
Fertility by Education by Marriage Status in Burlington
7.1% of women with births in Burlington are unmarried. Women with the educational attainment of college or associate's degree are most likely to be married with 100.0% of them married at childbirth, while women with the educational attainment of high school diploma are least likely to be married with 20.9% of them unmarried at childbirth.
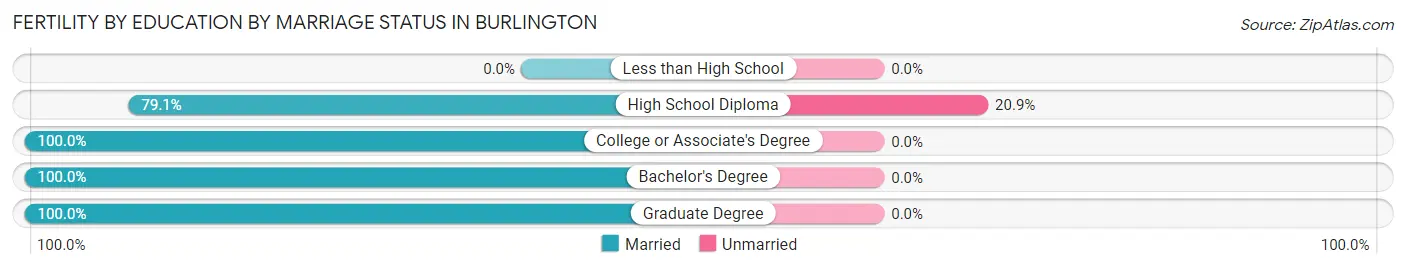
| Educational Attainment | Married | Unmarried |
| Less than High School | 0 (0.0%) | 0 (0.0%) |
| High School Diploma | 68 (79.1%) | 18 (20.9%) |
| College or Associate's Degree | 43 (100.0%) | 0 (0.0%) |
| Bachelor's Degree | 88 (100.0%) | 0 (0.0%) |
| Graduate Degree | 38 (100.0%) | 0 (0.0%) |
| Total | 237 (92.9%) | 18 (7.1%) |
Employment Characteristics in Burlington
Employment by Class of Employer in Burlington
Among the 13,700 employed individuals in Burlington, private company employees (9,645 | 70.4%), not-for-profit organizations (1,447 | 10.6%), and local government employees (1,103 | 8.1%) make up the most common classes of employment.
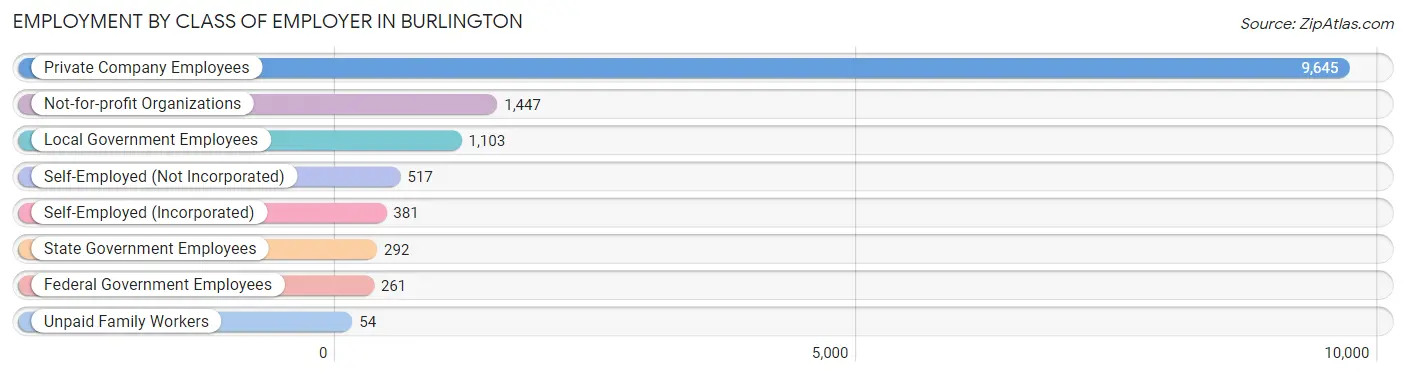
| Employer Class | # Employees | % Employees |
| Private Company Employees | 9,645 | 70.4% |
| Self-Employed (Incorporated) | 381 | 2.8% |
| Self-Employed (Not Incorporated) | 517 | 3.8% |
| Not-for-profit Organizations | 1,447 | 10.6% |
| Local Government Employees | 1,103 | 8.1% |
| State Government Employees | 292 | 2.1% |
| Federal Government Employees | 261 | 1.9% |
| Unpaid Family Workers | 54 | 0.4% |
| Total | 13,700 | 100.0% |
Employment Status by Age in Burlington
According to the labor force statistics for Burlington, out of the total population over 16 years of age (21,427), 67.0% or 14,356 individuals are in the labor force, with 3.5% or 502 of them unemployed. The age group with the highest labor force participation rate is 25 to 29 years, with 95.6% or 1,138 individuals in the labor force. Within the labor force, the 65 to 74 years age range has the highest percentage of unemployed individuals, with 13.9% or 109 of them being unemployed.
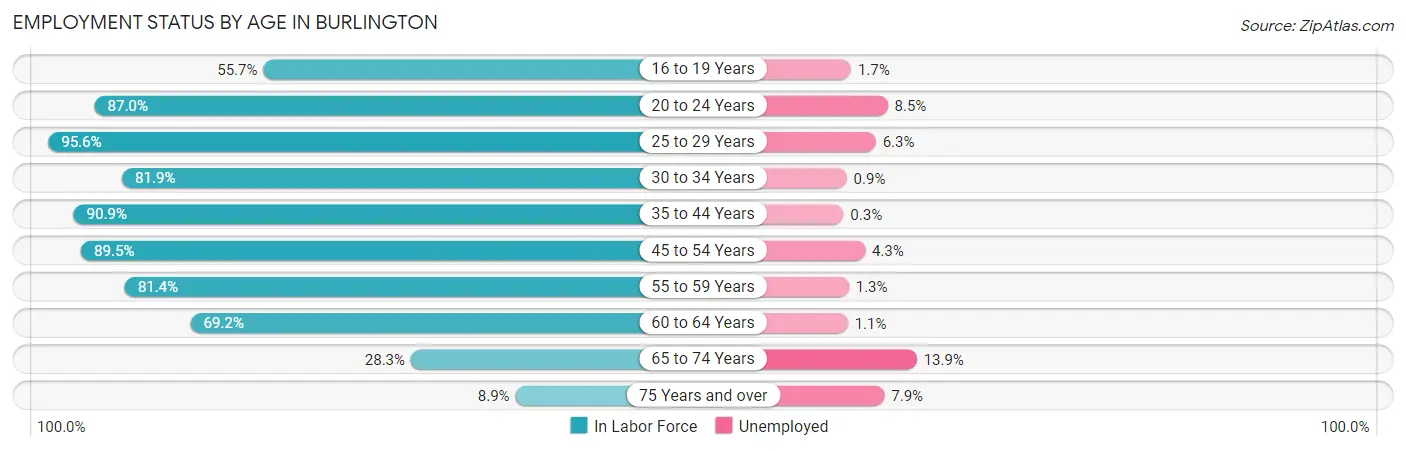
| Age Bracket | In Labor Force | Unemployed |
| 16 to 19 Years | 480 (55.7%) | 8 (1.7%) |
| 20 to 24 Years | 1,195 (87.0%) | 102 (8.5%) |
| 25 to 29 Years | 1,138 (95.6%) | 72 (6.3%) |
| 30 to 34 Years | 1,179 (81.9%) | 11 (0.9%) |
| 35 to 44 Years | 3,420 (90.9%) | 10 (0.3%) |
| 45 to 54 Years | 3,002 (89.5%) | 129 (4.3%) |
| 55 to 59 Years | 1,716 (81.4%) | 22 (1.3%) |
| 60 to 64 Years | 1,192 (69.2%) | 13 (1.1%) |
| 65 to 74 Years | 786 (28.3%) | 109 (13.9%) |
| 75 Years and over | 253 (8.9%) | 20 (7.9%) |
| Total | 14,356 (67.0%) | 502 (3.5%) |
Employment Status by Educational Attainment in Burlington
According to labor force statistics for Burlington, 85.8% of individuals (11,648) out of the total population between 25 and 64 years of age (13,576) are in the labor force, with 2.2% or 256 of them being unemployed. The group with the highest labor force participation rate are those with the educational attainment of bachelor's degree or higher, with 89.1% or 7,909 individuals in the labor force. Within the labor force, individuals with high school diploma education have the highest percentage of unemployment, with 4.4% or 72 of them being unemployed.
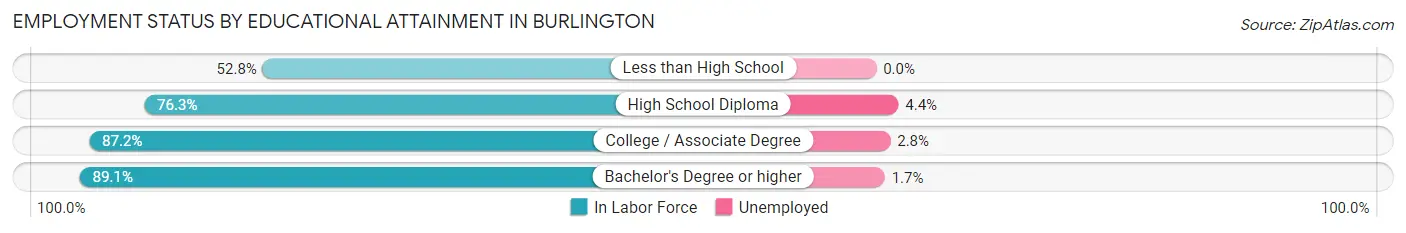
| Educational Attainment | In Labor Force | Unemployed |
| Less than High School | 199 (52.8%) | 0 (0.0%) |
| High School Diploma | 1,629 (76.3%) | 94 (4.4%) |
| College / Associate Degree | 1,907 (87.2%) | 61 (2.8%) |
| Bachelor's Degree or higher | 7,909 (89.1%) | 151 (1.7%) |
| Total | 11,648 (85.8%) | 299 (2.2%) |
Employment Occupations by Sex in Burlington
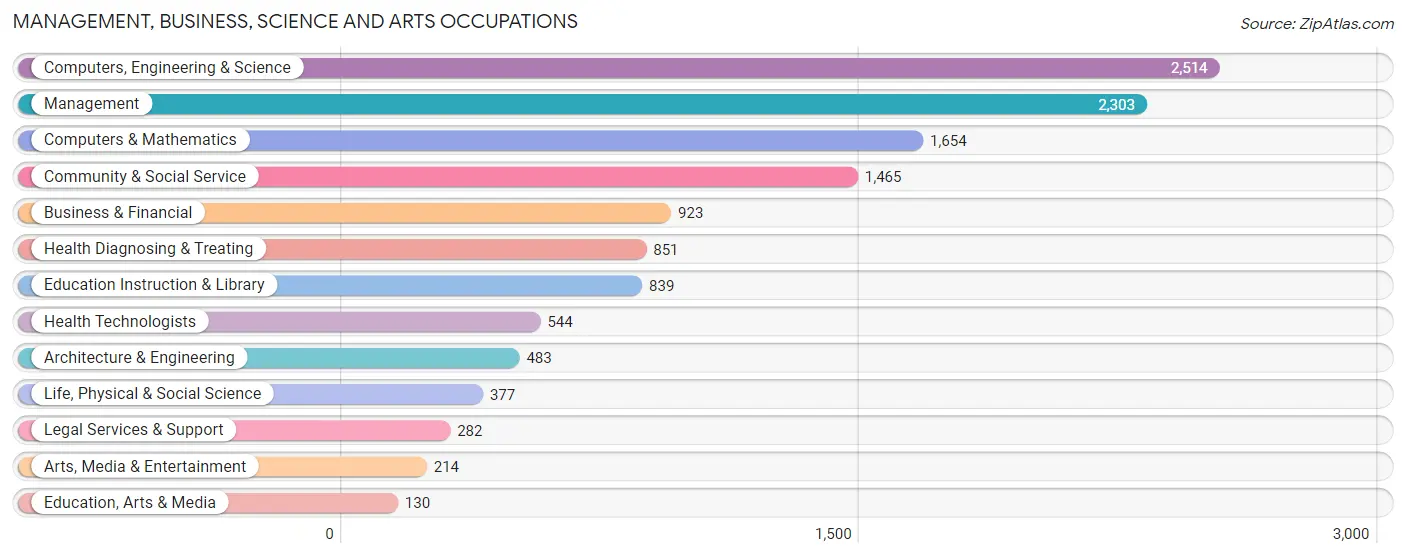
Management, Business, Science and Arts Occupations
The most common Management, Business, Science and Arts occupations in Burlington are Computers, Engineering & Science (2,514 | 18.2%), Management (2,303 | 16.6%), Computers & Mathematics (1,654 | 11.9%), Community & Social Service (1,465 | 10.6%), and Business & Financial (923 | 6.7%).
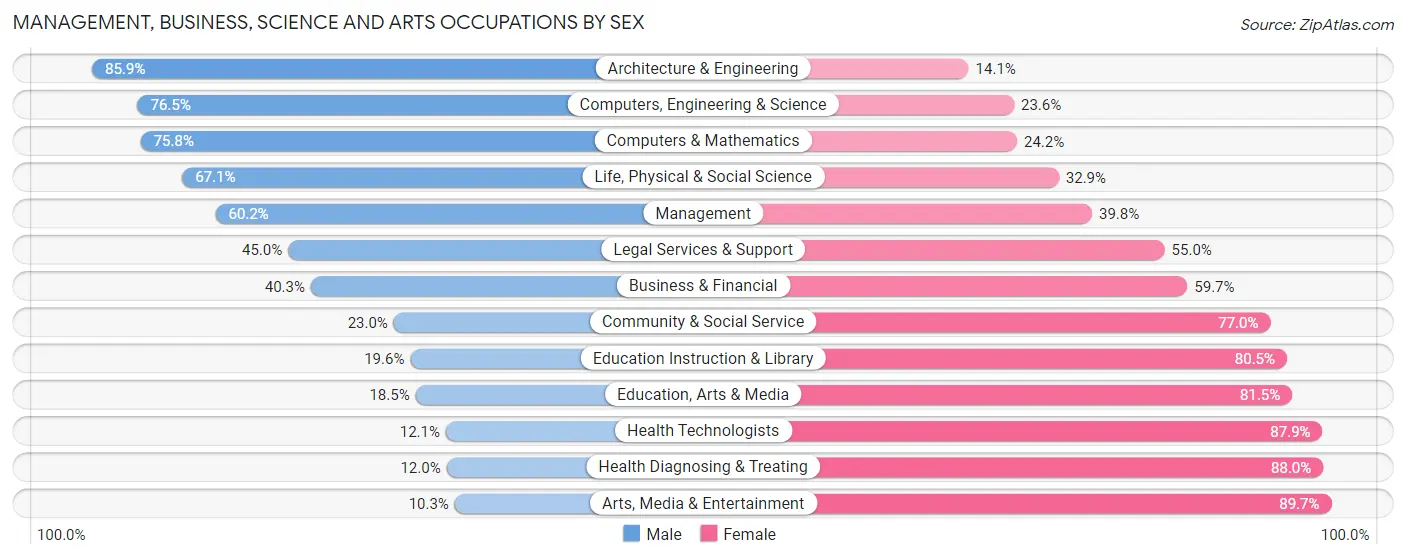
Management, Business, Science and Arts Occupations by Sex
Within the Management, Business, Science and Arts occupations in Burlington, the most male-oriented occupations are Architecture & Engineering (85.9%), Computers, Engineering & Science (76.4%), and Computers & Mathematics (75.8%), while the most female-oriented occupations are Arts, Media & Entertainment (89.7%), Health Diagnosing & Treating (88.0%), and Health Technologists (87.9%).
| Occupation | Male | Female |
| Management | 1,386 (60.2%) | 917 (39.8%) |
| Business & Financial | 372 (40.3%) | 551 (59.7%) |
| Computers, Engineering & Science | 1,922 (76.4%) | 592 (23.5%) |
| Computers & Mathematics | 1,254 (75.8%) | 400 (24.2%) |
| Architecture & Engineering | 415 (85.9%) | 68 (14.1%) |
| Life, Physical & Social Science | 253 (67.1%) | 124 (32.9%) |
| Community & Social Service | 337 (23.0%) | 1,128 (77.0%) |
| Education, Arts & Media | 24 (18.5%) | 106 (81.5%) |
| Legal Services & Support | 127 (45.0%) | 155 (55.0%) |
| Education Instruction & Library | 164 (19.6%) | 675 (80.4%) |
| Arts, Media & Entertainment | 22 (10.3%) | 192 (89.7%) |
| Health Diagnosing & Treating | 102 (12.0%) | 749 (88.0%) |
| Health Technologists | 66 (12.1%) | 478 (87.9%) |
| Total (Category) | 4,119 (51.1%) | 3,937 (48.9%) |
| Total (Overall) | 7,353 (53.1%) | 6,488 (46.9%) |
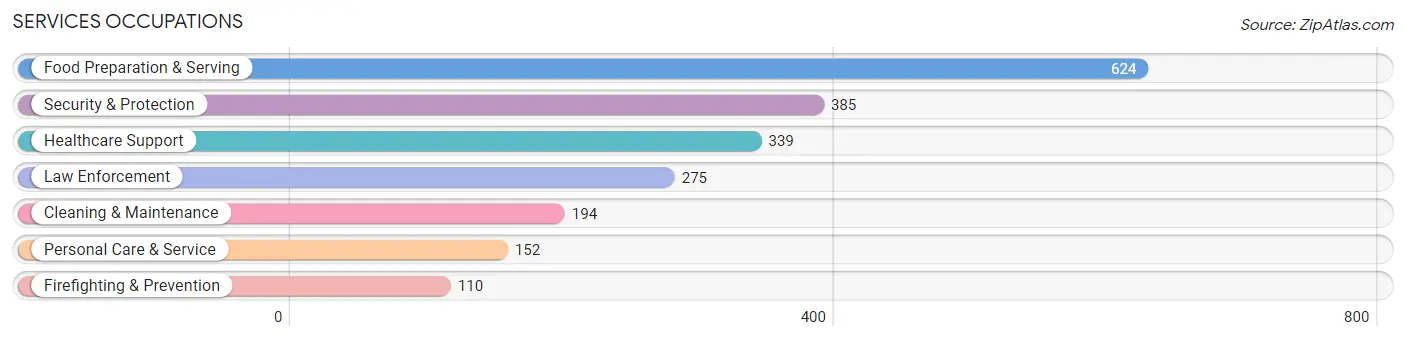
Services Occupations
The most common Services occupations in Burlington are Food Preparation & Serving (624 | 4.5%), Security & Protection (385 | 2.8%), Healthcare Support (339 | 2.5%), Law Enforcement (275 | 2.0%), and Cleaning & Maintenance (194 | 1.4%).
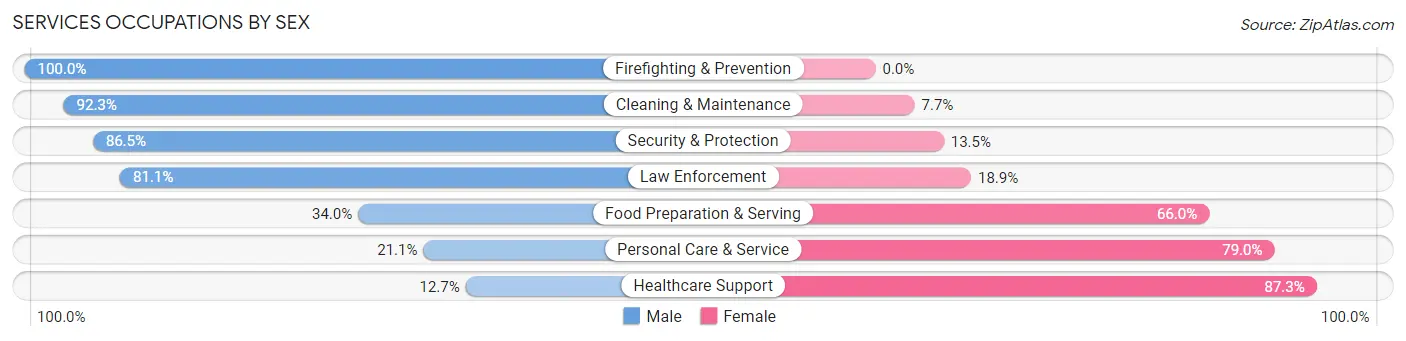
Services Occupations by Sex
Within the Services occupations in Burlington, the most male-oriented occupations are Firefighting & Prevention (100.0%), Cleaning & Maintenance (92.3%), and Security & Protection (86.5%), while the most female-oriented occupations are Healthcare Support (87.3%), Personal Care & Service (78.9%), and Food Preparation & Serving (66.0%).
| Occupation | Male | Female |
| Healthcare Support | 43 (12.7%) | 296 (87.3%) |
| Security & Protection | 333 (86.5%) | 52 (13.5%) |
| Firefighting & Prevention | 110 (100.0%) | 0 (0.0%) |
| Law Enforcement | 223 (81.1%) | 52 (18.9%) |
| Food Preparation & Serving | 212 (34.0%) | 412 (66.0%) |
| Cleaning & Maintenance | 179 (92.3%) | 15 (7.7%) |
| Personal Care & Service | 32 (21.0%) | 120 (78.9%) |
| Total (Category) | 799 (47.2%) | 895 (52.8%) |
| Total (Overall) | 7,353 (53.1%) | 6,488 (46.9%) |
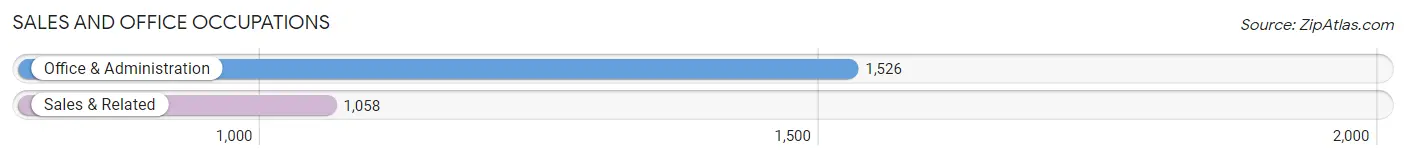
Sales and Office Occupations
The most common Sales and Office occupations in Burlington are Office & Administration (1,526 | 11.0%), and Sales & Related (1,058 | 7.6%).
Sales and Office Occupations by Sex
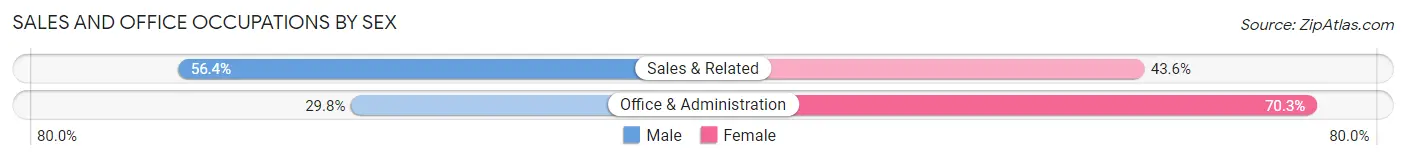
| Occupation | Male | Female |
| Sales & Related | 597 (56.4%) | 461 (43.6%) |
| Office & Administration | 454 (29.7%) | 1,072 (70.3%) |
| Total (Category) | 1,051 (40.7%) | 1,533 (59.3%) |
| Total (Overall) | 7,353 (53.1%) | 6,488 (46.9%) |
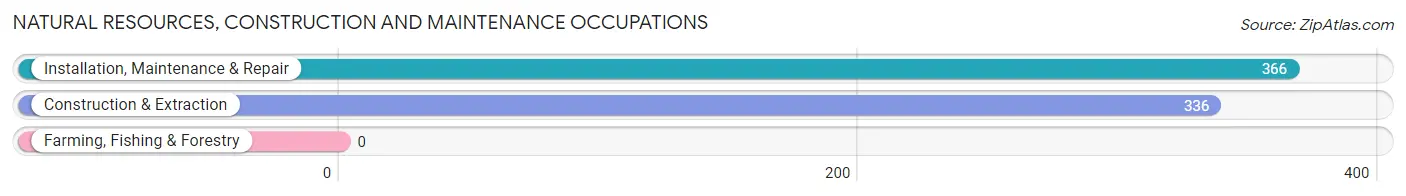
Natural Resources, Construction and Maintenance Occupations
The most common Natural Resources, Construction and Maintenance occupations in Burlington are Installation, Maintenance & Repair (366 | 2.6%), and Construction & Extraction (336 | 2.4%).
Natural Resources, Construction and Maintenance Occupations by Sex
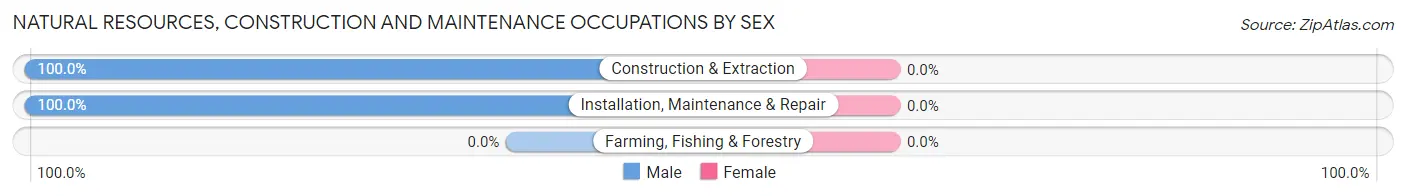
| Occupation | Male | Female |
| Farming, Fishing & Forestry | 0 (0.0%) | 0 (0.0%) |
| Construction & Extraction | 336 (100.0%) | 0 (0.0%) |
| Installation, Maintenance & Repair | 366 (100.0%) | 0 (0.0%) |
| Total (Category) | 702 (100.0%) | 0 (0.0%) |
| Total (Overall) | 7,353 (53.1%) | 6,488 (46.9%) |
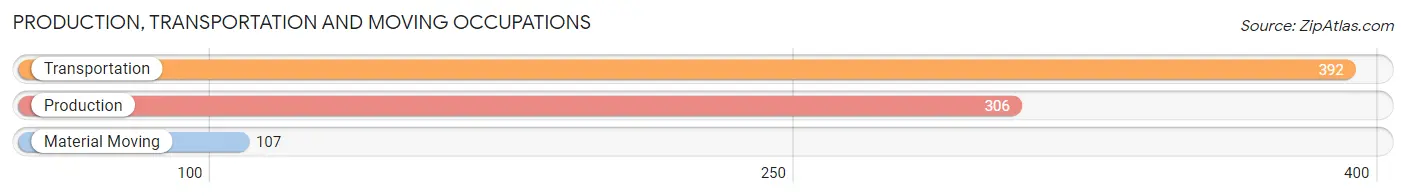
Production, Transportation and Moving Occupations
The most common Production, Transportation and Moving occupations in Burlington are Transportation (392 | 2.8%), Production (306 | 2.2%), and Material Moving (107 | 0.8%).
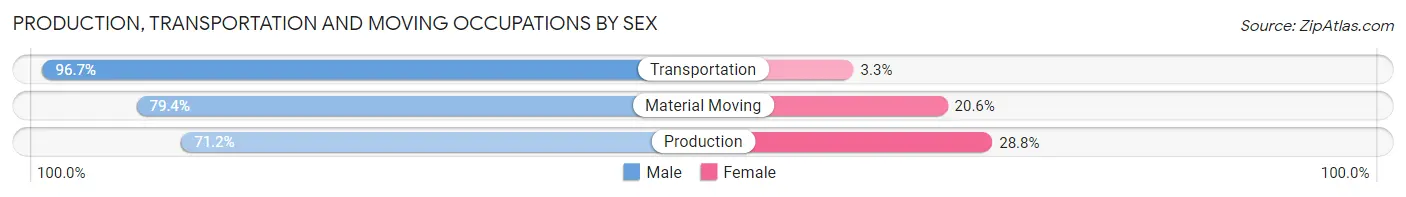
Production, Transportation and Moving Occupations by Sex
| Occupation | Male | Female |
| Production | 218 (71.2%) | 88 (28.8%) |
| Transportation | 379 (96.7%) | 13 (3.3%) |
| Material Moving | 85 (79.4%) | 22 (20.6%) |
| Total (Category) | 682 (84.7%) | 123 (15.3%) |
| Total (Overall) | 7,353 (53.1%) | 6,488 (46.9%) |
Employment Industries by Sex in Burlington
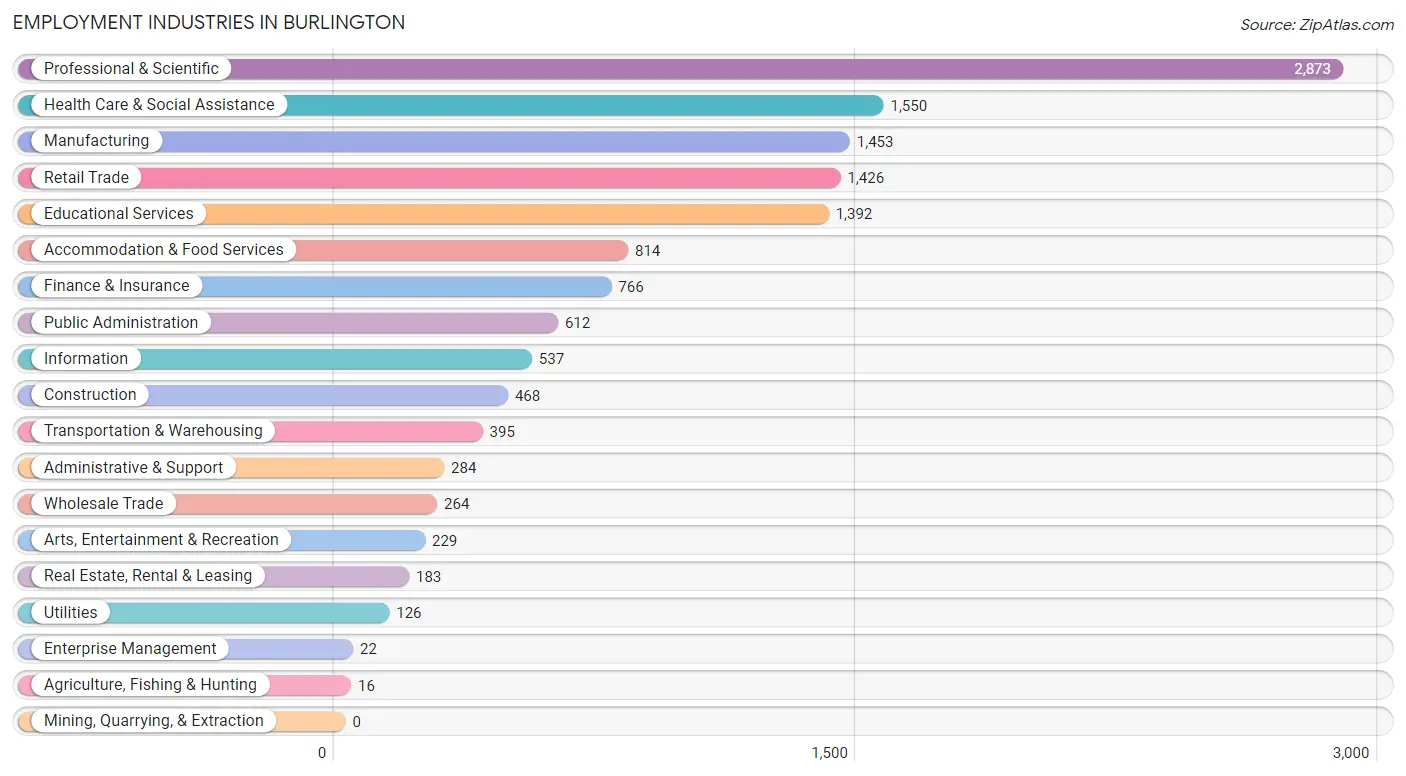
Employment Industries in Burlington
The major employment industries in Burlington include Professional & Scientific (2,873 | 20.8%), Health Care & Social Assistance (1,550 | 11.2%), Manufacturing (1,453 | 10.5%), Retail Trade (1,426 | 10.3%), and Educational Services (1,392 | 10.1%).
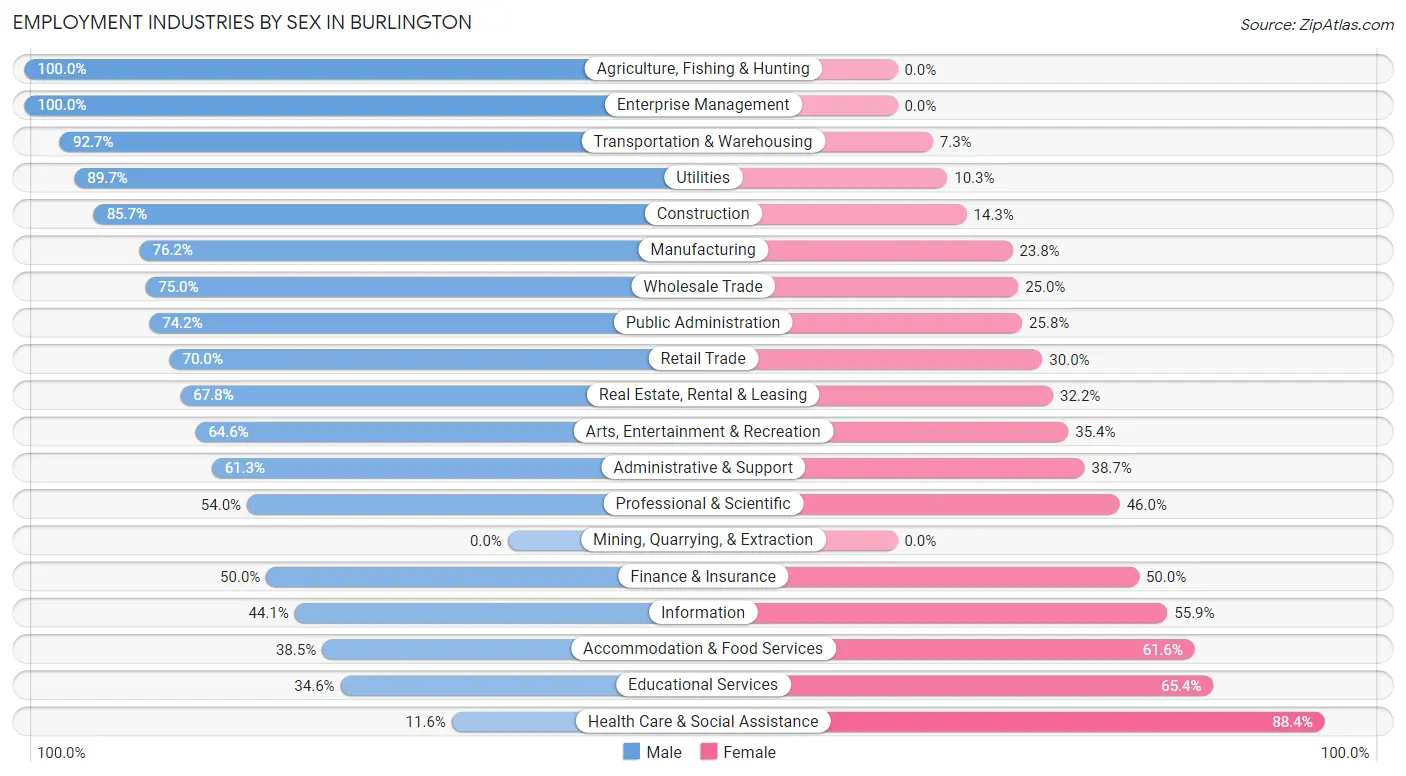
Employment Industries by Sex in Burlington
The Burlington industries that see more men than women are Agriculture, Fishing & Hunting (100.0%), Enterprise Management (100.0%), and Transportation & Warehousing (92.7%), whereas the industries that tend to have a higher number of women are Health Care & Social Assistance (88.4%), Educational Services (65.4%), and Accommodation & Food Services (61.6%).
| Industry | Male | Female |
| Agriculture, Fishing & Hunting | 16 (100.0%) | 0 (0.0%) |
| Mining, Quarrying, & Extraction | 0 (0.0%) | 0 (0.0%) |
| Construction | 401 (85.7%) | 67 (14.3%) |
| Manufacturing | 1,107 (76.2%) | 346 (23.8%) |
| Wholesale Trade | 198 (75.0%) | 66 (25.0%) |
| Retail Trade | 998 (70.0%) | 428 (30.0%) |
| Transportation & Warehousing | 366 (92.7%) | 29 (7.3%) |
| Utilities | 113 (89.7%) | 13 (10.3%) |
| Information | 237 (44.1%) | 300 (55.9%) |
| Finance & Insurance | 383 (50.0%) | 383 (50.0%) |
| Real Estate, Rental & Leasing | 124 (67.8%) | 59 (32.2%) |
| Professional & Scientific | 1,551 (54.0%) | 1,322 (46.0%) |
| Enterprise Management | 22 (100.0%) | 0 (0.0%) |
| Administrative & Support | 174 (61.3%) | 110 (38.7%) |
| Educational Services | 482 (34.6%) | 910 (65.4%) |
| Health Care & Social Assistance | 180 (11.6%) | 1,370 (88.4%) |
| Arts, Entertainment & Recreation | 148 (64.6%) | 81 (35.4%) |
| Accommodation & Food Services | 313 (38.5%) | 501 (61.6%) |
| Public Administration | 454 (74.2%) | 158 (25.8%) |
| Total | 7,353 (53.1%) | 6,488 (46.9%) |
Education in Burlington
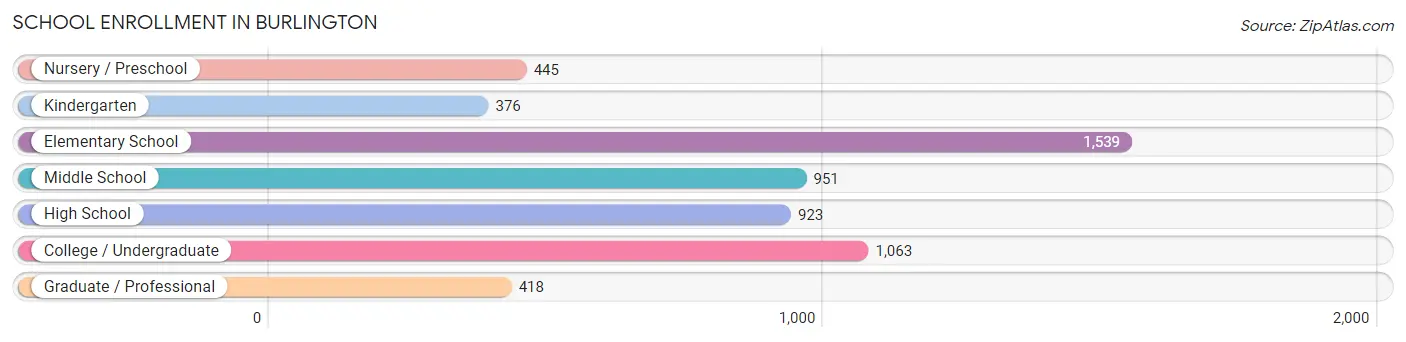
School Enrollment in Burlington
The most common levels of schooling among the 5,715 students in Burlington are elementary school (1,539 | 26.9%), college / undergraduate (1,063 | 18.6%), and middle school (951 | 16.6%).
| School Level | # Students | % Students |
| Nursery / Preschool | 445 | 7.8% |
| Kindergarten | 376 | 6.6% |
| Elementary School | 1,539 | 26.9% |
| Middle School | 951 | 16.6% |
| High School | 923 | 16.2% |
| College / Undergraduate | 1,063 | 18.6% |
| Graduate / Professional | 418 | 7.3% |
| Total | 5,715 | 100.0% |
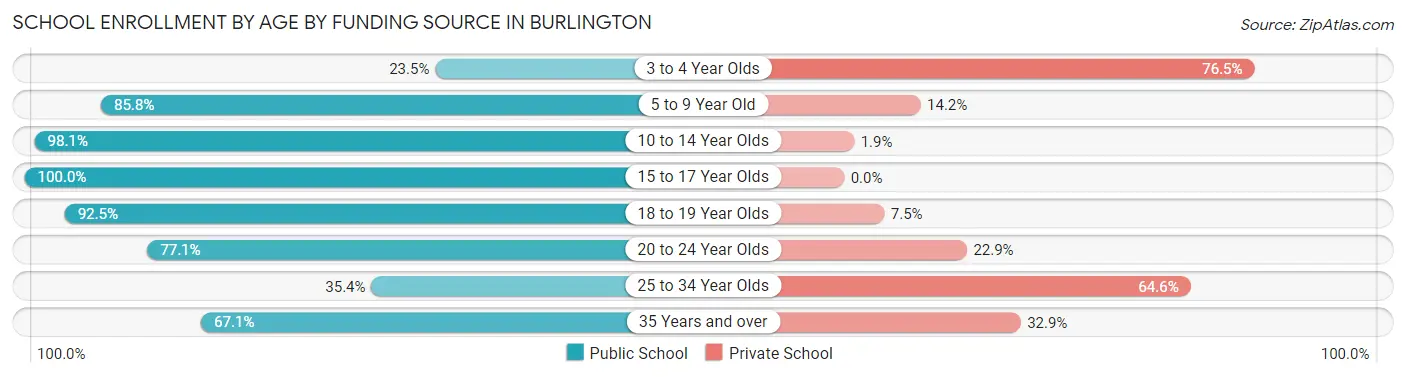
School Enrollment by Age by Funding Source in Burlington
Out of a total of 5,715 students who are enrolled in schools in Burlington, 1,057 (18.5%) attend a private institution, while the remaining 4,658 (81.5%) are enrolled in public schools. The age group of 3 to 4 year olds has the highest likelihood of being enrolled in private schools, with 309 (76.5% in the age bracket) enrolled. Conversely, the age group of 15 to 17 year olds has the lowest likelihood of being enrolled in a private school, with 535 (100.0% in the age bracket) attending a public institution.
| Age Bracket | Public School | Private School |
| 3 to 4 Year Olds | 95 (23.5%) | 309 (76.5%) |
| 5 to 9 Year Old | 1,457 (85.8%) | 242 (14.2%) |
| 10 to 14 Year Olds | 1,315 (98.1%) | 25 (1.9%) |
| 15 to 17 Year Olds | 535 (100.0%) | 0 (0.0%) |
| 18 to 19 Year Olds | 495 (92.5%) | 40 (7.5%) |
| 20 to 24 Year Olds | 408 (77.1%) | 121 (22.9%) |
| 25 to 34 Year Olds | 108 (35.4%) | 197 (64.6%) |
| 35 Years and over | 247 (67.1%) | 121 (32.9%) |
| Total | 4,658 (81.5%) | 1,057 (18.5%) |
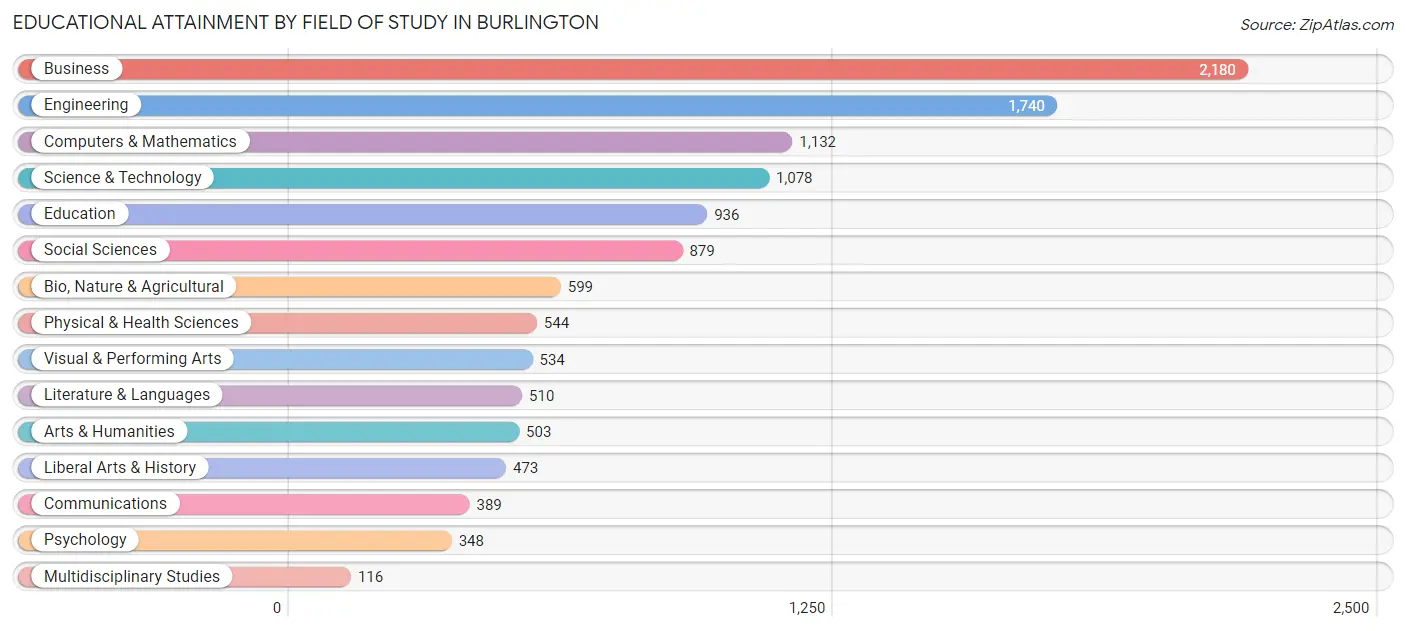
Educational Attainment by Field of Study in Burlington
Business (2,180 | 18.2%), engineering (1,740 | 14.5%), computers & mathematics (1,132 | 9.5%), science & technology (1,078 | 9.0%), and education (936 | 7.8%) are the most common fields of study among 11,961 individuals in Burlington who have obtained a bachelor's degree or higher.
| Field of Study | # Graduates | % Graduates |
| Computers & Mathematics | 1,132 | 9.5% |
| Bio, Nature & Agricultural | 599 | 5.0% |
| Physical & Health Sciences | 544 | 4.5% |
| Psychology | 348 | 2.9% |
| Social Sciences | 879 | 7.3% |
| Engineering | 1,740 | 14.5% |
| Multidisciplinary Studies | 116 | 1.0% |
| Science & Technology | 1,078 | 9.0% |
| Business | 2,180 | 18.2% |
| Education | 936 | 7.8% |
| Literature & Languages | 510 | 4.3% |
| Liberal Arts & History | 473 | 4.0% |
| Visual & Performing Arts | 534 | 4.5% |
| Communications | 389 | 3.3% |
| Arts & Humanities | 503 | 4.2% |
| Total | 11,961 | 100.0% |
Transportation & Commute in Burlington
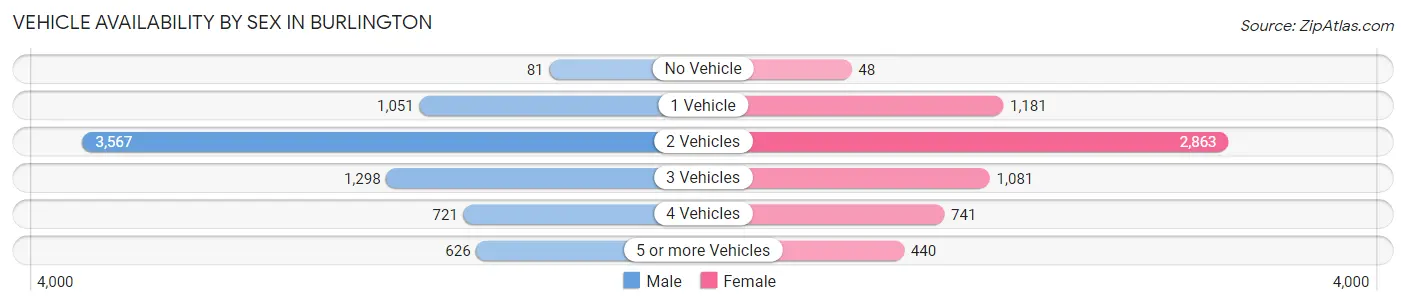
Vehicle Availability by Sex in Burlington
The most prevalent vehicle ownership categories in Burlington are males with 2 vehicles (3,567, accounting for 48.6%) and females with 2 vehicles (2,863, making up 56.1%).
| Vehicles Available | Male | Female |
| No Vehicle | 81 (1.1%) | 48 (0.8%) |
| 1 Vehicle | 1,051 (14.3%) | 1,181 (18.6%) |
| 2 Vehicles | 3,567 (48.6%) | 2,863 (45.1%) |
| 3 Vehicles | 1,298 (17.7%) | 1,081 (17.0%) |
| 4 Vehicles | 721 (9.8%) | 741 (11.7%) |
| 5 or more Vehicles | 626 (8.5%) | 440 (6.9%) |
| Total | 7,344 (100.0%) | 6,354 (100.0%) |
Commute Time in Burlington
The most frequently occuring commute durations in Burlington are 15 to 19 minutes (1,551 commuters, 13.8%), 30 to 34 minutes (1,540 commuters, 13.7%), and 10 to 14 minutes (1,351 commuters, 12.0%).
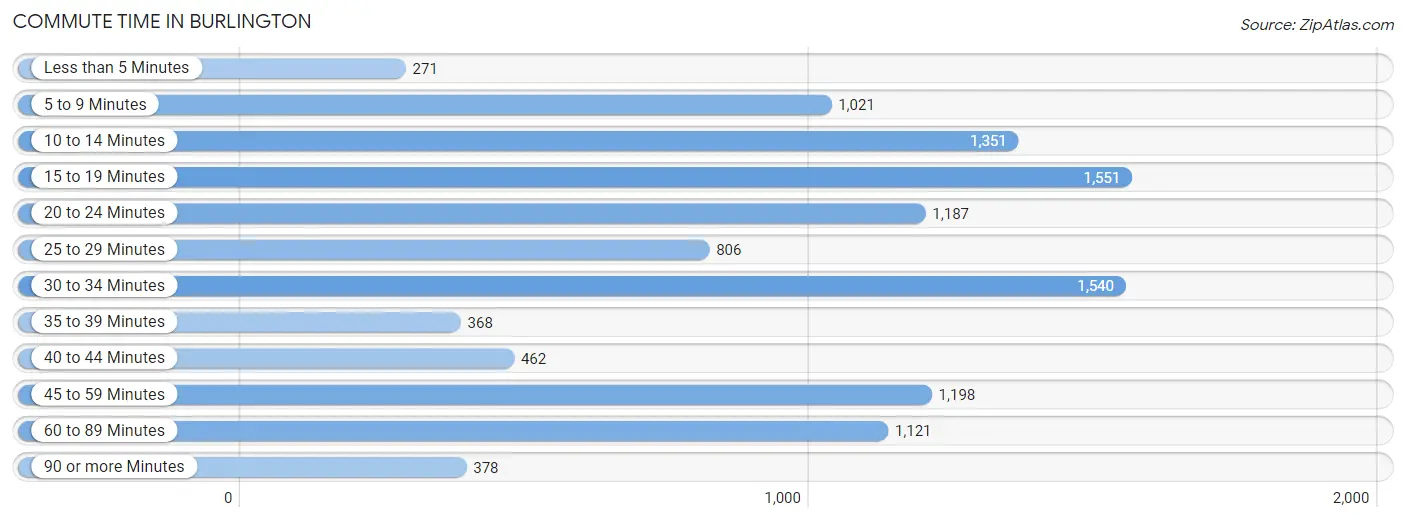
| Commute Time | # Commuters | % Commuters |
| Less than 5 Minutes | 271 | 2.4% |
| 5 to 9 Minutes | 1,021 | 9.1% |
| 10 to 14 Minutes | 1,351 | 12.0% |
| 15 to 19 Minutes | 1,551 | 13.8% |
| 20 to 24 Minutes | 1,187 | 10.5% |
| 25 to 29 Minutes | 806 | 7.2% |
| 30 to 34 Minutes | 1,540 | 13.7% |
| 35 to 39 Minutes | 368 | 3.3% |
| 40 to 44 Minutes | 462 | 4.1% |
| 45 to 59 Minutes | 1,198 | 10.6% |
| 60 to 89 Minutes | 1,121 | 10.0% |
| 90 or more Minutes | 378 | 3.4% |
Commute Time by Sex in Burlington
The most common commute times in Burlington are 30 to 34 minutes (924 commuters, 15.3%) for males and 15 to 19 minutes (924 commuters, 17.8%) for females.
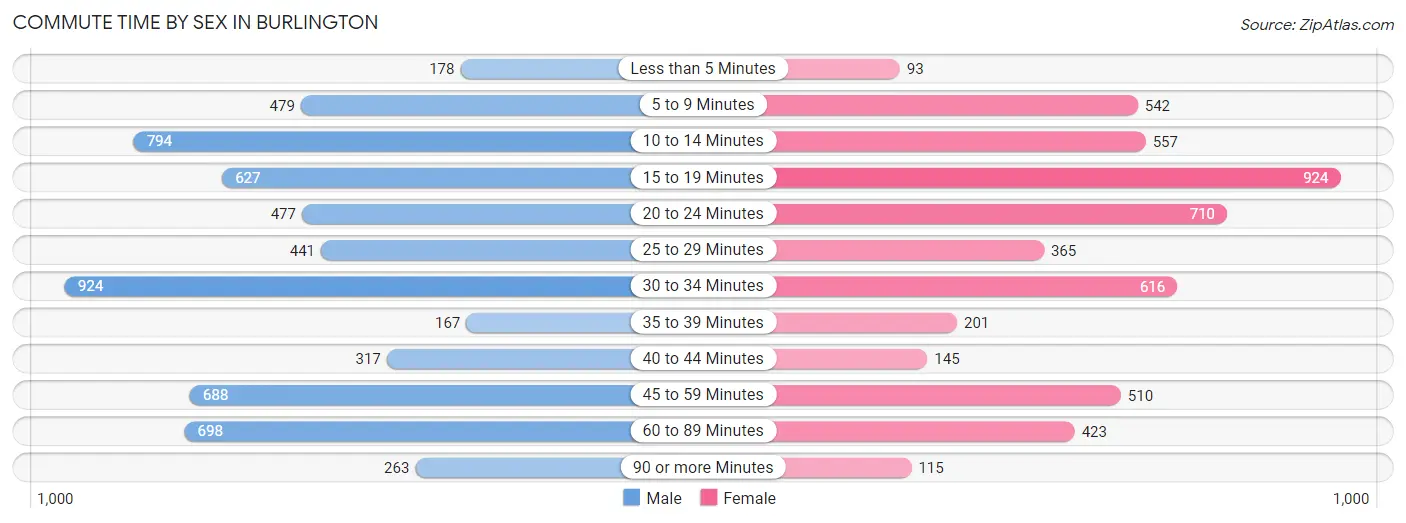
| Commute Time | Male | Female |
| Less than 5 Minutes | 178 (2.9%) | 93 (1.8%) |
| 5 to 9 Minutes | 479 (7.9%) | 542 (10.4%) |
| 10 to 14 Minutes | 794 (13.1%) | 557 (10.7%) |
| 15 to 19 Minutes | 627 (10.4%) | 924 (17.8%) |
| 20 to 24 Minutes | 477 (7.9%) | 710 (13.7%) |
| 25 to 29 Minutes | 441 (7.3%) | 365 (7.0%) |
| 30 to 34 Minutes | 924 (15.3%) | 616 (11.8%) |
| 35 to 39 Minutes | 167 (2.8%) | 201 (3.9%) |
| 40 to 44 Minutes | 317 (5.2%) | 145 (2.8%) |
| 45 to 59 Minutes | 688 (11.4%) | 510 (9.8%) |
| 60 to 89 Minutes | 698 (11.5%) | 423 (8.1%) |
| 90 or more Minutes | 263 (4.3%) | 115 (2.2%) |
Time of Departure to Work by Sex in Burlington
The most frequent times of departure to work in Burlington are 7:30 AM to 7:59 AM (978, 16.2%) for males and 7:00 AM to 7:29 AM (856, 16.5%) for females.
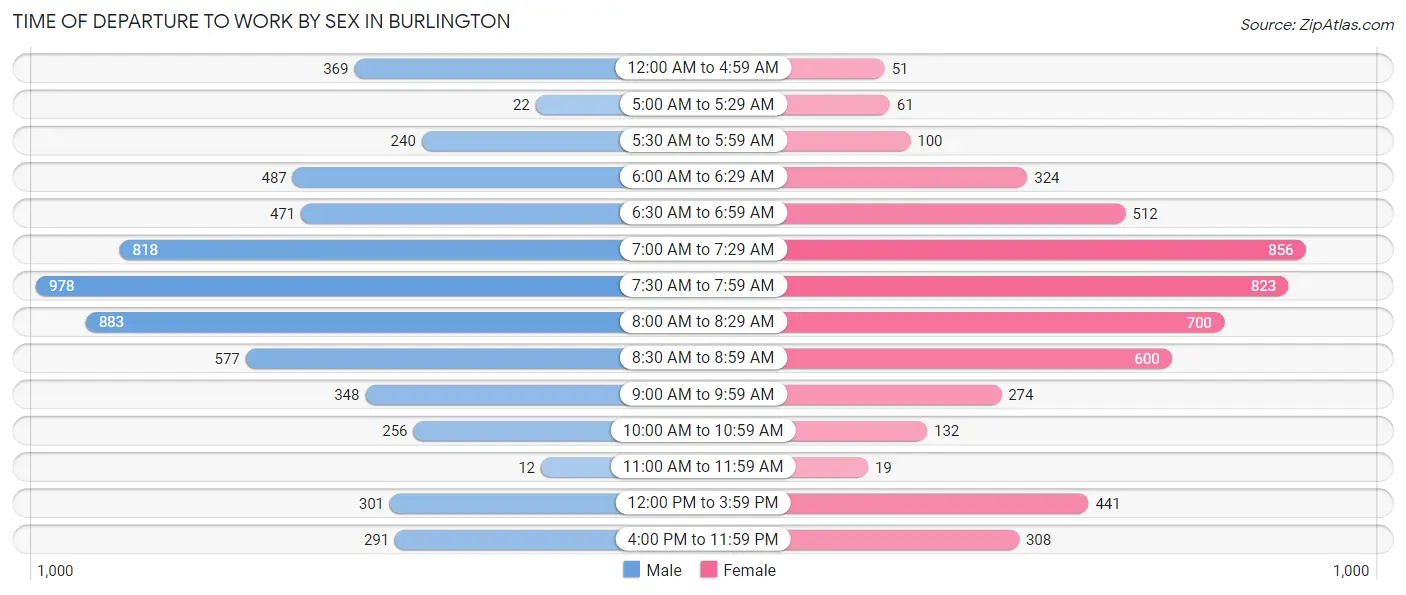
| Time of Departure | Male | Female |
| 12:00 AM to 4:59 AM | 369 (6.1%) | 51 (1.0%) |
| 5:00 AM to 5:29 AM | 22 (0.4%) | 61 (1.2%) |
| 5:30 AM to 5:59 AM | 240 (4.0%) | 100 (1.9%) |
| 6:00 AM to 6:29 AM | 487 (8.1%) | 324 (6.2%) |
| 6:30 AM to 6:59 AM | 471 (7.8%) | 512 (9.8%) |
| 7:00 AM to 7:29 AM | 818 (13.5%) | 856 (16.5%) |
| 7:30 AM to 7:59 AM | 978 (16.2%) | 823 (15.8%) |
| 8:00 AM to 8:29 AM | 883 (14.6%) | 700 (13.5%) |
| 8:30 AM to 8:59 AM | 577 (9.5%) | 600 (11.5%) |
| 9:00 AM to 9:59 AM | 348 (5.8%) | 274 (5.3%) |
| 10:00 AM to 10:59 AM | 256 (4.2%) | 132 (2.5%) |
| 11:00 AM to 11:59 AM | 12 (0.2%) | 19 (0.4%) |
| 12:00 PM to 3:59 PM | 301 (5.0%) | 441 (8.5%) |
| 4:00 PM to 11:59 PM | 291 (4.8%) | 308 (5.9%) |
| Total | 6,053 (100.0%) | 5,201 (100.0%) |
Housing Occupancy in Burlington
Occupancy by Ownership in Burlington
Of the total 10,059 dwellings in Burlington, owner-occupied units account for 7,390 (73.5%), while renter-occupied units make up 2,669 (26.5%).
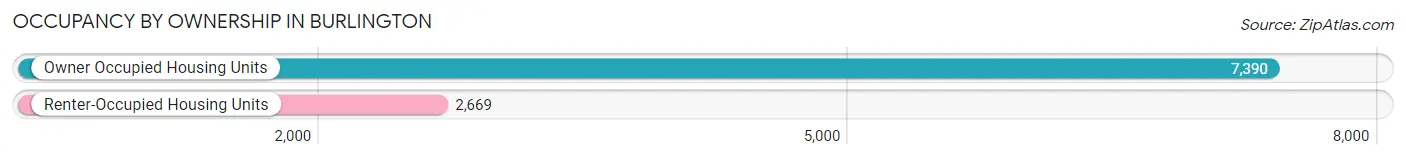
| Occupancy | # Housing Units | % Housing Units |
| Owner Occupied Housing Units | 7,390 | 73.5% |
| Renter-Occupied Housing Units | 2,669 | 26.5% |
| Total Occupied Housing Units | 10,059 | 100.0% |
Occupancy by Household Size in Burlington
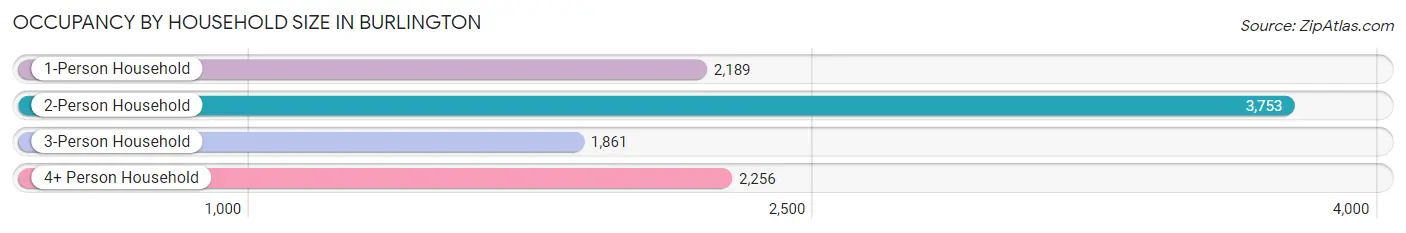
| Household Size | # Housing Units | % Housing Units |
| 1-Person Household | 2,189 | 21.8% |
| 2-Person Household | 3,753 | 37.3% |
| 3-Person Household | 1,861 | 18.5% |
| 4+ Person Household | 2,256 | 22.4% |
| Total Housing Units | 10,059 | 100.0% |
Occupancy by Ownership by Household Size in Burlington
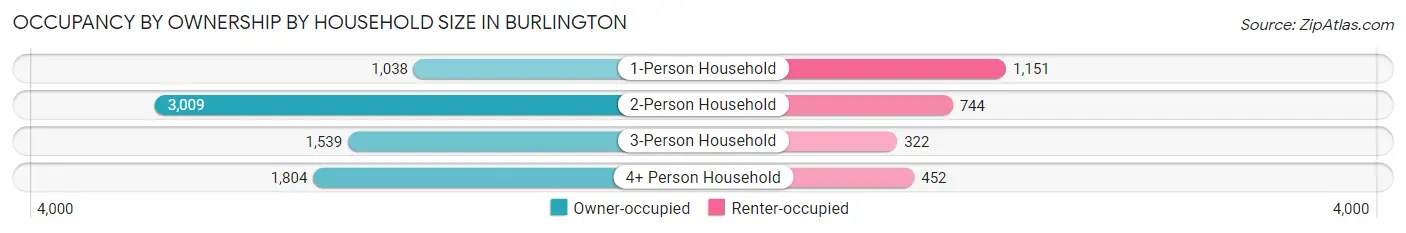
| Household Size | Owner-occupied | Renter-occupied |
| 1-Person Household | 1,038 (47.4%) | 1,151 (52.6%) |
| 2-Person Household | 3,009 (80.2%) | 744 (19.8%) |
| 3-Person Household | 1,539 (82.7%) | 322 (17.3%) |
| 4+ Person Household | 1,804 (80.0%) | 452 (20.0%) |
| Total Housing Units | 7,390 (73.5%) | 2,669 (26.5%) |
Occupancy by Educational Attainment in Burlington
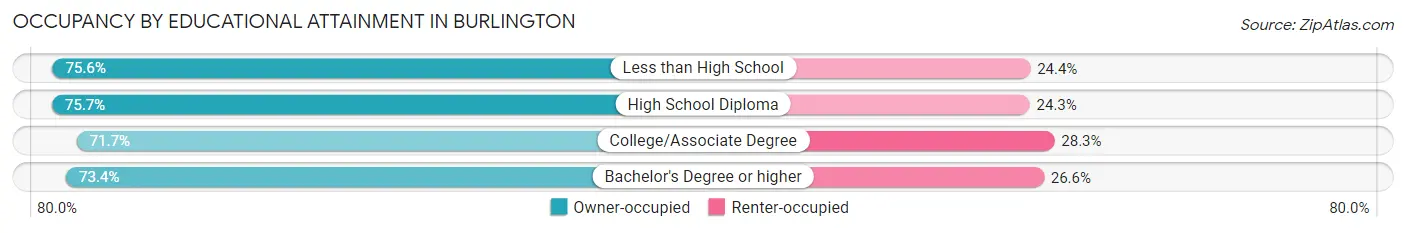
| Household Size | Owner-occupied | Renter-occupied |
| Less than High School | 133 (75.6%) | 43 (24.4%) |
| High School Diploma | 1,153 (75.7%) | 371 (24.3%) |
| College/Associate Degree | 1,391 (71.7%) | 548 (28.3%) |
| Bachelor's Degree or higher | 4,713 (73.4%) | 1,707 (26.6%) |
Occupancy by Age of Householder in Burlington
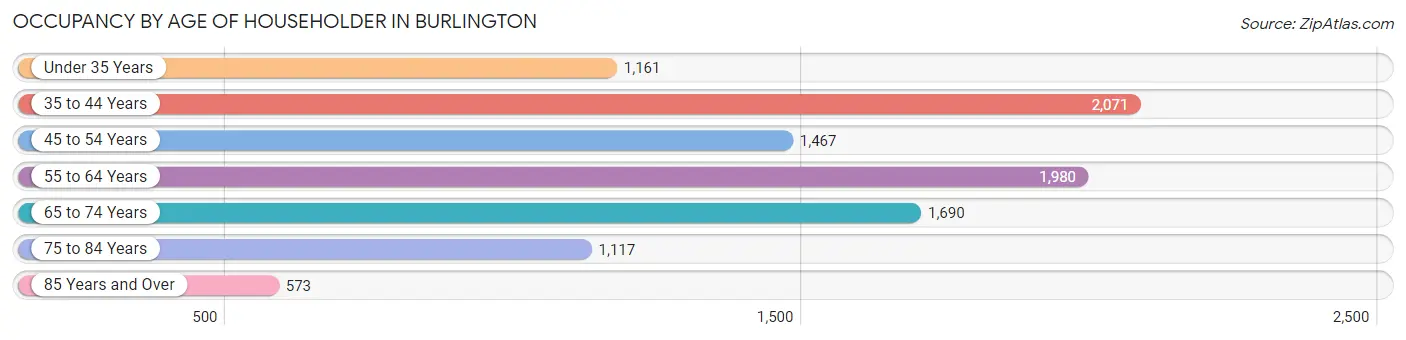
| Age Bracket | # Households | % Households |
| Under 35 Years | 1,161 | 11.5% |
| 35 to 44 Years | 2,071 | 20.6% |
| 45 to 54 Years | 1,467 | 14.6% |
| 55 to 64 Years | 1,980 | 19.7% |
| 65 to 74 Years | 1,690 | 16.8% |
| 75 to 84 Years | 1,117 | 11.1% |
| 85 Years and Over | 573 | 5.7% |
| Total | 10,059 | 100.0% |
Housing Finances in Burlington
Median Income by Occupancy in Burlington
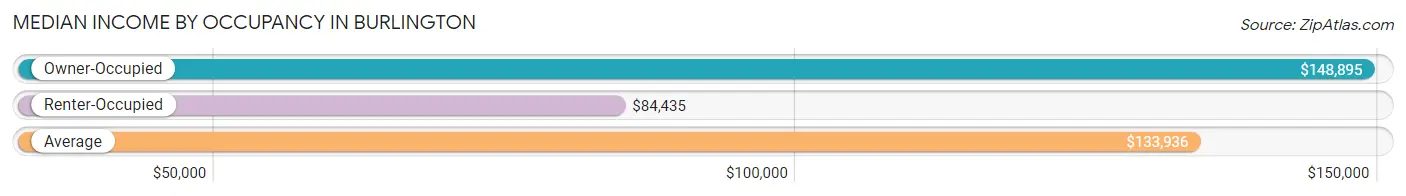
| Occupancy Type | # Households | Median Income |
| Owner-Occupied | 7,390 (73.5%) | $148,895 |
| Renter-Occupied | 2,669 (26.5%) | $84,435 |
| Average | 10,059 (100.0%) | $133,936 |
Occupancy by Householder Income Bracket in Burlington
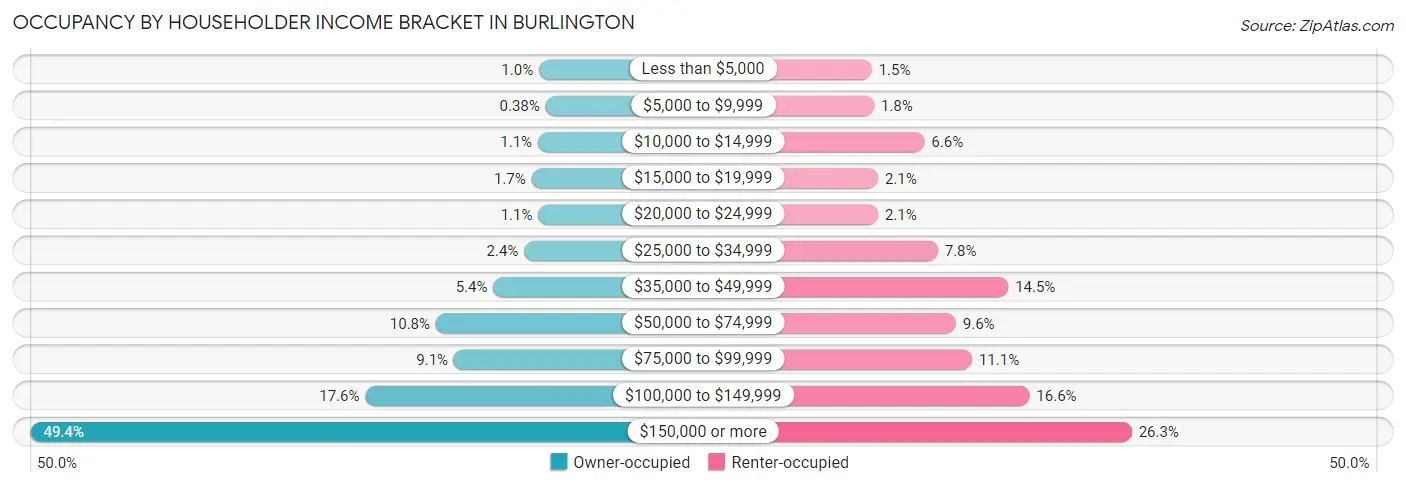
| Income Bracket | Owner-occupied | Renter-occupied |
| Less than $5,000 | 75 (1.0%) | 41 (1.5%) |
| $5,000 to $9,999 | 28 (0.4%) | 47 (1.8%) |
| $10,000 to $14,999 | 82 (1.1%) | 175 (6.6%) |
| $15,000 to $19,999 | 127 (1.7%) | 57 (2.1%) |
| $20,000 to $24,999 | 80 (1.1%) | 57 (2.1%) |
| $25,000 to $34,999 | 179 (2.4%) | 209 (7.8%) |
| $35,000 to $49,999 | 396 (5.4%) | 388 (14.5%) |
| $50,000 to $74,999 | 800 (10.8%) | 255 (9.6%) |
| $75,000 to $99,999 | 673 (9.1%) | 296 (11.1%) |
| $100,000 to $149,999 | 1,297 (17.5%) | 442 (16.6%) |
| $150,000 or more | 3,653 (49.4%) | 702 (26.3%) |
| Total | 7,390 (100.0%) | 2,669 (100.0%) |
Monthly Housing Cost Tiers in Burlington
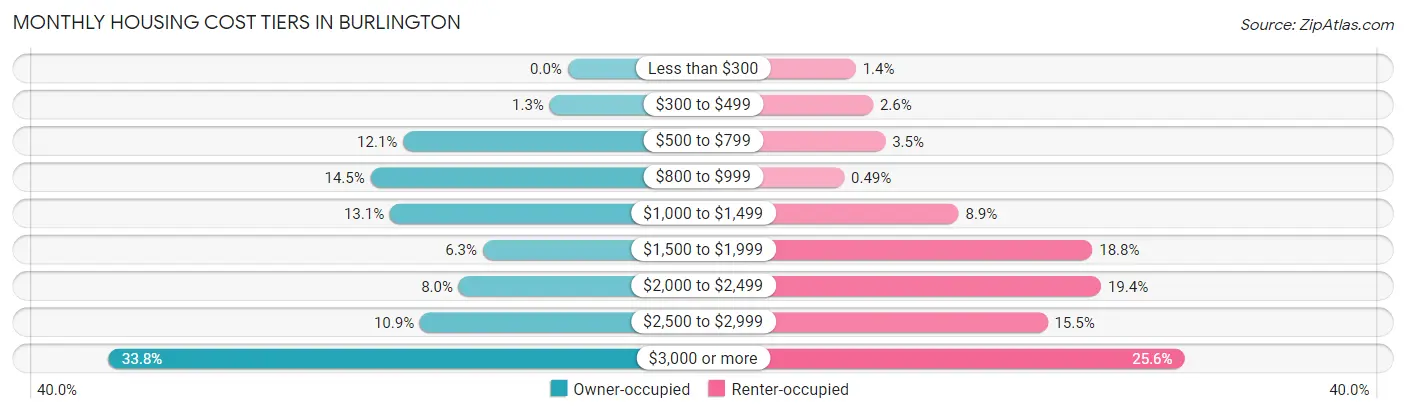
| Monthly Cost | Owner-occupied | Renter-occupied |
| Less than $300 | 0 (0.0%) | 36 (1.3%) |
| $300 to $499 | 98 (1.3%) | 70 (2.6%) |
| $500 to $799 | 896 (12.1%) | 94 (3.5%) |
| $800 to $999 | 1,073 (14.5%) | 13 (0.5%) |
| $1,000 to $1,499 | 967 (13.1%) | 238 (8.9%) |
| $1,500 to $1,999 | 462 (6.2%) | 501 (18.8%) |
| $2,000 to $2,499 | 593 (8.0%) | 518 (19.4%) |
| $2,500 to $2,999 | 804 (10.9%) | 413 (15.5%) |
| $3,000 or more | 2,497 (33.8%) | 682 (25.6%) |
| Total | 7,390 (100.0%) | 2,669 (100.0%) |
Physical Housing Characteristics in Burlington
Housing Structures in Burlington
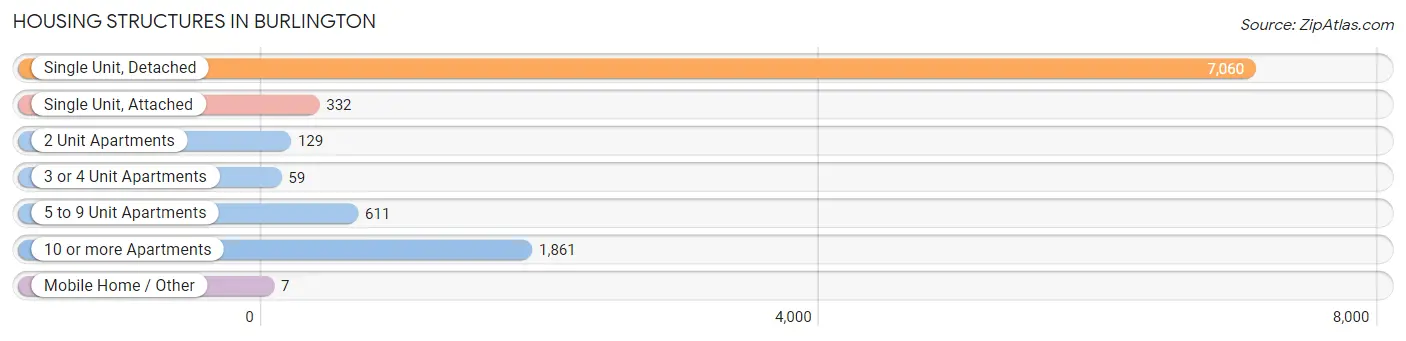
| Structure Type | # Housing Units | % Housing Units |
| Single Unit, Detached | 7,060 | 70.2% |
| Single Unit, Attached | 332 | 3.3% |
| 2 Unit Apartments | 129 | 1.3% |
| 3 or 4 Unit Apartments | 59 | 0.6% |
| 5 to 9 Unit Apartments | 611 | 6.1% |
| 10 or more Apartments | 1,861 | 18.5% |
| Mobile Home / Other | 7 | 0.1% |
| Total | 10,059 | 100.0% |
Housing Structures by Occupancy in Burlington
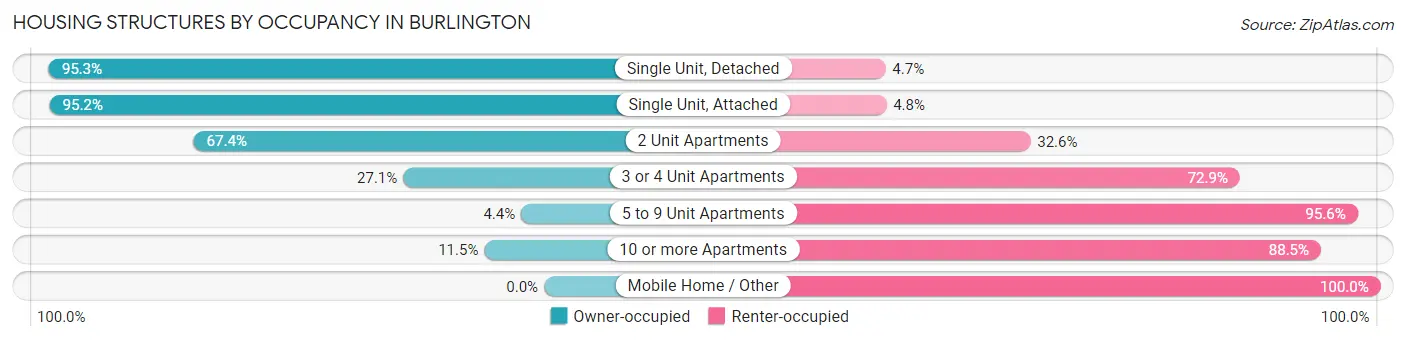
| Structure Type | Owner-occupied | Renter-occupied |
| Single Unit, Detached | 6,730 (95.3%) | 330 (4.7%) |
| Single Unit, Attached | 316 (95.2%) | 16 (4.8%) |
| 2 Unit Apartments | 87 (67.4%) | 42 (32.6%) |
| 3 or 4 Unit Apartments | 16 (27.1%) | 43 (72.9%) |
| 5 to 9 Unit Apartments | 27 (4.4%) | 584 (95.6%) |
| 10 or more Apartments | 214 (11.5%) | 1,647 (88.5%) |
| Mobile Home / Other | 0 (0.0%) | 7 (100.0%) |
| Total | 7,390 (73.5%) | 2,669 (26.5%) |
Housing Structures by Number of Rooms in Burlington
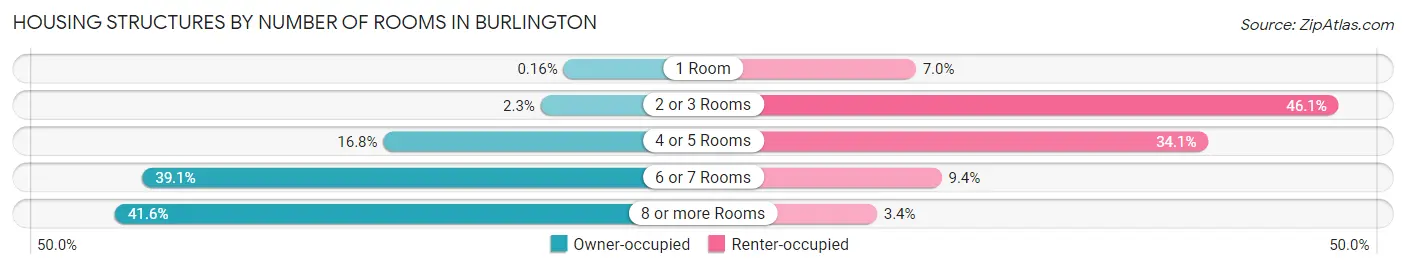
| Number of Rooms | Owner-occupied | Renter-occupied |
| 1 Room | 12 (0.2%) | 187 (7.0%) |
| 2 or 3 Rooms | 168 (2.3%) | 1,231 (46.1%) |
| 4 or 5 Rooms | 1,243 (16.8%) | 909 (34.1%) |
| 6 or 7 Rooms | 2,890 (39.1%) | 251 (9.4%) |
| 8 or more Rooms | 3,077 (41.6%) | 91 (3.4%) |
| Total | 7,390 (100.0%) | 2,669 (100.0%) |
Housing Structure by Heating Type in Burlington
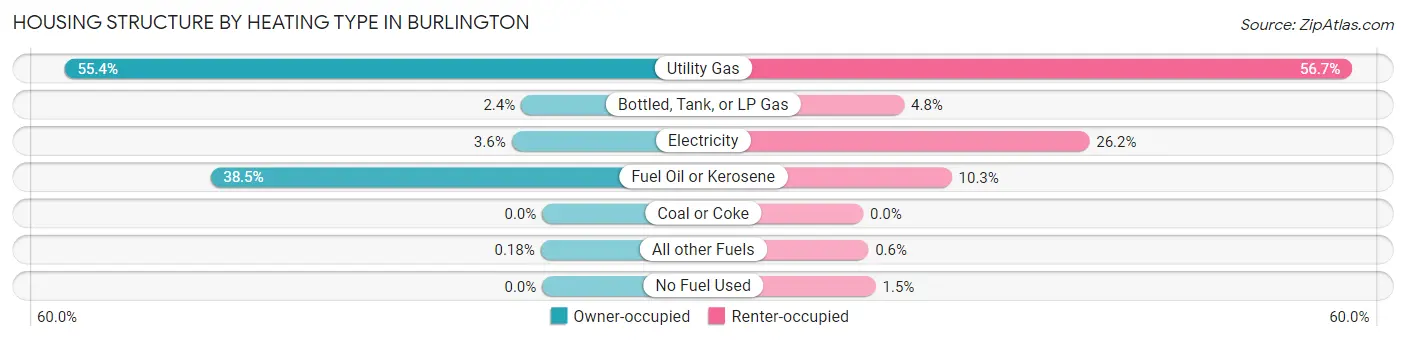
| Heating Type | Owner-occupied | Renter-occupied |
| Utility Gas | 4,092 (55.4%) | 1,513 (56.7%) |
| Bottled, Tank, or LP Gas | 180 (2.4%) | 127 (4.8%) |
| Electricity | 262 (3.5%) | 700 (26.2%) |
| Fuel Oil or Kerosene | 2,843 (38.5%) | 274 (10.3%) |
| Coal or Coke | 0 (0.0%) | 0 (0.0%) |
| All other Fuels | 13 (0.2%) | 16 (0.6%) |
| No Fuel Used | 0 (0.0%) | 39 (1.5%) |
| Total | 7,390 (100.0%) | 2,669 (100.0%) |
Household Vehicle Usage in Burlington
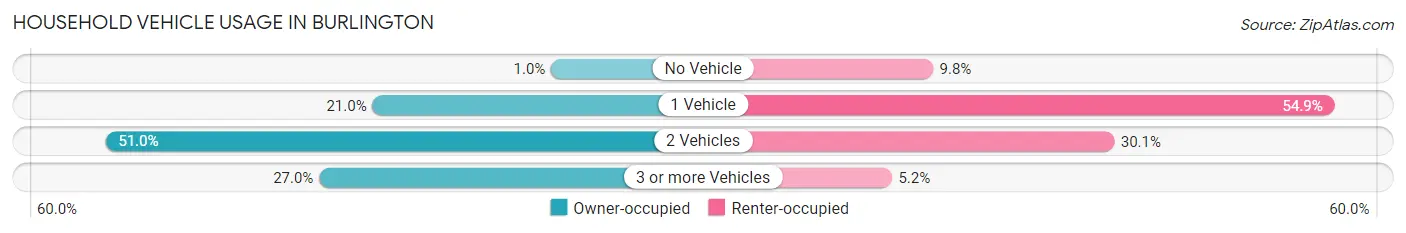
| Vehicles per Household | Owner-occupied | Renter-occupied |
| No Vehicle | 75 (1.0%) | 262 (9.8%) |
| 1 Vehicle | 1,554 (21.0%) | 1,464 (54.8%) |
| 2 Vehicles | 3,766 (51.0%) | 804 (30.1%) |
| 3 or more Vehicles | 1,995 (27.0%) | 139 (5.2%) |
| Total | 7,390 (100.0%) | 2,669 (100.0%) |
Real Estate & Mortgages in Burlington
Real Estate and Mortgage Overview in Burlington
| Characteristic | Without Mortgage | With Mortgage |
| Housing Units | 2,897 | 4,493 |
| Median Property Value | $632,700 | $679,100 |
| Median Household Income | $97,831 | $2,639 |
| Monthly Housing Costs | $908 | $2,492 |
| Real Estate Taxes | $5,638 | $64 |
Property Value by Mortgage Status in Burlington
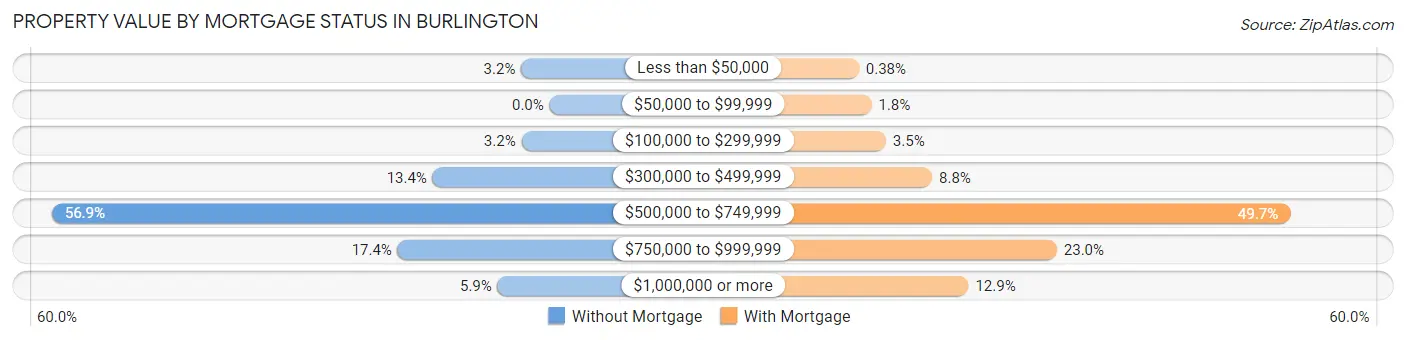
| Property Value | Without Mortgage | With Mortgage |
| Less than $50,000 | 94 (3.2%) | 17 (0.4%) |
| $50,000 to $99,999 | 0 (0.0%) | 82 (1.8%) |
| $100,000 to $299,999 | 93 (3.2%) | 156 (3.5%) |
| $300,000 to $499,999 | 387 (13.4%) | 393 (8.7%) |
| $500,000 to $749,999 | 1,648 (56.9%) | 2,231 (49.7%) |
| $750,000 to $999,999 | 503 (17.4%) | 1,034 (23.0%) |
| $1,000,000 or more | 172 (5.9%) | 580 (12.9%) |
| Total | 2,897 (100.0%) | 4,493 (100.0%) |
Household Income by Mortgage Status in Burlington
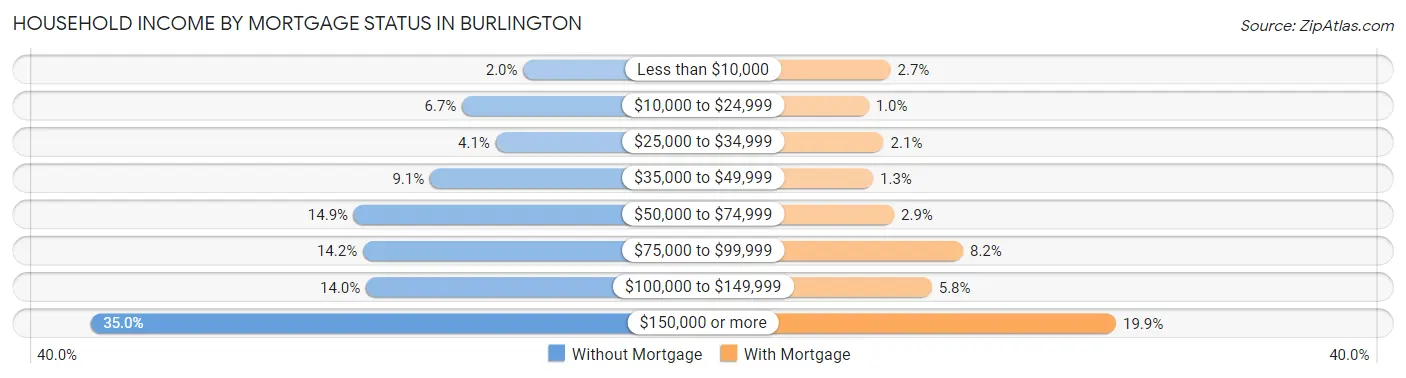
| Household Income | Without Mortgage | With Mortgage |
| Less than $10,000 | 58 (2.0%) | 120 (2.7%) |
| $10,000 to $24,999 | 193 (6.7%) | 45 (1.0%) |
| $25,000 to $34,999 | 119 (4.1%) | 96 (2.1%) |
| $35,000 to $49,999 | 264 (9.1%) | 60 (1.3%) |
| $50,000 to $74,999 | 432 (14.9%) | 132 (2.9%) |
| $75,000 to $99,999 | 412 (14.2%) | 368 (8.2%) |
| $100,000 to $149,999 | 405 (14.0%) | 261 (5.8%) |
| $150,000 or more | 1,014 (35.0%) | 892 (19.9%) |
| Total | 2,897 (100.0%) | 4,493 (100.0%) |
Property Value to Household Income Ratio in Burlington
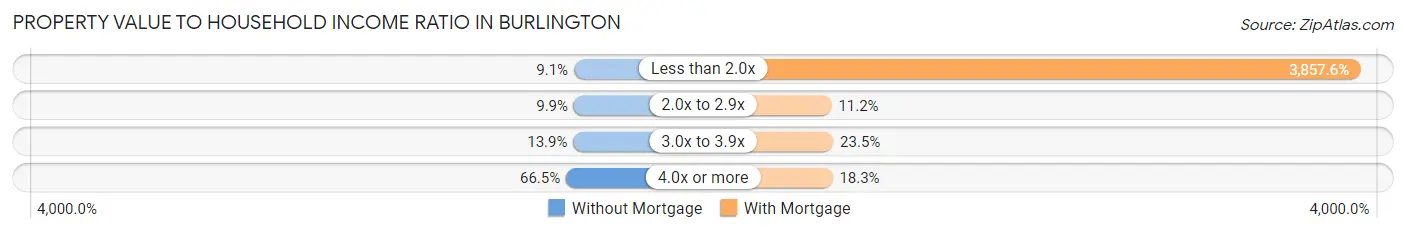
| Value-to-Income Ratio | Without Mortgage | With Mortgage |
| Less than 2.0x | 264 (9.1%) | 173,320 (3,857.6%) |
| 2.0x to 2.9x | 287 (9.9%) | 501 (11.2%) |
| 3.0x to 3.9x | 402 (13.9%) | 1,055 (23.5%) |
| 4.0x or more | 1,926 (66.5%) | 820 (18.2%) |
| Total | 2,897 (100.0%) | 4,493 (100.0%) |
Real Estate Taxes by Mortgage Status in Burlington
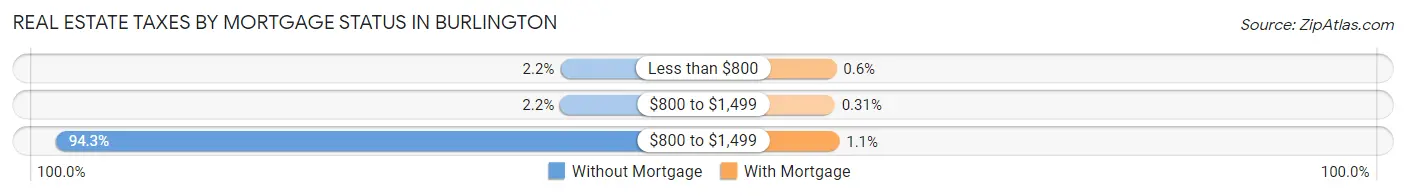
| Property Taxes | Without Mortgage | With Mortgage |
| Less than $800 | 63 (2.2%) | 27 (0.6%) |
| $800 to $1,499 | 64 (2.2%) | 14 (0.3%) |
| $800 to $1,499 | 2,732 (94.3%) | 51 (1.1%) |
| Total | 2,897 (100.0%) | 4,493 (100.0%) |
Health & Disability in Burlington
Health Insurance Coverage by Age in Burlington
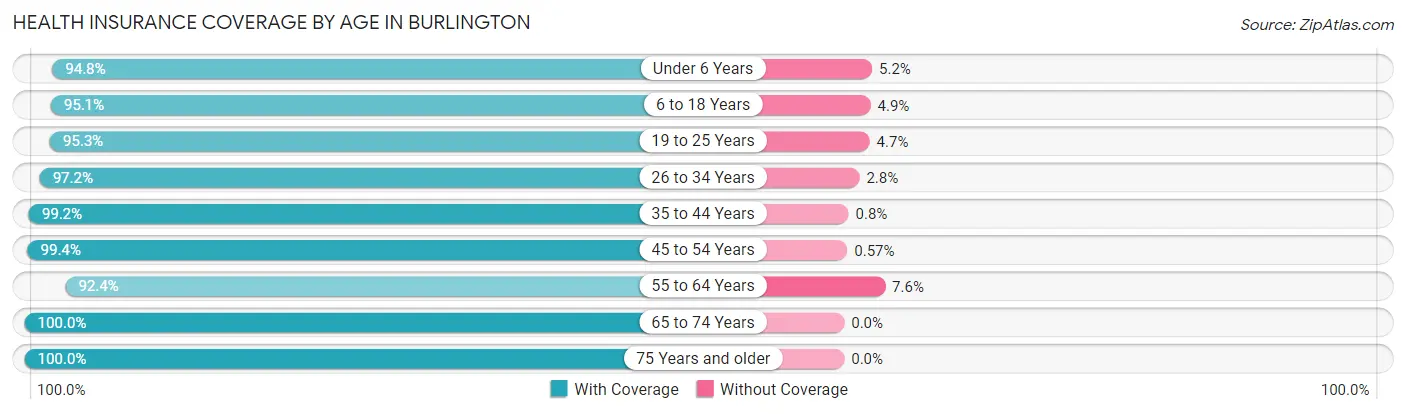
| Age Bracket | With Coverage | Without Coverage |
| Under 6 Years | 1,539 (94.8%) | 84 (5.2%) |
| 6 to 18 Years | 3,548 (95.1%) | 183 (4.9%) |
| 19 to 25 Years | 1,731 (95.3%) | 86 (4.7%) |
| 26 to 34 Years | 2,366 (97.2%) | 69 (2.8%) |
| 35 to 44 Years | 3,712 (99.2%) | 30 (0.8%) |
| 45 to 54 Years | 3,335 (99.4%) | 19 (0.6%) |
| 55 to 64 Years | 3,530 (92.4%) | 291 (7.6%) |
| 65 to 74 Years | 2,751 (100.0%) | 0 (0.0%) |
| 75 Years and older | 2,743 (100.0%) | 0 (0.0%) |
| Total | 25,255 (97.1%) | 762 (2.9%) |
Health Insurance Coverage by Citizenship Status in Burlington
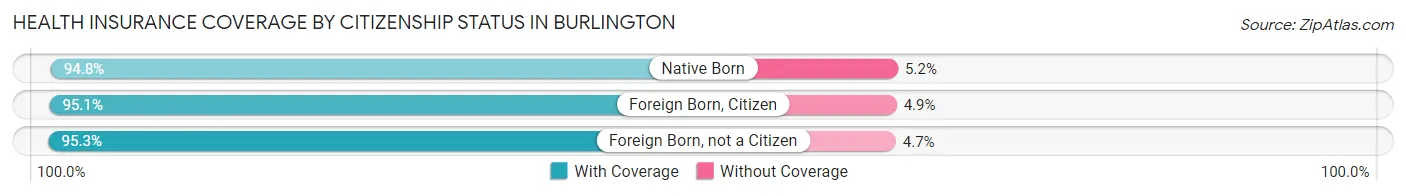
| Citizenship Status | With Coverage | Without Coverage |
| Native Born | 1,539 (94.8%) | 84 (5.2%) |
| Foreign Born, Citizen | 3,548 (95.1%) | 183 (4.9%) |
| Foreign Born, not a Citizen | 1,731 (95.3%) | 86 (4.7%) |
Health Insurance Coverage by Household Income in Burlington
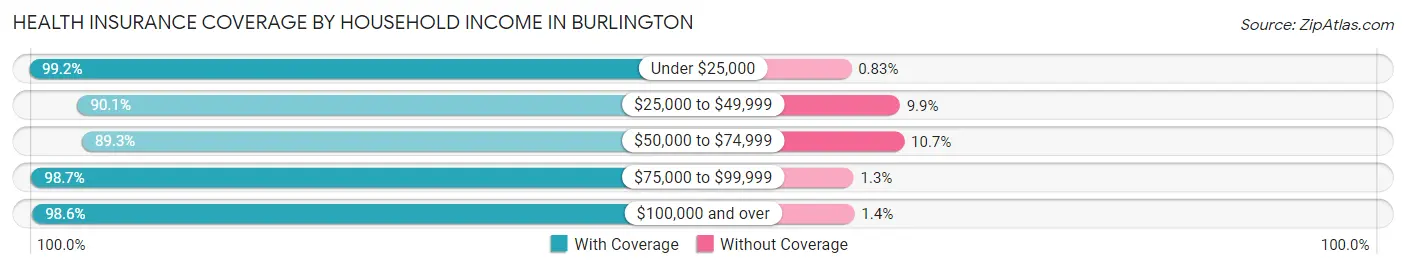
| Household Income | With Coverage | Without Coverage |
| Under $25,000 | 1,198 (99.2%) | 10 (0.8%) |
| $25,000 to $49,999 | 2,126 (90.1%) | 234 (9.9%) |
| $50,000 to $74,999 | 1,937 (89.3%) | 233 (10.7%) |
| $75,000 to $99,999 | 1,948 (98.7%) | 25 (1.3%) |
| $100,000 and over | 17,965 (98.6%) | 260 (1.4%) |
Public vs Private Health Insurance Coverage by Age in Burlington

| Age Bracket | Public Insurance | Private Insurance |
| Under 6 | 155 (9.6%) | 1,419 (87.4%) |
| 6 to 18 Years | 617 (16.5%) | 3,031 (81.2%) |
| 19 to 25 Years | 195 (10.7%) | 1,573 (86.6%) |
| 25 to 34 Years | 225 (9.2%) | 2,162 (88.8%) |
| 35 to 44 Years | 325 (8.7%) | 3,415 (91.3%) |
| 45 to 54 Years | 344 (10.3%) | 3,087 (92.0%) |
| 55 to 64 Years | 573 (15.0%) | 3,011 (78.8%) |
| 65 to 74 Years | 2,550 (92.7%) | 1,808 (65.7%) |
| 75 Years and over | 2,710 (98.8%) | 1,667 (60.8%) |
| Total | 7,694 (29.6%) | 21,173 (81.4%) |
Disability Status by Sex by Age in Burlington
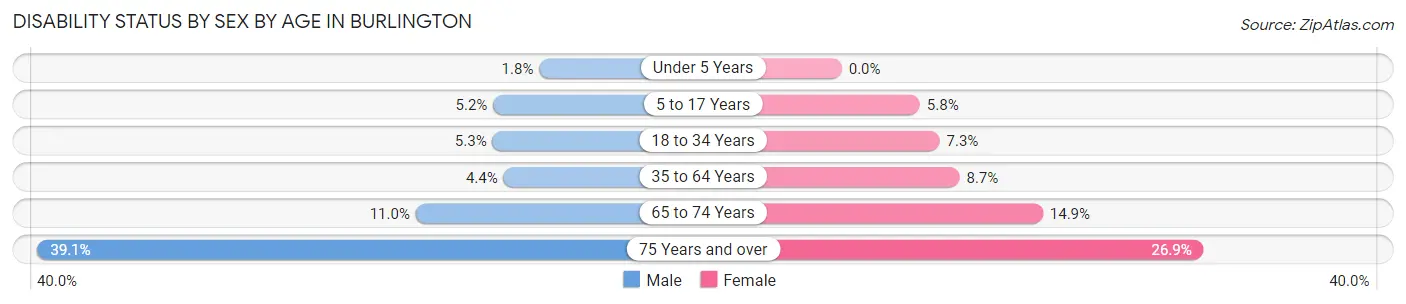
| Age Bracket | Male | Female |
| Under 5 Years | 13 (1.8%) | 0 (0.0%) |
| 5 to 17 Years | 96 (5.2%) | 102 (5.8%) |
| 18 to 34 Years | 124 (5.3%) | 163 (7.3%) |
| 35 to 64 Years | 242 (4.4%) | 478 (8.7%) |
| 65 to 74 Years | 126 (11.0%) | 239 (14.9%) |
| 75 Years and over | 446 (39.1%) | 430 (26.9%) |
Disability Class by Sex by Age in Burlington
Disability Class: Hearing Difficulty
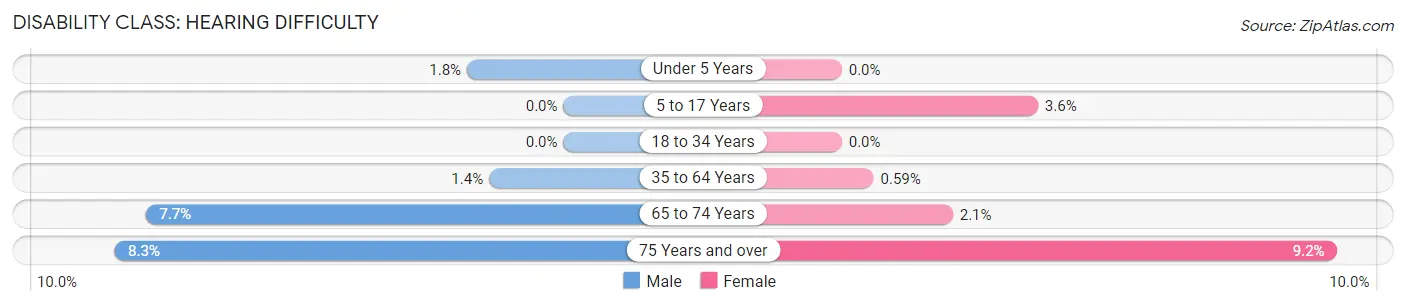
| Age Bracket | Male | Female |
| Under 5 Years | 13 (1.8%) | 0 (0.0%) |
| 5 to 17 Years | 0 (0.0%) | 64 (3.6%) |
| 18 to 34 Years | 0 (0.0%) | 0 (0.0%) |
| 35 to 64 Years | 75 (1.4%) | 32 (0.6%) |
| 65 to 74 Years | 89 (7.7%) | 33 (2.1%) |
| 75 Years and over | 95 (8.3%) | 147 (9.2%) |
Disability Class: Vision Difficulty
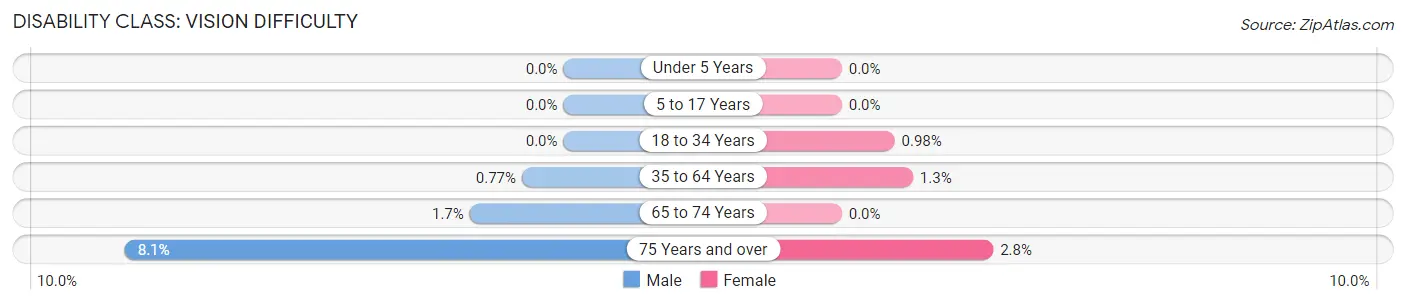
| Age Bracket | Male | Female |
| Under 5 Years | 0 (0.0%) | 0 (0.0%) |
| 5 to 17 Years | 0 (0.0%) | 0 (0.0%) |
| 18 to 34 Years | 0 (0.0%) | 22 (1.0%) |
| 35 to 64 Years | 42 (0.8%) | 72 (1.3%) |
| 65 to 74 Years | 20 (1.7%) | 0 (0.0%) |
| 75 Years and over | 93 (8.1%) | 45 (2.8%) |
Disability Class: Cognitive Difficulty
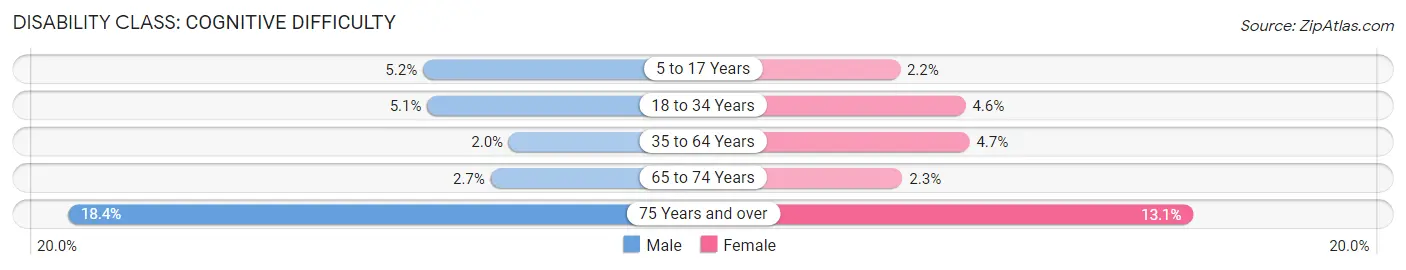
| Age Bracket | Male | Female |
| 5 to 17 Years | 96 (5.2%) | 38 (2.2%) |
| 18 to 34 Years | 119 (5.1%) | 103 (4.6%) |
| 35 to 64 Years | 110 (2.0%) | 259 (4.7%) |
| 65 to 74 Years | 31 (2.7%) | 36 (2.2%) |
| 75 Years and over | 210 (18.4%) | 209 (13.1%) |
Disability Class: Ambulatory Difficulty
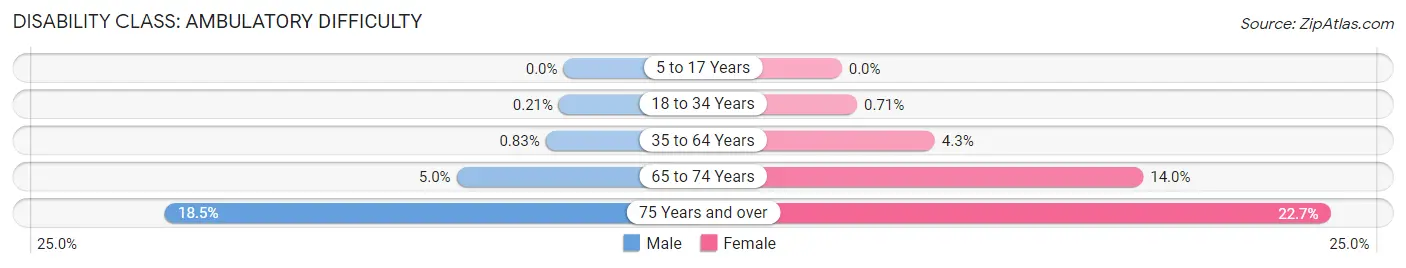
| Age Bracket | Male | Female |
| 5 to 17 Years | 0 (0.0%) | 0 (0.0%) |
| 18 to 34 Years | 5 (0.2%) | 16 (0.7%) |
| 35 to 64 Years | 45 (0.8%) | 236 (4.3%) |
| 65 to 74 Years | 57 (5.0%) | 224 (14.0%) |
| 75 Years and over | 211 (18.5%) | 363 (22.7%) |
Disability Class: Self-Care Difficulty
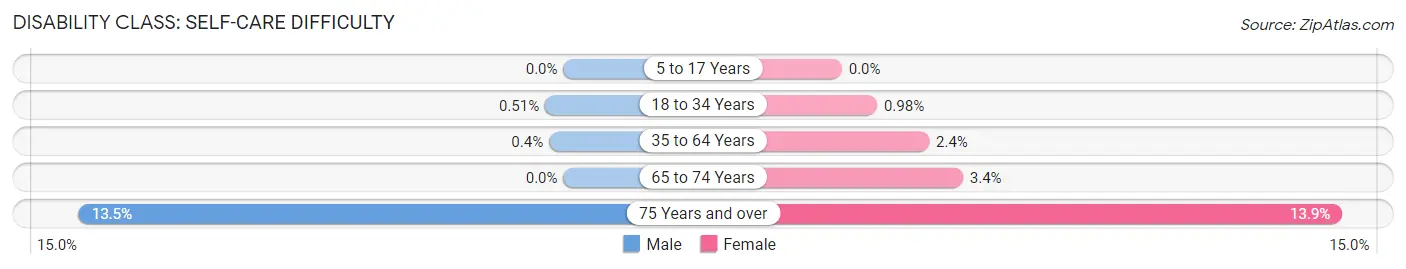
| Age Bracket | Male | Female |
| 5 to 17 Years | 0 (0.0%) | 0 (0.0%) |
| 18 to 34 Years | 12 (0.5%) | 22 (1.0%) |
| 35 to 64 Years | 22 (0.4%) | 133 (2.4%) |
| 65 to 74 Years | 0 (0.0%) | 54 (3.4%) |
| 75 Years and over | 154 (13.5%) | 223 (13.9%) |
Technology Access in Burlington
Computing Device Access in Burlington
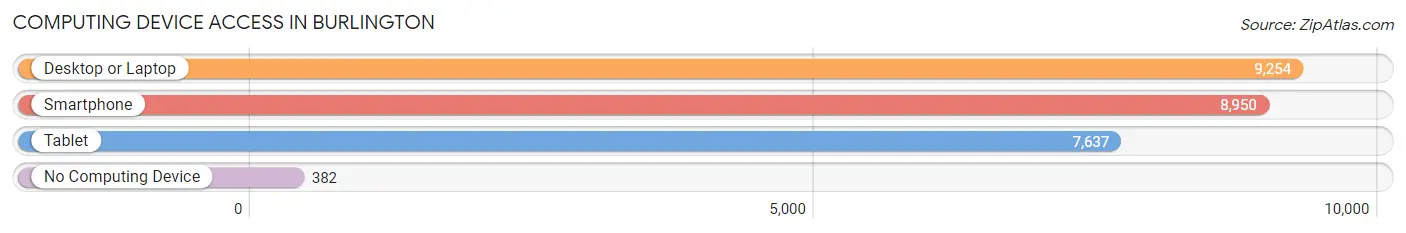
| Device Type | # Households | % Households |
| Desktop or Laptop | 9,254 | 92.0% |
| Smartphone | 8,950 | 89.0% |
| Tablet | 7,637 | 75.9% |
| No Computing Device | 382 | 3.8% |
| Total | 10,059 | 100.0% |
Internet Access in Burlington
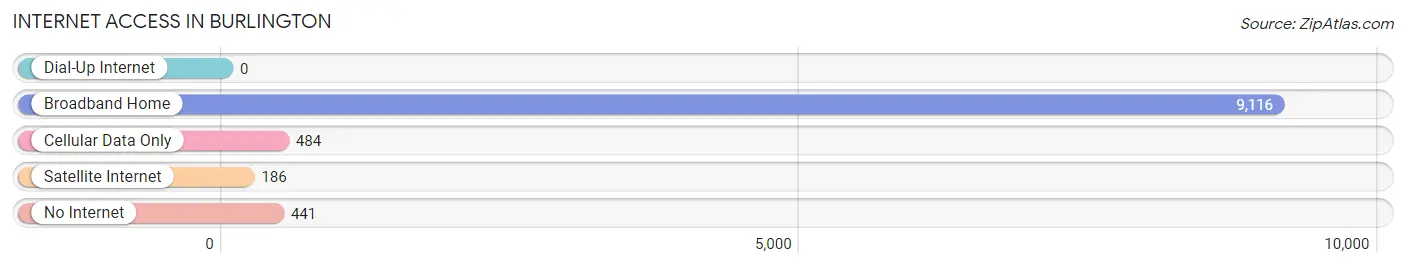
| Internet Type | # Households | % Households |
| Dial-Up Internet | 0 | 0.0% |
| Broadband Home | 9,116 | 90.6% |
| Cellular Data Only | 484 | 4.8% |
| Satellite Internet | 186 | 1.8% |
| No Internet | 441 | 4.4% |
| Total | 10,059 | 100.0% |
Burlington Summary
Burlington, Massachusetts is a town located in Middlesex County, Massachusetts, United States. It is located approximately 10 miles northwest of Boston and is part of the Greater Boston metropolitan area. As of the 2010 census, the town had a population of 24,498.
History
The area that is now Burlington was originally inhabited by the Algonquian-speaking Wampanoag tribe. The area was first settled by Europeans in 1641 and was officially incorporated as the town of Burlington in 1799. The town was named after the English town of Bridlington, which was the hometown of one of the original settlers.
The town was primarily an agricultural community until the mid-19th century, when it began to develop into a residential suburb of Boston. The town was home to several large estates, including the estate of the prominent Boston merchant, John Hancock.
Geography
Burlington is located in eastern Massachusetts, approximately 10 miles northwest of Boston. It is bordered by the towns of Bedford, Billerica, Woburn, and Wilmington. The town is located on the Mystic River, which flows into the Atlantic Ocean.
The town has a total area of 15.2 square miles, of which 14.9 square miles is land and 0.3 square miles is water. The town is mostly flat, with some hills in the northern part of town.
Economy
Burlington is a primarily residential community, with a few small businesses located in the town. The largest employers in the town are the Burlington Mall, the Burlington Public Schools, and the Lahey Clinic.
The town is also home to several corporate headquarters, including the headquarters of the software company, Oracle Corporation, and the medical device company, Boston Scientific.
Demographics
As of the 2010 census, the town had a population of 24,498. The racial makeup of the town was 87.3% White, 4.2% Asian, 3.2% African American, 0.3% Native American, 0.1% Pacific Islander, and 4.9% from other races. Hispanic or Latino of any race were 6.7% of the population.
The median income for a household in the town was $90,945, and the median income for a family was $106,817. The per capita income for the town was $41,945. About 2.7% of families and 3.9% of the population were below the poverty line, including 4.2% of those under age 18 and 4.3% of those age 65 or over.
Common Questions
What is Per Capita Income in Burlington?
Per Capita income in Burlington is $62,805.
What is the Median Family Income in Burlington?
Median Family Income in Burlington is $157,286.
What is the Median Household income in Burlington?
Median Household Income in Burlington is $133,936.
What is Income or Wage Gap in Burlington?
Income or Wage Gap in Burlington is 36.5%.
Women in Burlington earn 63.5 cents for every dollar earned by a man.
What is Family Income Deficit in Burlington?
Family Income Deficit in Burlington is $11,206.
Families that are below poverty line in Burlington earn $11,206 less on average than the poverty threshold level.
What is Inequality or Gini Index in Burlington?
Inequality or Gini Index in Burlington is 0.43.
What is the Total Population of Burlington?
Total Population of Burlington is 26,169.
What is the Total Male Population of Burlington?
Total Male Population of Burlington is 12,697.
What is the Total Female Population of Burlington?
Total Female Population of Burlington is 13,472.
What is the Ratio of Males per 100 Females in Burlington?
There are 94.25 Males per 100 Females in Burlington.
What is the Ratio of Females per 100 Males in Burlington?
There are 106.10 Females per 100 Males in Burlington.
What is the Median Population Age in Burlington?
Median Population Age in Burlington is 43.9 Years.
What is the Average Family Size in Burlington
Average Family Size in Burlington is 3.1 People.
What is the Average Household Size in Burlington
Average Household Size in Burlington is 2.6 People.
How Large is the Labor Force in Burlington?
There are 14,356 People in the Labor Forcein in Burlington.
What is the Percentage of People in the Labor Force in Burlington?
67.0% of People are in the Labor Force in Burlington.
What is the Unemployment Rate in Burlington?
Unemployment Rate in Burlington is 3.5%.