Cities with the Largest Household Size in Massachusetts
RELATED REPORTS & OPTIONS
Largest Household Size
Massachusetts
Compare Cities
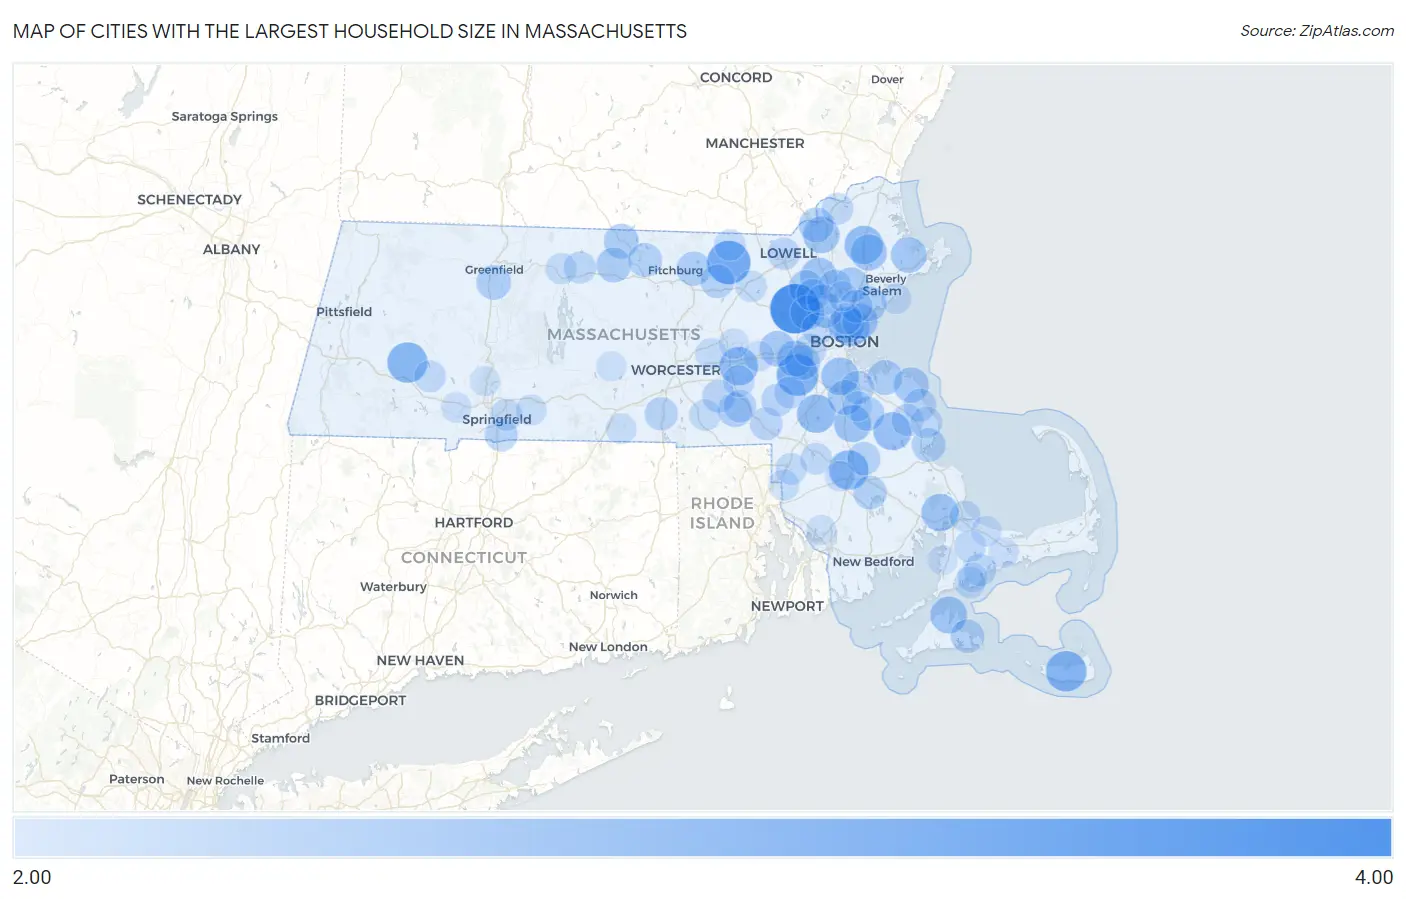
Map of Cities with the Largest Household Size in Massachusetts
0.00
4.00
Cities with the Largest Household Size in Massachusetts
| City | People / Household | vs State | vs National | |
| 1. | Hanscom Afb | 3.78 | 2.46(+1.32)#1 | 2.57(+1.21)#1,197 |
| 2. | Lenox Dale | 3.44 | 2.46(+0.980)#2 | 2.57(+0.870)#2,104 |
| 3. | Groton | 3.35 | 2.46(+0.890)#3 | 2.57(+0.780)#2,440 |
| 4. | Dover | 3.22 | 2.46(+0.760)#4 | 2.57(+0.650)#3,162 |
| 5. | Nantucket | 3.15 | 2.46(+0.690)#5 | 2.57(+0.580)#3,620 |
| 6. | Chester | 3.13 | 2.46(+0.670)#6 | 2.57(+0.560)#3,805 |
| 7. | Raynham Center | 3.07 | 2.46(+0.610)#7 | 2.57(+0.500)#4,266 |
| 8. | Cedar Crest | 3.05 | 2.46(+0.590)#8 | 2.57(+0.480)#4,489 |
| 9. | Cordaville | 3.01 | 2.46(+0.550)#9 | 2.57(+0.440)#4,886 |
| 10. | Sharon | 3.00 | 2.46(+0.540)#10 | 2.57(+0.430)#4,972 |
| 11. | Boxford | 3.00 | 2.46(+0.540)#11 | 2.57(+0.430)#4,994 |
| 12. | Hanson | 2.97 | 2.46(+0.510)#12 | 2.57(+0.400)#5,408 |
| 13. | Milton | 2.94 | 2.46(+0.480)#13 | 2.57(+0.370)#5,765 |
| 14. | Chelsea | 2.92 | 2.46(+0.460)#14 | 2.57(+0.350)#6,024 |
| 15. | White Island Shores | 2.91 | 2.46(+0.450)#15 | 2.57(+0.340)#6,208 |
| 16. | Brockton | 2.90 | 2.46(+0.440)#16 | 2.57(+0.330)#6,283 |
| 17. | Wilmington | 2.89 | 2.46(+0.430)#17 | 2.57(+0.320)#6,443 |
| 18. | Vineyard Haven | 2.88 | 2.46(+0.420)#18 | 2.57(+0.310)#6,635 |
| 19. | Lawrence | 2.87 | 2.46(+0.410)#19 | 2.57(+0.300)#6,741 |
| 20. | Topsfield | 2.85 | 2.46(+0.390)#20 | 2.57(+0.280)#7,102 |
| 21. | Everett | 2.84 | 2.46(+0.380)#21 | 2.57(+0.270)#7,220 |
| 22. | Wellesley | 2.84 | 2.46(+0.380)#22 | 2.57(+0.270)#7,226 |
| 23. | Essex | 2.81 | 2.46(+0.350)#23 | 2.57(+0.240)#7,816 |
| 24. | Revere | 2.80 | 2.46(+0.340)#24 | 2.57(+0.230)#7,917 |
| 25. | Cochituate | 2.80 | 2.46(+0.340)#25 | 2.57(+0.230)#7,949 |
| 26. | Winchester | 2.79 | 2.46(+0.330)#26 | 2.57(+0.220)#8,105 |
| 27. | North Scituate | 2.79 | 2.46(+0.330)#27 | 2.57(+0.220)#8,130 |
| 28. | Lynn | 2.78 | 2.46(+0.320)#28 | 2.57(+0.210)#8,283 |
| 29. | Lynnfield | 2.78 | 2.46(+0.320)#29 | 2.57(+0.210)#8,302 |
| 30. | Randolph Town | 2.76 | 2.46(+0.300)#30 | 2.57(+0.190)#8,630 |
| 31. | Needham | 2.76 | 2.46(+0.300)#31 | 2.57(+0.190)#8,633 |
| 32. | Methuen Town | 2.75 | 2.46(+0.290)#32 | 2.57(+0.180)#8,834 |
| 33. | Pinehurst | 2.75 | 2.46(+0.290)#33 | 2.57(+0.180)#8,879 |
| 34. | Hingham | 2.75 | 2.46(+0.290)#34 | 2.57(+0.180)#8,888 |
| 35. | Winchendon | 2.75 | 2.46(+0.290)#35 | 2.57(+0.180)#8,897 |
| 36. | Baldwinville | 2.75 | 2.46(+0.290)#36 | 2.57(+0.180)#8,917 |
| 37. | Lexington | 2.73 | 2.46(+0.270)#37 | 2.57(+0.160)#9,209 |
| 38. | Deerfield | 2.73 | 2.46(+0.270)#38 | 2.57(+0.160)#9,334 |
| 39. | Lunenburg | 2.72 | 2.46(+0.260)#39 | 2.57(+0.150)#9,470 |
| 40. | Hopedale | 2.71 | 2.46(+0.250)#40 | 2.57(+0.140)#9,660 |
| 41. | Abington | 2.70 | 2.46(+0.240)#41 | 2.57(+0.130)#9,802 |
| 42. | South Ashburnham | 2.69 | 2.46(+0.230)#42 | 2.57(+0.120)#10,114 |
| 43. | North Lakeville | 2.68 | 2.46(+0.220)#43 | 2.57(+0.110)#10,265 |
| 44. | South Duxbury | 2.68 | 2.46(+0.220)#44 | 2.57(+0.110)#10,268 |
| 45. | Devens | 2.68 | 2.46(+0.220)#45 | 2.57(+0.110)#10,293 |
| 46. | Edgartown | 2.67 | 2.46(+0.210)#46 | 2.57(+0.100)#10,567 |
| 47. | Bridgewater Town | 2.66 | 2.46(+0.200)#47 | 2.57(+0.090)#10,660 |
| 48. | Reading | 2.66 | 2.46(+0.200)#48 | 2.57(+0.090)#10,663 |
| 49. | Braintree Town | 2.65 | 2.46(+0.190)#49 | 2.57(+0.080)#10,879 |
| 50. | Oxford | 2.65 | 2.46(+0.190)#50 | 2.57(+0.080)#10,932 |
| 51. | Longmeadow | 2.63 | 2.46(+0.170)#51 | 2.57(+0.060)#11,384 |
| 52. | Saugus | 2.62 | 2.46(+0.160)#52 | 2.57(+0.050)#11,607 |
| 53. | Upton | 2.62 | 2.46(+0.160)#53 | 2.57(+0.050)#11,687 |
| 54. | Marshfield Hills | 2.62 | 2.46(+0.160)#54 | 2.57(+0.050)#11,690 |
| 55. | Franklin Town | 2.61 | 2.46(+0.150)#55 | 2.57(+0.040)#11,856 |
| 56. | Milford | 2.61 | 2.46(+0.150)#56 | 2.57(+0.040)#11,857 |
| 57. | Millis Clicquot | 2.61 | 2.46(+0.150)#57 | 2.57(+0.040)#11,913 |
| 58. | Green Harbor | 2.61 | 2.46(+0.150)#58 | 2.57(+0.040)#11,980 |
| 59. | Lowell | 2.60 | 2.46(+0.140)#59 | 2.57(+0.030)#12,109 |
| 60. | Mashpee Neck | 2.59 | 2.46(+0.130)#60 | 2.57(+0.020)#12,470 |
| 61. | Newton | 2.58 | 2.46(+0.120)#61 | 2.57(+0.010)#12,603 |
| 62. | Burlington | 2.58 | 2.46(+0.120)#62 | 2.57(+0.010)#12,627 |
| 63. | Athol | 2.58 | 2.46(+0.120)#63 | 2.57(+0.010)#12,663 |
| 64. | North Pembroke | 2.58 | 2.46(+0.120)#64 | 2.57(+0.010)#12,694 |
| 65. | Springfield | 2.56 | 2.46(+0.100)#65 | 2.57(-0.010)#13,133 |
| 66. | Belmont | 2.56 | 2.46(+0.100)#66 | 2.57(-0.010)#13,156 |
| 67. | Medfield | 2.56 | 2.46(+0.100)#67 | 2.57(-0.010)#13,202 |
| 68. | Marshfield | 2.56 | 2.46(+0.100)#68 | 2.57(-0.010)#13,215 |
| 69. | Huntington | 2.56 | 2.46(+0.100)#69 | 2.57(-0.010)#13,308 |
| 70. | Haverhill | 2.55 | 2.46(+0.090)#70 | 2.57(-0.020)#13,413 |
| 71. | Forestdale | 2.55 | 2.46(+0.090)#71 | 2.57(-0.020)#13,483 |
| 72. | Hopkinton | 2.55 | 2.46(+0.090)#72 | 2.57(-0.020)#13,491 |
| 73. | Norton Center | 2.55 | 2.46(+0.090)#73 | 2.57(-0.020)#13,506 |
| 74. | Attleboro | 2.54 | 2.46(+0.080)#74 | 2.57(-0.030)#13,673 |
| 75. | Seconsett Island | 2.54 | 2.46(+0.080)#75 | 2.57(-0.030)#13,939 |
| 76. | Malden | 2.53 | 2.46(+0.070)#76 | 2.57(-0.040)#13,958 |
| 77. | Whitinsville | 2.53 | 2.46(+0.070)#77 | 2.57(-0.040)#14,025 |
| 78. | Sagamore | 2.53 | 2.46(+0.070)#78 | 2.57(-0.040)#14,048 |
| 79. | Littleton Common | 2.53 | 2.46(+0.070)#79 | 2.57(-0.040)#14,067 |
| 80. | Woburn | 2.52 | 2.46(+0.060)#80 | 2.57(-0.050)#14,277 |
| 81. | Northborough | 2.52 | 2.46(+0.060)#81 | 2.57(-0.050)#14,320 |
| 82. | Orange | 2.52 | 2.46(+0.060)#82 | 2.57(-0.050)#14,345 |
| 83. | East Pepperell | 2.52 | 2.46(+0.060)#83 | 2.57(-0.050)#14,369 |
| 84. | North Seekonk | 2.51 | 2.46(+0.050)#84 | 2.57(-0.060)#14,634 |
| 85. | Wilbraham | 2.49 | 2.46(+0.030)#85 | 2.57(-0.080)#15,162 |
| 86. | Marblehead | 2.48 | 2.46(+0.020)#86 | 2.57(-0.090)#15,382 |
| 87. | Southbridge Town | 2.48 | 2.46(+0.020)#87 | 2.57(-0.090)#15,385 |
| 88. | Framingham | 2.47 | 2.46(+0.010)#88 | 2.57(-0.100)#15,649 |
| 89. | Barnstable Town | 2.47 | 2.46(+0.010)#89 | 2.57(-0.100)#15,654 |
| 90. | Marlborough | 2.47 | 2.46(+0.010)#90 | 2.57(-0.100)#15,656 |
| 91. | Westfield | 2.47 | 2.46(+0.010)#91 | 2.57(-0.100)#15,657 |
| 92. | East Sandwich | 2.47 | 2.46(+0.010)#92 | 2.57(-0.100)#15,740 |
| 93. | Taunton | 2.46 | 2.46(=0.000)#93 | 2.57(-0.110)#15,947 |
| 94. | Holyoke | 2.45 | 2.46(-0.010)#94 | 2.57(-0.120)#16,247 |
| 95. | Somerset | 2.45 | 2.46(-0.010)#95 | 2.57(-0.120)#16,263 |
| 96. | North Brookfield | 2.45 | 2.46(-0.010)#96 | 2.57(-0.120)#16,335 |
| 97. | Wakefield | 2.44 | 2.46(-0.020)#97 | 2.57(-0.130)#16,555 |
| 98. | Holbrook | 2.44 | 2.46(-0.020)#98 | 2.57(-0.130)#16,578 |
| 99. | North Falmouth | 2.44 | 2.46(-0.020)#99 | 2.57(-0.130)#16,661 |
| 100. | Seabrook | 2.44 | 2.46(-0.020)#100 | 2.57(-0.130)#16,767 |
Common Questions
What are the Top 10 Cities with the Largest Household Size in Massachusetts?
Top 10 Cities with the Largest Household Size in Massachusetts are:
#1
3.78
#2
3.35
#3
3.22
#4
3.15
#5
3.13
#6
3.07
#7
3.01
#8
3.00
#9
3.00
#10
2.97
What city has the Largest Household Size in Massachusetts?
Hanscom AFB has the Largest Household Size in Massachusetts with 3.78.
What is the Household Size in the State of Massachusetts?
Household Size in Massachusetts is 2.46.
What is the Household Size in the United States?
Household Size in the United States is 2.57.