Hanscom AFB, MA Map & Demographics
Hanscom AFB Map
Hanscom AFB Overview
$28,925
PER CAPITA INCOME
$78,281
AVG FAMILY INCOME
$71,250
AVG HOUSEHOLD INCOME
47.7%
WAGE / INCOME GAP [ % ]
52.3¢/ $1
WAGE / INCOME GAP [ $ ]
0.37
INEQUALITY / GINI INDEX
1,784
TOTAL POPULATION
1,059
MALE POPULATION
725
FEMALE POPULATION
146.07
MALES / 100 FEMALES
68.46
FEMALES / 100 MALES
25.5
MEDIAN AGE
3.8
AVG FAMILY SIZE
3.8
AVG HOUSEHOLD SIZE
710
LABOR FORCE [ PEOPLE ]
70.0%
PERCENT IN LABOR FORCE
1.0%
UNEMPLOYMENT RATE
Hanscom AFB Zip Codes
Income in Hanscom AFB
Income Overview in Hanscom AFB
Per Capita Income in Hanscom AFB is $28,925, while median incomes of families and households are $78,281 and $71,250 respectively.
| Characteristic | Number | Measure |
| Per Capita Income | 1,784 | $28,925 |
| Median Family Income | 449 | $78,281 |
| Mean Family Income | 449 | $106,954 |
| Median Household Income | 460 | $71,250 |
| Mean Household Income | 460 | $105,958 |
| Income Deficit | 449 | $0 |
| Wage / Income Gap (%) | 1,784 | 47.67% |
| Wage / Income Gap ($) | 1,784 | 52.33¢ per $1 |
| Gini / Inequality Index | 1,784 | 0.37 |
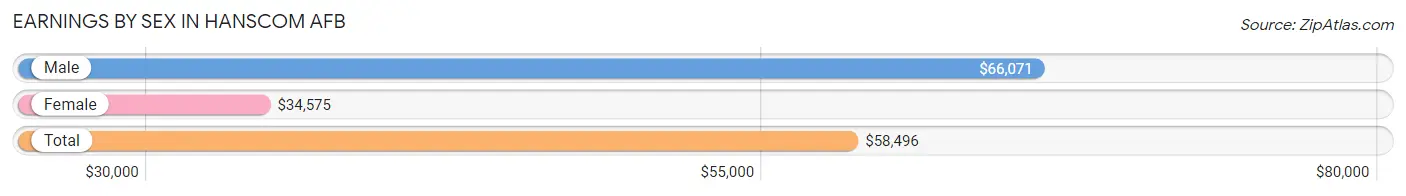
Earnings by Sex in Hanscom AFB
Average Earnings in Hanscom AFB are $58,496, $66,071 for men and $34,575 for women, a difference of 47.7%.
| Sex | Number | Average Earnings |
| Male | 466 (62.9%) | $66,071 |
| Female | 275 (37.1%) | $34,575 |
| Total | 741 (100.0%) | $58,496 |
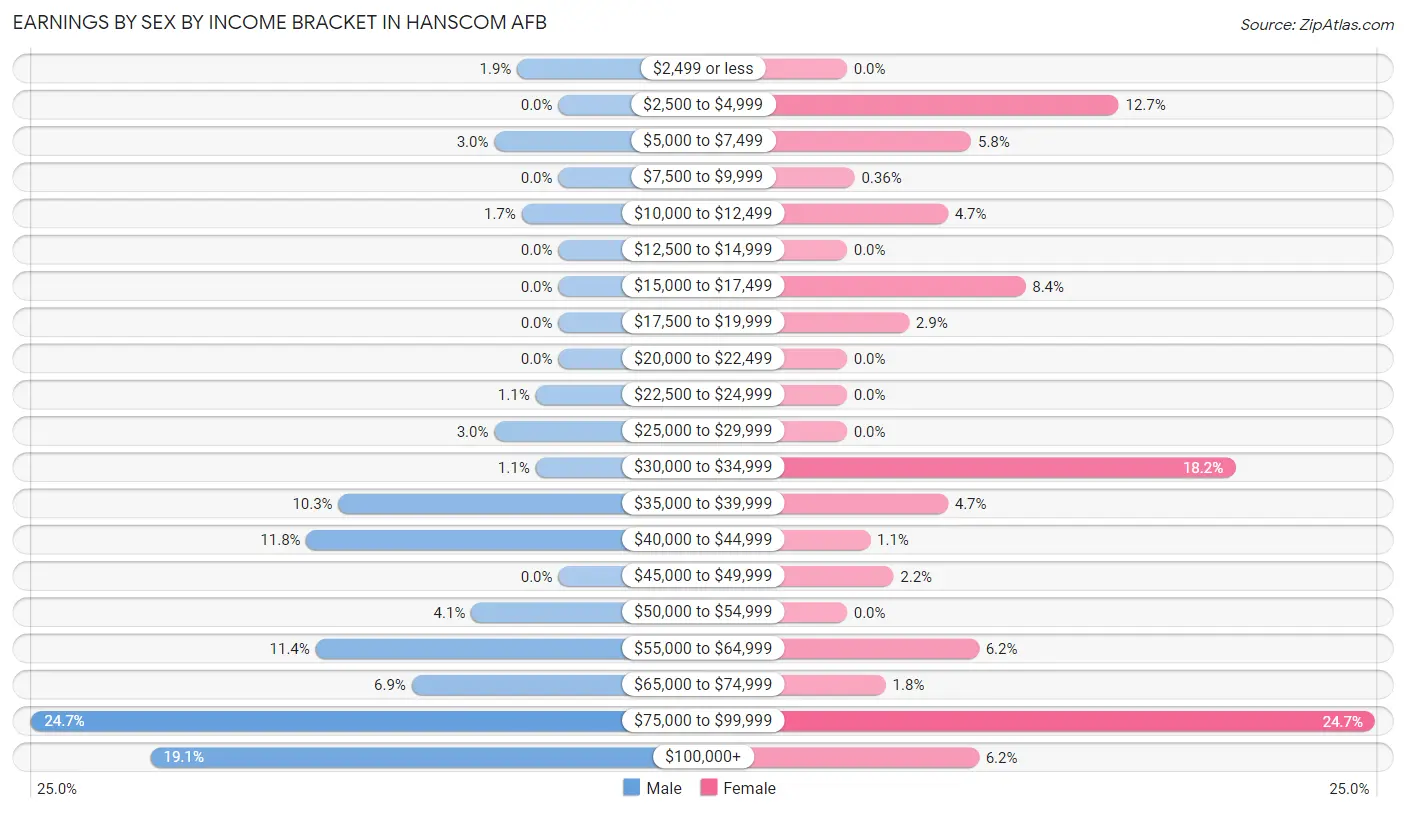
Earnings by Sex by Income Bracket in Hanscom AFB
The most common earnings brackets in Hanscom AFB are $75,000 to $99,999 for men (115 | 24.7%) and $75,000 to $99,999 for women (68 | 24.7%).
| Income | Male | Female |
| $2,499 or less | 9 (1.9%) | 0 (0.0%) |
| $2,500 to $4,999 | 0 (0.0%) | 35 (12.7%) |
| $5,000 to $7,499 | 14 (3.0%) | 16 (5.8%) |
| $7,500 to $9,999 | 0 (0.0%) | 1 (0.4%) |
| $10,000 to $12,499 | 8 (1.7%) | 13 (4.7%) |
| $12,500 to $14,999 | 0 (0.0%) | 0 (0.0%) |
| $15,000 to $17,499 | 0 (0.0%) | 23 (8.4%) |
| $17,500 to $19,999 | 0 (0.0%) | 8 (2.9%) |
| $20,000 to $22,499 | 0 (0.0%) | 0 (0.0%) |
| $22,500 to $24,999 | 5 (1.1%) | 0 (0.0%) |
| $25,000 to $29,999 | 14 (3.0%) | 0 (0.0%) |
| $30,000 to $34,999 | 5 (1.1%) | 50 (18.2%) |
| $35,000 to $39,999 | 48 (10.3%) | 13 (4.7%) |
| $40,000 to $44,999 | 55 (11.8%) | 3 (1.1%) |
| $45,000 to $49,999 | 0 (0.0%) | 6 (2.2%) |
| $50,000 to $54,999 | 19 (4.1%) | 0 (0.0%) |
| $55,000 to $64,999 | 53 (11.4%) | 17 (6.2%) |
| $65,000 to $74,999 | 32 (6.9%) | 5 (1.8%) |
| $75,000 to $99,999 | 115 (24.7%) | 68 (24.7%) |
| $100,000+ | 89 (19.1%) | 17 (6.2%) |
| Total | 466 (100.0%) | 275 (100.0%) |
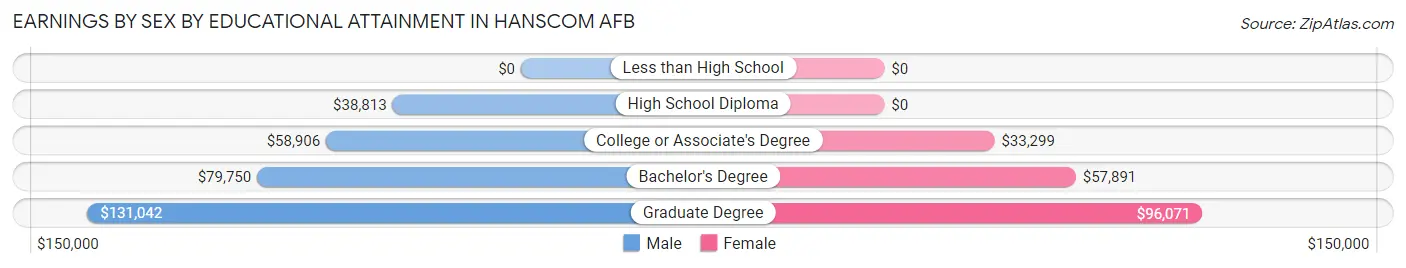
Earnings by Sex by Educational Attainment in Hanscom AFB
Average earnings in Hanscom AFB are $70,588 for men and $41,667 for women, a difference of 41.0%. Men with an educational attainment of graduate degree enjoy the highest average annual earnings of $131,042, while those with high school diploma education earn the least with $38,813. Women with an educational attainment of graduate degree earn the most with the average annual earnings of $96,071, while those with college or associate's degree education have the smallest earnings of $33,299.
| Educational Attainment | Male Income | Female Income |
| Less than High School | - | - |
| High School Diploma | $38,813 | $0 |
| College or Associate's Degree | $58,906 | $33,299 |
| Bachelor's Degree | $79,750 | $57,891 |
| Graduate Degree | $131,042 | $96,071 |
| Total | $70,588 | $41,667 |
Family Income in Hanscom AFB
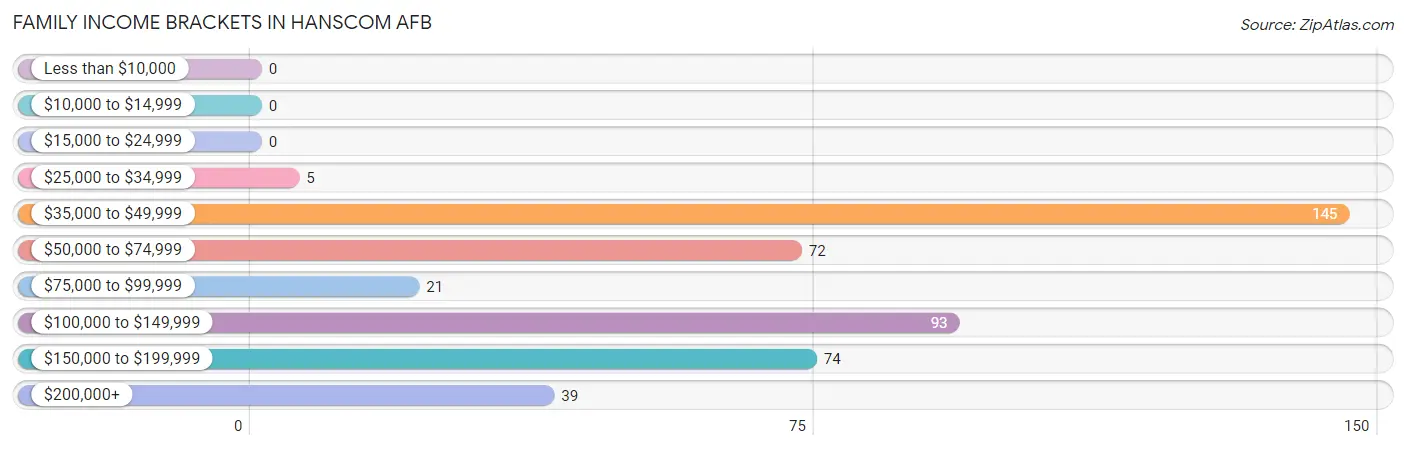
Family Income Brackets in Hanscom AFB
According to the Hanscom AFB family income data, there are 145 families falling into the $35,000 to $49,999 income range, which is the most common income bracket and makes up 32.3% of all families.
| Income Bracket | # Families | % Families |
| Less than $10,000 | 0 | 0.0% |
| $10,000 to $14,999 | 0 | 0.0% |
| $15,000 to $24,999 | 0 | 0.0% |
| $25,000 to $34,999 | 5 | 1.1% |
| $35,000 to $49,999 | 145 | 32.3% |
| $50,000 to $74,999 | 72 | 16.0% |
| $75,000 to $99,999 | 21 | 4.7% |
| $100,000 to $149,999 | 93 | 20.7% |
| $150,000 to $199,999 | 74 | 16.5% |
| $200,000+ | 39 | 8.7% |
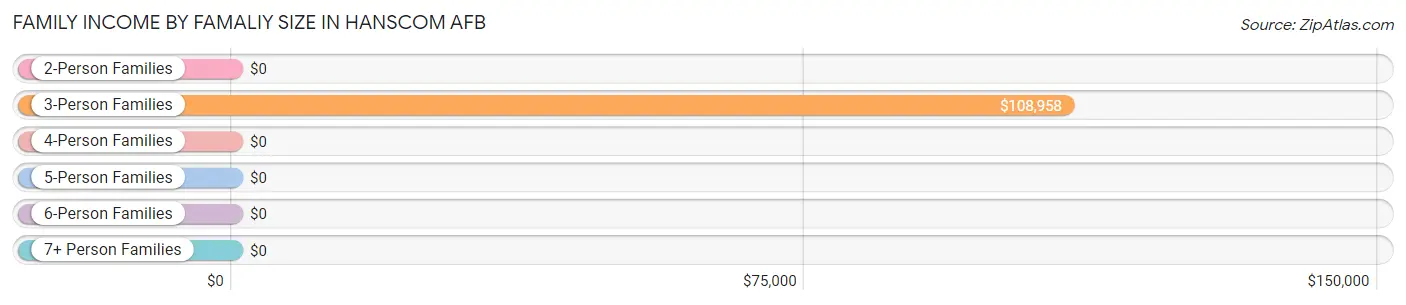
Family Income by Famaliy Size in Hanscom AFB
3-person families (121 | 27.0%) account for the highest median family income in Hanscom AFB with $108,958 per family, while 3-person families (121 | 27.0%) have the highest median income of $36,319 per family member.
| Income Bracket | # Families | Median Income |
| 2-Person Families | 78 (17.4%) | $0 |
| 3-Person Families | 121 (27.0%) | $108,958 |
| 4-Person Families | 230 (51.2%) | $0 |
| 5-Person Families | 19 (4.2%) | $0 |
| 6-Person Families | 1 (0.2%) | $0 |
| 7+ Person Families | 0 (0.0%) | $0 |
| Total | 449 (100.0%) | $78,281 |
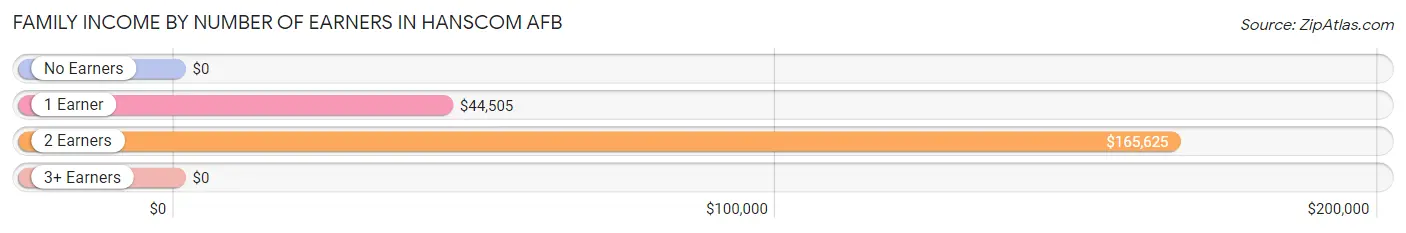
Family Income by Number of Earners in Hanscom AFB
| Number of Earners | # Families | Median Income |
| No Earners | 0 (0.0%) | $0 |
| 1 Earner | 264 (58.8%) | $44,505 |
| 2 Earners | 169 (37.6%) | $165,625 |
| 3+ Earners | 16 (3.6%) | $0 |
| Total | 449 (100.0%) | $78,281 |
Household Income in Hanscom AFB
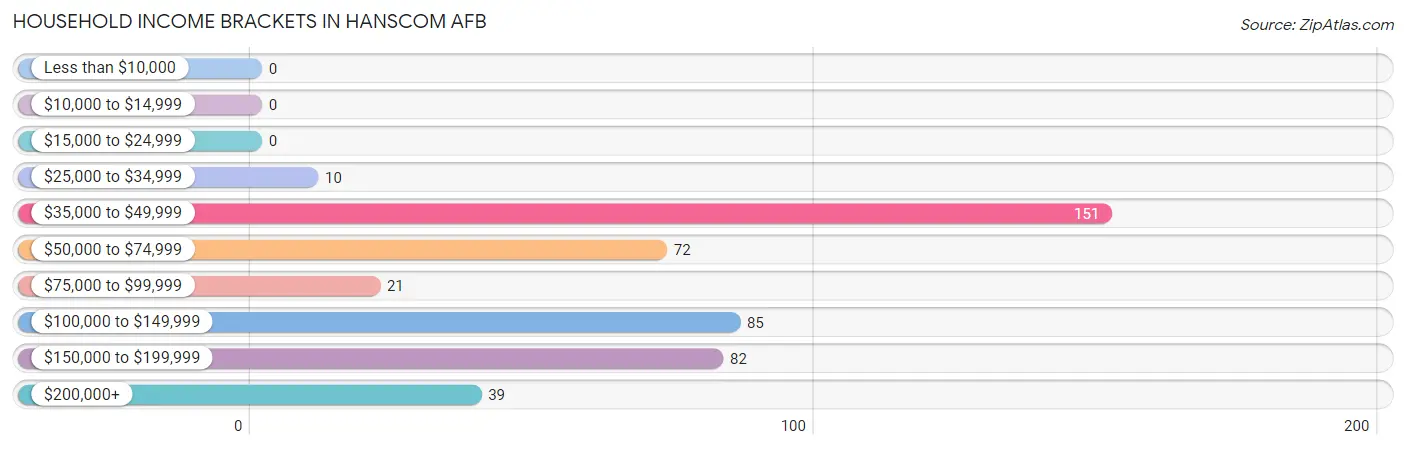
Household Income Brackets in Hanscom AFB
With 151 households falling in the category, the $35,000 to $49,999 income range is the most frequent in Hanscom AFB, accounting for 32.8% of all households.
| Income Bracket | # Households | % Households |
| Less than $10,000 | 0 | 0.0% |
| $10,000 to $14,999 | 0 | 0.0% |
| $15,000 to $24,999 | 0 | 0.0% |
| $25,000 to $34,999 | 10 | 2.2% |
| $35,000 to $49,999 | 151 | 32.8% |
| $50,000 to $74,999 | 72 | 15.7% |
| $75,000 to $99,999 | 21 | 4.6% |
| $100,000 to $149,999 | 85 | 18.5% |
| $150,000 to $199,999 | 82 | 17.8% |
| $200,000+ | 39 | 8.5% |
Household Income by Householder Age in Hanscom AFB
The median household income in Hanscom AFB is $71,250, with the highest median household income of $180,385 found in the 45 to 64 years age bracket for the primary householder. A total of 50 households (10.9%) fall into this category. Meanwhile, the 15 to 24 years age bracket for the primary householder has the lowest median household income of $0, with 5 households (1.1%) in this group.
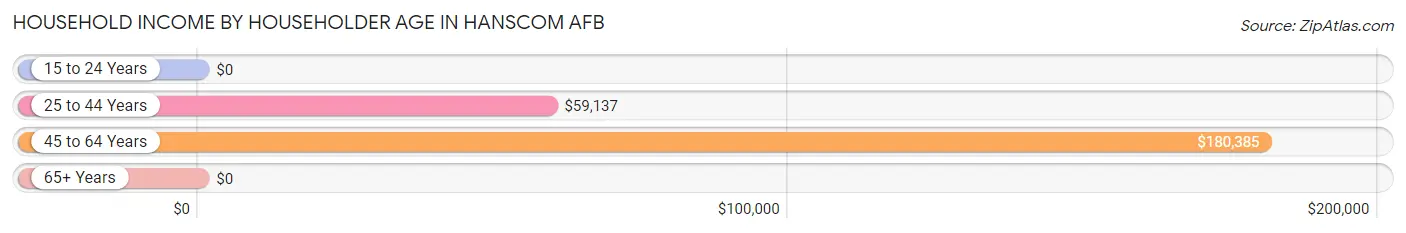
| Income Bracket | # Households | Median Income |
| 15 to 24 Years | 5 (1.1%) | $0 |
| 25 to 44 Years | 405 (88.0%) | $59,137 |
| 45 to 64 Years | 50 (10.9%) | $180,385 |
| 65+ Years | 0 (0.0%) | $0 |
| Total | 460 (100.0%) | $71,250 |
Poverty in Hanscom AFB
Income Below Poverty by Sex and Age in Hanscom AFB
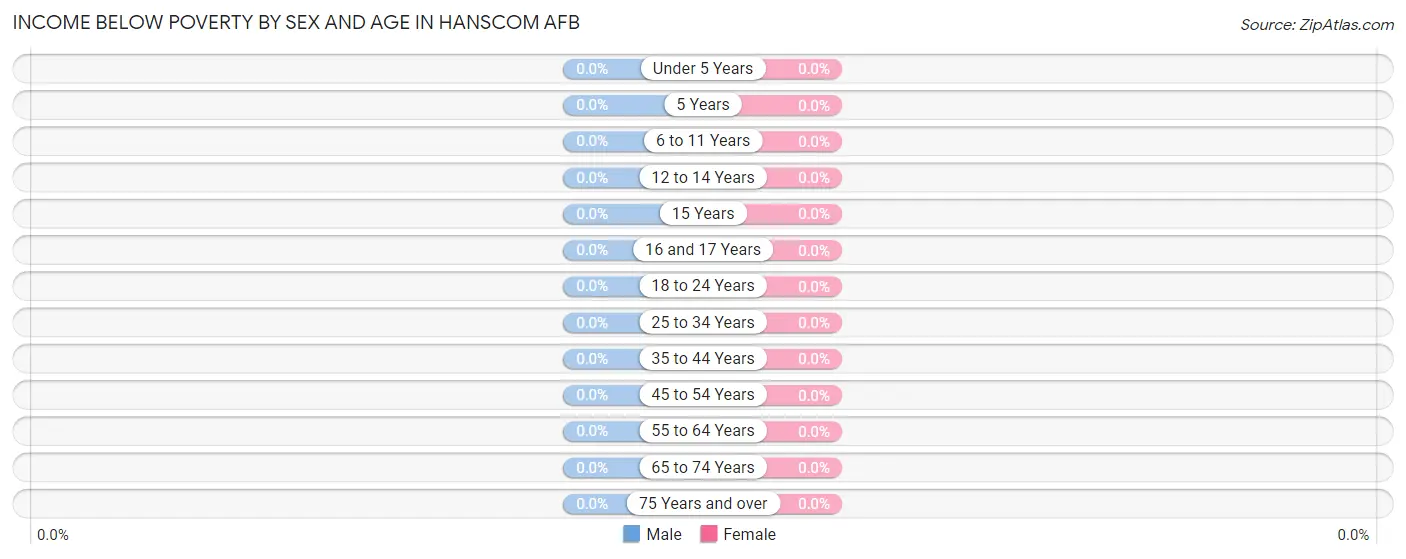
| Age Bracket | Male | Female |
| Under 5 Years | 0 (0.0%) | 0 (0.0%) |
| 5 Years | 0 (0.0%) | 0 (0.0%) |
| 6 to 11 Years | 0 (0.0%) | 0 (0.0%) |
| 12 to 14 Years | 0 (0.0%) | 0 (0.0%) |
| 15 Years | 0 (0.0%) | 0 (0.0%) |
| 16 and 17 Years | 0 (0.0%) | 0 (0.0%) |
| 18 to 24 Years | 0 (0.0%) | 0 (0.0%) |
| 25 to 34 Years | 0 (0.0%) | 0 (0.0%) |
| 35 to 44 Years | 0 (0.0%) | 0 (0.0%) |
| 45 to 54 Years | 0 (0.0%) | 0 (0.0%) |
| 55 to 64 Years | 0 (0.0%) | 0 (0.0%) |
| 65 to 74 Years | 0 (0.0%) | 0 (0.0%) |
| 75 Years and over | 0 (0.0%) | 0 (0.0%) |
| Total | 0 (0.0%) | 0 (0.0%) |
Income Above Poverty by Sex and Age in Hanscom AFB
According to the poverty statistics in Hanscom AFB, males aged under 5 years and females aged under 5 years are the age groups that are most secure financially, with 100.0% of males and 100.0% of females in these age groups living above the poverty line.
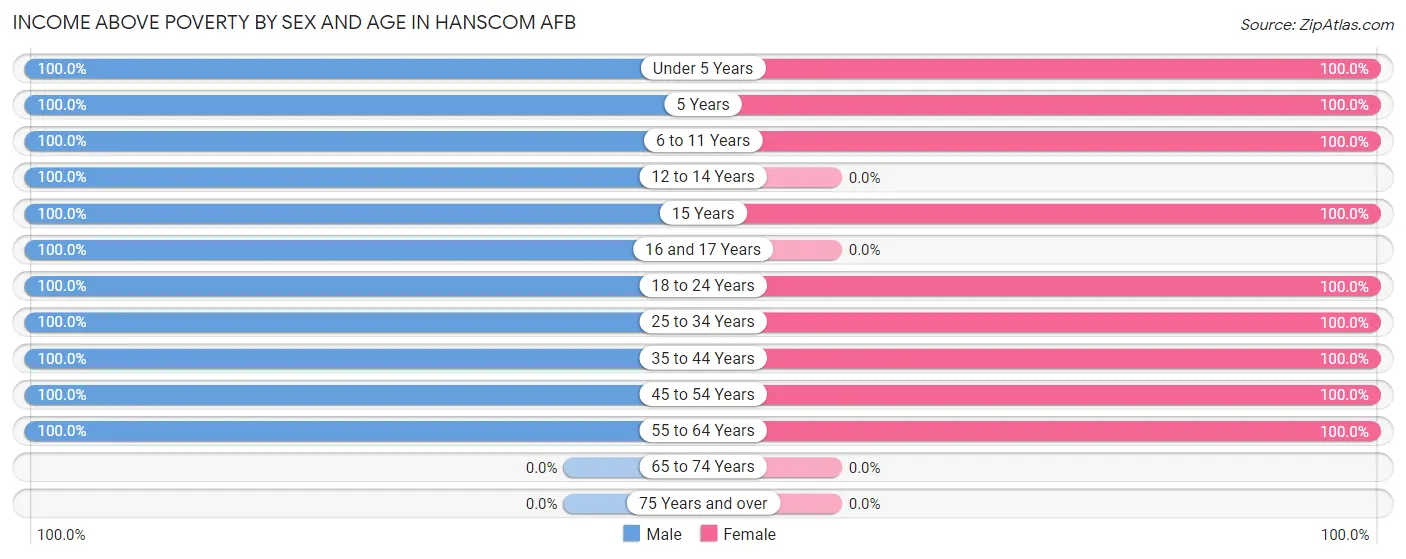
| Age Bracket | Male | Female |
| Under 5 Years | 237 (100.0%) | 86 (100.0%) |
| 5 Years | 8 (100.0%) | 11 (100.0%) |
| 6 to 11 Years | 267 (100.0%) | 88 (100.0%) |
| 12 to 14 Years | 59 (100.0%) | 0 (0.0%) |
| 15 Years | 5 (100.0%) | 8 (100.0%) |
| 16 and 17 Years | 13 (100.0%) | 0 (0.0%) |
| 18 to 24 Years | 13 (100.0%) | 52 (100.0%) |
| 25 to 34 Years | 172 (100.0%) | 189 (100.0%) |
| 35 to 44 Years | 191 (100.0%) | 189 (100.0%) |
| 45 to 54 Years | 28 (100.0%) | 24 (100.0%) |
| 55 to 64 Years | 26 (100.0%) | 71 (100.0%) |
| 65 to 74 Years | 0 (0.0%) | 0 (0.0%) |
| 75 Years and over | 0 (0.0%) | 0 (0.0%) |
| Total | 1,019 (100.0%) | 718 (100.0%) |
Income Below Poverty Among Married-Couple Families in Hanscom AFB
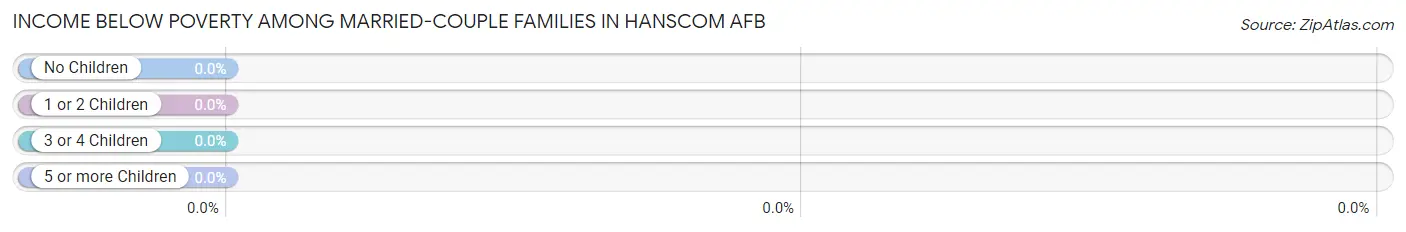
| Children | Above Poverty | Below Poverty |
| No Children | 52 (100.0%) | 0 (0.0%) |
| 1 or 2 Children | 321 (100.0%) | 0 (0.0%) |
| 3 or 4 Children | 20 (100.0%) | 0 (0.0%) |
| 5 or more Children | 0 (0.0%) | 0 (0.0%) |
| Total | 393 (100.0%) | 0 (0.0%) |
Income Below Poverty Among Single-Parent Households in Hanscom AFB
| Children | Single Father | Single Mother |
| No Children | 0 (0.0%) | 0 (0.0%) |
| 1 or 2 Children | 0 (0.0%) | 0 (0.0%) |
| 3 or 4 Children | 0 (0.0%) | 0 (0.0%) |
| 5 or more Children | 0 (0.0%) | 0 (0.0%) |
| Total | 0 (0.0%) | 0 (0.0%) |
Income Below Poverty Among Married-Couple vs Single-Parent Households in Hanscom AFB
| Children | Married-Couple Families | Single-Parent Households |
| No Children | 0 (0.0%) | 0 (0.0%) |
| 1 or 2 Children | 0 (0.0%) | 0 (0.0%) |
| 3 or 4 Children | 0 (0.0%) | 0 (0.0%) |
| 5 or more Children | 0 (0.0%) | 0 (0.0%) |
| Total | 0 (0.0%) | 0 (0.0%) |
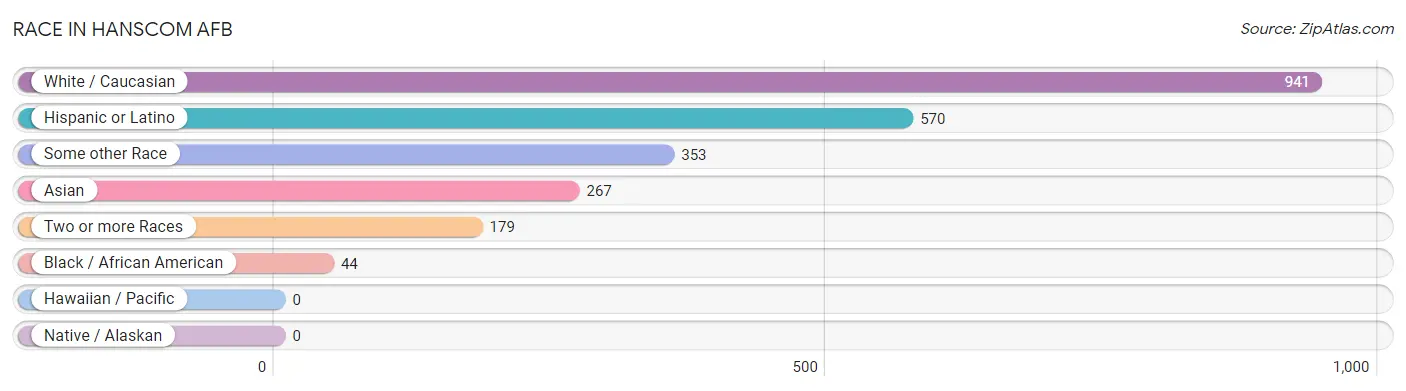
Race in Hanscom AFB
The most populous races in Hanscom AFB are White / Caucasian (941 | 52.7%), Hispanic or Latino (570 | 32.0%), and Some other Race (353 | 19.8%).
| Race | # Population | % Population |
| Asian | 267 | 15.0% |
| Black / African American | 44 | 2.5% |
| Hawaiian / Pacific | 0 | 0.0% |
| Hispanic or Latino | 570 | 32.0% |
| Native / Alaskan | 0 | 0.0% |
| White / Caucasian | 941 | 52.7% |
| Two or more Races | 179 | 10.0% |
| Some other Race | 353 | 19.8% |
| Total | 1,784 | 100.0% |
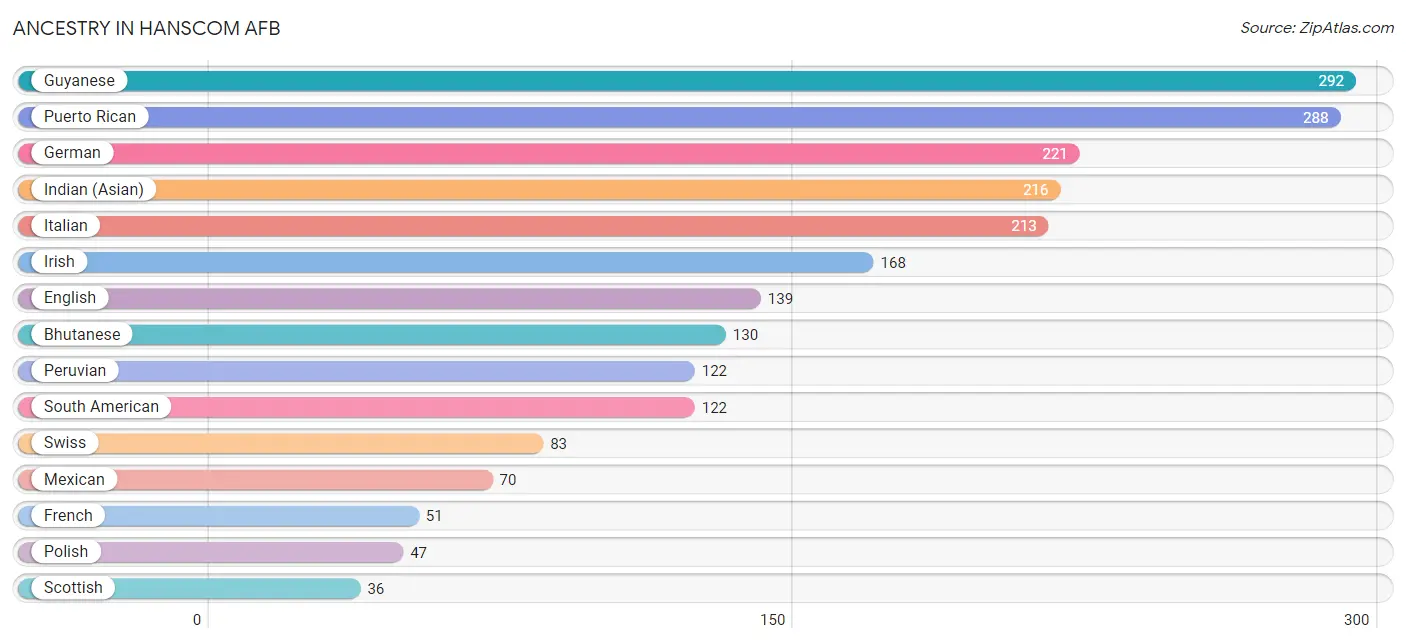
Ancestry in Hanscom AFB
The most populous ancestries reported in Hanscom AFB are Guyanese (292 | 16.4%), Puerto Rican (288 | 16.1%), German (221 | 12.4%), Indian (Asian) (216 | 12.1%), and Italian (213 | 11.9%), together accounting for 69.0% of all Hanscom AFB residents.
| Ancestry | # Population | % Population |
| American | 8 | 0.4% |
| Bhutanese | 130 | 7.3% |
| British | 7 | 0.4% |
| Burmese | 31 | 1.7% |
| Cuban | 10 | 0.6% |
| Danish | 7 | 0.4% |
| English | 139 | 7.8% |
| European | 17 | 0.9% |
| Finnish | 7 | 0.4% |
| French | 51 | 2.9% |
| German | 221 | 12.4% |
| Guyanese | 292 | 16.4% |
| Indian (Asian) | 216 | 12.1% |
| Irish | 168 | 9.4% |
| Italian | 213 | 11.9% |
| Korean | 7 | 0.4% |
| Mexican | 70 | 3.9% |
| Mexican American Indian | 12 | 0.7% |
| Northern European | 4 | 0.2% |
| Norwegian | 19 | 1.1% |
| Peruvian | 122 | 6.8% |
| Polish | 47 | 2.6% |
| Portuguese | 8 | 0.4% |
| Puerto Rican | 288 | 16.1% |
| Russian | 14 | 0.8% |
| Scandinavian | 8 | 0.4% |
| Scotch-Irish | 5 | 0.3% |
| Scottish | 36 | 2.0% |
| South American | 122 | 6.8% |
| Spaniard | 6 | 0.3% |
| Swedish | 28 | 1.6% |
| Swiss | 83 | 4.6% | View All 32 Rows |
Immigrants in Hanscom AFB
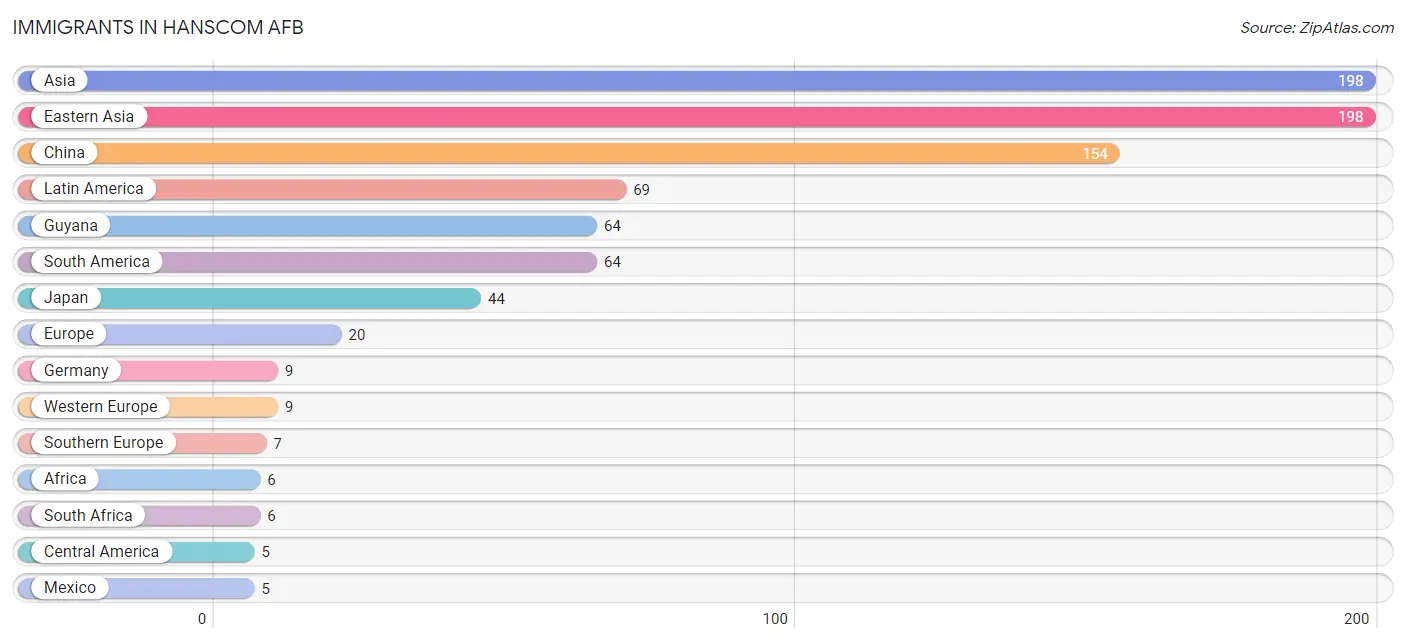
The most numerous immigrant groups reported in Hanscom AFB came from Asia (198 | 11.1%), Eastern Asia (198 | 11.1%), China (154 | 8.6%), Latin America (69 | 3.9%), and Guyana (64 | 3.6%), together accounting for 38.3% of all Hanscom AFB residents.
| Immigration Origin | # Population | % Population |
| Africa | 6 | 0.3% |
| Asia | 198 | 11.1% |
| Central America | 5 | 0.3% |
| China | 154 | 8.6% |
| Eastern Asia | 198 | 11.1% |
| Eastern Europe | 4 | 0.2% |
| Europe | 20 | 1.1% |
| Germany | 9 | 0.5% |
| Guyana | 64 | 3.6% |
| Japan | 44 | 2.5% |
| Latin America | 69 | 3.9% |
| Mexico | 5 | 0.3% |
| Russia | 4 | 0.2% |
| South Africa | 6 | 0.3% |
| South America | 64 | 3.6% |
| Southern Europe | 7 | 0.4% |
| Western Europe | 9 | 0.5% | View All 17 Rows |
Sex and Age in Hanscom AFB
Sex and Age in Hanscom AFB
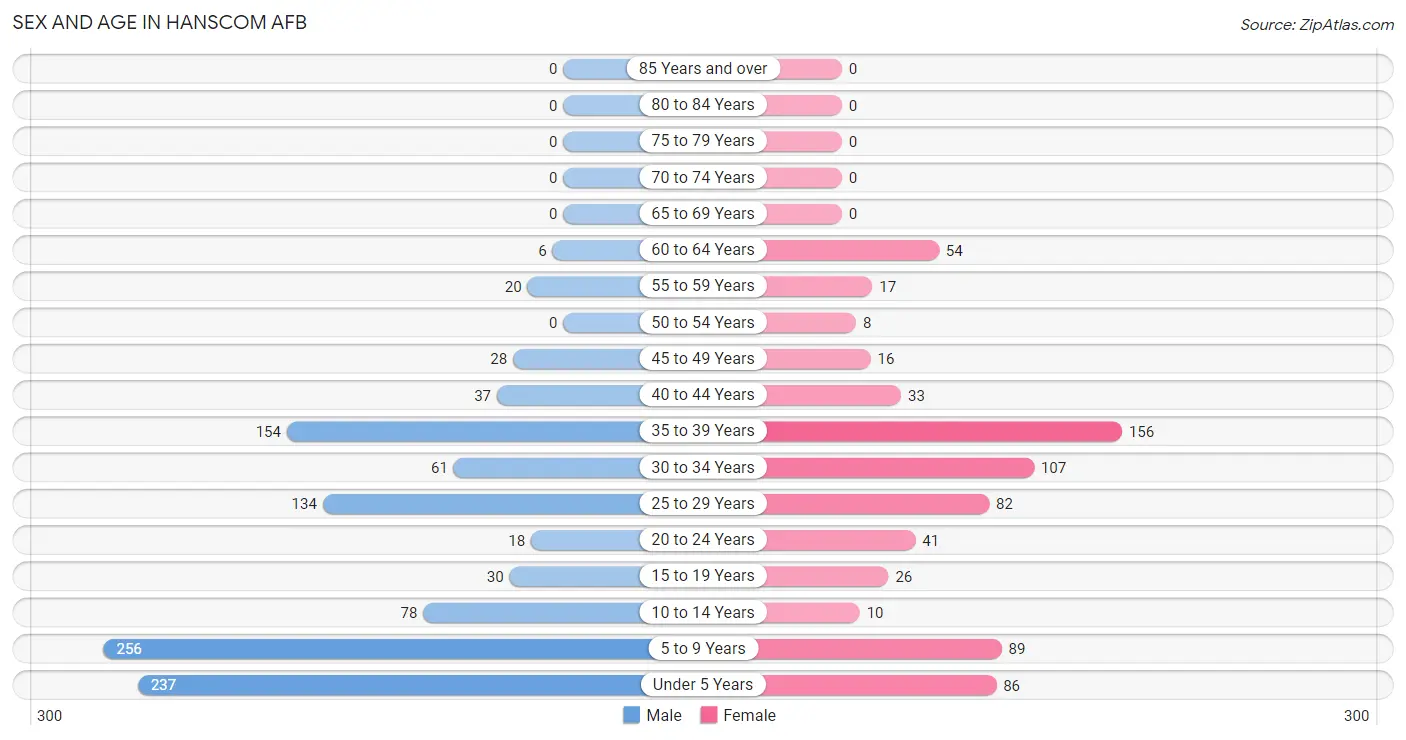
The most populous age groups in Hanscom AFB are 5 to 9 Years (256 | 24.2%) for men and 35 to 39 Years (156 | 21.5%) for women.
| Age Bracket | Male | Female |
| Under 5 Years | 237 (22.4%) | 86 (11.9%) |
| 5 to 9 Years | 256 (24.2%) | 89 (12.3%) |
| 10 to 14 Years | 78 (7.4%) | 10 (1.4%) |
| 15 to 19 Years | 30 (2.8%) | 26 (3.6%) |
| 20 to 24 Years | 18 (1.7%) | 41 (5.7%) |
| 25 to 29 Years | 134 (12.7%) | 82 (11.3%) |
| 30 to 34 Years | 61 (5.8%) | 107 (14.8%) |
| 35 to 39 Years | 154 (14.5%) | 156 (21.5%) |
| 40 to 44 Years | 37 (3.5%) | 33 (4.5%) |
| 45 to 49 Years | 28 (2.6%) | 16 (2.2%) |
| 50 to 54 Years | 0 (0.0%) | 8 (1.1%) |
| 55 to 59 Years | 20 (1.9%) | 17 (2.3%) |
| 60 to 64 Years | 6 (0.6%) | 54 (7.4%) |
| 65 to 69 Years | 0 (0.0%) | 0 (0.0%) |
| 70 to 74 Years | 0 (0.0%) | 0 (0.0%) |
| 75 to 79 Years | 0 (0.0%) | 0 (0.0%) |
| 80 to 84 Years | 0 (0.0%) | 0 (0.0%) |
| 85 Years and over | 0 (0.0%) | 0 (0.0%) |
| Total | 1,059 (100.0%) | 725 (100.0%) |
Families and Households in Hanscom AFB
Median Family Size in Hanscom AFB
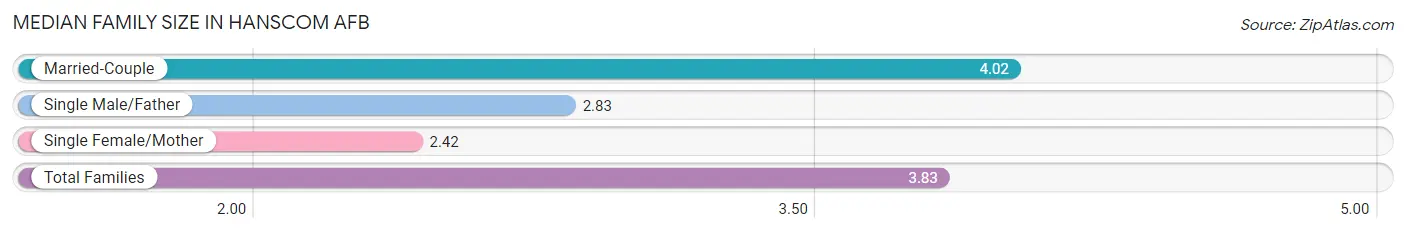
The median family size in Hanscom AFB is 3.83 persons per family, with married-couple families (393 | 87.5%) accounting for the largest median family size of 4.02 persons per family. On the other hand, single female/mother families (50 | 11.1%) represent the smallest median family size with 2.42 persons per family.
| Family Type | # Families | Family Size |
| Married-Couple | 393 (87.5%) | 4.02 |
| Single Male/Father | 6 (1.3%) | 2.83 |
| Single Female/Mother | 50 (11.1%) | 2.42 |
| Total Families | 449 (100.0%) | 3.83 |
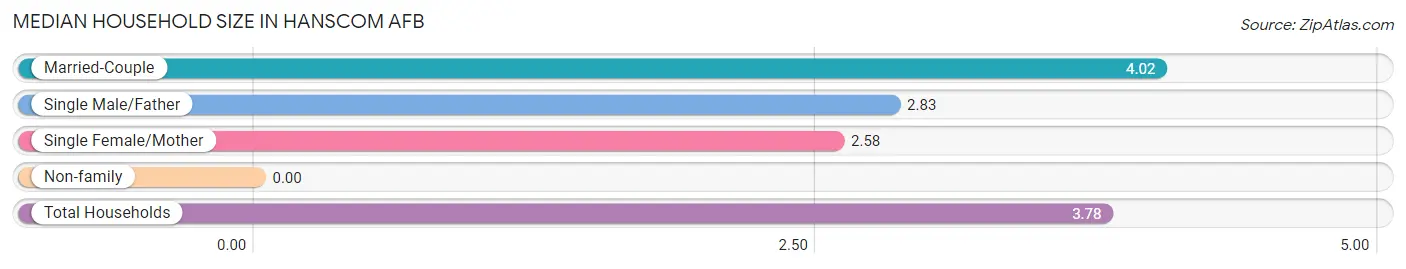
Median Household Size in Hanscom AFB
| Household Type | # Households | Household Size |
| Married-Couple | 393 (85.4%) | 4.02 |
| Single Male/Father | 6 (1.3%) | 2.83 |
| Single Female/Mother | 50 (10.9%) | 2.58 |
| Non-family | 11 (2.4%) | - |
| Total Households | 460 (100.0%) | 3.78 |
Household Size by Marriage Status in Hanscom AFB
Out of a total of 460 households in Hanscom AFB, 449 (97.6%) are family households, while 11 (2.4%) are nonfamily households. The most numerous type of family households are 4-person households, comprising 222, and the most common type of nonfamily households are 1-person households, comprising 11.
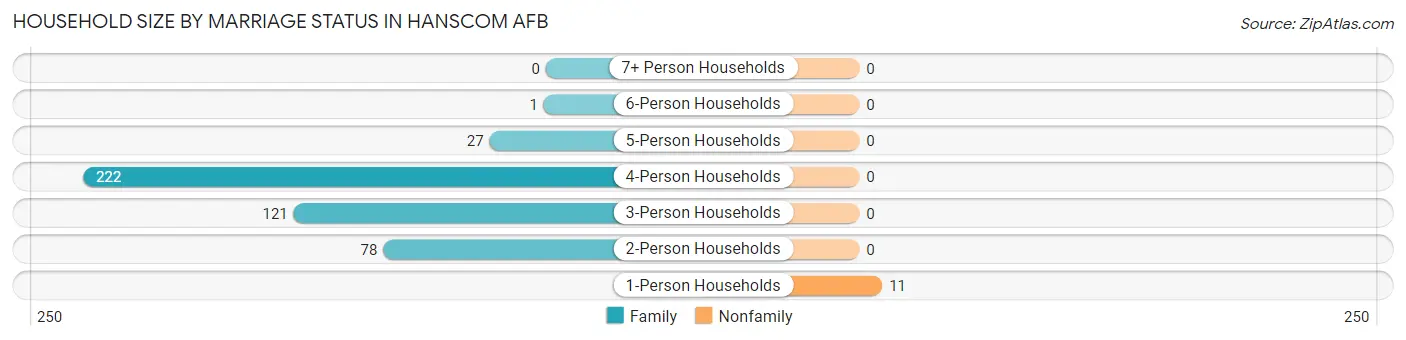
| Household Size | Family Households | Nonfamily Households |
| 1-Person Households | - | 11 (2.4%) |
| 2-Person Households | 78 (17.0%) | 0 (0.0%) |
| 3-Person Households | 121 (26.3%) | 0 (0.0%) |
| 4-Person Households | 222 (48.3%) | 0 (0.0%) |
| 5-Person Households | 27 (5.9%) | 0 (0.0%) |
| 6-Person Households | 1 (0.2%) | 0 (0.0%) |
| 7+ Person Households | 0 (0.0%) | 0 (0.0%) |
| Total | 449 (97.6%) | 11 (2.4%) |
Female Fertility in Hanscom AFB
Fertility by Age in Hanscom AFB
Average fertility rate in Hanscom AFB is 15.0 births per 1,000 women. Women in the age bracket of 35 to 50 years have the highest fertility rate with 33.0 births per 1,000 women. Women in the age bracket of 35 to 50 years acount for 100.0% of all women with births.
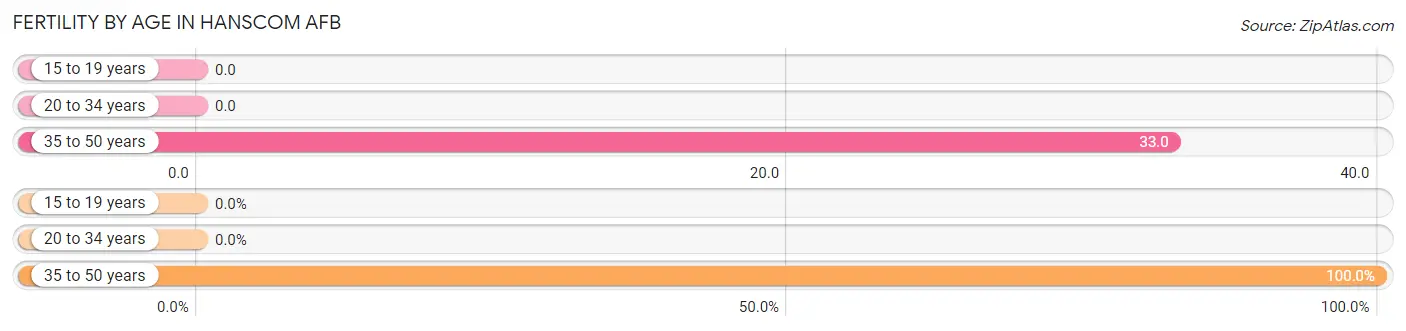
| Age Bracket | Women with Births | Births / 1,000 Women |
| 15 to 19 years | 0 (0.0%) | 0.0 |
| 20 to 34 years | 0 (0.0%) | 0.0 |
| 35 to 50 years | 7 (100.0%) | 33.0 |
| Total | 7 (100.0%) | 15.0 |
Fertility by Age by Marriage Status in Hanscom AFB
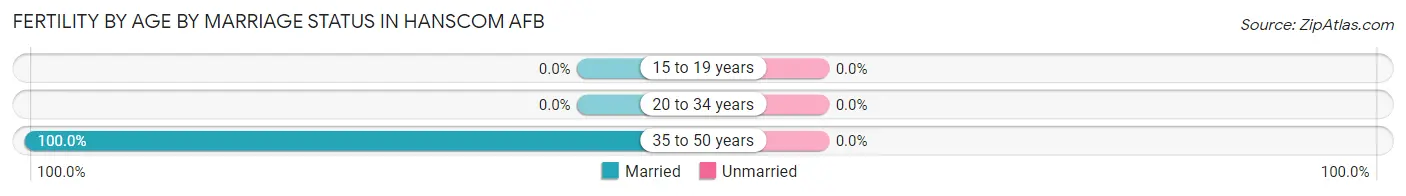
| Age Bracket | Married | Unmarried |
| 15 to 19 years | 0 (0.0%) | 0 (0.0%) |
| 20 to 34 years | 0 (0.0%) | 0 (0.0%) |
| 35 to 50 years | 7 (100.0%) | 0 (0.0%) |
| Total | 7 (100.0%) | 0 (0.0%) |
Fertility by Education in Hanscom AFB
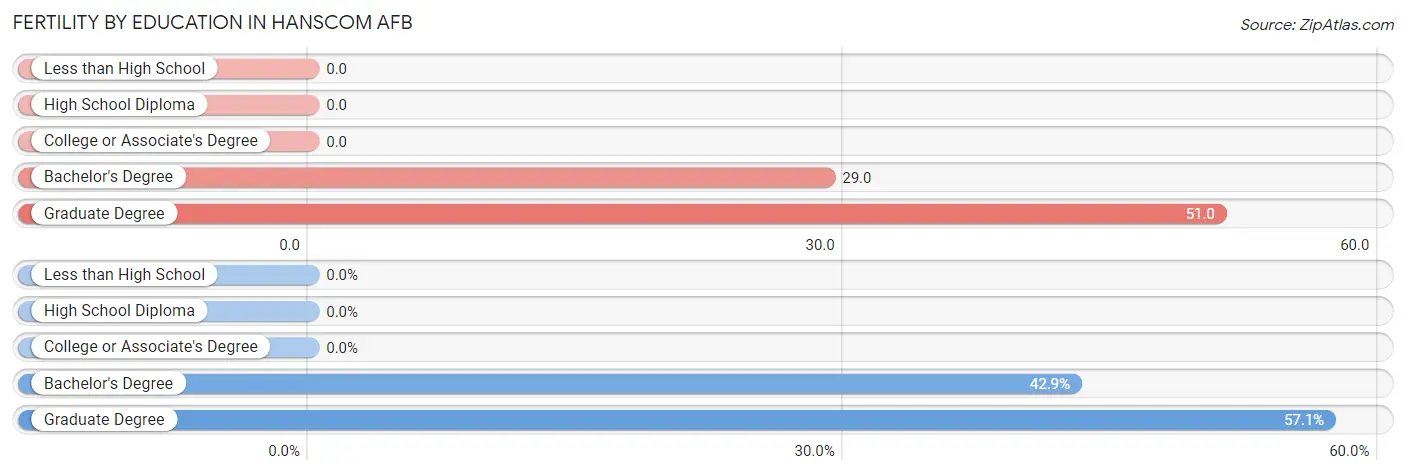
| Educational Attainment | Women with Births | Births / 1,000 Women |
| Less than High School | 0 (0.0%) | 0.0 |
| High School Diploma | 0 (0.0%) | 0.0 |
| College or Associate's Degree | 0 (0.0%) | 0.0 |
| Bachelor's Degree | 3 (42.9%) | 29.0 |
| Graduate Degree | 4 (57.1%) | 51.0 |
| Total | 7 (100.0%) | 15.0 |
Fertility by Education by Marriage Status in Hanscom AFB
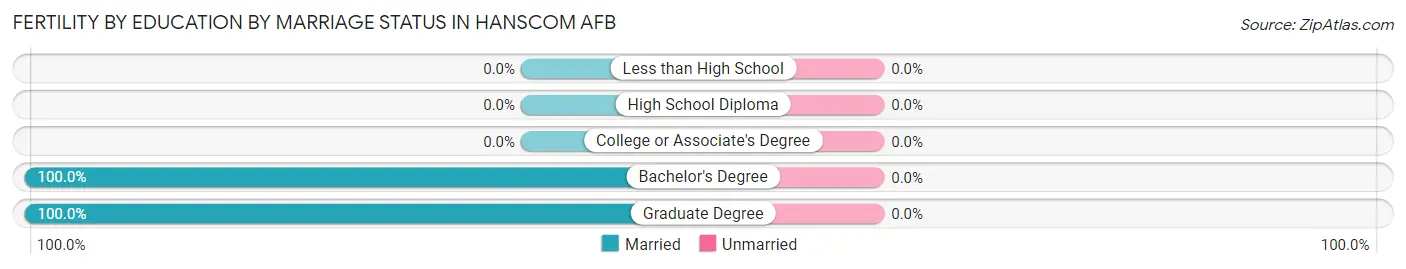
| Educational Attainment | Married | Unmarried |
| Less than High School | 0 (0.0%) | 0 (0.0%) |
| High School Diploma | 0 (0.0%) | 0 (0.0%) |
| College or Associate's Degree | 0 (0.0%) | 0 (0.0%) |
| Bachelor's Degree | 3 (100.0%) | 0 (0.0%) |
| Graduate Degree | 4 (100.0%) | 0 (0.0%) |
| Total | 7 (100.0%) | 0 (0.0%) |
Employment Characteristics in Hanscom AFB
Employment by Class of Employer in Hanscom AFB
Among the 708 employed individuals in Hanscom AFB, federal government employees (560 | 79.1%), private company employees (67 | 9.5%), and not-for-profit organizations (38 | 5.4%) make up the most common classes of employment.
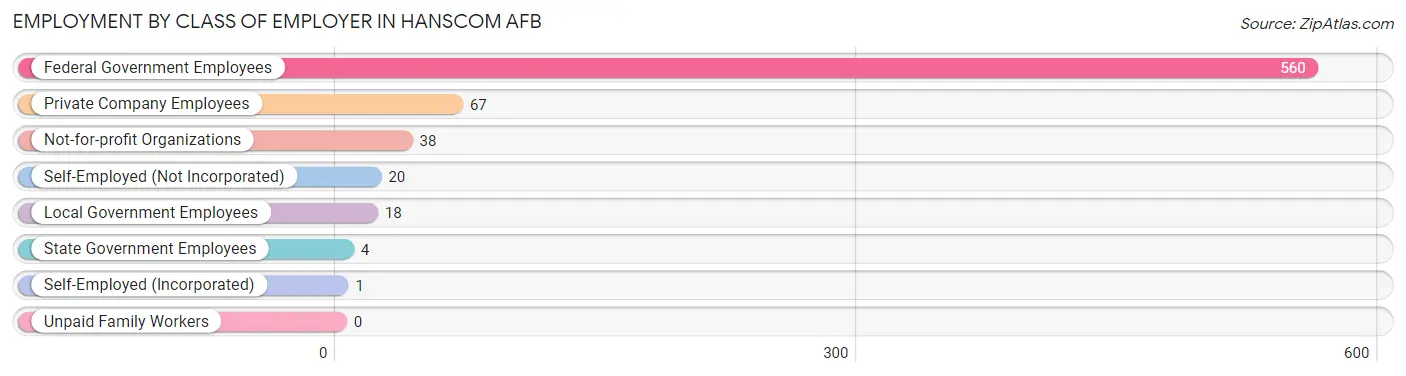
| Employer Class | # Employees | % Employees |
| Private Company Employees | 67 | 9.5% |
| Self-Employed (Incorporated) | 1 | 0.1% |
| Self-Employed (Not Incorporated) | 20 | 2.8% |
| Not-for-profit Organizations | 38 | 5.4% |
| Local Government Employees | 18 | 2.5% |
| State Government Employees | 4 | 0.6% |
| Federal Government Employees | 560 | 79.1% |
| Unpaid Family Workers | 0 | 0.0% |
| Total | 708 | 100.0% |
Employment Status by Age in Hanscom AFB
According to the labor force statistics for Hanscom AFB, out of the total population over 16 years of age (1,015), 70.0% or 710 individuals are in the labor force, with 1.0% or 7 of them unemployed. The age group with the highest labor force participation rate is 16 to 19 years, with 81.4% or 35 individuals in the labor force. Within the labor force, the 16 to 19 years age range has the highest percentage of unemployed individuals, with 15.8% or 6 of them being unemployed.
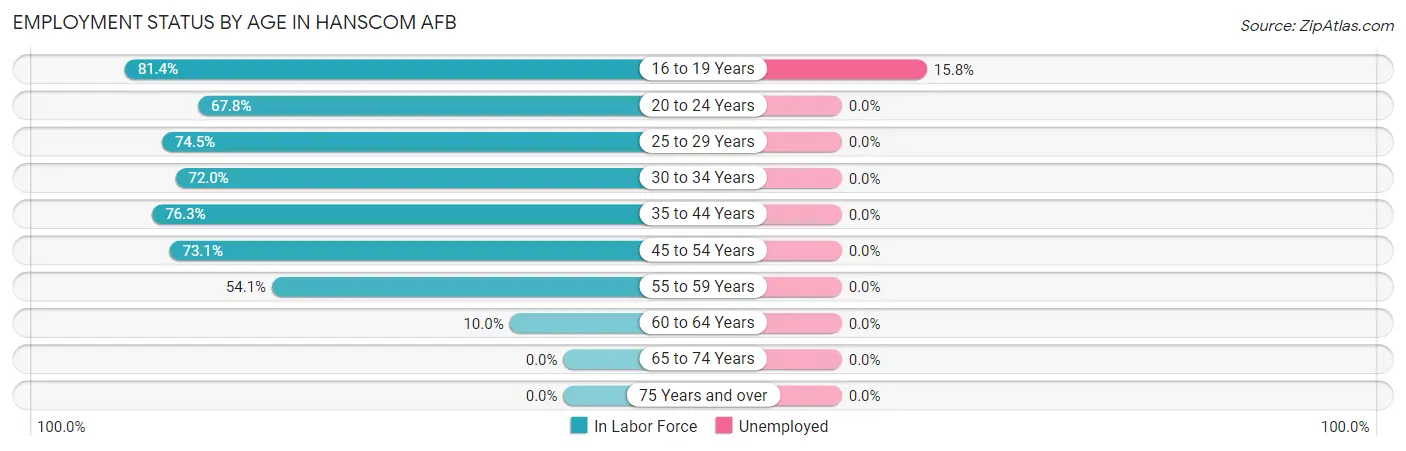
| Age Bracket | In Labor Force | Unemployed |
| 16 to 19 Years | 35 (81.4%) | 6 (15.8%) |
| 20 to 24 Years | 40 (67.8%) | 0 (0.0%) |
| 25 to 29 Years | 161 (74.5%) | 0 (0.0%) |
| 30 to 34 Years | 121 (72.0%) | 0 (0.0%) |
| 35 to 44 Years | 290 (76.3%) | 0 (0.0%) |
| 45 to 54 Years | 38 (73.1%) | 0 (0.0%) |
| 55 to 59 Years | 20 (54.1%) | 0 (0.0%) |
| 60 to 64 Years | 6 (10.0%) | 0 (0.0%) |
| 65 to 74 Years | 0 (0.0%) | 0 (0.0%) |
| 75 Years and over | 0 (0.0%) | 0 (0.0%) |
| Total | 710 (70.0%) | 7 (1.0%) |
Employment Status by Educational Attainment in Hanscom AFB
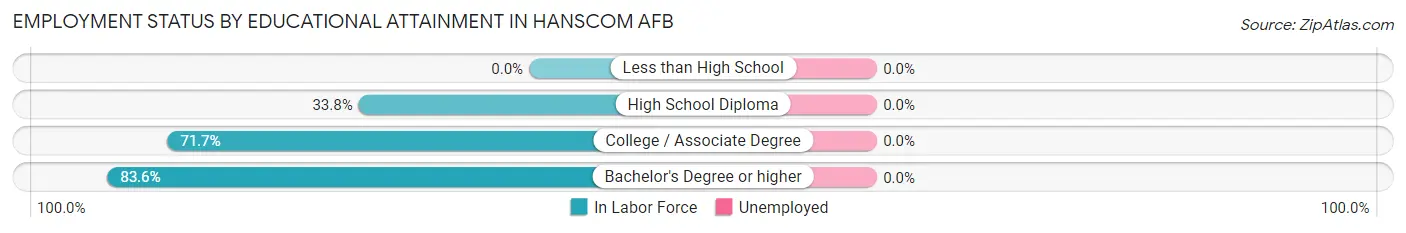
| Educational Attainment | In Labor Force | Unemployed |
| Less than High School | 0 (0.0%) | 0 (0.0%) |
| High School Diploma | 50 (33.8%) | 0 (0.0%) |
| College / Associate Degree | 321 (71.7%) | 0 (0.0%) |
| Bachelor's Degree or higher | 265 (83.6%) | 0 (0.0%) |
| Total | 636 (69.7%) | 0 (0.0%) |
Employment Occupations by Sex in Hanscom AFB
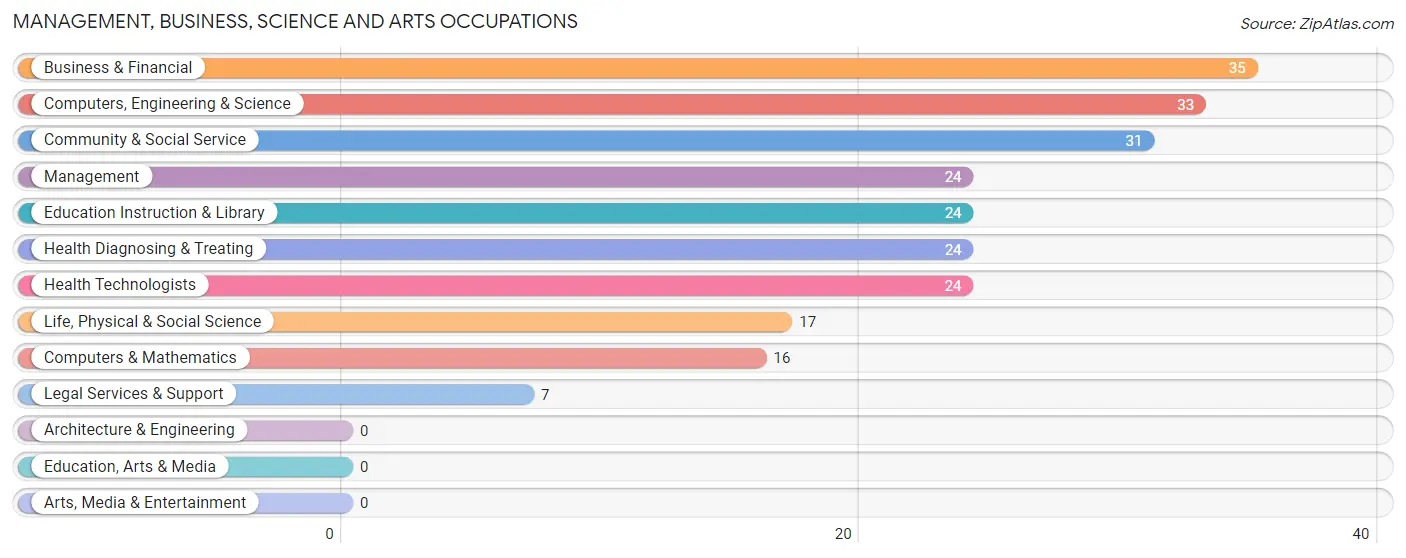
Management, Business, Science and Arts Occupations
The most common Management, Business, Science and Arts occupations in Hanscom AFB are Business & Financial (35 | 12.3%), Computers, Engineering & Science (33 | 11.6%), Community & Social Service (31 | 10.9%), Management (24 | 8.4%), and Education Instruction & Library (24 | 8.4%).
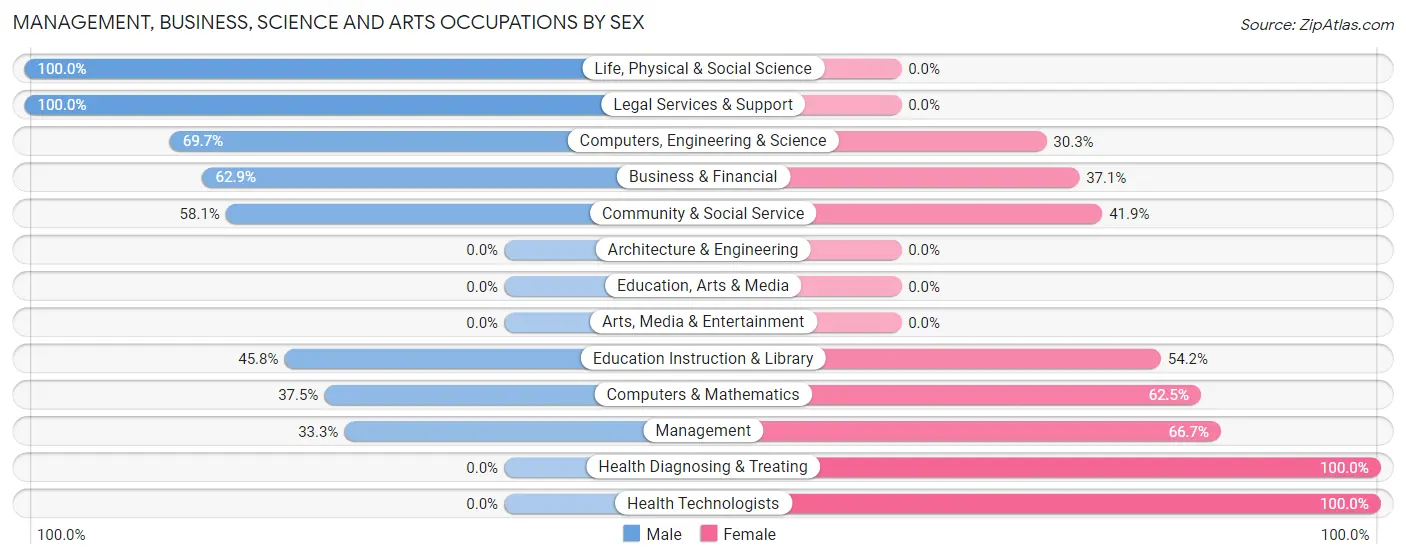
Management, Business, Science and Arts Occupations by Sex
Within the Management, Business, Science and Arts occupations in Hanscom AFB, the most male-oriented occupations are Life, Physical & Social Science (100.0%), Legal Services & Support (100.0%), and Computers, Engineering & Science (69.7%), while the most female-oriented occupations are Health Diagnosing & Treating (100.0%), Health Technologists (100.0%), and Management (66.7%).
| Occupation | Male | Female |
| Management | 8 (33.3%) | 16 (66.7%) |
| Business & Financial | 22 (62.9%) | 13 (37.1%) |
| Computers, Engineering & Science | 23 (69.7%) | 10 (30.3%) |
| Computers & Mathematics | 6 (37.5%) | 10 (62.5%) |
| Architecture & Engineering | 0 (0.0%) | 0 (0.0%) |
| Life, Physical & Social Science | 17 (100.0%) | 0 (0.0%) |
| Community & Social Service | 18 (58.1%) | 13 (41.9%) |
| Education, Arts & Media | 0 (0.0%) | 0 (0.0%) |
| Legal Services & Support | 7 (100.0%) | 0 (0.0%) |
| Education Instruction & Library | 11 (45.8%) | 13 (54.2%) |
| Arts, Media & Entertainment | 0 (0.0%) | 0 (0.0%) |
| Health Diagnosing & Treating | 0 (0.0%) | 24 (100.0%) |
| Health Technologists | 0 (0.0%) | 24 (100.0%) |
| Total (Category) | 71 (48.3%) | 76 (51.7%) |
| Total (Overall) | 161 (56.5%) | 124 (43.5%) |
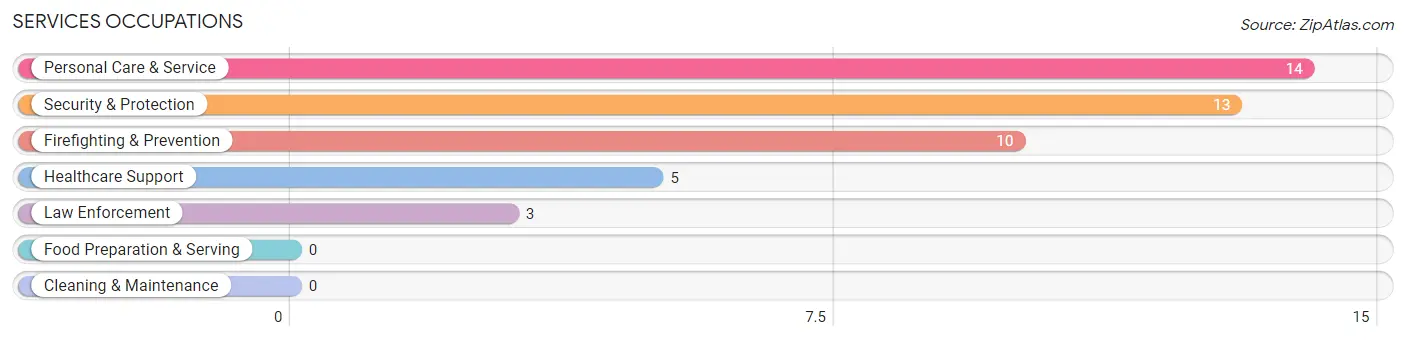
Services Occupations
The most common Services occupations in Hanscom AFB are Personal Care & Service (14 | 4.9%), Security & Protection (13 | 4.6%), Firefighting & Prevention (10 | 3.5%), Healthcare Support (5 | 1.8%), and Law Enforcement (3 | 1.1%).
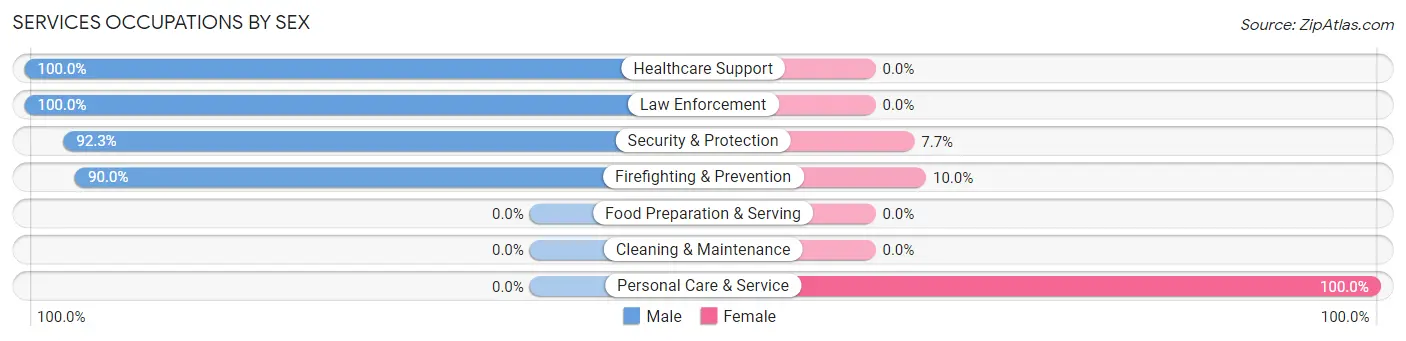
Services Occupations by Sex
Within the Services occupations in Hanscom AFB, the most male-oriented occupations are Healthcare Support (100.0%), Law Enforcement (100.0%), and Security & Protection (92.3%), while the most female-oriented occupations are Personal Care & Service (100.0%), Firefighting & Prevention (10.0%), and Security & Protection (7.7%).
| Occupation | Male | Female |
| Healthcare Support | 5 (100.0%) | 0 (0.0%) |
| Security & Protection | 12 (92.3%) | 1 (7.7%) |
| Firefighting & Prevention | 9 (90.0%) | 1 (10.0%) |
| Law Enforcement | 3 (100.0%) | 0 (0.0%) |
| Food Preparation & Serving | 0 (0.0%) | 0 (0.0%) |
| Cleaning & Maintenance | 0 (0.0%) | 0 (0.0%) |
| Personal Care & Service | 0 (0.0%) | 14 (100.0%) |
| Total (Category) | 17 (53.1%) | 15 (46.9%) |
| Total (Overall) | 161 (56.5%) | 124 (43.5%) |
Sales and Office Occupations
The most common Sales and Office occupations in Hanscom AFB are Sales & Related (21 | 7.4%), and Office & Administration (4 | 1.4%).
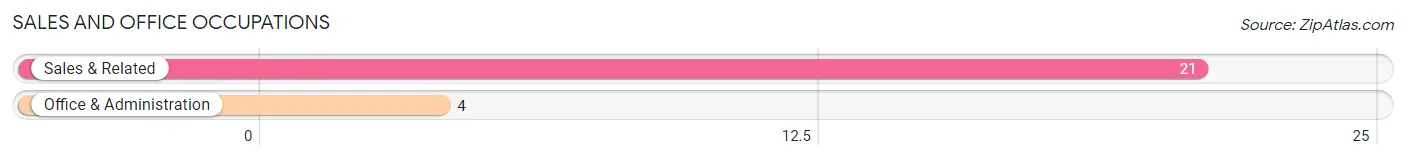
Sales and Office Occupations by Sex
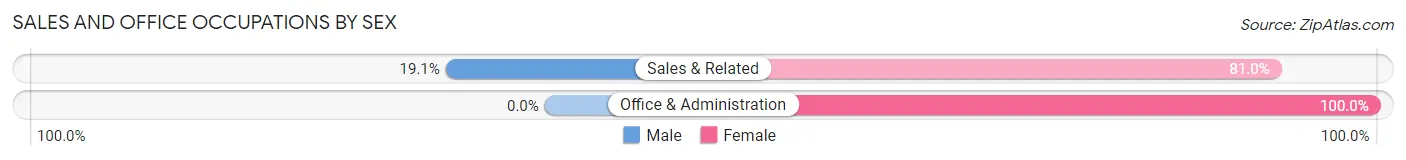
| Occupation | Male | Female |
| Sales & Related | 4 (19.1%) | 17 (80.9%) |
| Office & Administration | 0 (0.0%) | 4 (100.0%) |
| Total (Category) | 4 (16.0%) | 21 (84.0%) |
| Total (Overall) | 161 (56.5%) | 124 (43.5%) |
Natural Resources, Construction and Maintenance Occupations
The most common Natural Resources, Construction and Maintenance occupations in Hanscom AFB are , and Construction & Extraction (69 | 24.2%).
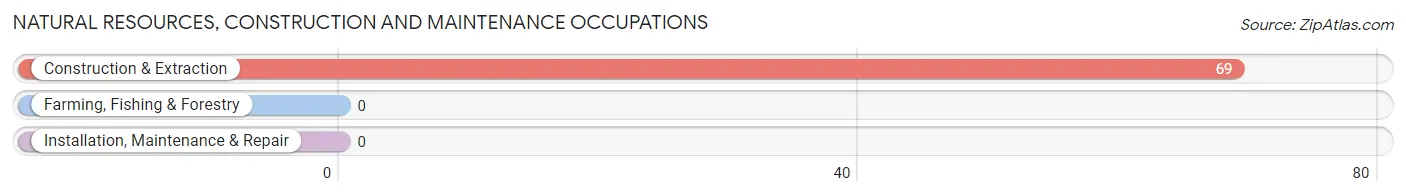
Natural Resources, Construction and Maintenance Occupations by Sex
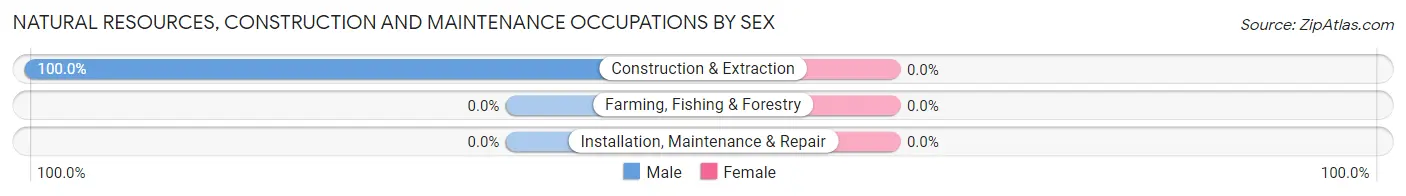
| Occupation | Male | Female |
| Farming, Fishing & Forestry | 0 (0.0%) | 0 (0.0%) |
| Construction & Extraction | 69 (100.0%) | 0 (0.0%) |
| Installation, Maintenance & Repair | 0 (0.0%) | 0 (0.0%) |
| Total (Category) | 69 (100.0%) | 0 (0.0%) |
| Total (Overall) | 161 (56.5%) | 124 (43.5%) |
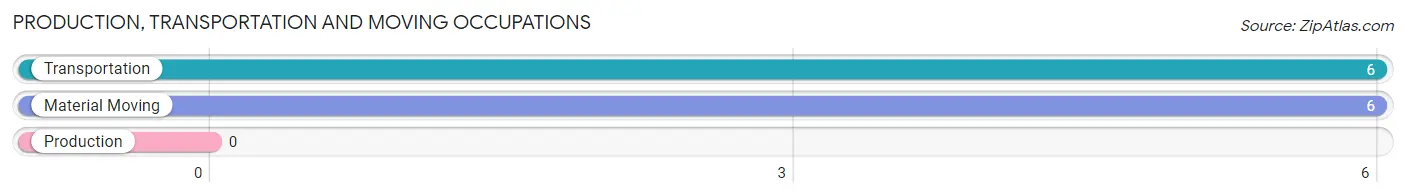
Production, Transportation and Moving Occupations
The most common Production, Transportation and Moving occupations in Hanscom AFB are Transportation (6 | 2.1%), and Material Moving (6 | 2.1%).
Production, Transportation and Moving Occupations by Sex
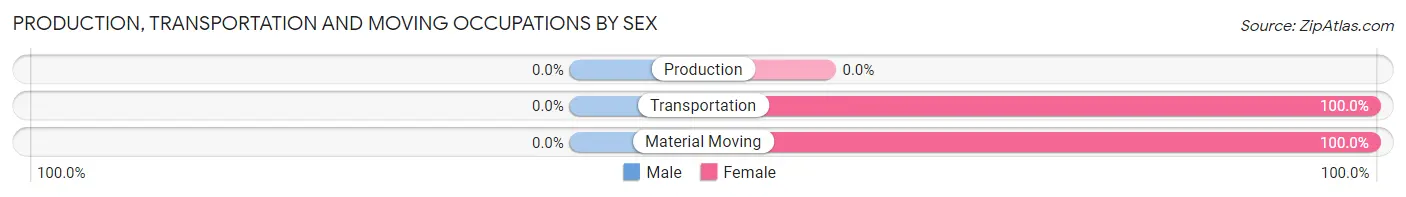
| Occupation | Male | Female |
| Production | 0 (0.0%) | 0 (0.0%) |
| Transportation | 0 (0.0%) | 6 (100.0%) |
| Material Moving | 0 (0.0%) | 6 (100.0%) |
| Total (Category) | 0 (0.0%) | 12 (100.0%) |
| Total (Overall) | 161 (56.5%) | 124 (43.5%) |
Employment Industries by Sex in Hanscom AFB
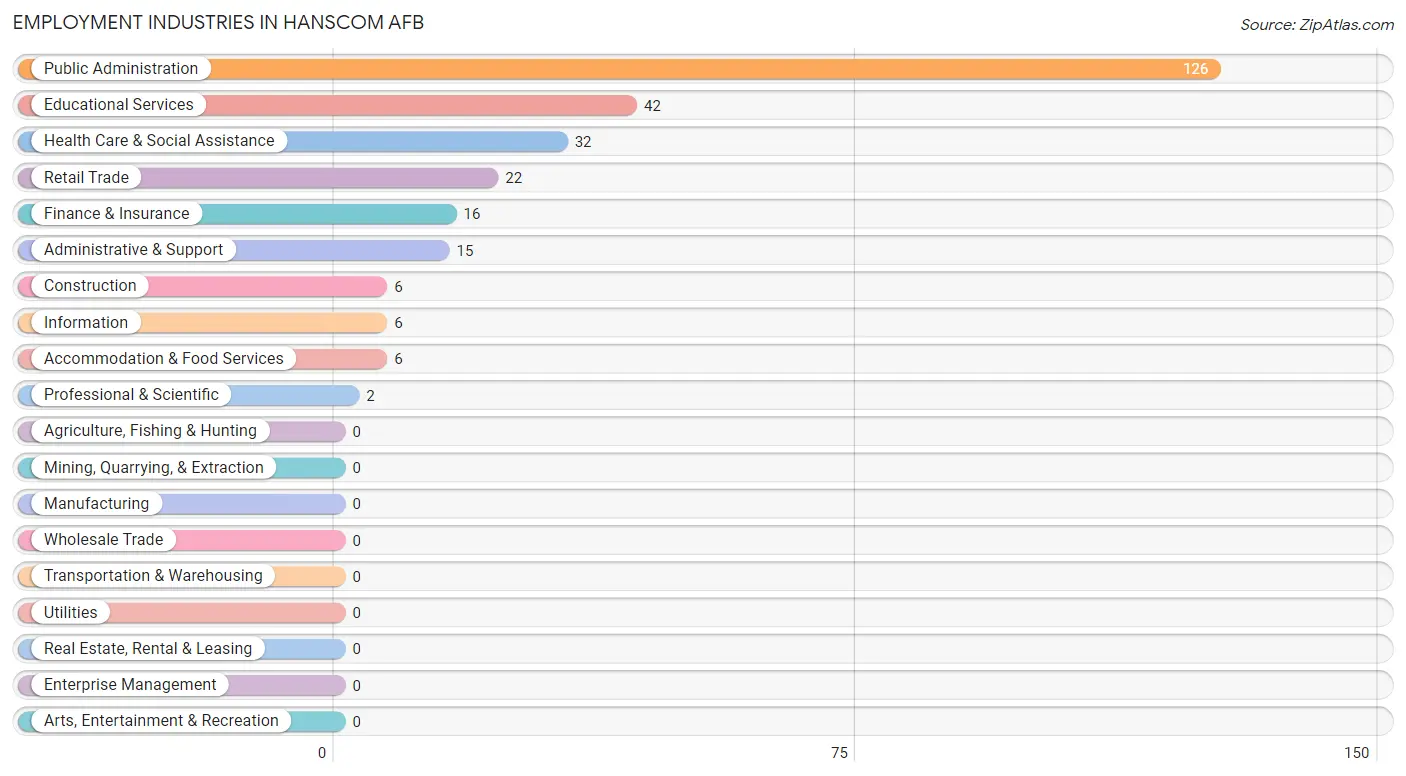
Employment Industries in Hanscom AFB
The major employment industries in Hanscom AFB include Public Administration (126 | 44.2%), Educational Services (42 | 14.7%), Health Care & Social Assistance (32 | 11.2%), Retail Trade (22 | 7.7%), and Finance & Insurance (16 | 5.6%).
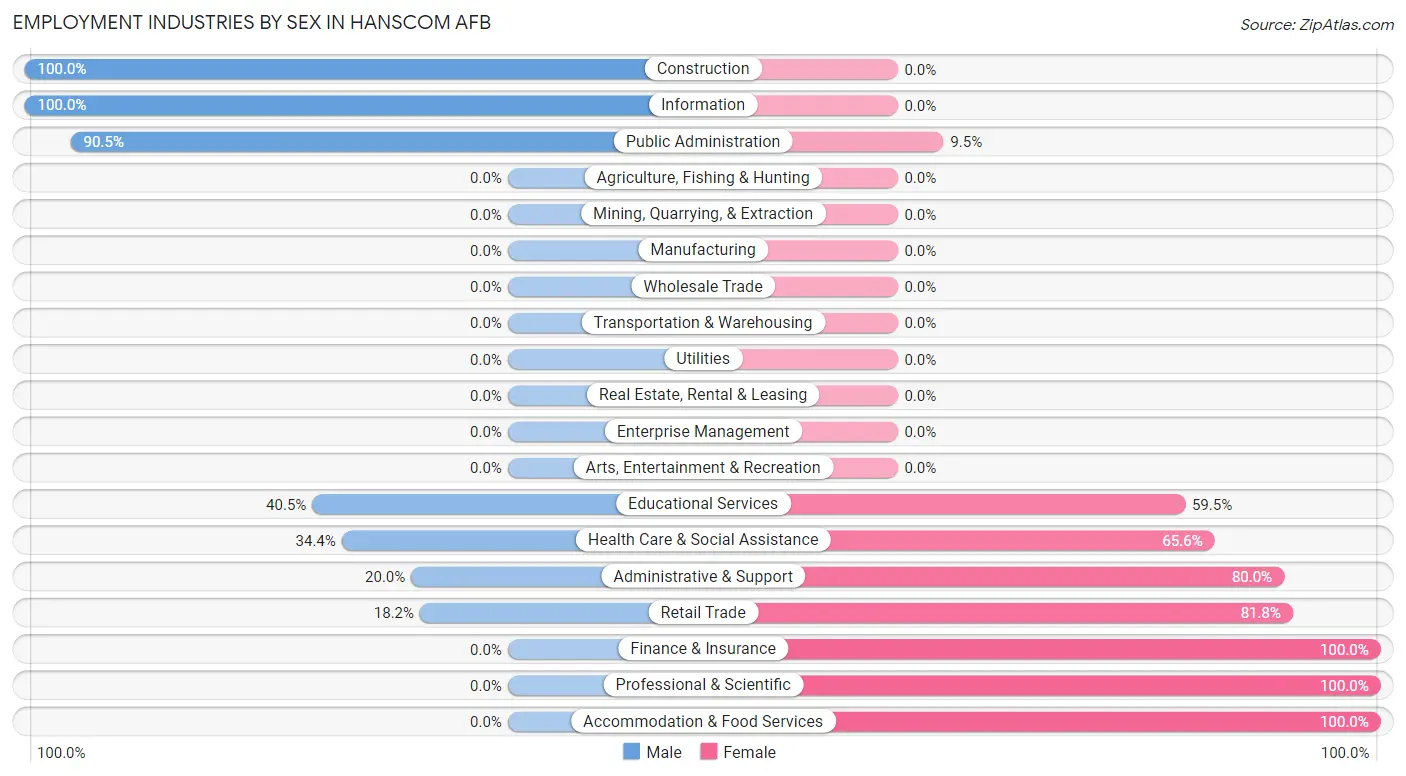
Employment Industries by Sex in Hanscom AFB
The Hanscom AFB industries that see more men than women are Construction (100.0%), Information (100.0%), and Public Administration (90.5%), whereas the industries that tend to have a higher number of women are Finance & Insurance (100.0%), Professional & Scientific (100.0%), and Accommodation & Food Services (100.0%).
| Industry | Male | Female |
| Agriculture, Fishing & Hunting | 0 (0.0%) | 0 (0.0%) |
| Mining, Quarrying, & Extraction | 0 (0.0%) | 0 (0.0%) |
| Construction | 6 (100.0%) | 0 (0.0%) |
| Manufacturing | 0 (0.0%) | 0 (0.0%) |
| Wholesale Trade | 0 (0.0%) | 0 (0.0%) |
| Retail Trade | 4 (18.2%) | 18 (81.8%) |
| Transportation & Warehousing | 0 (0.0%) | 0 (0.0%) |
| Utilities | 0 (0.0%) | 0 (0.0%) |
| Information | 6 (100.0%) | 0 (0.0%) |
| Finance & Insurance | 0 (0.0%) | 16 (100.0%) |
| Real Estate, Rental & Leasing | 0 (0.0%) | 0 (0.0%) |
| Professional & Scientific | 0 (0.0%) | 2 (100.0%) |
| Enterprise Management | 0 (0.0%) | 0 (0.0%) |
| Administrative & Support | 3 (20.0%) | 12 (80.0%) |
| Educational Services | 17 (40.5%) | 25 (59.5%) |
| Health Care & Social Assistance | 11 (34.4%) | 21 (65.6%) |
| Arts, Entertainment & Recreation | 0 (0.0%) | 0 (0.0%) |
| Accommodation & Food Services | 0 (0.0%) | 6 (100.0%) |
| Public Administration | 114 (90.5%) | 12 (9.5%) |
| Total | 161 (56.5%) | 124 (43.5%) |
Education in Hanscom AFB
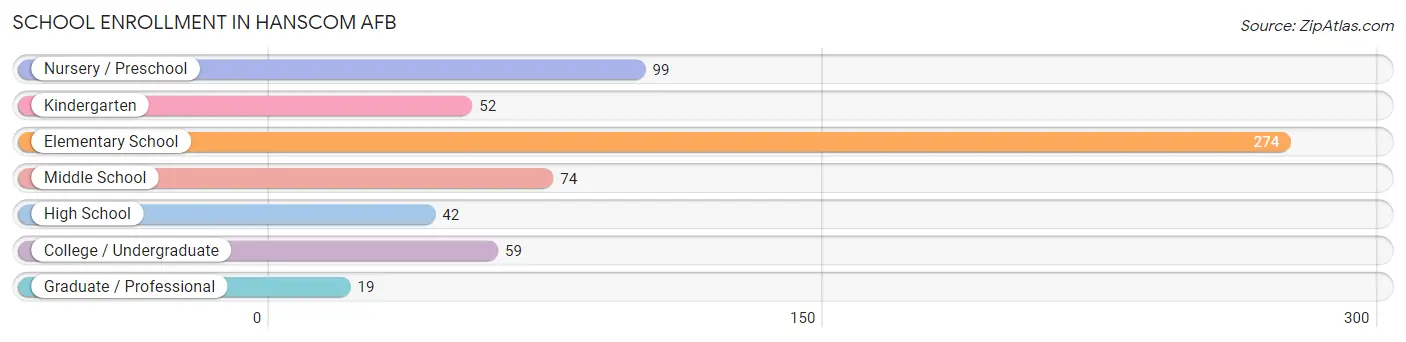
School Enrollment in Hanscom AFB
The most common levels of schooling among the 619 students in Hanscom AFB are elementary school (274 | 44.3%), nursery / preschool (99 | 16.0%), and middle school (74 | 11.9%).
| School Level | # Students | % Students |
| Nursery / Preschool | 99 | 16.0% |
| Kindergarten | 52 | 8.4% |
| Elementary School | 274 | 44.3% |
| Middle School | 74 | 11.9% |
| High School | 42 | 6.8% |
| College / Undergraduate | 59 | 9.5% |
| Graduate / Professional | 19 | 3.1% |
| Total | 619 | 100.0% |
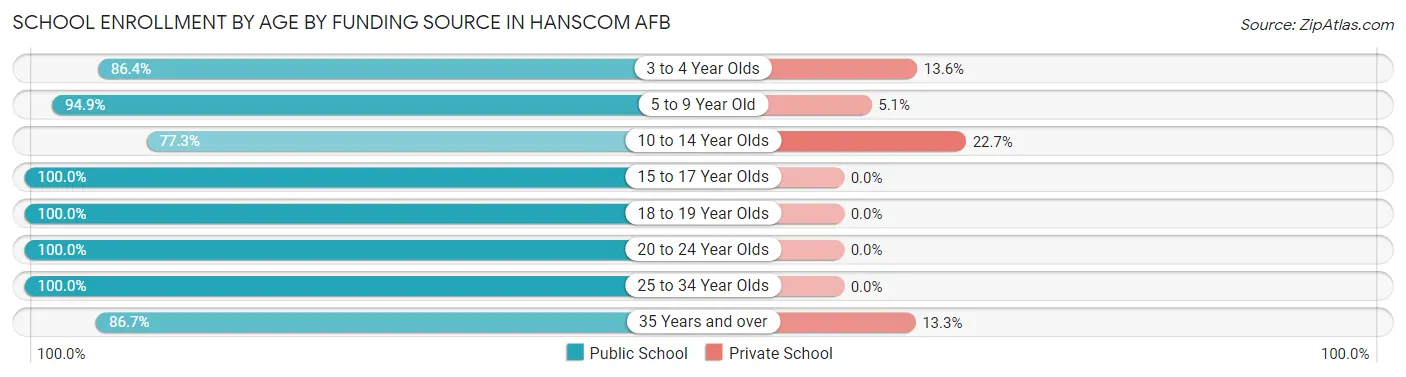
School Enrollment by Age by Funding Source in Hanscom AFB
Out of a total of 619 students who are enrolled in schools in Hanscom AFB, 53 (8.6%) attend a private institution, while the remaining 566 (91.4%) are enrolled in public schools. The age group of 10 to 14 year olds has the highest likelihood of being enrolled in private schools, with 20 (22.7% in the age bracket) enrolled. Conversely, the age group of 15 to 17 year olds has the lowest likelihood of being enrolled in a private school, with 26 (100.0% in the age bracket) attending a public institution.
| Age Bracket | Public School | Private School |
| 3 to 4 Year Olds | 76 (86.4%) | 12 (13.6%) |
| 5 to 9 Year Old | 314 (94.9%) | 17 (5.1%) |
| 10 to 14 Year Olds | 68 (77.3%) | 20 (22.7%) |
| 15 to 17 Year Olds | 26 (100.0%) | 0 (0.0%) |
| 18 to 19 Year Olds | 22 (100.0%) | 0 (0.0%) |
| 20 to 24 Year Olds | 14 (100.0%) | 0 (0.0%) |
| 25 to 34 Year Olds | 20 (100.0%) | 0 (0.0%) |
| 35 Years and over | 26 (86.7%) | 4 (13.3%) |
| Total | 566 (91.4%) | 53 (8.6%) |
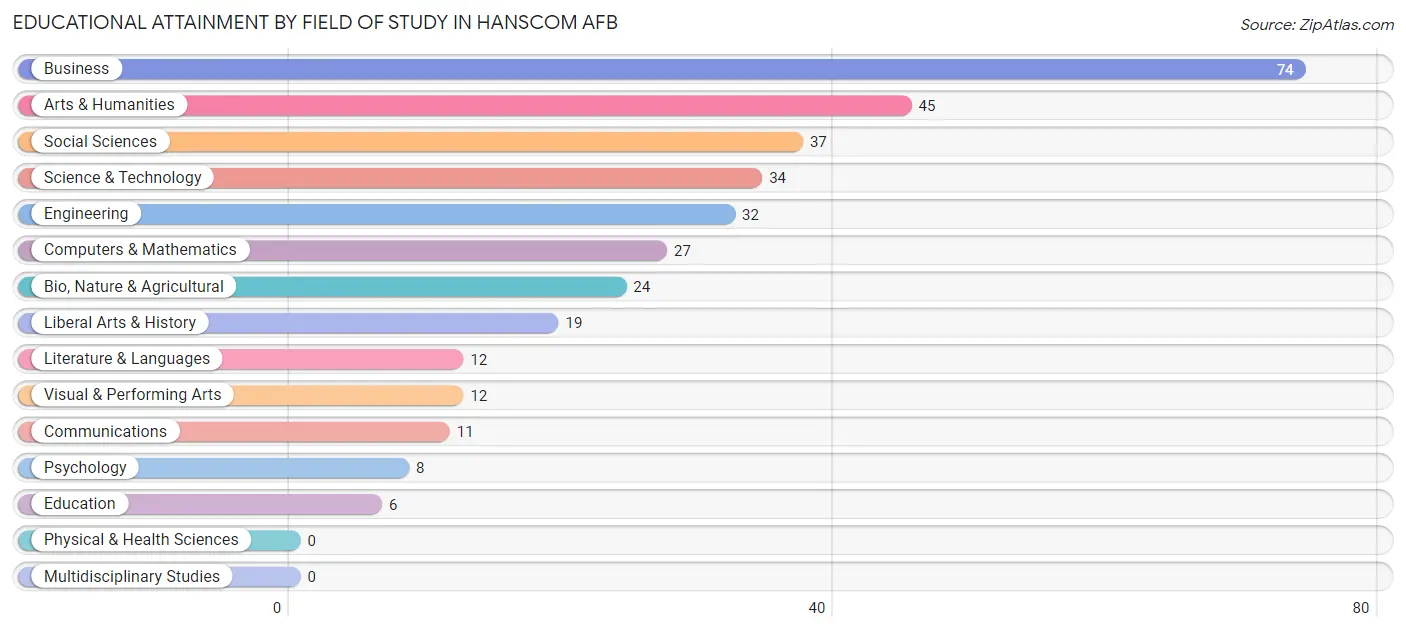
Educational Attainment by Field of Study in Hanscom AFB
Business (74 | 21.7%), arts & humanities (45 | 13.2%), social sciences (37 | 10.8%), science & technology (34 | 10.0%), and engineering (32 | 9.4%) are the most common fields of study among 341 individuals in Hanscom AFB who have obtained a bachelor's degree or higher.
| Field of Study | # Graduates | % Graduates |
| Computers & Mathematics | 27 | 7.9% |
| Bio, Nature & Agricultural | 24 | 7.0% |
| Physical & Health Sciences | 0 | 0.0% |
| Psychology | 8 | 2.4% |
| Social Sciences | 37 | 10.8% |
| Engineering | 32 | 9.4% |
| Multidisciplinary Studies | 0 | 0.0% |
| Science & Technology | 34 | 10.0% |
| Business | 74 | 21.7% |
| Education | 6 | 1.8% |
| Literature & Languages | 12 | 3.5% |
| Liberal Arts & History | 19 | 5.6% |
| Visual & Performing Arts | 12 | 3.5% |
| Communications | 11 | 3.2% |
| Arts & Humanities | 45 | 13.2% |
| Total | 341 | 100.0% |
Transportation & Commute in Hanscom AFB
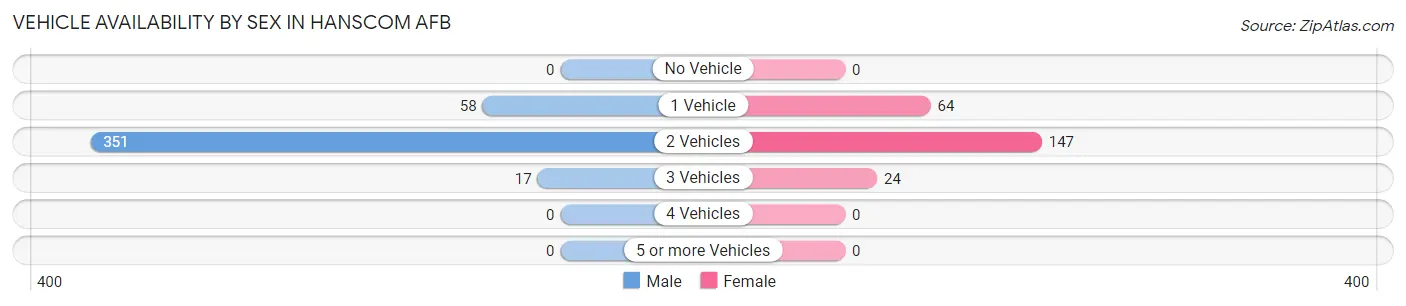
Vehicle Availability by Sex in Hanscom AFB
The most prevalent vehicle ownership categories in Hanscom AFB are males with 2 vehicles (351, accounting for 82.4%) and females with 2 vehicles (147, making up 149.4%).
| Vehicles Available | Male | Female |
| No Vehicle | 0 (0.0%) | 0 (0.0%) |
| 1 Vehicle | 58 (13.6%) | 64 (27.2%) |
| 2 Vehicles | 351 (82.4%) | 147 (62.5%) |
| 3 Vehicles | 17 (4.0%) | 24 (10.2%) |
| 4 Vehicles | 0 (0.0%) | 0 (0.0%) |
| 5 or more Vehicles | 0 (0.0%) | 0 (0.0%) |
| Total | 426 (100.0%) | 235 (100.0%) |
Commute Time in Hanscom AFB
The most frequently occuring commute durations in Hanscom AFB are 5 to 9 minutes (211 commuters, 36.7%), 10 to 14 minutes (77 commuters, 13.4%), and 40 to 44 minutes (75 commuters, 13.0%).
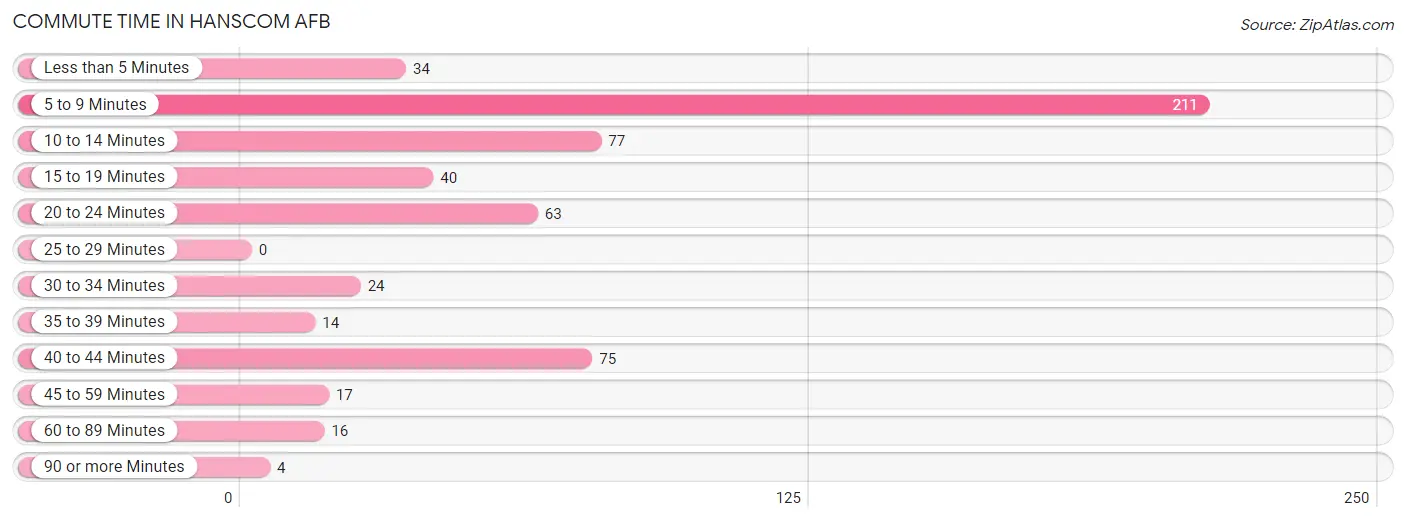
| Commute Time | # Commuters | % Commuters |
| Less than 5 Minutes | 34 | 5.9% |
| 5 to 9 Minutes | 211 | 36.7% |
| 10 to 14 Minutes | 77 | 13.4% |
| 15 to 19 Minutes | 40 | 7.0% |
| 20 to 24 Minutes | 63 | 11.0% |
| 25 to 29 Minutes | 0 | 0.0% |
| 30 to 34 Minutes | 24 | 4.2% |
| 35 to 39 Minutes | 14 | 2.4% |
| 40 to 44 Minutes | 75 | 13.0% |
| 45 to 59 Minutes | 17 | 3.0% |
| 60 to 89 Minutes | 16 | 2.8% |
| 90 or more Minutes | 4 | 0.7% |
Commute Time by Sex in Hanscom AFB
The most common commute times in Hanscom AFB are 40 to 44 minutes (75 commuters, 20.1%) for males and 5 to 9 minutes (150 commuters, 74.6%) for females.
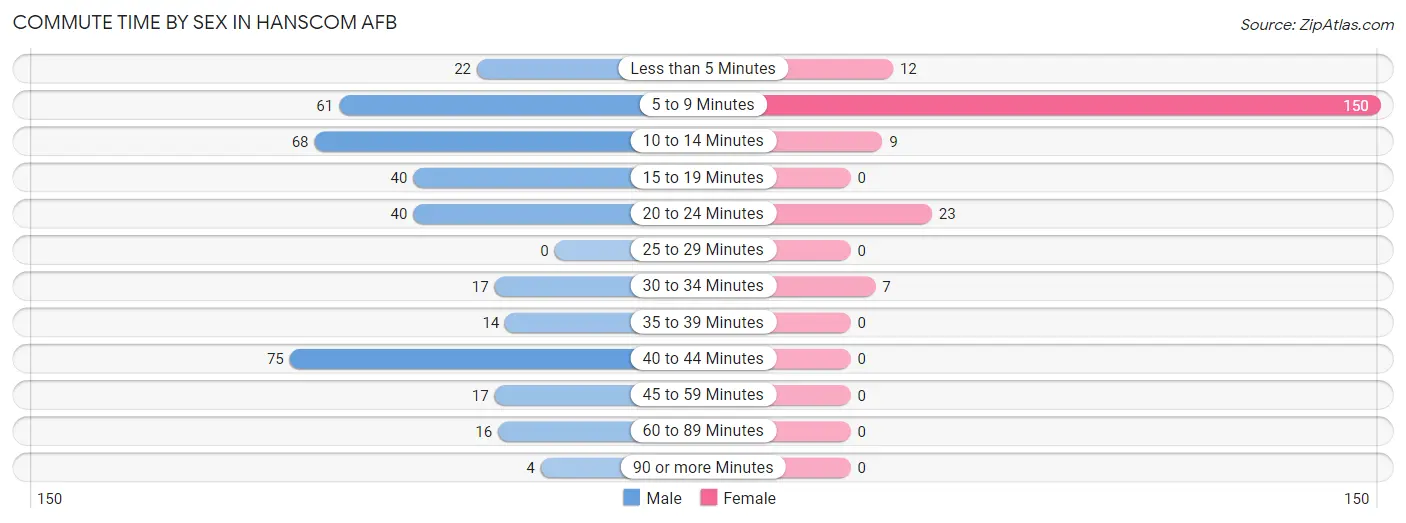
| Commute Time | Male | Female |
| Less than 5 Minutes | 22 (5.9%) | 12 (6.0%) |
| 5 to 9 Minutes | 61 (16.3%) | 150 (74.6%) |
| 10 to 14 Minutes | 68 (18.2%) | 9 (4.5%) |
| 15 to 19 Minutes | 40 (10.7%) | 0 (0.0%) |
| 20 to 24 Minutes | 40 (10.7%) | 23 (11.4%) |
| 25 to 29 Minutes | 0 (0.0%) | 0 (0.0%) |
| 30 to 34 Minutes | 17 (4.5%) | 7 (3.5%) |
| 35 to 39 Minutes | 14 (3.7%) | 0 (0.0%) |
| 40 to 44 Minutes | 75 (20.1%) | 0 (0.0%) |
| 45 to 59 Minutes | 17 (4.5%) | 0 (0.0%) |
| 60 to 89 Minutes | 16 (4.3%) | 0 (0.0%) |
| 90 or more Minutes | 4 (1.1%) | 0 (0.0%) |
Time of Departure to Work by Sex in Hanscom AFB
The most frequent times of departure to work in Hanscom AFB are 7:00 AM to 7:29 AM (140, 37.4%) for males and 7:30 AM to 7:59 AM (59, 29.3%) for females.
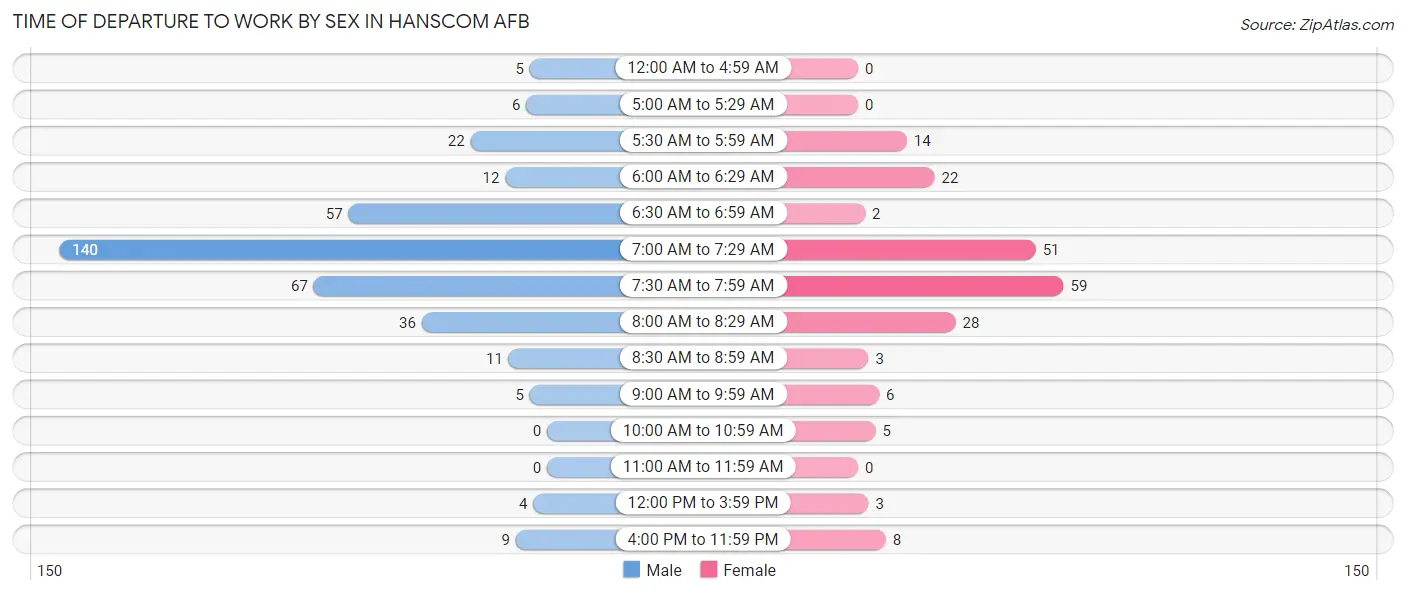
| Time of Departure | Male | Female |
| 12:00 AM to 4:59 AM | 5 (1.3%) | 0 (0.0%) |
| 5:00 AM to 5:29 AM | 6 (1.6%) | 0 (0.0%) |
| 5:30 AM to 5:59 AM | 22 (5.9%) | 14 (7.0%) |
| 6:00 AM to 6:29 AM | 12 (3.2%) | 22 (11.0%) |
| 6:30 AM to 6:59 AM | 57 (15.2%) | 2 (1.0%) |
| 7:00 AM to 7:29 AM | 140 (37.4%) | 51 (25.4%) |
| 7:30 AM to 7:59 AM | 67 (17.9%) | 59 (29.3%) |
| 8:00 AM to 8:29 AM | 36 (9.6%) | 28 (13.9%) |
| 8:30 AM to 8:59 AM | 11 (2.9%) | 3 (1.5%) |
| 9:00 AM to 9:59 AM | 5 (1.3%) | 6 (3.0%) |
| 10:00 AM to 10:59 AM | 0 (0.0%) | 5 (2.5%) |
| 11:00 AM to 11:59 AM | 0 (0.0%) | 0 (0.0%) |
| 12:00 PM to 3:59 PM | 4 (1.1%) | 3 (1.5%) |
| 4:00 PM to 11:59 PM | 9 (2.4%) | 8 (4.0%) |
| Total | 374 (100.0%) | 201 (100.0%) |
Housing Occupancy in Hanscom AFB
Occupancy by Ownership in Hanscom AFB
Of the total 460 dwellings in Hanscom AFB, owner-occupied units account for 0 (0.0%), while renter-occupied units make up 460 (100.0%).
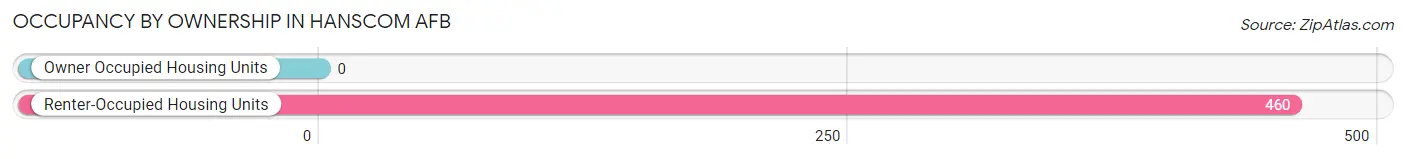
| Occupancy | # Housing Units | % Housing Units |
| Owner Occupied Housing Units | 0 | 0.0% |
| Renter-Occupied Housing Units | 460 | 100.0% |
| Total Occupied Housing Units | 460 | 100.0% |
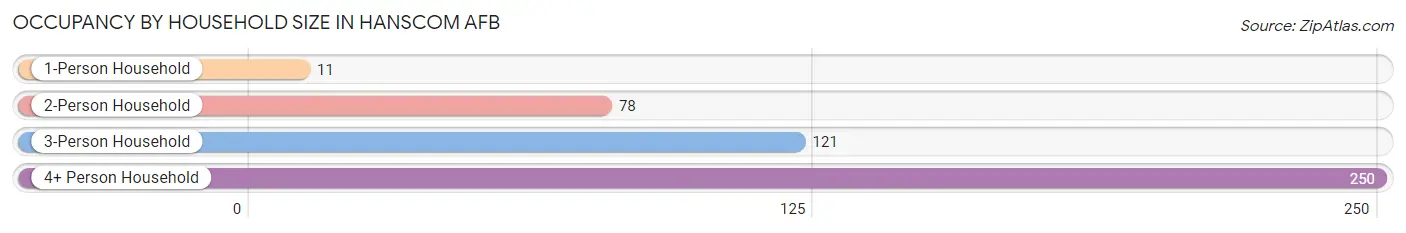
Occupancy by Household Size in Hanscom AFB
| Household Size | # Housing Units | % Housing Units |
| 1-Person Household | 11 | 2.4% |
| 2-Person Household | 78 | 17.0% |
| 3-Person Household | 121 | 26.3% |
| 4+ Person Household | 250 | 54.3% |
| Total Housing Units | 460 | 100.0% |
Occupancy by Ownership by Household Size in Hanscom AFB
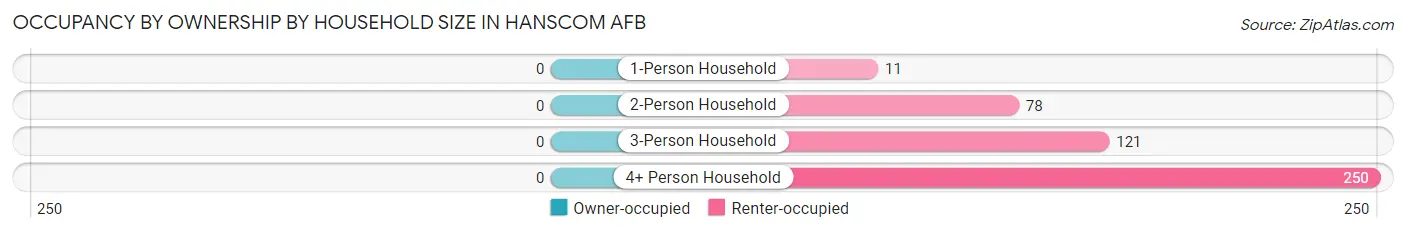
| Household Size | Owner-occupied | Renter-occupied |
| 1-Person Household | 0 (0.0%) | 11 (100.0%) |
| 2-Person Household | 0 (0.0%) | 78 (100.0%) |
| 3-Person Household | 0 (0.0%) | 121 (100.0%) |
| 4+ Person Household | 0 (0.0%) | 250 (100.0%) |
| Total Housing Units | 0 (0.0%) | 460 (100.0%) |
Occupancy by Educational Attainment in Hanscom AFB
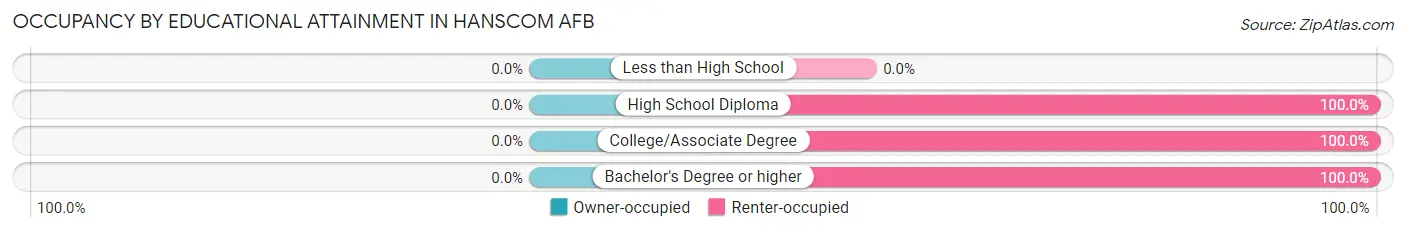
| Household Size | Owner-occupied | Renter-occupied |
| Less than High School | 0 (0.0%) | 0 (0.0%) |
| High School Diploma | 0 (0.0%) | 51 (100.0%) |
| College/Associate Degree | 0 (0.0%) | 213 (100.0%) |
| Bachelor's Degree or higher | 0 (0.0%) | 196 (100.0%) |
Occupancy by Age of Householder in Hanscom AFB
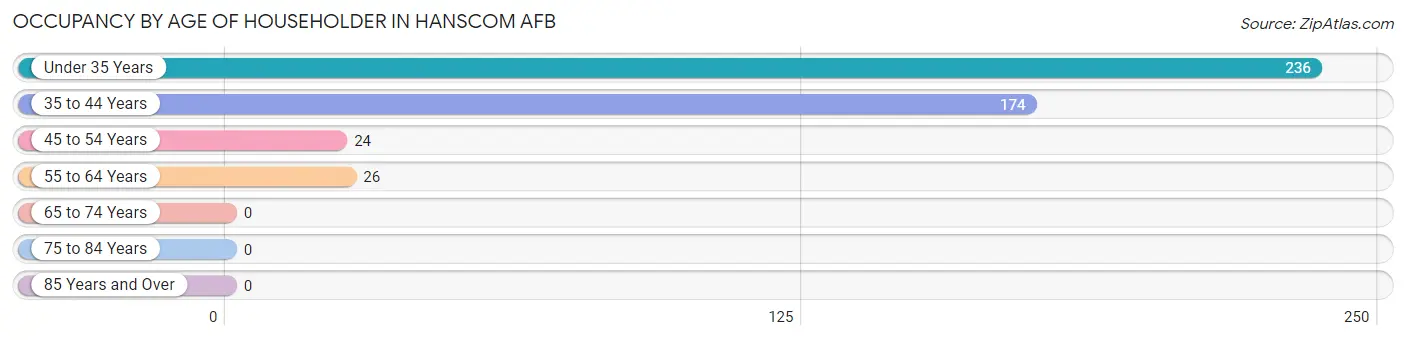
| Age Bracket | # Households | % Households |
| Under 35 Years | 236 | 51.3% |
| 35 to 44 Years | 174 | 37.8% |
| 45 to 54 Years | 24 | 5.2% |
| 55 to 64 Years | 26 | 5.7% |
| 65 to 74 Years | 0 | 0.0% |
| 75 to 84 Years | 0 | 0.0% |
| 85 Years and Over | 0 | 0.0% |
| Total | 460 | 100.0% |
Housing Finances in Hanscom AFB
Median Income by Occupancy in Hanscom AFB
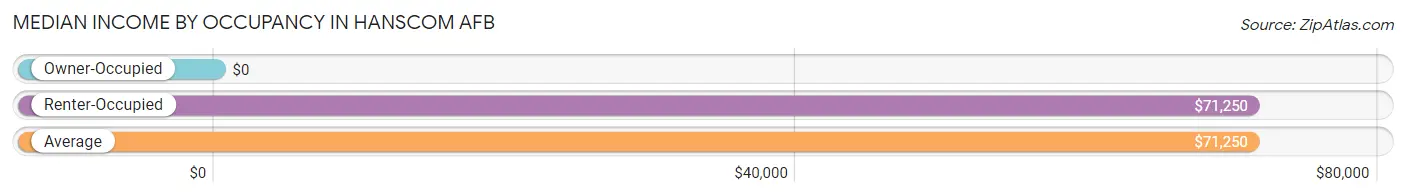
| Occupancy Type | # Households | Median Income |
| Owner-Occupied | 0 (0.0%) | $0 |
| Renter-Occupied | 460 (100.0%) | $71,250 |
| Average | 460 (100.0%) | $71,250 |
Occupancy by Householder Income Bracket in Hanscom AFB
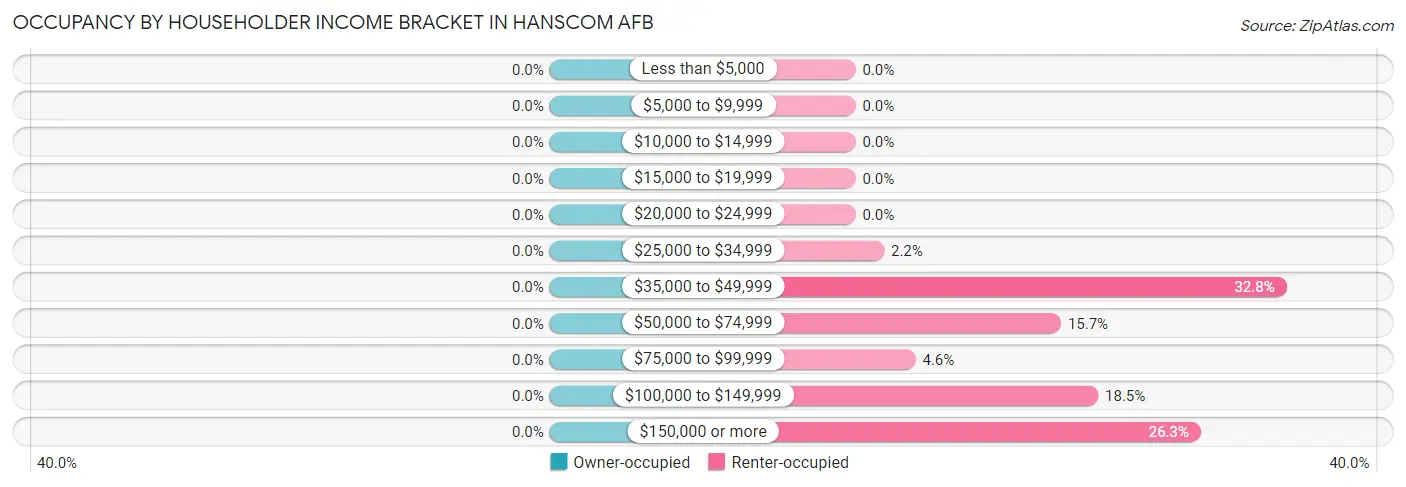
| Income Bracket | Owner-occupied | Renter-occupied |
| Less than $5,000 | 0 (0.0%) | 0 (0.0%) |
| $5,000 to $9,999 | 0 (0.0%) | 0 (0.0%) |
| $10,000 to $14,999 | 0 (0.0%) | 0 (0.0%) |
| $15,000 to $19,999 | 0 (0.0%) | 0 (0.0%) |
| $20,000 to $24,999 | 0 (0.0%) | 0 (0.0%) |
| $25,000 to $34,999 | 0 (0.0%) | 10 (2.2%) |
| $35,000 to $49,999 | 0 (0.0%) | 151 (32.8%) |
| $50,000 to $74,999 | 0 (0.0%) | 72 (15.7%) |
| $75,000 to $99,999 | 0 (0.0%) | 21 (4.6%) |
| $100,000 to $149,999 | 0 (0.0%) | 85 (18.5%) |
| $150,000 or more | 0 (0.0%) | 121 (26.3%) |
| Total | 0 (0.0%) | 460 (100.0%) |
Monthly Housing Cost Tiers in Hanscom AFB
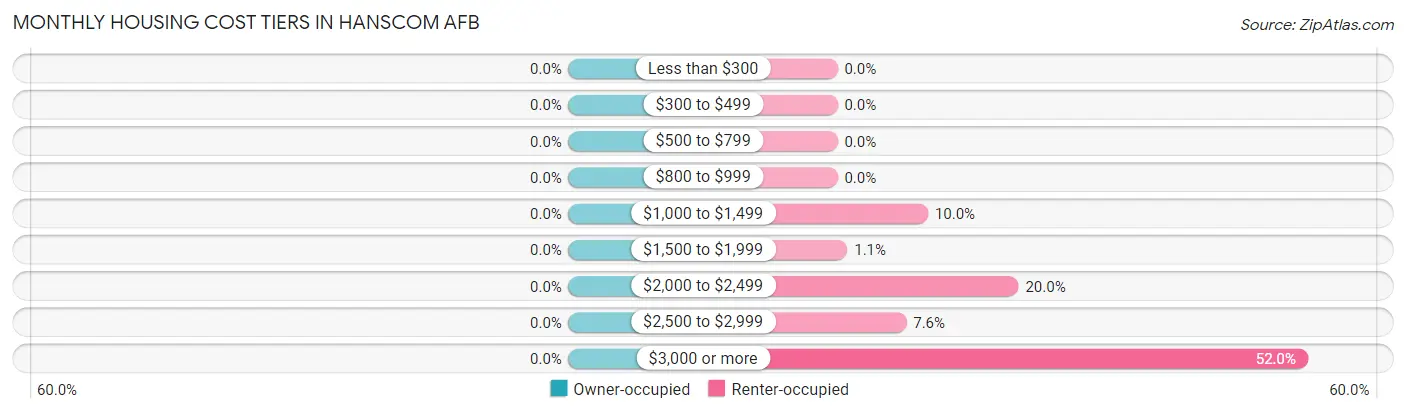
| Monthly Cost | Owner-occupied | Renter-occupied |
| Less than $300 | 0 (0.0%) | 0 (0.0%) |
| $300 to $499 | 0 (0.0%) | 0 (0.0%) |
| $500 to $799 | 0 (0.0%) | 0 (0.0%) |
| $800 to $999 | 0 (0.0%) | 0 (0.0%) |
| $1,000 to $1,499 | 0 (0.0%) | 46 (10.0%) |
| $1,500 to $1,999 | 0 (0.0%) | 5 (1.1%) |
| $2,000 to $2,499 | 0 (0.0%) | 92 (20.0%) |
| $2,500 to $2,999 | 0 (0.0%) | 35 (7.6%) |
| $3,000 or more | 0 (0.0%) | 239 (52.0%) |
| Total | 0 (0.0%) | 460 (100.0%) |
Physical Housing Characteristics in Hanscom AFB
Housing Structures in Hanscom AFB
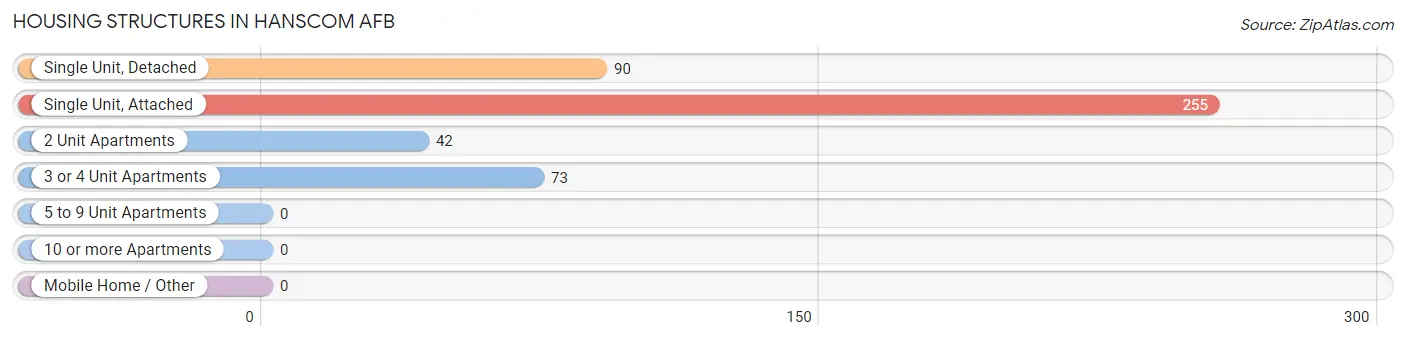
| Structure Type | # Housing Units | % Housing Units |
| Single Unit, Detached | 90 | 19.6% |
| Single Unit, Attached | 255 | 55.4% |
| 2 Unit Apartments | 42 | 9.1% |
| 3 or 4 Unit Apartments | 73 | 15.9% |
| 5 to 9 Unit Apartments | 0 | 0.0% |
| 10 or more Apartments | 0 | 0.0% |
| Mobile Home / Other | 0 | 0.0% |
| Total | 460 | 100.0% |
Housing Structures by Occupancy in Hanscom AFB
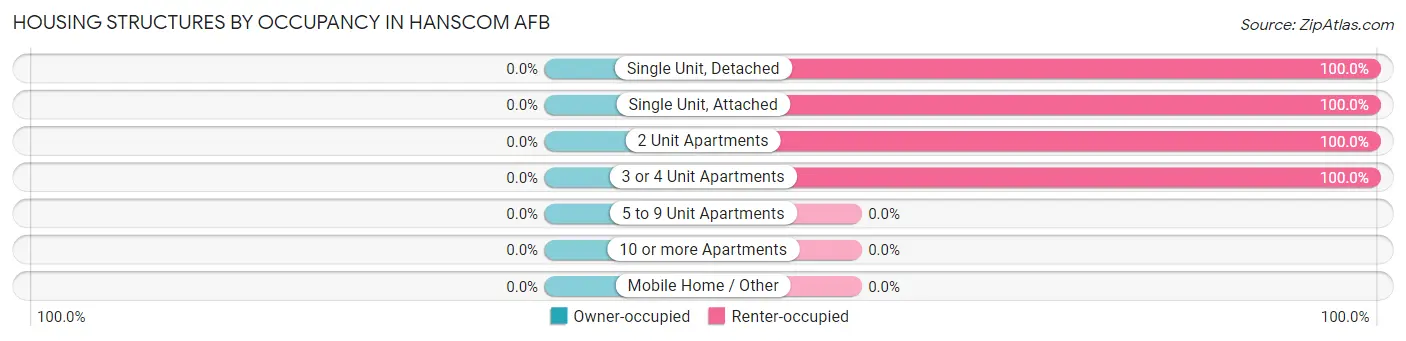
| Structure Type | Owner-occupied | Renter-occupied |
| Single Unit, Detached | 0 (0.0%) | 90 (100.0%) |
| Single Unit, Attached | 0 (0.0%) | 255 (100.0%) |
| 2 Unit Apartments | 0 (0.0%) | 42 (100.0%) |
| 3 or 4 Unit Apartments | 0 (0.0%) | 73 (100.0%) |
| 5 to 9 Unit Apartments | 0 (0.0%) | 0 (0.0%) |
| 10 or more Apartments | 0 (0.0%) | 0 (0.0%) |
| Mobile Home / Other | 0 (0.0%) | 0 (0.0%) |
| Total | 0 (0.0%) | 460 (100.0%) |
Housing Structures by Number of Rooms in Hanscom AFB
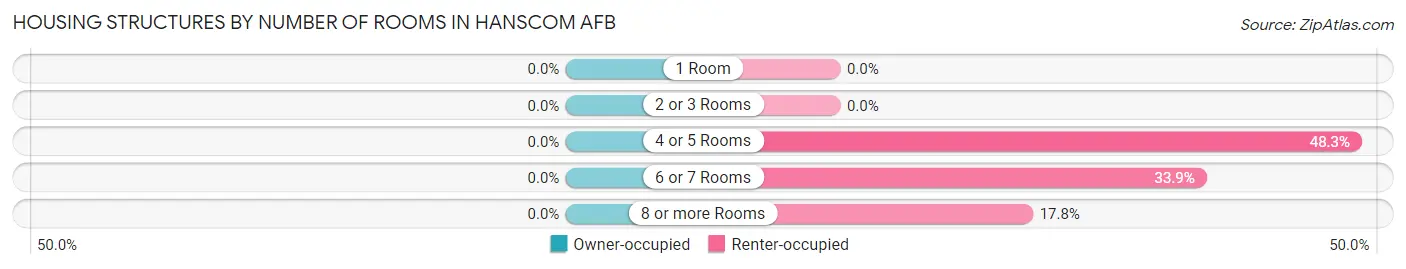
| Number of Rooms | Owner-occupied | Renter-occupied |
| 1 Room | 0 (0.0%) | 0 (0.0%) |
| 2 or 3 Rooms | 0 (0.0%) | 0 (0.0%) |
| 4 or 5 Rooms | 0 (0.0%) | 222 (48.3%) |
| 6 or 7 Rooms | 0 (0.0%) | 156 (33.9%) |
| 8 or more Rooms | 0 (0.0%) | 82 (17.8%) |
| Total | 0 (0.0%) | 460 (100.0%) |
Housing Structure by Heating Type in Hanscom AFB
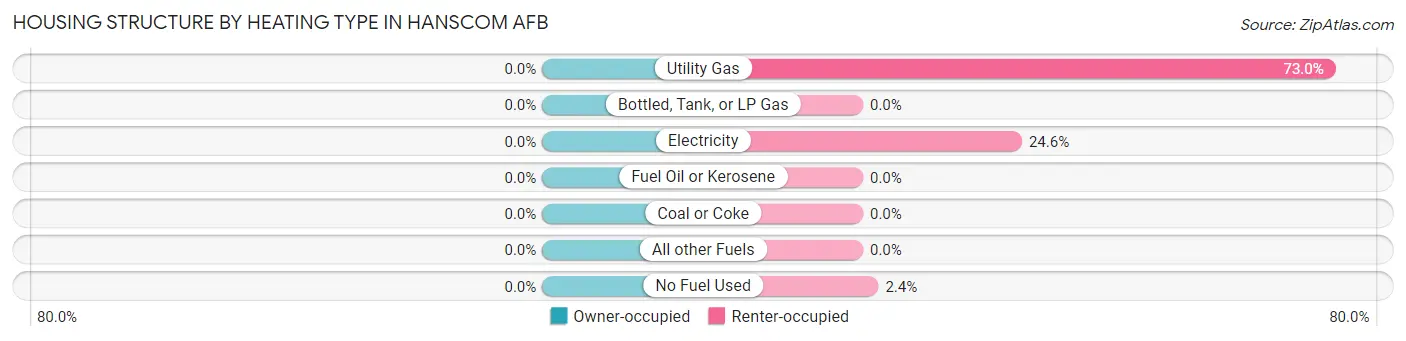
| Heating Type | Owner-occupied | Renter-occupied |
| Utility Gas | 0 (0.0%) | 336 (73.0%) |
| Bottled, Tank, or LP Gas | 0 (0.0%) | 0 (0.0%) |
| Electricity | 0 (0.0%) | 113 (24.6%) |
| Fuel Oil or Kerosene | 0 (0.0%) | 0 (0.0%) |
| Coal or Coke | 0 (0.0%) | 0 (0.0%) |
| All other Fuels | 0 (0.0%) | 0 (0.0%) |
| No Fuel Used | 0 (0.0%) | 11 (2.4%) |
| Total | 0 (0.0%) | 460 (100.0%) |
Household Vehicle Usage in Hanscom AFB
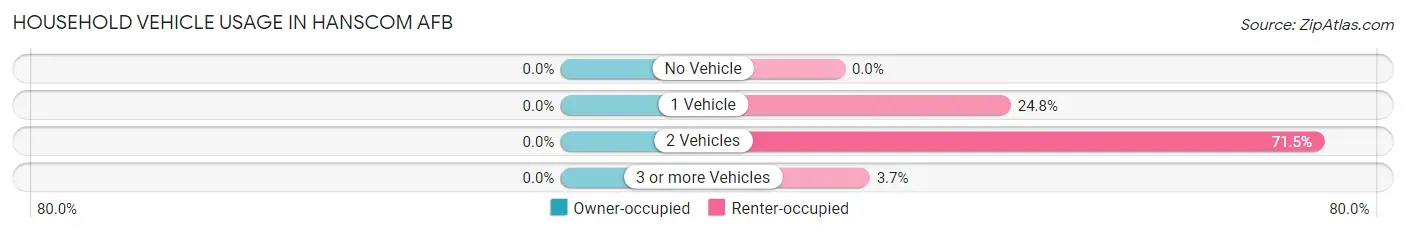
| Vehicles per Household | Owner-occupied | Renter-occupied |
| No Vehicle | 0 (0.0%) | 0 (0.0%) |
| 1 Vehicle | 0 (0.0%) | 114 (24.8%) |
| 2 Vehicles | 0 (0.0%) | 329 (71.5%) |
| 3 or more Vehicles | 0 (0.0%) | 17 (3.7%) |
| Total | 0 (0.0%) | 460 (100.0%) |
Real Estate & Mortgages in Hanscom AFB
Real Estate and Mortgage Overview in Hanscom AFB
| Characteristic | Without Mortgage | With Mortgage |
| Housing Units | 0 | 0 |
| Median Property Value | - | - |
| Median Household Income | - | - |
| Monthly Housing Costs | - | - |
| Real Estate Taxes | - | - |
Property Value by Mortgage Status in Hanscom AFB
| Property Value | Without Mortgage | With Mortgage |
| Less than $50,000 | 0 (0.0%) | 0 (0.0%) |
| $50,000 to $99,999 | 0 (0.0%) | 0 (0.0%) |
| $100,000 to $299,999 | 0 (0.0%) | 0 (0.0%) |
| $300,000 to $499,999 | 0 (0.0%) | 0 (0.0%) |
| $500,000 to $749,999 | 0 (0.0%) | 0 (0.0%) |
| $750,000 to $999,999 | 0 (0.0%) | 0 (0.0%) |
| $1,000,000 or more | 0 (0.0%) | 0 (0.0%) |
| Total | 0 (0.0%) | 0 (0.0%) |
Household Income by Mortgage Status in Hanscom AFB
| Household Income | Without Mortgage | With Mortgage |
| Less than $10,000 | 0 (0.0%) | 0 (0.0%) |
| $10,000 to $24,999 | 0 (0.0%) | 0 (0.0%) |
| $25,000 to $34,999 | 0 (0.0%) | 0 (0.0%) |
| $35,000 to $49,999 | 0 (0.0%) | 0 (0.0%) |
| $50,000 to $74,999 | 0 (0.0%) | 0 (0.0%) |
| $75,000 to $99,999 | 0 (0.0%) | 0 (0.0%) |
| $100,000 to $149,999 | 0 (0.0%) | 0 (0.0%) |
| $150,000 or more | 0 (0.0%) | 0 (0.0%) |
| Total | 0 (0.0%) | 0 (0.0%) |
Property Value to Household Income Ratio in Hanscom AFB
| Value-to-Income Ratio | Without Mortgage | With Mortgage |
| Less than 2.0x | 0 (0.0%) | 0 (0.0%) |
| 2.0x to 2.9x | 0 (0.0%) | 0 (0.0%) |
| 3.0x to 3.9x | 0 (0.0%) | 0 (0.0%) |
| 4.0x or more | 0 (0.0%) | 0 (0.0%) |
| Total | 0 (0.0%) | 0 (0.0%) |
Real Estate Taxes by Mortgage Status in Hanscom AFB
| Property Taxes | Without Mortgage | With Mortgage |
| Less than $800 | 0 (0.0%) | 0 (0.0%) |
| $800 to $1,499 | 0 (0.0%) | 0 (0.0%) |
| $800 to $1,499 | 0 (0.0%) | 0 (0.0%) |
| Total | 0 (0.0%) | 0 (0.0%) |
Health & Disability in Hanscom AFB
Health Insurance Coverage by Age in Hanscom AFB
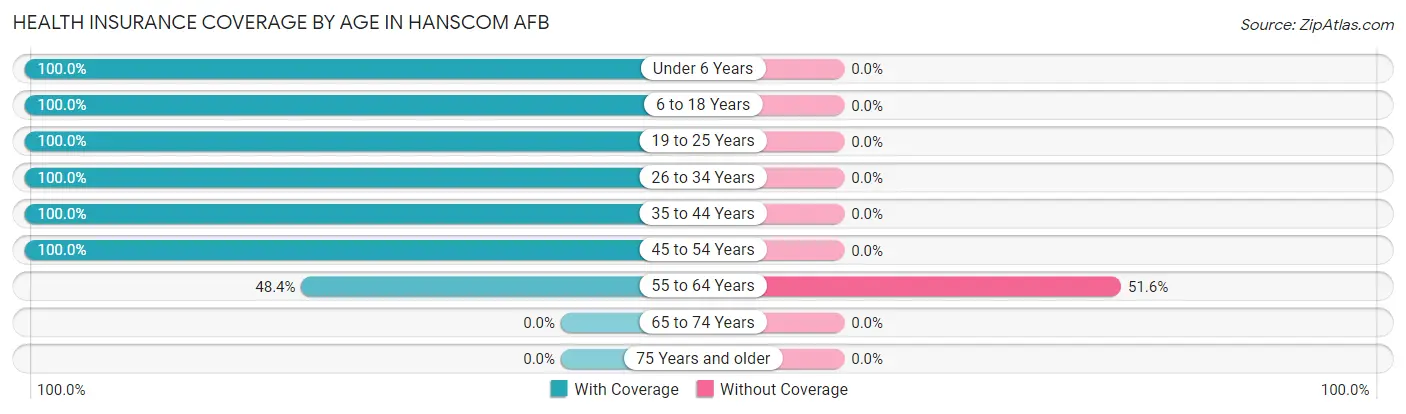
| Age Bracket | With Coverage | Without Coverage |
| Under 6 Years | 342 (100.0%) | 0 (0.0%) |
| 6 to 18 Years | 443 (100.0%) | 0 (0.0%) |
| 19 to 25 Years | 98 (100.0%) | 0 (0.0%) |
| 26 to 34 Years | 116 (100.0%) | 0 (0.0%) |
| 35 to 44 Years | 217 (100.0%) | 0 (0.0%) |
| 45 to 54 Years | 52 (100.0%) | 0 (0.0%) |
| 55 to 64 Years | 45 (48.4%) | 48 (51.6%) |
| 65 to 74 Years | 0 (0.0%) | 0 (0.0%) |
| 75 Years and older | 0 (0.0%) | 0 (0.0%) |
| Total | 1,313 (96.5%) | 48 (3.5%) |
Health Insurance Coverage by Citizenship Status in Hanscom AFB
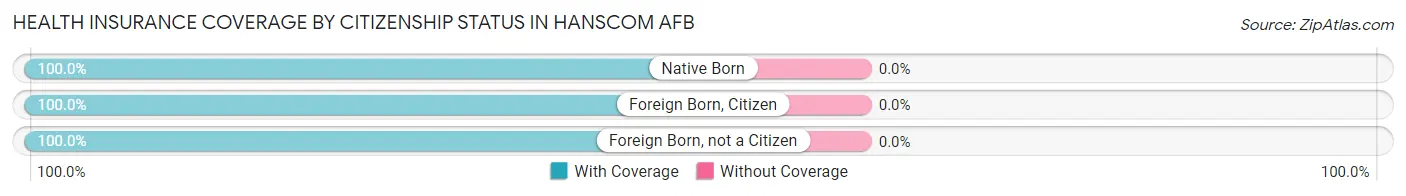
| Citizenship Status | With Coverage | Without Coverage |
| Native Born | 342 (100.0%) | 0 (0.0%) |
| Foreign Born, Citizen | 443 (100.0%) | 0 (0.0%) |
| Foreign Born, not a Citizen | 98 (100.0%) | 0 (0.0%) |
Health Insurance Coverage by Household Income in Hanscom AFB
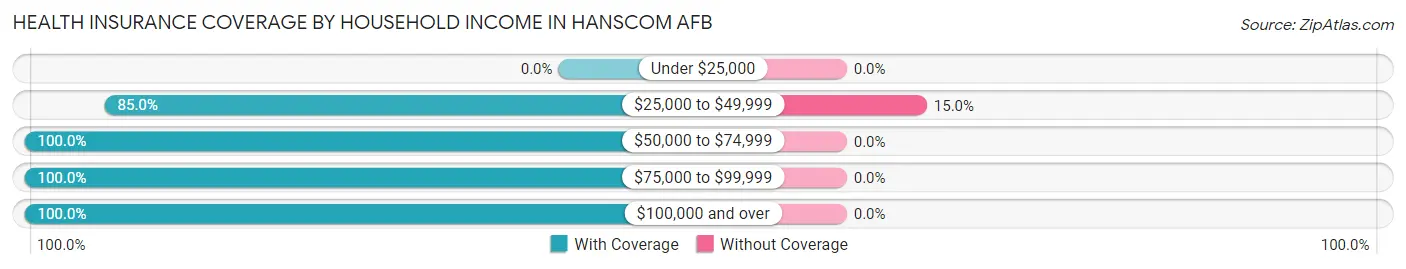
| Household Income | With Coverage | Without Coverage |
| Under $25,000 | 0 (0.0%) | 0 (0.0%) |
| $25,000 to $49,999 | 272 (85.0%) | 48 (15.0%) |
| $50,000 to $74,999 | 223 (100.0%) | 0 (0.0%) |
| $75,000 to $99,999 | 60 (100.0%) | 0 (0.0%) |
| $100,000 and over | 758 (100.0%) | 0 (0.0%) |
Public vs Private Health Insurance Coverage by Age in Hanscom AFB
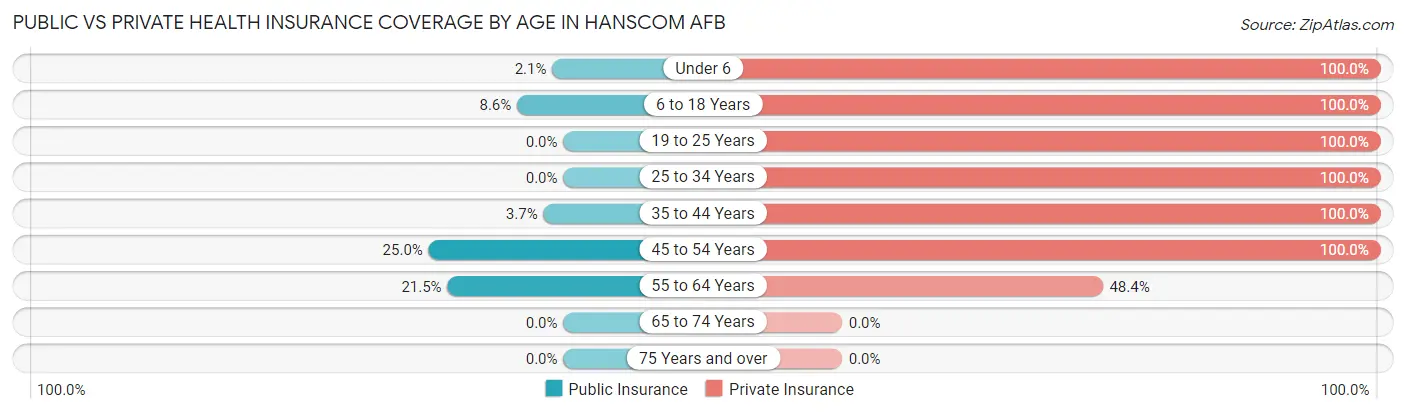
| Age Bracket | Public Insurance | Private Insurance |
| Under 6 | 7 (2.1%) | 342 (100.0%) |
| 6 to 18 Years | 38 (8.6%) | 443 (100.0%) |
| 19 to 25 Years | 0 (0.0%) | 98 (100.0%) |
| 25 to 34 Years | 0 (0.0%) | 116 (100.0%) |
| 35 to 44 Years | 8 (3.7%) | 217 (100.0%) |
| 45 to 54 Years | 13 (25.0%) | 52 (100.0%) |
| 55 to 64 Years | 20 (21.5%) | 45 (48.4%) |
| 65 to 74 Years | 0 (0.0%) | 0 (0.0%) |
| 75 Years and over | 0 (0.0%) | 0 (0.0%) |
| Total | 86 (6.3%) | 1,313 (96.5%) |
Disability Status by Sex by Age in Hanscom AFB
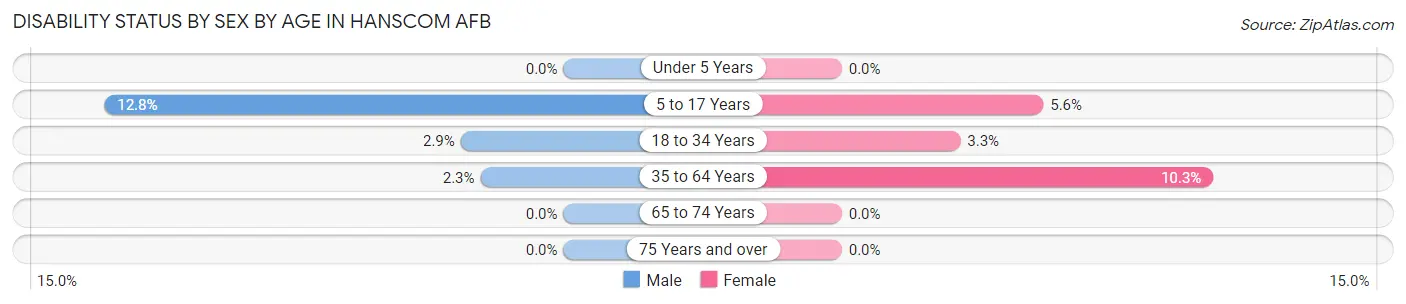
| Age Bracket | Male | Female |
| Under 5 Years | 0 (0.0%) | 0 (0.0%) |
| 5 to 17 Years | 45 (12.8%) | 6 (5.6%) |
| 18 to 34 Years | 1 (2.9%) | 6 (3.3%) |
| 35 to 64 Years | 3 (2.3%) | 24 (10.3%) |
| 65 to 74 Years | 0 (0.0%) | 0 (0.0%) |
| 75 Years and over | 0 (0.0%) | 0 (0.0%) |
Disability Class by Sex by Age in Hanscom AFB
Disability Class: Hearing Difficulty
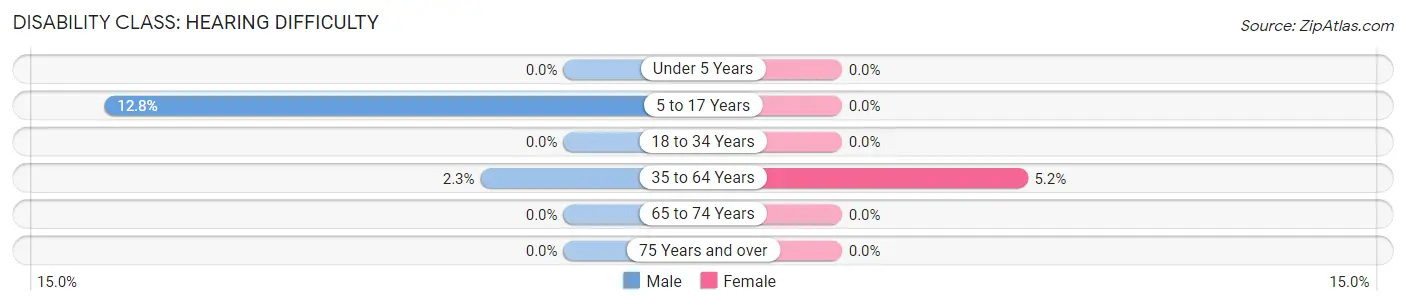
| Age Bracket | Male | Female |
| Under 5 Years | 0 (0.0%) | 0 (0.0%) |
| 5 to 17 Years | 45 (12.8%) | 0 (0.0%) |
| 18 to 34 Years | 0 (0.0%) | 0 (0.0%) |
| 35 to 64 Years | 3 (2.3%) | 12 (5.2%) |
| 65 to 74 Years | 0 (0.0%) | 0 (0.0%) |
| 75 Years and over | 0 (0.0%) | 0 (0.0%) |
Disability Class: Vision Difficulty
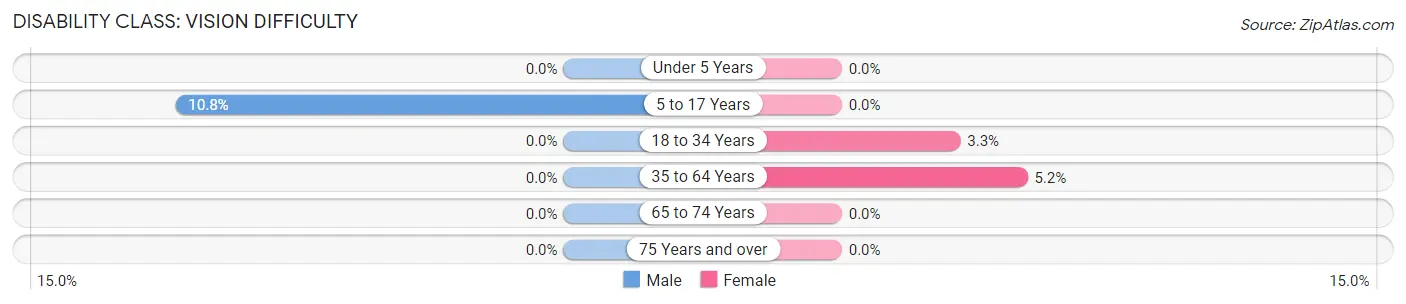
| Age Bracket | Male | Female |
| Under 5 Years | 0 (0.0%) | 0 (0.0%) |
| 5 to 17 Years | 38 (10.8%) | 0 (0.0%) |
| 18 to 34 Years | 0 (0.0%) | 6 (3.3%) |
| 35 to 64 Years | 0 (0.0%) | 12 (5.2%) |
| 65 to 74 Years | 0 (0.0%) | 0 (0.0%) |
| 75 Years and over | 0 (0.0%) | 0 (0.0%) |
Disability Class: Cognitive Difficulty
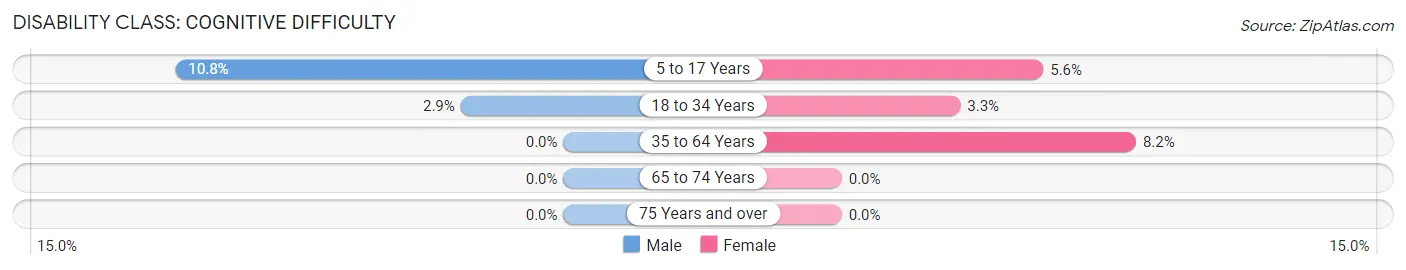
| Age Bracket | Male | Female |
| 5 to 17 Years | 38 (10.8%) | 6 (5.6%) |
| 18 to 34 Years | 1 (2.9%) | 6 (3.3%) |
| 35 to 64 Years | 0 (0.0%) | 19 (8.2%) |
| 65 to 74 Years | 0 (0.0%) | 0 (0.0%) |
| 75 Years and over | 0 (0.0%) | 0 (0.0%) |
Disability Class: Ambulatory Difficulty

| Age Bracket | Male | Female |
| 5 to 17 Years | 38 (10.8%) | 0 (0.0%) |
| 18 to 34 Years | 0 (0.0%) | 0 (0.0%) |
| 35 to 64 Years | 0 (0.0%) | 17 (7.3%) |
| 65 to 74 Years | 0 (0.0%) | 0 (0.0%) |
| 75 Years and over | 0 (0.0%) | 0 (0.0%) |
Disability Class: Self-Care Difficulty
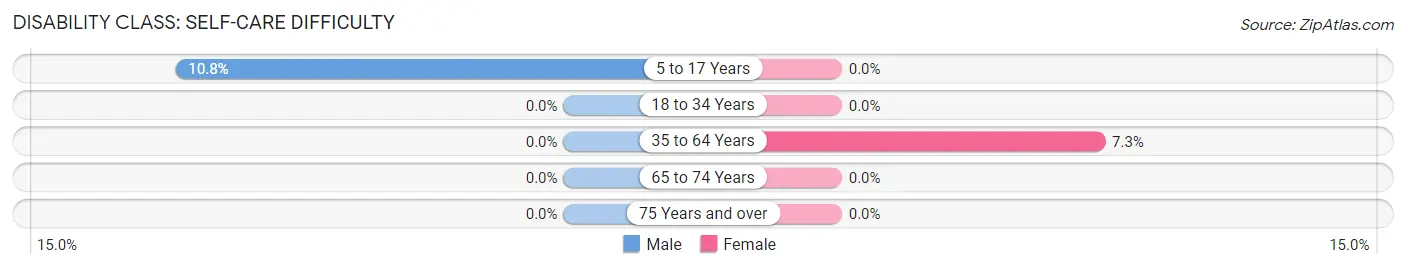
| Age Bracket | Male | Female |
| 5 to 17 Years | 38 (10.8%) | 0 (0.0%) |
| 18 to 34 Years | 0 (0.0%) | 0 (0.0%) |
| 35 to 64 Years | 0 (0.0%) | 17 (7.3%) |
| 65 to 74 Years | 0 (0.0%) | 0 (0.0%) |
| 75 Years and over | 0 (0.0%) | 0 (0.0%) |
Technology Access in Hanscom AFB
Computing Device Access in Hanscom AFB
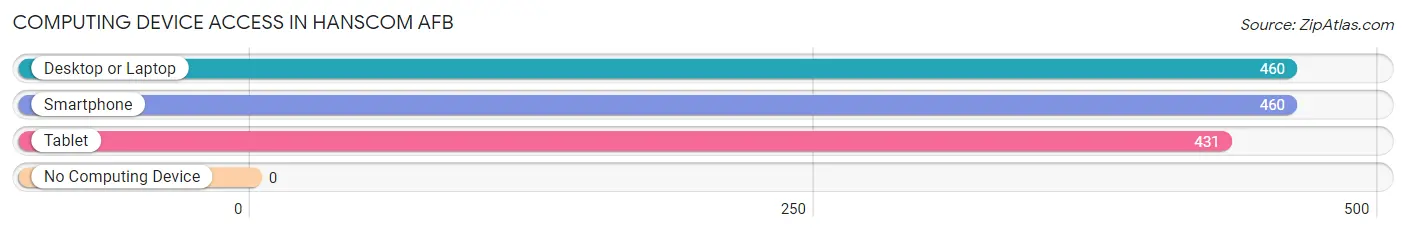
| Device Type | # Households | % Households |
| Desktop or Laptop | 460 | 100.0% |
| Smartphone | 460 | 100.0% |
| Tablet | 431 | 93.7% |
| No Computing Device | 0 | 0.0% |
| Total | 460 | 100.0% |
Internet Access in Hanscom AFB
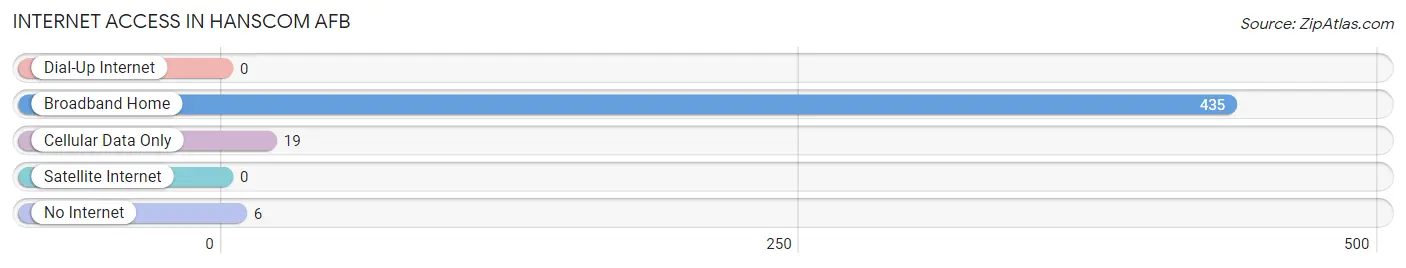
| Internet Type | # Households | % Households |
| Dial-Up Internet | 0 | 0.0% |
| Broadband Home | 435 | 94.6% |
| Cellular Data Only | 19 | 4.1% |
| Satellite Internet | 0 | 0.0% |
| No Internet | 6 | 1.3% |
| Total | 460 | 100.0% |
Hanscom AFB Summary
Hanscom Air Force Base (AFB) is located in Bedford, Massachusetts, approximately 20 miles northwest of Boston. It is a major installation of the United States Air Force and is home to the 66th Air Base Group, the 66th Medical Group, the 66th Security Forces Squadron, and the 66th Communications Squadron. Hanscom AFB is also home to the Electronic Systems Center, which is responsible for the development, acquisition, and sustainment of electronic systems for the Air Force.
Hanscom AFB was originally established in 1941 as the Bedford Army Air Field. It was renamed Hanscom Field in 1951 in honor of Laurence G. Hanscom, a Massachusetts native and aviation pioneer who was killed in a plane crash in 1941. The base was transferred to the Air Force in 1966 and has since become a major hub for research, development, and acquisition of electronic systems for the Air Force.
Geography
Hanscom AFB is located in the town of Bedford, Massachusetts, approximately 20 miles northwest of Boston. The base is situated on 1,400 acres of land and is bordered by the towns of Lexington, Concord, Lincoln, and Bedford. The base is located in a suburban area and is surrounded by residential neighborhoods, businesses, and recreational areas.
The base is located in a temperate climate with four distinct seasons. Summers are typically warm and humid, while winters are cold and snowy. The average annual temperature is around 50°F (10°C).
Economy
Hanscom AFB is a major economic driver for the region. The base is home to the Electronic Systems Center, which is responsible for the development, acquisition, and sustainment of electronic systems for the Air Force. The base also houses the 66th Air Base Group, the 66th Medical Group, the 66th Security Forces Squadron, and the 66th Communications Squadron.
The base is home to over 5,000 military personnel and civilian employees, and has an annual economic impact of over $1 billion. The base also supports over 10,000 jobs in the local community.
Demographics
As of the 2010 census, the population of Hanscom AFB was 5,837. The racial makeup of the base was 79.3% White, 8.2% African American, 5.2% Asian, 4.2% Hispanic or Latino, and 3.1% other.
The median household income was $77,837, and the median family income was $90,945. The per capita income was $37,845.
Conclusion
Hanscom AFB is a major installation of the United States Air Force located in Bedford, Massachusetts. The base is home to the Electronic Systems Center, the 66th Air Base Group, the 66th Medical Group, the 66th Security Forces Squadron, and the 66th Communications Squadron. The base has an annual economic impact of over $1 billion and supports over 10,000 jobs in the local community. The population of Hanscom AFB is 5,837, and the median household income is $77,837. Hanscom AFB is a major economic driver for the region and is an important part of the local community.
Common Questions
What is Per Capita Income in Hanscom AFB?
Per Capita income in Hanscom AFB is $28,925.
What is the Median Family Income in Hanscom AFB?
Median Family Income in Hanscom AFB is $78,281.
What is the Median Household income in Hanscom AFB?
Median Household Income in Hanscom AFB is $71,250.
What is Income or Wage Gap in Hanscom AFB?
Income or Wage Gap in Hanscom AFB is 47.7%.
Women in Hanscom AFB earn 52.3 cents for every dollar earned by a man.
What is Inequality or Gini Index in Hanscom AFB?
Inequality or Gini Index in Hanscom AFB is 0.37.
What is the Total Population of Hanscom AFB?
Total Population of Hanscom AFB is 1,784.
What is the Total Male Population of Hanscom AFB?
Total Male Population of Hanscom AFB is 1,059.
What is the Total Female Population of Hanscom AFB?
Total Female Population of Hanscom AFB is 725.
What is the Ratio of Males per 100 Females in Hanscom AFB?
There are 146.07 Males per 100 Females in Hanscom AFB.
What is the Ratio of Females per 100 Males in Hanscom AFB?
There are 68.46 Females per 100 Males in Hanscom AFB.
What is the Median Population Age in Hanscom AFB?
Median Population Age in Hanscom AFB is 25.5 Years.
What is the Average Family Size in Hanscom AFB
Average Family Size in Hanscom AFB is 3.8 People.
What is the Average Household Size in Hanscom AFB
Average Household Size in Hanscom AFB is 3.8 People.
How Large is the Labor Force in Hanscom AFB?
There are 710 People in the Labor Forcein in Hanscom AFB.
What is the Percentage of People in the Labor Force in Hanscom AFB?
70.0% of People are in the Labor Force in Hanscom AFB.
What is the Unemployment Rate in Hanscom AFB?
Unemployment Rate in Hanscom AFB is 1.0%.