North Seekonk, MA Map & Demographics
North Seekonk Map
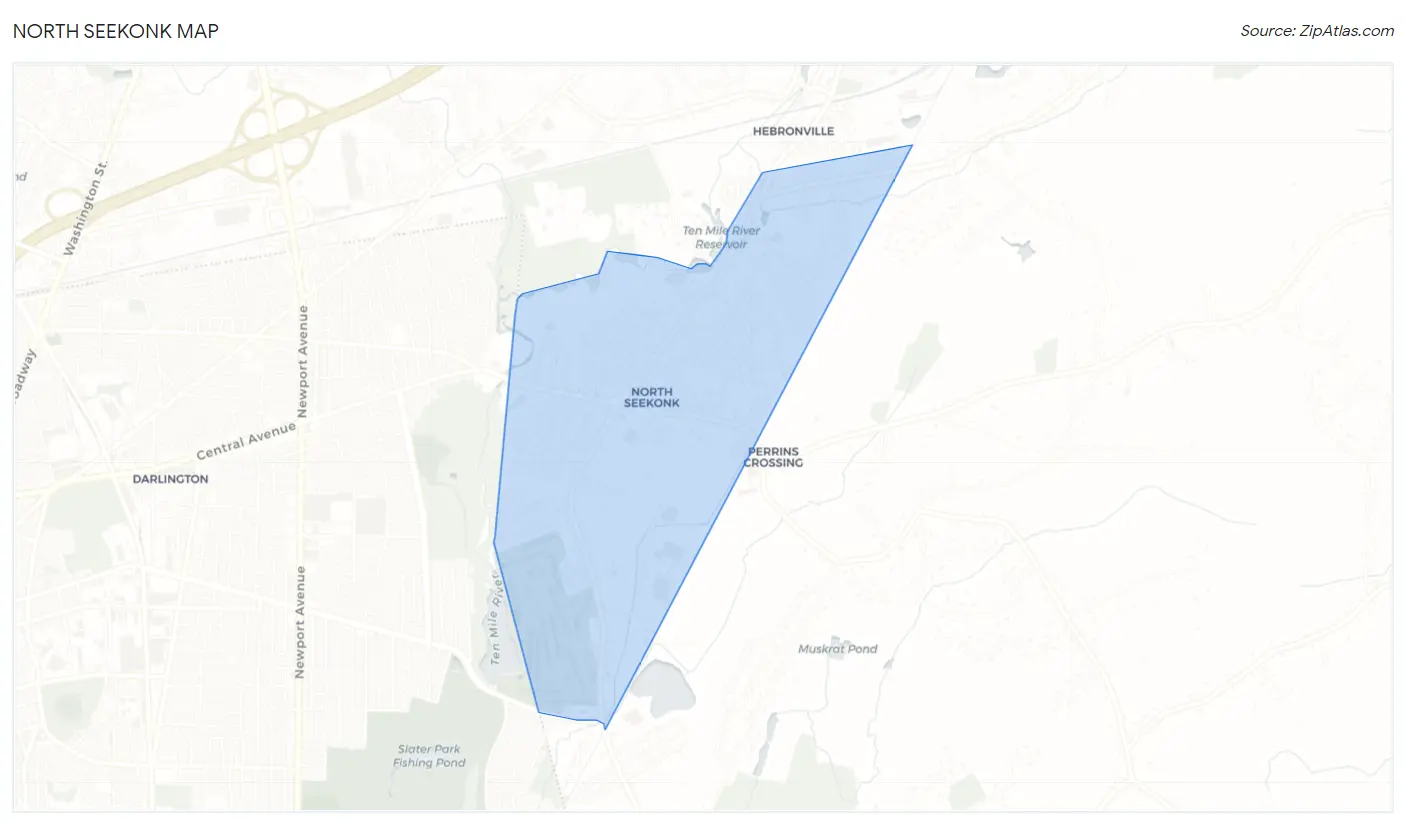
North Seekonk Overview
$44,469
PER CAPITA INCOME
$130,625
AVG FAMILY INCOME
$105,459
AVG HOUSEHOLD INCOME
26.0%
WAGE / INCOME GAP [ % ]
74.0¢/ $1
WAGE / INCOME GAP [ $ ]
0.32
INEQUALITY / GINI INDEX
2,726
TOTAL POPULATION
1,294
MALE POPULATION
1,432
FEMALE POPULATION
90.36
MALES / 100 FEMALES
110.66
FEMALES / 100 MALES
43.8
MEDIAN AGE
2.8
AVG FAMILY SIZE
2.5
AVG HOUSEHOLD SIZE
1,547
LABOR FORCE [ PEOPLE ]
68.6%
PERCENT IN LABOR FORCE
6.4%
UNEMPLOYMENT RATE
Income in North Seekonk
Income Overview in North Seekonk
Per Capita Income in North Seekonk is $44,469, while median incomes of families and households are $130,625 and $105,459 respectively.
| Characteristic | Number | Measure |
| Per Capita Income | 2,726 | $44,469 |
| Median Family Income | 786 | $130,625 |
| Mean Family Income | 786 | $123,121 |
| Median Household Income | 1,086 | $105,459 |
| Mean Household Income | 1,086 | $112,329 |
| Income Deficit | 786 | $0 |
| Wage / Income Gap (%) | 2,726 | 26.04% |
| Wage / Income Gap ($) | 2,726 | 73.96¢ per $1 |
| Gini / Inequality Index | 2,726 | 0.32 |
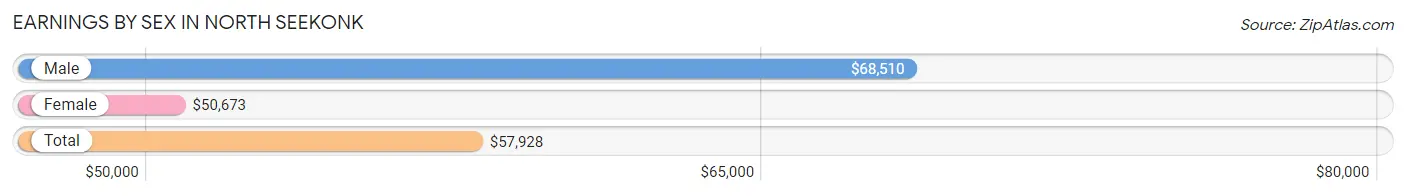
Earnings by Sex in North Seekonk
Average Earnings in North Seekonk are $57,928, $68,510 for men and $50,673 for women, a difference of 26.0%.
| Sex | Number | Average Earnings |
| Male | 783 (51.1%) | $68,510 |
| Female | 748 (48.9%) | $50,673 |
| Total | 1,531 (100.0%) | $57,928 |
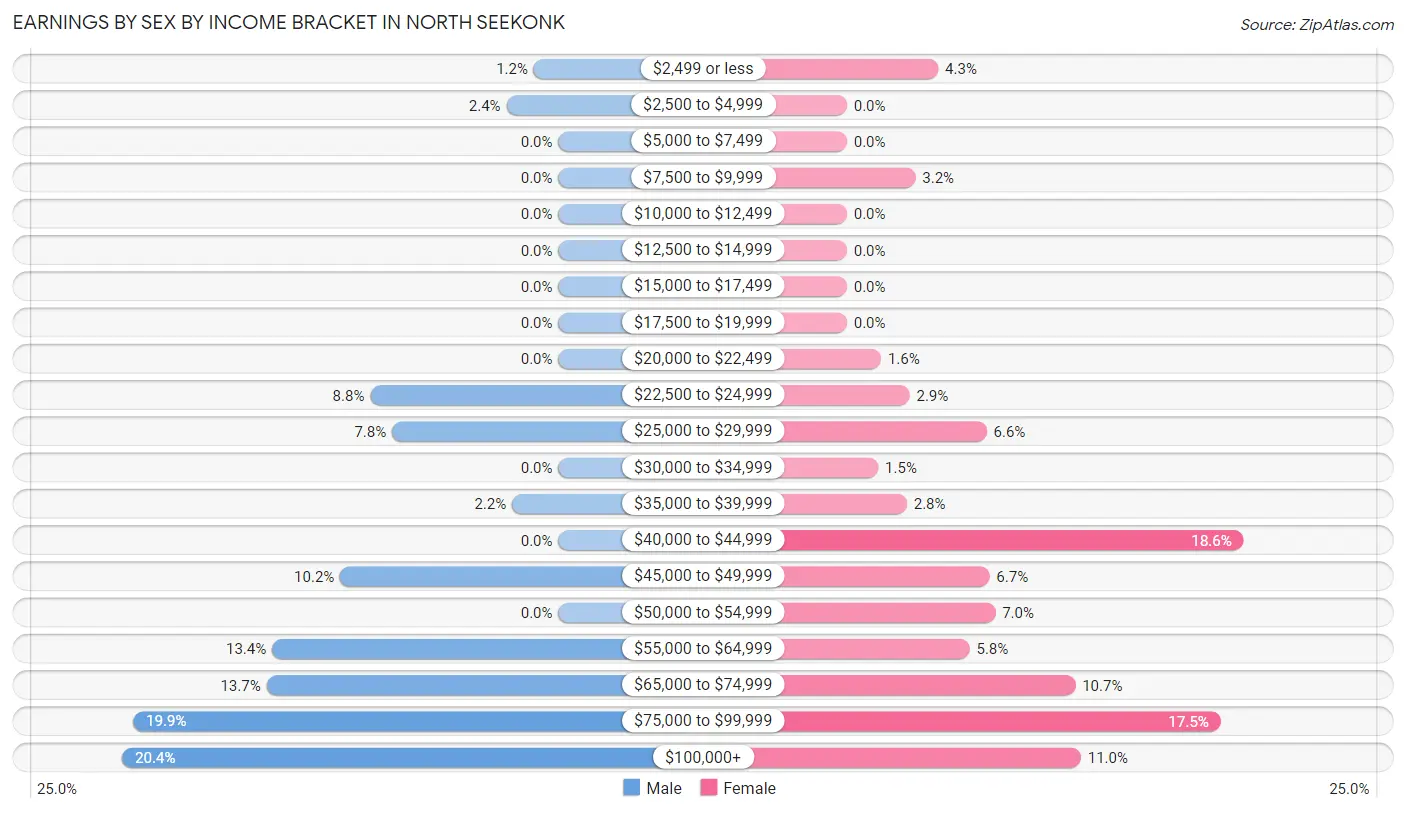
Earnings by Sex by Income Bracket in North Seekonk
The most common earnings brackets in North Seekonk are $100,000+ for men (160 | 20.4%) and $40,000 to $44,999 for women (139 | 18.6%).
| Income | Male | Female |
| $2,499 or less | 9 (1.1%) | 32 (4.3%) |
| $2,500 to $4,999 | 19 (2.4%) | 0 (0.0%) |
| $5,000 to $7,499 | 0 (0.0%) | 0 (0.0%) |
| $7,500 to $9,999 | 0 (0.0%) | 24 (3.2%) |
| $10,000 to $12,499 | 0 (0.0%) | 0 (0.0%) |
| $12,500 to $14,999 | 0 (0.0%) | 0 (0.0%) |
| $15,000 to $17,499 | 0 (0.0%) | 0 (0.0%) |
| $17,500 to $19,999 | 0 (0.0%) | 0 (0.0%) |
| $20,000 to $22,499 | 0 (0.0%) | 12 (1.6%) |
| $22,500 to $24,999 | 69 (8.8%) | 22 (2.9%) |
| $25,000 to $29,999 | 61 (7.8%) | 49 (6.6%) |
| $30,000 to $34,999 | 0 (0.0%) | 11 (1.5%) |
| $35,000 to $39,999 | 17 (2.2%) | 21 (2.8%) |
| $40,000 to $44,999 | 0 (0.0%) | 139 (18.6%) |
| $45,000 to $49,999 | 80 (10.2%) | 50 (6.7%) |
| $50,000 to $54,999 | 0 (0.0%) | 52 (7.0%) |
| $55,000 to $64,999 | 105 (13.4%) | 43 (5.8%) |
| $65,000 to $74,999 | 107 (13.7%) | 80 (10.7%) |
| $75,000 to $99,999 | 156 (19.9%) | 131 (17.5%) |
| $100,000+ | 160 (20.4%) | 82 (11.0%) |
| Total | 783 (100.0%) | 748 (100.0%) |
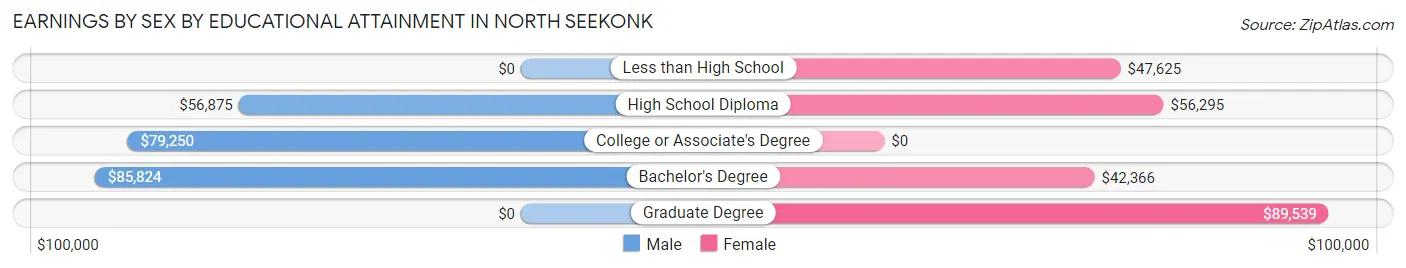
Earnings by Sex by Educational Attainment in North Seekonk
Average earnings in North Seekonk are $69,054 for men and $50,889 for women, a difference of 26.3%. Men with an educational attainment of bachelor's degree enjoy the highest average annual earnings of $85,824, while those with high school diploma education earn the least with $56,875. Women with an educational attainment of graduate degree earn the most with the average annual earnings of $89,539, while those with bachelor's degree education have the smallest earnings of $42,366.
| Educational Attainment | Male Income | Female Income |
| Less than High School | - | - |
| High School Diploma | $56,875 | $56,295 |
| College or Associate's Degree | $79,250 | $0 |
| Bachelor's Degree | $85,824 | $42,366 |
| Graduate Degree | - | - |
| Total | $69,054 | $50,889 |
Family Income in North Seekonk
Family Income Brackets in North Seekonk
According to the North Seekonk family income data, there are 253 families falling into the $100,000 to $149,999 income range, which is the most common income bracket and makes up 32.2% of all families.
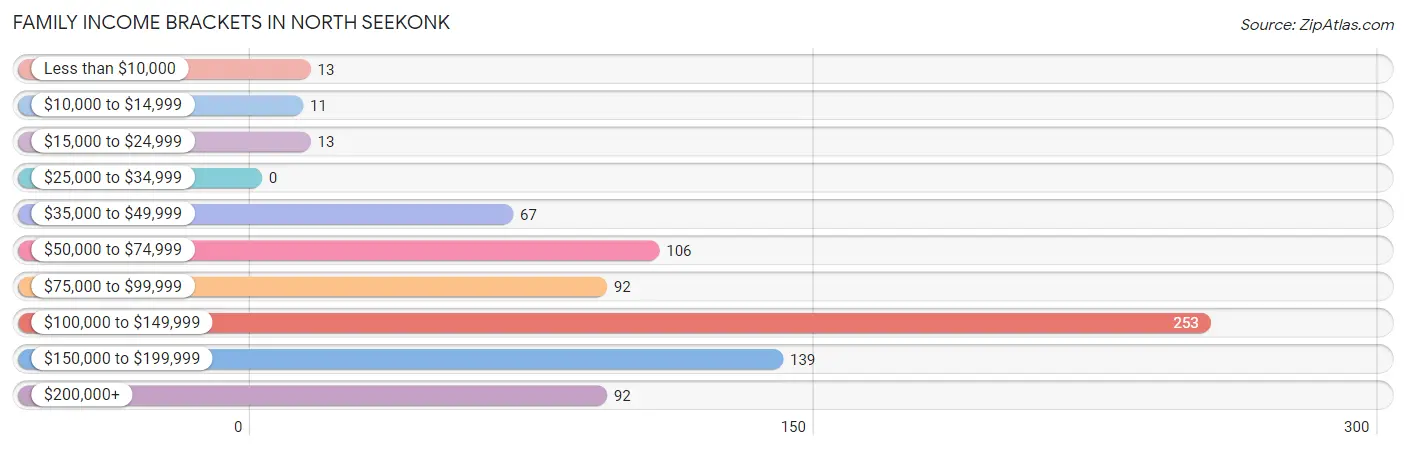
| Income Bracket | # Families | % Families |
| Less than $10,000 | 13 | 1.7% |
| $10,000 to $14,999 | 11 | 1.4% |
| $15,000 to $24,999 | 13 | 1.7% |
| $25,000 to $34,999 | 0 | 0.0% |
| $35,000 to $49,999 | 67 | 8.5% |
| $50,000 to $74,999 | 106 | 13.5% |
| $75,000 to $99,999 | 92 | 11.7% |
| $100,000 to $149,999 | 253 | 32.2% |
| $150,000 to $199,999 | 139 | 17.7% |
| $200,000+ | 92 | 11.7% |
Family Income by Famaliy Size in North Seekonk
4-person families (231 | 29.4%) account for the highest median family income in North Seekonk with $133,969 per family, while 2-person families (423 | 53.8%) have the highest median income of $64,208 per family member.
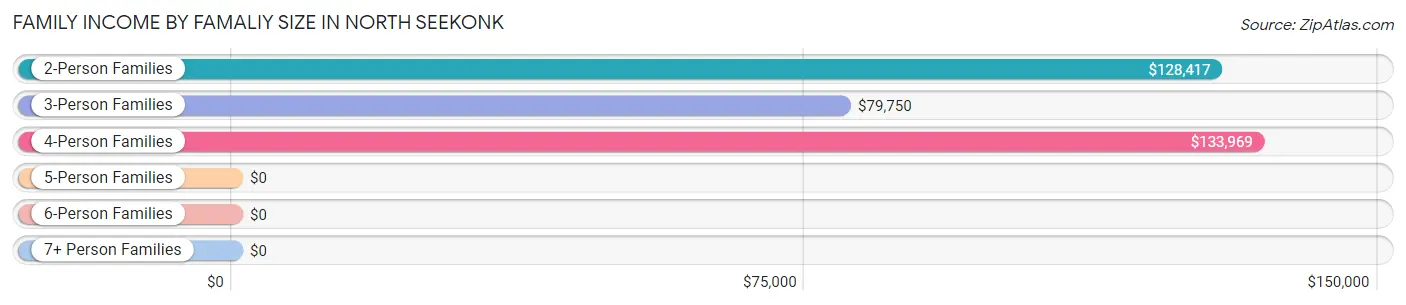
| Income Bracket | # Families | Median Income |
| 2-Person Families | 423 (53.8%) | $128,417 |
| 3-Person Families | 132 (16.8%) | $79,750 |
| 4-Person Families | 231 (29.4%) | $133,969 |
| 5-Person Families | 0 (0.0%) | $0 |
| 6-Person Families | 0 (0.0%) | $0 |
| 7+ Person Families | 0 (0.0%) | $0 |
| Total | 786 (100.0%) | $130,625 |
Family Income by Number of Earners in North Seekonk
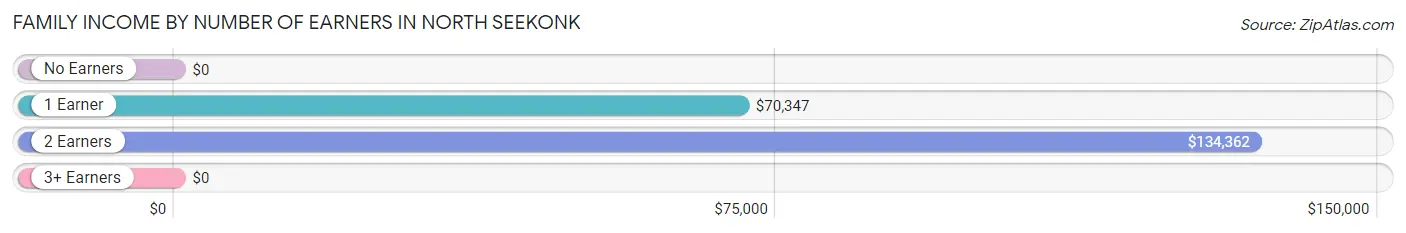
| Number of Earners | # Families | Median Income |
| No Earners | 75 (9.5%) | $0 |
| 1 Earner | 199 (25.3%) | $70,347 |
| 2 Earners | 475 (60.4%) | $134,362 |
| 3+ Earners | 37 (4.7%) | $0 |
| Total | 786 (100.0%) | $130,625 |
Household Income in North Seekonk
Household Income Brackets in North Seekonk
With 323 households falling in the category, the $100,000 to $149,999 income range is the most frequent in North Seekonk, accounting for 29.7% of all households. In contrast, only 11 households (1.0%) fall into the $10,000 to $14,999 income bracket, making it the least populous group.
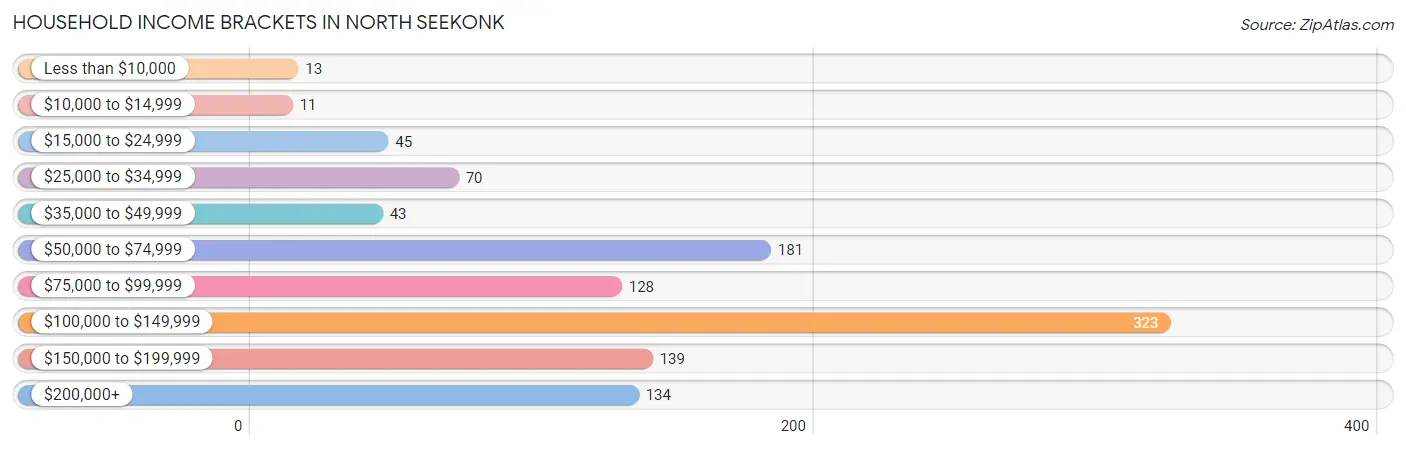
| Income Bracket | # Households | % Households |
| Less than $10,000 | 13 | 1.2% |
| $10,000 to $14,999 | 11 | 1.0% |
| $15,000 to $24,999 | 45 | 4.1% |
| $25,000 to $34,999 | 70 | 6.4% |
| $35,000 to $49,999 | 43 | 4.0% |
| $50,000 to $74,999 | 181 | 16.7% |
| $75,000 to $99,999 | 128 | 11.8% |
| $100,000 to $149,999 | 323 | 29.7% |
| $150,000 to $199,999 | 139 | 12.8% |
| $200,000+ | 134 | 12.3% |
Household Income by Householder Age in North Seekonk
The median household income in North Seekonk is $105,459, with the highest median household income of $133,031 found in the 45 to 64 years age bracket for the primary householder. A total of 535 households (49.3%) fall into this category.
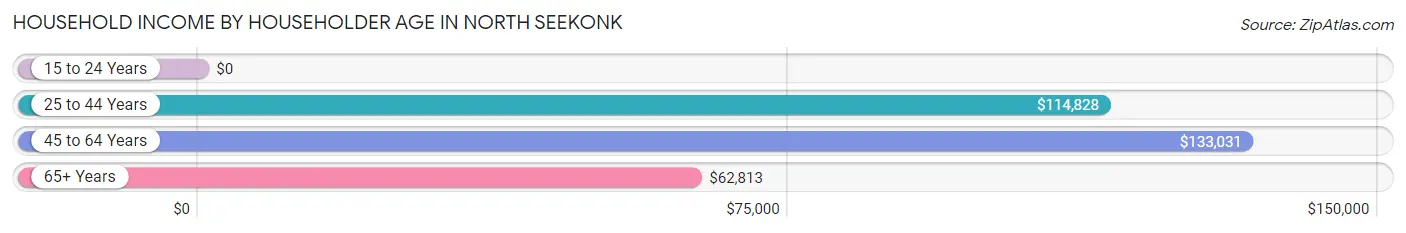
| Income Bracket | # Households | Median Income |
| 15 to 24 Years | 0 (0.0%) | $0 |
| 25 to 44 Years | 306 (28.2%) | $114,828 |
| 45 to 64 Years | 535 (49.3%) | $133,031 |
| 65+ Years | 245 (22.6%) | $62,813 |
| Total | 1,086 (100.0%) | $105,459 |
Poverty in North Seekonk
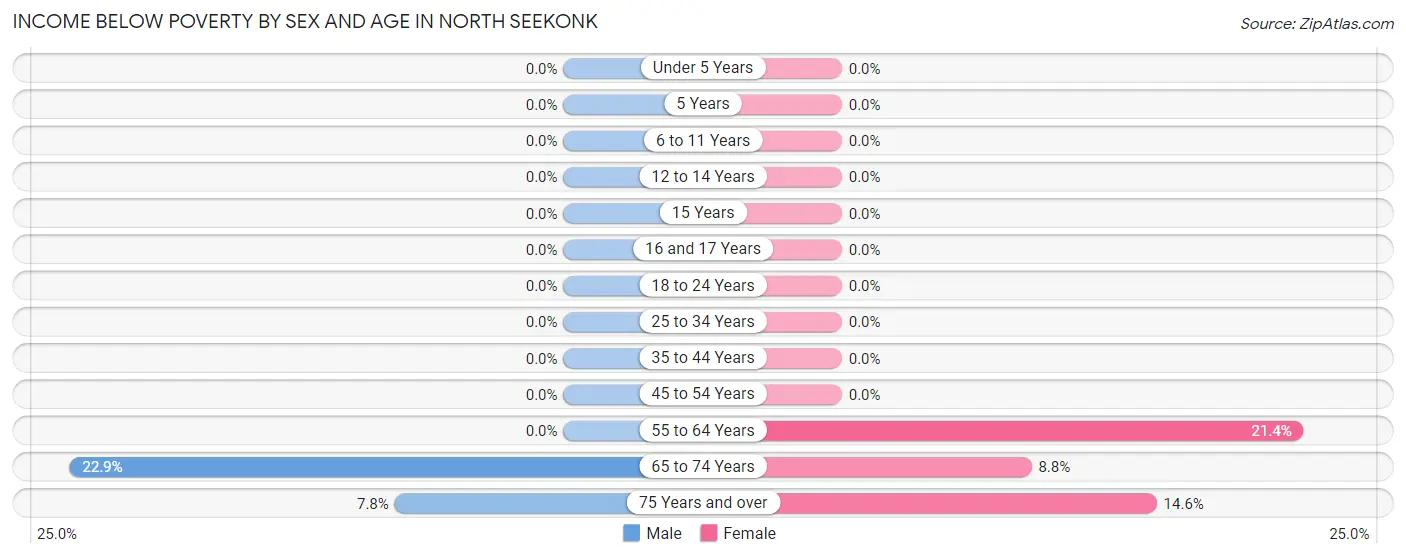
Income Below Poverty by Sex and Age in North Seekonk
With 1.8% poverty level for males and 6.1% for females among the residents of North Seekonk, 65 to 74 year old males and 55 to 64 year old females are the most vulnerable to poverty, with 11 males (22.9%) and 63 females (21.4%) in their respective age groups living below the poverty level.
| Age Bracket | Male | Female |
| Under 5 Years | 0 (0.0%) | 0 (0.0%) |
| 5 Years | 0 (0.0%) | 0 (0.0%) |
| 6 to 11 Years | 0 (0.0%) | 0 (0.0%) |
| 12 to 14 Years | 0 (0.0%) | 0 (0.0%) |
| 15 Years | 0 (0.0%) | 0 (0.0%) |
| 16 and 17 Years | 0 (0.0%) | 0 (0.0%) |
| 18 to 24 Years | 0 (0.0%) | 0 (0.0%) |
| 25 to 34 Years | 0 (0.0%) | 0 (0.0%) |
| 35 to 44 Years | 0 (0.0%) | 0 (0.0%) |
| 45 to 54 Years | 0 (0.0%) | 0 (0.0%) |
| 55 to 64 Years | 0 (0.0%) | 63 (21.4%) |
| 65 to 74 Years | 11 (22.9%) | 11 (8.8%) |
| 75 Years and over | 13 (7.8%) | 13 (14.6%) |
| Total | 24 (1.8%) | 87 (6.1%) |
Income Above Poverty by Sex and Age in North Seekonk
According to the poverty statistics in North Seekonk, males aged 5 years and females aged under 5 years are the age groups that are most secure financially, with 100.0% of males and 100.0% of females in these age groups living above the poverty line.
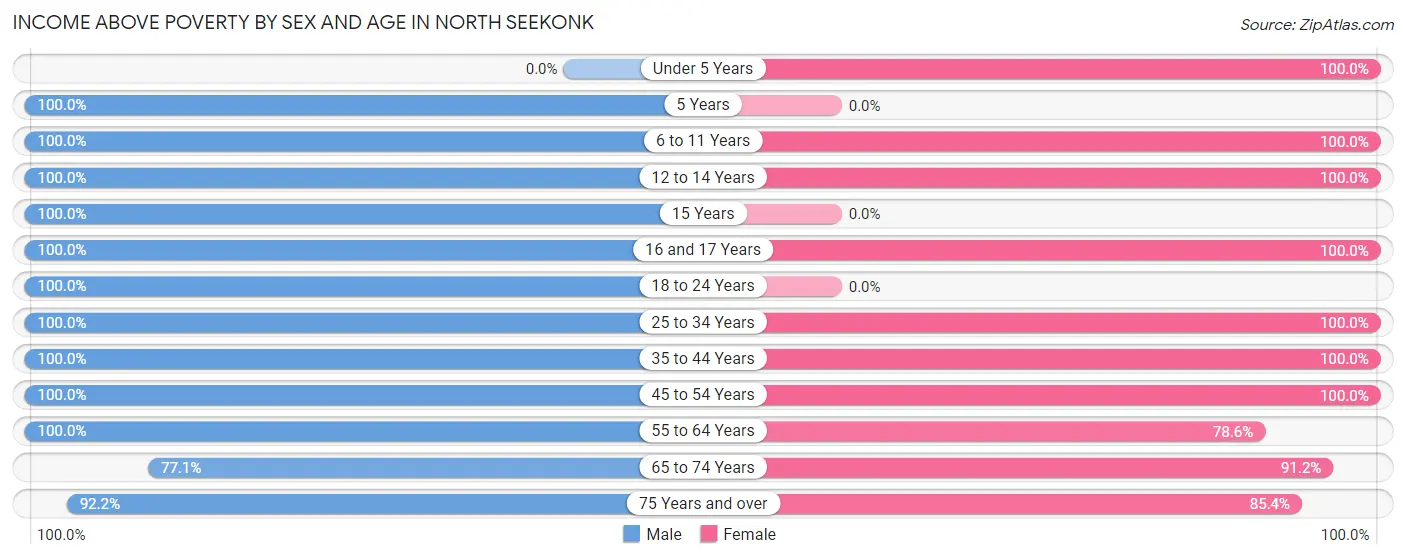
| Age Bracket | Male | Female |
| Under 5 Years | 0 (0.0%) | 80 (100.0%) |
| 5 Years | 26 (100.0%) | 0 (0.0%) |
| 6 to 11 Years | 138 (100.0%) | 87 (100.0%) |
| 12 to 14 Years | 52 (100.0%) | 59 (100.0%) |
| 15 Years | 29 (100.0%) | 0 (0.0%) |
| 16 and 17 Years | 16 (100.0%) | 69 (100.0%) |
| 18 to 24 Years | 34 (100.0%) | 0 (0.0%) |
| 25 to 34 Years | 191 (100.0%) | 385 (100.0%) |
| 35 to 44 Years | 147 (100.0%) | 77 (100.0%) |
| 45 to 54 Years | 126 (100.0%) | 167 (100.0%) |
| 55 to 64 Years | 321 (100.0%) | 231 (78.6%) |
| 65 to 74 Years | 37 (77.1%) | 114 (91.2%) |
| 75 Years and over | 153 (92.2%) | 76 (85.4%) |
| Total | 1,270 (98.2%) | 1,345 (93.9%) |
Income Below Poverty Among Married-Couple Families in North Seekonk
The poverty statistics for married-couple families in North Seekonk show that 4.2% or 24 of the total 576 families live below the poverty line. Families with no children have the highest poverty rate of 6.3%, comprising of 24 families. On the other hand, families with 1 or 2 children have the lowest poverty rate of 0.0%, which includes 0 families.
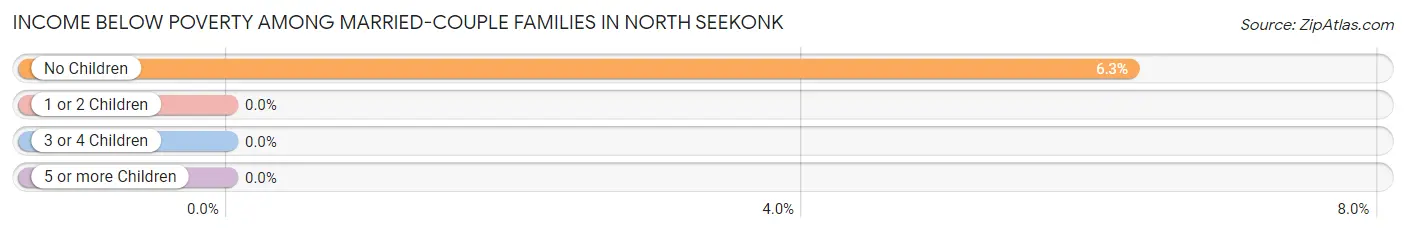
| Children | Above Poverty | Below Poverty |
| No Children | 358 (93.7%) | 24 (6.3%) |
| 1 or 2 Children | 194 (100.0%) | 0 (0.0%) |
| 3 or 4 Children | 0 (0.0%) | 0 (0.0%) |
| 5 or more Children | 0 (0.0%) | 0 (0.0%) |
| Total | 552 (95.8%) | 24 (4.2%) |
Income Below Poverty Among Single-Parent Households in North Seekonk
| Children | Single Father | Single Mother |
| No Children | 0 (0.0%) | 0 (0.0%) |
| 1 or 2 Children | 0 (0.0%) | 0 (0.0%) |
| 3 or 4 Children | 0 (0.0%) | 0 (0.0%) |
| 5 or more Children | 0 (0.0%) | 0 (0.0%) |
| Total | 0 (0.0%) | 0 (0.0%) |
Income Below Poverty Among Married-Couple vs Single-Parent Households in North Seekonk
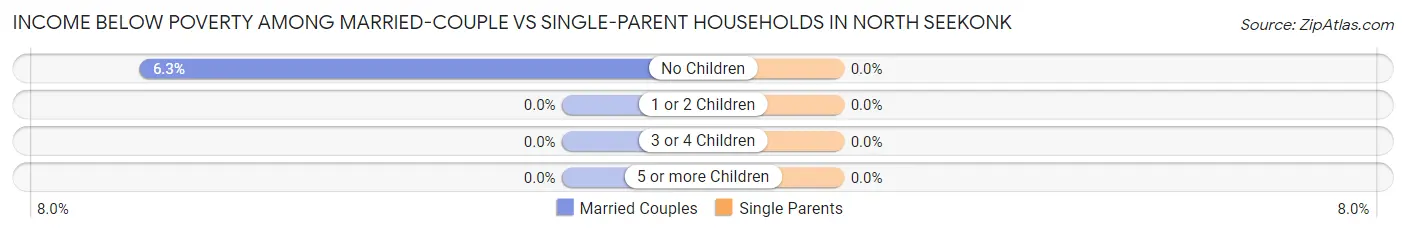
| Children | Married-Couple Families | Single-Parent Households |
| No Children | 24 (6.3%) | 0 (0.0%) |
| 1 or 2 Children | 0 (0.0%) | 0 (0.0%) |
| 3 or 4 Children | 0 (0.0%) | 0 (0.0%) |
| 5 or more Children | 0 (0.0%) | 0 (0.0%) |
| Total | 24 (4.2%) | 0 (0.0%) |
Race in North Seekonk
The most populous races in North Seekonk are White / Caucasian (2,127 | 78.0%), Hispanic or Latino (368 | 13.5%), and Black / African American (249 | 9.1%).
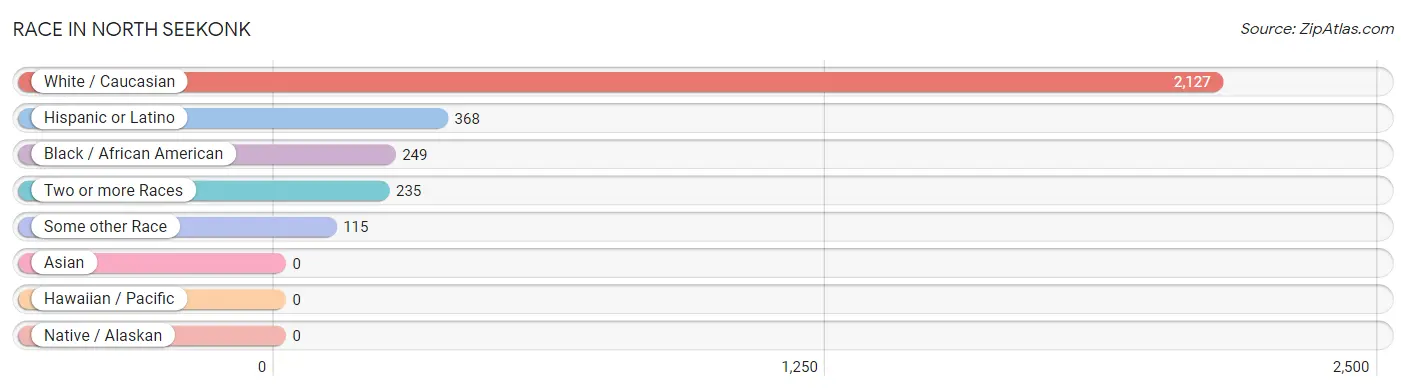
| Race | # Population | % Population |
| Asian | 0 | 0.0% |
| Black / African American | 249 | 9.1% |
| Hawaiian / Pacific | 0 | 0.0% |
| Hispanic or Latino | 368 | 13.5% |
| Native / Alaskan | 0 | 0.0% |
| White / Caucasian | 2,127 | 78.0% |
| Two or more Races | 235 | 8.6% |
| Some other Race | 115 | 4.2% |
| Total | 2,726 | 100.0% |
Ancestry in North Seekonk
The most populous ancestries reported in North Seekonk are Irish (538 | 19.7%), French Canadian (396 | 14.5%), Portuguese (393 | 14.4%), French (351 | 12.9%), and English (328 | 12.0%), together accounting for 73.6% of all North Seekonk residents.
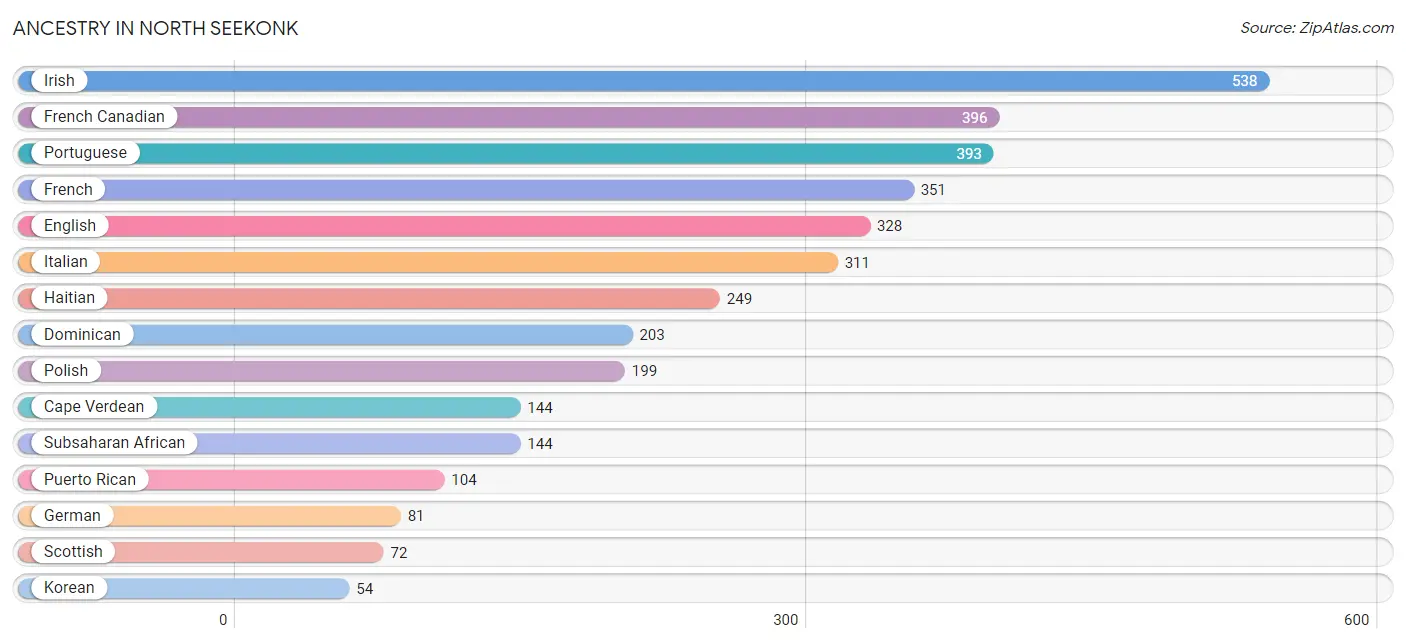
| Ancestry | # Population | % Population |
| Cape Verdean | 144 | 5.3% |
| Cuban | 10 | 0.4% |
| Dominican | 203 | 7.4% |
| Ecuadorian | 18 | 0.7% |
| English | 328 | 12.0% |
| European | 27 | 1.0% |
| French | 351 | 12.9% |
| French Canadian | 396 | 14.5% |
| German | 81 | 3.0% |
| Greek | 15 | 0.5% |
| Haitian | 249 | 9.1% |
| Irish | 538 | 19.7% |
| Italian | 311 | 11.4% |
| Korean | 54 | 2.0% |
| Mexican | 13 | 0.5% |
| Polish | 199 | 7.3% |
| Portuguese | 393 | 14.4% |
| Puerto Rican | 104 | 3.8% |
| Scotch-Irish | 12 | 0.4% |
| Scottish | 72 | 2.6% |
| South American | 18 | 0.7% |
| Spaniard | 20 | 0.7% |
| Subsaharan African | 144 | 5.3% |
| Swedish | 43 | 1.6% |
| Welsh | 11 | 0.4% | View All 25 Rows |
Immigrants in North Seekonk
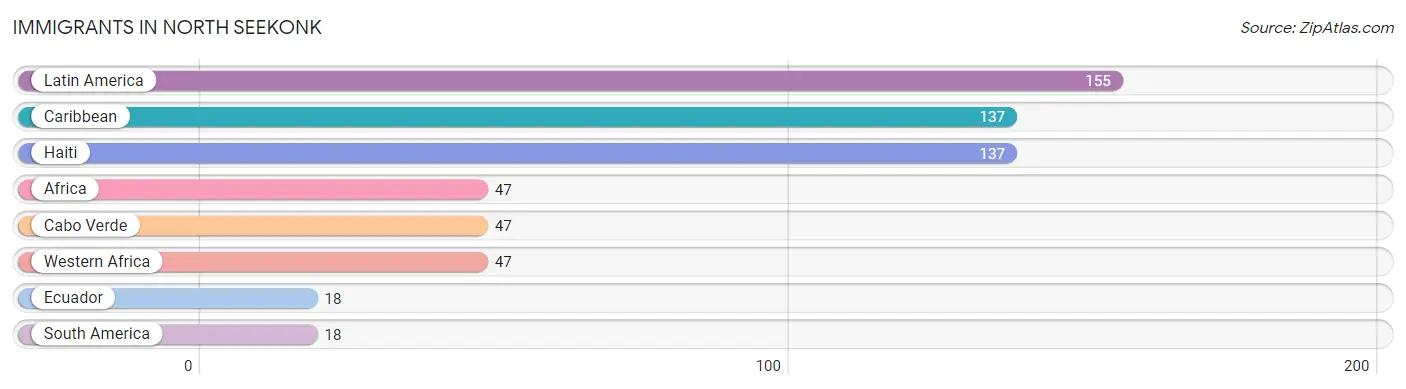
The most numerous immigrant groups reported in North Seekonk came from Latin America (155 | 5.7%), Caribbean (137 | 5.0%), Haiti (137 | 5.0%), Africa (47 | 1.7%), and Cabo Verde (47 | 1.7%), together accounting for 19.2% of all North Seekonk residents.
| Immigration Origin | # Population | % Population |
| Africa | 47 | 1.7% |
| Cabo Verde | 47 | 1.7% |
| Caribbean | 137 | 5.0% |
| Ecuador | 18 | 0.7% |
| Haiti | 137 | 5.0% |
| Latin America | 155 | 5.7% |
| South America | 18 | 0.7% |
| Western Africa | 47 | 1.7% | View All 8 Rows |
Sex and Age in North Seekonk
Sex and Age in North Seekonk
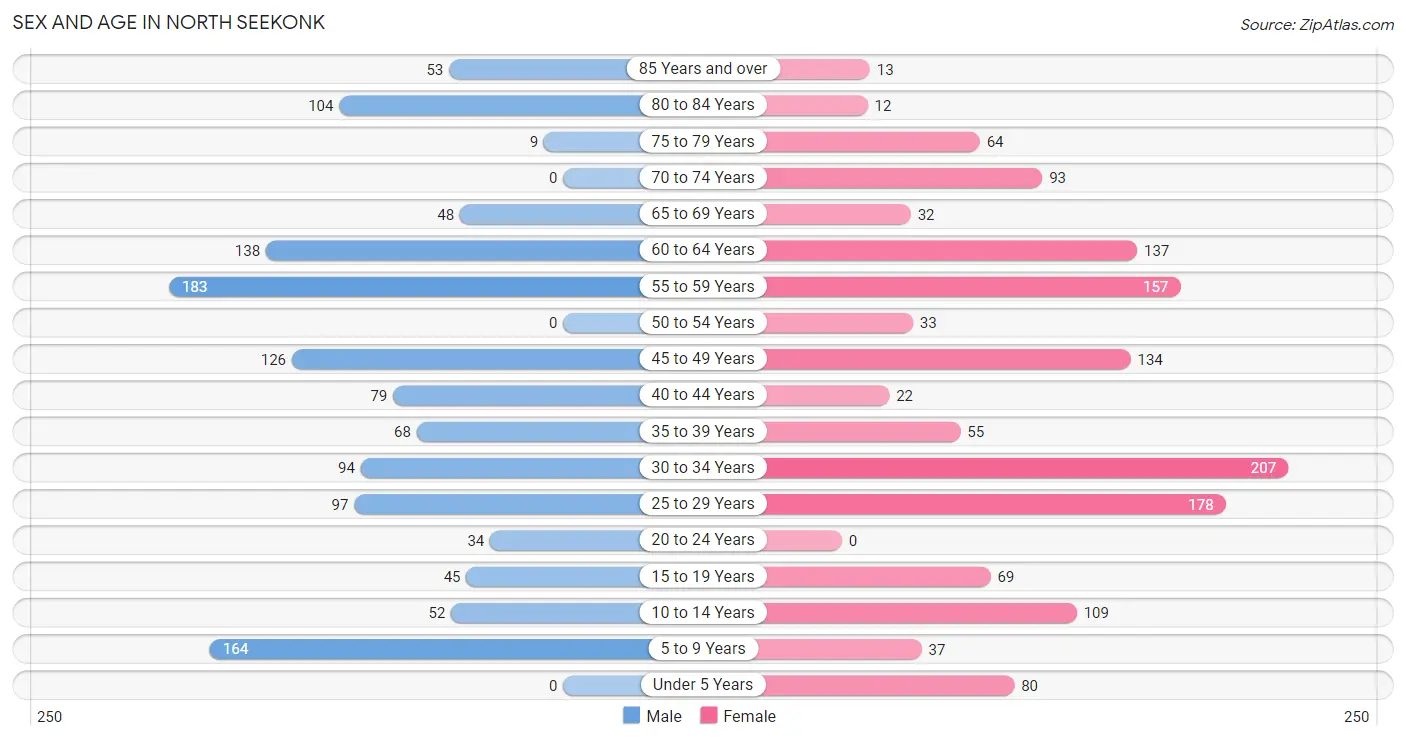
The most populous age groups in North Seekonk are 55 to 59 Years (183 | 14.1%) for men and 30 to 34 Years (207 | 14.5%) for women.
| Age Bracket | Male | Female |
| Under 5 Years | 0 (0.0%) | 80 (5.6%) |
| 5 to 9 Years | 164 (12.7%) | 37 (2.6%) |
| 10 to 14 Years | 52 (4.0%) | 109 (7.6%) |
| 15 to 19 Years | 45 (3.5%) | 69 (4.8%) |
| 20 to 24 Years | 34 (2.6%) | 0 (0.0%) |
| 25 to 29 Years | 97 (7.5%) | 178 (12.4%) |
| 30 to 34 Years | 94 (7.3%) | 207 (14.5%) |
| 35 to 39 Years | 68 (5.3%) | 55 (3.8%) |
| 40 to 44 Years | 79 (6.1%) | 22 (1.5%) |
| 45 to 49 Years | 126 (9.7%) | 134 (9.4%) |
| 50 to 54 Years | 0 (0.0%) | 33 (2.3%) |
| 55 to 59 Years | 183 (14.1%) | 157 (11.0%) |
| 60 to 64 Years | 138 (10.7%) | 137 (9.6%) |
| 65 to 69 Years | 48 (3.7%) | 32 (2.2%) |
| 70 to 74 Years | 0 (0.0%) | 93 (6.5%) |
| 75 to 79 Years | 9 (0.7%) | 64 (4.5%) |
| 80 to 84 Years | 104 (8.0%) | 12 (0.8%) |
| 85 Years and over | 53 (4.1%) | 13 (0.9%) |
| Total | 1,294 (100.0%) | 1,432 (100.0%) |
Families and Households in North Seekonk
Median Family Size in North Seekonk
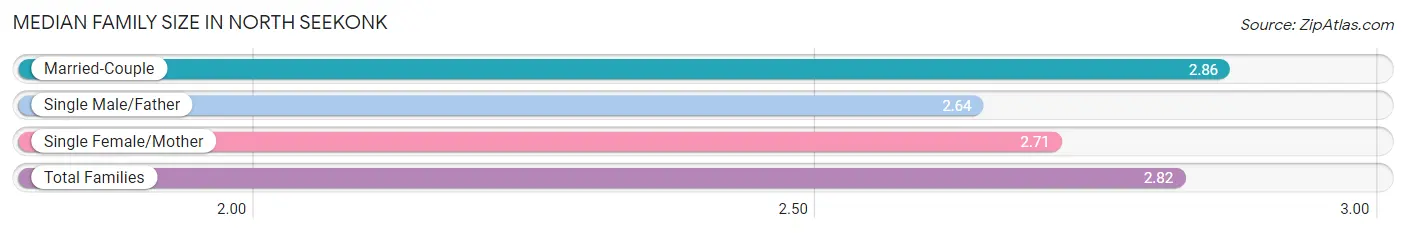
The median family size in North Seekonk is 2.82 persons per family, with married-couple families (576 | 73.3%) accounting for the largest median family size of 2.86 persons per family. On the other hand, single male/father families (53 | 6.7%) represent the smallest median family size with 2.64 persons per family.
| Family Type | # Families | Family Size |
| Married-Couple | 576 (73.3%) | 2.86 |
| Single Male/Father | 53 (6.7%) | 2.64 |
| Single Female/Mother | 157 (20.0%) | 2.71 |
| Total Families | 786 (100.0%) | 2.82 |
Median Household Size in North Seekonk
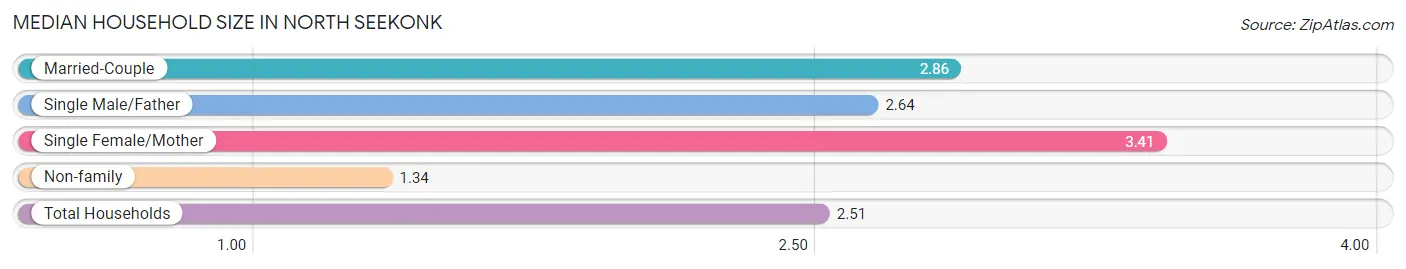
The median household size in North Seekonk is 2.51 persons per household, with single female/mother households (157 | 14.5%) accounting for the largest median household size of 3.41 persons per household. non-family households (300 | 27.6%) represent the smallest median household size with 1.34 persons per household.
| Household Type | # Households | Household Size |
| Married-Couple | 576 (53.0%) | 2.86 |
| Single Male/Father | 53 (4.9%) | 2.64 |
| Single Female/Mother | 157 (14.5%) | 3.41 |
| Non-family | 300 (27.6%) | 1.34 |
| Total Households | 1,086 (100.0%) | 2.51 |
Household Size by Marriage Status in North Seekonk
Out of a total of 1,086 households in North Seekonk, 786 (72.4%) are family households, while 300 (27.6%) are nonfamily households. The most numerous type of family households are 2-person households, comprising 358, and the most common type of nonfamily households are 1-person households, comprising 189.
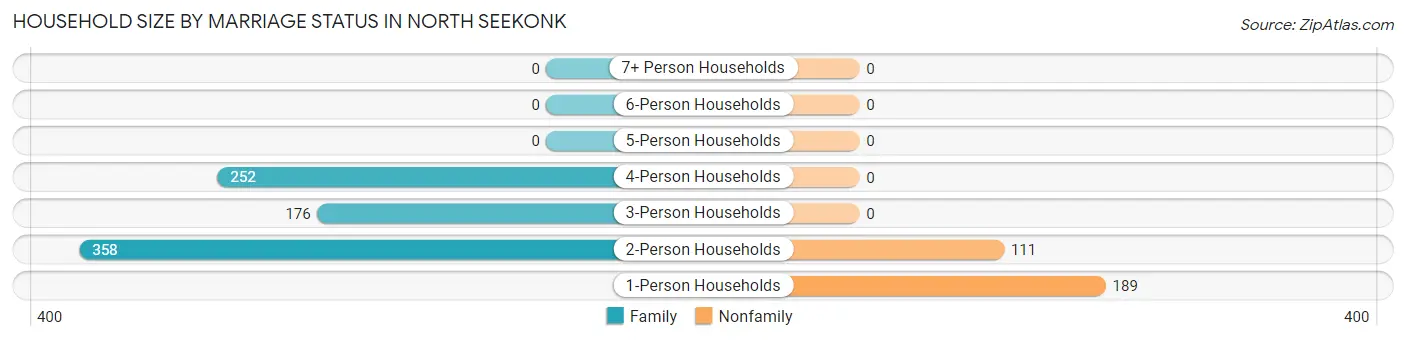
| Household Size | Family Households | Nonfamily Households |
| 1-Person Households | - | 189 (17.4%) |
| 2-Person Households | 358 (33.0%) | 111 (10.2%) |
| 3-Person Households | 176 (16.2%) | 0 (0.0%) |
| 4-Person Households | 252 (23.2%) | 0 (0.0%) |
| 5-Person Households | 0 (0.0%) | 0 (0.0%) |
| 6-Person Households | 0 (0.0%) | 0 (0.0%) |
| 7+ Person Households | 0 (0.0%) | 0 (0.0%) |
| Total | 786 (72.4%) | 300 (27.6%) |
Female Fertility in North Seekonk
Fertility by Age in North Seekonk
Average fertility rate in North Seekonk is 102.0 births per 1,000 women. Women in the age bracket of 20 to 34 years have the highest fertility rate with 127.0 births per 1,000 women. Women in the age bracket of 20 to 34 years acount for 70.0% of all women with births.
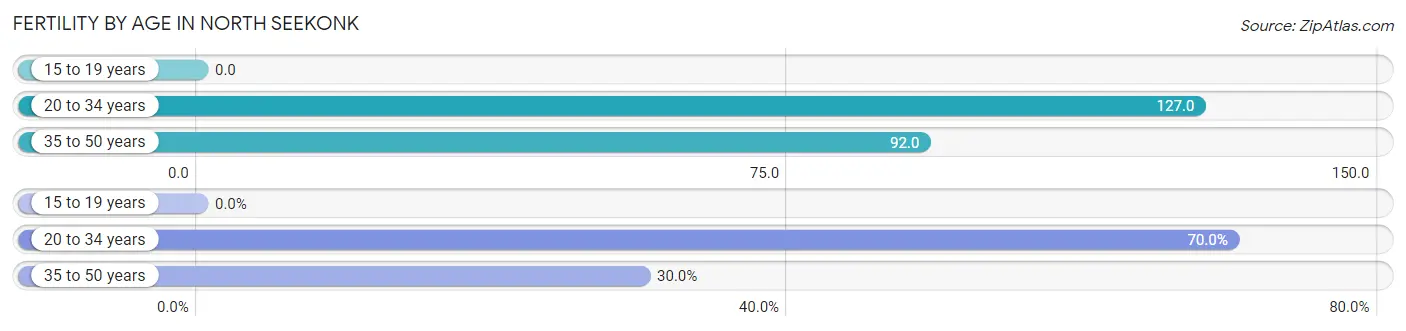
| Age Bracket | Women with Births | Births / 1,000 Women |
| 15 to 19 years | 0 (0.0%) | 0.0 |
| 20 to 34 years | 49 (70.0%) | 127.0 |
| 35 to 50 years | 21 (30.0%) | 92.0 |
| Total | 70 (100.0%) | 102.0 |
Fertility by Age by Marriage Status in North Seekonk
30.0% of women with births (70) in North Seekonk are married. The highest percentage of unmarried women with births falls into 20 to 34 years age bracket with 100.0% of them unmarried at the time of birth, while the lowest percentage of unmarried women with births belong to 35 to 50 years age bracket with 0.0% of them unmarried.
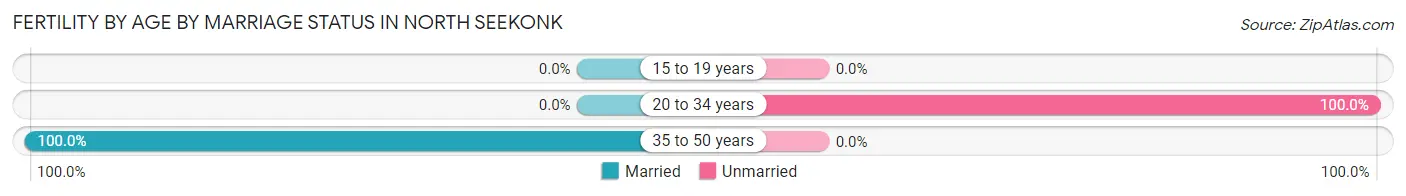
| Age Bracket | Married | Unmarried |
| 15 to 19 years | 0 (0.0%) | 0 (0.0%) |
| 20 to 34 years | 0 (0.0%) | 49 (100.0%) |
| 35 to 50 years | 21 (100.0%) | 0 (0.0%) |
| Total | 21 (30.0%) | 49 (70.0%) |
Fertility by Education in North Seekonk
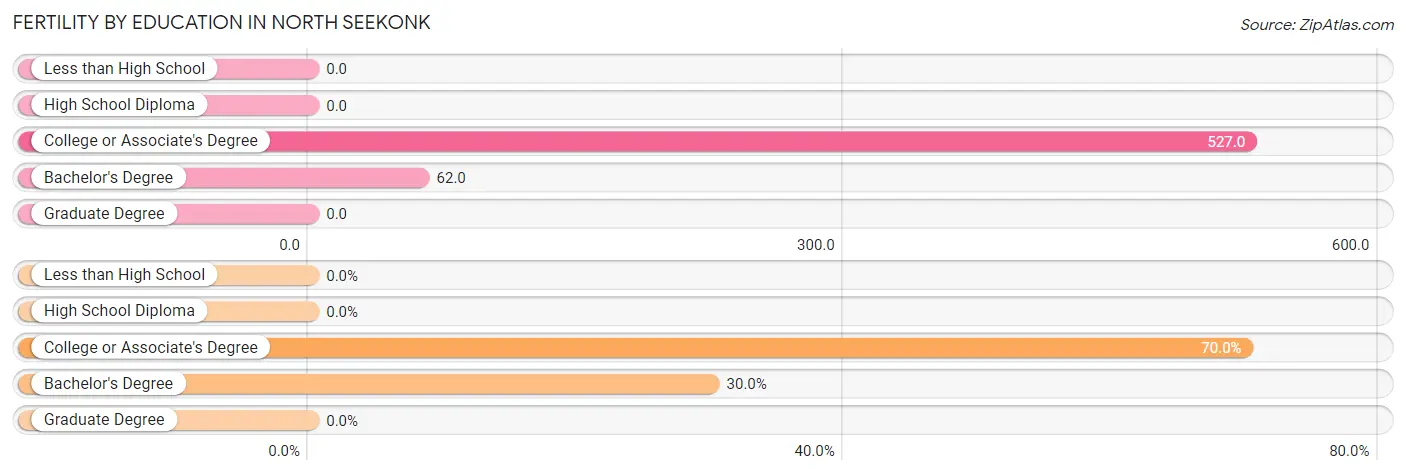
| Educational Attainment | Women with Births | Births / 1,000 Women |
| Less than High School | 0 (0.0%) | 0.0 |
| High School Diploma | 0 (0.0%) | 0.0 |
| College or Associate's Degree | 49 (70.0%) | 527.0 |
| Bachelor's Degree | 21 (30.0%) | 62.0 |
| Graduate Degree | 0 (0.0%) | 0.0 |
| Total | 70 (100.0%) | 102.0 |
Fertility by Education by Marriage Status in North Seekonk
70.0% of women with births in North Seekonk are unmarried. Women with the educational attainment of bachelor's degree are most likely to be married with 100.0% of them married at childbirth, while women with the educational attainment of college or associate's degree are least likely to be married with 100.0% of them unmarried at childbirth.
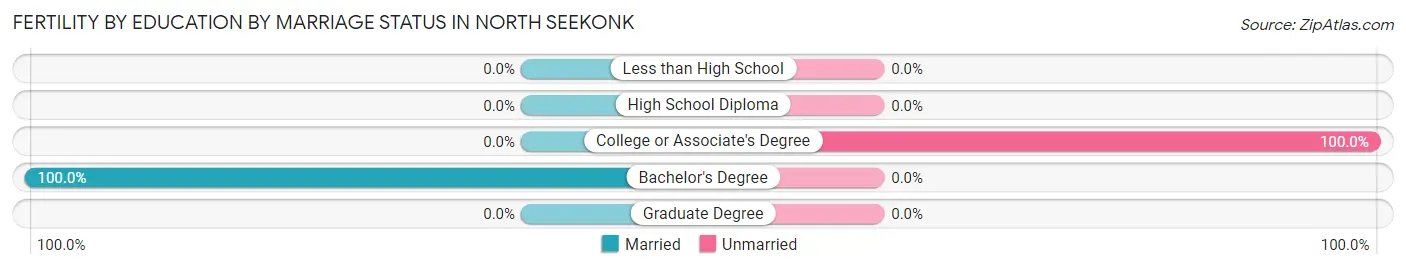
| Educational Attainment | Married | Unmarried |
| Less than High School | 0 (0.0%) | 0 (0.0%) |
| High School Diploma | 0 (0.0%) | 0 (0.0%) |
| College or Associate's Degree | 0 (0.0%) | 49 (100.0%) |
| Bachelor's Degree | 21 (100.0%) | 0 (0.0%) |
| Graduate Degree | 0 (0.0%) | 0 (0.0%) |
| Total | 21 (30.0%) | 49 (70.0%) |
Employment Characteristics in North Seekonk
Employment by Class of Employer in North Seekonk
Among the 1,422 employed individuals in North Seekonk, private company employees (1,061 | 74.6%), state government employees (88 | 6.2%), and not-for-profit organizations (77 | 5.4%) make up the most common classes of employment.
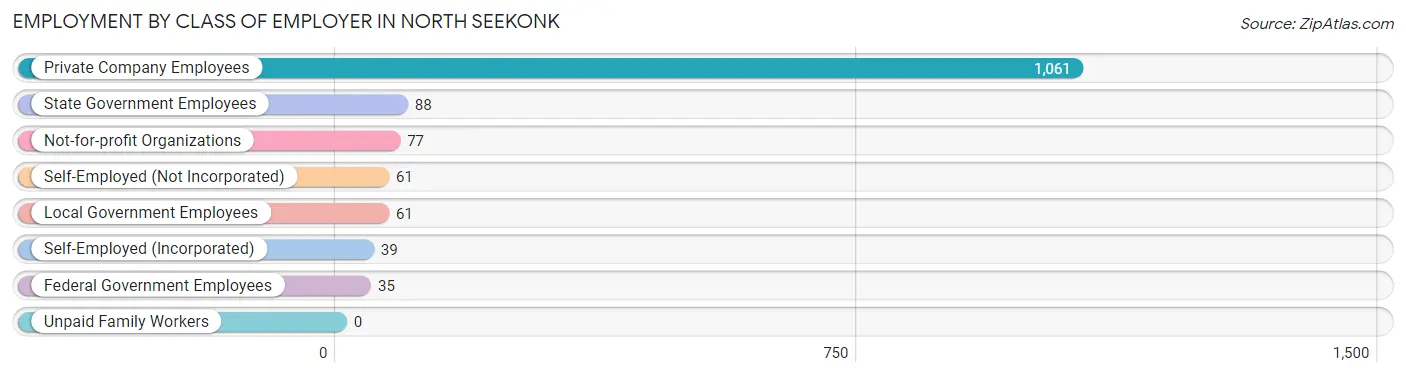
| Employer Class | # Employees | % Employees |
| Private Company Employees | 1,061 | 74.6% |
| Self-Employed (Incorporated) | 39 | 2.7% |
| Self-Employed (Not Incorporated) | 61 | 4.3% |
| Not-for-profit Organizations | 77 | 5.4% |
| Local Government Employees | 61 | 4.3% |
| State Government Employees | 88 | 6.2% |
| Federal Government Employees | 35 | 2.5% |
| Unpaid Family Workers | 0 | 0.0% |
| Total | 1,422 | 100.0% |
Employment Status by Age in North Seekonk
According to the labor force statistics for North Seekonk, out of the total population over 16 years of age (2,255), 68.6% or 1,547 individuals are in the labor force, with 6.4% or 99 of them unemployed. The age group with the highest labor force participation rate is 20 to 24 years, with 100.0% or 34 individuals in the labor force. Within the labor force, the 16 to 19 years age range has the highest percentage of unemployed individuals, with 100.0% or 61 of them being unemployed.
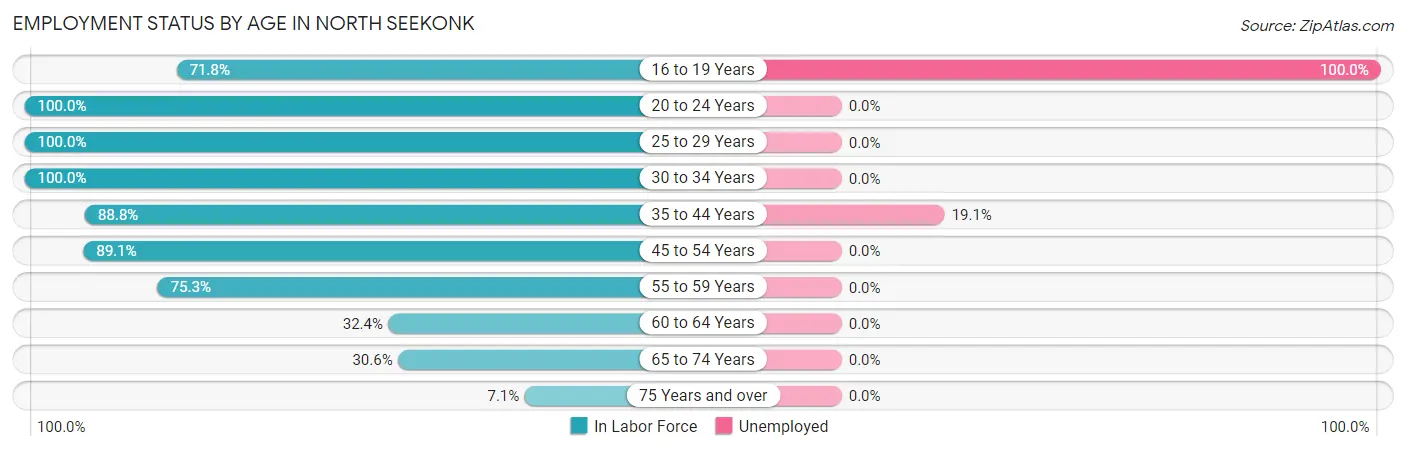
| Age Bracket | In Labor Force | Unemployed |
| 16 to 19 Years | 61 (71.8%) | 61 (100.0%) |
| 20 to 24 Years | 34 (100.0%) | 0 (0.0%) |
| 25 to 29 Years | 275 (100.0%) | 0 (0.0%) |
| 30 to 34 Years | 301 (100.0%) | 0 (0.0%) |
| 35 to 44 Years | 199 (88.8%) | 38 (19.1%) |
| 45 to 54 Years | 261 (89.1%) | 0 (0.0%) |
| 55 to 59 Years | 256 (75.3%) | 0 (0.0%) |
| 60 to 64 Years | 89 (32.4%) | 0 (0.0%) |
| 65 to 74 Years | 53 (30.6%) | 0 (0.0%) |
| 75 Years and over | 18 (7.1%) | 0 (0.0%) |
| Total | 1,547 (68.6%) | 99 (6.4%) |
Employment Status by Educational Attainment in North Seekonk
According to labor force statistics for North Seekonk, 80.9% of individuals (1,382) out of the total population between 25 and 64 years of age (1,708) are in the labor force, with 2.8% or 39 of them being unemployed. The group with the highest labor force participation rate are those with the educational attainment of college / associate degree, with 92.8% or 258 individuals in the labor force. Within the labor force, individuals with high school diploma education have the highest percentage of unemployment, with 10.4% or 38 of them being unemployed.
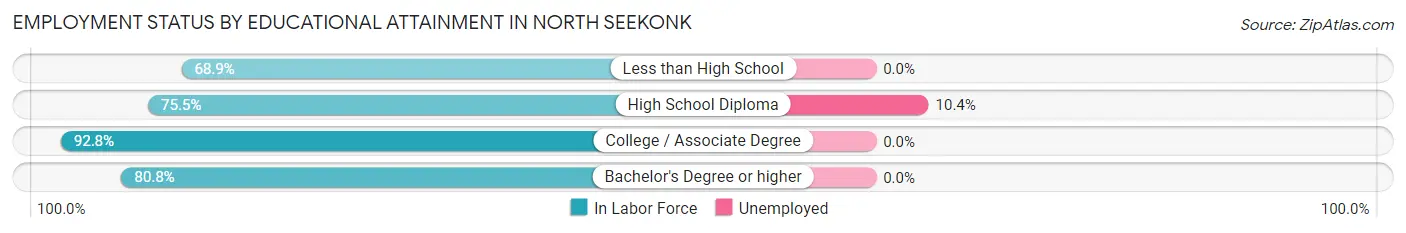
| Educational Attainment | In Labor Force | Unemployed |
| Less than High School | 42 (68.9%) | 0 (0.0%) |
| High School Diploma | 364 (75.5%) | 50 (10.4%) |
| College / Associate Degree | 258 (92.8%) | 0 (0.0%) |
| Bachelor's Degree or higher | 717 (80.8%) | 0 (0.0%) |
| Total | 1,382 (80.9%) | 48 (2.8%) |
Employment Occupations by Sex in North Seekonk
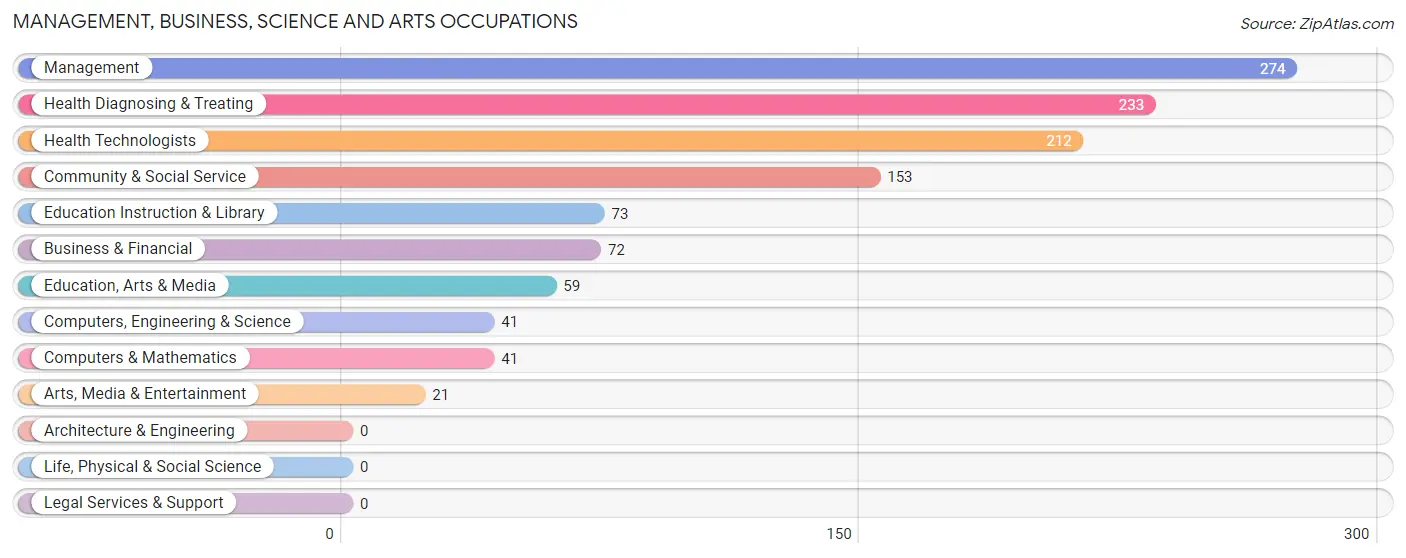
Management, Business, Science and Arts Occupations
The most common Management, Business, Science and Arts occupations in North Seekonk are Management (274 | 18.9%), Health Diagnosing & Treating (233 | 16.1%), Health Technologists (212 | 14.6%), Community & Social Service (153 | 10.6%), and Education Instruction & Library (73 | 5.0%).
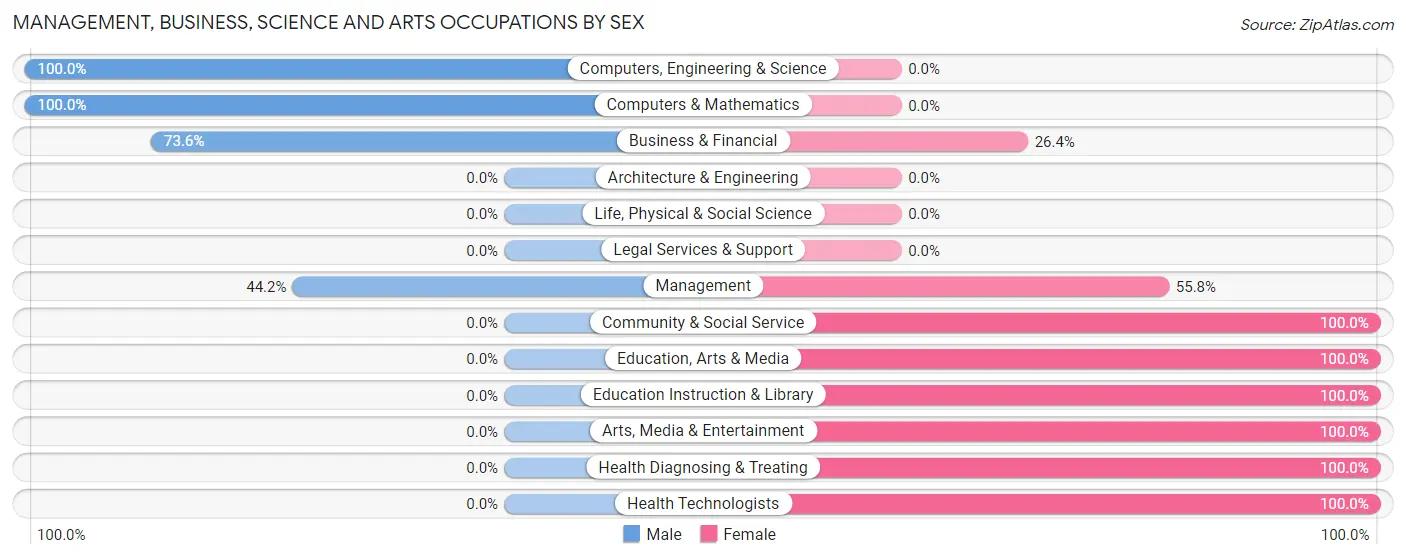
Management, Business, Science and Arts Occupations by Sex
Within the Management, Business, Science and Arts occupations in North Seekonk, the most male-oriented occupations are Computers, Engineering & Science (100.0%), Computers & Mathematics (100.0%), and Business & Financial (73.6%), while the most female-oriented occupations are Community & Social Service (100.0%), Education, Arts & Media (100.0%), and Education Instruction & Library (100.0%).
| Occupation | Male | Female |
| Management | 121 (44.2%) | 153 (55.8%) |
| Business & Financial | 53 (73.6%) | 19 (26.4%) |
| Computers, Engineering & Science | 41 (100.0%) | 0 (0.0%) |
| Computers & Mathematics | 41 (100.0%) | 0 (0.0%) |
| Architecture & Engineering | 0 (0.0%) | 0 (0.0%) |
| Life, Physical & Social Science | 0 (0.0%) | 0 (0.0%) |
| Community & Social Service | 0 (0.0%) | 153 (100.0%) |
| Education, Arts & Media | 0 (0.0%) | 59 (100.0%) |
| Legal Services & Support | 0 (0.0%) | 0 (0.0%) |
| Education Instruction & Library | 0 (0.0%) | 73 (100.0%) |
| Arts, Media & Entertainment | 0 (0.0%) | 21 (100.0%) |
| Health Diagnosing & Treating | 0 (0.0%) | 233 (100.0%) |
| Health Technologists | 0 (0.0%) | 212 (100.0%) |
| Total (Category) | 215 (27.8%) | 558 (72.2%) |
| Total (Overall) | 709 (49.0%) | 739 (51.0%) |
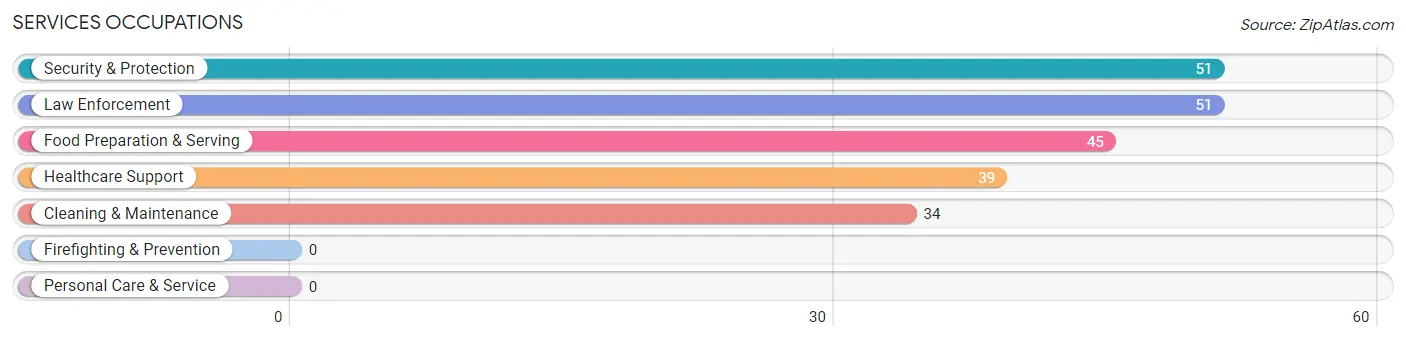
Services Occupations
The most common Services occupations in North Seekonk are Security & Protection (51 | 3.5%), Law Enforcement (51 | 3.5%), Food Preparation & Serving (45 | 3.1%), Healthcare Support (39 | 2.7%), and Cleaning & Maintenance (34 | 2.4%).
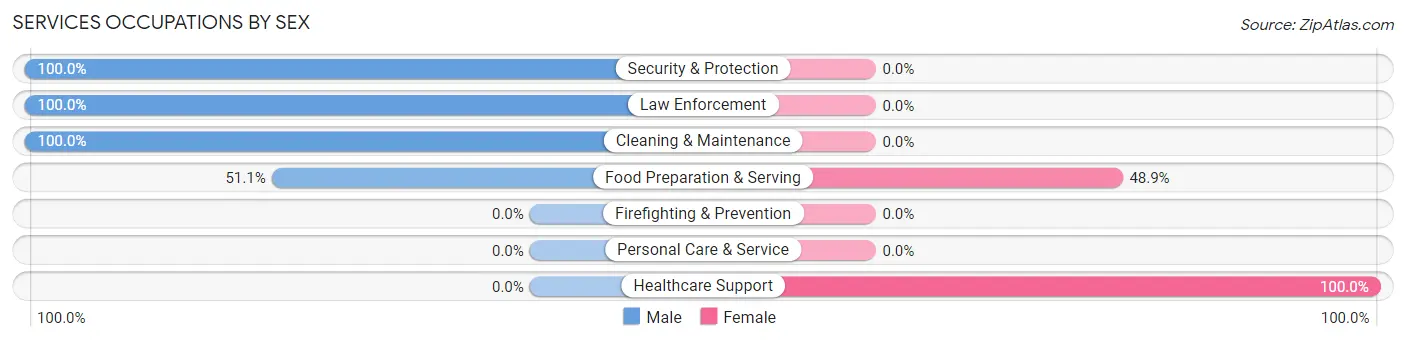
Services Occupations by Sex
Within the Services occupations in North Seekonk, the most male-oriented occupations are Security & Protection (100.0%), Law Enforcement (100.0%), and Cleaning & Maintenance (100.0%), while the most female-oriented occupations are Healthcare Support (100.0%), and Food Preparation & Serving (48.9%).
| Occupation | Male | Female |
| Healthcare Support | 0 (0.0%) | 39 (100.0%) |
| Security & Protection | 51 (100.0%) | 0 (0.0%) |
| Firefighting & Prevention | 0 (0.0%) | 0 (0.0%) |
| Law Enforcement | 51 (100.0%) | 0 (0.0%) |
| Food Preparation & Serving | 23 (51.1%) | 22 (48.9%) |
| Cleaning & Maintenance | 34 (100.0%) | 0 (0.0%) |
| Personal Care & Service | 0 (0.0%) | 0 (0.0%) |
| Total (Category) | 108 (63.9%) | 61 (36.1%) |
| Total (Overall) | 709 (49.0%) | 739 (51.0%) |
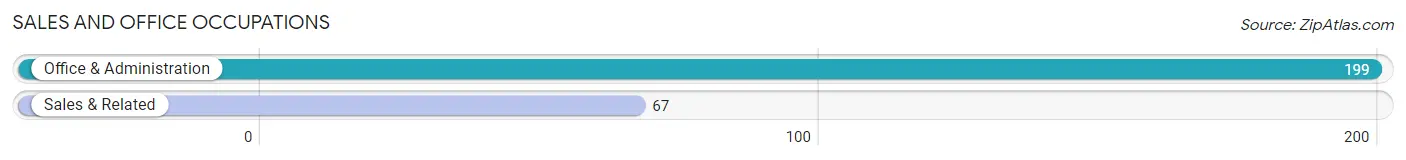
Sales and Office Occupations
The most common Sales and Office occupations in North Seekonk are Office & Administration (199 | 13.7%), and Sales & Related (67 | 4.6%).
Sales and Office Occupations by Sex
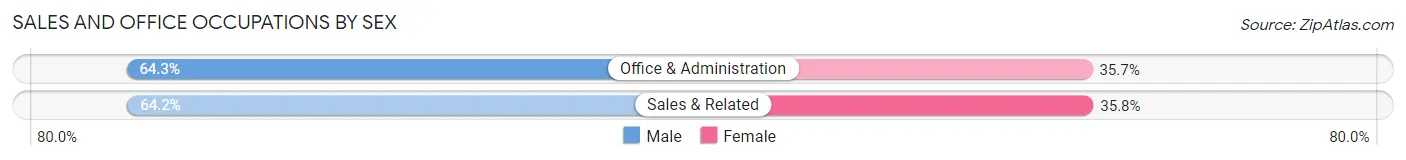
| Occupation | Male | Female |
| Sales & Related | 43 (64.2%) | 24 (35.8%) |
| Office & Administration | 128 (64.3%) | 71 (35.7%) |
| Total (Category) | 171 (64.3%) | 95 (35.7%) |
| Total (Overall) | 709 (49.0%) | 739 (51.0%) |
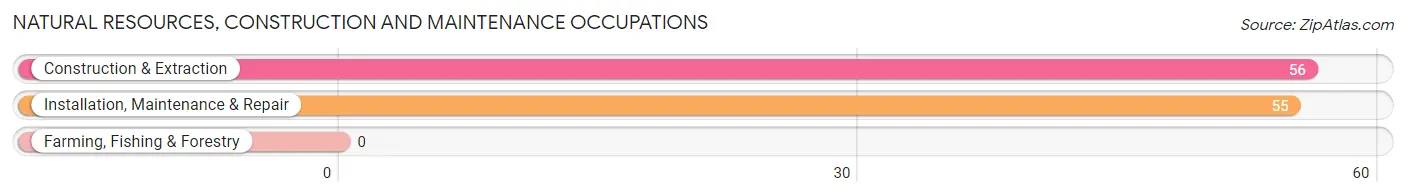
Natural Resources, Construction and Maintenance Occupations
The most common Natural Resources, Construction and Maintenance occupations in North Seekonk are Construction & Extraction (56 | 3.9%), and Installation, Maintenance & Repair (55 | 3.8%).
Natural Resources, Construction and Maintenance Occupations by Sex
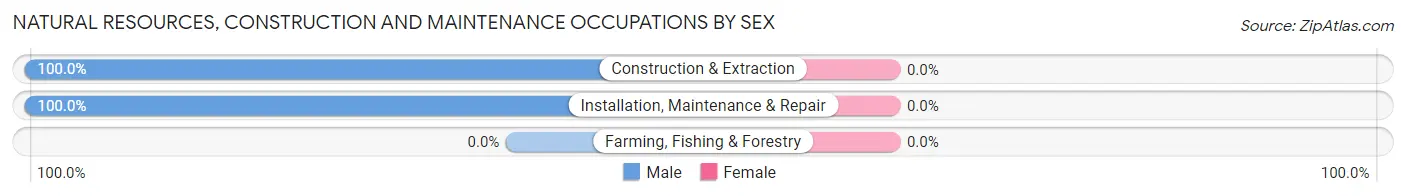
| Occupation | Male | Female |
| Farming, Fishing & Forestry | 0 (0.0%) | 0 (0.0%) |
| Construction & Extraction | 56 (100.0%) | 0 (0.0%) |
| Installation, Maintenance & Repair | 55 (100.0%) | 0 (0.0%) |
| Total (Category) | 111 (100.0%) | 0 (0.0%) |
| Total (Overall) | 709 (49.0%) | 739 (51.0%) |
Production, Transportation and Moving Occupations
The most common Production, Transportation and Moving occupations in North Seekonk are Production (100 | 6.9%), and Transportation (29 | 2.0%).
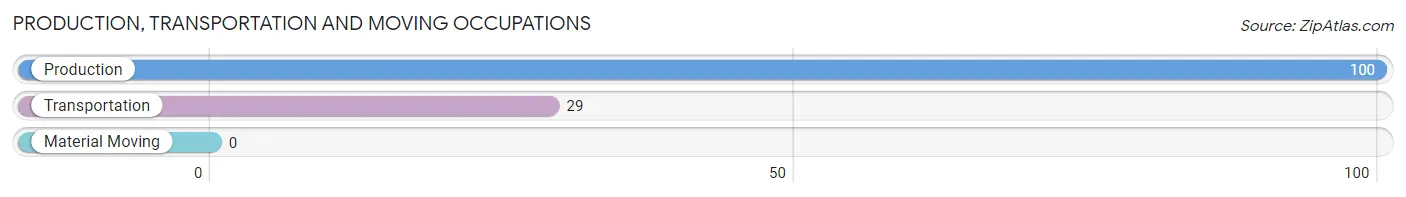
Production, Transportation and Moving Occupations by Sex
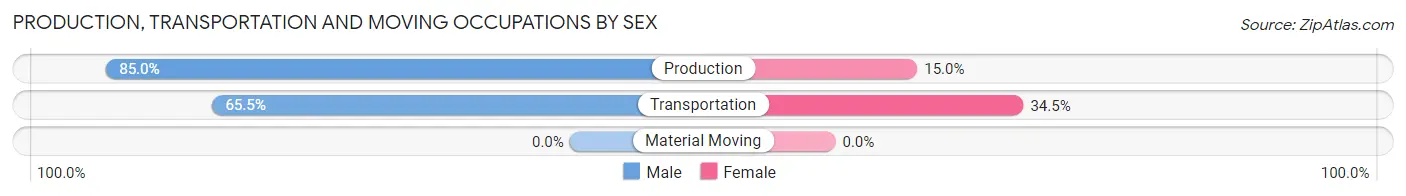
| Occupation | Male | Female |
| Production | 85 (85.0%) | 15 (15.0%) |
| Transportation | 19 (65.5%) | 10 (34.5%) |
| Material Moving | 0 (0.0%) | 0 (0.0%) |
| Total (Category) | 104 (80.6%) | 25 (19.4%) |
| Total (Overall) | 709 (49.0%) | 739 (51.0%) |
Employment Industries by Sex in North Seekonk
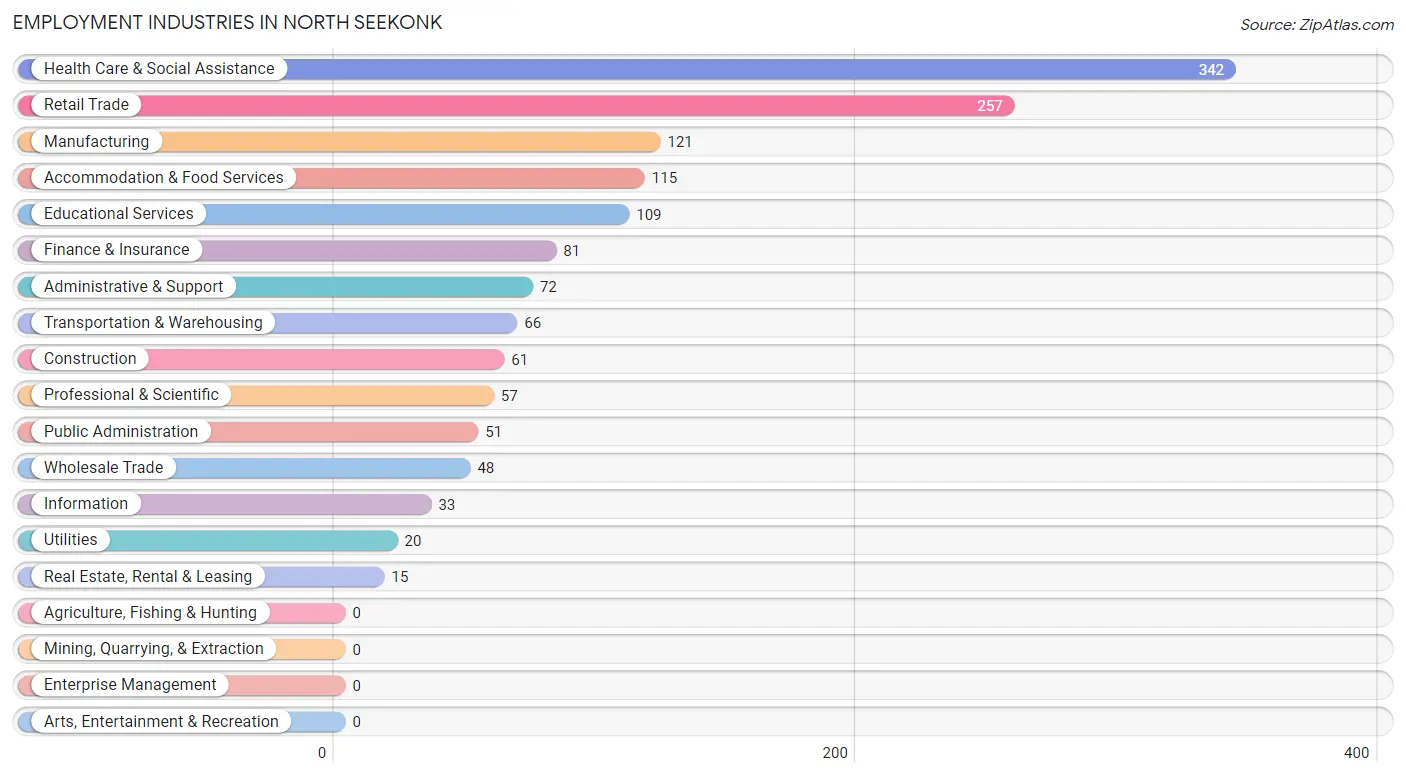
Employment Industries in North Seekonk
The major employment industries in North Seekonk include Health Care & Social Assistance (342 | 23.6%), Retail Trade (257 | 17.7%), Manufacturing (121 | 8.4%), Accommodation & Food Services (115 | 7.9%), and Educational Services (109 | 7.5%).
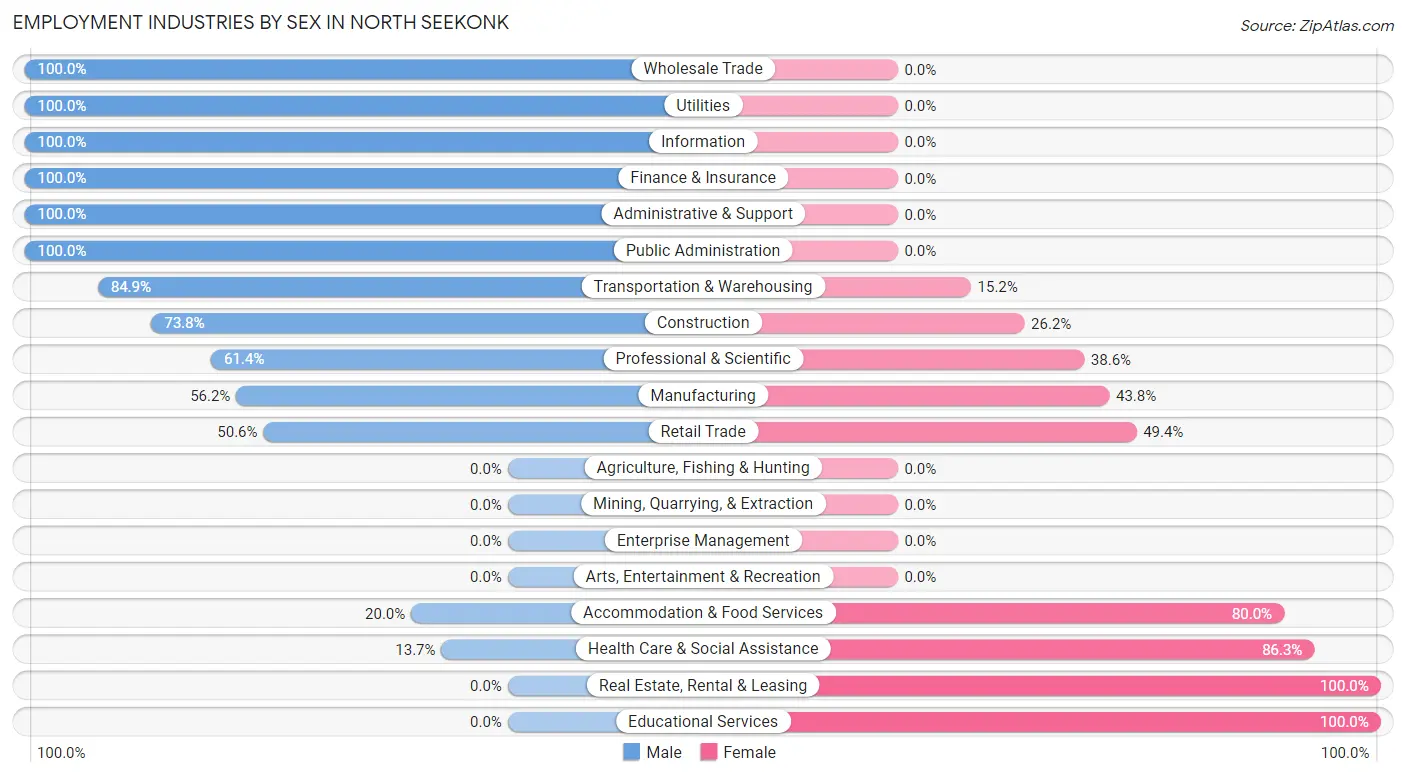
Employment Industries by Sex in North Seekonk
The North Seekonk industries that see more men than women are Wholesale Trade (100.0%), Utilities (100.0%), and Information (100.0%), whereas the industries that tend to have a higher number of women are Real Estate, Rental & Leasing (100.0%), Educational Services (100.0%), and Health Care & Social Assistance (86.3%).
| Industry | Male | Female |
| Agriculture, Fishing & Hunting | 0 (0.0%) | 0 (0.0%) |
| Mining, Quarrying, & Extraction | 0 (0.0%) | 0 (0.0%) |
| Construction | 45 (73.8%) | 16 (26.2%) |
| Manufacturing | 68 (56.2%) | 53 (43.8%) |
| Wholesale Trade | 48 (100.0%) | 0 (0.0%) |
| Retail Trade | 130 (50.6%) | 127 (49.4%) |
| Transportation & Warehousing | 56 (84.9%) | 10 (15.1%) |
| Utilities | 20 (100.0%) | 0 (0.0%) |
| Information | 33 (100.0%) | 0 (0.0%) |
| Finance & Insurance | 81 (100.0%) | 0 (0.0%) |
| Real Estate, Rental & Leasing | 0 (0.0%) | 15 (100.0%) |
| Professional & Scientific | 35 (61.4%) | 22 (38.6%) |
| Enterprise Management | 0 (0.0%) | 0 (0.0%) |
| Administrative & Support | 72 (100.0%) | 0 (0.0%) |
| Educational Services | 0 (0.0%) | 109 (100.0%) |
| Health Care & Social Assistance | 47 (13.7%) | 295 (86.3%) |
| Arts, Entertainment & Recreation | 0 (0.0%) | 0 (0.0%) |
| Accommodation & Food Services | 23 (20.0%) | 92 (80.0%) |
| Public Administration | 51 (100.0%) | 0 (0.0%) |
| Total | 709 (49.0%) | 739 (51.0%) |
Education in North Seekonk
School Enrollment in North Seekonk
The most common levels of schooling among the 487 students in North Seekonk are elementary school (175 | 35.9%), middle school (142 | 29.2%), and high school (114 | 23.4%).
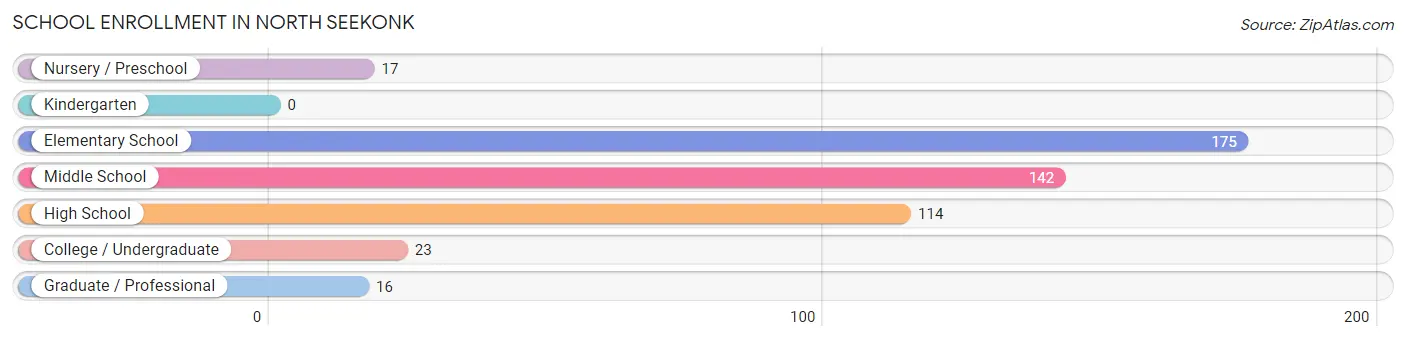
| School Level | # Students | % Students |
| Nursery / Preschool | 17 | 3.5% |
| Kindergarten | 0 | 0.0% |
| Elementary School | 175 | 35.9% |
| Middle School | 142 | 29.2% |
| High School | 114 | 23.4% |
| College / Undergraduate | 23 | 4.7% |
| Graduate / Professional | 16 | 3.3% |
| Total | 487 | 100.0% |
School Enrollment by Age by Funding Source in North Seekonk
Out of a total of 487 students who are enrolled in schools in North Seekonk, 57 (11.7%) attend a private institution, while the remaining 430 (88.3%) are enrolled in public schools. The age group of 25 to 34 year olds has the highest likelihood of being enrolled in private schools, with 16 (41.0% in the age bracket) enrolled. Conversely, the age group of 3 to 4 year olds has the lowest likelihood of being enrolled in a private school, with 17 (100.0% in the age bracket) attending a public institution.
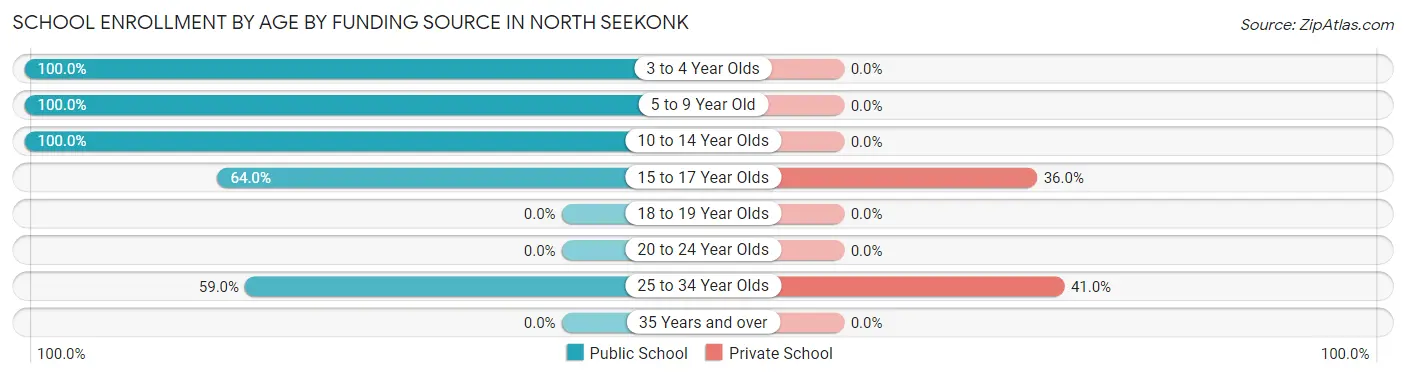
| Age Bracket | Public School | Private School |
| 3 to 4 Year Olds | 17 (100.0%) | 0 (0.0%) |
| 5 to 9 Year Old | 175 (100.0%) | 0 (0.0%) |
| 10 to 14 Year Olds | 142 (100.0%) | 0 (0.0%) |
| 15 to 17 Year Olds | 73 (64.0%) | 41 (36.0%) |
| 18 to 19 Year Olds | 0 (0.0%) | 0 (0.0%) |
| 20 to 24 Year Olds | 0 (0.0%) | 0 (0.0%) |
| 25 to 34 Year Olds | 23 (59.0%) | 16 (41.0%) |
| 35 Years and over | 0 (0.0%) | 0 (0.0%) |
| Total | 430 (88.3%) | 57 (11.7%) |
Educational Attainment by Field of Study in North Seekonk
Science & technology (205 | 20.2%), education (139 | 13.7%), arts & humanities (131 | 12.9%), social sciences (114 | 11.3%), and psychology (83 | 8.2%) are the most common fields of study among 1,013 individuals in North Seekonk who have obtained a bachelor's degree or higher.
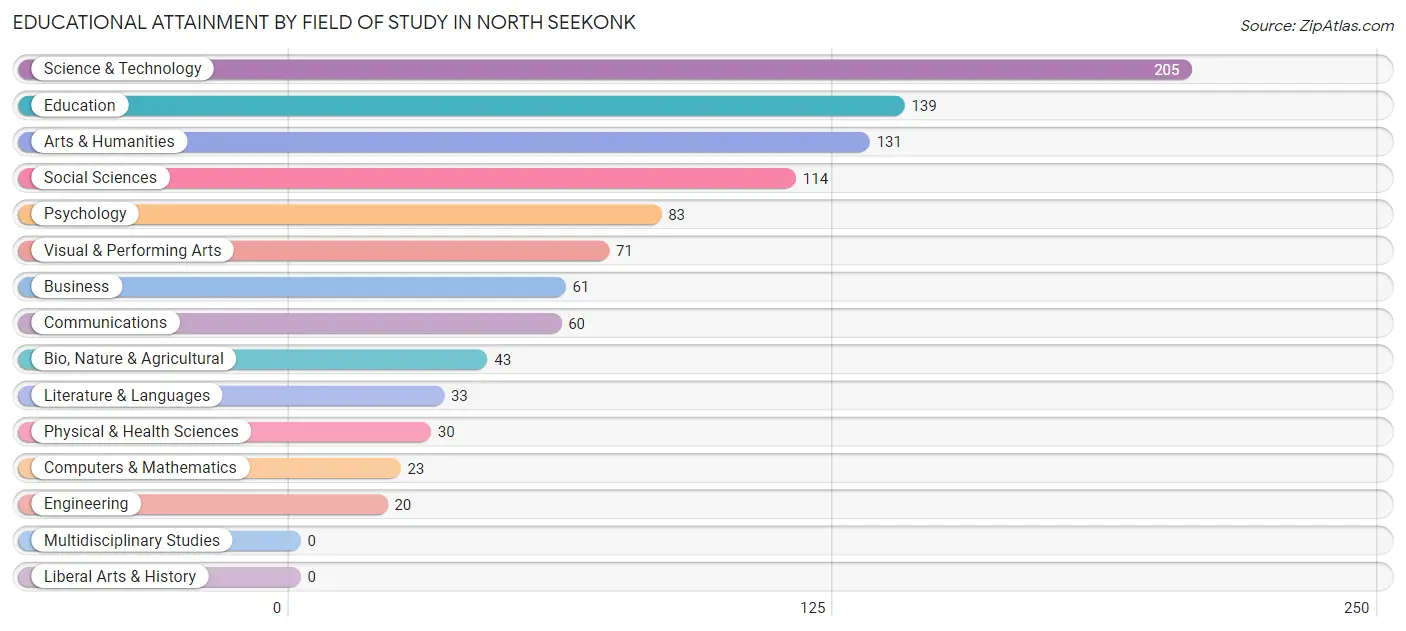
| Field of Study | # Graduates | % Graduates |
| Computers & Mathematics | 23 | 2.3% |
| Bio, Nature & Agricultural | 43 | 4.2% |
| Physical & Health Sciences | 30 | 3.0% |
| Psychology | 83 | 8.2% |
| Social Sciences | 114 | 11.3% |
| Engineering | 20 | 2.0% |
| Multidisciplinary Studies | 0 | 0.0% |
| Science & Technology | 205 | 20.2% |
| Business | 61 | 6.0% |
| Education | 139 | 13.7% |
| Literature & Languages | 33 | 3.3% |
| Liberal Arts & History | 0 | 0.0% |
| Visual & Performing Arts | 71 | 7.0% |
| Communications | 60 | 5.9% |
| Arts & Humanities | 131 | 12.9% |
| Total | 1,013 | 100.0% |
Transportation & Commute in North Seekonk
Vehicle Availability by Sex in North Seekonk
The most prevalent vehicle ownership categories in North Seekonk are males with 2 vehicles (298, accounting for 43.6%) and females with 2 vehicles (314, making up 40.3%).
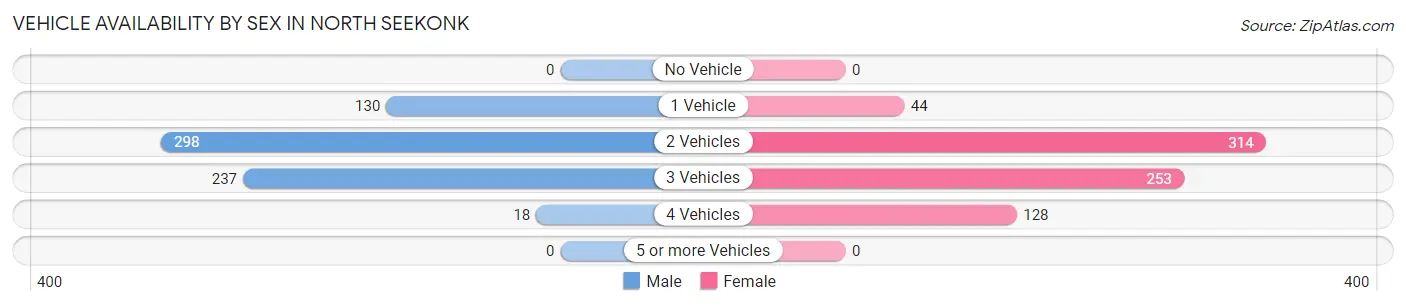
| Vehicles Available | Male | Female |
| No Vehicle | 0 (0.0%) | 0 (0.0%) |
| 1 Vehicle | 130 (19.0%) | 44 (5.9%) |
| 2 Vehicles | 298 (43.6%) | 314 (42.5%) |
| 3 Vehicles | 237 (34.7%) | 253 (34.2%) |
| 4 Vehicles | 18 (2.6%) | 128 (17.3%) |
| 5 or more Vehicles | 0 (0.0%) | 0 (0.0%) |
| Total | 683 (100.0%) | 739 (100.0%) |
Commute Time in North Seekonk
The most frequently occuring commute durations in North Seekonk are 15 to 19 minutes (266 commuters, 20.6%), 25 to 29 minutes (197 commuters, 15.2%), and 20 to 24 minutes (168 commuters, 13.0%).
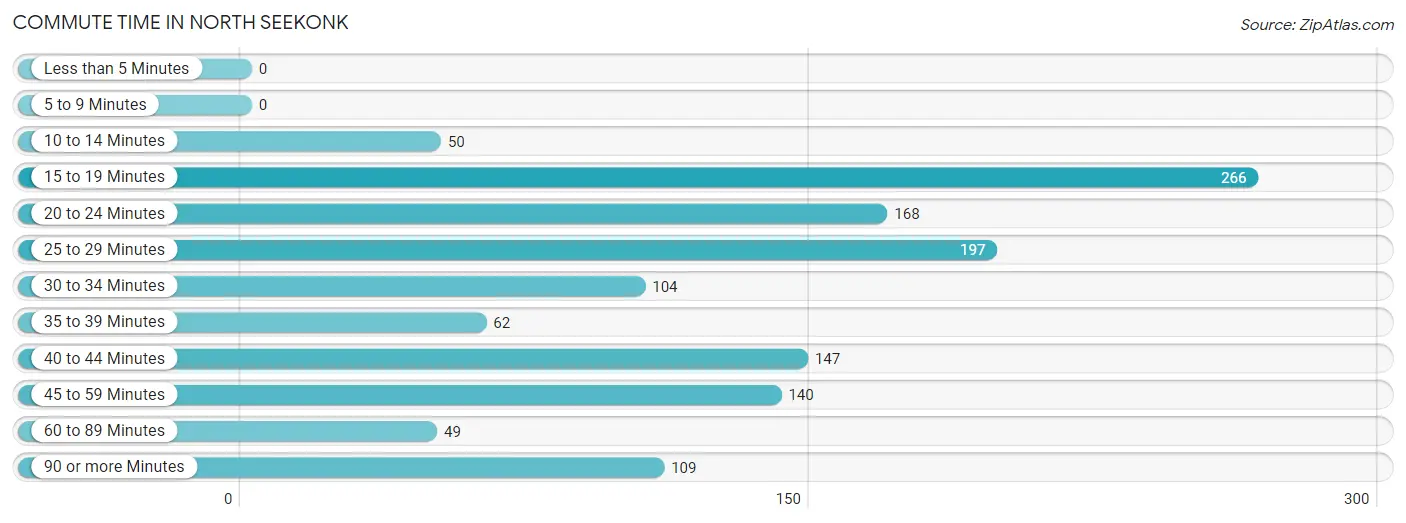
| Commute Time | # Commuters | % Commuters |
| Less than 5 Minutes | 0 | 0.0% |
| 5 to 9 Minutes | 0 | 0.0% |
| 10 to 14 Minutes | 50 | 3.9% |
| 15 to 19 Minutes | 266 | 20.6% |
| 20 to 24 Minutes | 168 | 13.0% |
| 25 to 29 Minutes | 197 | 15.2% |
| 30 to 34 Minutes | 104 | 8.1% |
| 35 to 39 Minutes | 62 | 4.8% |
| 40 to 44 Minutes | 147 | 11.4% |
| 45 to 59 Minutes | 140 | 10.8% |
| 60 to 89 Minutes | 49 | 3.8% |
| 90 or more Minutes | 109 | 8.4% |
Commute Time by Sex in North Seekonk
The most common commute times in North Seekonk are 15 to 19 minutes (148 commuters, 23.6%) for males and 40 to 44 minutes (124 commuters, 18.6%) for females.
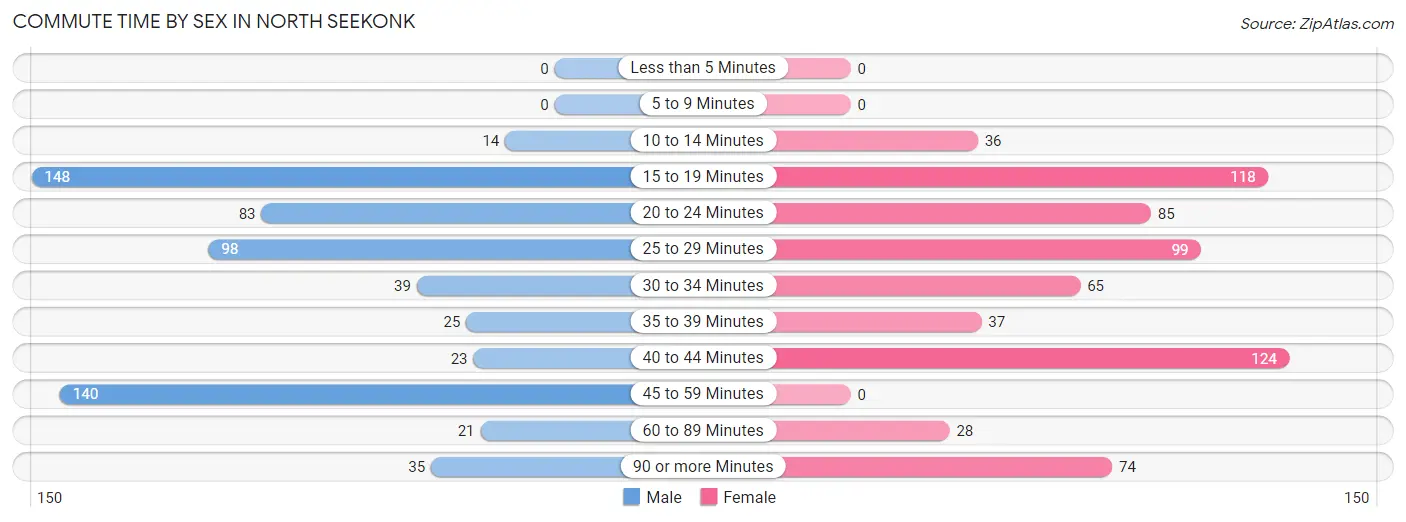
| Commute Time | Male | Female |
| Less than 5 Minutes | 0 (0.0%) | 0 (0.0%) |
| 5 to 9 Minutes | 0 (0.0%) | 0 (0.0%) |
| 10 to 14 Minutes | 14 (2.2%) | 36 (5.4%) |
| 15 to 19 Minutes | 148 (23.6%) | 118 (17.7%) |
| 20 to 24 Minutes | 83 (13.3%) | 85 (12.8%) |
| 25 to 29 Minutes | 98 (15.7%) | 99 (14.9%) |
| 30 to 34 Minutes | 39 (6.2%) | 65 (9.8%) |
| 35 to 39 Minutes | 25 (4.0%) | 37 (5.6%) |
| 40 to 44 Minutes | 23 (3.7%) | 124 (18.6%) |
| 45 to 59 Minutes | 140 (22.4%) | 0 (0.0%) |
| 60 to 89 Minutes | 21 (3.4%) | 28 (4.2%) |
| 90 or more Minutes | 35 (5.6%) | 74 (11.1%) |
Time of Departure to Work by Sex in North Seekonk
The most frequent times of departure to work in North Seekonk are 7:30 AM to 7:59 AM (163, 26.0%) for males and 7:30 AM to 7:59 AM (142, 21.3%) for females.
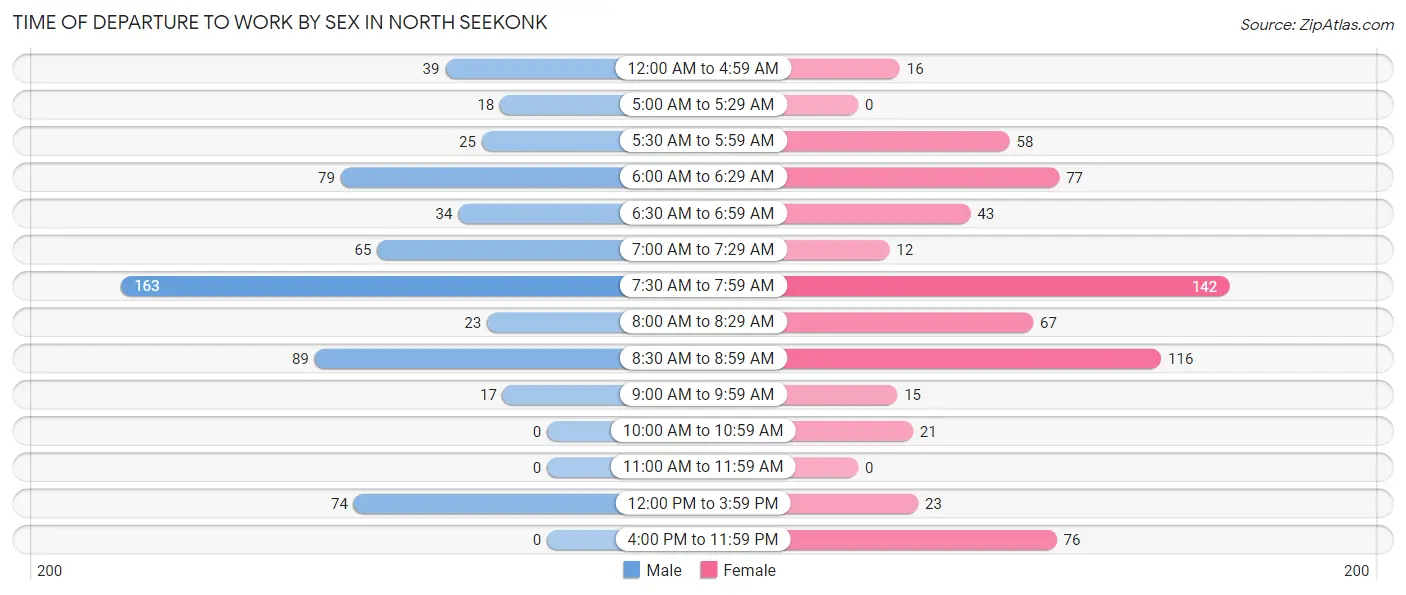
| Time of Departure | Male | Female |
| 12:00 AM to 4:59 AM | 39 (6.2%) | 16 (2.4%) |
| 5:00 AM to 5:29 AM | 18 (2.9%) | 0 (0.0%) |
| 5:30 AM to 5:59 AM | 25 (4.0%) | 58 (8.7%) |
| 6:00 AM to 6:29 AM | 79 (12.6%) | 77 (11.6%) |
| 6:30 AM to 6:59 AM | 34 (5.4%) | 43 (6.5%) |
| 7:00 AM to 7:29 AM | 65 (10.4%) | 12 (1.8%) |
| 7:30 AM to 7:59 AM | 163 (26.0%) | 142 (21.3%) |
| 8:00 AM to 8:29 AM | 23 (3.7%) | 67 (10.1%) |
| 8:30 AM to 8:59 AM | 89 (14.2%) | 116 (17.4%) |
| 9:00 AM to 9:59 AM | 17 (2.7%) | 15 (2.2%) |
| 10:00 AM to 10:59 AM | 0 (0.0%) | 21 (3.2%) |
| 11:00 AM to 11:59 AM | 0 (0.0%) | 0 (0.0%) |
| 12:00 PM to 3:59 PM | 74 (11.8%) | 23 (3.5%) |
| 4:00 PM to 11:59 PM | 0 (0.0%) | 76 (11.4%) |
| Total | 626 (100.0%) | 666 (100.0%) |
Housing Occupancy in North Seekonk
Occupancy by Ownership in North Seekonk
Of the total 1,086 dwellings in North Seekonk, owner-occupied units account for 930 (85.6%), while renter-occupied units make up 156 (14.4%).
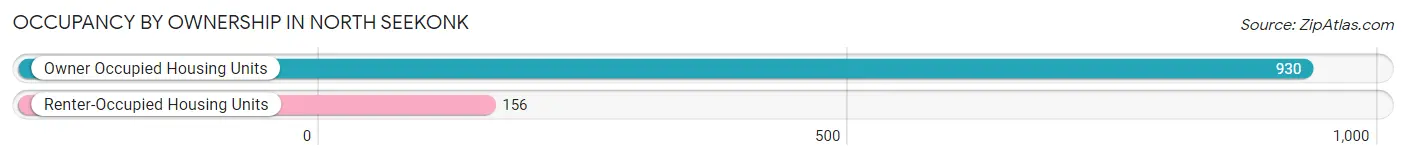
| Occupancy | # Housing Units | % Housing Units |
| Owner Occupied Housing Units | 930 | 85.6% |
| Renter-Occupied Housing Units | 156 | 14.4% |
| Total Occupied Housing Units | 1,086 | 100.0% |
Occupancy by Household Size in North Seekonk
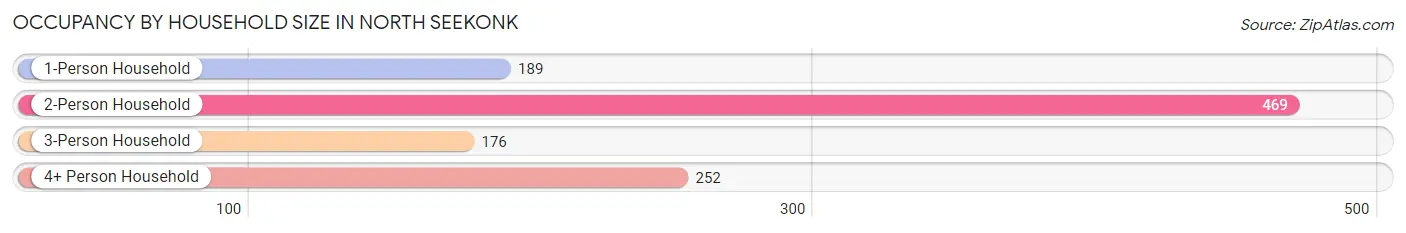
| Household Size | # Housing Units | % Housing Units |
| 1-Person Household | 189 | 17.4% |
| 2-Person Household | 469 | 43.2% |
| 3-Person Household | 176 | 16.2% |
| 4+ Person Household | 252 | 23.2% |
| Total Housing Units | 1,086 | 100.0% |
Occupancy by Ownership by Household Size in North Seekonk
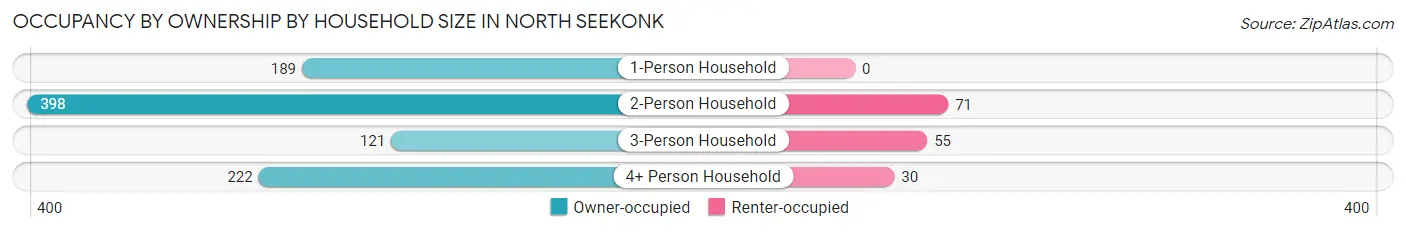
| Household Size | Owner-occupied | Renter-occupied |
| 1-Person Household | 189 (100.0%) | 0 (0.0%) |
| 2-Person Household | 398 (84.9%) | 71 (15.1%) |
| 3-Person Household | 121 (68.8%) | 55 (31.2%) |
| 4+ Person Household | 222 (88.1%) | 30 (11.9%) |
| Total Housing Units | 930 (85.6%) | 156 (14.4%) |
Occupancy by Educational Attainment in North Seekonk
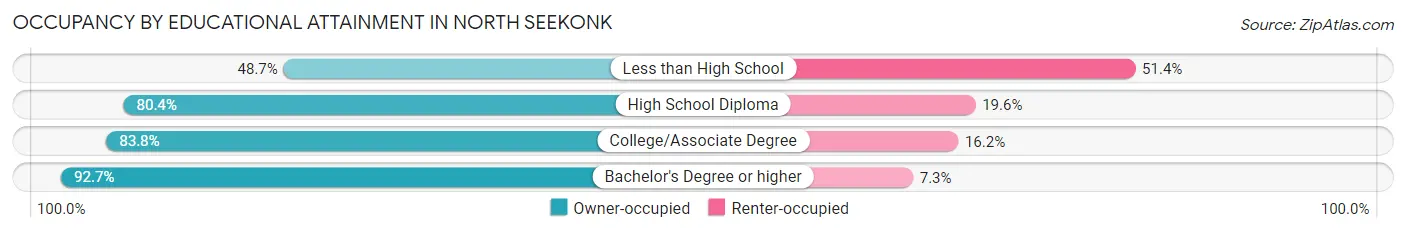
| Household Size | Owner-occupied | Renter-occupied |
| Less than High School | 18 (48.6%) | 19 (51.3%) |
| High School Diploma | 266 (80.4%) | 65 (19.6%) |
| College/Associate Degree | 186 (83.8%) | 36 (16.2%) |
| Bachelor's Degree or higher | 460 (92.7%) | 36 (7.3%) |
Occupancy by Age of Householder in North Seekonk
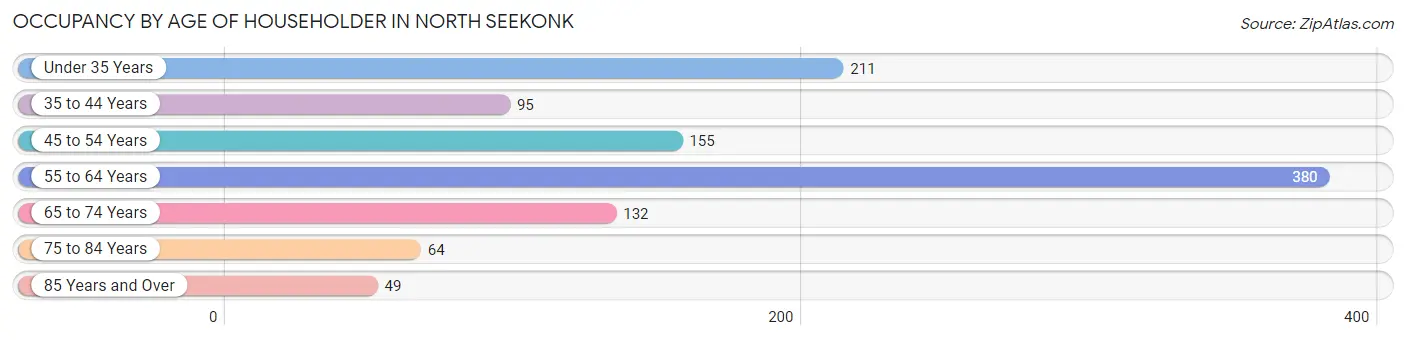
| Age Bracket | # Households | % Households |
| Under 35 Years | 211 | 19.4% |
| 35 to 44 Years | 95 | 8.7% |
| 45 to 54 Years | 155 | 14.3% |
| 55 to 64 Years | 380 | 35.0% |
| 65 to 74 Years | 132 | 12.1% |
| 75 to 84 Years | 64 | 5.9% |
| 85 Years and Over | 49 | 4.5% |
| Total | 1,086 | 100.0% |
Housing Finances in North Seekonk
Median Income by Occupancy in North Seekonk
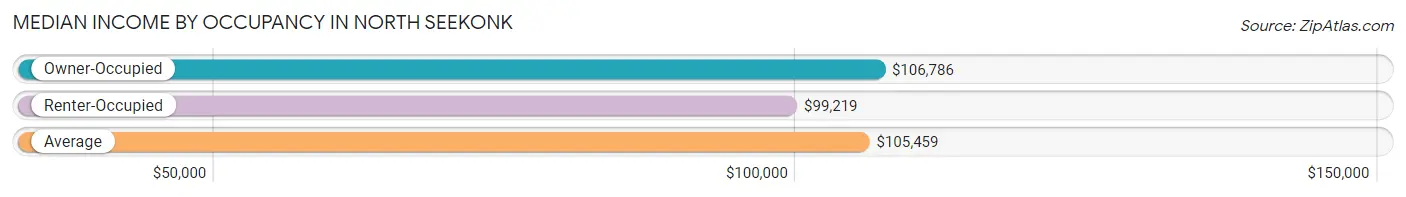
| Occupancy Type | # Households | Median Income |
| Owner-Occupied | 930 (85.6%) | $106,786 |
| Renter-Occupied | 156 (14.4%) | $99,219 |
| Average | 1,086 (100.0%) | $105,459 |
Occupancy by Householder Income Bracket in North Seekonk
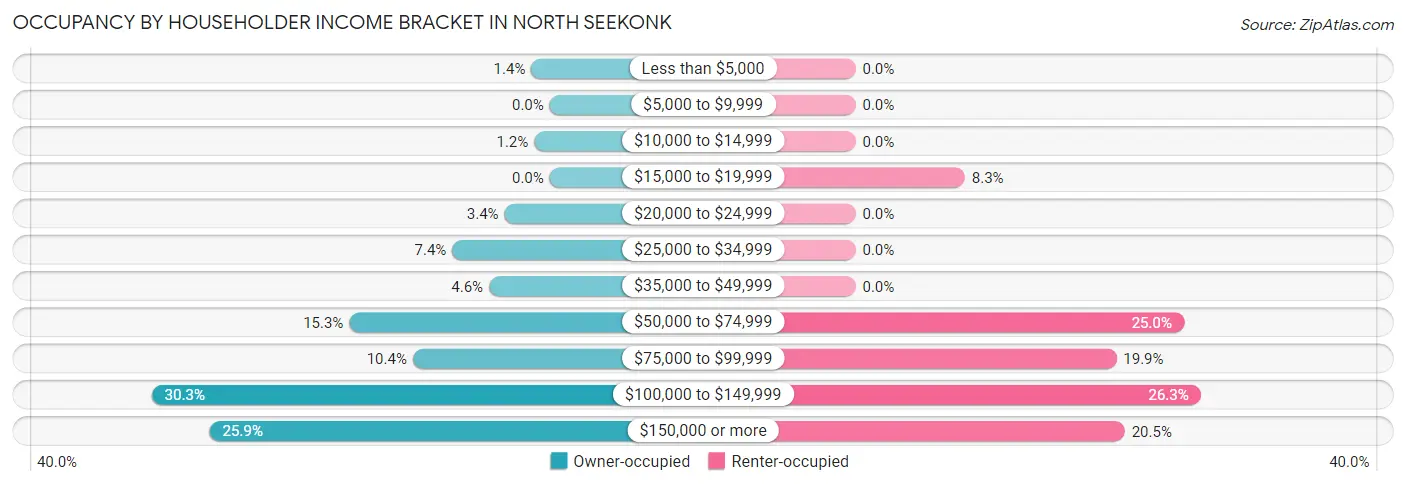
| Income Bracket | Owner-occupied | Renter-occupied |
| Less than $5,000 | 13 (1.4%) | 0 (0.0%) |
| $5,000 to $9,999 | 0 (0.0%) | 0 (0.0%) |
| $10,000 to $14,999 | 11 (1.2%) | 0 (0.0%) |
| $15,000 to $19,999 | 0 (0.0%) | 13 (8.3%) |
| $20,000 to $24,999 | 32 (3.4%) | 0 (0.0%) |
| $25,000 to $34,999 | 69 (7.4%) | 0 (0.0%) |
| $35,000 to $49,999 | 43 (4.6%) | 0 (0.0%) |
| $50,000 to $74,999 | 142 (15.3%) | 39 (25.0%) |
| $75,000 to $99,999 | 97 (10.4%) | 31 (19.9%) |
| $100,000 to $149,999 | 282 (30.3%) | 41 (26.3%) |
| $150,000 or more | 241 (25.9%) | 32 (20.5%) |
| Total | 930 (100.0%) | 156 (100.0%) |
Monthly Housing Cost Tiers in North Seekonk
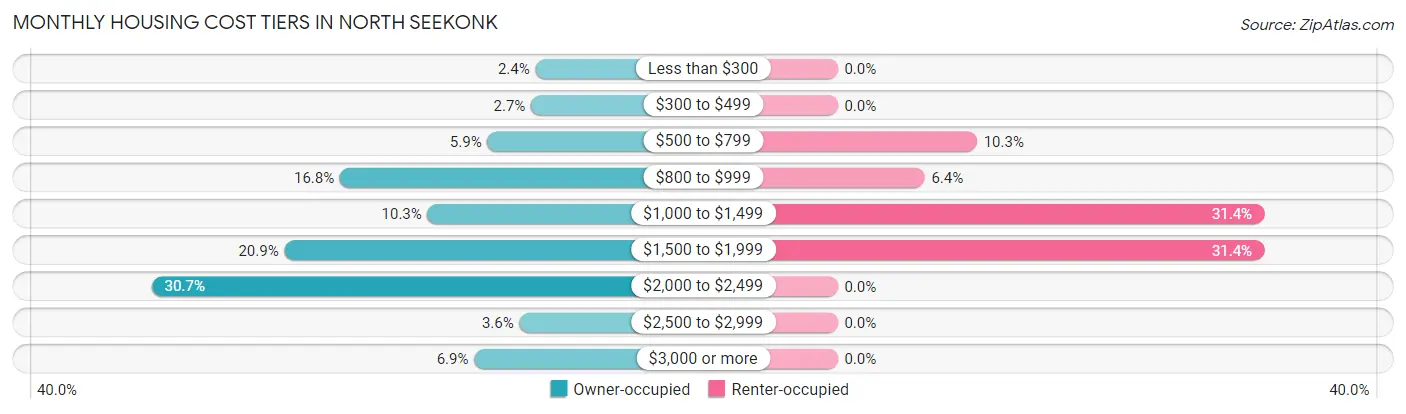
| Monthly Cost | Owner-occupied | Renter-occupied |
| Less than $300 | 22 (2.4%) | 0 (0.0%) |
| $300 to $499 | 25 (2.7%) | 0 (0.0%) |
| $500 to $799 | 55 (5.9%) | 16 (10.3%) |
| $800 to $999 | 156 (16.8%) | 10 (6.4%) |
| $1,000 to $1,499 | 96 (10.3%) | 49 (31.4%) |
| $1,500 to $1,999 | 194 (20.9%) | 49 (31.4%) |
| $2,000 to $2,499 | 285 (30.6%) | 0 (0.0%) |
| $2,500 to $2,999 | 33 (3.5%) | 0 (0.0%) |
| $3,000 or more | 64 (6.9%) | 0 (0.0%) |
| Total | 930 (100.0%) | 156 (100.0%) |
Physical Housing Characteristics in North Seekonk
Housing Structures in North Seekonk
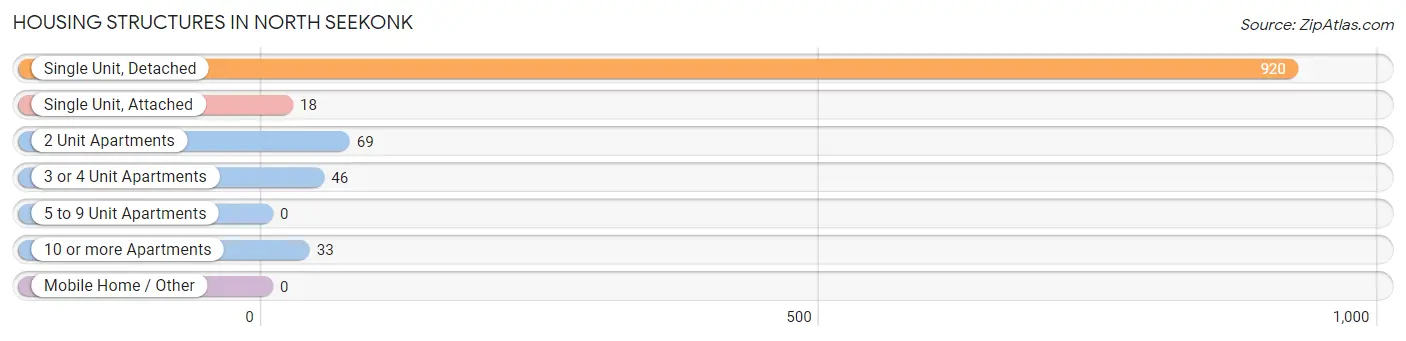
| Structure Type | # Housing Units | % Housing Units |
| Single Unit, Detached | 920 | 84.7% |
| Single Unit, Attached | 18 | 1.7% |
| 2 Unit Apartments | 69 | 6.4% |
| 3 or 4 Unit Apartments | 46 | 4.2% |
| 5 to 9 Unit Apartments | 0 | 0.0% |
| 10 or more Apartments | 33 | 3.0% |
| Mobile Home / Other | 0 | 0.0% |
| Total | 1,086 | 100.0% |
Housing Structures by Occupancy in North Seekonk
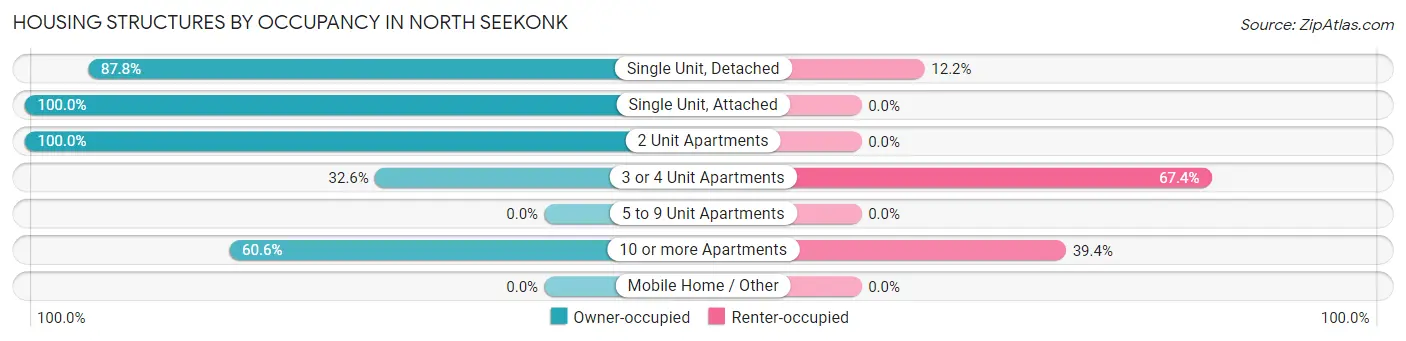
| Structure Type | Owner-occupied | Renter-occupied |
| Single Unit, Detached | 808 (87.8%) | 112 (12.2%) |
| Single Unit, Attached | 18 (100.0%) | 0 (0.0%) |
| 2 Unit Apartments | 69 (100.0%) | 0 (0.0%) |
| 3 or 4 Unit Apartments | 15 (32.6%) | 31 (67.4%) |
| 5 to 9 Unit Apartments | 0 (0.0%) | 0 (0.0%) |
| 10 or more Apartments | 20 (60.6%) | 13 (39.4%) |
| Mobile Home / Other | 0 (0.0%) | 0 (0.0%) |
| Total | 930 (85.6%) | 156 (14.4%) |
Housing Structures by Number of Rooms in North Seekonk
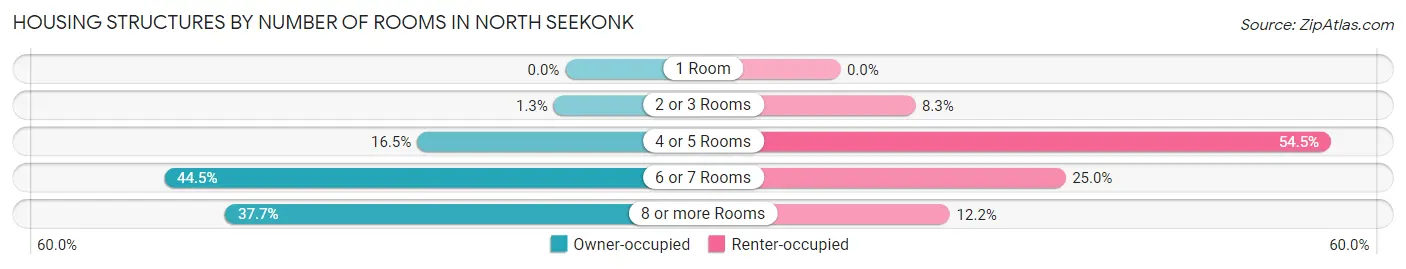
| Number of Rooms | Owner-occupied | Renter-occupied |
| 1 Room | 0 (0.0%) | 0 (0.0%) |
| 2 or 3 Rooms | 12 (1.3%) | 13 (8.3%) |
| 4 or 5 Rooms | 153 (16.5%) | 85 (54.5%) |
| 6 or 7 Rooms | 414 (44.5%) | 39 (25.0%) |
| 8 or more Rooms | 351 (37.7%) | 19 (12.2%) |
| Total | 930 (100.0%) | 156 (100.0%) |
Housing Structure by Heating Type in North Seekonk
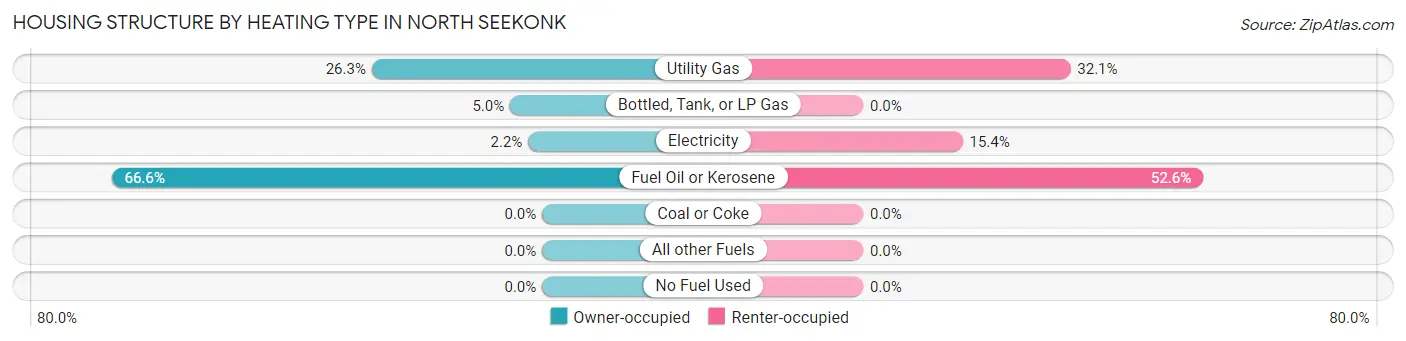
| Heating Type | Owner-occupied | Renter-occupied |
| Utility Gas | 245 (26.3%) | 50 (32.1%) |
| Bottled, Tank, or LP Gas | 46 (5.0%) | 0 (0.0%) |
| Electricity | 20 (2.1%) | 24 (15.4%) |
| Fuel Oil or Kerosene | 619 (66.6%) | 82 (52.6%) |
| Coal or Coke | 0 (0.0%) | 0 (0.0%) |
| All other Fuels | 0 (0.0%) | 0 (0.0%) |
| No Fuel Used | 0 (0.0%) | 0 (0.0%) |
| Total | 930 (100.0%) | 156 (100.0%) |
Household Vehicle Usage in North Seekonk
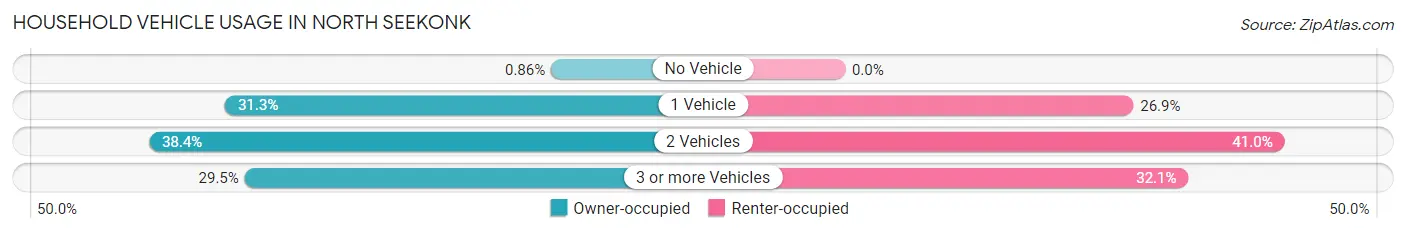
| Vehicles per Household | Owner-occupied | Renter-occupied |
| No Vehicle | 8 (0.9%) | 0 (0.0%) |
| 1 Vehicle | 291 (31.3%) | 42 (26.9%) |
| 2 Vehicles | 357 (38.4%) | 64 (41.0%) |
| 3 or more Vehicles | 274 (29.5%) | 50 (32.1%) |
| Total | 930 (100.0%) | 156 (100.0%) |
Real Estate & Mortgages in North Seekonk
Real Estate and Mortgage Overview in North Seekonk
| Characteristic | Without Mortgage | With Mortgage |
| Housing Units | 275 | 655 |
| Median Property Value | $443,100 | $376,500 |
| Median Household Income | $54,538 | $194 |
| Monthly Housing Costs | $837 | $64 |
| Real Estate Taxes | $5,460 | $0 |
Property Value by Mortgage Status in North Seekonk
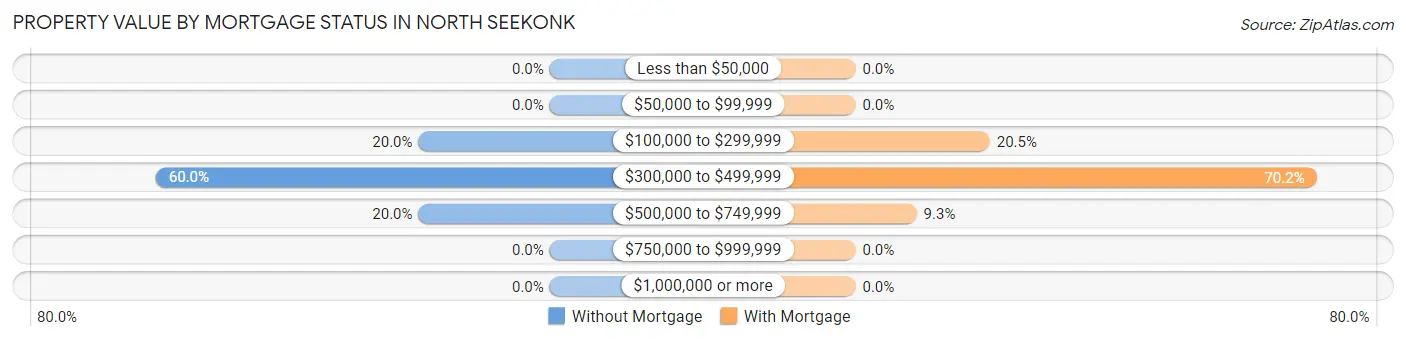
| Property Value | Without Mortgage | With Mortgage |
| Less than $50,000 | 0 (0.0%) | 0 (0.0%) |
| $50,000 to $99,999 | 0 (0.0%) | 0 (0.0%) |
| $100,000 to $299,999 | 55 (20.0%) | 134 (20.5%) |
| $300,000 to $499,999 | 165 (60.0%) | 460 (70.2%) |
| $500,000 to $749,999 | 55 (20.0%) | 61 (9.3%) |
| $750,000 to $999,999 | 0 (0.0%) | 0 (0.0%) |
| $1,000,000 or more | 0 (0.0%) | 0 (0.0%) |
| Total | 275 (100.0%) | 655 (100.0%) |
Household Income by Mortgage Status in North Seekonk
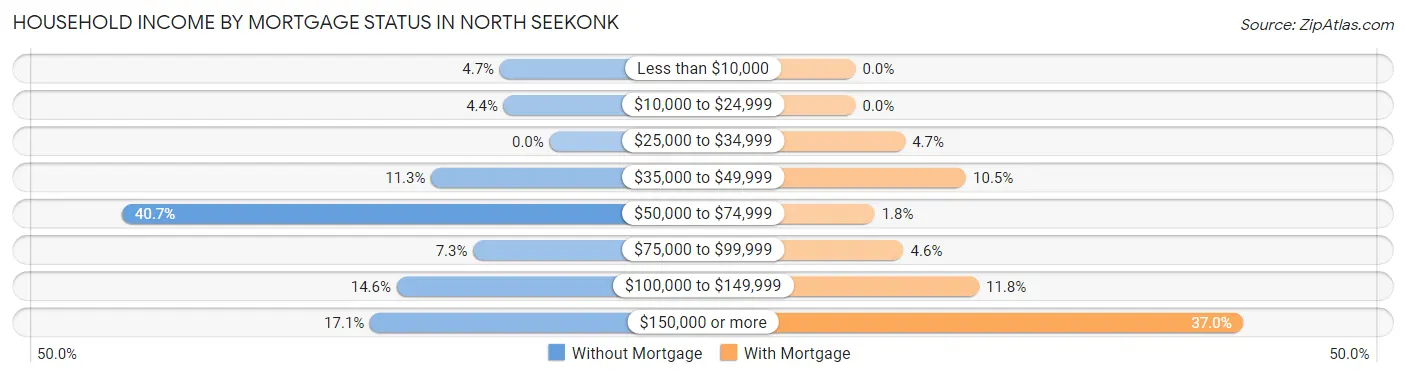
| Household Income | Without Mortgage | With Mortgage |
| Less than $10,000 | 13 (4.7%) | 0 (0.0%) |
| $10,000 to $24,999 | 12 (4.4%) | 0 (0.0%) |
| $25,000 to $34,999 | 0 (0.0%) | 31 (4.7%) |
| $35,000 to $49,999 | 31 (11.3%) | 69 (10.5%) |
| $50,000 to $74,999 | 112 (40.7%) | 12 (1.8%) |
| $75,000 to $99,999 | 20 (7.3%) | 30 (4.6%) |
| $100,000 to $149,999 | 40 (14.5%) | 77 (11.8%) |
| $150,000 or more | 47 (17.1%) | 242 (36.9%) |
| Total | 275 (100.0%) | 655 (100.0%) |
Property Value to Household Income Ratio in North Seekonk
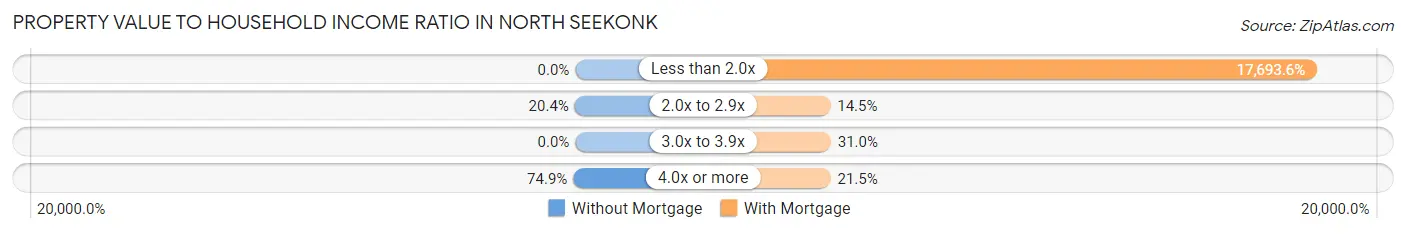
| Value-to-Income Ratio | Without Mortgage | With Mortgage |
| Less than 2.0x | 0 (0.0%) | 115,893 (17,693.6%) |
| 2.0x to 2.9x | 56 (20.4%) | 95 (14.5%) |
| 3.0x to 3.9x | 0 (0.0%) | 203 (31.0%) |
| 4.0x or more | 206 (74.9%) | 141 (21.5%) |
| Total | 275 (100.0%) | 655 (100.0%) |
Real Estate Taxes by Mortgage Status in North Seekonk
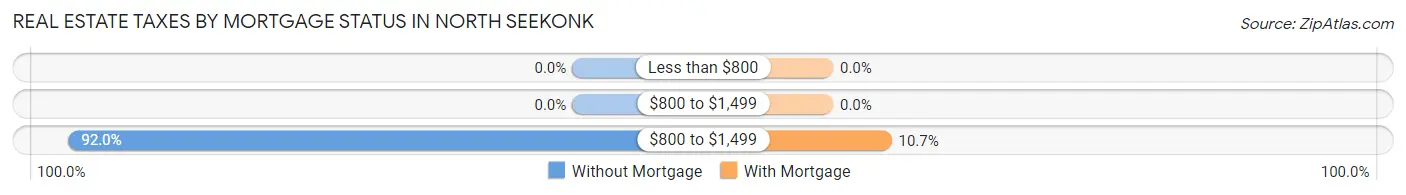
| Property Taxes | Without Mortgage | With Mortgage |
| Less than $800 | 0 (0.0%) | 0 (0.0%) |
| $800 to $1,499 | 0 (0.0%) | 0 (0.0%) |
| $800 to $1,499 | 253 (92.0%) | 70 (10.7%) |
| Total | 275 (100.0%) | 655 (100.0%) |
Health & Disability in North Seekonk
Health Insurance Coverage by Age in North Seekonk
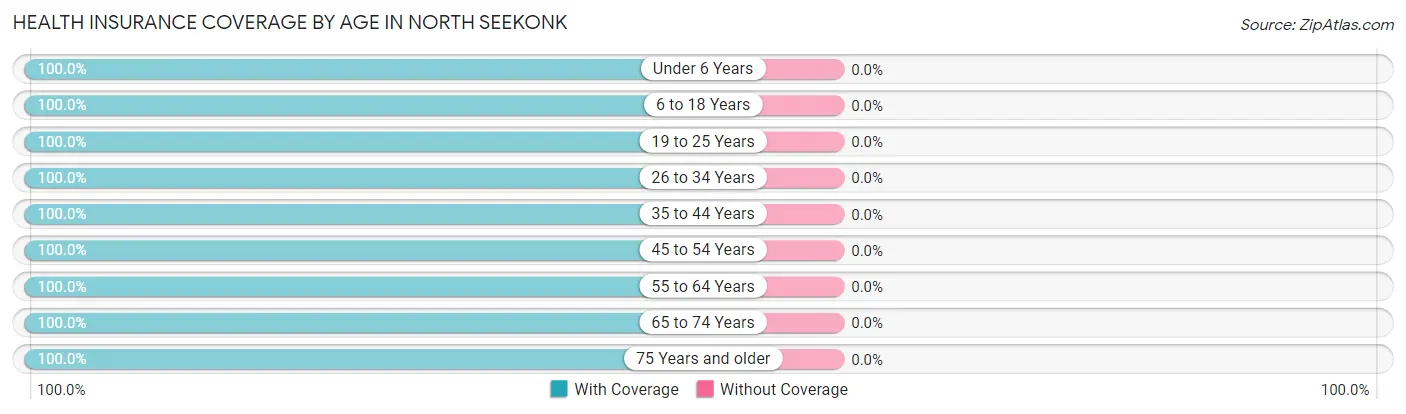
| Age Bracket | With Coverage | Without Coverage |
| Under 6 Years | 106 (100.0%) | 0 (0.0%) |
| 6 to 18 Years | 450 (100.0%) | 0 (0.0%) |
| 19 to 25 Years | 53 (100.0%) | 0 (0.0%) |
| 26 to 34 Years | 557 (100.0%) | 0 (0.0%) |
| 35 to 44 Years | 224 (100.0%) | 0 (0.0%) |
| 45 to 54 Years | 293 (100.0%) | 0 (0.0%) |
| 55 to 64 Years | 615 (100.0%) | 0 (0.0%) |
| 65 to 74 Years | 173 (100.0%) | 0 (0.0%) |
| 75 Years and older | 255 (100.0%) | 0 (0.0%) |
| Total | 2,726 (100.0%) | 0 (0.0%) |
Health Insurance Coverage by Citizenship Status in North Seekonk
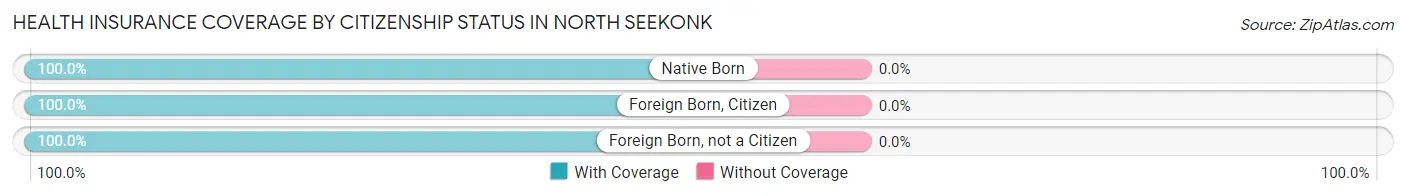
| Citizenship Status | With Coverage | Without Coverage |
| Native Born | 106 (100.0%) | 0 (0.0%) |
| Foreign Born, Citizen | 450 (100.0%) | 0 (0.0%) |
| Foreign Born, not a Citizen | 53 (100.0%) | 0 (0.0%) |
Health Insurance Coverage by Household Income in North Seekonk
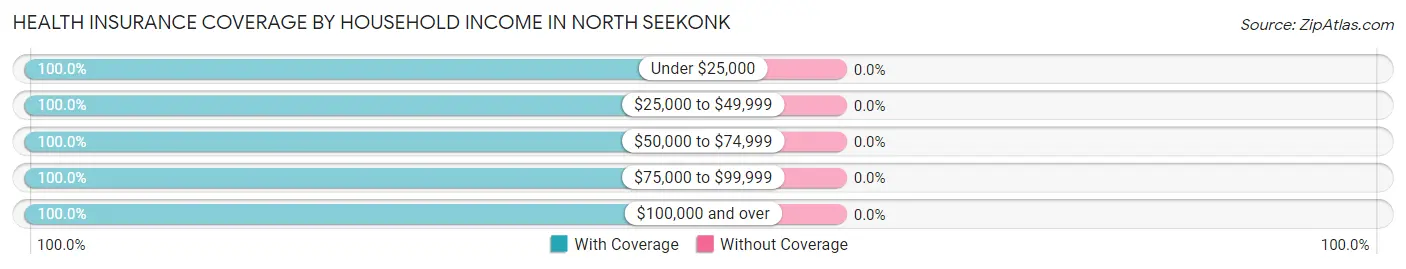
| Household Income | With Coverage | Without Coverage |
| Under $25,000 | 105 (100.0%) | 0 (0.0%) |
| $25,000 to $49,999 | 203 (100.0%) | 0 (0.0%) |
| $50,000 to $74,999 | 289 (100.0%) | 0 (0.0%) |
| $75,000 to $99,999 | 431 (100.0%) | 0 (0.0%) |
| $100,000 and over | 1,698 (100.0%) | 0 (0.0%) |
Public vs Private Health Insurance Coverage by Age in North Seekonk
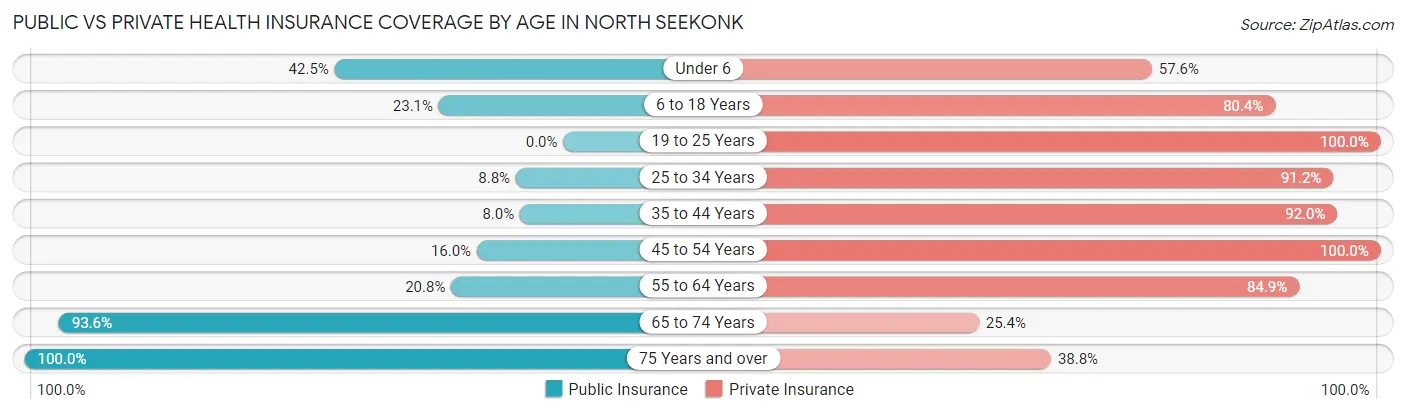
| Age Bracket | Public Insurance | Private Insurance |
| Under 6 | 45 (42.4%) | 61 (57.6%) |
| 6 to 18 Years | 104 (23.1%) | 362 (80.4%) |
| 19 to 25 Years | 0 (0.0%) | 53 (100.0%) |
| 25 to 34 Years | 49 (8.8%) | 508 (91.2%) |
| 35 to 44 Years | 18 (8.0%) | 206 (92.0%) |
| 45 to 54 Years | 47 (16.0%) | 293 (100.0%) |
| 55 to 64 Years | 128 (20.8%) | 522 (84.9%) |
| 65 to 74 Years | 162 (93.6%) | 44 (25.4%) |
| 75 Years and over | 255 (100.0%) | 99 (38.8%) |
| Total | 808 (29.6%) | 2,148 (78.8%) |
Disability Status by Sex by Age in North Seekonk
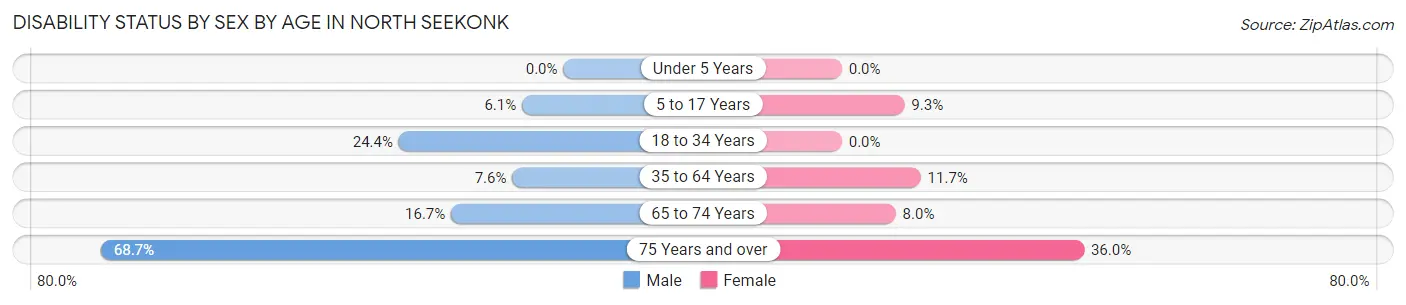
| Age Bracket | Male | Female |
| Under 5 Years | 0 (0.0%) | 0 (0.0%) |
| 5 to 17 Years | 16 (6.1%) | 20 (9.3%) |
| 18 to 34 Years | 55 (24.4%) | 0 (0.0%) |
| 35 to 64 Years | 45 (7.6%) | 63 (11.7%) |
| 65 to 74 Years | 8 (16.7%) | 10 (8.0%) |
| 75 Years and over | 114 (68.7%) | 32 (36.0%) |
Disability Class by Sex by Age in North Seekonk
Disability Class: Hearing Difficulty
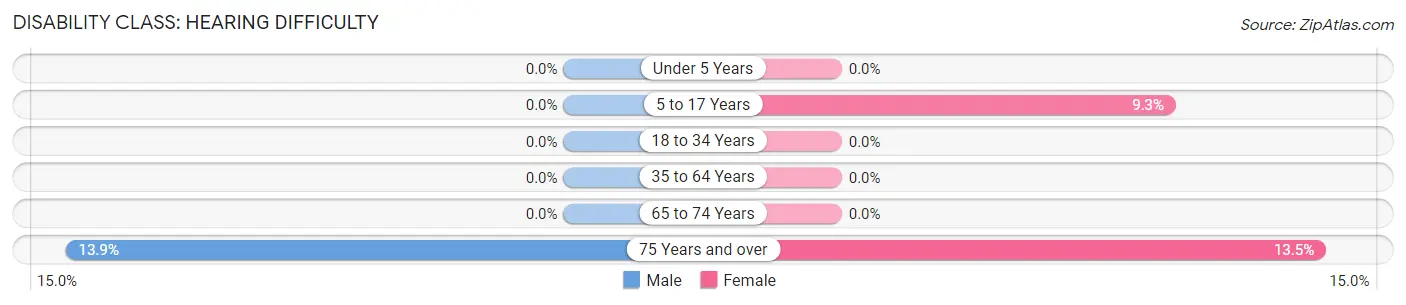
| Age Bracket | Male | Female |
| Under 5 Years | 0 (0.0%) | 0 (0.0%) |
| 5 to 17 Years | 0 (0.0%) | 20 (9.3%) |
| 18 to 34 Years | 0 (0.0%) | 0 (0.0%) |
| 35 to 64 Years | 0 (0.0%) | 0 (0.0%) |
| 65 to 74 Years | 0 (0.0%) | 0 (0.0%) |
| 75 Years and over | 23 (13.9%) | 12 (13.5%) |
Disability Class: Vision Difficulty
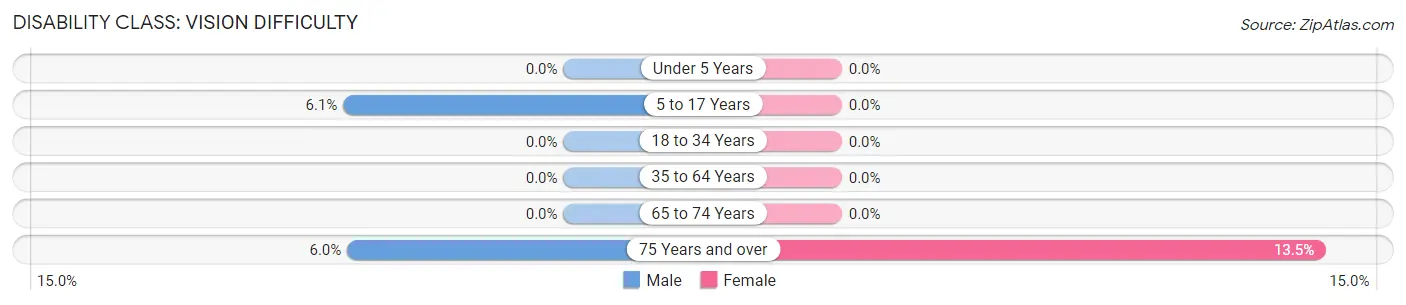
| Age Bracket | Male | Female |
| Under 5 Years | 0 (0.0%) | 0 (0.0%) |
| 5 to 17 Years | 16 (6.1%) | 0 (0.0%) |
| 18 to 34 Years | 0 (0.0%) | 0 (0.0%) |
| 35 to 64 Years | 0 (0.0%) | 0 (0.0%) |
| 65 to 74 Years | 0 (0.0%) | 0 (0.0%) |
| 75 Years and over | 10 (6.0%) | 12 (13.5%) |
Disability Class: Cognitive Difficulty
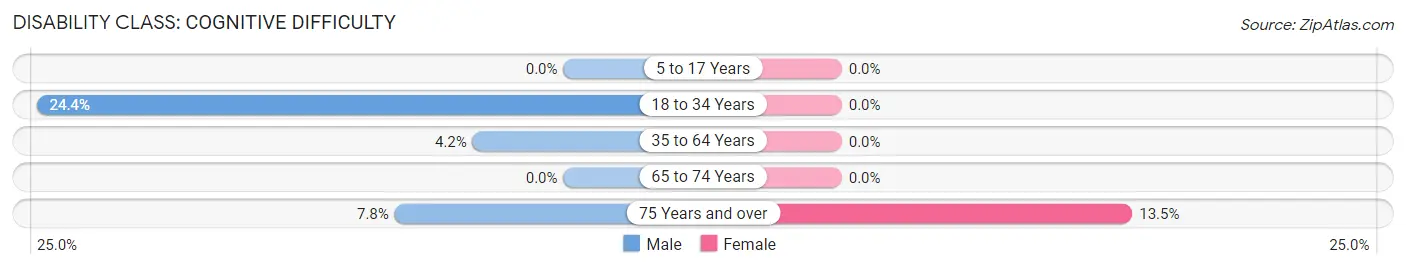
| Age Bracket | Male | Female |
| 5 to 17 Years | 0 (0.0%) | 0 (0.0%) |
| 18 to 34 Years | 55 (24.4%) | 0 (0.0%) |
| 35 to 64 Years | 25 (4.2%) | 0 (0.0%) |
| 65 to 74 Years | 0 (0.0%) | 0 (0.0%) |
| 75 Years and over | 13 (7.8%) | 12 (13.5%) |
Disability Class: Ambulatory Difficulty
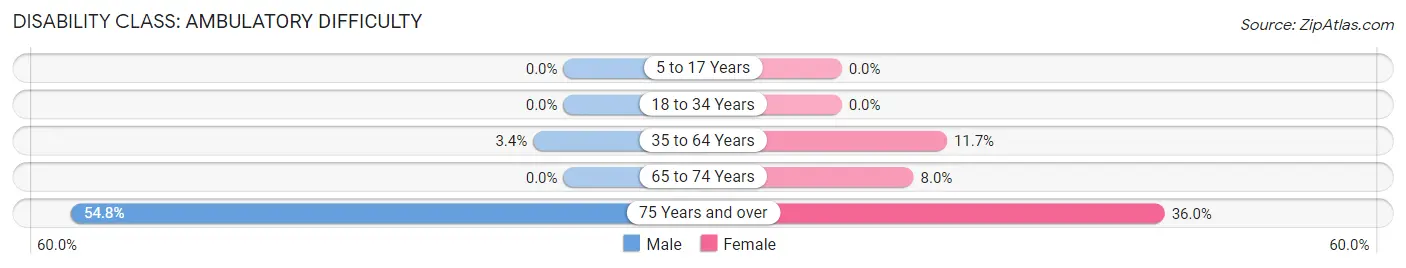
| Age Bracket | Male | Female |
| 5 to 17 Years | 0 (0.0%) | 0 (0.0%) |
| 18 to 34 Years | 0 (0.0%) | 0 (0.0%) |
| 35 to 64 Years | 20 (3.4%) | 63 (11.7%) |
| 65 to 74 Years | 0 (0.0%) | 10 (8.0%) |
| 75 Years and over | 91 (54.8%) | 32 (36.0%) |
Disability Class: Self-Care Difficulty
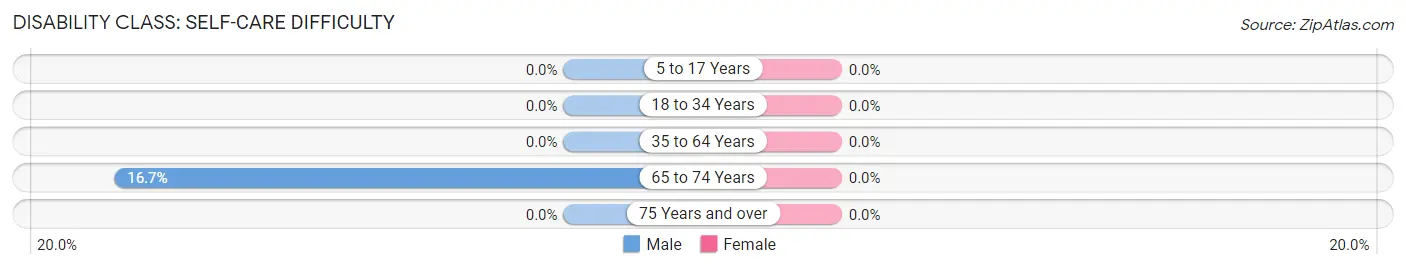
| Age Bracket | Male | Female |
| 5 to 17 Years | 0 (0.0%) | 0 (0.0%) |
| 18 to 34 Years | 0 (0.0%) | 0 (0.0%) |
| 35 to 64 Years | 0 (0.0%) | 0 (0.0%) |
| 65 to 74 Years | 8 (16.7%) | 0 (0.0%) |
| 75 Years and over | 0 (0.0%) | 0 (0.0%) |
Technology Access in North Seekonk
Computing Device Access in North Seekonk
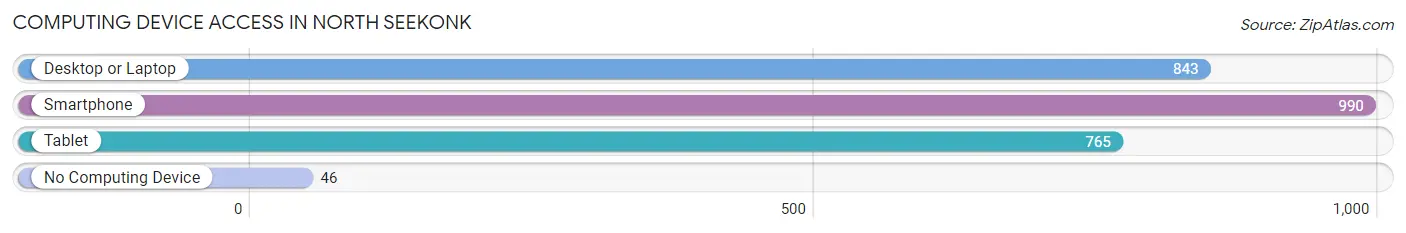
| Device Type | # Households | % Households |
| Desktop or Laptop | 843 | 77.6% |
| Smartphone | 990 | 91.2% |
| Tablet | 765 | 70.4% |
| No Computing Device | 46 | 4.2% |
| Total | 1,086 | 100.0% |
Internet Access in North Seekonk
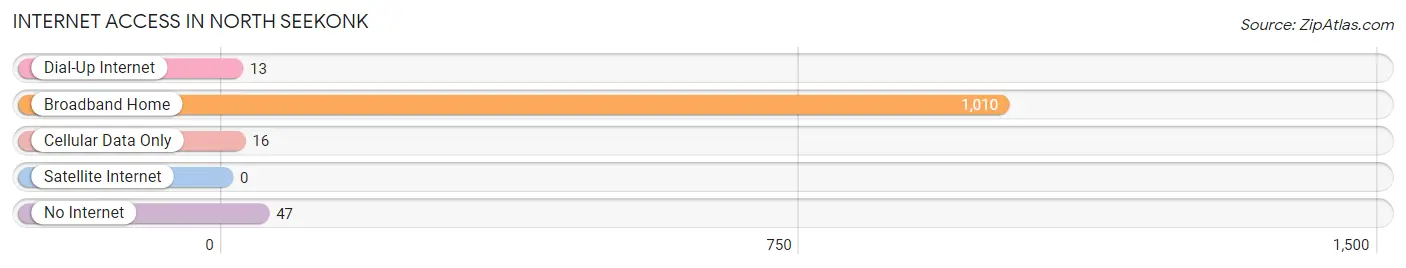
| Internet Type | # Households | % Households |
| Dial-Up Internet | 13 | 1.2% |
| Broadband Home | 1,010 | 93.0% |
| Cellular Data Only | 16 | 1.5% |
| Satellite Internet | 0 | 0.0% |
| No Internet | 47 | 4.3% |
| Total | 1,086 | 100.0% |
North Seekonk Summary
Seekonk is a town located in Bristol County, Massachusetts, United States. It borders the cities of Providence, Rhode Island and Pawtucket, Rhode Island to the south, and the towns of Rehoboth, Massachusetts and Attleboro, Massachusetts to the north. The population was 13,722 at the 2010 census.
History
The area now known as Seekonk was originally inhabited by the Wampanoag tribe. The first European settlers arrived in the area in 1636, and the town was officially incorporated in 1812. The town was named after the Wampanoag word for “black goose,” which was the name of a local river.
In the 19th century, Seekonk was a major center for the manufacture of textiles, and the town was home to several mills. The town also had a thriving agricultural industry, and was known for its apples and cranberries.
Geography
Seekonk is located in southeastern Massachusetts, about 10 miles south of Providence, Rhode Island. It is bordered by the towns of Rehoboth, Massachusetts and Attleboro, Massachusetts to the north, and the cities of Providence, Rhode Island and Pawtucket, Rhode Island to the south. The town has a total area of 16.2 square miles, of which 15.9 square miles is land and 0.3 square miles is water.
The town is located on the Seekonk River, which flows through the center of town. The river is a tributary of the Providence River, which flows into Narragansett Bay.
Economy
Seekonk’s economy is largely based on manufacturing and retail. The town is home to several large manufacturing companies, including the Gillette Company, which produces razors and other personal care products. The town is also home to several retail stores, including the Seekonk Speedway, a popular destination for racing fans.
The town is also home to several small businesses including restaurants cafes and shops
Demographics
As of the 2010 census, there were 13,722 people, 5,541 households, and 3,717 families residing in the town. The population density was 862.2 people per square mile. The racial makeup of the town was 92.2% White, 2.7% African American, 0.3% Native American, 1.7% Asian, 0.1% Pacific Islander, 1.3% from other races, and 2.1% from two or more races. Hispanic or Latino of any race were 3.7% of the population.
The median income for a household in the town was $60,945, and the median income for a family was $71,945. The per capita income for the town was $27,945. About 4.2% of families and 5.7% of the population were below the poverty line, including 6.7% of those under age 18 and 5.2% of those age 65 or over.
Common Questions
What is Per Capita Income in North Seekonk?
Per Capita income in North Seekonk is $44,469.
What is the Median Family Income in North Seekonk?
Median Family Income in North Seekonk is $130,625.
What is the Median Household income in North Seekonk?
Median Household Income in North Seekonk is $105,459.
What is Income or Wage Gap in North Seekonk?
Income or Wage Gap in North Seekonk is 26.0%.
Women in North Seekonk earn 74.0 cents for every dollar earned by a man.
What is Inequality or Gini Index in North Seekonk?
Inequality or Gini Index in North Seekonk is 0.32.
What is the Total Population of North Seekonk?
Total Population of North Seekonk is 2,726.
What is the Total Male Population of North Seekonk?
Total Male Population of North Seekonk is 1,294.
What is the Total Female Population of North Seekonk?
Total Female Population of North Seekonk is 1,432.
What is the Ratio of Males per 100 Females in North Seekonk?
There are 90.36 Males per 100 Females in North Seekonk.
What is the Ratio of Females per 100 Males in North Seekonk?
There are 110.66 Females per 100 Males in North Seekonk.
What is the Median Population Age in North Seekonk?
Median Population Age in North Seekonk is 43.8 Years.
What is the Average Family Size in North Seekonk
Average Family Size in North Seekonk is 2.8 People.
What is the Average Household Size in North Seekonk
Average Household Size in North Seekonk is 2.5 People.
How Large is the Labor Force in North Seekonk?
There are 1,547 People in the Labor Forcein in North Seekonk.
What is the Percentage of People in the Labor Force in North Seekonk?
68.6% of People are in the Labor Force in North Seekonk.
What is the Unemployment Rate in North Seekonk?
Unemployment Rate in North Seekonk is 6.4%.