Cities with the Highest Percentage of English Population in Massachusetts
RELATED REPORTS & OPTIONS
English
Massachusetts
Compare Cities
Map of Cities with the Highest Percentage of English Population in Massachusetts
0.00%
60.00%
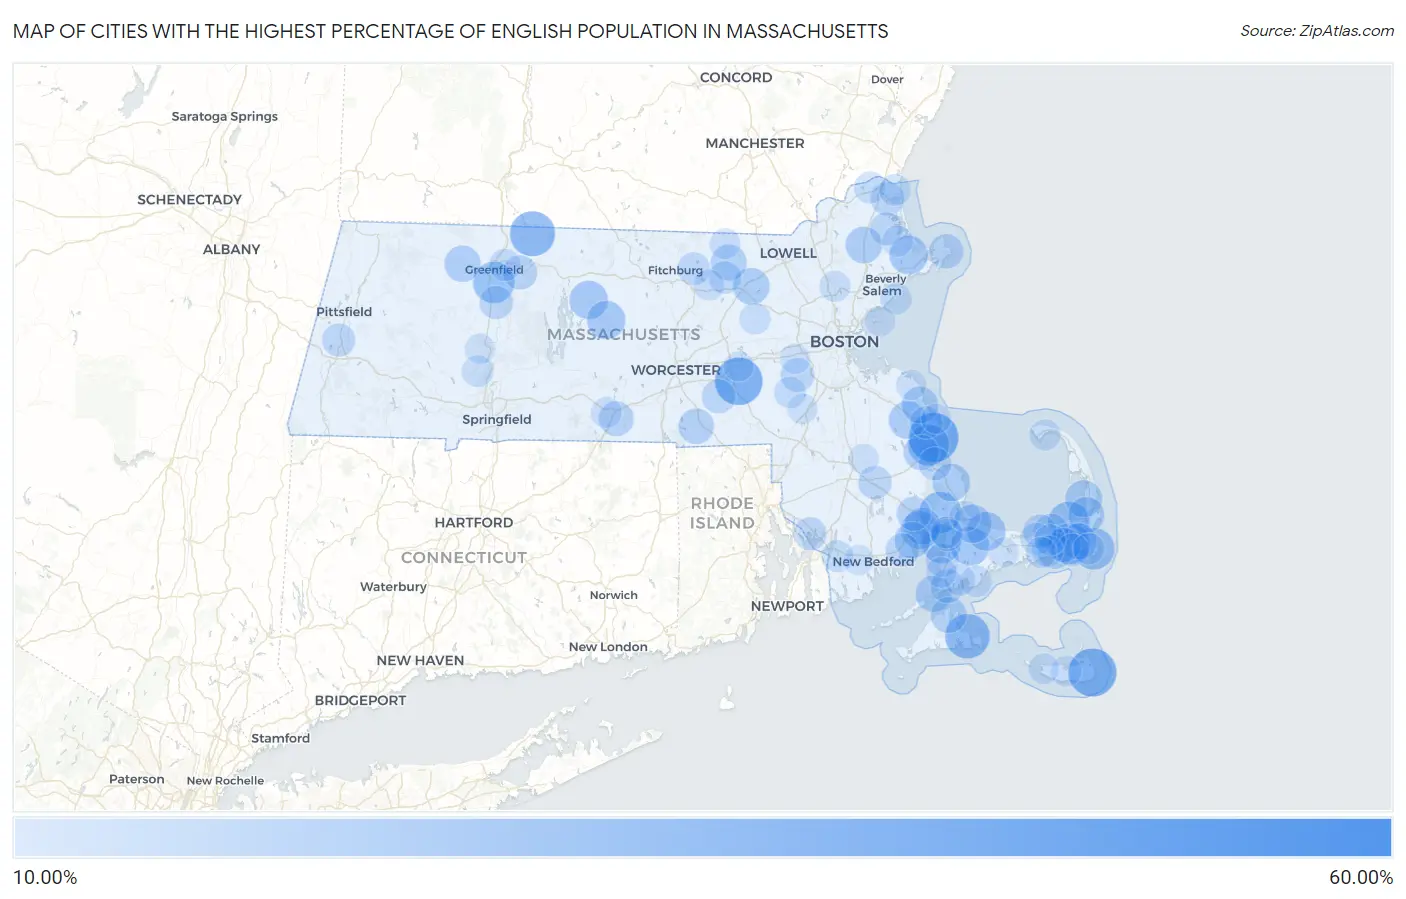
Cities with the Highest Percentage of English Population in Massachusetts
| City | English | vs State | vs National | |
| 1. | Lenox Dale | 52.94% | 9.47% (+43.5)#1 | 8.59% (+44.4)#198 |
| 2. | Duxbury | 38.44% | 9.47% (+29.0)#2 | 8.59% (+29.9)#537 |
| 3. | Siasconset | 36.52% | 9.47% (+27.0)#3 | 8.59% (+27.9)#619 |
| 4. | Hopkinton | 35.96% | 9.47% (+26.5)#4 | 8.59% (+27.4)#656 |
| 5. | Green Harbor | 33.99% | 9.47% (+24.5)#5 | 8.59% (+25.4)#751 |
| 6. | Northfield | 32.60% | 9.47% (+23.1)#6 | 8.59% (+24.0)#854 |
| 7. | Edgartown | 31.97% | 9.47% (+22.5)#7 | 8.59% (+23.4)#896 |
| 8. | Chatham | 28.22% | 9.47% (+18.7)#8 | 8.59% (+19.6)#1,268 |
| 9. | Brewster | 28.12% | 9.47% (+18.6)#9 | 8.59% (+19.5)#1,280 |
| 10. | White Island Shores | 27.85% | 9.47% (+18.4)#10 | 8.59% (+19.3)#1,304 |
| 11. | South Duxbury | 27.81% | 9.47% (+18.3)#11 | 8.59% (+19.2)#1,309 |
| 12. | Deerfield | 27.78% | 9.47% (+18.3)#12 | 8.59% (+19.2)#1,316 |
| 13. | Harwich Center | 27.41% | 9.47% (+17.9)#13 | 8.59% (+18.8)#1,367 |
| 14. | Pocasset | 24.86% | 9.47% (+15.4)#14 | 8.59% (+16.3)#1,755 |
| 15. | Forestdale | 24.67% | 9.47% (+15.2)#15 | 8.59% (+16.1)#1,792 |
| 16. | East Sandwich | 24.24% | 9.47% (+14.8)#16 | 8.59% (+15.7)#1,870 |
| 17. | Essex | 24.10% | 9.47% (+14.6)#17 | 8.59% (+15.5)#1,903 |
| 18. | Sandwich | 24.05% | 9.47% (+14.6)#18 | 8.59% (+15.5)#1,916 |
| 19. | Petersham | 24.00% | 9.47% (+14.5)#19 | 8.59% (+15.4)#1,927 |
| 20. | Barre | 23.91% | 9.47% (+14.4)#20 | 8.59% (+15.3)#1,944 |
| 21. | Weweantic | 23.60% | 9.47% (+14.1)#21 | 8.59% (+15.0)#1,996 |
| 22. | The Pinehills | 22.96% | 9.47% (+13.5)#22 | 8.59% (+14.4)#2,114 |
| 23. | North Pembroke | 22.84% | 9.47% (+13.4)#23 | 8.59% (+14.2)#2,141 |
| 24. | North Eastham | 22.12% | 9.47% (+12.6)#24 | 8.59% (+13.5)#2,297 |
| 25. | Wareham Center | 21.93% | 9.47% (+12.5)#25 | 8.59% (+13.3)#2,353 |
| 26. | Marshfield Hills | 21.85% | 9.47% (+12.4)#26 | 8.59% (+13.3)#2,371 |
| 27. | Littleton Common | 21.78% | 9.47% (+12.3)#27 | 8.59% (+13.2)#2,391 |
| 28. | Boxford | 21.67% | 9.47% (+12.2)#28 | 8.59% (+13.1)#2,435 |
| 29. | Woods Hole | 21.47% | 9.47% (+12.0)#29 | 8.59% (+12.9)#2,492 |
| 30. | Shelburne Falls | 21.13% | 9.47% (+11.7)#30 | 8.59% (+12.5)#2,587 |
| 31. | Orleans | 21.08% | 9.47% (+11.6)#31 | 8.59% (+12.5)#2,605 |
| 32. | Marion Center | 21.02% | 9.47% (+11.5)#32 | 8.59% (+12.4)#2,630 |
| 33. | East Harwich | 20.96% | 9.47% (+11.5)#33 | 8.59% (+12.4)#2,653 |
| 34. | Groton | 20.86% | 9.47% (+11.4)#34 | 8.59% (+12.3)#2,683 |
| 35. | Vineyard Haven | 20.74% | 9.47% (+11.3)#35 | 8.59% (+12.2)#2,714 |
| 36. | East Douglas | 20.22% | 9.47% (+10.7)#36 | 8.59% (+11.6)#2,886 |
| 37. | Dennis Port | 20.18% | 9.47% (+10.7)#37 | 8.59% (+11.6)#2,906 |
| 38. | Kingston | 20.16% | 9.47% (+10.7)#38 | 8.59% (+11.6)#2,911 |
| 39. | Sturbridge | 19.62% | 9.47% (+10.1)#39 | 8.59% (+11.0)#3,117 |
| 40. | Oak Bluffs | 19.59% | 9.47% (+10.1)#40 | 8.59% (+11.0)#3,128 |
| 41. | East Dennis | 19.46% | 9.47% (+9.98)#41 | 8.59% (+10.9)#3,200 |
| 42. | Rockport | 19.10% | 9.47% (+9.62)#42 | 8.59% (+10.5)#3,356 |
| 43. | West Wareham | 18.66% | 9.47% (+9.18)#43 | 8.59% (+10.1)#3,525 |
| 44. | Northwest Harwich | 18.60% | 9.47% (+9.12)#44 | 8.59% (+10.0)#3,555 |
| 45. | Millers Falls | 18.47% | 9.47% (+9.00)#45 | 8.59% (+9.88)#3,604 |
| 46. | Upton | 18.34% | 9.47% (+8.86)#46 | 8.59% (+9.75)#3,687 |
| 47. | Greenfield | 18.22% | 9.47% (+8.74)#47 | 8.59% (+9.63)#3,751 |
| 48. | Falmouth | 17.98% | 9.47% (+8.50)#48 | 8.59% (+9.39)#3,876 |
| 49. | Dover | 17.95% | 9.47% (+8.48)#49 | 8.59% (+9.37)#3,887 |
| 50. | Dennis | 17.81% | 9.47% (+8.33)#50 | 8.59% (+9.22)#3,967 |
| 51. | Newburyport | 17.74% | 9.47% (+8.26)#51 | 8.59% (+9.15)#4,017 |
| 52. | Mattapoisett Center | 17.69% | 9.47% (+8.22)#52 | 8.59% (+9.11)#4,044 |
| 53. | Middleborough Center | 17.64% | 9.47% (+8.16)#53 | 8.59% (+9.05)#4,090 |
| 54. | North Falmouth | 17.60% | 9.47% (+8.13)#54 | 8.59% (+9.01)#4,115 |
| 55. | South Deerfield | 17.51% | 9.47% (+8.04)#55 | 8.59% (+8.92)#4,156 |
| 56. | Plymouth | 17.13% | 9.47% (+7.65)#56 | 8.59% (+8.54)#4,390 |
| 57. | Lenox | 17.06% | 9.47% (+7.58)#57 | 8.59% (+8.47)#4,431 |
| 58. | Ocean Grove | 17.06% | 9.47% (+7.58)#58 | 8.59% (+8.47)#4,432 |
| 59. | Rowley | 17.05% | 9.47% (+7.58)#59 | 8.59% (+8.46)#4,437 |
| 60. | Lunenburg | 16.85% | 9.47% (+7.37)#60 | 8.59% (+8.26)#4,565 |
| 61. | Harwich Port | 16.83% | 9.47% (+7.36)#61 | 8.59% (+8.24)#4,574 |
| 62. | Ayer | 16.57% | 9.47% (+7.10)#62 | 8.59% (+7.98)#4,755 |
| 63. | Marshfield | 16.50% | 9.47% (+7.02)#63 | 8.59% (+7.91)#4,802 |
| 64. | Monument Beach | 16.20% | 9.47% (+6.73)#64 | 8.59% (+7.62)#5,014 |
| 65. | Yarmouth Port | 16.08% | 9.47% (+6.60)#65 | 8.59% (+7.49)#5,103 |
| 66. | Turners Falls | 16.02% | 9.47% (+6.55)#66 | 8.59% (+7.44)#5,141 |
| 67. | Amesbury Town | 15.58% | 9.47% (+6.11)#67 | 8.59% (+6.99)#5,506 |
| 68. | North Westport | 15.32% | 9.47% (+5.85)#68 | 8.59% (+6.73)#5,677 |
| 69. | Medfield | 15.27% | 9.47% (+5.80)#69 | 8.59% (+6.69)#5,714 |
| 70. | Bourne | 15.26% | 9.47% (+5.79)#70 | 8.59% (+6.68)#5,727 |
| 71. | West Dennis | 15.19% | 9.47% (+5.72)#71 | 8.59% (+6.60)#5,780 |
| 72. | Salisbury | 15.18% | 9.47% (+5.71)#72 | 8.59% (+6.59)#5,787 |
| 73. | Marblehead | 15.08% | 9.47% (+5.60)#73 | 8.59% (+6.49)#5,879 |
| 74. | Easthampton Town | 15.05% | 9.47% (+5.58)#74 | 8.59% (+6.46)#5,898 |
| 75. | New Seabury | 15.04% | 9.47% (+5.57)#75 | 8.59% (+6.45)#5,909 |
| 76. | South Dennis | 15.00% | 9.47% (+5.52)#76 | 8.59% (+6.41)#5,965 |
| 77. | West Chatham | 14.82% | 9.47% (+5.35)#77 | 8.59% (+6.23)#6,133 |
| 78. | Provincetown | 14.77% | 9.47% (+5.29)#78 | 8.59% (+6.18)#6,184 |
| 79. | East Falmouth | 14.76% | 9.47% (+5.29)#79 | 8.59% (+6.17)#6,190 |
| 80. | Maynard | 14.62% | 9.47% (+5.15)#80 | 8.59% (+6.03)#6,320 |
| 81. | South Yarmouth | 14.61% | 9.47% (+5.14)#81 | 8.59% (+6.02)#6,327 |
| 82. | Reading | 14.54% | 9.47% (+5.06)#82 | 8.59% (+5.95)#6,403 |
| 83. | Ipswich | 14.45% | 9.47% (+4.98)#83 | 8.59% (+5.86)#6,491 |
| 84. | Shirley | 14.42% | 9.47% (+4.95)#84 | 8.59% (+5.83)#6,521 |
| 85. | Pepperell | 14.38% | 9.47% (+4.90)#85 | 8.59% (+5.79)#6,558 |
| 86. | Fiskdale | 14.33% | 9.47% (+4.85)#86 | 8.59% (+5.74)#6,617 |
| 87. | Sagamore | 14.32% | 9.47% (+4.85)#87 | 8.59% (+5.73)#6,621 |
| 88. | Nantucket | 14.24% | 9.47% (+4.76)#88 | 8.59% (+5.65)#6,732 |
| 89. | Madaket | 14.15% | 9.47% (+4.68)#89 | 8.59% (+5.56)#6,803 |
| 90. | West Falmouth | 13.89% | 9.47% (+4.41)#90 | 8.59% (+5.30)#7,074 |
| 91. | North Scituate | 13.69% | 9.47% (+4.22)#91 | 8.59% (+5.10)#7,291 |
| 92. | Northampton | 13.65% | 9.47% (+4.17)#92 | 8.59% (+5.06)#7,337 |
| 93. | Wellesley | 13.65% | 9.47% (+4.17)#93 | 8.59% (+5.06)#7,341 |
| 94. | Smith Mills | 13.59% | 9.47% (+4.11)#94 | 8.59% (+5.00)#7,424 |
| 95. | Walpole | 13.56% | 9.47% (+4.08)#95 | 8.59% (+4.97)#7,454 |
| 96. | Nahant | 13.49% | 9.47% (+4.02)#96 | 8.59% (+4.90)#7,523 |
| 97. | Bridgewater Town | 13.47% | 9.47% (+3.99)#97 | 8.59% (+4.88)#7,545 |
| 98. | Ocean Bluff Brant Rock | 13.46% | 9.47% (+3.98)#98 | 8.59% (+4.87)#7,557 |
| 99. | Cordaville | 13.42% | 9.47% (+3.94)#99 | 8.59% (+4.83)#7,592 |
| 100. | Barnstable Town | 13.42% | 9.47% (+3.94)#100 | 8.59% (+4.83)#7,597 |
Common Questions
What are the Top 10 Cities with the Highest Percentage of English Population in Massachusetts?
Top 10 Cities with the Highest Percentage of English Population in Massachusetts are:
#1
38.44%
#2
36.52%
#3
35.96%
#4
32.60%
#5
31.97%
#6
28.22%
#7
28.12%
#8
27.85%
#9
27.81%
#10
27.78%
What city has the Highest Percentage of English Population in Massachusetts?
Duxbury has the Highest Percentage of English Population in Massachusetts with 38.44%.
What is the Percentage of English Population in the State of Massachusetts?
Percentage of English Population in Massachusetts is 9.47%.
What is the Percentage of English Population in the United States?
Percentage of English Population in the United States is 8.59%.